1. Introduction
Electrified railways are a vital component of modern transportation systems, as they have been globally developed owing to their high efficiency, environmental friendliness, and energy-saving benefits. A well-maintained catenary system is crucial for efficient and safe railway operations [
1]. In current catenary system maintenance practices, catenary maintenance vehicles serve as one of the key operational units, capable of performing transportation, maintenance, and inspection tasks [
2]. To enhance economic efficiency and adhere to sustainable development principles, adopting effective strategies that reduce the energy consumption of catenary maintenance vehicles is essential [
3]. One promising approach is the optimization of the operating curves of these vehicles, commonly known as eco-driving. This method optimizes the operating curve by accounting for factors such as vehicle performance and track conditions, with the goals of maximizing energy savings, allowing smoother operations, and increasing safety [
4].
Given the inherently multi-objective nature of train operation optimization, which involves generating multiple potential speed profiles via extensive solution space exploration, multi-objective evolutionary algorithms based on Pareto optimization have achieved significant advancements. For instance, Domínguez et al. demonstrated that multi-objective particle swarm optimization (MOPSO) generates Pareto-optimal solutions for running time and energy consumption more efficiently than GA [
5]. In addition, Yang et al. developed an online optimization algorithm using MOPSO for high-speed trains, leveraging real-world operational data [
6]. Furthermore, Shangguan et al. developed a hybrid evolutionary algorithm that combines differential evolution (DE) and simulated annealing (SA) to identify Pareto fronts, enabling energy-efficient driving strategies across various journey times [
7].
Recent advancements include the results achieved by Fernández-Rodríguez et al., who introduced a real-time optimization framework utilizing NSGA-II and MOPSO for adjusting the dynamic speed trajectory during train delays [
8]. In addition, Pu et al. developed a hybrid strategy that accounts for energy efficiency, running time, and comfort, utilizing an improved particle swarm optimization (HS-MOPSO) algorithm [
9]. Furthermore, Huang et al. proposed a time–energy optimization framework that incorporates dynamic train mass estimation using K-means clustering of passenger flow data and an improved adaptive NSGA-II algorithm [
10]. Moreover, Fernández et al. improved an enhanced multi-objective ant colony (MOACOr) algorithm, which demonstrated superior convergence and diversity compared to NSGA-II [
11]. Havaei et al. introduced a novel conscious search (CS) heuristic algorithm featuring global and local search phases, which outperformed traditional heuristic methods in determining optimal train speed profiles [
12]. Zhenyu et al. validated the effectiveness of an improved NSGA-II algorithm via comparative analyses with GA and PSO for metro train energy-saving operations [
13].
However, recent studies on Pareto front solution sets predominantly focus on two or three objectives and do not extensively explore higher-dimensional problems [
11,
14,
15,
16]. Algorithms such as NSGA-II perform well for low-dimensional multi-objective problems (M ≤ 3) [
13,
15,
17], but they encounter significant challenges in high-dimensional optimization (M > 3). These challenges stem from exponentially increasing computational demands to perform crowding distance calculations and the diminished selection pressure from Pareto dominance relations. Although these algorithms can generate Pareto solutions, the exponential growth of non-dominated individuals complicates the differentiation [
18].
To address these limitations, an enhanced selection strategy of the Non-Dominated Sorting Genetic Algorithm III (ESS-NSGA-III) algorithm is proposed, incorporating mechanisms such as shift-based density estimation (SDE) and dynamic convergence distance (DCD) to improve mating probability and environmental selection processes. Finally, the algorithm’s effectiveness is validated by comparing various optimized operation strategies, offering drivers a more practical and feasible solution for real-world implementation.
The remainder of this paper is organized as follows.
Section 2 outlines the operation strategy framework and the multi-objective optimization model for railway catenary maintenance vehicles.
Section 3 describes the ESS-NSGA-III algorithm used for solving the multi-objective optimization problem.
Section 4 presents a comparative analysis of various algorithms and operational strategies using real-world intersection operational data. Finally,
Section 5 summarizes the key findings and discusses their implications.
2. Multi-Objective Operation Model
2.1. Operation Strategy Analysis
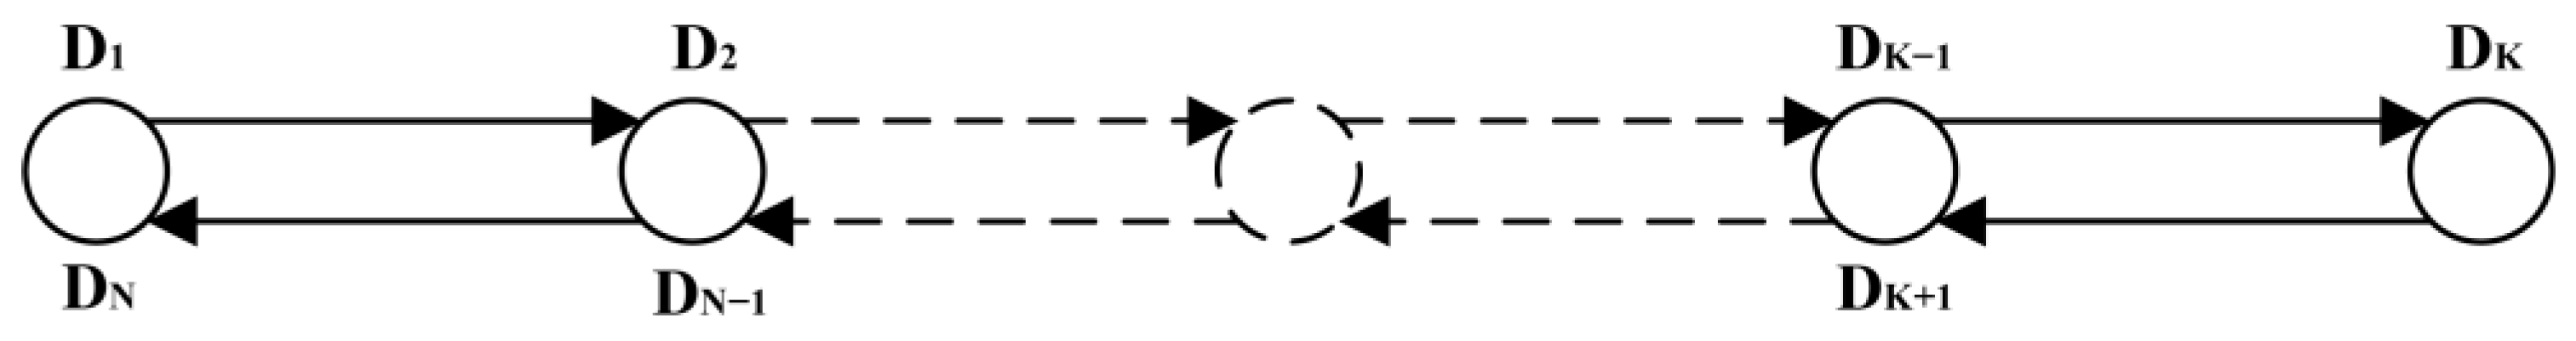
Figure 1 schematically illustrates the operational workflow of railway overhead contact line maintenance vehicles within designated track sections. Following established daily operational protocols, the maintenance vehicle is deployed from a predetermined origin point (D
1) to execute scheduled tasks within a predefined temporal window. The vehicle sequentially accesses multiple target nodes (D
2, D
3, ⋯, D
K, ⋯, D
N−1) along the designated route to perform essential line maintenance operations while simultaneously facilitating personnel and equipment transportation. Following the completion of these scheduled interventions, the vehicle returns to its initial departure point D
1 (denoted as D
N in the cyclic operational sequence), thereby forming a closed-loop operational circuit that fulfills comprehensive maintenance requirements within the specified track section.
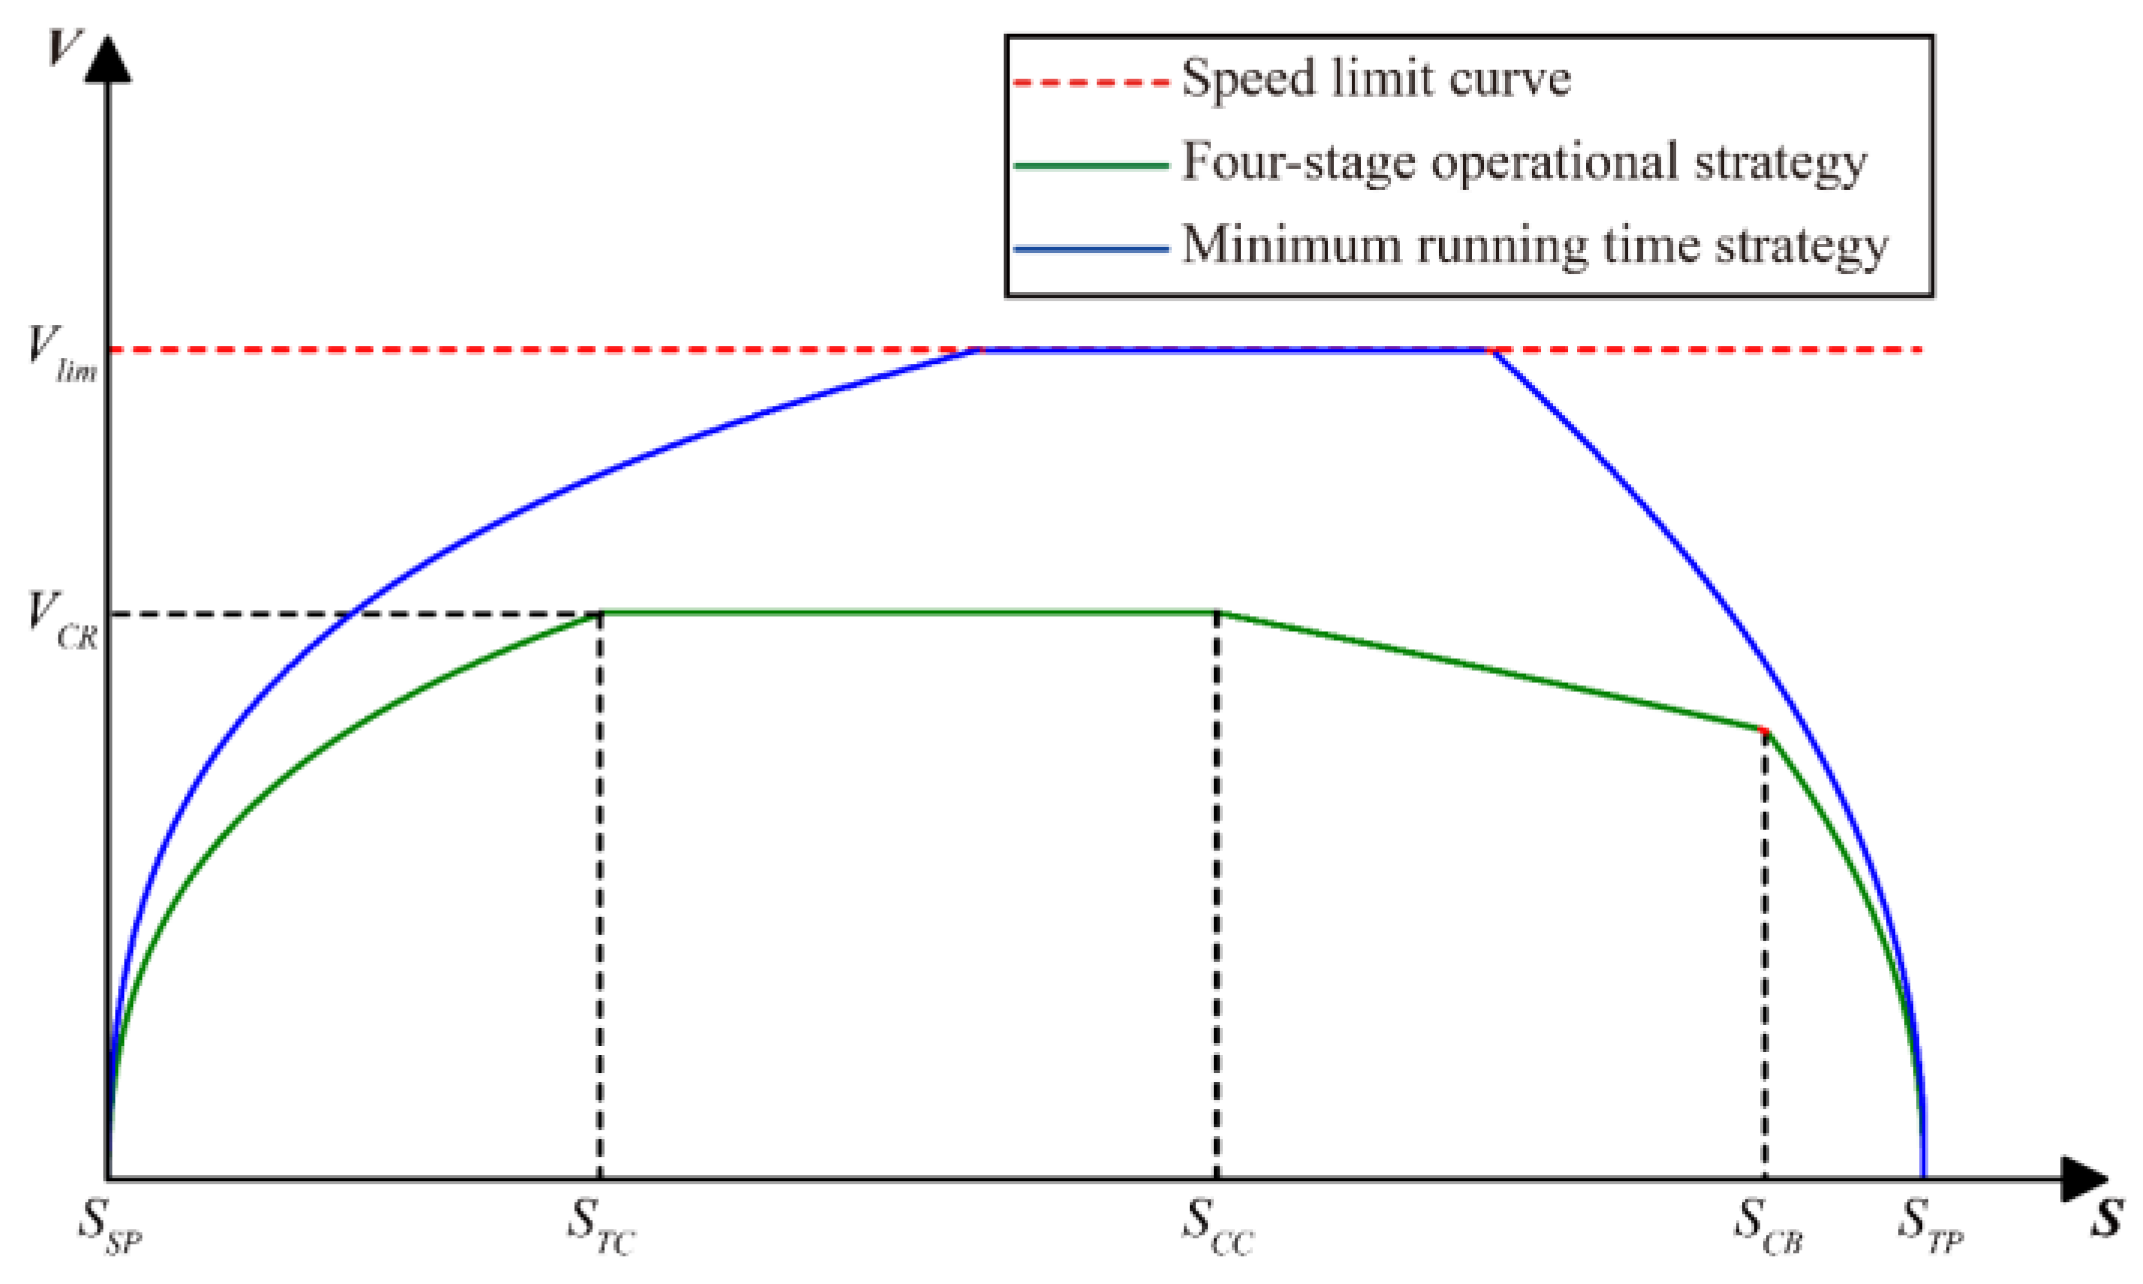
Figure 2 compares the speed profiles of two operational strategies between adjacent target points: the four-stage operational strategy and the minimum runtime strategy. The four-stage strategy divides operations into traction, cruising, coasting, and braking phases. In practice, operators often prioritize efficiency by adopting the minimum runtime strategy, which involves maximum traction acceleration, sustained cruising, and immediate maximum braking. While this method minimizes travel time, it may compromise other operational parameters such as energy efficiency, comfort, and safety.
When analyzing operational strategies, the discrete sequences of operational conditions across maintenance sections can be consolidated into a matrix of condition transition points. This matrix can be systematically mapped to specific speed profiles, facilitating the derivation and comparative analysis of the corresponding energy consumption, time efficiency, comfort, and safety metrics.
Specifically, for the section , the operational sequence can be described as follows. The maintenance vehicle begins its journey from the starting point , accelerating during the traction phases until reaching the traction-to-cruise transition point . It then maintains a constant cruising speed until arriving at the cruise-to-coasting transition point , where traction is discontinued. Subsequently, the vehicle continues in the coasting phases at a constant speed until reaching the coasting-to-braking transition point , where the braking strategy is activated to completely stop the vehicle at the designated target point .
To address comfort considerations, relying solely on maximum traction and braking forces is suboptimal. Instead, a range of traction and braking forces should be utilized to enable a comprehensive comparison and analysis of the control strategies. Accordingly, based on the characteristic curves of the maximum traction and braking forces, the vehicle is configured to execute start-acceleration and brake-stop phases using specific levels of traction and braking forces by adjusting the proportionality coefficients and .
For the traction phase, the traction-to-cruise transition point and the corresponding cruise speed are determined using forward calculations of process data from the starting point . Establishing these parameters involves sequentially computing each step in the traction mode. Conversely, for the braking phase, the braking initiation point is derived using the reverse calculation of process data from the endpoint . This reverse calculation identifies the point where the braking curve intersects with the train’s speed profile, thereby determining the optimal position at which braking should commence.
Given that the starting position
and ending position
are fixed parameters, the decision variables for optimizing the speed profile of a single operational section can be mathematically expressed as follows:
where
,
,
, and
represent the traction-to-cruise transition point, cruise-to-coasting transition point, traction ratio parameter, and braking ratio parameter of the section, respectively. These variables collectively define the operation strategy and serve as key decision parameters for optimizing the speed profile.
2.2. Dynamics Simulation Model
In this study, a time step-based simulation model is employed to describe the operational state of a railway catenary maintenance vehicle [
9]. The acceleration
is set as a constant value within each time step
. The kinematic equations for the
-th time step can be expressed as follows:
where
and
represent the speed and travel distance in the
-th time step, respectively. The acceleration
is calculated using the dynamic model given by
where
and
are the maximum traction and braking forces at speed
, respectively;
and
represent the traction and braking force coefficients, respectively;
is the rotational mass coefficient;
is the mass of the train;
,
, and
are the basic resistance, gradient resistance, and curve resistance related to speed
and position
, respectively;
,
, and
are the basic resistance coefficients;
and
represent the gradient percentage and the curve radius at position
, respectively.
2.3. Objective Function and Constraints
Speed profile optimization is a multi-objective optimization problem, requiring the formulation of a comprehensive model to analyze and determine optimal operational profiles. This study considers four key performance indicators: energy consumption, punctuality, comfort, and safety. Each indicator is formally defined as follows:
The punctuality indicator
is quantified as the absolute deviation between the actual running time
and the planned running time
, which is expressed as follows:
where
represents the total elapsed time (s),
denotes the scheduled running time (s),
denotes the time step (s), and
indicates the total number of time steps.
Given the lack of a regenerative braking capability in railway catenary maintenance vehicles, this study employs an energy consumption calculation method based on the work performed by the traction force. The energy consumption indicator
is defined as follows:
where
represents the traction force,
denotes the operating speed, and
denotes the efficiency of the traction system.
The comfort indicator
is quantitatively defined using the rate of change of acceleration [
19] and is expressed as follows:
where
represents the change in acceleration within the
-th time step
.
The safety indicator
is defined according to railway operational requirements as follows [
6]:
where
and
represent the speed limit and the vehicle’s speed at time
, respectively. The safety indicator
exhibits an inverse relationship with the proximity between the vehicle’s speed
and the speed limit curve
. Specifically,
is a dimensionless indicator; a smaller value of
indicates a greater distance between the operating speed
and the speed limit curve
, reflecting a higher level of operational safety.
Therefore, the multi-objective optimization function for the running curves of section operations, along with the function’s associated constraints, can be formulated as follows:
where
represents the mass of the operational vehicle and
,
, and
denote the traction, resistance, and braking forces, respectively. The system dynamics are governed by these forces.
The multi-objective optimization function integrates four key performance indicators: energy consumption, punctuality, comfort, and safety. In addition, the optimization framework is governed by several operational constraints to ensure practical applicability, safety, and precision. First, the vehicle’s speed must be zero at both the starting point and stopping point . Second, the operational speed must not exceed the designated speed limit at any point during the journey. Additionally, the stopping position error , defined as the distance between the actual stopping point and the target stopping point , must not exceed 0.5 m. Finally, the total running time for each section must not exceed 1.3 times the planned time . These constraints ensure that the optimization framework aligns with real-world operational requirements while maintaining safety and precision.
3. Optimization Based on ESS-NSGA-III Algorithm
3.1. ESS-NSGA-III Algorithmic Framework
The reference point-based NSGA-III algorithm, a classical multi-objective optimization approach, excels in optimizing three or more objectives, offering advantages in computational speed, convergence, and diversity performance [
20]. However, its performance requires improvement when applied to train operation optimization problems involving multiple decision variables [
21]. As illustrated in
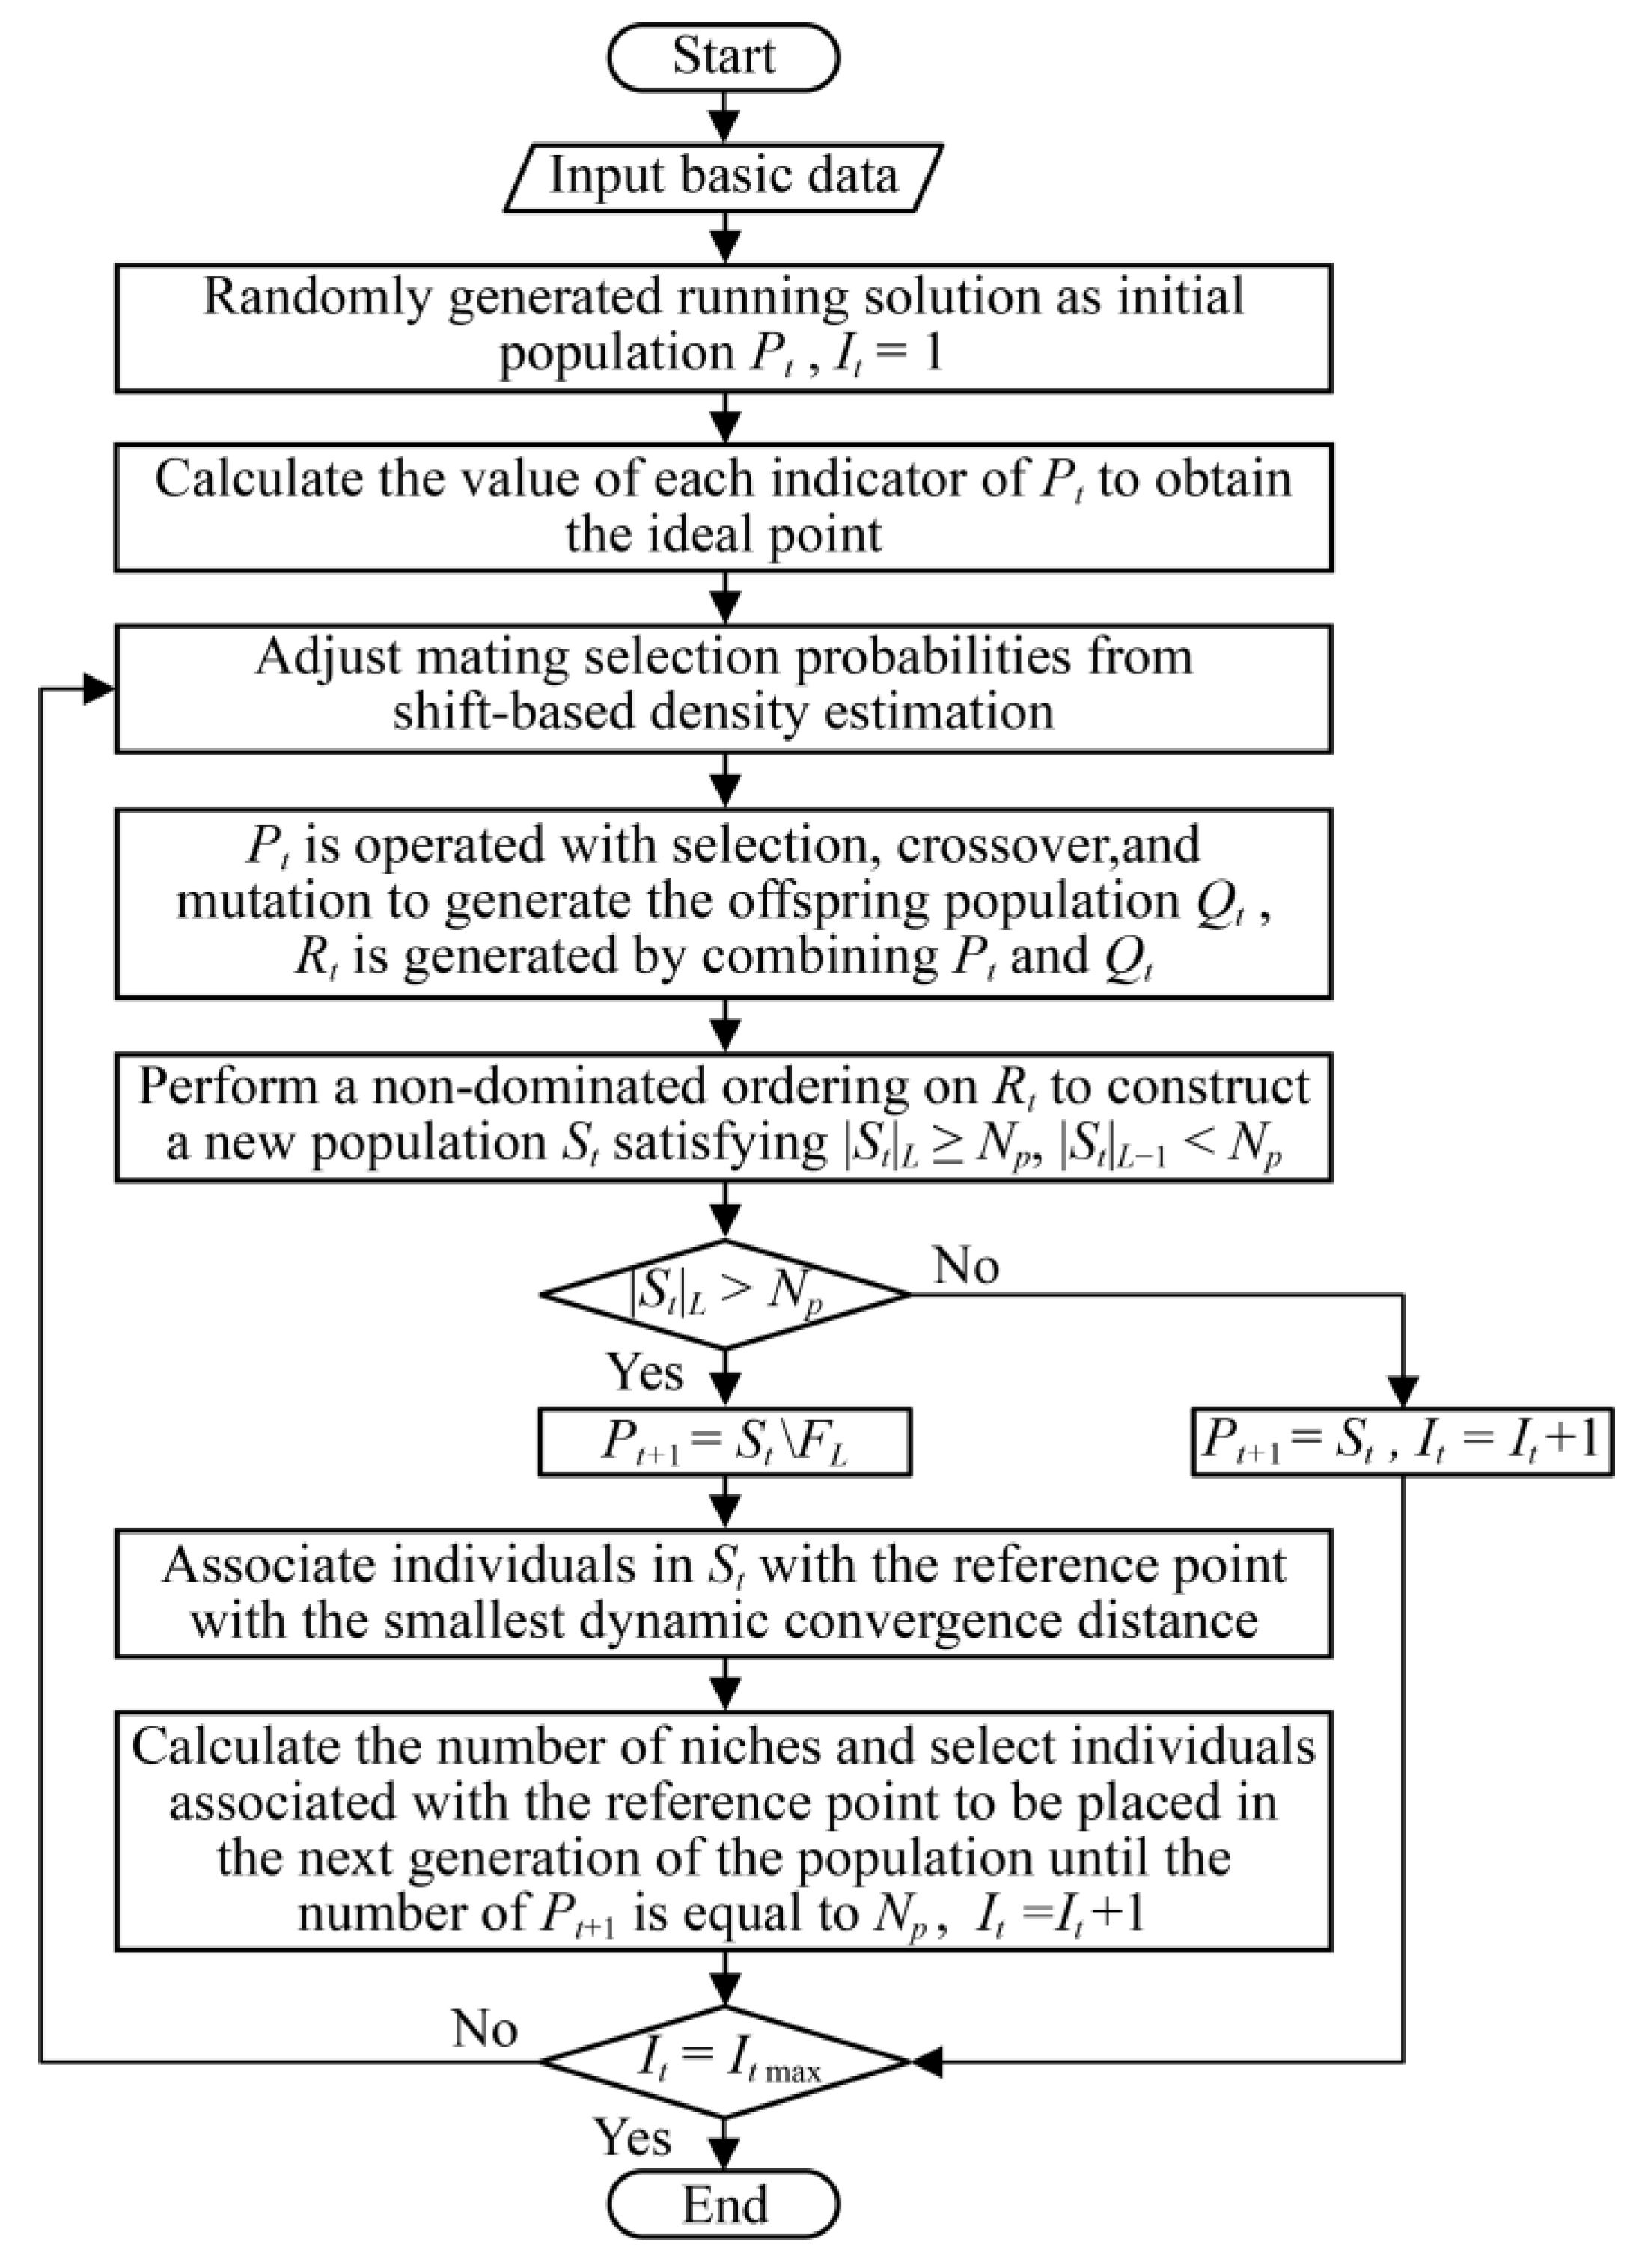
Figure 3, the proposed methodology for solving the speed profile optimization problem for the section operations of railway catenary maintenance vehicles using the ESS-NSGA-III algorithm consists of the following sequential steps:
Initialize the optimization process by inputting basic data, including the operational route parameters, vehicle specifications, and algorithm configuration parameters.
Generate an initial population of size by randomly creating feasible running schemes based on the input data. Ensure that all generated solutions satisfy the specified constraints, then perform non-dominated sorting to classify the population.
Evaluate the population by calculating the objective function values for each individual. Determine the ideal point by identifying the minimum values across all objectives. Generate reference points uniformly distributed across the four-dimensional objective space.
Adjust the mating selection probability using shift-based density estimation (SDE) to enhance the population diversity and convergence properties.
Perform selection, crossover, and mutation operations on the current population to produce an offspring population of size . Then, merge and to form a new combined population with a size of . During the generation of , validate each running scheme against the operational constraints. If any individual violates the constraints, regenerate it until all individuals in are feasible.
To construct the new population , non-dominated sorting is applied to . The population comprises the first non-dominated layers, denoted as to . These layers are selected such that the cumulative number of individuals in the first layers, is fewer than , while the total number of individuals in the first layers, meets or exceeds .
If contains more than individuals, all members from the first non-dominated layers are included in the offspring population . The remaining individuals required to reach are chosen from the -th non-dominated layer . On the other hand, if the number of individuals in exactly equals , the offspring population is set as . Subsequently, the iteration count is incremented by one, and the process advances to Step 10.
Normalize the objective space by projecting the population individuals onto the hyperplane that contains the reference points. Each individual in is then associated with the reference point exhibiting the smallest dynamic convergence distance, and the number of individuals linked to each reference point is determined.
Next, compute the niche count for each reference point, defined as the count of individuals associated with that reference point across the current and the preceding non-dominated layers. Reference points are selected in ascending order based on their niche counts. Individuals associated with these reference points are sequentially added from the layer to the offspring population until the population size reaches . Finally, the iteration count is incremented by one.
Check whether the number of iterations has reached the maximum number of iterations . If so, terminate the iteration, and repeat steps (4)–(9).
Output the Pareto optimal solution set. Extract the optimal solution based on specific operational requirements and generate the corresponding speed profile to complete the process of optimizing the operations of the railway catenary maintenance vehicle.
The subsequent sections provide a detailed explanation of the key enhancements implemented in the ESS-NSGA-III algorithm. These improvements focus on two primary advancements: the optimization of the mating selection probability via the implementation of SDE and the refinement of the environmental selection process using the dynamic convergence distance (DCD). Together, these methodological enhancements significantly improve the algorithm’s performance in addressing complex multi-objective optimization problems.
Figure 3.
Flow chart of multi-objective optimization algorithm based on the ESS-NSGA-III algorithm.
Figure 3.
Flow chart of multi-objective optimization algorithm based on the ESS-NSGA-III algorithm.
3.2. Optimization of Mating Selection Probability Using Shift-Based Density Estimation
In the traditional NSGA-III algorithm, the mating process employs a uniform random selection method that chooses individuals from the parent population. This method lacks a mechanism for evaluating the quality of individuals, preventing it from prioritizing individuals with superior characteristics. To address this limitation, this study introduces a novel method for optimizing the mating selection probability based on SDE.
SDE utilizes a parameter-free metric for assessing inter-individual densities, effectively balancing both convergence and diversity considerations [
22]. The SDE metric is mathematically defined by Equations (11) and (12), which quantify the density distribution within the population and account for the relative positions of the individuals in the objective space. By leveraging this approach, the selection process prioritizes individuals that enhance both population diversity and convergence toward the Pareto front; this is expressed as follows:
where
represents the
-th normalization objective value for individual
, which ensures that all objective values are scaled to a common range, facilitating accurate density estimations and comparisons between individuals.
The specific process for optimizing the mating selection probability based on SDE is as follows:
According to Equation (14), the ratio of the maximum probability value to the minimum probability value is . Compared to random uniform selection, this method significantly increases the probability of generating high-quality offspring during the evolutionary process.
3.3. Environment Selection Method Based on Dynamic Convergence Distance
During the environment selection stage, the NSGA-III algorithm considers only the perpendicular distance from an individual to the reference line and neglects the distance from the individual to the ideal point, leading to insufficient emphasis on convergence during the selection process. To address this limitation, this study proposes a novel environment selection method based on the DCD. The DCD integrates both the perpendicular distance (
) from an individual to the reference line and the projection distance (
) from the individual to the ideal point on the reference line, defined as follows:
where
represents the current iteration number,
denotes the maximum number of iterations, and
and
are the lower and upper bounds of the convergence coefficient
, respectively. In this study, the parameters are assigned values of
and
.
During the early stages of optimization, the primary objective is to accelerate the search process toward the Pareto front. Smaller values of prioritize convergence, enabling the algorithm to rapidly approach the optimal region. This emphasis on convergence ensures efficient progress toward high-quality solutions in the initial phases of the optimization process.
In contrast, during the later stages, the focus shifts to promoting diversity and ensuring the dispersion of solutions across the entire Pareto front. Larger values of enhance diversity, preventing the population from clustering in specific regions and ensuring comprehensive coverage of the Pareto optimal set. This balance between convergence and diversity ensures that the final solution set is both high-quality and well-distributed, capturing the full extent of the Pareto front.
4. Experimental Simulations and Results
In this section, a simulation analysis is performed on the operational task of the Huoqiu-Caomiao section of the Fuyang-Lu’an Railway in China, which includes nine target points spanning a total distance of 19.188 km. The characteristics of the line are illustrated in
Figure 4, including gradient, curve radius, and speed limit. The vehicle data used for this study were sourced from the JW-4G railway catenary maintenance vehicle, and its corresponding specifications are presented in
Table 1.
4.1. Simulation Experiment Settings
In the first case, the D1-D2 section was selected for the simulation to evaluate the effectiveness of the proposed algorithm. The performance of ESS-NSGA-III was evaluated against NSGA-III and NSGA-II. The parameters for these three algorithms are listed in
Table 2 and
Table 3.
In the second case, the entire operational route from D1 to D9 was simulated using the ESS-NSGA-III algorithm. The feasibility of the driving strategy optimization method was further validated by comparing the different running time strategies.
4.2. Results
4.2.1. Case 1: Algorithm Benchmarking on D1–D2 Section
For this case, the section from D1 to D2, which spanned 1995 m with a planned running time of 150 s, was selected for analysis. The ESS-NSGA-III, NSGA-III, and NSGA-II algorithms were utilized to solve the multi-objective model, and their simulation results were compared. To assess the performance of the three algorithms, a variety of evaluation metrics were applied to the results, and they are summarized in
Table 4.
Among these metrics, spread [
23] quantifies the diversity of the solution set by assessing the uniformity and range of its distribution in the objective space. The inverted generational distance (IGD) [
24] serves as a comprehensive performance indicator, evaluating both convergence and diversity through the measurement of distances between the obtained solutions and the true Pareto front. Hypervolume (HV) [
25], on the other hand, measures the volume of the objective space dominated by the solution set, providing insights into both convergence and diversity.
For each generation, the non-dominated solution sets from the three algorithms were combined and underwent unified non-dominated sorting. This procedure generated a collection of Pareto-optimal solutions, which were dominated and then mapped in the objective space to establish the true Pareto front (PF). The PF was subsequently utilized to compute the performance metrics for algorithmic evaluation.
Table 5 presents the percentage differences between the metrics for ESS-NSGA-III and those for NSGA-III and NSGA-II. Compared to NSGA-II, the ESS-NSGA-III algorithm achieved improvements of −12.89%, 4.12%, and −5.79% for the spread, HV, and IGD, respectively. These results indicate superior diversity and convergence characteristics in the four-dimensional optimization space. Furthermore, when compared to NSGA-III, ESS-NSGA-III exhibited improvements of −8.15%, 0.77%, and −3.66% for the spread, HV, and IGD, respectively, confirming the algorithm’s ability to balance solution quality across conflicting objectives.
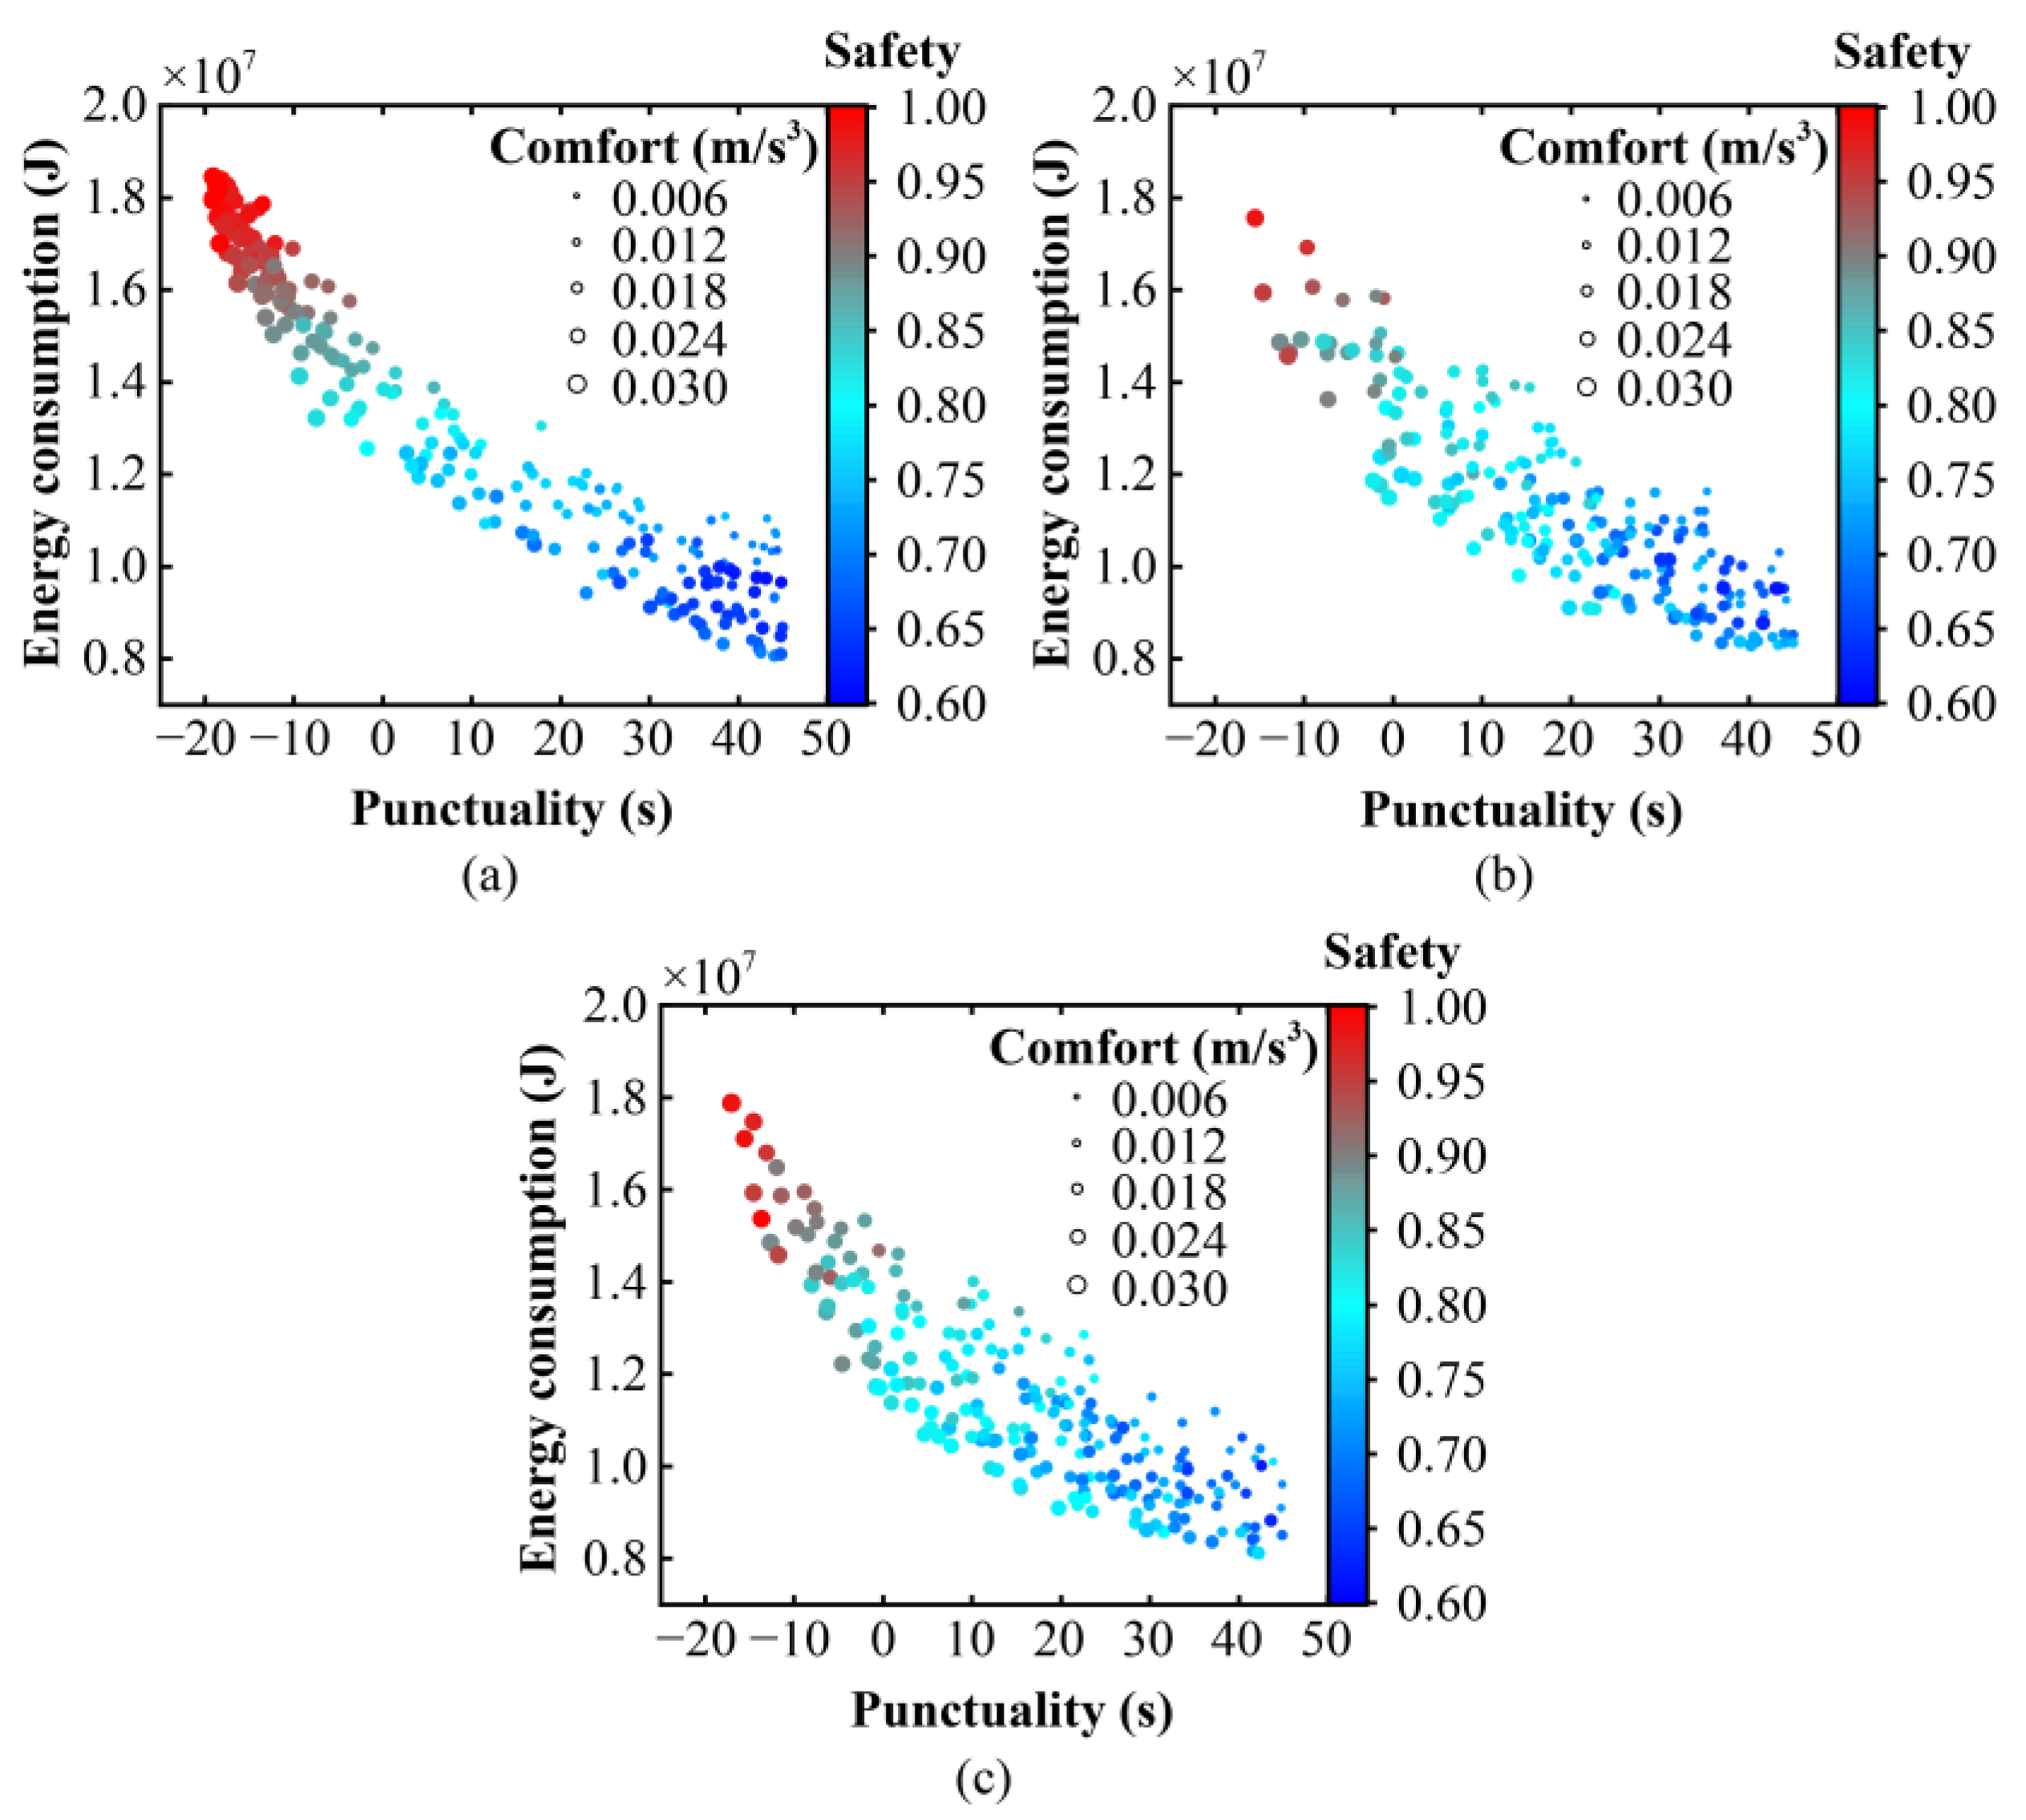
Figure 5 presents the Pareto fronts generated by the three algorithms for section D1–D2, plotted with energy consumption on the vertical axis and punctuality metrics on the horizontal axis. The colors and sizes of the data points indicate the safety and comfort indices, respectively. Each particle represents a unique set of independent operational control strategies.
The results indicate that all three algorithms successfully identified points on the Pareto front. However, the NSGA-II algorithm, which uses the crowding distance to select optimal individuals, exhibited skewness in its solution set. The objective points tended to cluster at the two extremes of the distribution, resulting in an insufficient uniformity in the central interval. This uneven distribution highlights the limitations of NSGA-II in managing high-dimensional multi-objective optimization problems.
The most punctual solutions extracted from the Pareto optimal sets obtained by the ESS-NSGA-III, NSGA-III, and NSGA-II algorithms for section D1–D2 were compared, and the corresponding metrics are presented in
Table 6. Specifically, ESS-NSGA-III achieved the lowest energy consumption (1.3241 × 10
4 J), which represents a significant improvement over NSGA-III (1.3325 × 10
4 J) and NSGA-II (1.3832 × 10
4 J), with energy savings rates of 0.6% and 4.3%, respectively. In terms of punctuality, ESS-NSGA-III exhibited the smallest time deviation of 0.1 s, outperforming NSGA-III (0.3 s) and NSGA-II (0.4 s). Regarding ride comfort, ESS-NSGA-III achieved the optimal value of 0.0197 m/s
3, performing slightly better than NSGA-II (0.0199 m/s
3) and NSGA-III (0.0201 m/s
3). Additionally, ESS-NSGA-III maintained a competitive safety index of 0.8201, also performing slightly better than NSGA-III (0.8228) and NSGA-II (0.8251).
4.2.2. Case 2: Full-Line Strategy Optimization (D1–D9)
Using the proposed ESS-NSGA-III algorithm, this study conducted a comprehensive comparison of three operation strategies: the minimum running time strategy, the punctual operation strategy, and the delayed operation strategy. The minimum running time strategy served as the baseline reference, while the punctual and delayed operation strategies were derived respectively from the Pareto-optimal solution sets corresponding to the planned and delayed operational schedules for each section, as detailed in
Table 7.
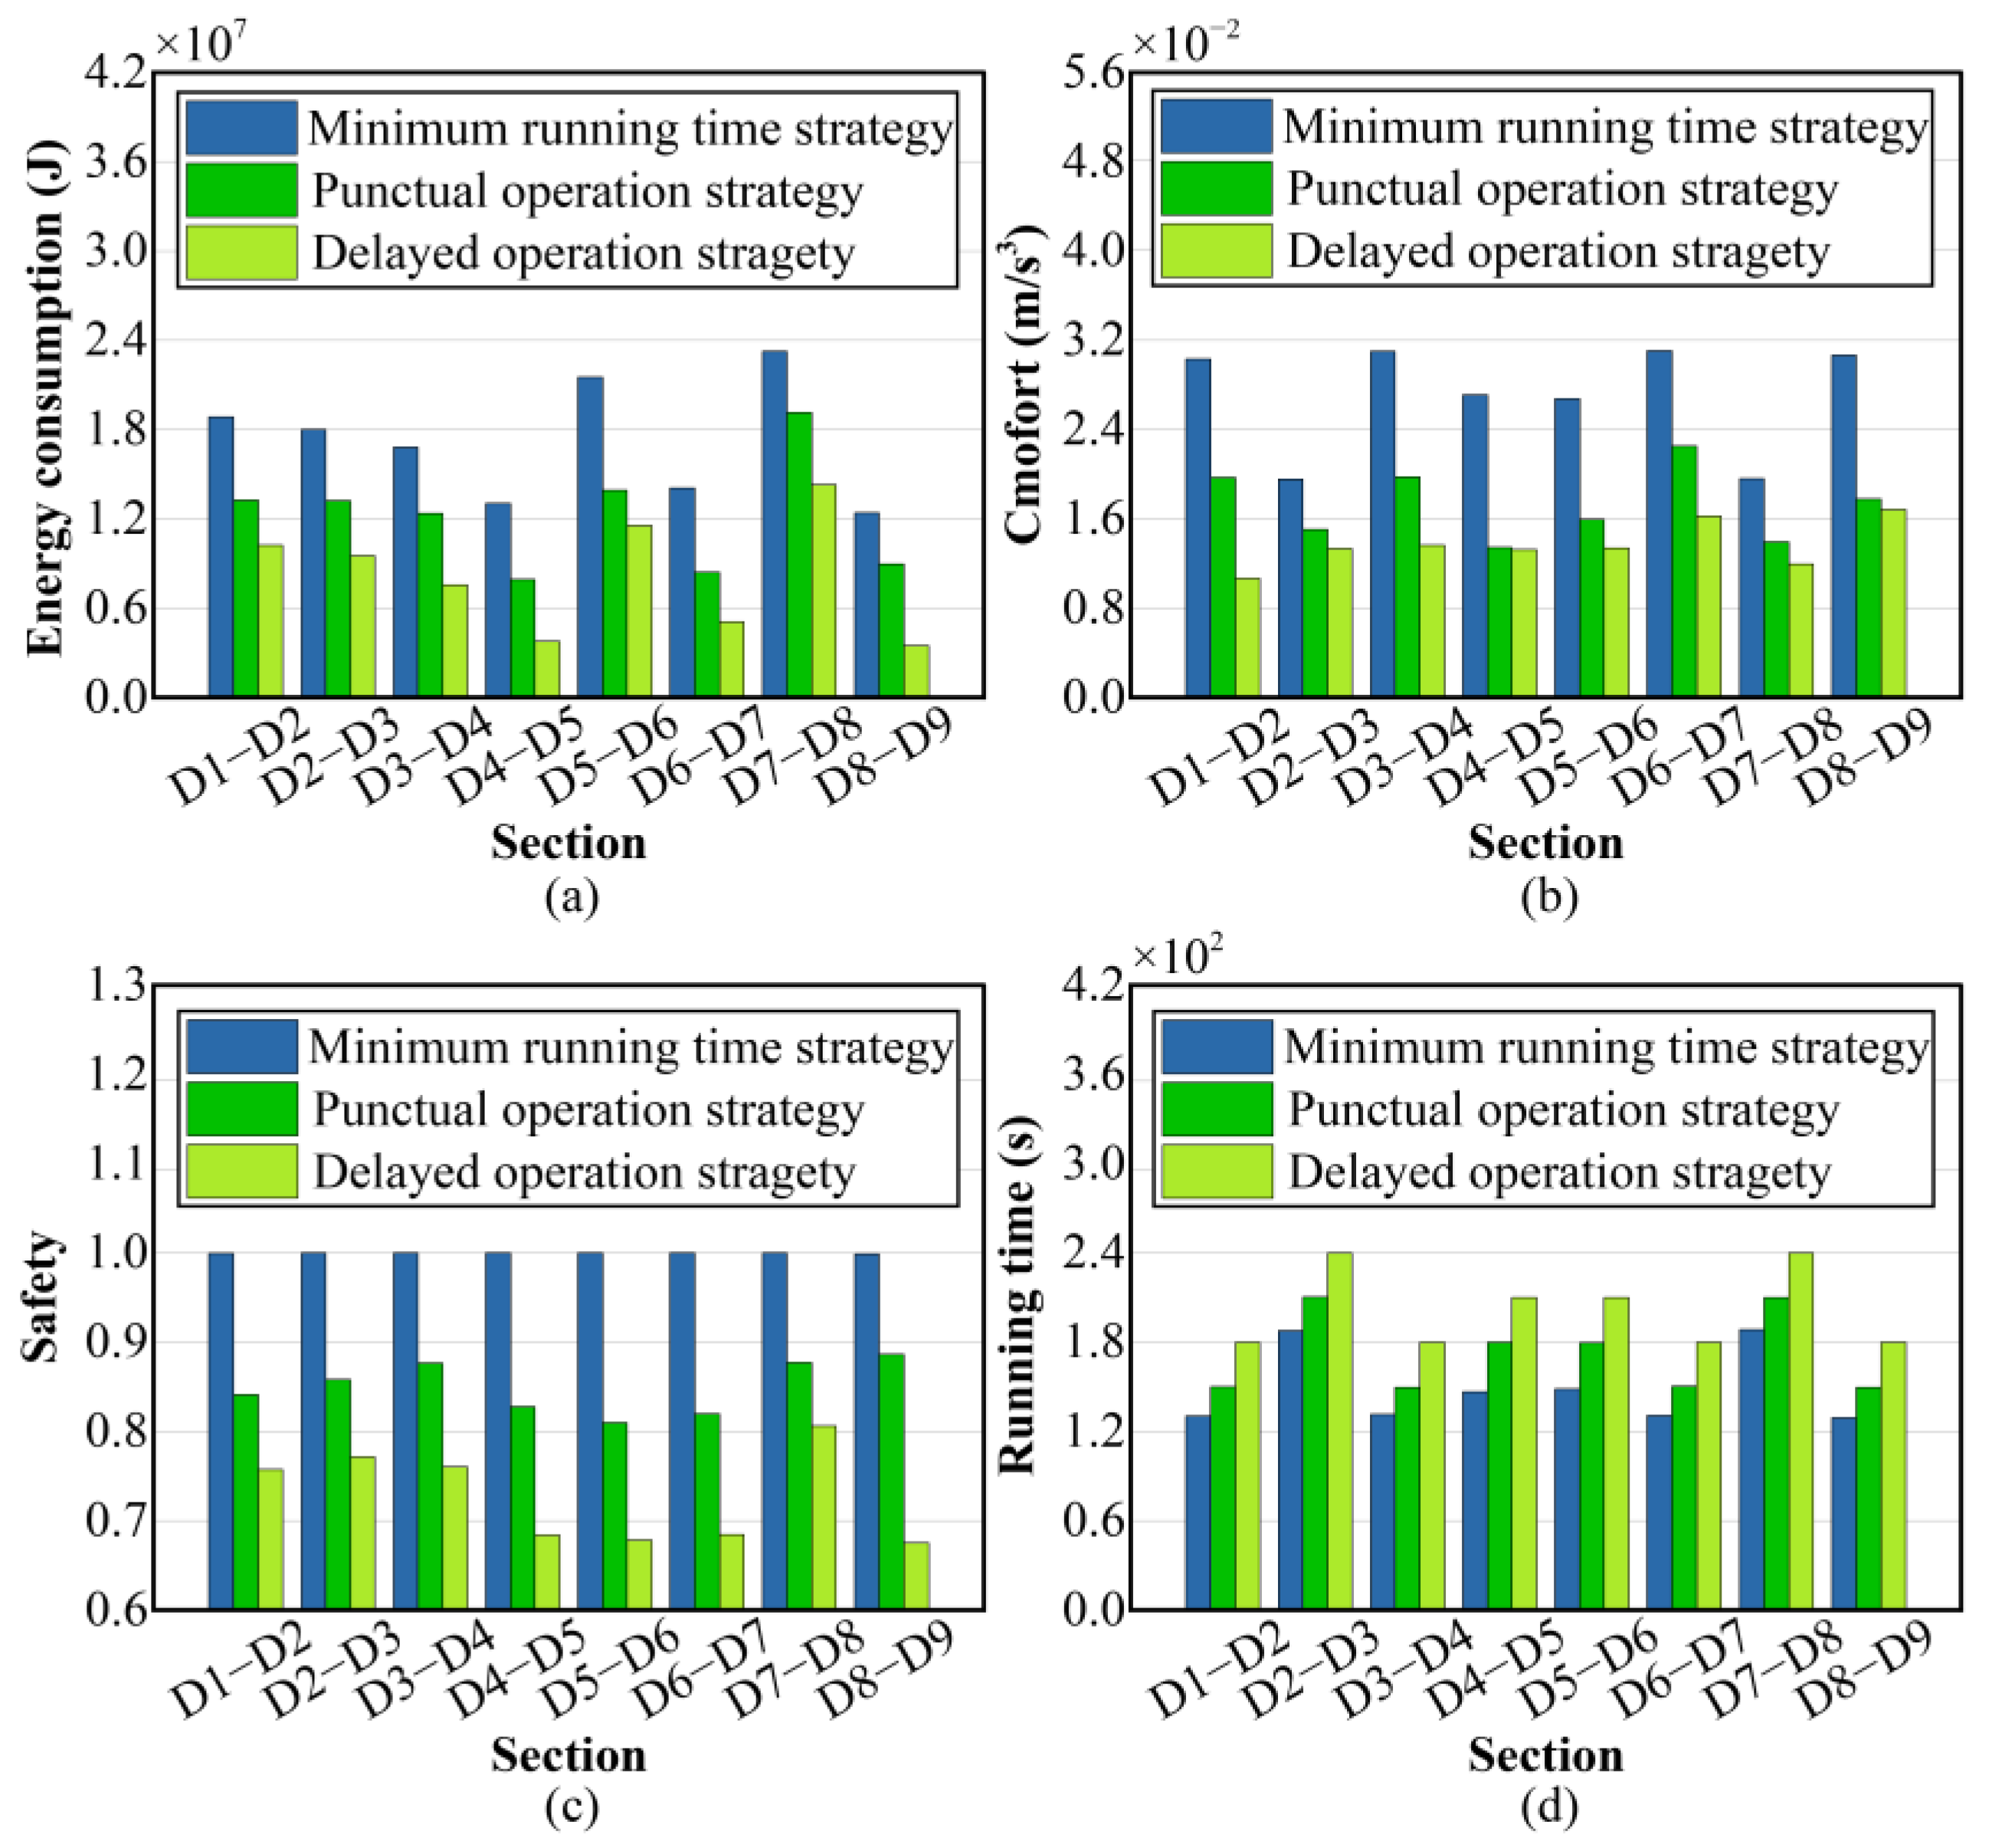
Figure 6 presents the comprehensive performance metrics of the three operational strategies, encompassing energy consumption, passenger comfort, safety parameters, and operational duration. Comparative analysis reveals significant inter-strategy variations in segment-specific metrics, while a uniform trend alignment across all track segments highlights characteristic performance patterns inherent to each operational methodology.
Table 8 summarizes the cumulative performance metrics of the three operational strategies across the D1–D9 section. Comparative analysis demonstrates that the punctual operation strategy exhibited significant improvements over the minimum running time strategy, extending the total running time by 186.3 s while achieving substantial reductions in key performance indicators. Specifically, it reduced the energy consumption by 4.0707 × 10
4 J (29.51%), improved the comfort by 0.0780 m/s
3 (36.10%), and enhanced the safety by 1.2244 (15.30%).
The delayed operation strategy further extended the operational duration by 426.3 s compared to the minimum running time strategy, yielding even greater performance enhancements. This strategy achieved reductions of 7.2903 × 10⁴ J (52.86%), 0.1045 m/s3 (48.35%), and 2.1901 (27.38%) in energy consumption, comfort, and safety, respectively.
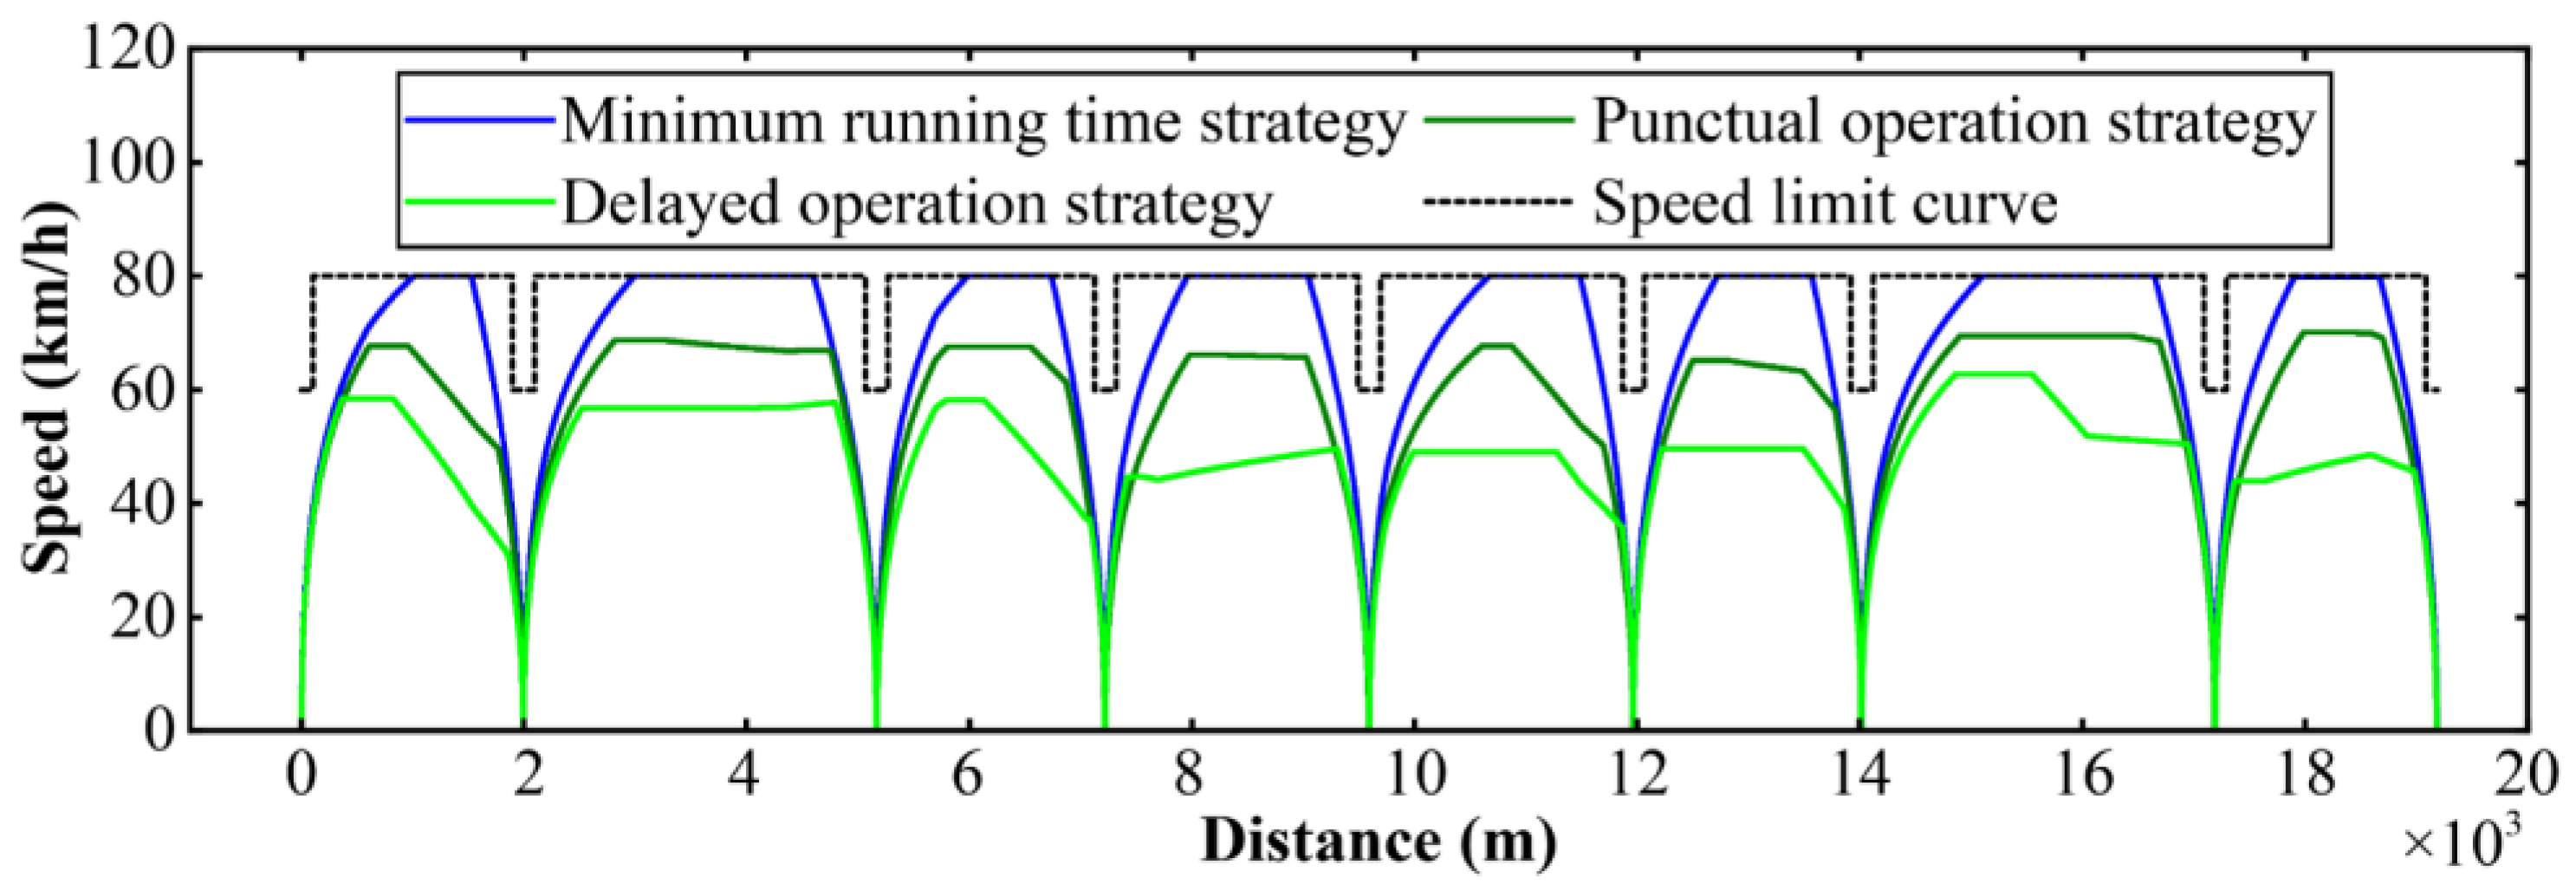
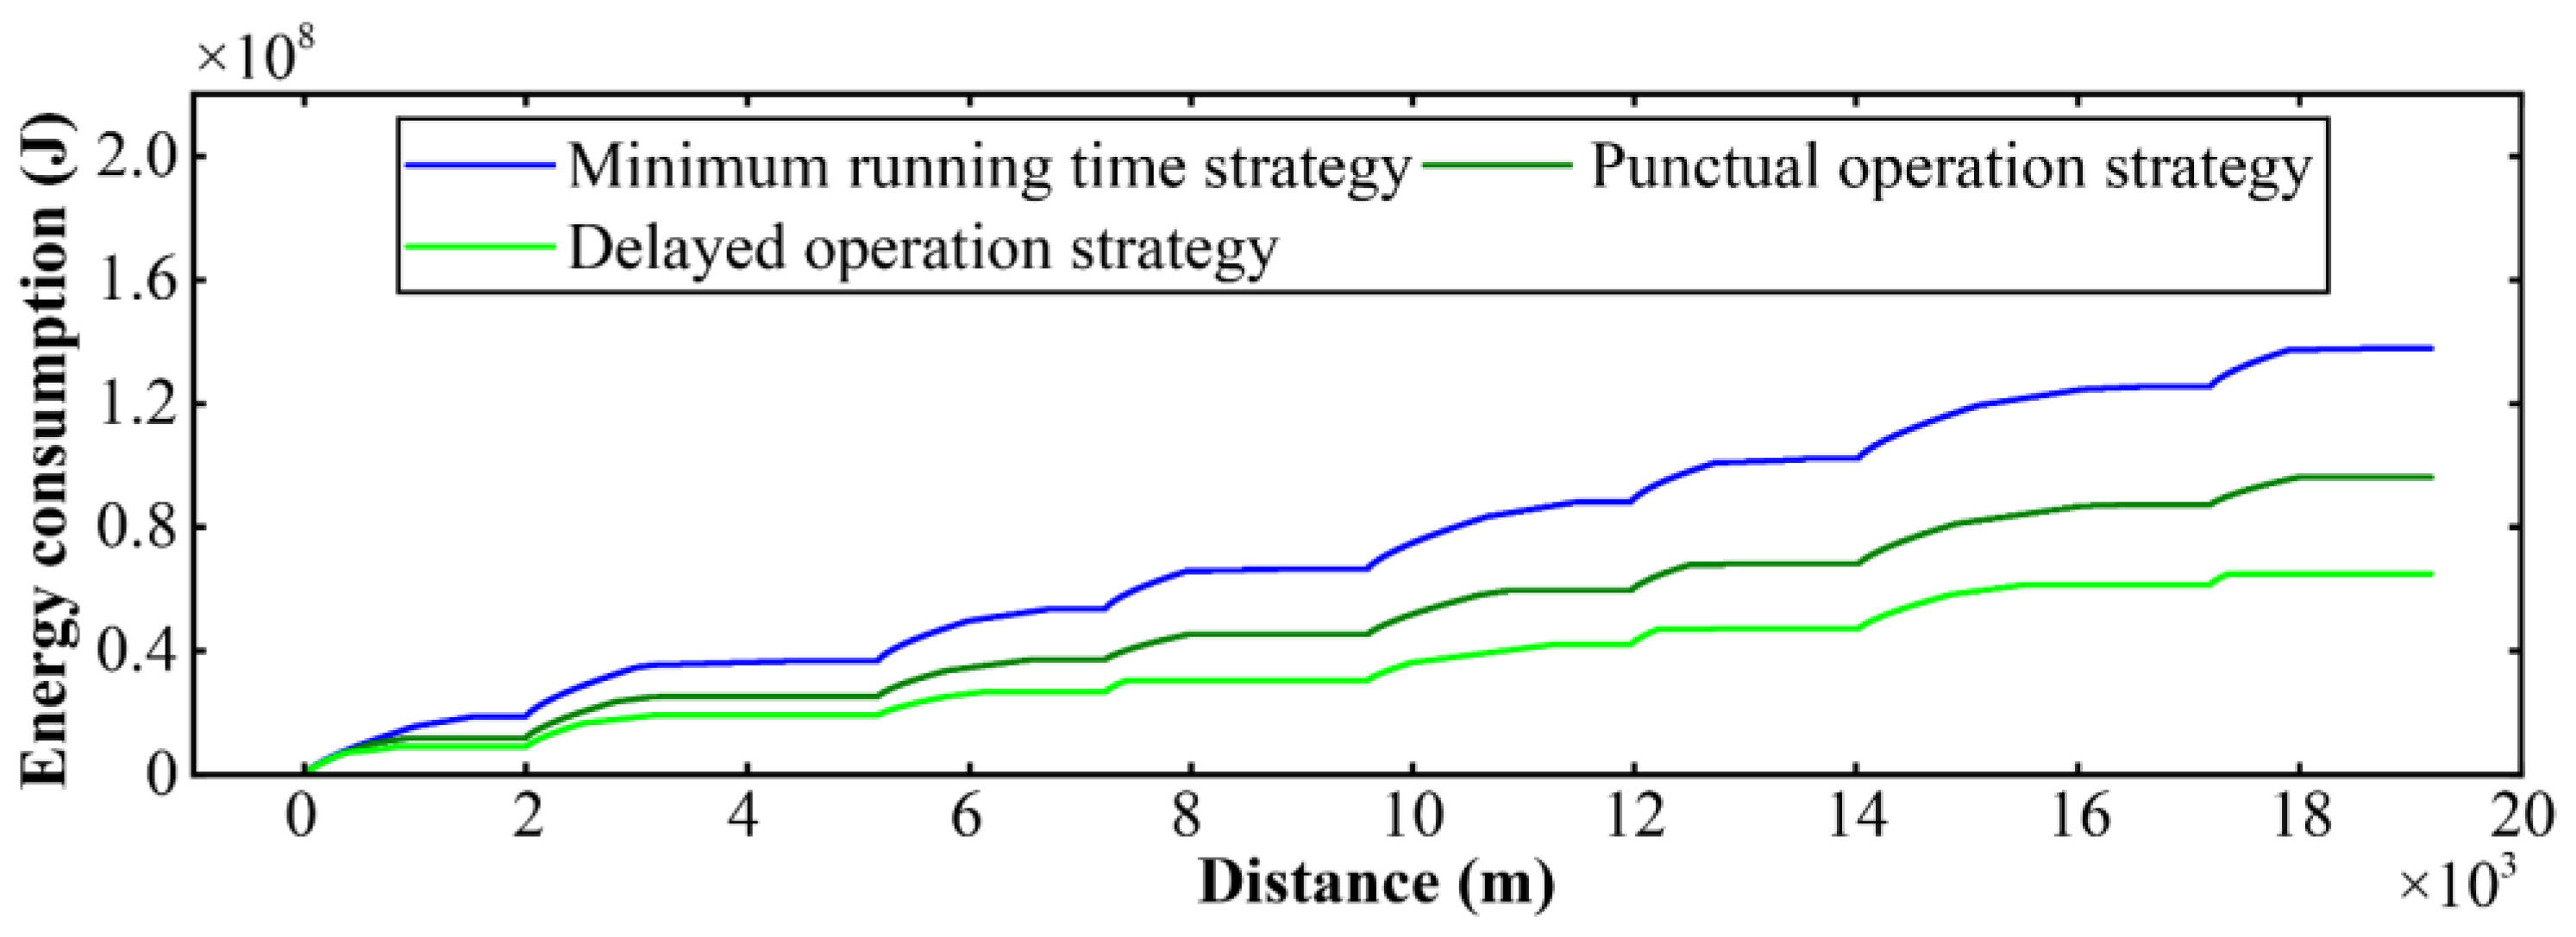
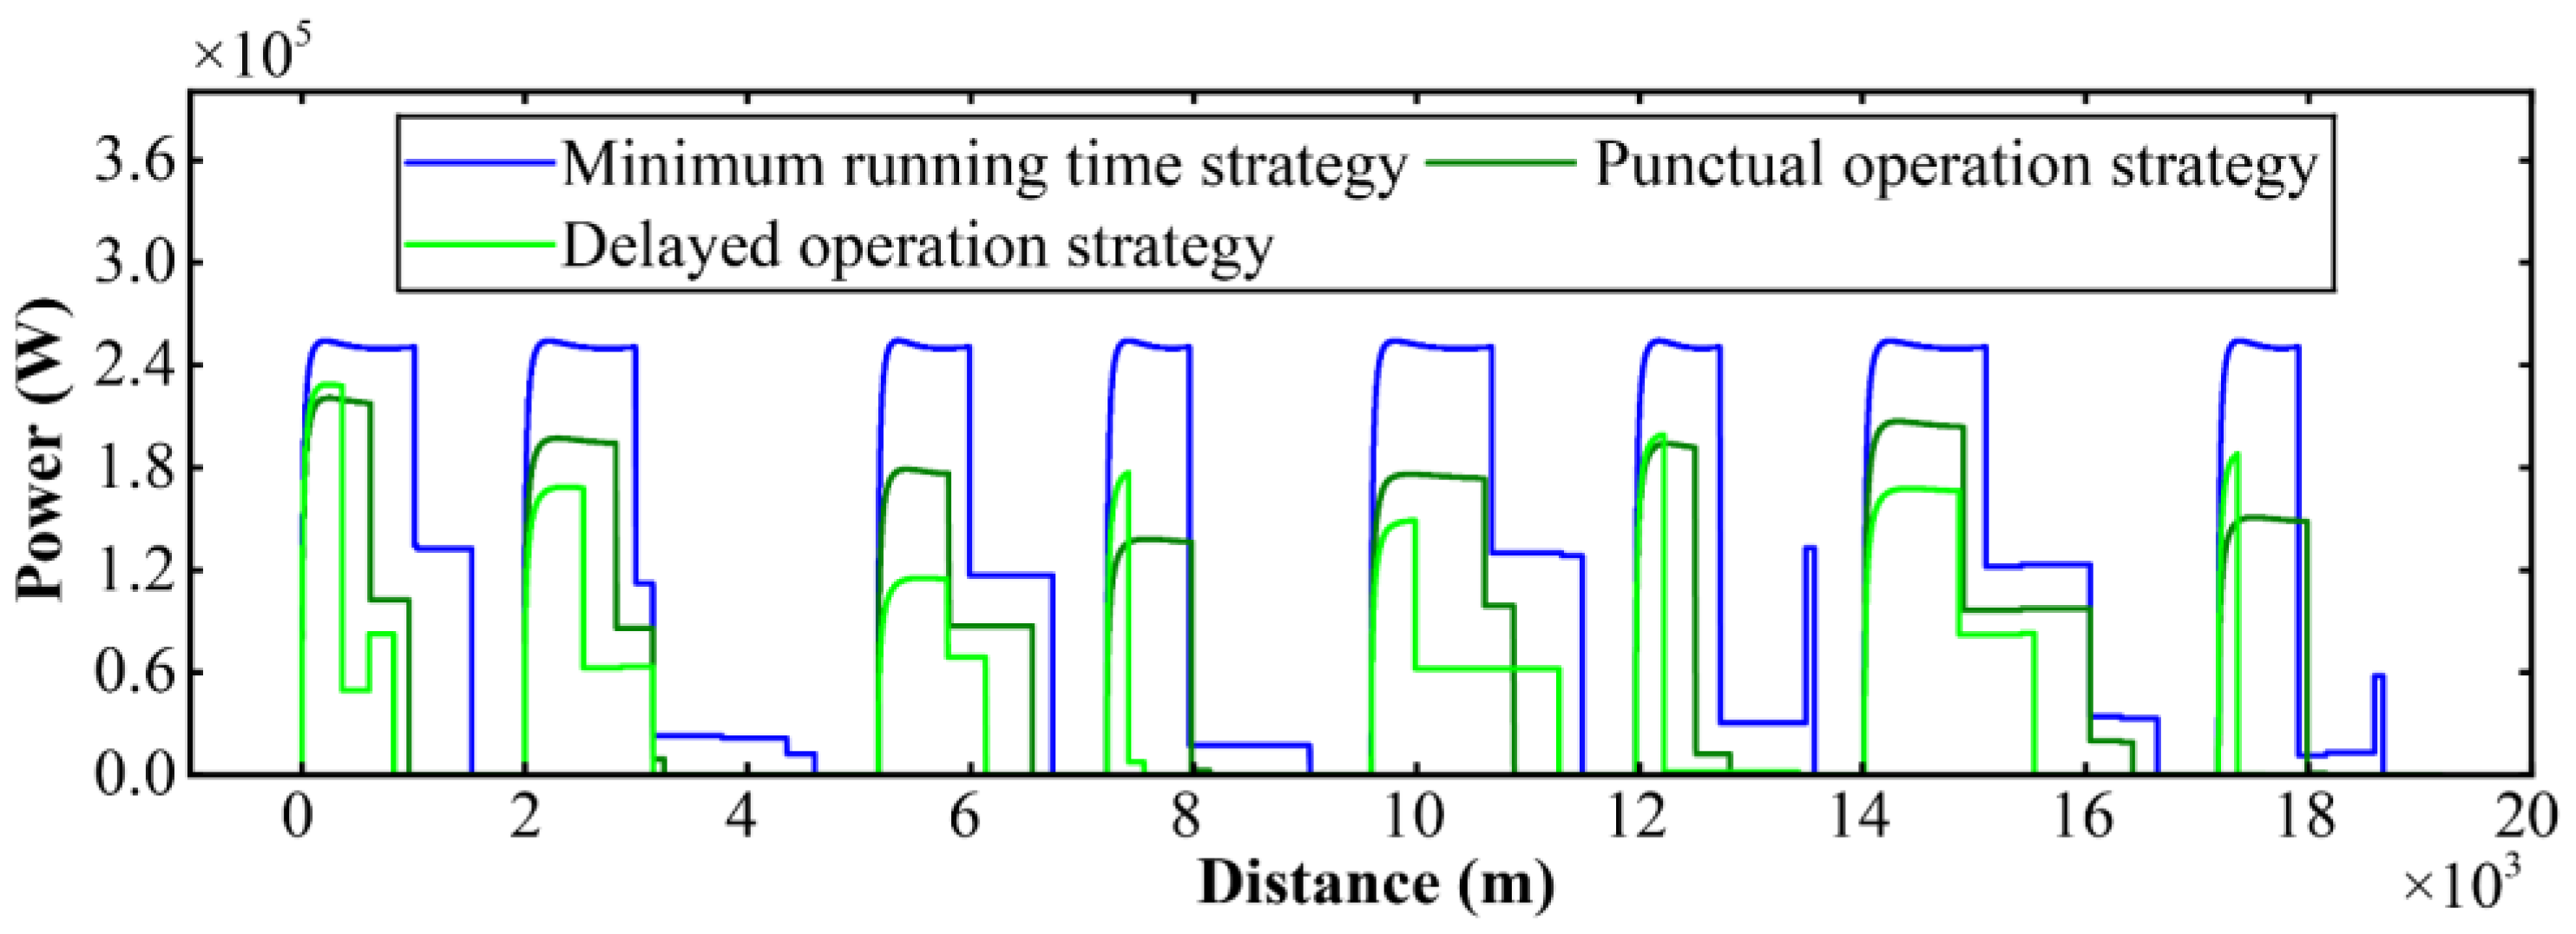
The complete speed, energy, and power profiles derived from the three strategies are illustrated in
Figure 7,
Figure 8 and
Figure 9, respectively. Comparative analysis reveals that the punctual operation strategy, when compared to the minimum running time strategy, demonstrated an effective allocation of switching points, traction ratios, and braking ratios across each section. This approach maximized the use of coasting phases, thereby minimizing the traction energy consumption while maintaining optimal comfort and safety levels. The delayed operation strategy further enhanced the energy efficiency, comfort, and safety, provided that the operating time window allowed for such adjustments.
5. Discussion
This study demonstrates the superior comprehensive performance of the ESS-NSGA-III algorithm in solving four-dimensional multi-objective optimization problems through comparative analyses with NSGA-III and NSGA-II. Simulation results reveal that ESS-NSGA-III outperforms conventional algorithms in spread, HV, and IGD metrics (
Table 4 and
Table 5). Specifically, ESS-NSGA-III achieves a 4.12% improvement in HV and a 5.79% reduction in IGD compared to NSGA-II, indicating enhanced convergence and diversity in the obtained solution sets, which align more closely with the true Pareto front (
Table 5 and
Figure 5). When compared to NSGA-III, ESS-NSGA-III reduces spread and IGD by 8.15% and 3.66%, respectively, validating that the proposed SDE and DCD mechanisms effectively enhance solution distribution uniformity (
Table 5 and
Figure 5). These findings align with the distance dominance relationship reported in [
26], yet our improvements exhibit greater efficacy in four-dimensional objective spaces.
Practical applications demonstrate that ESS-NSGA-III achieves balanced optimization, excelling in energy efficiency while maintaining high punctuality, comfort, and safety (
Table 6). These results corroborate the energy-saving control strategies for trains proposed in [
27] but extend the flexibility of multi-objective trade-offs through the Pareto optimization framework. Comparisons of operational strategies reveal that moderately extending running time significantly improves comprehensive performance (
Figure 6 and
Table 8). This improvement is operationally realized through three key measures: shortening traction duration, lowering cruising speed, and optimizing downhill coasting phases (
Figure 7,
Figure 8 and
Figure 9). While this aligns with the time–energy trade-off theory in [
13], our study further quantifies the marginal benefits of comfort and safety enhancements. The Pareto-optimal solutions derived from ESS-NSGA-III enable the extraction of optimal driving strategies, offering actionable guidance for operators. This methodology supports eco-driving practices for catenary maintenance vehicles, demonstrating practical relevance in railway operations.
However, this study has several limitations that warrant further investigation. First, the simulation experiments assume a static operational environment and do not incorporate dynamic factors (e.g., weather variations), which may limit the algorithm’s generalizability in complex dynamic scenarios. Second, while the case studies focus on operational optimization for a specific section, the applicability of the algorithm across diverse railway lines requires additional validation. Finally, the research considers single-vehicle operations and neglects collaborative optimization in multi-vehicle cooperative scenarios.
Future research should prioritize the following directions. First, dynamic environmental factors should be integrated into the optimization framework, and online adaptive algorithms (e.g., deep reinforcement learning) could be developed to improve computational efficiency and enhance robustness in time-varying scenarios. Second, simulation validations across different railway lines should be conducted to evaluate the algorithm’s effectiveness under heterogeneous operational conditions. Lastly, the model should be extended to accommodate multi-vehicle cooperative operations, thereby broadening the algorithm’s applicability in intelligent transportation systems.
6. Conclusions
The primary contribution of this study is the development of a multi-objective optimization algorithm for determining the optimal speed profiles of railway catenary maintenance vehicles. A multi-objective optimization model was first formulated for an operational scenario of railway catenary maintenance vehicles, integrating energy consumption, punctuality, comfort, and safety as optimization objectives. These objectives were included to ensure a sufficiently large solution space and to capture the complexities of real-world operations. Furthermore, the ESS-NSGA-III algorithm was introduced, incorporating the shift density distance and dynamic convergence distance to enhance the mating selection probability and environmental selection process, respectively.
The proposed optimization model and algorithm were validated using an operational scenario of the Huoqiu-Caomiao section as a case study. In section D1–D2, the ESS-NSGA-III algorithm demonstrated improvements of −12.89%, 4.12%, and −5.79% for the spread, HV, and IGD metrics, respectively, compared to the NSGA-II algorithm. Similarly, improvements of −8.15%, 0.77%, and −3.66% were achieved when compared to the NSGA-III algorithm. Additionally, the Pareto front distribution confirmed that the ESS-NSGA-III algorithm exhibited superior convergence and diversity, reinforcing its effectiveness in solving complex multi-objective optimization problems.
ESS-NSGA-III achieved a superior multi-objective optimization performance for section D1-D2, achieving the lowest energy consumption (1.3241 × 10⁴ J) compared to NSGA-III and NSGA-II. It also excelled in terms of punctuality (0.1 s), comfort (0.0197 m/s3), and safety (0.8201). These results indicate that ESS-NSGA-III is a robust and efficient algorithm for complex engineering optimization tasks.
Additionally, the ESS-NSGA-III algorithm was applied to optimize sections D1–D9, resulting in the derivation of both punctual operation and delayed operation strategies. Compared to the minimum running time strategy, the punctual operation strategy reduced energy consumption, comfort, and safety indicators by 29.51%, 36.10%, and 14.93%, respectively. Similarly, the delayed operation strategy achieved reductions of 52.86%, 48.35%, and 27.38% in terms of the same indicators. These findings suggest that, within permissible operational limits, maximizing running time can significantly enhance the overall operational performance. The proposed method offers a valuable reference for drivers in real-world operations, enabling them to flexibly select control strategies based on specific requirements to improve operational quality.
Author Contributions
Conceptualization, B.Z., G.S., Y.W. and Y.Z.; methodology, B.Z. and G.S.; software, G.S.; validation, G.S.; formal analysis, Y.W., C.Z. and X.W.; resources, B.Z. and C.Z.; data curation, X.W., Z.L. and X.L.; writing—original draft, B.Z. and G.S.; writing—review and editing, Y.W. and Y.Z.; visualization, B.Z., G.S. and Z.L.; supervision, B.Z. and G.S.; project administration, B.Z.; funding acquisition, B.Z. All authors have read and agreed to the published version of the manuscript.
Funding
This work was supported by the Joint Research Project of the Yangtze River Delta Science and Technology Innovation Community [Grant No. 2022CSJGG1501], the Major Science and Technology Projects of Anhui Province [Grant No. 202203a05020008], the Key Research and Development Project of Anhui Province [Grant No. 202423d12050007], the 2023 Anhui Province Industrial Foundation Capability Enhancement Task List [Grant No. JZ2024AFKJ0344], and the Key Project of Anhui Province Science and Technology [Grant No. 202423e12050001].
Institutional Review Board Statement
Not applicable.
Informed Consent Statement
Not applicable.
Data Availability Statement
Data are contained within the article.
Conflicts of Interest
The authors declare no conflicts of interest.
References
- Xu, R.-H.; Lai, Y.-C.; Huang, K.-L. Decision support models for annual catenary maintenance task identification and assignment. Transp. Res. Part E Logist. Transp. Rev. 2021, 152, 102402. [Google Scholar] [CrossRef]
- Lin, S.; Shang, C.; Li, N.; Sun, X.; Feng, D.; He, Z. An Optimization Method for Maintenance Resource Allocation in Electrified Railway Catenary Systems. IEEE Trans. Ind. Appl. 2023, 59, 641–651. [Google Scholar] [CrossRef]
- Yang, J.; Wang, B.; Jia, L.M.; Zhu, K. Review of Energy-Efficient Train Trajectory Optimization and Intelligent Control. In Proceedings of the 4th International Conference on Electrical and Information Technologies for Rail Transportation (EITRT) 2019, Qingdao, China, 25–27 October 2019; pp. 317–326. [Google Scholar]
- Wang, X.X.; Wu, J.; Zhang, C.; Zhang, Y.R. Multi-objective online driving strategy optimization for energy storage tram considering battery life. J. Energy Storage 2024, 100, 113498. [Google Scholar] [CrossRef]
- Domínguez, M.; Fernández-Cardador, A.; Cucala, A.P.; Gonsalves, T.; Fernández, A. Multi objective particle swarm optimization algorithm for the design of efficient ATO speed profiles in metro lines. Eng. Appl. Artif. Intell. 2014, 29, 43–53. [Google Scholar] [CrossRef]
- Yang, H.; Liu, H.E.; Fu, Y.T. Multi-objective operation optimization for electric multiple unit-based on speed restriction mutation. Neurocomputing 2015, 169, 383–391. [Google Scholar] [CrossRef]
- ShangGuan, W.; Yan, X.H.; Cai, B.G.; Wang, J. Multiobjective Optimization for Train Speed Trajectory in CTCS High-Speed Railway With Hybrid Evolutionary Algorithm. IEEE Trans. Intell. Transport. Syst. 2015, 16, 2215–2225. [Google Scholar] [CrossRef]
- Fernández-Rodríguez, A.; Fernández-Cardador, A.; Cucala, A.P. Real time eco-driving of high speed trains by simulation-based dynamic multi-objective optimization. Simul. Model. Pract. Theory 2018, 84, 50–68. [Google Scholar] [CrossRef]
- Pu, Q.; Zhu, X.M.; Zhang, R.T.; Liu, J.; Cai, D.B.; Fu, G.H. Multiobjective Optimization on the Operation Speed Profile Design of an Urban Railway Train With a Hybrid Running Strategy. IEEE Intell. Transport. Syst. Mag. 2022, 14, 230–243. [Google Scholar] [CrossRef]
- Huang, B.Z.; Chen, D.W.; Huang, Y.H.; Lai, W.Z. Subway Train Time-Energy Alternative Set Generation Considering Passenger Flow Data Based on Adaptive NSGA-II Algorithm. In Proceedings of the Advances in Natural Computation, Fuzzy Systems and Knowledge Discovery, Fuzhou, China, 30 July–1 August 2019; pp. 527–535. [Google Scholar]
- Fernández, P.M.; Font Torres, J.B.; Sanchís, I.V.; Franco, R.I. Multi objective ant Colony Optimisation to obtain efficient metro speed profiles. Proc. Inst. Mech. Eng. Part F J. Rail Rapid Transit 2023, 237, 232–242. [Google Scholar] [CrossRef]
- Havaei, P.; Sandidzadeh, M.A. Multi-objective train speed profile determination for automatic train operation with conscious search: A new optimization algorithm, a comprehensive study. Eng. Appl. Artif. Intell. 2023, 119, 105756. [Google Scholar] [CrossRef]
- Zhang, Z.Y.; Cheng, X.Q.; Xing, Z.Y.; Gui, X.D. Pareto multi-objective optimization of metro train energy-saving operation using improved NSGA-II algorithms. Chaos Solitons Fractals 2023, 176, 114183. [Google Scholar] [CrossRef]
- Sánchez-Contreras, G.; Fernández-Rodríguez, A.; Fernández-Cardador, A.; Cucala, A.P. A Two-Level Fuzzy Multi-Objective Design of ATO Driving Commands for Energy-Efficient Operation of Metropolitan Railway Lines. Sustainability 2023, 15, 9238. [Google Scholar] [CrossRef]
- Chen, X.; Meng, J.; Xu, R.; Li, D.; Yang, H. Research on Multi-Objective Optimization Methods of Urban Rail Train Automatic Driving Based on NSGA-II. Electronics 2024, 13, 3971. [Google Scholar] [CrossRef]
- Blanco-Castillo, M.; Adrián, F.-R.; Su, S.; Antonio, F.-C.; Cucala, A.P. Efficient automatic operation of a metro line: Eco-driving design with optimized use of regenerative energy and rolling stock consideration. Eng. Optim. 2024. [Google Scholar] [CrossRef]
- Zhang, H.; Jia, L.; Wang, L.; Xu, X.; Dou, F. Energy-Efficient Timetable Optimization Empowered by Time-Energy Pareto Solution Under Actual Line Conditions. IEEE Trans. Intell. Transport. Syst. 2024, 25, 7106–7124. [Google Scholar] [CrossRef]
- Xu, X.; Cheng, D.; Wang, D.; Li, Q.; Yu, F. An Improved NSGA-III with a Comprehensive Adaptive Penalty Scheme for Many-Objective Optimization. Symmetry 2024, 16, 1289. [Google Scholar] [CrossRef]
- Zhou, M.; Zhou, X.Y.; Cao, Y.G.; Yang, B.; Dong, H. Double Deep Q network-based speed trajectory intelligent optimization for high-speed train. In Proceedings of the 2022 34th Chinese Control and Decision Conference (CCDC), Hefei, China, 15–17 August 2022; pp. 2436–2441. [Google Scholar]
- Deb, K.; Jain, H. An Evolutionary Many-Objective Optimization Algorithm Using Reference-Point-Based Nondominated Sorting Approach, part I: Solving Problems With Box Constraints. IEEE Trans. Evol. Comput. 2014, 18, 577–601. [Google Scholar] [CrossRef]
- Gu, Z.M.; Wang, G.G. Improving NSGA-III algorithms with information feedback models for large-scale many-objective optimization. Future Gener. Comput. Syst. 2020, 107, 49–69. [Google Scholar] [CrossRef]
- Li, M.Q.; Yang, S.X.; Liu, X.H. Shift-Based Density Estimation for Pareto-Based Algorithms in Many-Objective Optimization. IEEE Trans. Evol. Comput. 2014, 18, 348–365. [Google Scholar] [CrossRef]
- Wang, Y.N.; Wu, L.H.; Yuan, X.F. Multi-objective self-adaptive differential evolution with elitist archive and crowding entropy-based diversity measure. Soft Comput. 2009, 14, 193–209. [Google Scholar] [CrossRef]
- Coello, C.A.C.; Cortes, N.C. Solving Multiobjective Optimization Problems Using an Artificial Immune System. Genet. Program. Evolvable Mach. 2005, 6, 163–190. [Google Scholar] [CrossRef]
- Zitzler, E.; Thiele, L. Multiobjective evolutionary algorithms: A comparative case study and the strength Pareto approach. IEEE Trans. Evol. Comput. 1999, 3, 257–271. [Google Scholar] [CrossRef]
- Gu, Q.; Xu, Q.; Li, X. An improved NSGA-III algorithm based on distance dominance relation for many-objective optimization. Expert Syst. Appl. 2022, 207, 117738. [Google Scholar] [CrossRef]
- Li, W.; Sizhe, Z.; Kang, L.; Yi, X.; Qian, L.; Yao, W. GSOANR-based multi-objective train trajectory optimization. Int. J. Rail Transp. 2024, 12, 733–748. [Google Scholar] [CrossRef]
Figure 1.
Schematic diagram of scheduled round-trip maintenance operations for a railway catenary maintenance vehicle.
Figure 1.
Schematic diagram of scheduled round-trip maintenance operations for a railway catenary maintenance vehicle.
Figure 2.
Speed profiles of the four-stage operational and minimum running time strategies.
Figure 2.
Speed profiles of the four-stage operational and minimum running time strategies.
Figure 4.
Characteristics of the operational line: (a) gradient, (b) curve radius, and (c) speed limit.
Figure 4.
Characteristics of the operational line: (a) gradient, (b) curve radius, and (c) speed limit.
Figure 5.
Pareto fronts generated by the different algorithms for section D1–D2: (a) NSGA-II, (b) NSGA-III, and (c) ESS-NSGA-III.
Figure 5.
Pareto fronts generated by the different algorithms for section D1–D2: (a) NSGA-II, (b) NSGA-III, and (c) ESS-NSGA-III.
Figure 6.
Comparison between four indicators for the three strategies for each section: (a) energy consumption, (b) comfort, (c) safety, and (d) running time.
Figure 6.
Comparison between four indicators for the three strategies for each section: (a) energy consumption, (b) comfort, (c) safety, and (d) running time.
Figure 7.
Speed profiles for the three strategies.
Figure 7.
Speed profiles for the three strategies.
Figure 8.
Energy consumption–distance curves for the three strategies.
Figure 8.
Energy consumption–distance curves for the three strategies.
Figure 9.
Power–distance curves for the three strategies.
Figure 9.
Power–distance curves for the three strategies.
Table 1.
Characteristics of the railway catenary maintenance vehicle.
Table 1.
Characteristics of the railway catenary maintenance vehicle.
| Symbol | Name | Characteristic |
|---|
| Mass (kg) | |
| Rotating mass coefficient | |
| Maximum operating speed (km/h) | |
| Maximum traction force (N) | |
| Maximum braking force (N) | |
| Basic operating resistance parameters | |
| Gradient resistance (N) | |
| Curve resistance (N) | |
Table 2.
Parameters of the ESS-NSGA-III and NSGA-III algorithms.
Table 2.
Parameters of the ESS-NSGA-III and NSGA-III algorithms.
| Parameter | Value |
|---|
| Population size () | 220 |
| Maximum number of iterations () | 50 |
| Cross-distribution parameter () | 30 |
| SBX probability () | 1.0 |
| PM variant parameters () | 20 |
| Polynomial variational probability () | 0.25 |
Table 3.
Parameters of the NSGA-II algorithm.
Table 3.
Parameters of the NSGA-II algorithm.
| Parameter | Value |
|---|
| Population size () | 220 |
| Maximum number of iterations () | 50 |
| Crossover probability () | 0.9 |
| Probability of mutation () | 0.1 |
Table 4.
Performance indicators of the three algorithms for section D1–D2.
Table 4.
Performance indicators of the three algorithms for section D1–D2.
| Algorithm | Spread | Hypervolume (HV) | Inverted Generational Distance (IGD) |
|---|
| ESS-NSGA-III | 0.3578 | 0.3626 | 0.0663 |
| NSGA-III | 0.3750 | 0.3597 | 0.0681 |
| NSGA-II | 0.4281 | 0.3494 | 0.0692 |
Table 5.
Percentage differences in the optimization indicators between ESS-NSGA-III, NSGA-III, and NSGA-II.
Table 5.
Percentage differences in the optimization indicators between ESS-NSGA-III, NSGA-III, and NSGA-II.
| Algorithm Comparison | Spread | Hypervolume (HV) | Inverted Generational Distance (IGD) |
|---|
| ESS-NSGA-III compared to NSGA-III | −8.15% | 0.77% | −3.66% |
| ESS-NSGA-III compared to NSGA-II | −12.89% | 4.12% | −5.79% |
Table 6.
Comparison between the evaluation index parameters optimized by the different algorithms for section D1–D2.
Table 6.
Comparison between the evaluation index parameters optimized by the different algorithms for section D1–D2.
| Algorithm | Energy Consumption (J) | Punctuality (s) | Comfort (m/s3) | Safety |
|---|
| ESS-NSGA-III | 1.3241 × 10⁴ | 0.1 | 0.0197 | 0.8201 |
| NSGA-III | 1.3325 × 10⁴ | 0.3 | 0.0201 | 0.8228 |
| NSGA-II | 1.3832 × 10⁴ | 0.4 | 0.0199 | 0.8251 |
Table 7.
Planned and delayed operational schedules for each section.
Table 7.
Planned and delayed operational schedules for each section.
| Section | Planned Operational Schedule (s) | Delayed Operational Schedule (s) |
|---|
| D1–D2 | 150 | 180 |
| D2–D3 | 210 | 240 |
| D3–D4 | 150 | 180 |
| D4–D5 | 180 | 210 |
| D5–D6 | 180 | 210 |
| D6–D7 | 150 | 180 |
| D7–D8 | 210 | 240 |
| D8–D9 | 150 | 180 |
Table 8.
Comparison of cumulative indicators across the three operational strategies in sections D1–D9.
Table 8.
Comparison of cumulative indicators across the three operational strategies in sections D1–D9.
| Strategy | Energy Consumption (J) | Running Time (s) | Comfort (m/s3) | Safety |
|---|
| Minimum running time strategy | 1.3793 × 10⁵ | 1193.5 | 0.216 | 8.000 |
| Punctual operation strategy | 9.7223 × 10⁴ | 1379.8 | 0.138 | 6.776 |
| Delayed operation strategy | 6.5027 × 10⁴ | 1619.8 | 0.112 | 5.810 |
| Disclaimer/Publisher’s Note: The statements, opinions and data contained in all publications are solely those of the individual author(s) and contributor(s) and not of MDPI and/or the editor(s). MDPI and/or the editor(s) disclaim responsibility for any injury to people or property resulting from any ideas, methods, instructions or products referred to in the content. |
© 2025 by the authors. Licensee MDPI, Basel, Switzerland. This article is an open access article distributed under the terms and conditions of the Creative Commons Attribution (CC BY) license (https://creativecommons.org/licenses/by/4.0/).

 ,
, 

