Article

An Intelligent Fault Diagnosis Model for Rolling Bearings Based on IGTO-Optimized VMD and LSTM Networks

School of Metallurgy and Energy Engineering, Kunming University of Science and Technology, Kunming 650093, China
*
Author to whom correspondence should be addressed.
Appl. Sci. 2025, 15(8), 4338; https://doi.org/10.3390/app15084338
Submission received: 6 March 2025 / Revised: 4 April 2025 / Accepted: 10 April 2025 / Published: 14 April 2025

Abstract

:
To address the issue of rolling bearing fault diagnosis, this paper proposes a novel model combining the Improved Gorilla Troop Optimization (IGTO) algorithm, Variational Mode Decomposition (VMD), Permutation Entropy (PE), and Long Short-Term Memory (LSTM) networks. The IGTO algorithm is used to optimize the parameters of VMD and LSTM, enhancing signal decomposition and feature extraction. The proposed model achieves fault classification accuracies of 96.67% and 98.96% in the testing and training phases, respectively, on the Case Western Reserve University dataset, with minimal accuracy fluctuations. Furthermore, on the Jiangnan University dataset, the model reaches an average testing accuracy of 98.85%, with the highest accuracy reaching 99.48%. The results also demonstrate high stability, as indicated by low standard deviations (1.2148 and 1.3217) and narrow 95% confidence intervals ([95.75%, 97.58%] and [96.73%, 97.49%]). Despite a longer average runtime of 13.88 s per sample, the model’s superior accuracy justifies the computational cost. These results demonstrate the model’s excellent diagnostic performance, adaptability to different datasets, and practical applicability for rolling bearing fault diagnosis. This approach provides a valuable reference for predictive maintenance and fault detection systems in industrial applications.

1. Introduction

Rolling bearings are a critical component in industrial machinery, as their operational state is closely linked to the overall performance and reliability of the equipment [1,2]. The health of these bearings directly impacts the efficiency, safety, and longevity of machinery, making their condition monitoring essential. Over time, bearings can develop faults due to wear, lubrication failure, or material defects, which can severely affect machinery operations if not detected early. To address this challenge, it is crucial to accurately extract fault characteristics from complex vibration signals generated by the bearings during operation [3]. These signals are typically non-stationary and contain a mixture of different fault features, influenced by factors such as load, speed, and temperature. Advanced signal processing methods are therefore needed to isolate meaningful patterns, enabling effective fault detection and diagnosis. Early identification of faults allows for timely maintenance, improving system reliability and reducing the risk of catastrophic failures [4].
Over time, bearings can develop faults due to wear, lubrication failure, or material defects, which can severely affect machinery operations if not detected early [5]. To address this challenge, it is crucial to accurately extract fault characteristics from complex vibration signals generated by the bearings during operation. These signals are typically non-stationary and contain a mixture of different fault features, influenced by factors such as load, speed, and temperature. Advanced signal processing methods are therefore needed to isolate meaningful patterns, enabling effective fault detection and diagnosis [6].
Significant advancements have been achieved in signal processing methodologies. Ma et al. [7] proposed the RIME-VMD method for rolling bearing fault diagnosis, optimizing VMD using the RIME algorithm. This method improves feature extraction and achieves efficient fault detection by utilizing Support Vector Machine (SVM), resulting in faster search times and higher efficiency. Zhou et al. [8] introduced the Whale Gray Wolf Optimization Algorithm (WGWOA)-VMD-SVM method, which combines Whale Optimization and Gray Wolf Optimization to optimize both VMD and SVM, achieving 100% fault detection accuracy. Wang et al. [9] also proposed the Sparrow Search Algorithm (SSA)-VMD method for rolling bearing fault diagnosis, optimizing VMD parameters using the SSA and integrating it with SVM for classification. Wang et al. [10] developed the Optimized Grass-hopper Optimization Algorithm (OEGOA)-VMD algorithm for early fault detection in cryogenic rolling bearings, combining OEGOA with VMD to optimize parameter extraction and avoid local optima in fault feature extraction. Zhang et al. [11] presented a fault diagnosis method using (bat algorithm)BAS-optimized VMD and Composite impact index (CS)-SVM, which was verified with both simulation and real bearing data, demonstrating its effectiveness. Wu et al. [12] proposed a fault diagnosis method using Marine Predator Algorithm (MPA)-optimized VMD, employing the Squared Envelope Gini Index (SEGI) to identify the best IMF for fault feature extraction, with experimental results showing superior accuracy and robustness compared to kurtosis and correlation coefficient indicators. However, the methods mentioned above often rely on optimization algorithms, which result in high computational complexity [13], sensitivity to noise [14], dependence on parameter selection [15], limited generalizability [16], and increased model complexity [17], thereby posing challenges to real-time implementation and practical applications.
Wang et al. [18] proposed a fault diagnosis method based on a Multi-channel Residual Attention Network with Efficient Channel Attention (ECA-MRANet), where the original time–domain signal is processed through multi-domain transforms and features are extracted using MRANet. These features are then fused by ECA for fault identification. Chen et al. [19] introduced the ISCV-ViT method for rolling bearing fault diagnosis, utilizing motor current signals (MCS) and the Vision Transformer (ViT) model. This method processes the MCS using an instantaneous square current value (ISCV)-based signal processing technique to convert the signal into time–domain images, which are then used for fault diagnosis with the ViT model. Zhou et al. [20] proposed a fault diagnosis method based on a deep residual network combined with transfer learning (ResNet-TL), where one-dimensional vibration signal data are preprocessed into image data and the ResNet34 network is trained using transfer learning. Experimental results with datasets from both a practical test bench and Case Western Reserve University demonstrate that the ResNet34-TL model outperforms other classification models in fault diagnosis. Liang et al. [21] proposed a rolling bearing fault diagnosis method combining VMD and Artificial Neural Networks (ANN), achieving high prediction accuracy with reduced computation time. The method demonstrated an average prediction accuracy of 99.3% with a computation time of only 2.4 s, outperforming other machine learning and deep learning algorithms. Zhang et al. [22] introduced an intelligent fault diagnosis method for rolling bearings, using a one-dimensional multi-scale residual convolutional neural network (1D-MRCNN) for feature extraction and fault-type identification. Both simulation and experimental results show that the method accurately diagnoses various fault types, even under different noise levels. Yin et al. [1] proposed a multi-scale rolling bearing fault diagnosis method based on transfer learning. Experimental results with datasets from Case Western Reserve University and Jiangnan University indicate that this method achieves high diagnostic accuracy.
The methods mentioned above have several common limitations, including reliance on complex models and optimization algorithms, which result in high computational complexity. Some methods also require careful parameter tuning and data preprocessing, which can lead to long model training times [
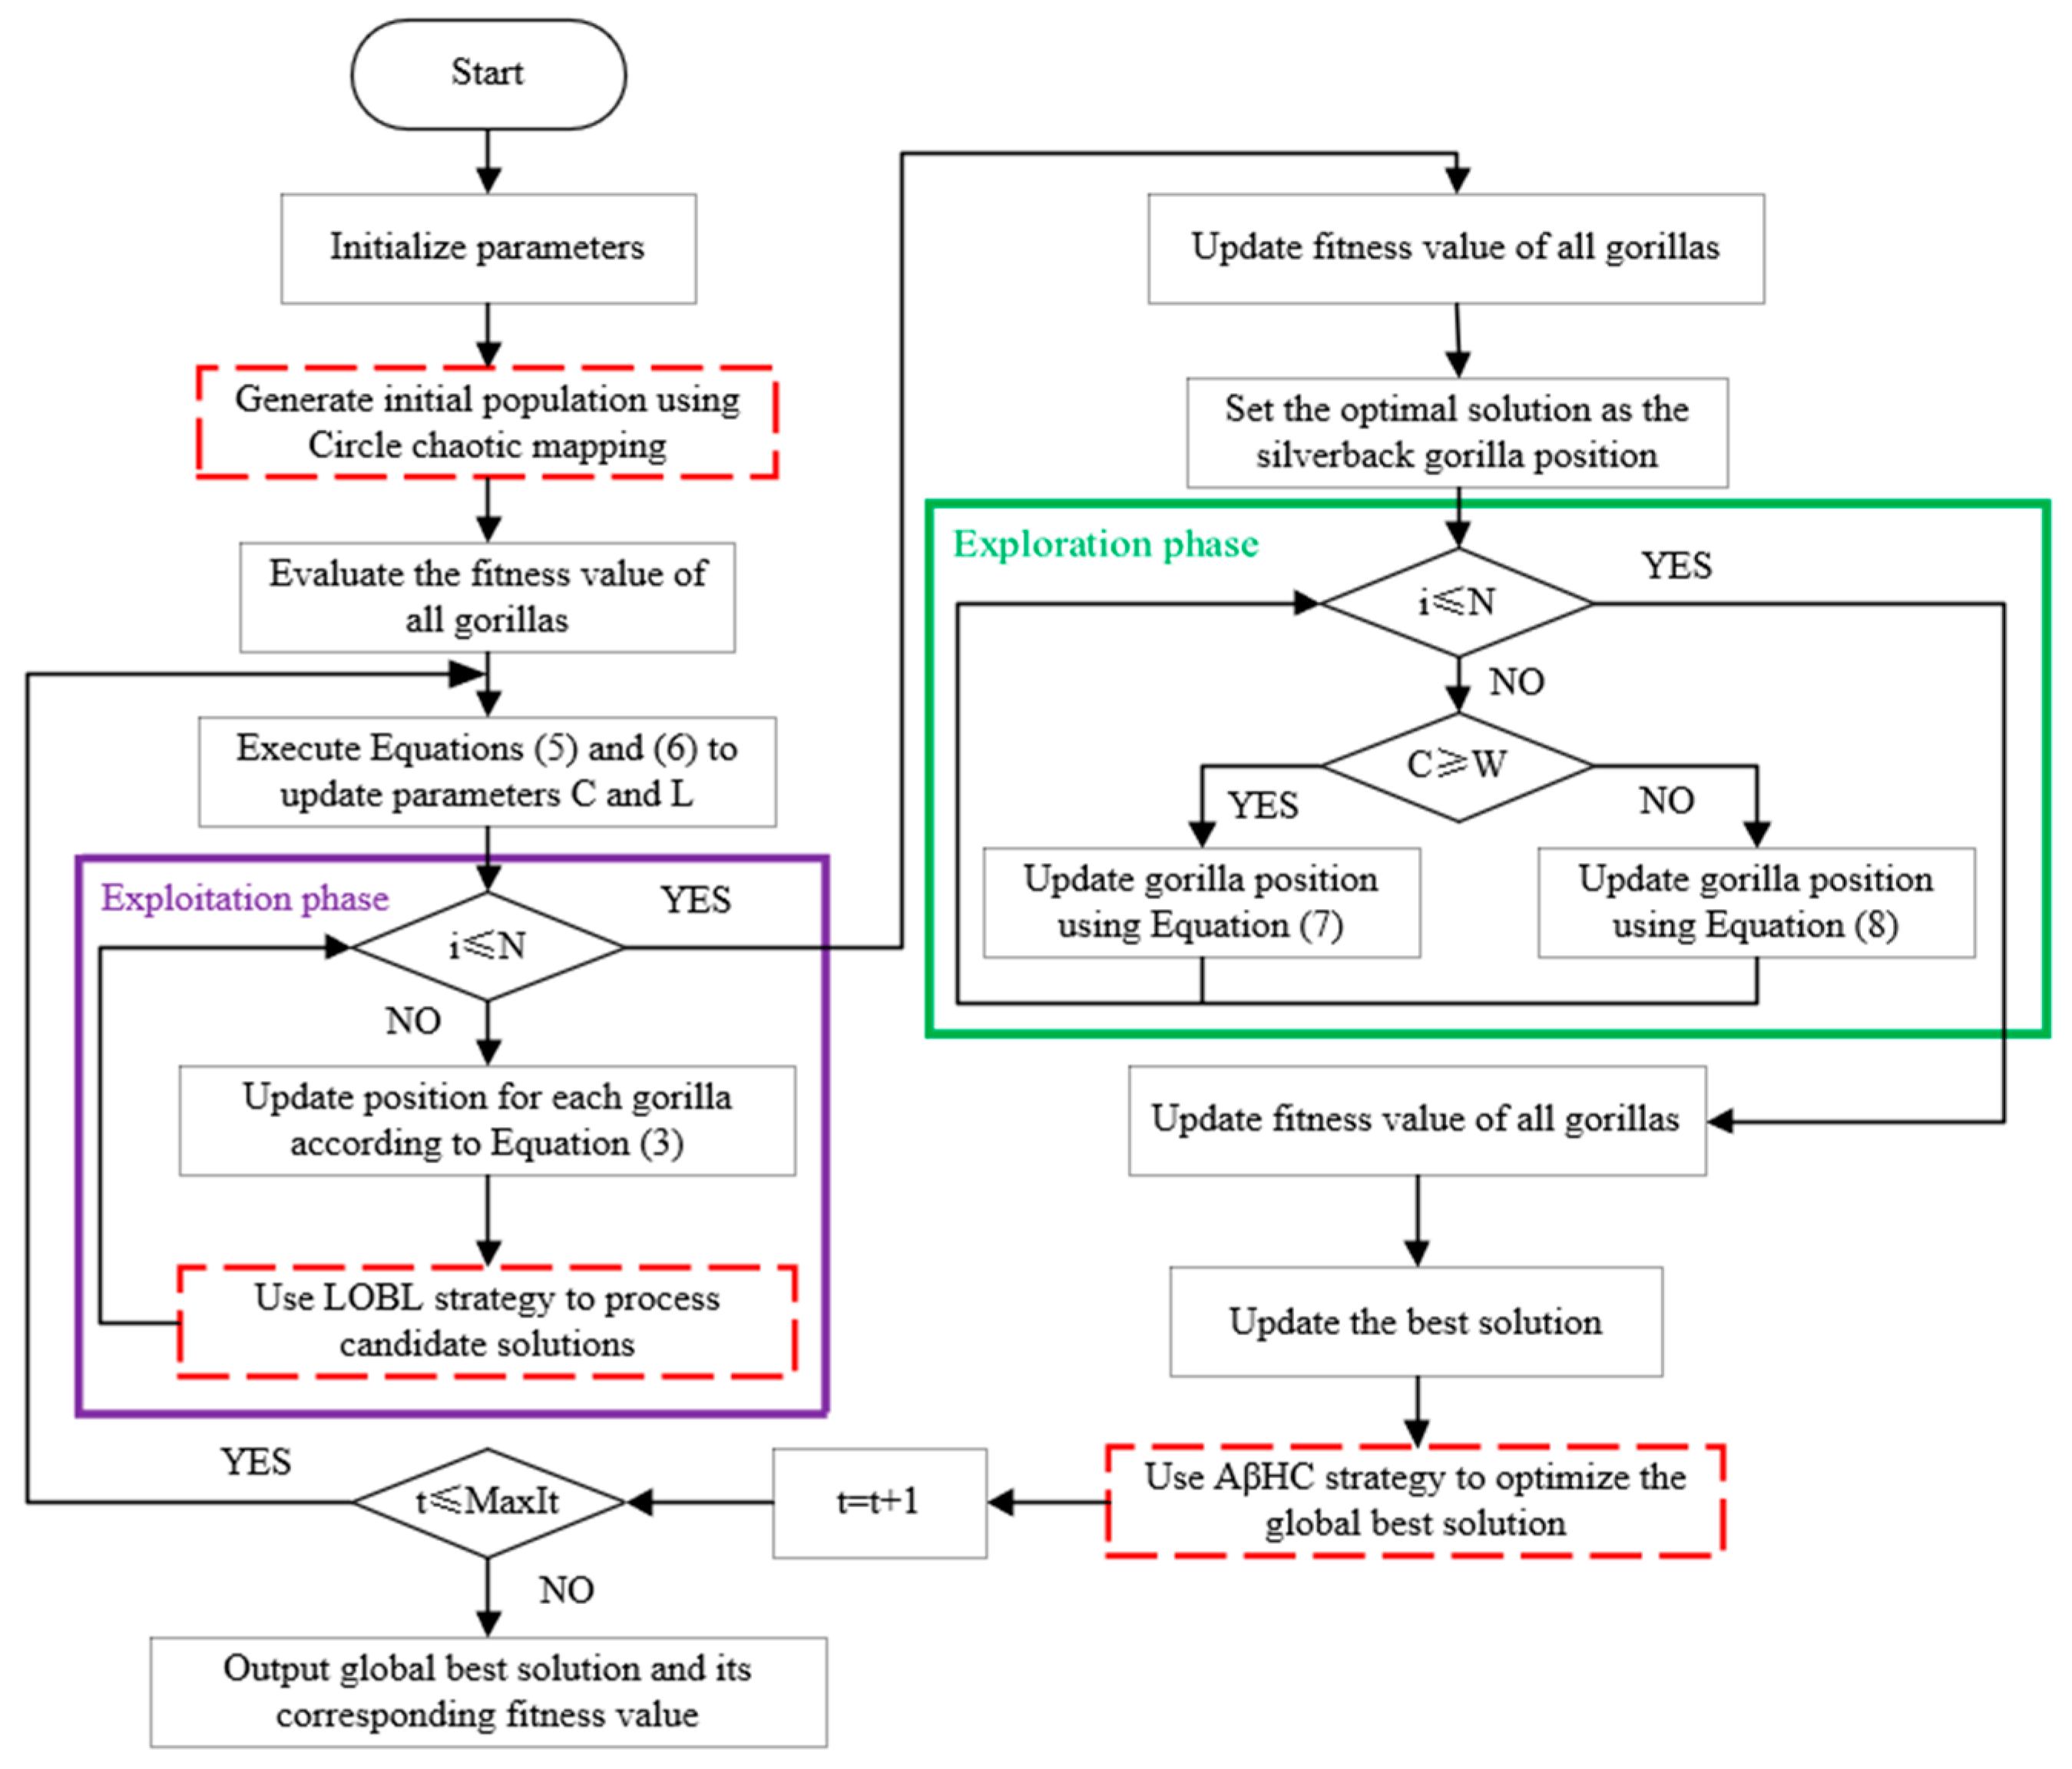
23]. Furthermore, the generalizability and adaptability of certain methods may be limited by the specific datasets and fault types considered. To address the limitations of traditional methods, such as high computational complexity, sensitivity to noise, and dependence on parameter tuning, this paper proposes an IGTO to enhance the performance of VMD and LSTM in signal processing. The method introduces Circle chaotic mapping to increase population diversity, utilizes Lens-based Opposite Learning (LOBL) to optimize local search capabilities, and incorporates an Adaptive β Hill Climbing (AβHC) mechanism to improve global search efficiency. These improvements overcome the tendency of traditional GTO to get trapped in local optima when dealing with high-dimensional and complex optimization problems.
VMD, as an efficient signal processing method, is particularly suitable for the analysis of non-stationary signals. It avoids the problem of mode mixing and provides clearer modal separation, demonstrating strong signal analysis and processing capabilities [24,25,26]. LSTM, by introducing gating mechanisms, successfully addresses the vanishing gradient problem in traditional recurrent neural networks (RNNs) when handling long-term dependencies. It selectively remembers and forgets information, maintains essential long-term dependencies, and exhibits strong adaptive learning capabilities, a stable training process, and efficient parallel computation, making it particularly suitable for analyzing complex sequential signals [27,28]. PE is computationally simple and efficiently measures the complexity of time series, exhibiting strong noise robustness and suitability for nonlinear and non-stationary signals, with superior computational efficiency in real-time applications [29,30]. To further improve model performance, IGTO is applied to optimize the key parameters of VMD and LSTM, achieving adaptive parameter selection. Finally, by combining the advantages of VMD, PE, and LSTM, the IGTO-VMD-PE-IGTO-LSTM fault diagnosis model is proposed. The model is validated on the SKF6205-2RSJEM bearing vibration signal and Jiangnan University rolling bearing vibration signal datasets. The results show that the proposed method exhibits higher accuracy, a smaller error range, and better diagnostic stability, verifying the model’s suitability for fault diagnosis in complex signals.
To provide the reader with an overview, the structure of the paper is as follows: Section 1 introduces the motivation for the study and the key contributions of the paper. Section 2 presents the basic theory, including variational mode decomposition, the improved gorilla troops optimizer, and other relevant methods. Section 3 focuses on the construction of the fault diagnosis model, covering optimization principles, feature extraction methods, and fault classification techniques. In Section 4, the analysis and verification of rolling bearing faults are presented, with a selection of test data and additional validation experiments. Finally, Section 5 provides conclusions and outlines future work.

2. Basic Theory

2.1. Variational Mode Decomposition

VMD is an effective method for processing non-stationary time series. Its core concept is to iteratively extract each mode’s center frequency and bandwidth within a variational framework, minimizing the total bandwidth of all modes to achieve signal decomposition.
The decomposition steps are as follows [31]:
Convert the k-th mode component m k   ( t ) into an analytic signal using the Hilbert transform to obtain its unilateral spectrum.
Modulate the analytic signal to the corresponding center frequency ω k , confining it to the fundamental frequency band.
Estimate the bandwidth of m k   ( t ) by calculating the gradient squared L 2 -norm of the demodulated signal.
The constrained variational problem of modal components is described as follows:
min { u k } , { ω k } { | |   t [ ( δ   ( t ) + j π t ) u k   ( t ) ] e j ω k t | | 2 2 } s . t . k = 1 K   m k   ( t ) = x   ( t ) , k = 1,2 , , K
To solve this, a quadratic penalty term and Lagrange multiplier are introduced to suppress Gaussian noise and ensure reconstruction accuracy. The problem is reformulated into an augmented variational problem:
L   ( m k , ω k , β ) = α k   | | t [   ( δ   ( t ) + j / π t ) m k   ( t ) ] e j ω k t 2 2 + | | f t k   m k t 2 2 + β t , f t k   m k t
where α is the penalty parameter.
The solution is achieved iteratively through the alternating direction multiplier method (ADMM), with iterations stopping when
k m k n + 1 m k n 2 2 < ε
where n is the number of iterations; ε is solution accuracy.

2.2. The Improved Gorilla Troops Optimizer

2.2.1. The Gorilla Troops Optimizer Algorithm

By emulating the leading and following behaviors observed in gorillas, the GTO algorithm can effectively explore and exploit multidimensional spaces. This approach is particularly well-suited for addressing high-dimensional and multi-modal problems, offering advantages such as a streamlined structure and robust adaptability.
In the Exploration Phase of the GTO, three behavior-based mechanisms, which are derived from the social patterns observed in gorillas, are utilized: migration to unfamiliar territories, migration to familiar territories, and movement towards other gorillas. These mechanisms function collaboratively to optimize the balance between global and local search capabilities.
Migration to Unknown Regions (with probability p)
The process of migrating to an unknown region emulates the exploratory behavior of group members by randomly generating novel solutions. This mechanism predominantly utilizes the probability p to ascertain the occurrence of migration. Specifically, if a randomly generated number, denoted as rand, is less than p, migration to a new position is executed. The mathematical formulation is as follows:
G X t + 1 = U B L B × r 1 + L B ,   i f   r a n d < p
where G X   ( t + 1 ) is the candidate position vector in the next iteration; r 1 is a random number between [0, 1]; U B ,   L B represent the upper and lower bounds; p controls the probability of the exploration behavior; r a n d is a random number between [0, 1].
Movement Towards Other Gorillas (if rand ≥ 0.5)
This mechanism simulates the interactions among gorillas within the troop. It enhances local search capabilities by randomly selecting the position of another gorilla and moving towards it. The mathematical formula is presented as follows:
G X t + 1 = r 2 C × X r t + L × H
where X r   ( t ) is the position of a randomly selected gorilla at the t-th iteration; L is the leadership factor, calculated as L = C × l , where l is a random number between [−1, 1]; H is a random direction disturbance term, defined as H = Z × X   ( t ) , where Z is a random perturbation term within the range of [−C, C] used to introduce random disturbances in the solution space, and C is a dynamic coefficient, controlling the precision of the search. It is computed as C = F × 1 I t / M a x I t , where F = cos   ( 2 × r 4 ) + 1 ; r 2 is a random number between [0, 1], controlling the intensity of the movement.
Migration Towards Known Regions (if rand < 0.5)
This behavior simulates that the members of the population adjust the search direction based on the historical optimal solution in order to avoid repeatedly searching the same region in the solution space, through this mechanism, the algorithm is able to improve the efficiency of the search and to avoid excessive concentration on the local region. The mathematical formula is presented as follows:
G X t + 1 = X   ( t ) L × ( L × X t G X r t + r 3 × X t G X r t )
where X   ( t ) is the current position of the gorilla at the t-th iteration; G X r is a randomly selected historical optimal solution; r 3 is a random number between [0, 1].
The Exploitation Phase encompasses two principal behaviors: the following of the silverback and competition among adult males. The objective of this phase is to further refine local solutions and improve local search capabilities by emulating the dynamics of leadership following and male competition within the gorilla group.
Following the Silverback (if C ≥ W)
In the GTO, the behavior of following the silverback is modeled by other gorilla members converging towards the silverback’s position for refined local search. The mathematical implementation of this behavior is as follows:
G X   ( t + 1 ) = L × M × X   ( t ) X s i l v e r b a c k + X   ( t )
where X s i l v e r b a c k is the position of the silverback gorilla; L is the leadership factor; M is the average position of the group, calculated as
M = 1 N i = 1 N G X i   ( t ) g 1 g
where N is the total population of gorillas; G X i   ( t ) is the position of the i-th gorilla at the t -th iteration; g = 2 L controls the influence of the average position.
Adult Male Competition (if C < W)
In this phase, the competition among adult male gorillas simulates the struggle for resources, including female gorillas, within the group. This competitive mechanism introduces random perturbations, which enhance the diversity of the solution space and facilitate the algorithm’s ability to escape from local optima. The mathematical representation of this behavior is as follows:
G X   ( t + 1 ) = X s i l v e r b a c k Q × ( X t Q × A ) × X t
where Q is the competition factor, which simulates the intensity of the competition, calculated as Q = 2 × r 5 1 (where r 5 is a random number); A is the aggressiveness factor, computed as A = β × E , with β being a fixed parameter (typically set to 3); E represents the random disturbance term, which can follow either a normal or uniform distribution depending on a random decision. The disturbance is modeled as
E = { Normal   random   number i f   r a n d 0.5 Uniform   random   number i f   r a n d < 0.5
Following the Exploitation Phase, the GTO algorithm identifies the optimal solution through group formation operations. If a candidate solution, denoted as G X   ( t ) , demonstrates superior fitness compared to the current solution, X   ( t ) , the latter is replaced by G X   ( t ) . Ultimately, after numerous iterations, the most effective solution within the population is regarded as the solution represented by the silverback gorilla, which is considered the global optimal solution.

2.2.2. Improved Artificial Gorilla Troop Algorithm

Although the GTO algorithm presents several advantages in the context of global optimization problems, it also reveals significant limitations when tackling complex optimization tasks. Initially, the population in GTO is generated randomly, resulting in reduced diversity within the early population. Secondly, the exploration phase in GTO is predominantly dependent on random migration. Lastly, the application of GTO to high-dimensional and complex problems is often hindered by premature convergence. In order to address these deficiencies, the following enhancements are proposed for the GTO:
Initialization of the Circle Chaotic Mapping
In GTO, the initial population is generated through a random search process, which often results in a population that inadequately represents the solution space, consequently constraining the algorithm’s exploratory capabilities. The traversal characteristics of Chaotic Mapping facilitate a more extensive coverage of the solution space, thereby improving the diversity of the initial population. Among the various chaotic mapping techniques, Circle Chaotic Mapping has been selected as the enhancement method in this study due to its superior exploratory performance. Research has demonstrated that Circle Chaotic Mapping surpasses both Logistic and Tent chaotic mappings in terms of exploration efficacy [32]. The mathematical representation of Circle Chaotic Mapping is as follows:
z k + 1 = z k + b a 2 π sin   ( 2 π z k ) m o d   ( 1 ) , z k   ( 0,1 )
where z k is the value at the current step; z k + 1 is the value at the next step; a = 0.5 , b = 0.2 are constants defining the chaotic behavior.
In the study, both random search and Circle Chaotic Mapping were independently executed 300 times in a two-dimensional space to compare their initialization effects. The results are shown in Figure 1 below.
Figure 1 illustrates that the traversal of Circle Chaotic Mapping exhibits a more extensive and uniform distribution within the feasible domain of [0, 1]. In comparison to random search methods, Circle Chaotic Mapping encompasses a larger segment of the solution space and achieves a more equitable distribution.
LOBL Partial Solution Update
LOBL integrates the conventional Opposition-Based Learning (OBL) methodology with the principles of convex lens imaging [33]. The fundamental concept of LOBL involves the simultaneous computation and comparison of candidate solutions alongside their corresponding inverse solutions, subsequently selecting the superior solution for the next iteration. Consequently, in this study, LOBL is employed during the exploration phase to broaden the search range and assist the algorithm in escaping from local optima.
The phenomenon known as OBL pertains to the formation of a reduced, inverted image of an object when the object is positioned at a distance greater than twice the focal length from the lens. Utilizing the principles of lens imaging and the properties of similar triangles, the following geometric relationship can be derived:
  ( l b + u b ) 2 G X = G X ( l b + u b ) 2 = h / h
Utilizing the aforementioned formula, let the ratio factor be denoted as n = h / h . The inverse solution G X can be computed as follows:
G X = l b + u b 2 + l b + u b 2 n G X n
The OBL strategy represents a specific instance of the LOBL approach. In contrast to OBL, LOBL possesses the capability to dynamically modify the inverse solution by altering the ratio factor n, thereby providing an expanded search range. Algorithm optimization is generally conducted within multi-dimensional spaces; consequently, we extend LOBL to a D-dimensional framework. For each dimension j (where j = 1, 2, …, D), the inverse solution G X j is computed as follows:
G X j = l b j + u b j 2 + l b j + u b j 2 n G X j n
where l b j and u b j is the lower and upper bounds of the j-th dimension; G X j is the current candidate solution for the j-th dimension; G X j is the inverse solution for the j-th dimension.
In the process of generating a new inverse solution, it is essential to evaluate the fitness values of both the inverse solution and the candidate solutions. The solution exhibiting the higher fitness value is subsequently chosen for the optimization process outlined below:
G X n e x t = G X , if   F   ( G X ) < F   ( G X ) G X ,   o t h e r w i s e
where G X n e x t is the selected solution; F   ( ) is the fitness function of the problem.
In the exploration phase of GTO, the LOBL mechanism enhances the algorithm by updating inverse solutions. This approach effectively mitigates the risk of the algorithm becoming ensnared in local optima, thereby improving the precision of local exploitation.
AβHC Global Solution Update
In the context of GTO, the exploitation phase frequently encounters challenges when addressing high-dimensional and complex optimization problems, often resulting in suboptimal solutions. To mitigate this issue, AβHC has been integrated into the GTO framework, facilitating a transition between global and local search strategies. During the initial phases of the search, a larger step size is employed to swiftly navigate the solution space and identify promising high-quality solutions. Conversely, in the later stages, the dynamic modification of the β value serves to avert premature convergence within a localized region, thereby ensuring both the quality of the solution and the thoroughness of the optimization process [34].
AβHC conducts local search utilizing two control operations: the N-operator and the β-operator. The corresponding mathematical models are delineated as follows:
The N-operator generates neighborhood solutions:
X i = ( x i 1 , x i 2 , , x i D )
where x i j is the j-th dimension of the solution generated through perturbation.
The β-operator dynamically adjusts the step size:
β   ( t ) = β m i n + ( β m a x β m i n ) × t M a x I t e r
where β m i n , β m a x is the minimum and maximum step size values, respectively; t is the current iteration number; M a x I t e r is the maximum number of iterations.
Compared to conventional solution update mechanisms, AβHC mitigates early convergence and improves the convergence speed of GTO, thereby facilitating a more rapid attainment of optimal or near-optimal solutions.
Summary
In summary, the IGTO is developed by incorporating Circle Chaotic Mapping, LOBL, and AβHC as the fundamental mechanisms for initialization, local solution updates, and global solution updates, respectively. The integration of these enhancement mechanisms is designed to improve the adaptability and robustness of IGTO in addressing multimodal, high-dimensional, and complex optimization problems. The implementation process is illustrated in Figure 2 below.

2.3. IGTO Performance Evaluation

Five algorithms—Grey Wolf Optimization [35] (GWO), Particle Swarm Optimization [36] (PSO), GTO [37], IGTO, and Chernobyl Disaster Optimizer [38] (CDO)—were evaluated using single-modal, multi-modal, and unconstrained optimization functions to assess the performance of IGTO in terms of convergence rate, problem-solving capability, and stability. The details of the test functions, including their dimensions, search scope, and theoretical minimum values, are presented in Table 1, while the convergence curves are illustrated in Figure 3.
As illustrated in Figure 3 above, among the five test functions evaluated, the IGTO algorithm achieves a relatively modest fitness value within the initial 400 iterations. For instance, in the F8 test function, approximately 100 iterations are required to approach the optimal fitness value, whereas other algorithms do not demonstrate a significant reduction in fitness values. The final fitness value attained by the IGTO algorithm is considerably lower than those of the comparative algorithms, with the F5 and F4 test functions achieving reductions to 10−300 and 10−200, respectively, thereby indicating its superior problem-solving capability. Furthermore, the convergence curves of the IGTO algorithm across the test functions exhibit a high degree of smoothness, with minimal fluctuations observed in the F3 test function, which underscores its stability. In conclusion, the IGTO algorithm demonstrates rapid convergence, robust problem-solving abilities, and consistent results in high-dimensional complex optimization scenarios. It is also well-suited for diagnosing rolling bearing faults, which necessitate high levels of real-time optimization and result stability.
To better illustrate the optimization performance of IGTO, two metrics—average fitness value (Avg) and standard deviation (Std)—are employed to evaluate the proposed algorithm. The average fitness value intuitively reflects the convergence accuracy and search capability of the algorithm, while the standard deviation indicates the degree of deviation between experimental results and the average value. The optimization results of different algorithms on the benchmark test functions are presented in Table 2 as follows.
As shown in Table 2, IGTO stands out among various optimization algorithms due to its superior stability and precision. Compared with other algorithms, IGTO consistently achieves the theoretical minimum, whereas others still exhibit considerable errors across multiple functions. This highlights IGTO’s remarkable advantage in high-precision optimization tasks. Furthermore, IGTO maintains extremely low fluctuations during the optimization process and delivers consistent and reliable performance across multiple runs, demonstrating strong potential when addressing complex optimization problems.
For instance, in functions F5 and F10, IGTO not only maintains efficient optimization but also achieves optimal numerical precision, ensuring high accuracy and consistency in the results. Therefore, in practical applications—especially those requiring high precision and stability—IGTO proves to be an ideal algorithm, owing to its accuracy, robustness, and sustained optimization capability.

2.4. Permutation Entropy

The PE quantifies uncertainty by examining the arrangement patterns of data and analyzing the complexity inherent in time series data [39]. This approach aligns with the research objectives outlined in this paper. Consequently, PE has been selected as the characteristic value following the processing of vibration signals from rolling bearings.
First, the phase space reconstruction of the time series X   ( i ) , i = 1,2 , , n of length N is carried out to obtain the following matrix:
x   ( 1 ) x   ( 1 + τ ) x   ( 1 + ( m 1 ) τ ) x   ( j ) x   ( j + τ ) x   ( j + ( m 1 ) τ ) x   ( K ) x   ( K + τ ) x   ( K + ( m 1 ) τ ) j = 1,2 , , K
where m is embedding dimension; τ is delay time.
Then, the reconstructed components of each row are arranged in ascending order to obtain the symbol sequence of the position index:
S l = j 1 , j 2 , , j m , l = 1,2 , , k ,   and   k m !
Finally, the probability P g of the symbol sequence is calculated, and the PE of time series X is:
H p e = g = 1 m !   P g log P g
The PE value serves as an indicator of the randomness and complexity inherent in a time series, where lower values signify greater regularity, and higher values denote increased randomness. This methodology allows for the extraction of intricate features from vibration signals, which are essential inputs for the fault diagnosis model.

2.5. Long Short-Term Memory Network

The fundamental concept of LSTM networks is to regulate the flow of information through the implementation of a gating mechanism, which is essential for capturing long-range dependencies in time series data [40]. The primary components of LSTM include the cell state C t , the hidden state h t , and three gating structures that govern the flow of information. At each time step, the LSTM updates both the cell state and the hidden state through a series of defined steps.
Firstly, the sigmoid function computes the forgetting gate, mapping the output to the interval [0, 1], thereby facilitating the retention or abandonment of historical information. The formula is presented as follows:
f t = σ W f h t 1 , x t + b f
where x t is the weight matrix; h t 1 is the hidden state of the previous time step; W f , b f is the weight and bias of the forgetting gate.
The input gate i t controls the update of the new information, and the candidate cell state C ~ t calculated by the tanh activation function is then provided with the candidate value of the new information:
i t = σ W t h t 1 , x t + b i
C ~ t = tanh W c h t 1 , x t + b c
After completing the above steps, the cell status is updated through the forgetting gate f t and the input gate i t :
C t = f t C t 1 + i t C ~ t
where f t C t 1 is retained old memory; i t C ~ t is newer memory.
Finally, through the contribution of the output gate O t to output hidden state information, the information transmitted from cell state to hidden state is determined:
O t = σ W o h t 1 , X t + b o
h t = O t tanh C t
Due to its robust capability for capturing long-term dependencies and its efficient processing of sequential data, LSTM networks are adept at extracting critical information from time series data and diagnosing fault modes in fault diagnosis applications, even in the presence of extended data lengths or noise.

3. Construction of Fault Diagnosis Model

3.1. Optimization Principle

Following the VMD, it is imperative that the essential information of the original vibration signal from the rolling bearing is preserved, and that the decomposed signal accurately represents its intrinsic characteristics. Failure to achieve this renders the decomposition process ineffective. The criteria for successful decomposition are twofold: (1) the decomposed signal must retain a substantial amount of the information contained in the original signal and (2) the fault characteristics should be more pronounced post-decomposition. Consequently, this study employs envelope entropy as a metric to quantify the effectiveness of the decomposition in accordance with these established criteria.
To compute the envelope entropy, one must first derive the envelope of the signal using the Hilbert transform. Let the input signal be denoted as x   ( t ) , and the envelope e n v   ( t ) can be determined through the following steps:
Firstly, the analytic signal x ^   ( t ) is derived by applying the Hilbert transform to x   ( t ) :
x ^ t = x t + j H x t
Subsequently, the envelope e n v   ( t ) of the signal is computed:
e n v t = x ^ t = x t 2 + H x t 2
To calculate the entropy value, the signal envelope is normalized to align with the characteristics of a probability distribution. The resulting normalized probability distribution, denoted as p   ( t ) , is as follows:
p t = e n v t i = 1 N e n v t
The envelope entropy is ultimately computed using the normalized envelope described above, and its expression is presented as follows:
H = i = 1 N p i log p i
Envelope entropy serves as a metric for assessing the complexity of a signal, where elevated entropy values signify increased complexity, and diminished entropy values correspond to simpler modulation patterns. Employing minimum envelope entropy as the optimization criterion for VMD guarantees the preservation of fundamental signal characteristics while yielding decomposed modes that are both concise and interpretable.
In the context of optimizing LSTM networks, the minimum fitness value, denoted as F i t n e s s = 1 A c c u r a c y , serves as the objective function. By minimizing this fitness value, one directly maximizes the accuracy of the model, thereby improving the accuracy of classification diagnoses.

3.2. Fault Feature Extraction Method

In VMD, the penalty factor α serves as a crucial parameter that influences the bandwidth of each IMF. Vibration signals from rolling bearings generally encompass both harmonic and pulse components. Harmonic signals necessitate a larger α due to their narrow frequency bandwidth, whereas fault pulse signals require a smaller α to adequately capture their broader bandwidth. Conventional methods are often inadequate in simultaneously extracting both harmonic and fault pulse characteristics effectively.
To address this issue, the IGTO is utilized, with the minimization of envelope entropy serving as the optimization objective to ascertain the optimal values of α and K for VMD. Following the decomposition, the PE value of each IMF is computed to characterize the fault frequency features of the vibration signal. The process of fault feature extraction using IGTO-VMD-PE is depicted in the accompanying Figure 4.

3.3. Fault Classification and Diagnosis Method

In order to develop a model for the classification and diagnosis of rolling bearing faults, this study utilizes the IGTO algorithm to optimize the parameters of the LSTM network. The parameters optimized include the number of neurons, maximum iterations, learning rate, and regularization parameters. Subsequently, these optimized parameters are employed to construct the LSTM model. The detailed methodology of the IGTO-LSTM model is depicted in the accompanying Figure 5.
In summary, the IGTO method is employed to optimize parameters for the decomposition of vibration signals and the classification of diagnostics, resulting in optimal configurations. The proposed IGTO-VMD-PE-IGTO-LSTM model effectively addresses the nonlinear and non-stationary characteristics of vibration signals, demonstrating adaptability to various working environments and complex fault types.

4. Analysis and Verification of Rolling Bearing Fault Diagnosis Tests

4.1. Selection of Test Data

The experimental data utilized in this study comprises the vibration signals from rolling bearings obtained from Case Western Reserve University [41] (https://engineering.case.edu/bearingdatacenter) (accessed on 9 April 2025), specifically focusing on the drive-end data of the deep groove ball bearing model SKF6205-2RSJEM. Single-point faults were introduced into the test bearings through the application of electrical discharge machining, thereby simulating four distinct operational states of the rolling bearings. The primary objective of this experiment is to evaluate the efficacy of the IGTO method in optimizing VMD.
The experimental data pertains to a rotational speed of 1772 revolutions per minute (r/min) with a sampling frequency of 12 kilohertz (kHz) under zero-load normal operating conditions. The dataset encompasses both normal and fault states, with a fault diameter of 0.5334 mm affecting the inner race, outer race, and rolling elements. The four operational states are categorized as follows: normal state (L0), outer race fault (L1), inner race fault (L2), and rolling element fault (L3).

4.2. Analysis of the Experimental Process and Results

In this study, we used a test dataset consisting of 2048 sampling points collected under normal operating conditions. Based on the parameter selection from the literature, we set K to 4 and α to 2000, and the reasonableness of this parameter choice was verified through preliminary experiments [42]. Similarly, in the calculation of PE, we also need to determine the embedding dimension (m) and the delay time (τ), which were set to 6 and 1, respectively, based on parameters derived from the literature [43]. The following Figure 6 displays the original vibration signal of the rolling bearing and the results of its VMD are displayed in Figure 7.
Subsequently, all vibration signals from the rolling bearings were processed, encompassing 480 sets of data corresponding to various fault types (L0 to L3). Given the substantial volume of data, this paper presents only a selection of these results. Five random samples from each operational type were chosen, and the PE values were calculated and documented in the accompanying Table 3.
The parameters of the penalty factor α and the decomposition mode number K were optimized for VMD using the IGTO method. The envelope entropy corresponding to various parameter configurations was calculated. The values of α and K were determined based on the principle of minimizing envelope entropy. The IGTO-VMD was performed on the same dataset as previously mentioned; the initial IGTO population was set to 32, and the maximum number of iterations was established at 20 [33]. The search range for K was defined as [3, 15], while the search range for α was set between [200, 2000]. The minimum envelope entropy served as the fitness function to identify the optimal parameters for VMD. The relationship between the iterations of IGTO and the envelope entropy is illustrated in the accompanying Figure 8.
The figure illustrates that the minimum envelope entropy of 3.20422 is attained during the 16th iteration. The corresponding values for K and α are [299, 7]. Subsequently, these optimal parameters are employed to decompose the vibration signal using VMD, resulting in the decomposition of each IMF component, as depicted in Figure 9 below.
Subsequently, the PE values of the IMFs were derived through the IGTO-VMD applied to four distinct types of sample signals, as illustrated in the accompanying table. Similarly, five random samples from each category of work were selected, and the corresponding PE values were calculated and presented in Table 4.

4.3. Comparison Test of Diagnostic Models

The effectiveness of the proposed model is evaluated by comparing it with several currently prevalent fault diagnosis models, which include the following: VMD-PE-LSTM, VMD-PE-IGTO-LSTM, GTO-VMD-PE-LSTM, IGTO-VMD-PE-LSTM, IGTO-VMD-PE-PE-PSO-LSTM, IGTO-VMD-PE-PSO-LSTM, IGTO-VMD-PE-GWO-LSTM, IGTO-VMD-PE-CDO-LSTM, and IGTO-VMD-PE-GTO-LSTM. Each sample comprised 2048 data points across 480 datasets representing various operational states; 384 datasets were randomly selected for training, while the remaining 96 datasets were utilized for testing.
Based on empirical observations from previous studies and preliminary experiments, the hyperparameters for the LSTM model were set as follows: 300 neurons, a maximum of 100 iterations, a learning rate of 0.0001, and a regularization parameter of 0.01. These values were chosen after reviewing similar approaches in the literature and verifying their effectiveness through initial tests [44]. To mitigate the randomness inherent in intelligent algorithms and neural networks, each model is subjected to testing 10 times using randomly selected training samples. For all comparative models employing intelligent algorithms, the parameter optimization settings are aligned with those of the IGTO-VMD-PE-IGTO-LSTM model. These settings encompass a population size of 32, 20 iterations, and search ranges for hidden units of [50, 500], maximum iterations of [100, 2000], learning rates of [0.0001, 0.01], and L2 regularization values of [0.001, 0.1]. Performance evaluation is conducted using average accuracy and deviation ranges, in accordance with the proposed model. The results are presented in the form of a comparison table as shown in Table 5, a box plot as shown in Figure 10, and an average confusion matrix as shown in Figure 11, illustrating the diagnostic outcomes from 10 repeated experiments across various fault diagnosis models.
The data presented in Table 5 indicate that Model 3 achieved a test accuracy that is 4.17% higher than that of Model 1, thereby demonstrating that the application of intelligent algorithms significantly enhances the performance of VMD in signal decomposition and fault diagnosis. Furthermore, the comparison between Models 2 and 9 supports this assertion. When comparing Model 3 to Model 4, it is evident that the parameters optimized by the IGTO method yield a higher diagnostic accuracy of 91.98% and a narrower deviation range of [−2.40, 1.77] compared to those optimized by the GTO method. This finding further substantiates the superiority of IGTO in optimization tasks. Additionally, this conclusion is corroborated by the comparison between Models 7 and 9.
Model 9 demonstrated superior performance in rolling bearing fault diagnosis compared to models 5, 6, 7, and 8, achieving the highest accuracy rates of 98.44% during training and 96.67% during testing. In contrast, model 8, which exhibited the second-highest accuracy with 97.03% in training and 95.00% in testing, underscores the advantages of employing IGTO twice for parameter optimization. This approach allowed model 9 to exceed the performance of both GTO and other algorithms.
In order to better evaluate the performance of the models, the standard deviation and 95% confidence intervals of their diagnostic accuracies for each model in the testing phase were calculated and the key parameters are listed in Table 6 below.
Based on the experimental results in Table 6 above, the IGTO-VMD-PE-IGTO-LSTM model performs well in the fault diagnosis task, with an average accuracy of 96.67%, a maximum accuracy of 98.96%, and a standard deviation of 1.2148, which shows high stability and small fluctuations. In contrast, the other models have obvious gaps in accuracy and stability with large standard deviations, indicating that they do not perform as well as IGTO-VMD-PE-IGTO-LSTM. In addition, the 95% confidence intervals of IGTO-VMD-PE-IGTO-LSTM are [95.75%, 97.58%], which further verifies its reliability and accuracy. Taken together, the model not only provides higher accuracy and lower volatility but also has strong stability in practical applications.
As shown in Figure 10, it can be found that Model 9 exhibits the highest median accuracy of 98.44% in the training phase, with a narrow fluctuation range concentrated around 98%. This observation indicates that Model 9 not only achieves the highest accuracy during the training process but also demonstrates commendable stability. Furthermore, in the boxplot of the testing phase, Model 9 continues to uphold its superior position in terms of both accuracy and stability, achieving a median accuracy of 96.35% and a fluctuation range between 95% and 97%. These results suggest that Model 9 possesses exceptional stability while maintaining high accuracy, rendering it the model likely to excel in practical applications, particularly in fault diagnosis environments that necessitate both high accuracy and stability.
The confusion matrix presented above in Figure 11, which represents one of ten results, indicates that the proposed Model 9 demonstrates exceptional performance in the fault diagnosis of rolling bearings. Also, it achieves high accuracy in all fault categories, especially in the L1 category, reaching a 29 times high accuracy diagnosis, which is the highest value in the comparison model. Furthermore, the classification error rate for Model 9 remains consistently low across all fault types, reflecting its high stability and superior classification efficacy. In comparison to other models, Model 9 not only excels in diagnosing individual fault types but also effectively minimizes misclassification while sustaining an overall high level of accuracy.
In order to evaluate the performance of the IGTO-VMD-MSE-IGTO-LSTM models, Precision, Recall, and F1 Score are used, and the resulting fault diagnosis evaluation metrics for each model under different operating conditions are shown in Table 7.
As can be seen from Table 7, the IGTO-VMD-MSE-IGTO-LSTM model has an average precision of 0.9804, an average recall of 0.9804, and an average F1 score of 0.9804, which all reach the highest value among all compared models; therefore, the proposed model in this paper exhibits excellent classification performance, especially in the recognition of multiple fault categories and is a model worth prioritizing and applying in fault diagnosis tasks.

4.4. Additional Validation Experiments

The previous experiment was validated using only a single dataset, which is insufficient to demonstrate its effectiveness. To further validate the proposed model’s applicability in fault diagnosis, it was applied to another dataset for supplementary validation. The chosen dataset is the Jiangnan University bearing dataset, which includes roller bearings with faults such as outer race faults, inner race faults, and rolling element faults. The test bearings used are of two types: N205 and NU205. The N205 bearings were used for normal, outer race fault, and rolling element fault conditions, while the NU205 bearings, which have a separable outer race, were used for inner race fault conditions. Each fault type is tested under three different operating conditions, corresponding to three different rotational speeds: 600 rpm, 800 rpm, and 1000 rpm. The data are collected using a single accelerometer with a sampling frequency of 50 kHz and a sampling duration of 10 s. The structure diagram and schematic of the test rig are shown in Figure 12 below.
Taking the data at 600 rpm as an example, the original signal is segmented into 1024-length windows, and 480 samples are generated for each fault category. With four categories in total, there are 1920 samples. The data are split into a training set and a test set with an 8:2 ratio, resulting in 1536 training samples and 384 test samples. The bearing condition labels and corresponding information are shown in Table 8 below.
To verify the applicability of the IGTO-VMD-PE-IGTO-LSTM model on this dataset, it was compared with a series of benchmark models, including VMD-PE-LSTM, VMD-PE-IGTO-LSTM, GTO-VMD-PE-LSTM, IGTO-VMD-PE-LSTM, IGTO-VMD-PE-PSO-LSTM, IGTO-VMD-PE-GWO-LSTM, IGTO-VMD-PE-CDO-LSTM, IGTO-VMD-PE-GTO-LSTM, GWO-VMD-PE-IGTO-LSTM, PSO-VMD-PE-IGTO-LSTM, GTO-VMD-PE-IGTO-LSTM, and CDO-VMD-PE-IGTO-LSTM. The parameter settings used were consistent with those described in Section 4.2. To mitigate the randomness introduced by intelligent optimization algorithms in the fault diagnosis process, each model was executed 10 times. The classification accuracies obtained in the testing phase are summarized in Table 9 below.
To compute the average accuracy, highest accuracy, lowest accuracy, standard deviation of accuracy, and the 95% confidence intervals for the 10 runs in the training phase, the following results are presented in Table 10 below.
From Table 10 above, it is evident that the models with hyperparameter optimization achieve higher fault diagnosis accuracy. A comparison of models 5, 6, 7, 8, and 13 shows that IGTO provides the best hyperparameter optimization for LSTM. Similarly, a comparison of models 9, 10, 11, 12, and 13 demonstrates that IGTO offers the best hyperparameter optimization for VMD.
Based on the analysis of standard deviation and 95% confidence interval, Model 13 performs the best among all models. Its diagnostic accuracy has the smallest standard deviation, only 0.54, and the 95% confidence interval is [98.47%, 99.24%], indicating that the model performs very stably across different datasets and achieves a high level of accuracy. Therefore, Model 13 exhibits the best stability and precision.
The test phase accuracy boxplots for each model were then plotted and the following results were obtained as shown below in Figure 13.
As shown in Figure 13, the median accuracy of Model 13 is 98.96%, which is significantly higher than the medians of the other models, indicating that Model 13 has the most stable and superior diagnostic performance. Additionally, although most models exhibit some fluctuation in accuracy (as indicated by the interquartile range and the length of the whiskers in the boxplot), the boxplot for Model 13 is more compact with a smaller fluctuation range, suggesting its greater stability. The absence of outliers in Model 13 further indicates that it is not influenced by extreme individual cases, and its performance remains consistent across different test sets or operating conditions, demonstrating good reliability for practical applications.
The above content verifies the proposed model (IGTO-VMD-PE-IGTO-LSTM) in terms of accuracy, demonstrating its strong fault diagnosis capability. To further analyze the diagnostic efficiency of each model, the diagnostic time for each model on the same dataset was statistically calculated. The results are shown in Table 11 below.
After comparing the runtime of the aforementioned models, it is evident that although Model 13 has a relatively longer runtime (with an average runtime of 13.88 s), it achieves the highest fault diagnosis accuracy among all models. This result indicates that Model 13 provides more precise results in diagnostic tasks. Therefore, in practical applications, it is entirely acceptable to sacrifice some computational time in exchange for higher accuracy. From an engineering perspective, when diagnostic accuracy is critical to the task outcome, choosing a model with a longer runtime but higher accuracy can significantly enhance the reliability of the diagnosis. This is especially true in domains that require precise fault detection, where a reasonable trade-off between computational time and accuracy is justified. Therefore, despite Model 13’s slightly longer runtime, its superior accuracy makes it a more attractive choice in high-precision scenarios. In such tasks, extending the computation time to achieve higher diagnostic accuracy is a rational and worthwhile decision.

5. Conclusions and Future Work

5.1. Conclusions

This paper proposes an intelligent fault diagnosis model for rolling bearings, named IGTO-VMD-PE-IGTO-LSTM, which integrates the IGTO algorithm and VMD, PE, and LSTM networks. The model employs IGTO to optimize both VMD and LSTM parameters, enhancing signal decomposition and feature extraction and ultimately improving fault classification accuracy.
The experimental results of the Case Western Reserve University dataset and the Jiangnan University dataset demonstrate the excellent performance of the proposed model. Specifically, the model achieves an average testing accuracy of 96.67% and a maximum testing accuracy of 98.96% in the Case Western Reserve University dataset. In the Jiangnan University dataset, the model reaches an average testing accuracy of 98.85%, with the highest accuracy reaching 99.48%. Furthermore, the model exhibits high stability, with low standard deviations of 1.2148 and 1.3217, and narrow 95% confidence intervals of [95.75%, 97.58%] and [96.73%, 97.49%] for the two datasets. These results confirm the model’s robustness and adaptability across different datasets and fault types. In terms of computational efficiency, while the proposed model has a slightly longer average runtime of 13.88 s per sample, the trade-off is justified by its superior diagnostic accuracy, making it suitable for high-precision fault detection tasks.

5.2. Future Work

The results presented in this study clearly demonstrate the superiority of the IGTO-VMD-PE-IGTO-LSTM model in rolling bearing fault diagnosis. The model outperforms other benchmark models in both accuracy and stability. The relatively low standard deviation and narrow confidence intervals further confirm the robustness of the proposed model, indicating its potential for real-world applications where stability and reliability are crucial.
However, the model’s performance has been primarily validated in the CWRU and Jiangnan University datasets, which may introduce dataset dependency. To enhance generalizability, further validation of diverse datasets from different domains is necessary. Second, the scalability of the model to real-time systems has not been fully explored. Future work should focus on optimizing the model for real-time applications, ensuring its feasibility in systems with strict time constraints. Lastly, the model’s sensitivity to parameter initialization could impact performance, particularly during the optimization process. While predefined settings based on prior research were used, further research could explore adaptive initialization techniques or robust hyperparameter tuning methods to improve stability and reliability.
In conclusion, the IGTO-VMD-PE-IGTO-LSTM model represents a significant advancement in rolling bearing fault diagnosis, offering high accuracy, stability, and adaptability. With further optimization in terms of computational efficiency and real-time implementation, the model could become a valuable tool for industrial applications in predictive maintenance and fault detection.

Author Contributions

Conceptualization, F.Y. and J.Q.; methodology, X.L.; software, X.L.; validation, B.A. and N.D.; formal analysis, F.Y.; investigation, F.Y.; resources, J.Q.; data curation, X.L.; writing—original draft preparation, X.L.; writing—review and editing, X.L.; visualization, X.L.; supervision, F.Y.; project administration, J.Q.; funding acquisition, F.Y. All authors have read and agreed to the published version of the manuscript.

Funding

This research was funded by the Program of National Natural Science Foundation of (NSFC) under Grant 52269020 and Yunnan Province Unveils Marshal Science and Technology Projects under Grant 2202204BW050001.

Institutional Review Board Statement

Not applicable.

Informed Consent Statement

Not applicable.

Data Availability Statement

The original contributions presented in this study are included in the article. Further inquiries can be directed to the corresponding author.

Acknowledgments

The authors would like to express their sincere gratitude to F.Y. for their invaluable guidance and support throughout this work. We also thank Case Western Reserve University and Jiangnan University for providing the datasets used in this study and for their assistance in data collection and analysis. We would like to acknowledge the helpful suggestions of J.Q. who contributed to improving the quality of this paper. Additionally, the authors are grateful to B.A. and N.D. Finally, we would like to extend our deepest appreciation to our families for their continuous encouragement and support during the course of this research.

Conflicts of Interest

The authors declare no conflicts of interest.

Abbreviations

The following abbreviations are used in this manuscript:
IGTOImproved Gorilla Troop Optimization Algorithm
LSTMLong Short-Term Memory
IMFIntrinsic Mode Function
GTOGorilla Troops Optimizer
VMDVariational Mode Decomposition
AβHCAdaptive β Hill Climbing
LOBLLens-based Opposite Learning
PEPermutation Entropy
PSOParticle Swarm Optimization
GWOGrey Wolf Optimization
CDOChernobyl disaster optimizer
AvgAverage Value
StdStandard Deviation

References

  1. Yin, Z.; Zhang, F.; Xu, G.; Han, G.; Bi, Y. Multi-Scale Rolling Bearing Fault Diagnosis Method Based on Transfer Learning. Appl. Sci. 2024, 14, 1198. [Google Scholar] [CrossRef]
  2. Fang, Z.; Wu, Q.-E.; Wang, W.; Wu, S. Research on Improved Fault Detection Method of Rolling Bearing Based on Signal Feature Fusion Technology. Appl. Sci. 2023, 13, 12987. [Google Scholar] [CrossRef]
  3. Wang, R.; Jiang, H.; Zhu, K.; Wang, Y.; Liu, C. A deep feature enhanced reinforcement learning method for rolling bearing fault diagnosis. Adv. Eng. Inform. 2022, 54, 101750. [Google Scholar] [CrossRef]
  4. Wang, L.; Zou, T.; Cai, K.; Liu, Y. Rolling bearing fault diagnosis method based on improved residual shrinkage network. J. Braz. Soc. Mech. Sci. Eng. 2024, 46, 172. [Google Scholar] [CrossRef]
  5. Zhou, Y.; Fang, Q.; Pei, Z.; Bai, L. Fault Diagnosis of Rolling Bearing Based on Improved Sparrow Search Algorithm Optimized LSTM. Adv. Eng. Sci. 2024, 56, 289–298. [Google Scholar]
  6. Chen, X.; Yang, R.; Xue, Y.; Huang, M.; Ferrero, R.; Wang, Z. Deep Transfer Learning for Bearing Fault Diagnosis: A Systematic Review Since 2016. IEEE Trans. Instrum. Meas. 2023, 72, 3508221. [Google Scholar] [CrossRef]
  7. Ma, Z.; Zhang, Y. A study on rolling bearing fault diagnosis using RIME-VMD. Sci. Rep. 2025, 15, 4712. [Google Scholar] [CrossRef]
  8. Zhou, J.; Xiao, M.; Niu, Y.; Ji, G. Rolling Bearing Fault Diagnosis Based on WGWOA-VMD-SVM. Sensors 2022, 22, 6281. [Google Scholar] [CrossRef]
  9. Wang, M.; Wang, W.; Zeng, J.; Zhang, Y. An Integrated Method Based on Sparrow Search Algorithm Improved Variational Mode Decomposition and Support Vector Machine for Fault Diagnosis of Rolling Bearing. J. Vib. Eng. Technol. 2022, 10, 2893–2904. [Google Scholar] [CrossRef]
  10. Wang, B.; Guo, Y.; Zhang, Z.; Wang, D.; Wang, J.; Zhang, Y. Developing and applying OEGOA-VMD algorithm for feature extraction for early fault detection in cryogenic rolling bearing. Measurement 2023, 216, 112908. [Google Scholar] [CrossRef]
  11. Zhang, W.; Li, J.; Chen, W. A compound fault feature separation method of rolling bearings based on VMD optimized by the bat algorithm. J. Vib. Shock 2022, 41, 133–141. [Google Scholar]
  12. Wu, K.; Feng, Y.; Wang, C.; Wang, G.; He, S.; Jiang, Z. Fault Diagnosis Method of Rolling Bearings Based on MPA-VMD. Noise Vib. Control 2023, 43, 112–119. [Google Scholar]
  13. Shi, L.; Su, S.; Wang, W.; Gao, S.; Chu, C. Bearing Fault Diagnosis Method Based on Deep Learning and Health State Division. Appl. Sci. 2023, 13, 7424. [Google Scholar] [CrossRef]
  14. Fan, Q.; Chen, Z.; Zhang, W.; Fang, X. ESSAWOA: Enhanced Whale Optimization Algorithm integrated with Salp Swarm Algorithm for global optimization. Eng. Comput. 2022, 38, 797–814. [Google Scholar] [CrossRef]
  15. Meng, D.; Wang, H.; Yang, S.; Lv, Z.; Hu, Z.; Wang, Z. Fault Analysis of Wind Power Rolling Bearing Based on EMD Feature Extraction. Cmes Comput. Model. Eng. Sci. 2022, 130, 543–558. [Google Scholar] [CrossRef]
  16. Li, X.; Ma, Z.; Kang, D.; Li, X. Fault diagnosis for rolling bearing based on VMD-FRFT. Measurement 2020, 155, 107554. [Google Scholar] [CrossRef]
  17. Lv, Q.; Zhang, K.; Wu, X.; Li, Q. Fault Diagnosis Method of Bearings Based on SCSSA-VMD-MCKD. Processes 2024, 12, 1484. [Google Scholar] [CrossRef]
  18. Wang, K.; Gao, B.; Shan, S.; Wang, R.; Wang, X. Research on Rolling Bearing Fault Diagnosis Method Based on ECA-MRANet. Appl. Sci. 2024, 14, 551. [Google Scholar] [CrossRef]
  19. Chen, F.; Zhou, X.; Xu, B.; Yang, Z.; Qu, Z. Instantaneous Square Current Signal Analysis for Motors Using Vision Transformer for the Fault Diagnosis of Rolling Bearings. Appl. Sci. 2023, 13, 9349. [Google Scholar] [CrossRef]
  20. Zhou, J.; Yang, X.; Li, J. Deep Residual Network Combined with Transfer Learning Based Fault Diagnosis for Rolling Bearing. Appl. Sci. 2022, 12, 7810. [Google Scholar] [CrossRef]
  21. Liang, X.; Yao, J.; Zhang, W.; Wang, Y. A Novel Fault Diagnosis of a Rolling Bearing Method Based on Variational Mode Decomposition and an Artificial Neural Network. Appl. Sci. 2023, 13, 3413. [Google Scholar] [CrossRef]
  22. Zhang, D.; Tao, H. Bearing Fault Diagnosis Based on Parameter-Optimized Variational Mode Extraction and an Improved One-Dimensional Convolutional Neural Network. Appl. Sci. 2024, 14, 3289. [Google Scholar] [CrossRef]
  23. Joseph, T.; Sudeep, U.; Krishnan, K.K.; Khanam, S. An Improved Rolling Bearing Fault Diagnosis Model of Long Short-Term Memory Network Based on VMD Denoised Vibration Signals. Int. J. Acoust. Vib. 2024, 29, 296–304. [Google Scholar] [CrossRef]
  24. Liu, Y.; Shi, Y.; Wang, J. Multi-stage life prediction of rolling bearings based on FCM-LSTM. J. Mach. Des. 2023, 40, 43–50. [Google Scholar]
  25. Liu, G.; Ma, Y.; Wang, N. Rolling Bearing Fault Diagnosis Based on SABO-VMD and WMH-KNN. Sensors 2024, 24, 5003. [Google Scholar] [CrossRef]
  26. Li, Y.; Peng, Z. Rolling Bearing Fault Diagnosis with Parameters Optimized VMD and SVM. Mech. Sci. Technol. Aerosp. Eng. 2022, 41, 1509–1514. [Google Scholar]
  27. Wan, L.; Li, Y.; Chen, K.; Gong, K.; Li, C. A novel deep convolution multi-adversarial domain adaptation model for rolling bearing fault diagnosis. Measurement 2022, 191, 110752. [Google Scholar] [CrossRef]
  28. Tiboni, M.; Remino, C.; Bussola, R.; Amici, C. A Review on Vibration-Based Condition Monitoring of Rotating Machinery. Appl. Sci. 2022, 12, 972. [Google Scholar] [CrossRef]
  29. Bao, J.; Zheng, J.; Cheng, J.; Pan, H.; Tong, J. MHTFPE2D: Two-dimensional multi-scale hierarchical time-frequency permutation entropy for complexity measurement. Nonlinear Dyn. 2024, 112, 15087–15108. [Google Scholar] [CrossRef]
  30. Bai, L.; Li, W.; Ren, H.; Li, F.; Yan, T.; Chen, L. Weak Fault Feature Extraction of the Rotating Machinery Using Flexible Analytic Wavelet Transform and Nonlinear Quantum Permutation Entropy. CMC—Comput. Mater. Contin. 2024, 79, 4513–4531. [Google Scholar] [CrossRef]
  31. Zhang, J.; Wu, J.; Hu, B.; Tang, J. Intelligent fault diagnosis of rolling bearings using variational mode decomposition and self-organizing feature map. J. Vib. Control 2020, 26, 1886–1897. [Google Scholar] [CrossRef]
  32. Li, W.; Yang, J.; Shao, P. Circle Chaotic Search-Based Butterfly Optimization Algorithm. In Proceedings of the 15th International Conference on Advances in Swarm Intelligence (ICSI), Xining, China, 23–26 August 2024; pp. 122–132. [Google Scholar]
  33. Xiao, Y.; Sun, X.; Guo, Y.; Li, S.; Zhang, Y.; Wang, Y. An Improved Gorilla Troops Optimizer Based on Lens Opposition-Based Learning and Adaptive β-Hill Climbing for Global Optimization. CMES—Comput. Model. Eng. Sci. 2022, 131, 815–850. [Google Scholar] [CrossRef]
  34. Al-Qablan, T.A.; Noor, M.H.M.; Al-Betar, M.A.; Khader, A.T. Improved Binary Gray Wolf Optimizer Based on Adaptive β-Hill Climbing for Feature Selection. IEEE Access 2023, 11, 59866–59881. [Google Scholar] [CrossRef]
  35. Mirjalili, S.; Mirjalili, S.M.; Lewis, A. Grey Wolf Optimizer. Adv. Eng. Softw. 2014, 69, 46–61. [Google Scholar] [CrossRef]
  36. Jain, M.; Saihjpal, V.; Singh, N.; Singh, S.B. An Overview of Variants and Advancements of PSO Algorithm. Appl. Sci. 2022, 12, 8392. [Google Scholar] [CrossRef]
  37. Abdollahzadeh, B.; Gharehchopogh, F.S.; Mirjalili, S. Artificial gorilla troops optimizer: A new nature-inspired metaheuristic algorithm for global optimization problems. Int. J. Intell. Syst. 2021, 36, 5887–5958. [Google Scholar] [CrossRef]
  38. Shehadeh, H.A. Chernobyl disaster optimizer (CDO): A novel meta-heuristic method for global optimization. Neural Comput. Appl. 2023, 35, 10733–10749. [Google Scholar] [CrossRef]
  39. Zhang, X.; Liang, Y.; Zhou, J.; Zang, Y. A novel bearing fault diagnosis model integrated permutation entropy, ensemble empirical mode decomposition and optimized SVM. Measurement 2015, 69, 164–179. [Google Scholar] [CrossRef]
  40. Yu, Y.; Si, X.; Hu, C.; Zhang, J. A Review of Recurrent Neural Networks: LSTM Cells and Network Architectures. Neural Comput. 2019, 31, 1235–1270. [Google Scholar] [CrossRef]
  41. Smith, W.A.; Randall, R.B. Rolling element bearing diagnostics using the Case Western Reserve University data: A benchmark study. Mech. Syst. Signal Process. 2015, 64–65, 100–131. [Google Scholar] [CrossRef]
  42. Xie, F.; Jiang, Y.; Xiao, Q.; Fu, Y.; Wang, E.; Liu, Y. VMD-LSSVM Fault Identification Method for Rolling Bearings. Mech. Sci. Technol. Aerosp. Eng. 2023, 42, 1482–1489. [Google Scholar]
  43. Zheng, J.; Chen, Y.; Pan, H.; Tong, J. Composite multi-scale phase reverse permutation entropy and its application to fault diagnosis of rolling bearing. Nonlinear Dyn. 2023, 111, 459–479. [Google Scholar] [CrossRef]
  44. Wang, Y.; Wang, X.; Wang, Y.; Gu, X.; Sun, J. A rolling bearing fault diagnosis method based on improved Aquila optimization algorithm to optimize LSTM. J. Vib. Shock 2024, 43, 144–154. [Google Scholar]
  45. Zhao, F.; Jiang, Y.; Cheng, C.; Wang, S. An improved fault diagnosis method for rolling bearings based on wavelet packet decomposition and network parameter optimization. Meas. Sci. Technol. 2024, 35, 025004. [Google Scholar] [CrossRef]
Figure 1. Results of the initial population.
Applsci 15 04338 g001
Figure 2. Flowchart of IGTO.
Applsci 15 04338 g002
Figure 3. (a) Convergence curves of F1; (b) convergence curves of F3; (c) convergence curves of F4; (d) convergence curves of F5; (e) convergence curves of F8; (f) convergence curves of F10.
Applsci 15 04338 g003
Figure 4. Flowchart of IGTO-VMD-PE.
Applsci 15 04338 g004
Figure 5. Fault diagnosis flowchart for adaptive parameter optimization.
Applsci 15 04338 g005
Figure 6. Timing diagram of the original vibration signal.
Applsci 15 04338 g006
Figure 7. Results of VMD.
Applsci 15 04338 g007
Figure 8. Curve of envelope entropy.
Applsci 15 04338 g008
Figure 9. VMD results after parameter optimization.
Applsci 15 04338 g009
Figure 10. (a) Boxplots of diagnostic results of training phase for different models; (b) boxplots of diagnostic results of testing phase for different models.
Applsci 15 04338 g010
Figure 11. (a) Confusion matrix for VMD-PE-LSTM models; (b) confusion matrix for VMD-PE-IGTO-LSTM models; (c) confusion matrix for GTO-VMD-PE-LSTM models; (d) confusion matrix for IGTO-VMD-PE-LSTM models; (e) confusion matrix for IGTO-VMD-PE-GWO-LSTM models; (f) confusion matrix for IGTO-VMD-PE-PSO-LSTM models; (g) confusion matrix for IGTO-VMD-PE-GTO-LSTM models; (h) confusion matrix for IGTO-VMD-PE-CDO-LSTM models; (i) confusion matrix for IGTO-VMD-PE-IGTO-LSTM models.
Applsci 15 04338 g011aApplsci 15 04338 g011b
Figure 12. (a) Structural diagram of the test bench; (b) schematic diagram of the test bench [45].
Applsci 15 04338 g012
Figure 13. Boxplot of test phase accuracy for each model.
Applsci 15 04338 g013
Table 1. Benchmark functions.
TypeFunctionDimRange F m i n
UM F 1   ( x ) = n i = 1   x i 2 30[−100, 100]0
F 3   ( x ) = m a x   ( x 1 , x 2 , , x d ) 30[−100, 100]0
MM F 4   ( x ) = d i = 1     ( i j = 1   x j ) 2 30[−100, 100]0
F 5   ( x ) = d i = 1   X i   i + 1 30[−1, 1]0
FM F 8 x = d i = 1   x i + d i = 1   x i 30[−10, 10]0
F 10   ( x ) = d i = 1   i x i 4 30[−1.28, 1.28]0
Table 2. Avg and Std values for each algorithm.
FunctionParametersGWOPSOGTOCDOIGTO
F1Avg2.49 × 10−271.32 × 10−733.68 × 10−27500
Std6.42 × 10−275.4 × 10−73000
F3Avg1.35 × 10−546,0002.61 × 10−31800
Std2.66 × 10−512,700000
F4Avg8.38 × 10−744.32.19 × 10−1469.71 × 10−1930
Std1.10 × 10−629.21.20 × 10−14500
F5Avg27.527.811.74.957.46 × 10−5
Std4.47 × 10−16.10 × 10−114.411.18.57 × 10−5
F8Avg−6189.550−10,334.835−12,569.055−12,568.778−12,569.487
Std79717703.51 × 10−11.23 × 10−43.02 × 10−5
F10Avg1.02 × 10−135.03 × 10−158.88 × 10−168.88 × 10−168.88 × 10⁻¹⁶
Std1.64 × 10−142.30 × 10−15000
Table 3. PE values of fault samples extracted by VMD.
Fault LabelSample NumberPE of Different IMFs
PE1PE2PE3PE4
L010.2990690.3203920.4935290.511928
20.3126740.3349670.4966480.514999
30.289960.3106340.4872770.517158
40.2835490.3037660.4937880.518129
50.295420.3164840.4893540.518198
L110.4342350.4771230.5644390.726385
20.4377680.4810040.5633660.726868
30.4384450.4817480.5563850.726981
40.4283740.4706830.5634480.727338
50.4335640.4763850.5670460.728214
L210.4261290.4303380.5609850.717812
20.4325610.4368330.5585780.717836
30.4350150.4393110.5579890.718189
40.4477790.4522020.559260.718412
50.4537990.4582810.5621030.718434
L310.4390230.4444150.5455520.692361
20.4285140.4337760.5556940.694069
30.4201560.4253160.5533780.695108
40.420910.4260790.5511720.695938
50.4170630.4221850.551440.695975
Table 4. PE values of fault samples extracted by IGTO-VMD.
Fault LabelSample NumberPE of Different IMFs
PE1PE2PE3PE4PE5PE6PE7
L010.251270.3740750.4383610.4686580.4642870.5870910.639929
20.2381010.3609050.4385030.46880.4642930.5870980.639936
30.2678510.3906560.4340660.4643630.4645430.5873480.640209
40.2633810.3861860.4314970.4617940.4658080.5886120.641587
50.2535780.3763820.4363860.4666830.4663550.5891590.642184
L110.3812560.3935640.5003470.5497640.6316620.687030.707641
20.3807780.393070.4957230.5446840.6318990.6872880.707907
30.3862870.3987570.4947790.5436460.6319070.6872960.707915
40.3930.4056860.4882510.5364730.6324580.6878960.708533
50.3874710.3999780.4961280.5451280.6324820.6879220.70856
L210.3849630.3926620.4832680.5074320.6058630.6482730.7131
20.3979230.4058820.4790770.5030310.6061970.6486310.713494
30.3704590.3778690.4840.50820.6066010.6490630.713969
40.3815910.3892230.4888870.5133320.6070320.6495240.714477
50.4250110.4335120.4916820.5162670.6072180.6497230.714696
L310.4139020.4263190.5009260.5109440.6182850.6491990.746579
20.4238760.4365920.5164050.5267330.6186560.6495890.747028
30.470570.4846870.5065520.5166830.6090330.6394840.735407
40.4410580.454290.5136280.52390.6291610.6606190.759711
50.4626930.4765730.5154670.5257770.6191740.6501320.747652
Table 5. Fault diagnosis results of different models.
ModelAccuracy/(%) and Deviation Range
Training PhaseTesting Phase
1-VMD-PE-LSTM85.55, [−2.21, 4.30]86.25, [−8.13, 5.42]
2-VMD-PE-IGTO-LSTM90.16, [−2.40, 2.29]88.13, [−3.75, 2.50]
3-GTO-VMD-PE-LSTM92.68, [−1.80, 1.85]90.42, [−1.88, 2.29]
4-IGTO-VMD-PE-LSTM94.51, [−1.02, 1.07]91.98, [−2.40, 1.77]
5-IGTO-VMD-PE-GWO-LSTM95.05, [−2.08, 2.08]92.81, [−2.19, 1.98]
6-IGTO-VMD-PE-PSO-LSTM95.86, [−1.07, 1.28]93.33, [−2.71, 2.50]
7-IGTO-VMD-PE-GTO-LSTM96.41, [−1.61, 1.25]94.48, [−1.77, 2.40]
8-IGTO-VMD-PE-CDO-LSTM97.03, [−0.94, 1.15]95.00, [−2.29, 2.92]
9-IGTO-VMD-PE-IGTO-LSTM98.44, [−0.78, 0.78]96.67, [−1.88, 2.29]
Table 6. Results of the testing phase for CWRU dataset.
ModelAvg/%Max/%Min/%Std/%95% Confidence Intervals/%
1-VMD-PE-LSTM86.2591.6778.134.1615(89.39, 83.11)
2-VMD-PE-IGTO-LSTM88.1390.6384.382.0412(89.66, 86.59)
3-GTO-VMD-PE-LSTM90.4292.7188.541.2148(91.33, 89.50)
4-IGTO-VMD-PE-LSTM91.9893.7589.581.3217(92.98, 90.98)
5-IGTO-VMD-PE-GWO-LSTM92.8194.7990.631.5059(93.95, 91.68)
6-IGTO-VMD-PE-PSO-LSTM93.3395.8390.631.6271(94.56, 92.11)
7-IGTO-VMD-PE-GTO-LSTM94.4896.8892.711.3217(95.48, 93.48)
8-IGTO-VMD-PE-CDO-LSTM95.0097.9292.711.5309(96.15, 93.85)
9-IGTO-VMD-PE-IGTO-LSTM96.6798.9694.791.2148(97.58, 95.75)
Table 7. Evaluation metrics for fault diagnosis in different operating states for each model.
ModelOperating StatesPrecisionRecallF1 Score
1-VMD-PE-LSTML00.77140.90000.8308
L10.83330.78950.8108
L20.84620.84620.8462
L30.80950.68000.7391
2-VMD-PE-IGTO-LSTML00.93330.96550.9492
L10.95450.91300.9333
L20.88460.85190.8679
L30.77780.82350.8000
3-GTO-VMD-PE-LSTML00.86960.95240.9091
L10.96150.89290.9259
L20.96000.88890.9231
L30.86360.95000.9048
4-IGTO-VMD-PE-LSTML00.83330.90910.8696
L11.00001.00001.0000
L21.00000.86210.9259
L30.76920.83330.8000
5-IGTO-VMD-PE-GWO-LSTML00.85000.80950.8293
L11.00001.00001.0000
L21.00001.00001.0000
L30.87500.90320.8889
6-IGTO-VMD-PE-PSO-LSTML00.89660.89660.8966
L11.00001.00001.0000
L21.00001.00001.0000
L30.82350.82350.8235
7-IGTO-VMD-PE-GTO-LSTML01.00000.85190.9200
L11.00001.00001.0000
L21.00001.00001.0000
L30.86211.00000.9259
8-IGTO-VMD-PE-CDO-LSTML00.90480.90480.9048
L11.00001.00001.0000
L21.00001.00001.0000
L30.90000.90000.9000
9-IGTO-VMD-PE-IGTO-LSTML00.96000.96000.9600
L11.00001.00001.0000
L21.00001.00001.0000
L30.96150.96150.9615
Table 8. Labeling and information on bearing status.
Bearing StatusLabelsRotation SpeedSampling FrequencyNumber of Data
Regular staten600 rpm50 KHz480
Inner race faultsib600 rpm50 KHz480
Outer race faultsob600 rpm50 KHz480
Rolling element faultstb600 rpm50 KHz480
Table 9. Accuracy of the model in the testing phase.
ModelAccuracy of the Model in the Testing Phase/%
12345678910
1-VMD-PE-LSTM83.3384.1184.9085.6886.2086.9887.5087.7688.0288.28
2-VMD-PE-IGTO-LSTM87.5088.0288.5488.8086.2089.0689.3289.5890.8992.45
3-GTO-VMD-PE-LSTM89.5890.3691.4192.4592.9793.2391.4190.3694.2793.75
4-IGTO-VMD-PE-LSTM91.4195.5794.7993.2395.8394.7993.2394.0192.1995.83
5-IGTO-VMD-PE-GWO-LSTM97.4096.6196.3596.0997.4092.9796.6195.5797.1493.23
6-IGTO-VMD-PE-PSO-LSTM96.6196.3596.0997.1496.6196.8896.0998.7094.7995.05
7-IGTO-VMD-PE-GTO-LSTM97.1496.8897.4096.8897.4096.6197.6697.9296.0997.14
8-IGTO-VMD-PE-CDO-LSTM98.1898.4497.9297.6697.6698.4498.4496.8896.6198.70
9-GWO-VMD-PE-IGTO-LSTM97.496.6196.3596.0997.492.9796.6195.5797.1493.23
10-PSO-VMD-PE-IGTO-LSTM96.6196.3596.0997.1496.6196.8896.0998.794.7995.05
11-GTO-VMD-PE-IGTO-LSTM97.1496.8897.496.8897.496.6197.6697.9296.0997.14
12-CDO-VMD-PE-IGTO-LSTM98.1898.4497.9297.6697.6698.4498.4496.8896.6198.7
13-IGTO-VMD-PE-IGTO-LSTM99.4898.4498.798.9699.2297.9299.4898.9699.2298.18
Table 10. Results of the testing phase for JNU dataset.
ModelAvg/%Max/%Min/%Std/%95% Confidence Intervals/%
1-VMD-PE-LSTM86.2888.2883.331.7281(85.04, 87.51)
2-VMD-PE-IGTO-LSTM89.0492.4586.201.7386(87.79, 90.28)
3-GTO-VMD-PE-LSTM91.9894.2789.581.5916(90.84, 93.12)
4-IGTO-VMD-PE-LSTM94.0995.8391.411.5457(92.98, 95.19)
5-IGTO-VMD-PE-GWO-LSTM95.9497.4092.971.6019(94.79, 97.08)
6-IGTO-VMD-PE-PSO-LSTM96.4398.7094.791.0932(95.65, 97.21)
7-IGTO-VMD-PE-GTO-LSTM97.1197.9296.090.5596(96.73, 97.49)
8-IGTO-VMD-PE-CDO-LSTM97.8998.7096.610.7002(97.39, 98.39)
9-GWO-VMD-PE-IGTO-LSTM93.9897.9292.451.6536(94.79, 97.08)
10-PSO-VMD-PE-IGTO-LSTM94.7495.5794.010.5463(95.65, 97.21)
11-GTO-VMD-PE-IGTO-LSTM96.1296.8895.050.6548(96.73, 97.49)
12-CDO-VMD-PE-IGTO-LSTM96.4897.9295.050.9916(97.39, 98.39)
13-IGTO-VMD-PE-IGTO-LSTM98.8599.4897.920.5371(98.47, 99.24)
Table 11. Running time for each model.
ModelRunning Time/sAvg/s
12345678910
1-VMD-PE-LSTM10.1311.1610.1310.2910.1110.4410.3610.1710.5710.1610.35
2-VMD-PE-IGTO-LSTM10.2611.3010.2610.4210.2410.5710.4910.3010.7010.2910.48
3-GTO-VMD-PE-LSTM10.3911.4510.3910.5610.3710.7110.6310.4310.8410.4210.62
4-IGTO-VMD-PE-LSTM11.5612.7411.5611.7411.5411.9111.8211.6112.0611.5911.81
5-IGTO-VMD-PE-GWO-LSTM15.1716.7115.1715.4115.1415.6415.5215.2315.8315.2215.50
6-IGTO-VMD-PE-PSO-LSTM13.5114.8813.5113.7213.4813.9213.8113.5614.0913.5513.80
7-IGTO-VMD-PE-GTO-LSTM13.2014.5513.2013.4113.1813.6113.5013.2513.7813.2413.49
8-IGTO-VMD-PE-CDO-LSTM12.2113.4512.2112.4012.1912.5812.4912.2612.7412.2512.48
9-GWO-VMD-PE-IGTO-LSTM16.0515.3813.9614.1813.9414.3914.2814.0214.5714.0114.48
10-PSO-VMD-PE-IGTO-LSTM14.2813.6812.4212.6212.4012.8012.7012.4712.9612.4612.88
11-GTO-VMD-PE-IGTO-LSTM15.6915.0413.6513.8613.6214.0713.9613.7014.2413.6914.15
12-CDO-VMD-PE-IGTO-LSTM13.8713.2912.0712.2612.0412.4312.3412.1112.5912.1012.51
13-IGTO-VMD-PE-IGTO-LSTM15.3914.7513.3913.6013.3613.8013.6913.4413.9713.4313.88
Disclaimer/Publisher’s Note: The statements, opinions and data contained in all publications are solely those of the individual author(s) and contributor(s) and not of MDPI and/or the editor(s). MDPI and/or the editor(s) disclaim responsibility for any injury to people or property resulting from any ideas, methods, instructions or products referred to in the content.

