1. Introduction
Recent advancements in information and communication technology have brought positive changes to document management methods across various industries and institutions. Companies, public institutions, and financial organizations can reduce the spatial limitations of physical document storage and improve the efficiency of document transmission and management by digitizing important documents. However, with the development of image processing and document editing tools, digital documents are now exposed to forgery and manipulation. A wide range of digital documents, from everyday documents to critical ones handled by key institutions, can become targets for forgery and manipulation. If these forged documents are distributed uncontrollably, they can cause serious social disruption. For example, the distribution of forged legal documents or contracts can lead to significant legal disputes, while manipulated financial documents can result in economic damage. As a result, many countries are actively conducting research on detecting forgery in digital documents. Recently, deep learning technologies have gained attention for their high accuracy in digital document forgery detection. For instance, Hamido et al.’s method [
1] combines convolutional neural networks (CNNs) with background pattern analysis and template synthesis to assess whether a document conforms to its original format. Similarly, Jaiswal et al.’s method [
2] introduces an unsupervised approach that utilizes hyperspectral imaging; in this method, a convolutional autoencoder (CAE) extracts the spectral features of inks, and a logistic regression classifier is employed to effectively distinguish between different inks, thereby detecting subtle alterations in the document. Since deep learning models such as CNNs require large amounts of training data for forgery detection, it is crucial not only to develop sophisticated models but also to create diverse datasets that can be used in developing new deep learning models. However, the majority of datasets developed and used in this field are based on English documents, which limits their effectiveness in detecting forgery across different languages. For example, after reviewing ten papers published since 2023 on the topic of document forgery detection ([
3,
4,
5,
6,
7,
8,
9,
10,
11,
12]), it was found that nine out of these ten studies conducted their research using English-based datasets. Example images of the datasets used in [
3] and [
4] are shown in
Figure 1. In addition, [
13] introduced six datasets (CVL [
14], ICDAR 2011 [
15], KHATT [
16], ICPR2018 [
17], IMEI number [
18], Google-LIFE-Magazine [
19]) used for digital document forgery detection, five of which are based on the English alphabet.
As these examples show, the majority of datasets published in the field of digital document forgery detection are in English. However, deep learning-based digital document forgery detection models, which achieve high performance with English-based data, may show different accuracy when applied in cultures that do not use English. This discrepancy arises because the models are trained on English data but applied to data in another language.
Each language has its own structural complexity, so in order to improve detection accuracy, datasets that reflect the characteristics of the target language are needed. For instance, Korean and English have significant differences in their writing systems, and these differences can affect the accuracy of forgery detection algorithms. The visual complexity of a script plays an important role in cognitive processing, and languages with more complex scripts may require greater cognitive resources. This variation in complexity can lead deep learning models to process Korean and English documents differently when detecting forgery. If this is not taken into account during model training, the detection accuracy may suffer [
20]. Therefore, this study examines the differences in forgery between the two languages by experimentally comparing Korean and English documents and confirming the presence of distinct numerical features when documents are forged in each language. The experiment is conducted by analyzing the visual complexity of each language and investigating the differences between the original and forged versions of English and Korean documents using the SIFT and GLCM algorithms. The SIFT algorithm extracts keypoints from images and calculates the similarity between the original and manipulated images to identify the differences between English and Korean documents [
21]. Additionally, the GLCM algorithm is used to extract textural features from both the original and forged images to analyze the differences between the two languages [
22].
By analyzing the visual differences between English and Korean when documents are forged and evaluating the performance of detection models using deep learning through experiments, this study emphasizes the need for datasets based on various languages in the development of digital document forgery detection models. Furthermore, the method of comparing the characteristics of forged Korean and English text can contribute to the development of methods for comparing differences between other languages. This research is expected to make a contribution to the advancement of digital document forgery detection.
2. Related Work
2.1. Document Image Forgery Techniques
Document image forgery techniques commonly involve methods such as copy–move, splicing, and insertion, where manipulated regions are either duplicated from the same document, combined from different sources, or artificially added to alter the content:
- ▪
The copy–move method involves copying specific text or image regions within a digital document and pasting them elsewhere in the same document. This method can be used to conceal important information within the document or duplicate portions of text or images. For example, in a receipt or contract, important details such as amounts or signatures can be copied and pasted to another location, distorting the semantic integrity of the document [
23].
- ▪
The splicing method is similar to copy–move, but the difference lies in the fact that the inserted text or image is not copied from the same document but sourced from another document or file. This type of manipulation is used to hide specific information in the document or create a fake scenario. For instance, a signature from one document can be spliced into another, making the document appear authentic when it is not [
23].
- ▪
Insertion is one of the frequently used techniques in digital document forgery. Software tools are employed to insert new characters at specific locations in the document, altering the original content [
22]. This technique is mainly employed to distort critical information or modify the document to fit particular needs, which may undermine the credibility of the document. With the recent advancements in software tools, the insertion technique has become more sophisticated, leading to the development of various methods for detecting such forgeries.
2.2. Digital Document Forgery Dataset
2.2.1. Receipt Dataset
This dataset consists of a total of 988 scanned receipt images and their corresponding texts, and it was built based on the SROIE (Scanned Receipts OCR and Information Extraction) dataset. Out of these, 163 receipts have undergone forgery, with methods such as copy–paste, text imitation, the deletion of information, and pixel modification used for the forgeries. The forged areas are annotated, allowing verification of how the image or text has been altered. This dataset was created in a way that closely resembles real-world scenarios and can be used for both text- and image-based analyses, making it a valuable resource for digital document forgery detection research [
3].
2.2.2. DocTamper Dataset
The DocTamper dataset consists of various types of documents such as contracts, invoices, and receipts, with 95,000 English documents and 75,000 Chinese documents, totaling 170,000 digital document images. Out of these, 120,000 are provided as the training dataset, 30,000 as the general test dataset, and 20,000 as the cross-domain test dataset. The forgery techniques used in this dataset include copy–move, splicing, and generation. To maintain visual consistency in document images, instead of randomly copying and pasting text, similar-styled text groups were selected to generate tampered text. Additionally, during text deletion and generation, new text with styles and fonts similar to the original was inserted to ensure visual consistency. Moreover, pixel-level annotations of the tampered text regions are provided for all document images, making the dataset highly useful for researchers working on tampered text detection [
4].
2.3. Visual Complexity of Characters
English, Chinese, Korean, and other languages each have distinct visual characteristics. When these languages are digitized and rendered as images, their visual traits can be observed at the pixel level, allowing us to evaluate the complexity of the characters. In [
20], the complexity of characters is evaluated using perimetric complexity and algorithmic complexity.
Perimetric complexity is calculated by comparing the perimeter of a character to its printed area. Specifically, it measures the perimeter of the character or shape and the area filled with ink to calculate its complexity. The formula for perimetric complexity is shown in Equation (1).
Here, PC represents the perimetric complexity, where P denotes the perimeter length, and A represents the area filled with ink. A higher value indicates higher complexity.
Algorithmic complexity measures the complexity of a character by converting the image of the character into a file and then compressing it to measure the file size. The file size reflects the length of the program that most concisely represents the character, allowing us to assess the complexity of the character.
2.4. GLCM
The Gray-Level Co-occurrence Matrix (GLCM) is a technique used to analyze the spatial relationships between pixels in an image, represented as a matrix, and is applied for the texture analysis of images. This matrix reflects the frequency of the occurrence of gray-level values between two adjacent pixels at angles of 0°, 45°, 90°, and 135°, allowing us to understand the structural arrangement of the image. By utilizing the generated matrix, 14 texture features can be calculated, with key features including the Inverse Difference Moment (IDM), contrast, Angular Second Moment (ASM), and correlation. The GLCM is effective in quantifying texture by analyzing the spatial relationships between pixels in an image, allowing it to detect subtle changes in text images. This makes it useful for identifying visual differences between English and Korean.
- ▪
Inverse Difference Moment (IDM): The IDM is a measure of the smoothness or homogeneity of a texture, with the value increasing as the texture becomes more uniformly distributed. The formula for its calculation is shown in Equation (2).
- ▪
Contrast: Contrast is a measure that reflects the gray-level difference between pixels in an image. It is used to assess the irregularity of the texture, and a higher contrast indicates greater differences between pixels in the image. The formula for its calculation is shown in Equation (3).
- ▪
Angular Second Moment (ASM): The ASM refers to the sum of the squares of the values in the matrix, indicating how uniform the texture of an image is. The value increases when the texture is repetitive, and the formula for its calculation is shown in Equation (4).
- ▪
Correlation: Correlation is a measure that indicates how linearly related the gray-level values of neighboring pixels are. A higher value means that the gray-level values of neighboring pixels are more linearly dependent. The formula for its calculation is shown in Equation (5).
In a normalized gray-tone spatial dependence matrix,
p(
i,
j) represents the entry at the (
i,
j) position, and it is calculated as
p(
i,
j) =
P(
i,
j)/
R.
denotes the number of distinct gray levels in the quantized image.
and
represent the average values and the standard deviations of
and
, respectively [
24].
2.5. SIFT
The similarity between the original and forged images in each language can be measured to identify the differences in the characteristics of these languages. The SIFT (Scale-Invariant Feature Transform) algorithm can find feature points in images while maintaining robustness to changes in scale, rotation, and illumination [
25]. Using this algorithm, feature points can be detected, and matching distances can be calculated to measure the similarity between the original and forged images in each language. The method for detecting feature points in images using the SIFT algorithm is described below [
26]:
Scale-space Extreme Detection: The first step of the SIFT algorithm is to use the Difference of Gaussians (DoG) function to find points of interest at various scales and locations within an image. The DoG detects stable feature points at different scales, ensuring invariance to changes in size and orientation.
Keypoint Localization: to precisely determine the location and scale of candidate keypoints, a detailed model is applied at each location to select stable keypoints.
Orientation Assignment: For each keypoint location, one or more orientations are assigned based on the local image gradient directions. All subsequent operations are performed on image data transformed relative to the assigned orientation, scale, and location, ensuring invariance to these transformations.
Keypoint Descriptor Generation: At the chosen scale, local image gradients around each keypoint are measured and converted into feature vectors, ensuring strong invariance to local shape distortions and changes in illumination.
2.6. K-Fold Cross-Validation and Bootstrap
K-fold cross-validation and the bootstrap method are widely used techniques for evaluating model performance and estimating generalization error. K-fold cross-validation involves partitioning the dataset into K folds, training the model K times, with each fold serving as a validation set once while the remaining folds are used for training. This approach helps reduce model performance variability and provides a more reliable performance estimation.
On the other hand, the bootstrap method utilizes resampling with replacement, generating multiple new samples from the original dataset and repeatedly evaluating the model on these samples to estimate the distribution of performance metrics. This technique is particularly useful for small datasets or when sampling bias may affect the reliability of model evaluation.
Kohavi et al.’s method [
27] compares K-fold cross-validation and the bootstrap method, discussing their advantages and limitations in model evaluation and selection. According to their findings, K-fold cross-validation generally exhibits lower variance and provides stable performance estimates, whereas the bootstrap method is advantageous for performance estimation, particularly when dealing with small datasets.
3. Experimental Method
3.1. Data Generation for Experiments
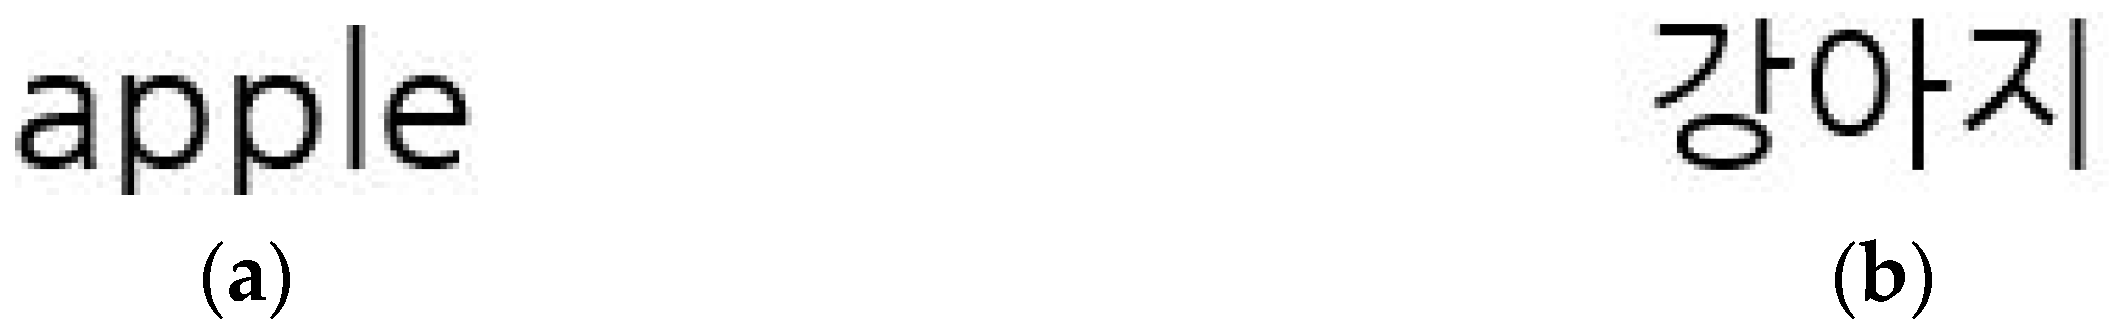
To examine the visual differences between English and Korean and understand how these differences affect the classification accuracy of digital document forgery detection models, data for the experiments were generated. To ensure accurate experiments, the font type, font size, and background color of the data were standardized, and the text length of each image was adjusted to be as similar as possible. An example of the generated text reflecting these aspects is shown in
Figure 2.
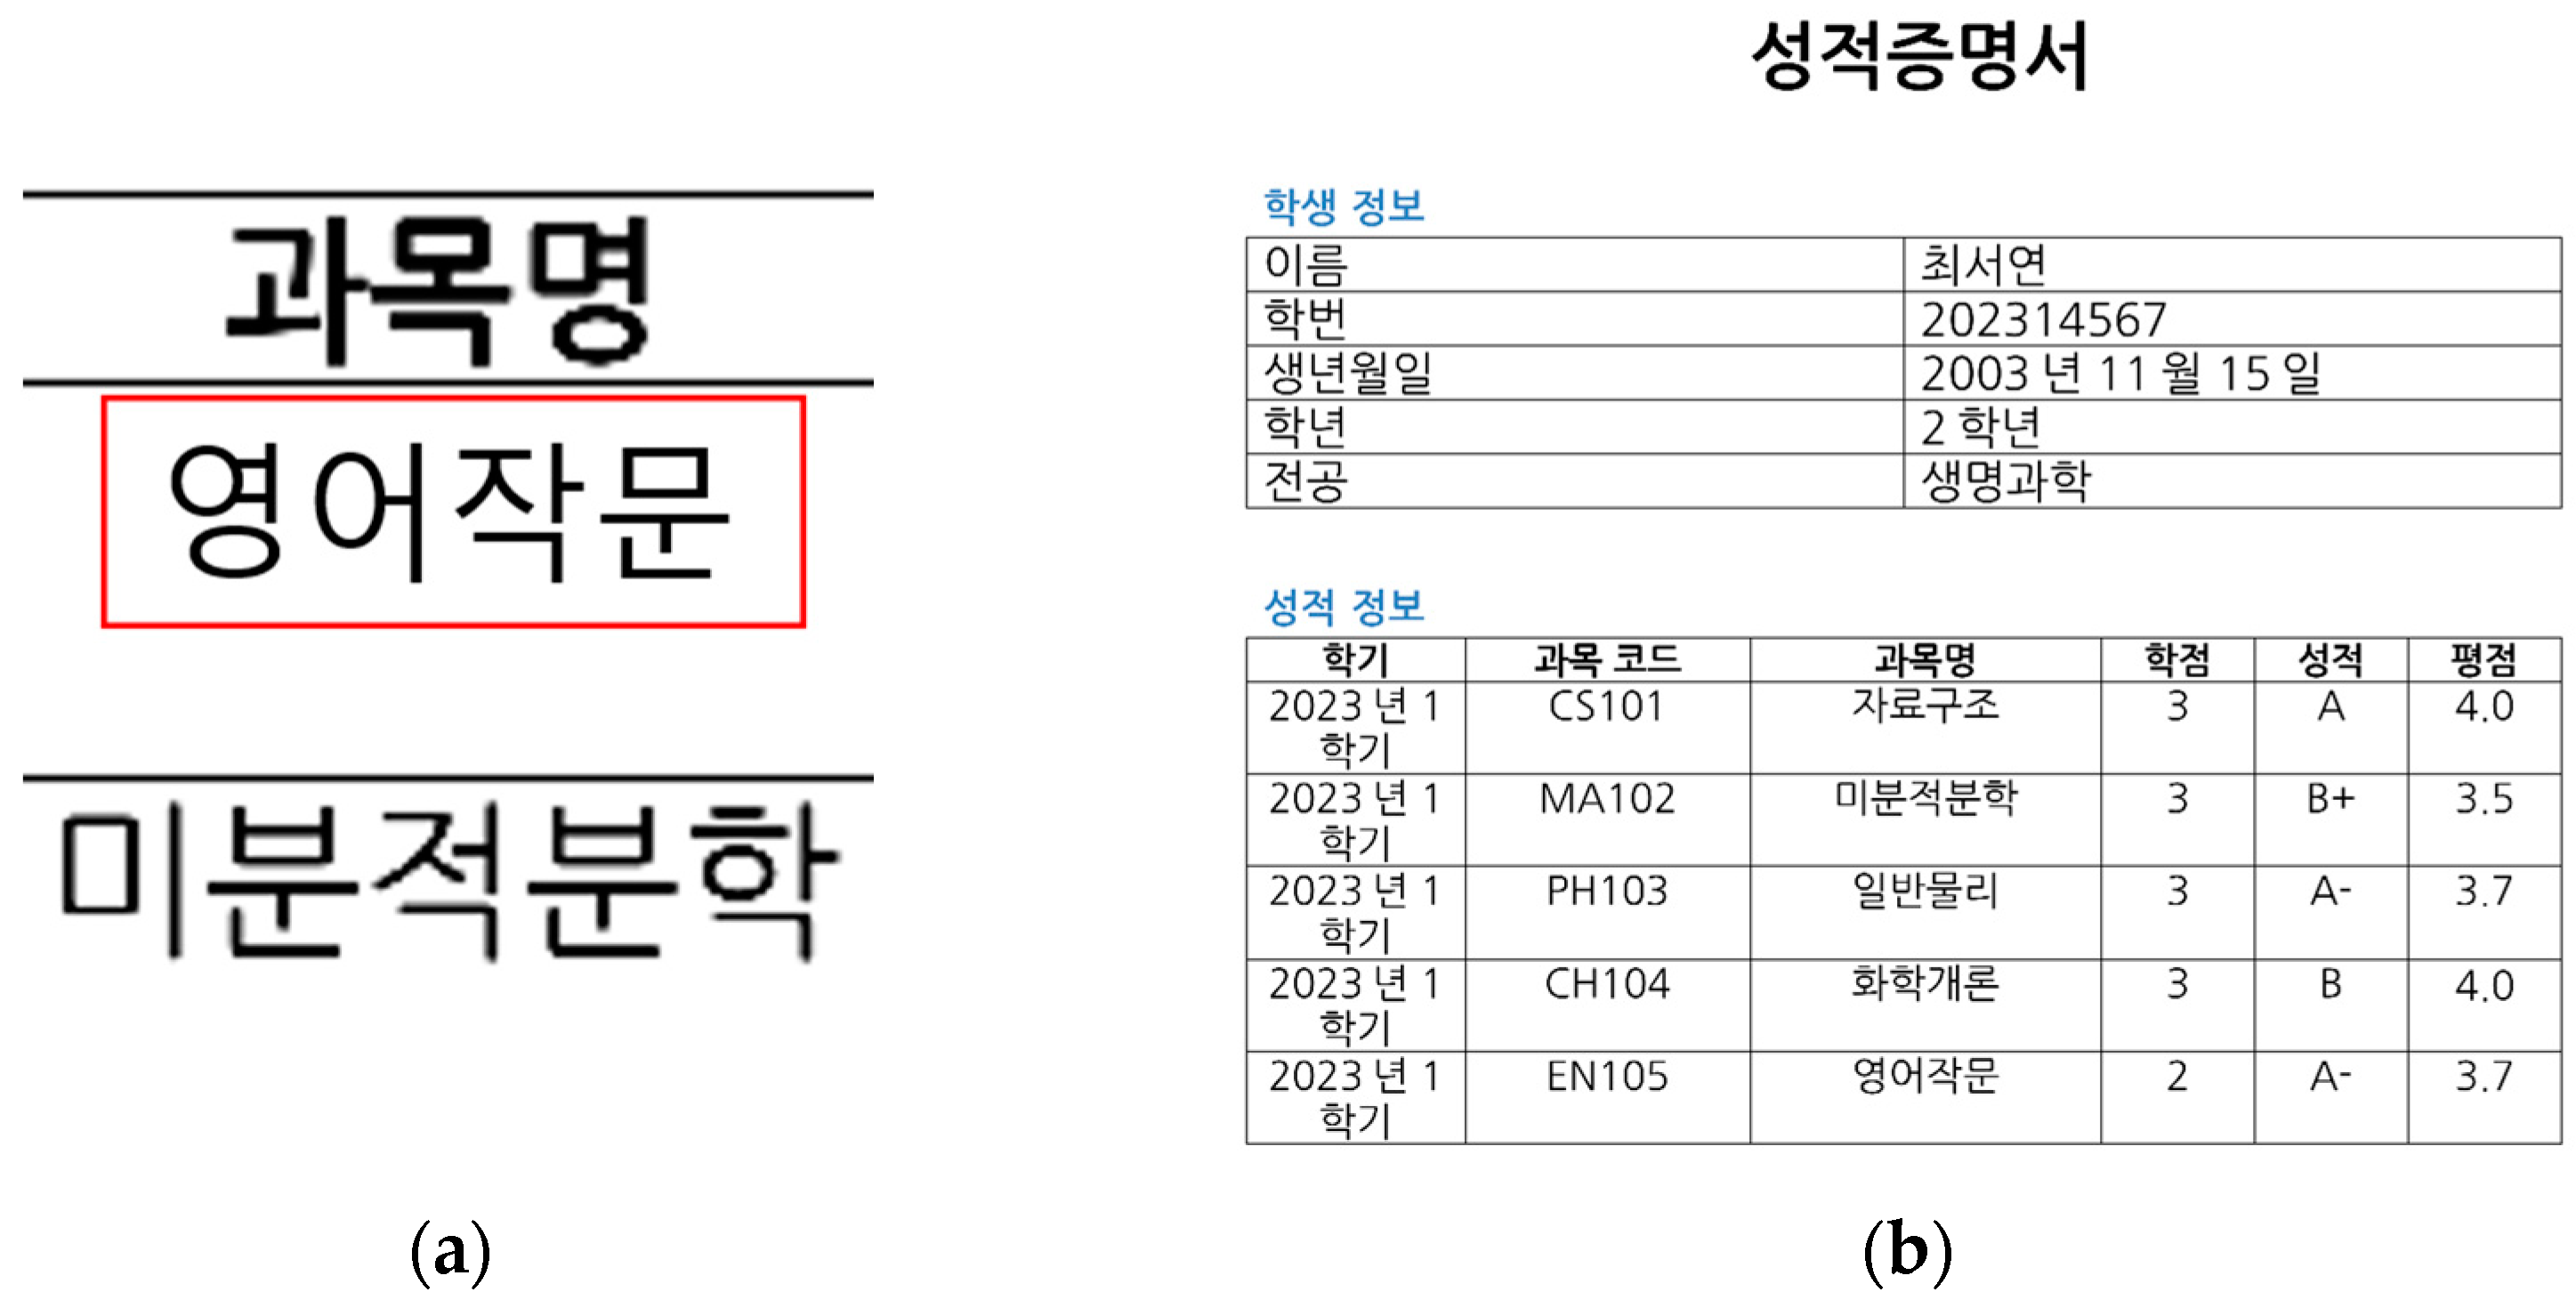
Using these settings, original digital document images in the form of university transcripts were created, and these images were forged using the copy–move and insertion methods to generate forged data. The data were generated by randomly creating transcript formats using Python’s (3.11.12) docx module and generative deep learning models, then converting them into image files from MS Word documents. Tesseract OCR was then used to automatically identify information such as student names, course titles, university names, and grades, and some of this information was intentionally manipulated. The forgery process was fully automated, with the copy–move and insertion techniques applied programmatically. The copy–move method involved detecting text regions using Tesseract OCR, selecting the forged area, cropping it, and pasting it back into the original position using the Python PIL library. The insertion method involved identifying specific text regions through Tesseract OCR, overlaying them with a white background, and replacing the text using the same font type and size to generate a realistic forgery. To ensure diversity in the dataset, the generated transcripts varied in layout, font, and content, and the modifications were designed to be visually consistent with the original documents. An example of the generated data is shown in
Figure 3.
3.2. Validation of the Generated Data
This study investigates how visual differences between English and Korean affect the performance of digital document forgery detection models by generating and using custom datasets. Since most existing public datasets are in English only, a fair comparison between the two languages was not feasible. In particular, there are no publicly available manipulated document image datasets in Korean, making dataset construction necessary.
Section 3.2. describes the procedures used to validate the reliability and suitability of the custom-generated dataset.
3.2.1. Dataset Validation Criteria
For comparison, the receipt dataset and the DocTamper dataset were used, and the custom-generated dataset was based on both English and Korean document images. The suitability of the dataset was evaluated based on the following three criteria:
- -
OCR accuracy of document images: to evaluate the recognizability of characters in document images, the Percentage of Correctly Recognized characters (PCR) was measured for each dataset using OCR.
- -
Document dataset structure: to ensure structural consistency and similarity between the custom-generated dataset and other datasets, we analyzed each dataset in terms of the average number of sentences and words, as well as the maximum and minimum number of characters.
- -
Model performance comparison: to confirm whether the generated dataset could be applied to actual forgery detection models, representative models from previous studies ([
7,
22,
28]) were applied, and their performance was measured based on accuracy and the F1-score.
Table 2 summarizes the differences in the structure and preprocessing methods between the CNN-based deep learning model proposed in [
22], the SVM model based on GLCM features presented in [
28], and the CAE-SVM model using RGB images described in [
7], which were used for classification accuracy validation. All three models were partially modified to accommodate the input format of the dataset used in this study. For data validation, the reliability of the custom-generated dataset was reviewed with reference to the validation criteria proposed in [
29].
3.2.2. Controlled Conditions for Dataset Generation
To ensure fairness in experiments, the Korean and English document image datasets were generated under identical conditions:
- -
Unified document background color, font type, and font size;
- -
Standardized document structure based on a university transcript template;
- -
Similar average number of sentences and words per document;
- -
Identical document forgery methods (copy–move, insertion).
These controlled conditions minimized the influence of external variables other than visual factors, ensuring the validity of cross-linguistic comparison.
3.2.3. Dataset Structure and Document Length Comparison
The structure of text complexity and document length for each dataset are shown in
Table 3.
As shown in
Table 3, each dataset differs in terms of the average number of sentences, average number of words, maximum character count, and minimum character count. These differences appear to result from the distinct document structures that make up each dataset. Compared to the two existing datasets, the custom dataset generated for this study does not exhibit any particular bias.
3.2.4. OCR Accuracy Validation
To assess the quality of the dataset, text recognition accuracy was measured using the Percentage of Correctly Recognized characters (PCR) metric, based on text extracted with Tesseract OCR. The results are shown in
Table 4.
As shown in the results of
Table 4, all three datasets exhibited very high OCR performance, and the custom-generated dataset also demonstrated sufficient recognition quality for use in actual experiments.
3.2.5. Model Performance Comparison
To validate the suitability of the datasets, the classification performance was evaluated using two document forgery detection models from previous studies [
22,
28]. All datasets were preprocessed in the same manner and converted into cropped text images using Tesseract OCR. The experimental results are presented in
Table 5.
As shown in
Table 5, the custom-generated dataset demonstrated performance comparable to the existing public datasets across both models. It produced stable results without excessively high or notably low outcomes, confirming its suitability for evaluating document forgery detection models in practical settings.
3.3. Experimental Design to Identify Differences Between Korean and English
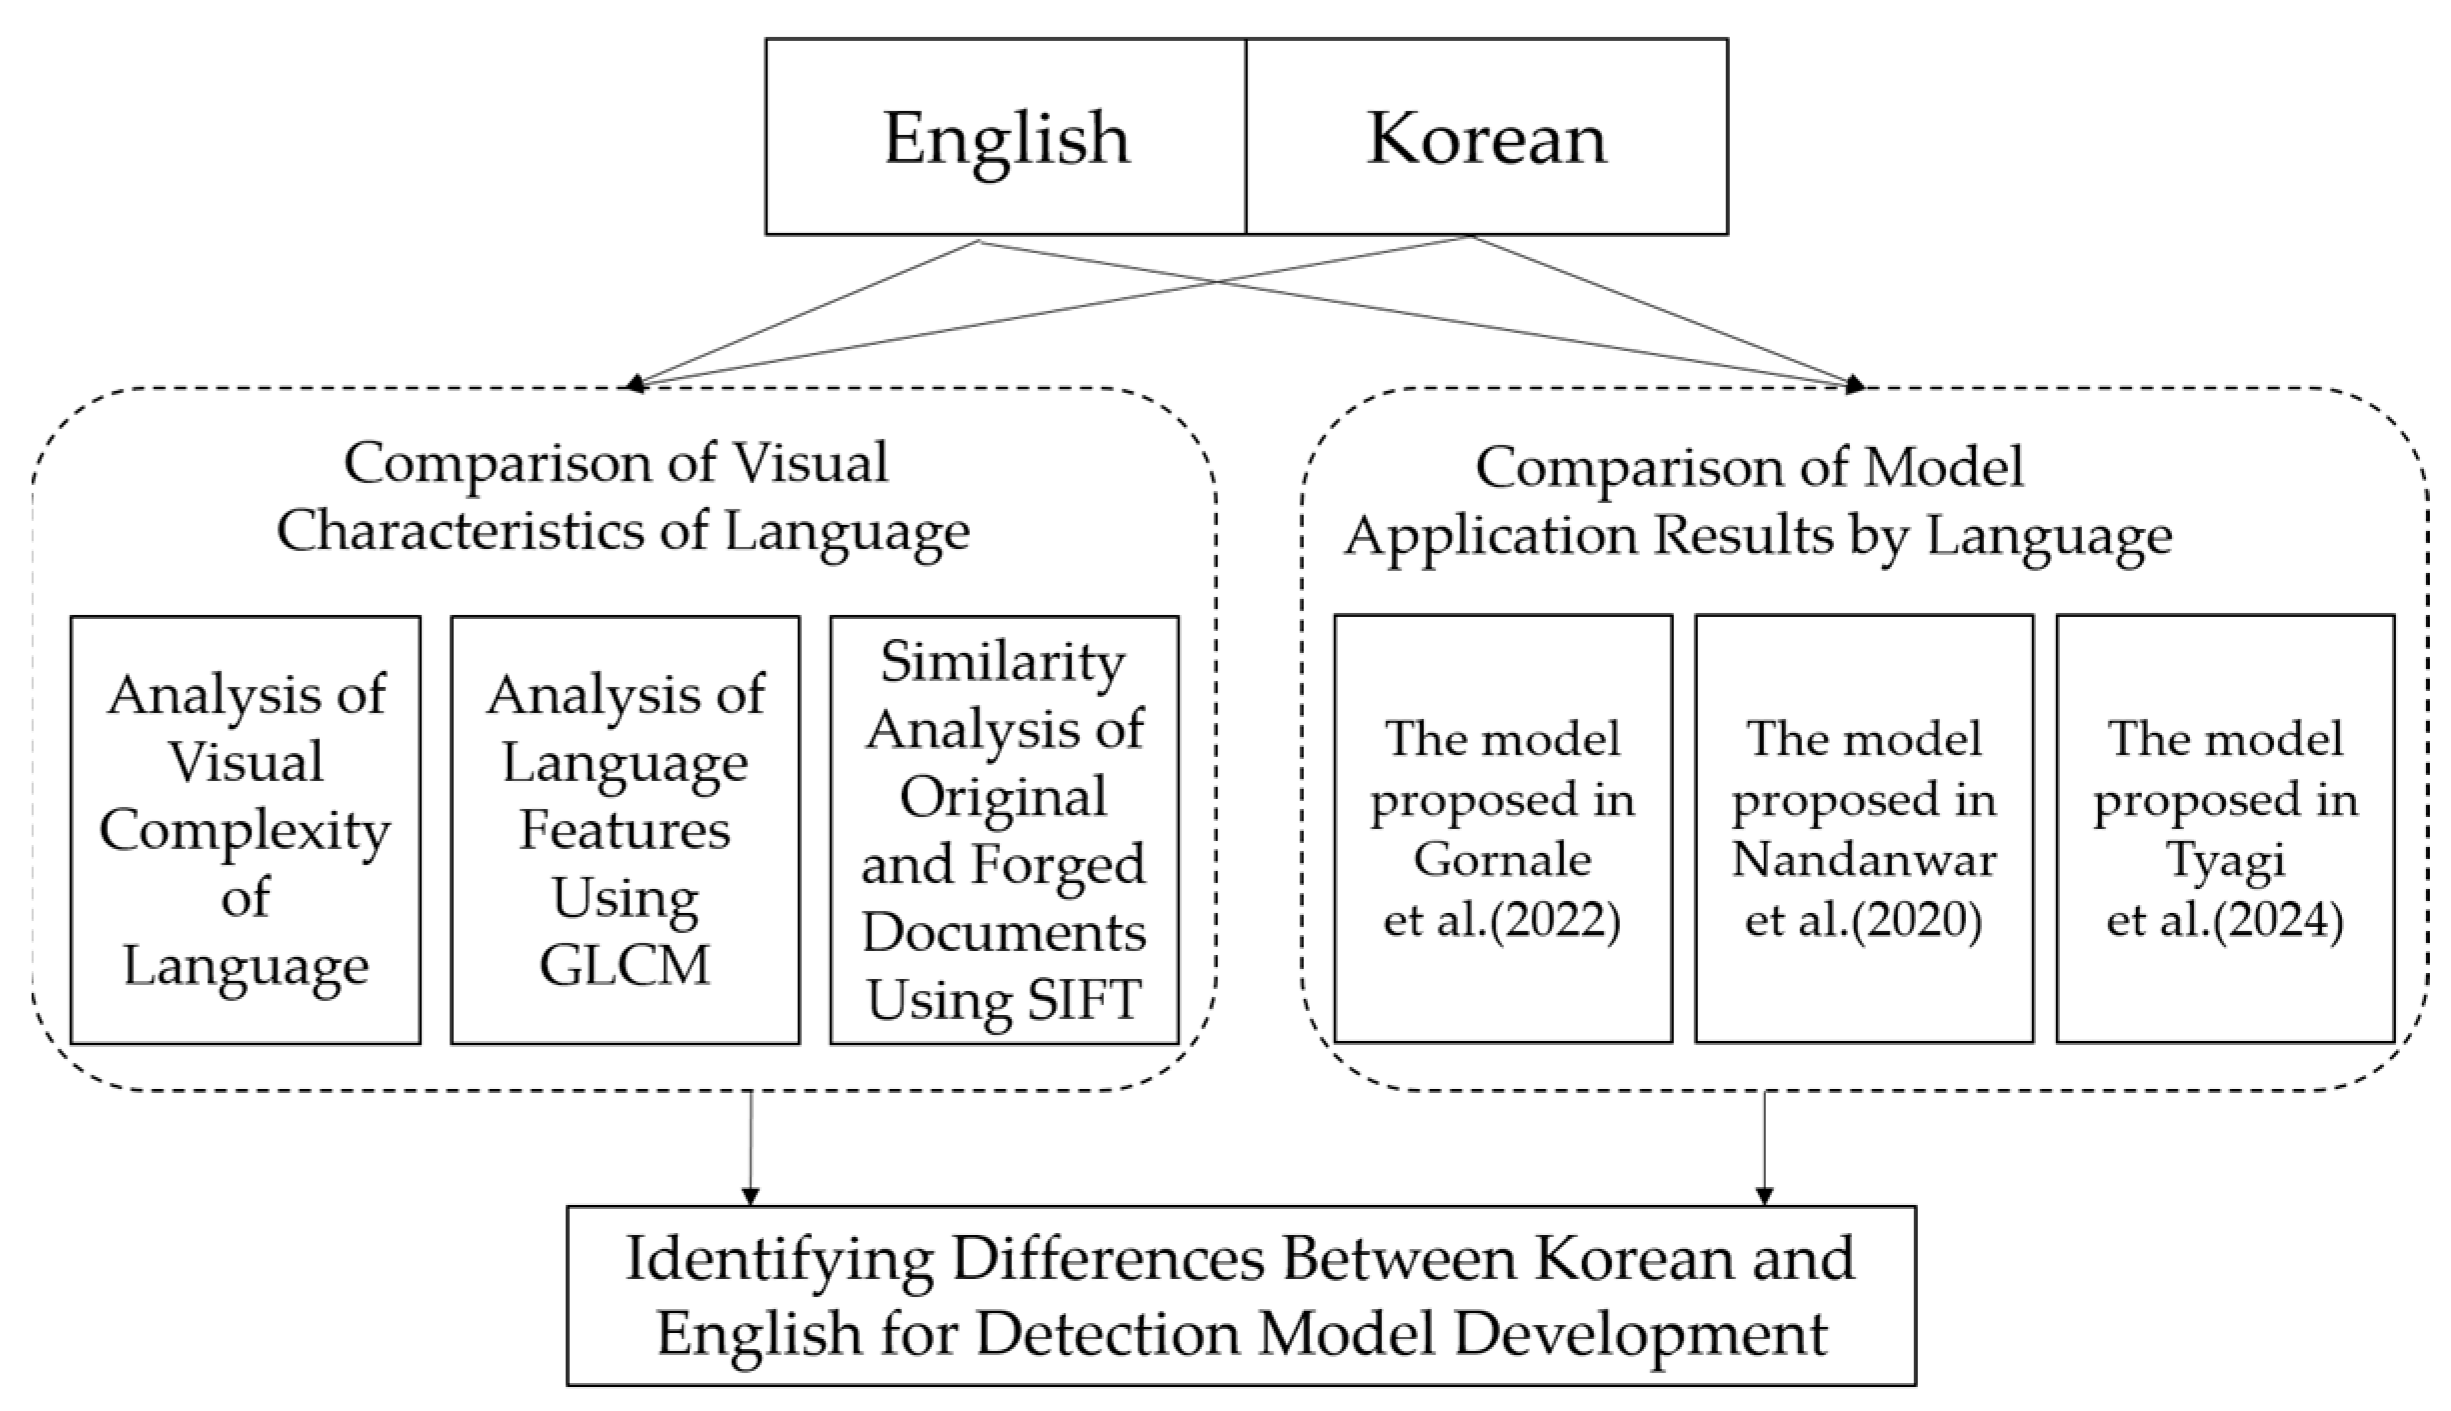
The experimental design to identify differences between English and Korean is illustrated in
Figure 4.
To analyze differences between English and Korean, experiments were designed in two areas. The first aimed to examine the visual differences of each language by adapting the method proposed in [
20] to assess visual complexity. The GLCM was utilized to analyze the spatial relationships of pixels within the images of each language. Finally, SIFT was applied to evaluate the similarity between original and forged images for each language. The second area focused on examining the results of applying English and Korean to the forgery detection models proposed in [
7,
22,
28] in order to understand how the differences between the two languages might affect the accuracy of forgery detection.
3.4. Comparison of Visual Characteristics of Language
3.4.1. Analysis of Visual Complexity
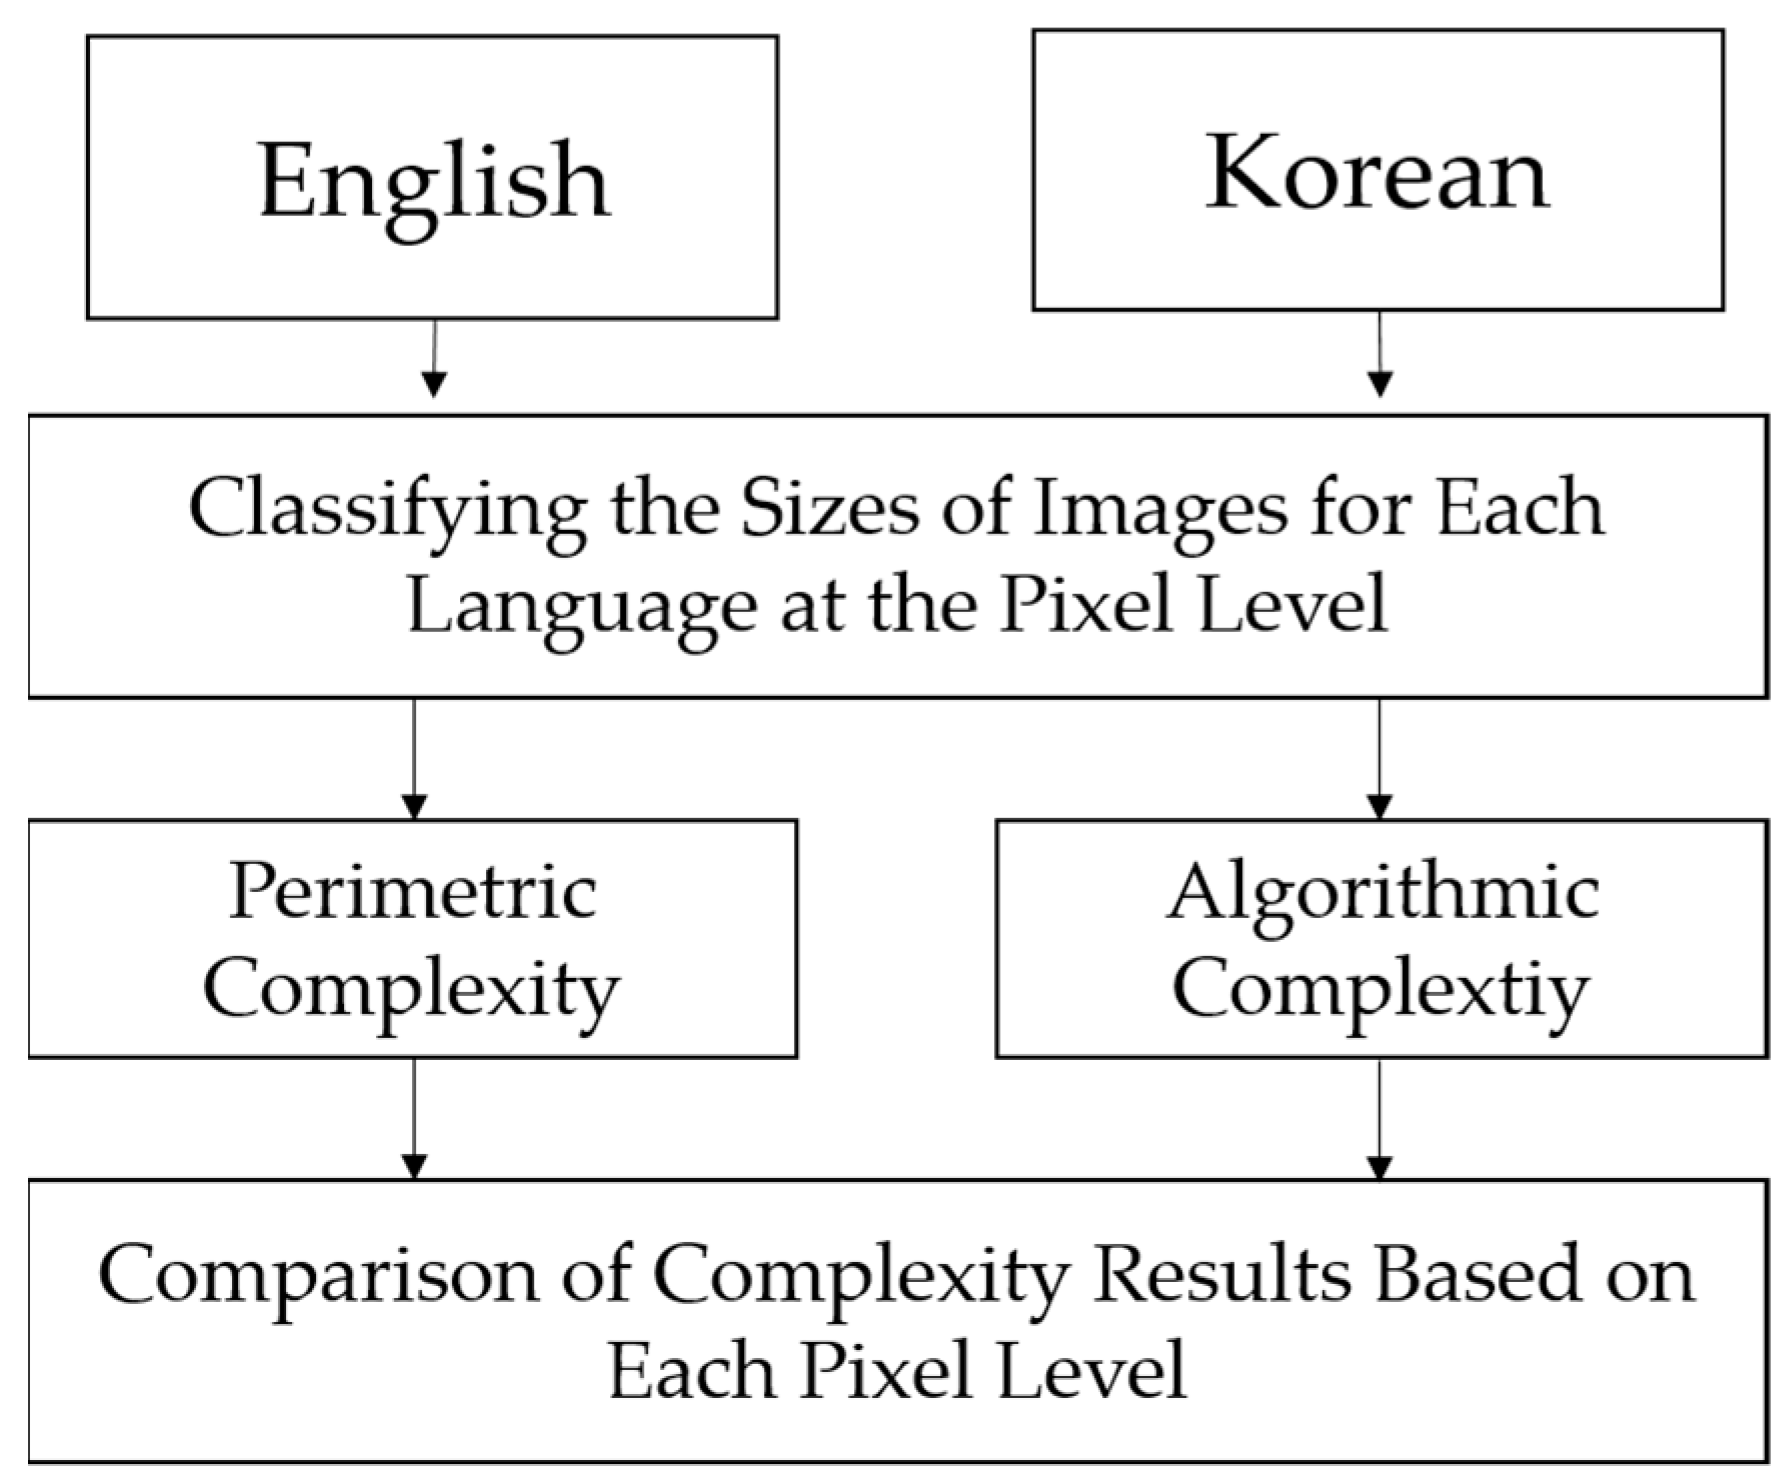
The method for analyzing the complexity of each language is illustrated in
Figure 5.
To measure visual complexity, it is first necessary to control the size of text images for each language. This is because the visual complexity can vary depending on the amount of text in each text image, regardless of the type of language. Therefore, the pixel count of each text image was calculated first, and then the counts were grouped into intervals of 500, such as 0–499, 500–999, 1000–1499, and so on. This allowed for comparisons of text images within the same pixel-level interval. After dividing the pixel ranges in this way, the perimetric complexity and algorithmic complexity of text images for each language were calculated. Perimetric complexity was calculated using Equation (1), and algorithmic complexity was calculated using Equation (6) below.
AC represents the algorithmic complexity, where S denotes the size of the compressed image file and A represents the area of the image. The algorithmic complexity calculation method proposed in [
20] measures the compressed file size of a text image. However, since the file size increases with the amount of text in each text image, this was controlled by dividing the compressed file size by the ink-filled area
, as shown in Equation (1). This approach reflects the differences in the base size and text quantity of text images, allowing for a more accurate calculation of algorithmic complexity.
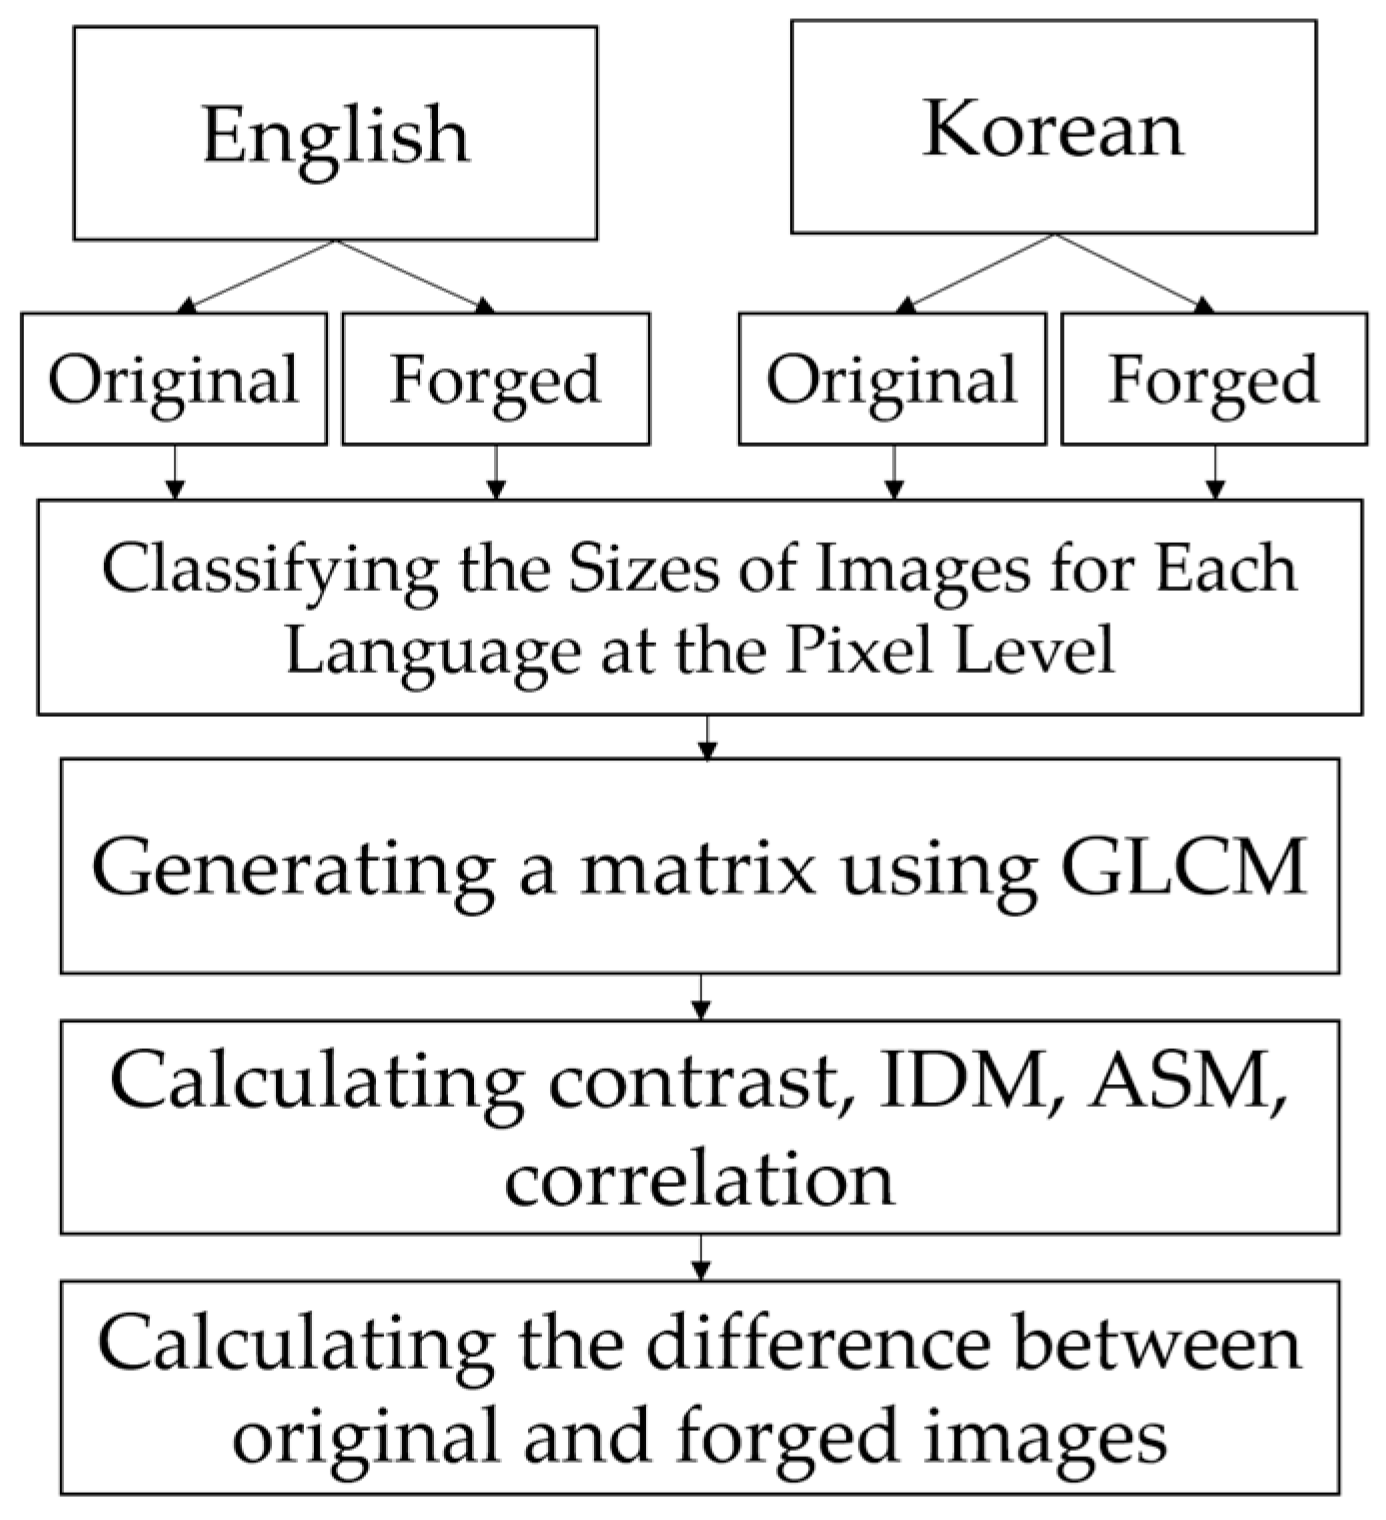
3.4.2. Analysis of Spatial Relationships Between Pixels of Text Images Using GLCM
The process of analyzing the spatial relationships between pixels in Korean and English images using the GLCM is illustrated in
Figure 6.
To analyze the spatial relationships between pixels in text images of each language using the GLCM, original and forged data for Korean and English text images were first generated. The GLCM was then applied to each dataset to calculate matrices for the text images, which were subsequently used to compute the contrast, IDM, ASM, and correlation. Since the purpose of this study is to analyze how the type of language impacts digital document forgery detection, the differences between the results of these four metrics calculated using the original data of each language and those calculated using the forged data were examined. This allows for an understanding of how the spatial relationships between pixels in text images change when they are forged for each language. Furthermore, to ensure the accuracy of the experiments, text images were grouped based on the pixel size of the text area into two ranges: 0–249 and 250–499. This step was necessary to avoid any potential influence of text image size on the results of the four metrics.
3.4.3. Similarity Measurement Between Original and Forged Data Using SIFT
The process of measuring the similarity between the original and forged text images of each language using SIFT is illustrated in
Figure 7.
The SIFT algorithm was developed to extract features that are robust to scale and rotation in images. By using this algorithm, the features of both the original and forged text images can be extracted, and their similarity can be measured through matching distance calculations. In this process, the differences between English and Korean are compared by examining how similar the forged text images are to the original text images for each language. First, as described in
Section 3.1., original and forged text images for each language are generated. Then, SIFT is applied to each dataset to extract keypoints, and the matching distances between these keypoints are measured to determine similarity. Images with lower matching distances are interpreted as having higher similarity. Additionally, text images were grouped based on text size into two ranges, 0–249 and 250–500, to ensure that the image size does not affect the similarity measurements, allowing for comparisons within the same pixel size range.
3.5. Verifying Classification Accuracy Using the Detection Model
To investigate how the type of language affects the accuracy of previously published digital document forgery detection models, the dataset generated in
Section 3.1 was applied to the models proposed in [
7,
22,
28], and the results were analyzed. In [
28], the model applies DCT transformation, a Laplacian filter, and Canny and Sobel operators to measure image quality and generate data. It then creates histogram-based information and combines it as input data for a deep learning model that classifies document images. In [
22], the GLCM is applied to each RGB color channel of the image to extract features such as contrast, homogeneity, and energy. These features are then used as input for an SVM classifier to distinguish between original and forged documents. In [
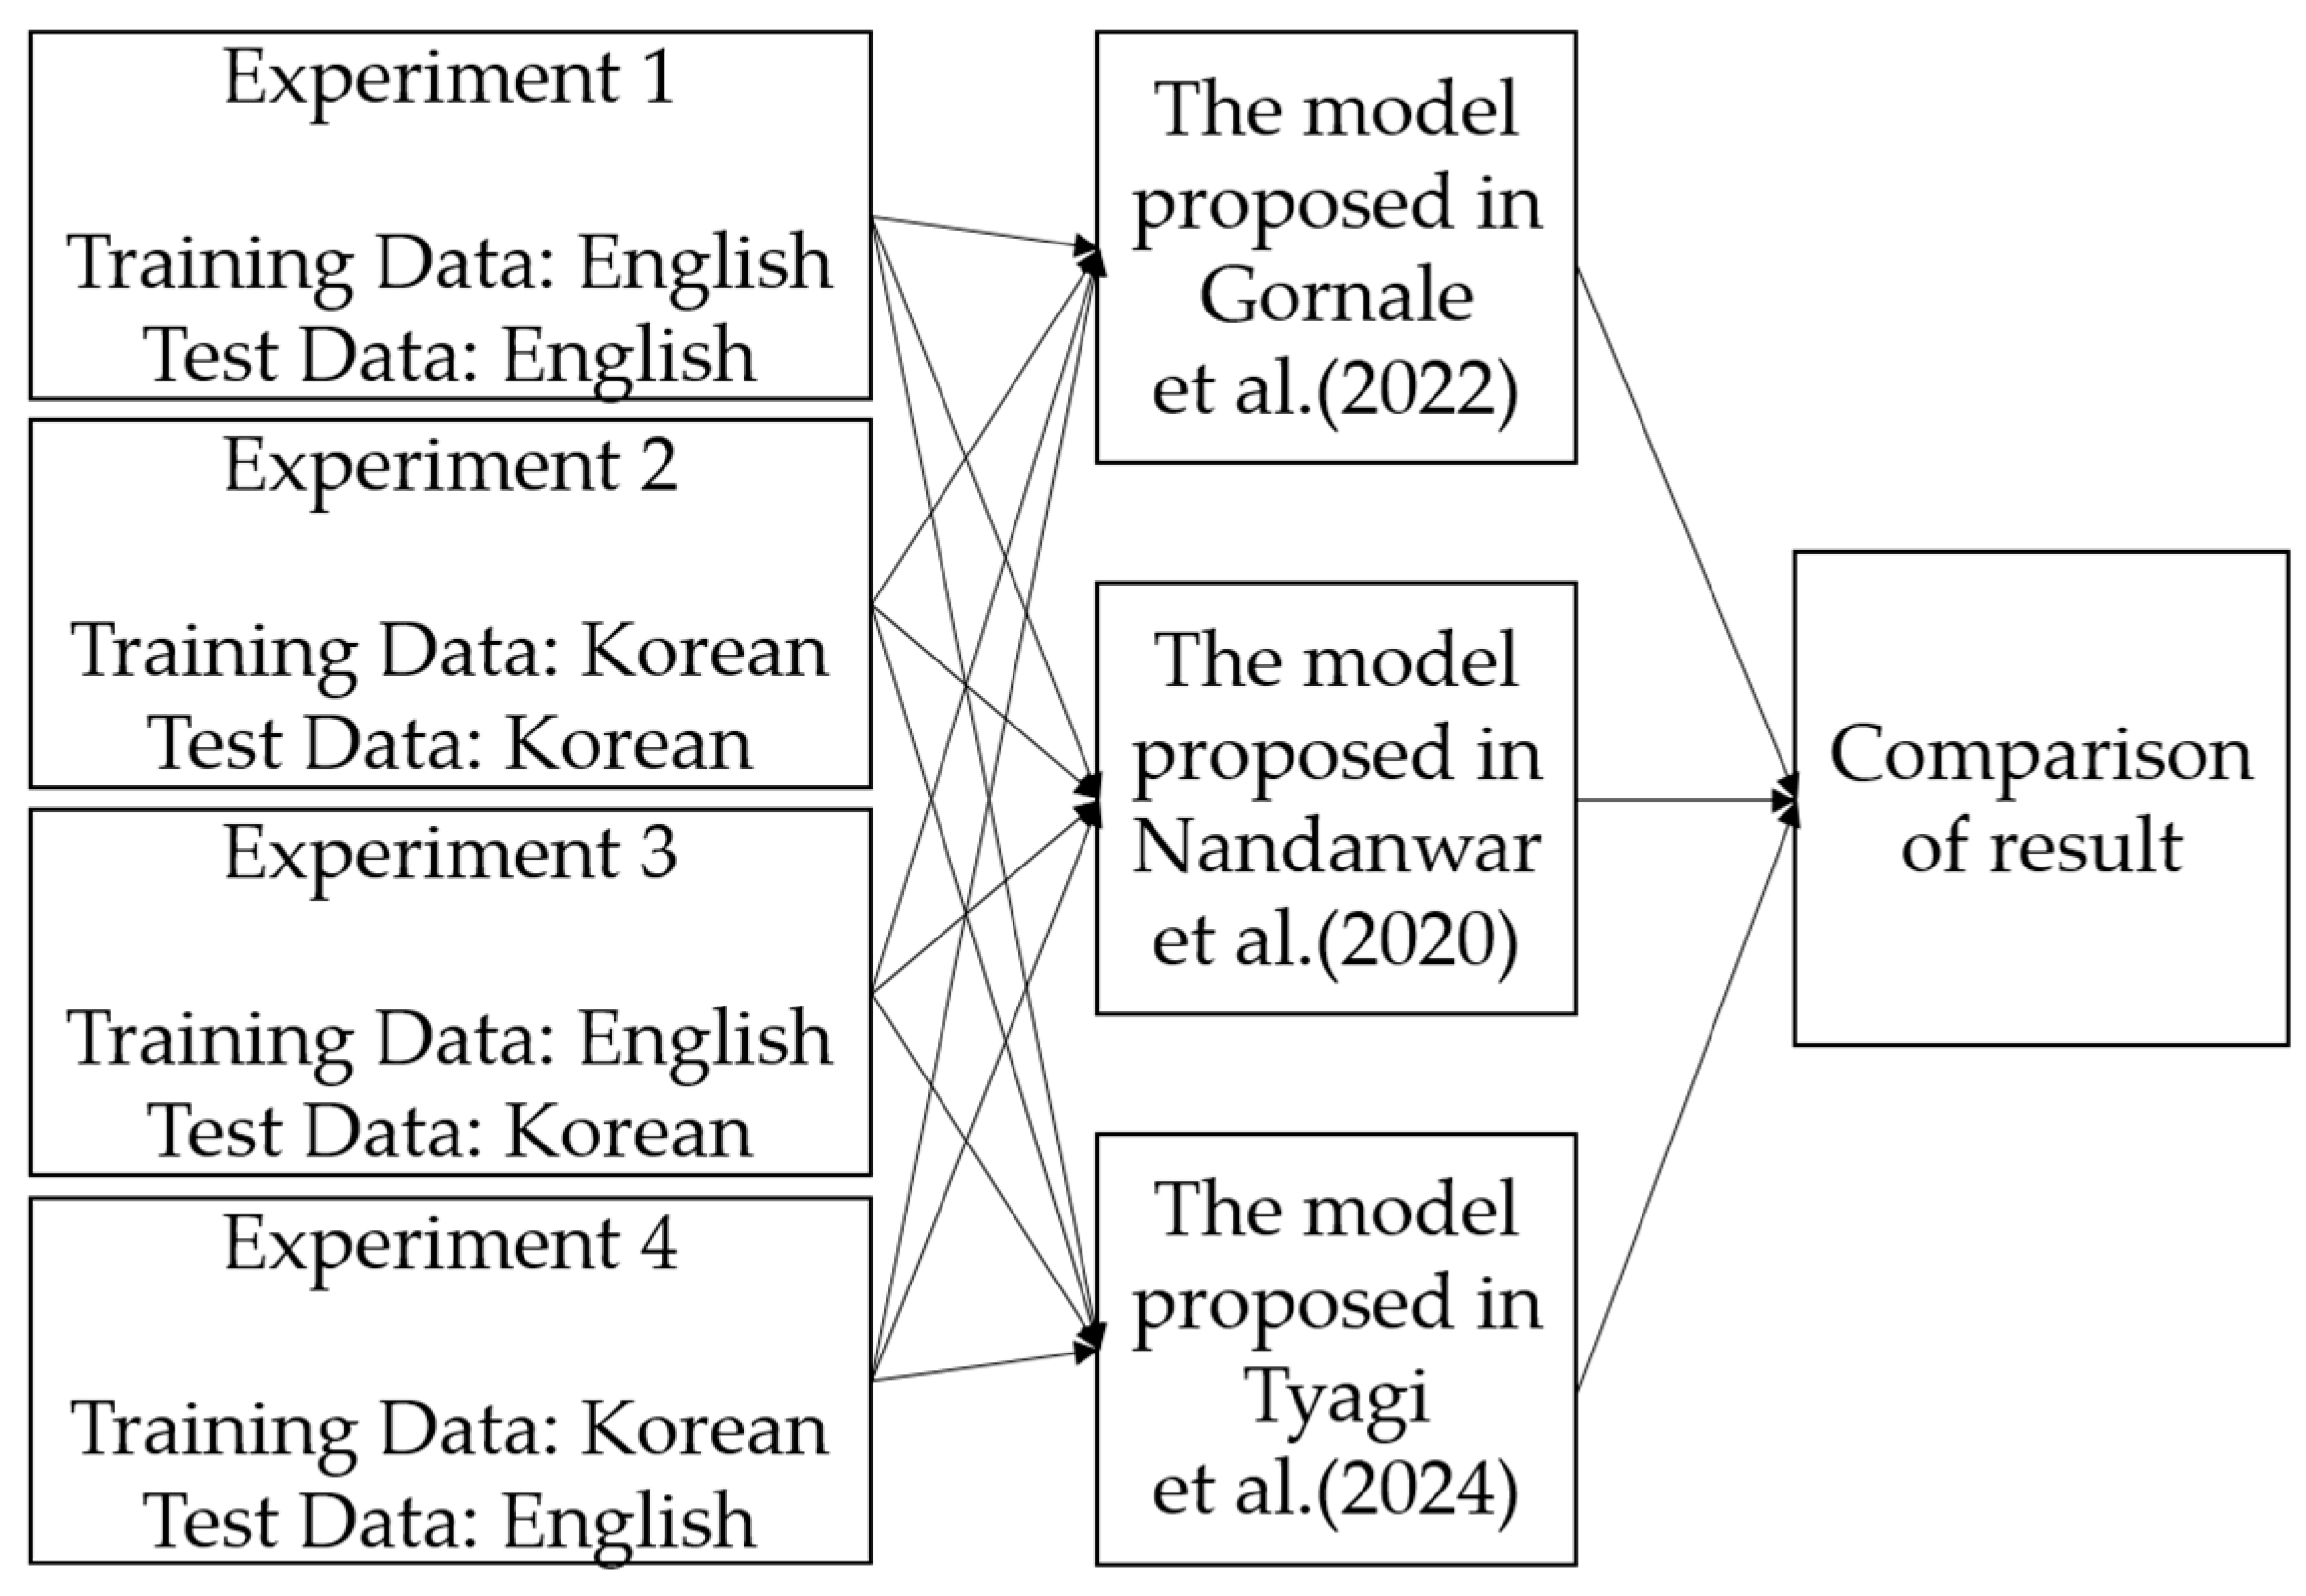
7], an unsupervised learning-based autoencoder is used to learn feature representations of document images. The encoded vectors are then used to classify whether the document is forged or not. All three models were modified to accommodate the input data used in this study. The generated dataset was applied to each model to evaluate its performance. In the first experiment, both the training and test data consisted of English documents. In the second experiment, both were Korean documents. In the third experiment, English documents were used for training and Korean documents for testing. In the fourth experiment, Korean documents were used for training and English documents for testing. By comparing the results of these four experiments, it is possible to observe the performance differences between cases where the training and test data are in the same language and where they are not. A detailed explanation of the experimental process is provided in
Figure 8.
4. Experimental Results
The experimental data utilized the datasets described in
Table 1. Among these,
Section 4.1,
Section 4.2 and
Section 4.3 were conducted using only the training data from
Table 1, as there was no need to use test data. In contrast, for experiment 4.4, both the training data and test data were used to evaluate the model’s performance after training.
4.1. Results of Visual Complexity Measurement
To compare the visual complexity of Korean and English, the perimetric complexity and algorithmic complexity, as proposed in [
20], were measured. The results are shown in
Figure 9.
Figure 9 presents a graph displaying the average perimetric and algorithmic complexities calculated using the training data from
Table 1, categorized by the number of pixels corresponding to the text regions in the images. The results indicate that both perimetric and algorithmic complexities are generally higher for Korean text than for English, with a 95% confidence interval confirming this trend. This difference arises because English is structured with 26 alphabet letters arranged linearly from left to right, contributing to a regular pattern. In contrast, Korean is composed of 14 consonants and 10 vowels, which combine in various ways to form syllabic blocks, some of which include final consonants, making it challenging to identify a consistent structure. Additionally, the complex forms created by combining consonants, vowels, and sometimes final consonants result in higher visual complexity for Korean text.
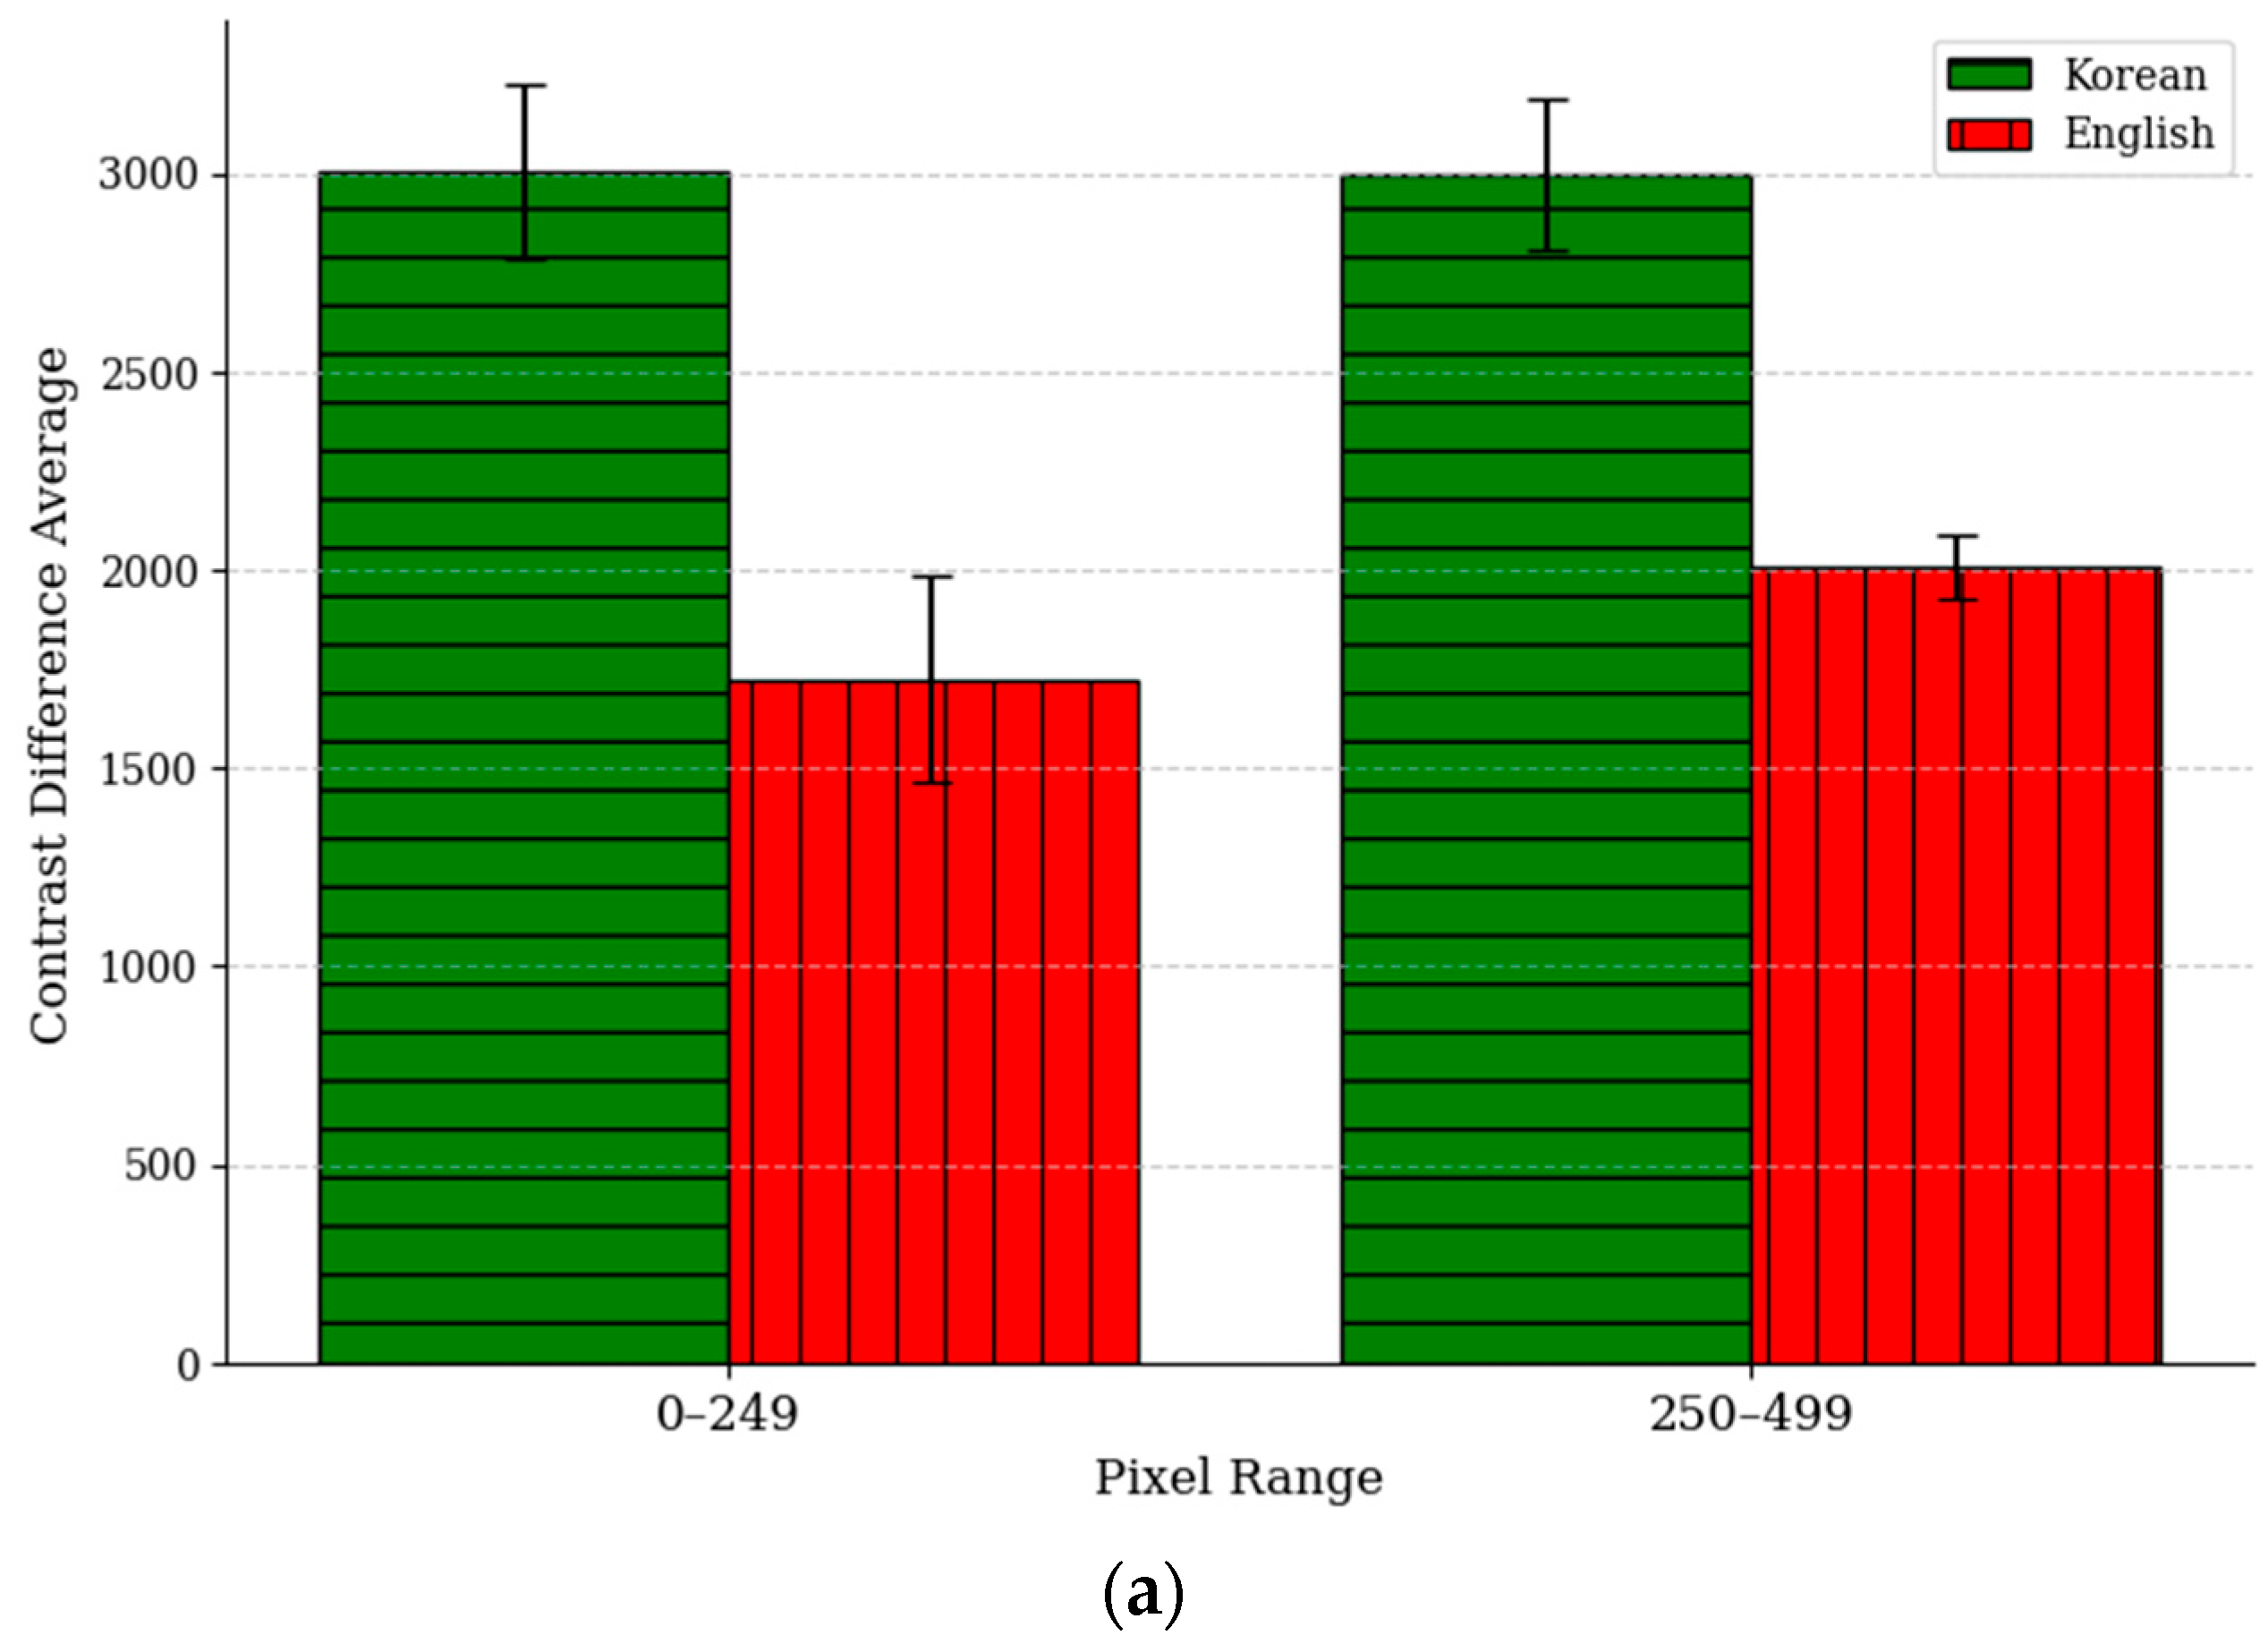
4.2. Texture Feature Analysis Using GLCM
The Gray-Level Co-occurrence Matrix (GLCM) is a technique that analyzes the spatial relationships between pixels in an image and represents the results in a matrix. The GLCM is used to calculate key texture features such as the contrast, ASM, IDM, and correlation. In this experiment, the contrast, ASM, IDM, and correlation values were measured for both Korean and English texts by comparing original images with forged images created using the copy–move and insertion methods. The purpose was to analyze the differences in texture changes when document images are forged. Each metric represents the average value of the results obtained by applying the training data in
Table 1, while the ‘Difference Average’ indicates the average difference between the values measured from the original and forged images. The method for calculating the Difference Average is expressed in Equation (7) as follows:
In Equation (7),
represents the total number of files within the pixel bin B, and
i indicates the sequence within that bin.
denotes the GLCM results for each feature of the original image, while
represents the GLCM results for each feature of the tampered image. As shown in
Figure 10, where the error bars represent 95% confidence intervals, the Difference Average value is larger for Korean in the contrast and correlation metrics when comparing the two languages, whereas it is larger for English in the ASM and IDM metrics. This can be attributed to the visual differences between Korean and English. Korean text has a complex syllable structure formed by combining consonants and vowels, resulting in densely packed characters. This complexity leads to frequent changes in grayscale values between pixels, causing significant variations in the differences between adjacent pixel grayscale values when forged. In other words, forgery significantly alters the contrast and spatial relationships between pixels in Korean text, leading to larger changes in these metrics. In contrast, English text has simpler character structures and wider spacing between characters, resulting in many uniform regions within the image. These uniform regions are more susceptible to noise or distortions when forged, causing a substantial reduction in overall uniformity. This has a significant impact on the IDM and ASM metrics, leading to higher Difference Average values for English. Korean, due to its complex structure, has inherently lower IDM and ASM values compared to English, which explains why the changes in these metrics are smaller for Korean during forgery.
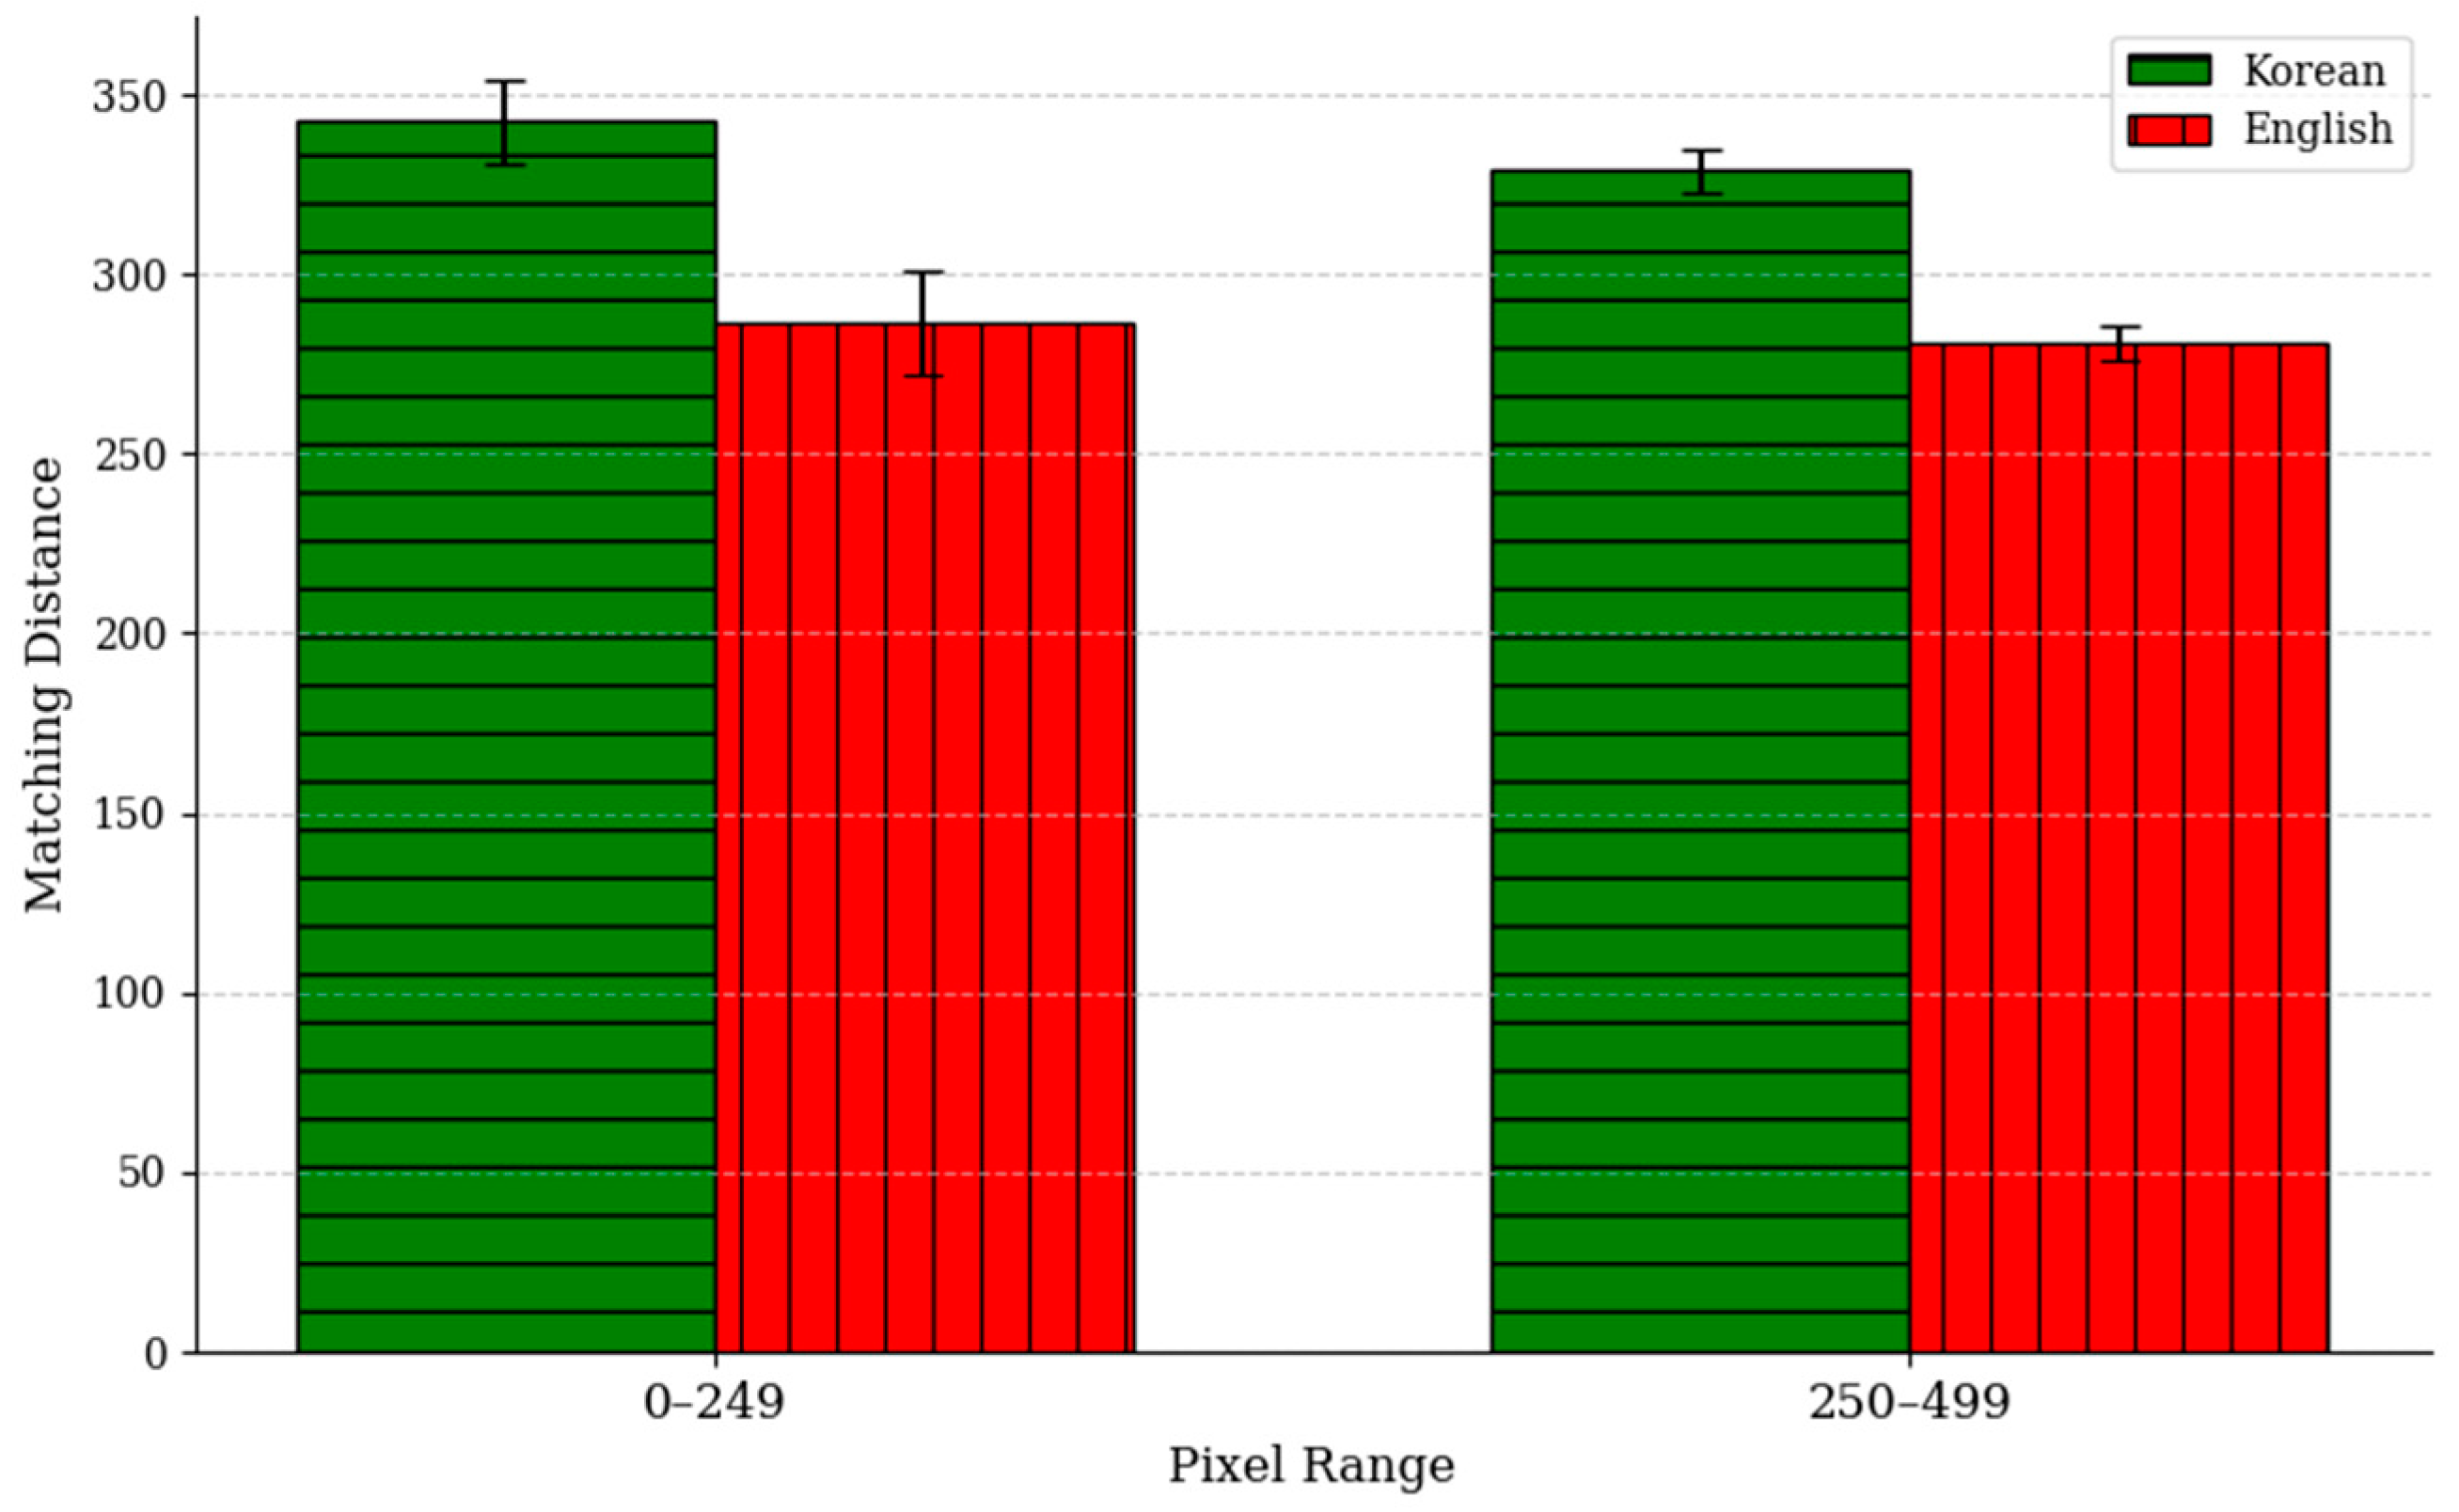
4.3. Similarity Analysis Between Original and Tampered Images Using SIFT
The comparison of the average matching distance between Korean and English text images using Scale-Invariant Feature Transform (SIFT) revealed significant differences based on the structural characteristics of the two languages. As shown in
Figure 11, statistical analysis confirmed that the matching distance for Korean text is significantly higher than that for English text (
p < 0.05), indicating notable differences in visual complexity. This can be attributed to the fact that Korean characters have a more complex structure than English ones. Korean text consists of syllabic blocks formed by combining consonants and vowels, and this block-based structure results in a densely arranged text. Due to the high complexity and density of these syllabic blocks, even slight pixel changes can significantly affect the relative positions and arrangements of keypoints, thereby increasing the matching distance. As a result, the complex and dense structure of Korean text leads to higher SIFT matching distance values compared to English text, reflecting lower similarity between the original and tampered images. On the other hand, the simpler structure and smaller number of keypoints in English text result in relatively lower matching distance values.
4.4. Results of Applying the Detection Model
In this experiment, the data presented in
Table 1 were applied to the digital document forgery detection models proposed in [
7,
22,
28] to compare the results based on the input data. To ensure reliable statistics, 5-fold cross-validation was performed on the training data, while bootstrap cross-validation with 1000 iterations was applied to the test data, and the confidence interval was set to 95%. Across all models, the performance was compared based on the language combinations used in training and testing. Consistently, the highest accuracy and F1-score were observed when both the training and testing data were in English. This was followed by the case where both were in Korean. In contrast, when the training and testing data were in different languages, the models showed relatively lower performance. As shown in
Table 6, these results suggest that the visual differences between Korean and English can affect model performance, highlighting the importance of using a unified language dataset when developing digital document forgery detection models.
5. Conclusions
In this paper, the impact of language-specific characteristics on forgery detection accuracy has been analyzed by investigating the differences in the forgery detection performance between English and Korean document images. The experimental results revealed that the visual complexity of forged documents varied by languages, and the outcomes of the digital document forgery detection models differed depending on which language’s dataset was used. These findings highlighted the limitations of relying solely on single-language datasets and emphasized the need to develop multilingual datasets and model architectures optimized for various languages.
Furthermore, this study employed the SIFT and GLCM algorithms to analyze the differences between original and forged documents in English and Korean, and the results confirmed that the forgery characteristics of English and Korean documents were distinct. In addition, the results showed that detection accuracy improved when the training and target language matched, reinforcing the necessity of language-specific datasets for effective forgery detection. Given that most available datasets for digital document forgery detection are primarily based on English and Chinese, there is a growing need to develop datasets in other languages, including Korean, to enhance detection accuracy in diverse linguistic environments.
However, this paper has certain limitations. The scope of the analysis was restricted to English and Korean documents, and the dataset size was relatively limited. Additionally, while SIFT and the GLCM were used as the primary detection methods, further research should compare these findings with results from deep learning-based forgery detection techniques. Future research should focus on developing large-scale Korean-language document forgery datasets, exploring transformer-based deep learning models, and assessing the impact of multilingual training approaches to improve generalization.
In conclusion, this paper serves as a foundational step toward enhancing the applicability of digital document forgery detection models in multilingual contexts. By developing more sophisticated detection models and constructing diverse language-based datasets, future research can contribute to the advancement of reliable and globally applicable forgery detection technology.
Author Contributions
Conceptualization, Y.-Y.B. and K.-H.J.; validation, K.-H.J. and D.-J.C.; formal analysis, Y.-Y.B. and K.-H.J.; writing—original draft preparation, Y.-Y.B. and K.-H.J.; writing—review and editing D.-J.C. and K.-H.J. All authors have read and agreed to the published version of the manuscript.
Funding
This research was supported by the Basic Science Research Program through the National Research Foundation of Korea (NRF) funded by the Ministry of Education (2021R1I1A3049788).
Institutional Review Board Statement
Not applicable.
Informed Consent Statement
Not applicable.
Data Availability Statement
The datasets used in this paper are publicly available, and their links are provided in the References Section.
Acknowledgments
We thank the anonymous reviewers for their valuable suggestions that improved the quality of this article.
Conflicts of Interest
The authors declare no conflicts of interest.
References
- Hamido, M.; Mohialdin, A.; Atia, A. The Use of Background Features, Template Synthesis and Deep Neural Networks in Document Forgery Detection. In Proceedings of the 2023 International Conference on Artificial Intelligence in Information and Communication (ICAIIC), Bali, Indonesia, 20–23 February 2023; pp. 365–370. [Google Scholar]
- Jaiswal, G.; Sharma, A.; Yadav, S.K. Deep Feature Extraction for Document Forgery Detection with Convolutional Autoencoders. Comput. Electr. Eng. 2022, 99, 107770. [Google Scholar] [CrossRef]
- Tornés, B.M.; Taburet, T.; Boros, E.; Rouis, K.; Doucet, A.; Gomez-Krämer, P.; Sidere, N.; d’Andecy, V.P. Receipt Dataset for Document Forgery Detection. In Proceedings of the 2023 17th International Conference on Document Analysis and Recognition (ICDAR), San José, CA, USA, 21–26 August 2023; pp. 454–469. [Google Scholar]
- Qu, C.; Liu, J.; Zhang, H.; Chen, Y.; Wu, Y.; Li, X.; Yang, F. Towards Robust Tampered Text Detection in Document Image: New Dataset and New Solution. In Proceedings of the 2023 IEEE/CVF Conference on Computer Vision and Pattern Recognition (CVPR), Vancouver, BC, Canada, 17–24 June 2023; pp. 5937–5946. [Google Scholar]
- EL Abady, N.F.; Zayed, H.H.; Taha, M. An Efficient Technique for Detecting Document Forgery in Hyperspectral Document Images. Alex. Eng. J. 2023, 85, 207–217. [Google Scholar] [CrossRef]
- Boonkrong, S. Design of an Academic Document Forgery Detection System. Int. J. Inf. Technol. 2024, 1–13. [Google Scholar] [CrossRef]
- Tyagi, P.; Agarwal, K.; Jaiswal, G.; Sharma, A.; Rani, R. Forged Document Detection and Writer Identification Through Unsupervised Deep Learning Approach. Multimed. Tools Appl. 2024, 83, 18459–18478. [Google Scholar] [CrossRef]
- Jaiswal, A.K.; Singh, S.; Tripathy, S.K. FSD: A Novel Forged Document Dataset and Baseline. In Proceedings of the 2023 14th International Conference on Computing Communication and Networking Technologies (ICCCNT), Delhi, India, 6–8 July 2023; pp. 1–6. [Google Scholar]
- Tornés, B.M.; Boros, E.; Doucet, A.; Gomez-Krämer, P.; Ogier, J.M. Detecting Forged Receipts with Domain-Specific Ontology-Based Entities & Relations. In Proceedings of the Document Analysis and Recognition—ICDAR 2023, San José, CA, USA, 21–26 August 2023; Lecture Notes in Computer Science. Springer: Berlin/Heidelberg, Germany, 2023; Volume 14189. [Google Scholar]
- Dash, R.; Bag, M.; Pattnayak, D.; Mohanty, A.; Dash, I. Automated Signature Inspection and Forgery Detection Utilizing VGG-16: A Deep Convolutional Neural Network. In Proceedings of the 2023 2nd International Conference on Ambient Intelligence in Health Care (ICAIHC), Bhubaneswar, India, 17–18 November 2023; pp. 01–06. [Google Scholar]
- Ebrahimpour, N. Handwritten Signatures Forgery Detection Using Pre-Trained Deep Learning Methods. In Proceedings of the 2nd International Congress of New Horizons in Sciences, İstanbul, Türkiye, 20–21 May 2023. [Google Scholar]
- Zaman, Z.; Ahmed, S.B.; Malik, M.I. Analysis of Hyperspectral Data to Develop an Approach for Document Images. Sensors 2023, 23, 6845. [Google Scholar] [CrossRef] [PubMed]
- Shinde, A.; Patil, G.; Kumar, S. Document Image Forgery and Detection Methods Using Image Processing Techniques—A Review. Int. Res. J. Mod. Eng. Technol. Sci. 2022, 4, 1077–1101. [Google Scholar]
- Kleber, F.; Fiel, S.; Diem, M.; Sablatnig, R. CVL-DataBase: An Off-Line Database for Writer Retrieval, Writer Identification and Word Spotting. In Proceedings of the 2013 12th International Conference on Document Analysis and Recognition, Washington, DC, USA, 25–28 August 2013; pp. 560–564. [Google Scholar]
- Shahab, A.; Shafait, F.; Dengel, A. ICDAR 2011 Robust Reading Competition Challenge 2: Reading Text in Scene Images. In Proceedings of the 2011 International Conference on Document Analysis and Recognition, Beijing, China, 18–21 September 2011; pp. 1491–1496. [Google Scholar]
- Mahmoud, S.A.; Ahmad, I.; Al-Khatib, W.G.; Alshayeb, M.; Tanvir Parvez, M.; Märgner, V.; Fink, G.A. KHATT: An open Arabic offline handwritten text database. Pattern Recognit. 2014, 47, 1096–1112. [Google Scholar] [CrossRef]
- Artaud, C.; Sidère, N.; Doucet, A.; Ogier, J.-M.; Yooz, V.P.D. Find it! Fraud Detection Contest Report. In Proceedings of the 2018 24th International Conference on Pattern Recognition (ICPR), Beijing, China, 20–24 August 2018; pp. 13–18. [Google Scholar]
- Shivakumara, P.; Basavaraja, V.; Gowda, H.S.; Guru, D.S.; Pal, U.; Lu, T. A New RGB Based Fusion for Forged IMEI Number Detection in Mobile Images. In Proceedings of the 2018 16th International Conference on Frontiers in Handwriting Recognition (ICFHR), Niagara Falls, NY, USA, 5–8 August 2018; pp. 386–391. [Google Scholar]
- Halder, B.; Garain, U. Color Feature Based Approach for Determining Ink Age in Printed Documents. In Proceedings of the 2010 20th International Conference on Pattern Recognition, Istanbul, Turkey, 23–26 August 2010; pp. 3212–3215. [Google Scholar]
- Miton, H.; Morin, O. Graphic Complexity in Writing Systems. Cognition 2021, 214, 104771. [Google Scholar] [CrossRef] [PubMed]
- Shaharom, M.F.M.; Tahar, K.N. Multispectral Image Matching Using SIFT and SURF Algorithm: A Review. Int. J. Geoinformatics 2023, 19, 13–21. [Google Scholar]
- Gornale, S.S.; Patil, G.; Benne, R. Document Image Forgery Detection Using RGB Color Channel. Trans. Eng. Comput. Sci. 2022, 10, 1–14. [Google Scholar] [CrossRef]
- Zanardelli, M.; Guerrini, F.; Leonardi, R.; Adami, N. Image Forgery Detection: A Survey of Recent Deep-Learning Approaches. Multimed. Tools Appl. 2023, 82, 17521–17566. [Google Scholar] [CrossRef]
- Haralick, R.M.; Shanmugam, K.; Dinstein, I. Textural Features for Image Classification. IEEE Trans. Syst. Man Cybern. 1973, SMC-3, 610–621. [Google Scholar] [CrossRef]
- Fatima, B.; Ghafoor, A.; Ali, S.S.; Wahab, A.U.; Hussain, S. FAST, BRIEF and SIFT Based Image Copy-Move Forgery Detection Technique. Multimed. Tools Appl. 2022, 81, 43805–43819. [Google Scholar] [CrossRef]
- Lowe, D.G. Distinctive Image Features from Scale-Invariant Keypoints. Int. J. Comput. Vis. 2004, 60, 91–110. [Google Scholar] [CrossRef]
- Kohavi, R. A study of cross-validation and bootstrap for accuracy estimation and model selection. In Proceedings of the 14th International Joint Conference on Artificial Intelligence, Montreal, QC, Canada, 20–25 August 1995; Volume 2, pp. 1137–1143. [Google Scholar]
- Nandanwar, L.; Shivakumara, P.; Pal, U. A New Method for Detecting Altered Text in Document Images. In Proceedings of the Pattern Recognition and Artificial Intelligence, ICPRAI 2020, Zhongshan, China, 19–23 October 2020; Lecture Notes in Computer Science. Lu, Y., Vincent, N., Yuen, P.C., Zheng, W.S., Cheriet, F., Suen, C.Y., Eds.; Springer: Cham, Switzerland, 2020; Volume 12068. [Google Scholar]
- Bulatov, K.B.; Emelianova, E.V.; Tropin, D.V.; Skoryukina, N.S.; Chernyshova, Y.S.; Sheshkus, A.V.; Usilin, S.A.; Ming, Z.; Burie, J.-C.; Luqman, M.M.; et al. MIDV-2020: A Comprehensive Benchmark Dataset for Identity Document Analysis. Comput. Opt. 2022, 46, 252–270. [Google Scholar] [CrossRef]
| Disclaimer/Publisher’s Note: The statements, opinions and data contained in all publications are solely those of the individual author(s) and contributor(s) and not of MDPI and/or the editor(s). MDPI and/or the editor(s) disclaim responsibility for any injury to people or property resulting from any ideas, methods, instructions or products referred to in the content. |
© 2025 by the authors. Licensee MDPI, Basel, Switzerland. This article is an open access article distributed under the terms and conditions of the Creative Commons Attribution (CC BY) license (https://creativecommons.org/licenses/by/4.0/).


