Article

Understanding Oxygen Concentrator Failures in Low Resource Settings: The Role of Dust and Humidity

1
Unit of Chemical-Physics Fundamentals in Chemical Engineering, Department of Science and Technology for Sustainable Development and One Health, Università Campus Bio-Medico di Roma, Via Alvaro del Portillo, 21, 00128 Rome, Italy
2
Unit of Intelligent Health Technologies, Department of Engineering, Sustainable Design Management and Assessment, Università Campus Bio-Medico di Roma, Via Alvaro del Portillo, 21, 00128 Rome, Italy
3
Department of Chemistry, University of Warwick, Coventry CV4 7AL, UK
4
Department of Biomedical Sciences, Ernest Cook Ultrasound Research and Education Institute, Sir Albert Cook Building, Mengo Hospital Kampala, Kampala P.O. Box 7161, Uganda
5
School of Engineering, University of Warwick, Coventry CV4 7AL, UK
*
Author to whom correspondence should be addressed.
Appl. Sci. 2025, 15(8), 4311; https://doi.org/10.3390/app15084311
Submission received: 20 March 2025 / Revised: 9 April 2025 / Accepted: 10 April 2025 / Published: 14 April 2025
(This article belongs to the Section Green Sustainable Science and Technology)

Abstract

:
Oxygen concentrators (OCs) are essential medical devices providing oxygen in various settings, especially low-resource settings (LRSs). Despite their adaptability and cost-effectiveness, challenges arise in such environments due to factors like dust, temperature, and humidity, leading to premature OC failure. While efforts have been made to address these issues, understanding the primary contributing factor remains unclear. This study aims to shed light on this matter through the analysis of exhausted zeolite samples from Uganda, Ethiopia, and South Africa alongside a commercial virgin sample. The samples were comprehensively characterized through powder X-ray diffraction (PXRD) analysis, wavelength dispersive X-ray fluorescence (WDXRF) elemental analysis, Brunauer–Emmett–Teller (BET) surface analysis, and thermo-gravimetric analysis (TGA) coupled with mass spectrometry (MS). The characterization results confirmed a low silicon X-type framework (FAU-LSX) for all the samples. The maximum mass loss during TGA tests occurred at 130–160 °C, suggesting that water is the main component released from the zeolites. This was confirmed by MS analysis, which revealed the predominance of water in all the sample matrices. A correlation was found between OC efficiency and the amount of water adsorbed by the zeolites, proving that humidity has a key role in causing OC malfunctioning. No evidence for the presence of dust as a contaminant in the zeolites was found by the absence of the expected chemical elements in WDXRF. Since the outcomes of the study are independent of the geographical origin of the zeolites, its findings provide general guidance for engineers to modify OCs and prevent zeolite moisture poisoning.

1. Introduction

Oxygen concentrators (OCs) are medical devices that efficiently supply oxygen in various healthcare settings or at home, particularly where traditional oxygen delivery systems are impractical or unavailable [1]. They are crucial in medical settings, especially when treating conditions that cause low blood oxygen levels, such as respiratory diseases, and during certain medical emergencies [2,3]. OCs are designed to provide medical-grade oxygen from normal environment air, which is mainly made up of nitrogen (78.08%) and oxygen (20.95%). They do so by filtering out nitrogen from the air and, therefore, concentrating oxygen, relying on pressure swing adsorption (PSA) technology [4] and vacuum pressure adsorption (VPA) [5]. PSA technology is a widely used method for gas separation and purification, which utilizes the adsorptive properties of molecular sieves such as zeolites [6]. After extensive investigation to optimize oxygen concentration devices, it was determined that the most efficient zeolites for this task are the X-type, including NaX, LiX, and LiLSX (with low Si content, Si/Al~1 molar ratio). These zeolites are highly selective for the adsorption of nitrogen and therefore able to generate an air stream rich in oxygen [7].
The adaptability of OCs to different medical needs and environments, from hospitals to remote locations, has proven to be a vital resource during emergencies and pandemics [8]. OCs are cost-effective and lightweight, making them suitable for use in military zones, during disasters, and especially in LRSs, including rural areas [9]. However, at present, the majority of the medical device market is dominated by high-income countries (HICs) such as the USA, many European nations, and Japan. These countries establish and adhere to standard practices and requirements that may not be tailored to or feasible in settings with limited resources [10]. OCs are primarily designed in and for HICs [11]. Consequently, when used in countries with limited infrastructure, their effectiveness and safety may be limited [12].
An illustrative example is portrayed by the various challenges that sub-Saharan African countries face, including a scarcity of funding, medical and biomedical specialized expertise, and a functional health technology management and supply chain, and harsh environmental conditions (e.g., temperature, humidity, and dust), amongst others [13,14]. In such scenarios, power outages are common events [15] that threaten the safe, efficient, and continuous functioning of medical devices, jeopardizing users’ and patients’ lives. To partially address such challenges, several studies have focused on designing low-pressure oxygen storage systems [16,17,18] and medium-pressure storage systems [19] to supply oxygen for patients during power outages. Although the contamination of zeolites used in oxygen production by PSA is a well-known issue in the adsorption field [20], manufacturers often fail to consider the real environmental challenges mentioned above. OCs and the molecular sieves they contain are quite sensitive to dust and humidity and may not be resilient enough for this kind of environment given their current design. As shown in Figure 1, OCs are currently equipped with an inlet filter to prevent contamination of the zeolites from environmental agents. Despite the fact that the inlet filters could be easily replaced with new ones, they are evidently not tailored to work in harsh environmental conditions [21]. As a consequence, both the molecular sieves and the inlet filter they rely on stop working efficiently after fewer hours of use than expected [22]. Some of the authors of this paper have previously proposed a solution [23] by redesigning the inlet filter of an oxygen concentrator using activated charcoal to prevent the entrance of gross particles into the device, obtaining satisfactory results, but not reaching the performance of the benchmark. Moreover, tropical countries frequently experience ambient conditions of 40 °C and 95% relative humidity simultaneously, and malfunctions of different OC models operating in such conditions have also been proven [24]. Therefore, dust, temperature, and humidity can be considered as the main factors contributing to the premature failure of oxygen concentrators operating LRSs. However, to the best of our knowledge, it is not well understood which one among them plays the major role in OC failure. The aim of this paper is to take a step forward in answering this question. To do so, exhausted zeolite samples of OCs adopted in medical environments were collected from different African countries: Uganda, South Africa, and Ethiopia. All the samples were subjected to a range of analytical techniques to confirm the sample identity and detect the presence of dust, moisture, and any organic compounds. Addressing this issue is crucial, as oxygen concentrators play a vital role in providing affordable and accessible medical oxygen, aligning with the target of several United Nations sustainable development goals (SDGs) [25]. Hence, an additional target of the work is to provide suggestions for engineering improvements of OCs, enhancing their working lifetime and their sustainability.

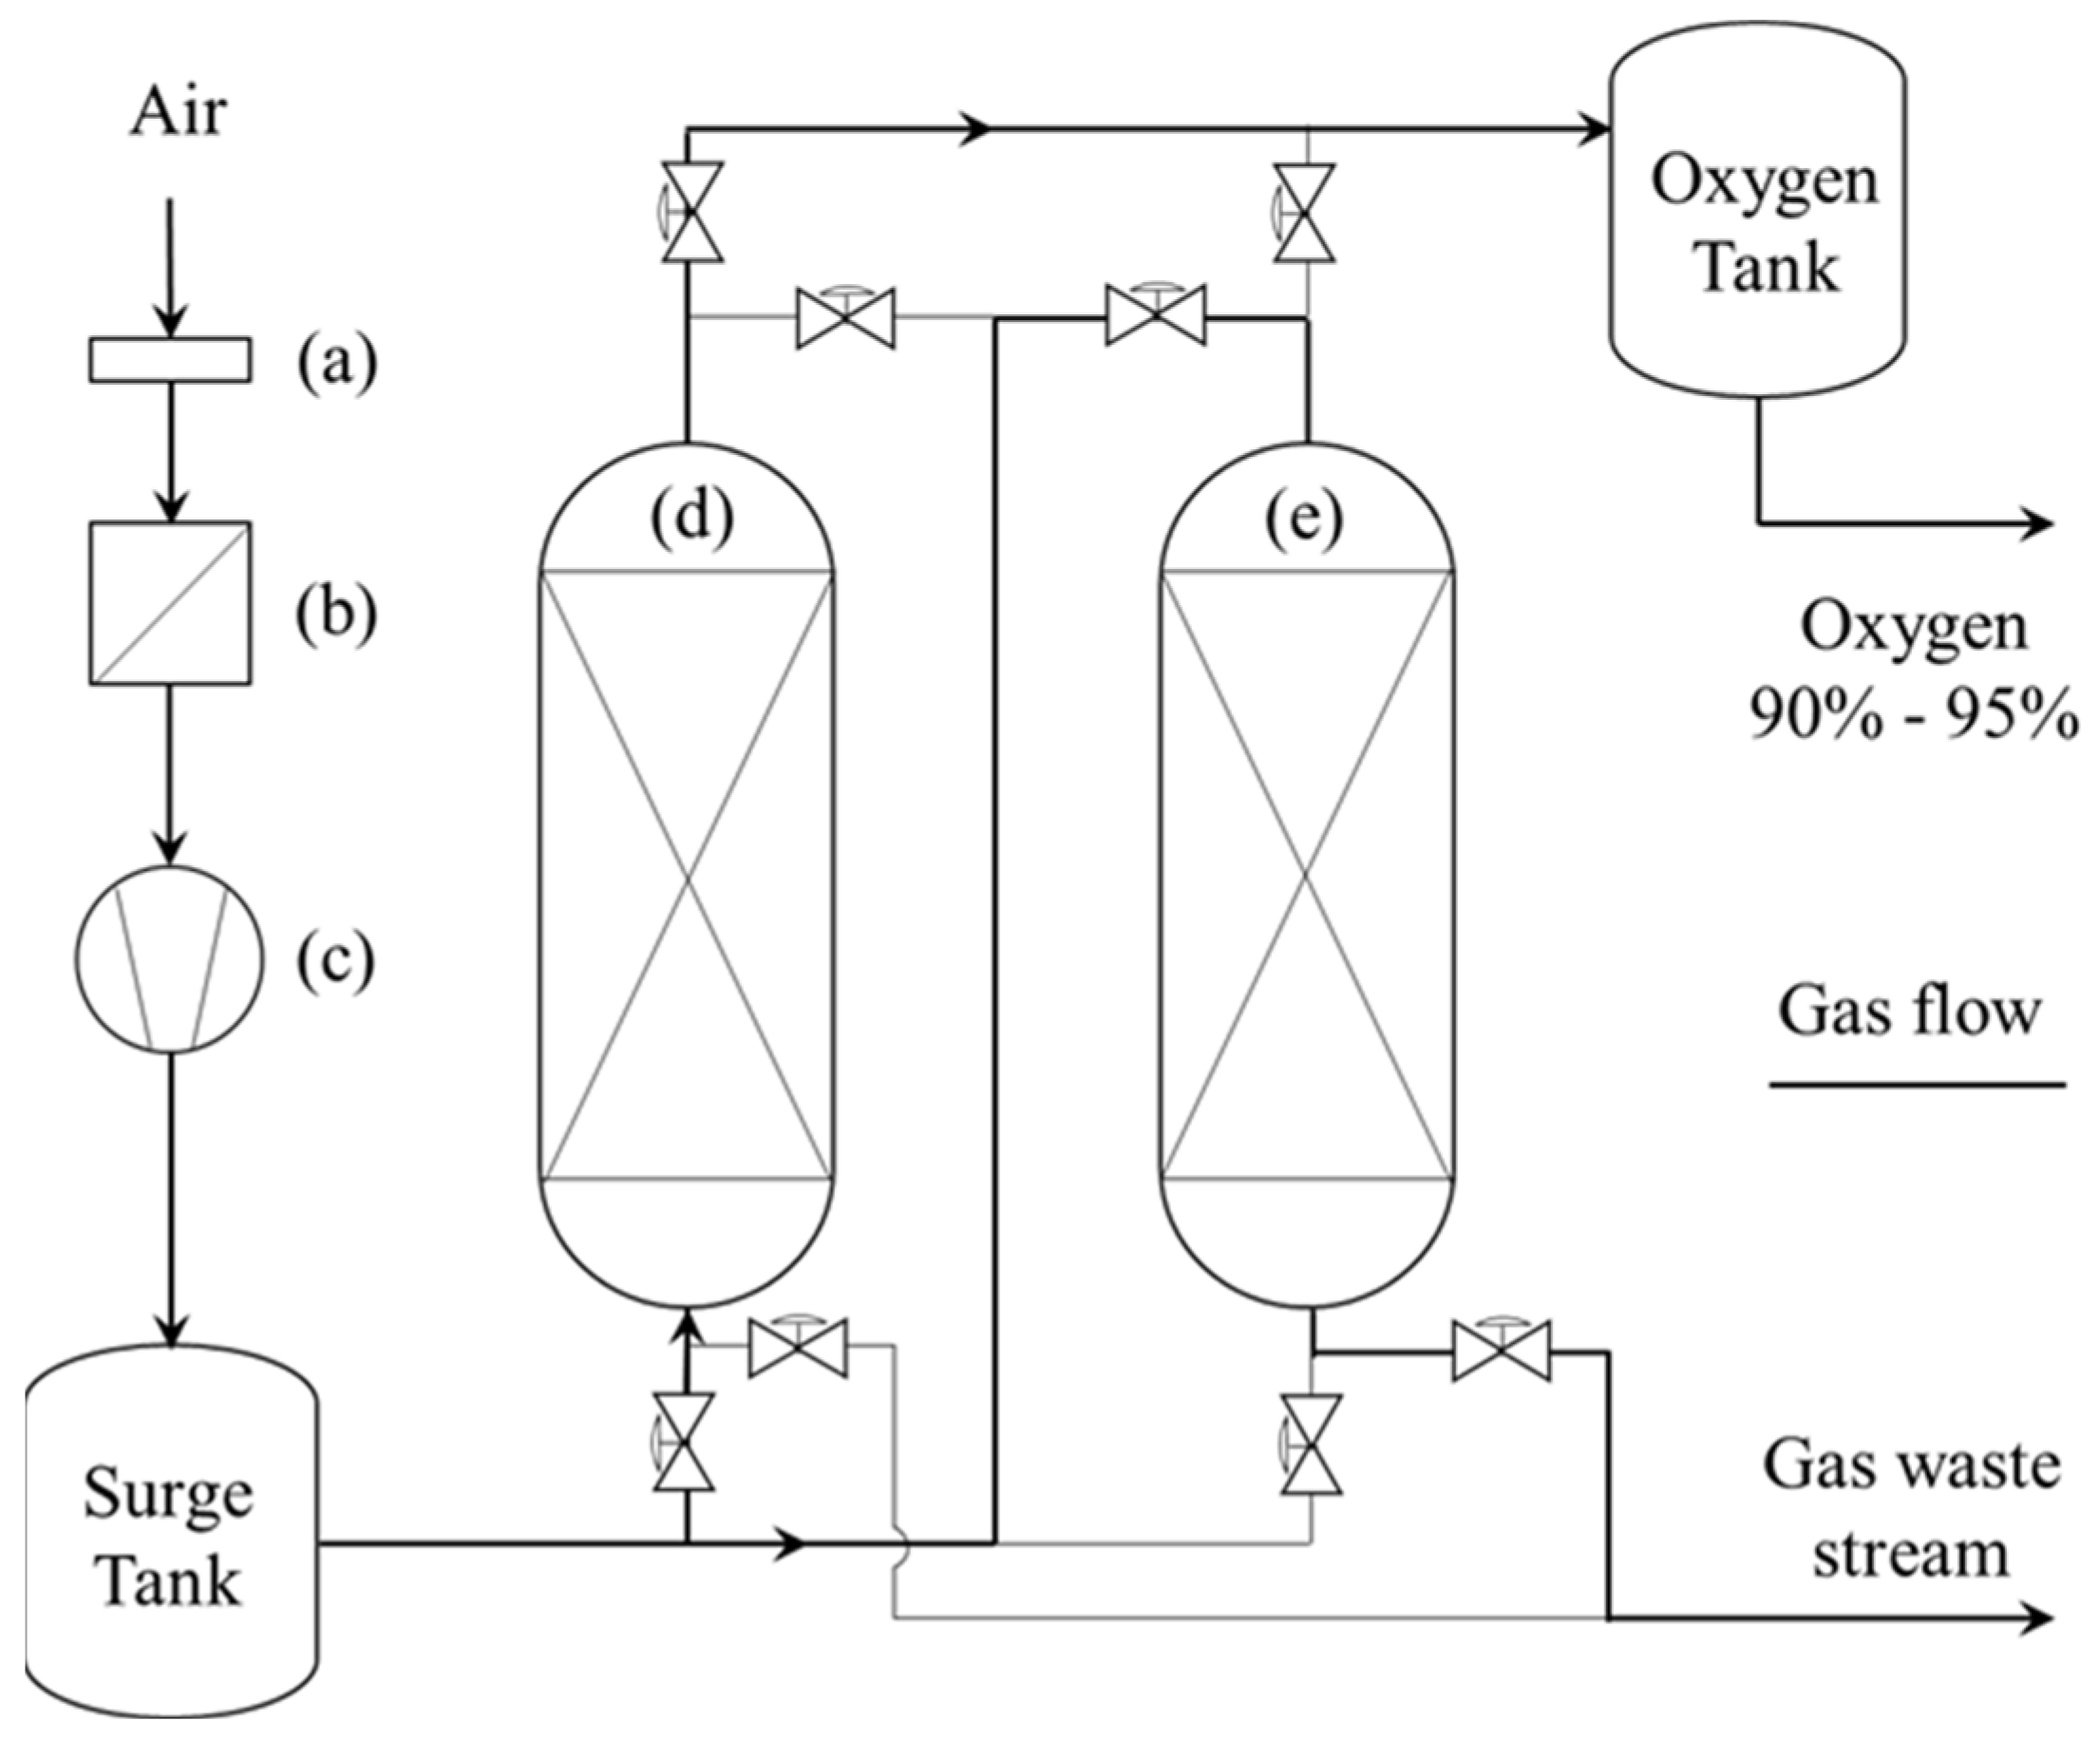
2. Materials and Methods

2.1. Zeolite Samples

Synthetic zeolite samples were collected from three different African regions: Ethiopia, Uganda, and South Africa. All the samples were recovered from the canisters of oxygen concentrators (OCs) employed in a relevant medical environment. In particular, the samples from Ethiopia, renamed E-1 and E-2, were provided by the Nekemte Specialized Hospital and Shashemene General Hospital, respectively. The samples from Uganda, identified as U-1 and U-2, were provided by the Mbarara Regional Referral Hospital and St. Francis Hospital Nsambya, respectively. The sample from South Africa (SA) was provided by the University of Cape Town. For each zeolite sample, the oxygen purity (% v/v) outgoing from the OC at the sampling time was also recorded and is reported in Table 1. Unfortunately, some other information, such as the amount of working operation time and the model of the OC, was not available for every sample. Table 1 summarizes all the main information available for the samples. Commercial 13X zeolite, identified as C-X, was purchased from Themo Scientific (CAS 63231-69-6) and constituted a benchmark to compare the characterization results of the zeolites used in the field. All the zeolite samples were ground into powder prior to analytical measurements. Additionally, special care was taken to minimize their exposure to open air: whenever possible, the canisters were shipped directly to the experimental lab, allowing the zeolites to be removed in situ just before analysis. In other cases, the samples were stored in sealed Falcon tubes and only opened immediately before testing.

2.2. Zeolite Characterization and Instrumentation

Powder X-ray diffraction (PXRD) analysis was carried out using a Panalytical Empyrean diffractometer (Malvern Panalytical, Malvern, UK) operating with Cu Kα1/2 radiation recorded between 2° and 75° 2θ to investigate the crystal structure of the samples and to the identify the presence of different phases. The software GSAS-II (v1.0.1) was used to perform profile fits of the PXRD patterns in order to determine unit cell parameters [26].
Elemental analysis for each sample was conducted using a Rigaku Primus IV wavelength dispersive X-ray fluorescence spectrometer (WDXRF). This allowed the calculation of their Si/Al and Al/Na molar ratio (the wt% percentages are provided in Figure S1). Additionally, WDXRF was adopted to evaluate the presence of residual dust on the samples’ surface. Particular attention was given to the occurrence of some key elements, Zr, Ti, and Mn, which are commonly found in African dust [27]. Their presence would serve as evidence of dust associated with the samples. The samples in powder form were covered with a polypropylene film (TF-260-255, FluXana, GmbH & Co. KG, Bedburg-Hau, Germany) to prevent material leakage.
Surface area measurements were made with an ASAP 2020 instrument (Micromeritics, Tewkesbury, UK). The samples were degassed before analysis under vacuum for 3 h at 150 °C. Then, N2 adsorption measurements were conducted at 77 K. The BET (Brunauer–Emmett–Teller) equation was applied to determine both the specific surface area and average pore volume of each sample.
Thermo-gravimetric analysis (TGA) was conducted using a Mettler Toledo TGA/DSC instrument (Mettler-Toledo, Leicester, UK) by placing the samples in a 70 μL alumina crucible under an airflow up to 1000 °C with a heating rate of 5 °C/min. The TGA was performed to quantify the mass of the adsorbed compounds/impurities present in the samples. Additionally, mass spectrometry (MS) was used to analyze the gases that evolved during TGA, providing evidence of the compounds released from the samples. This analysis was conducted using a Hiden HPR-20 QIC R&D specialist gas analysis system equipped with a triple filter mass spectrometer and SEM detection.

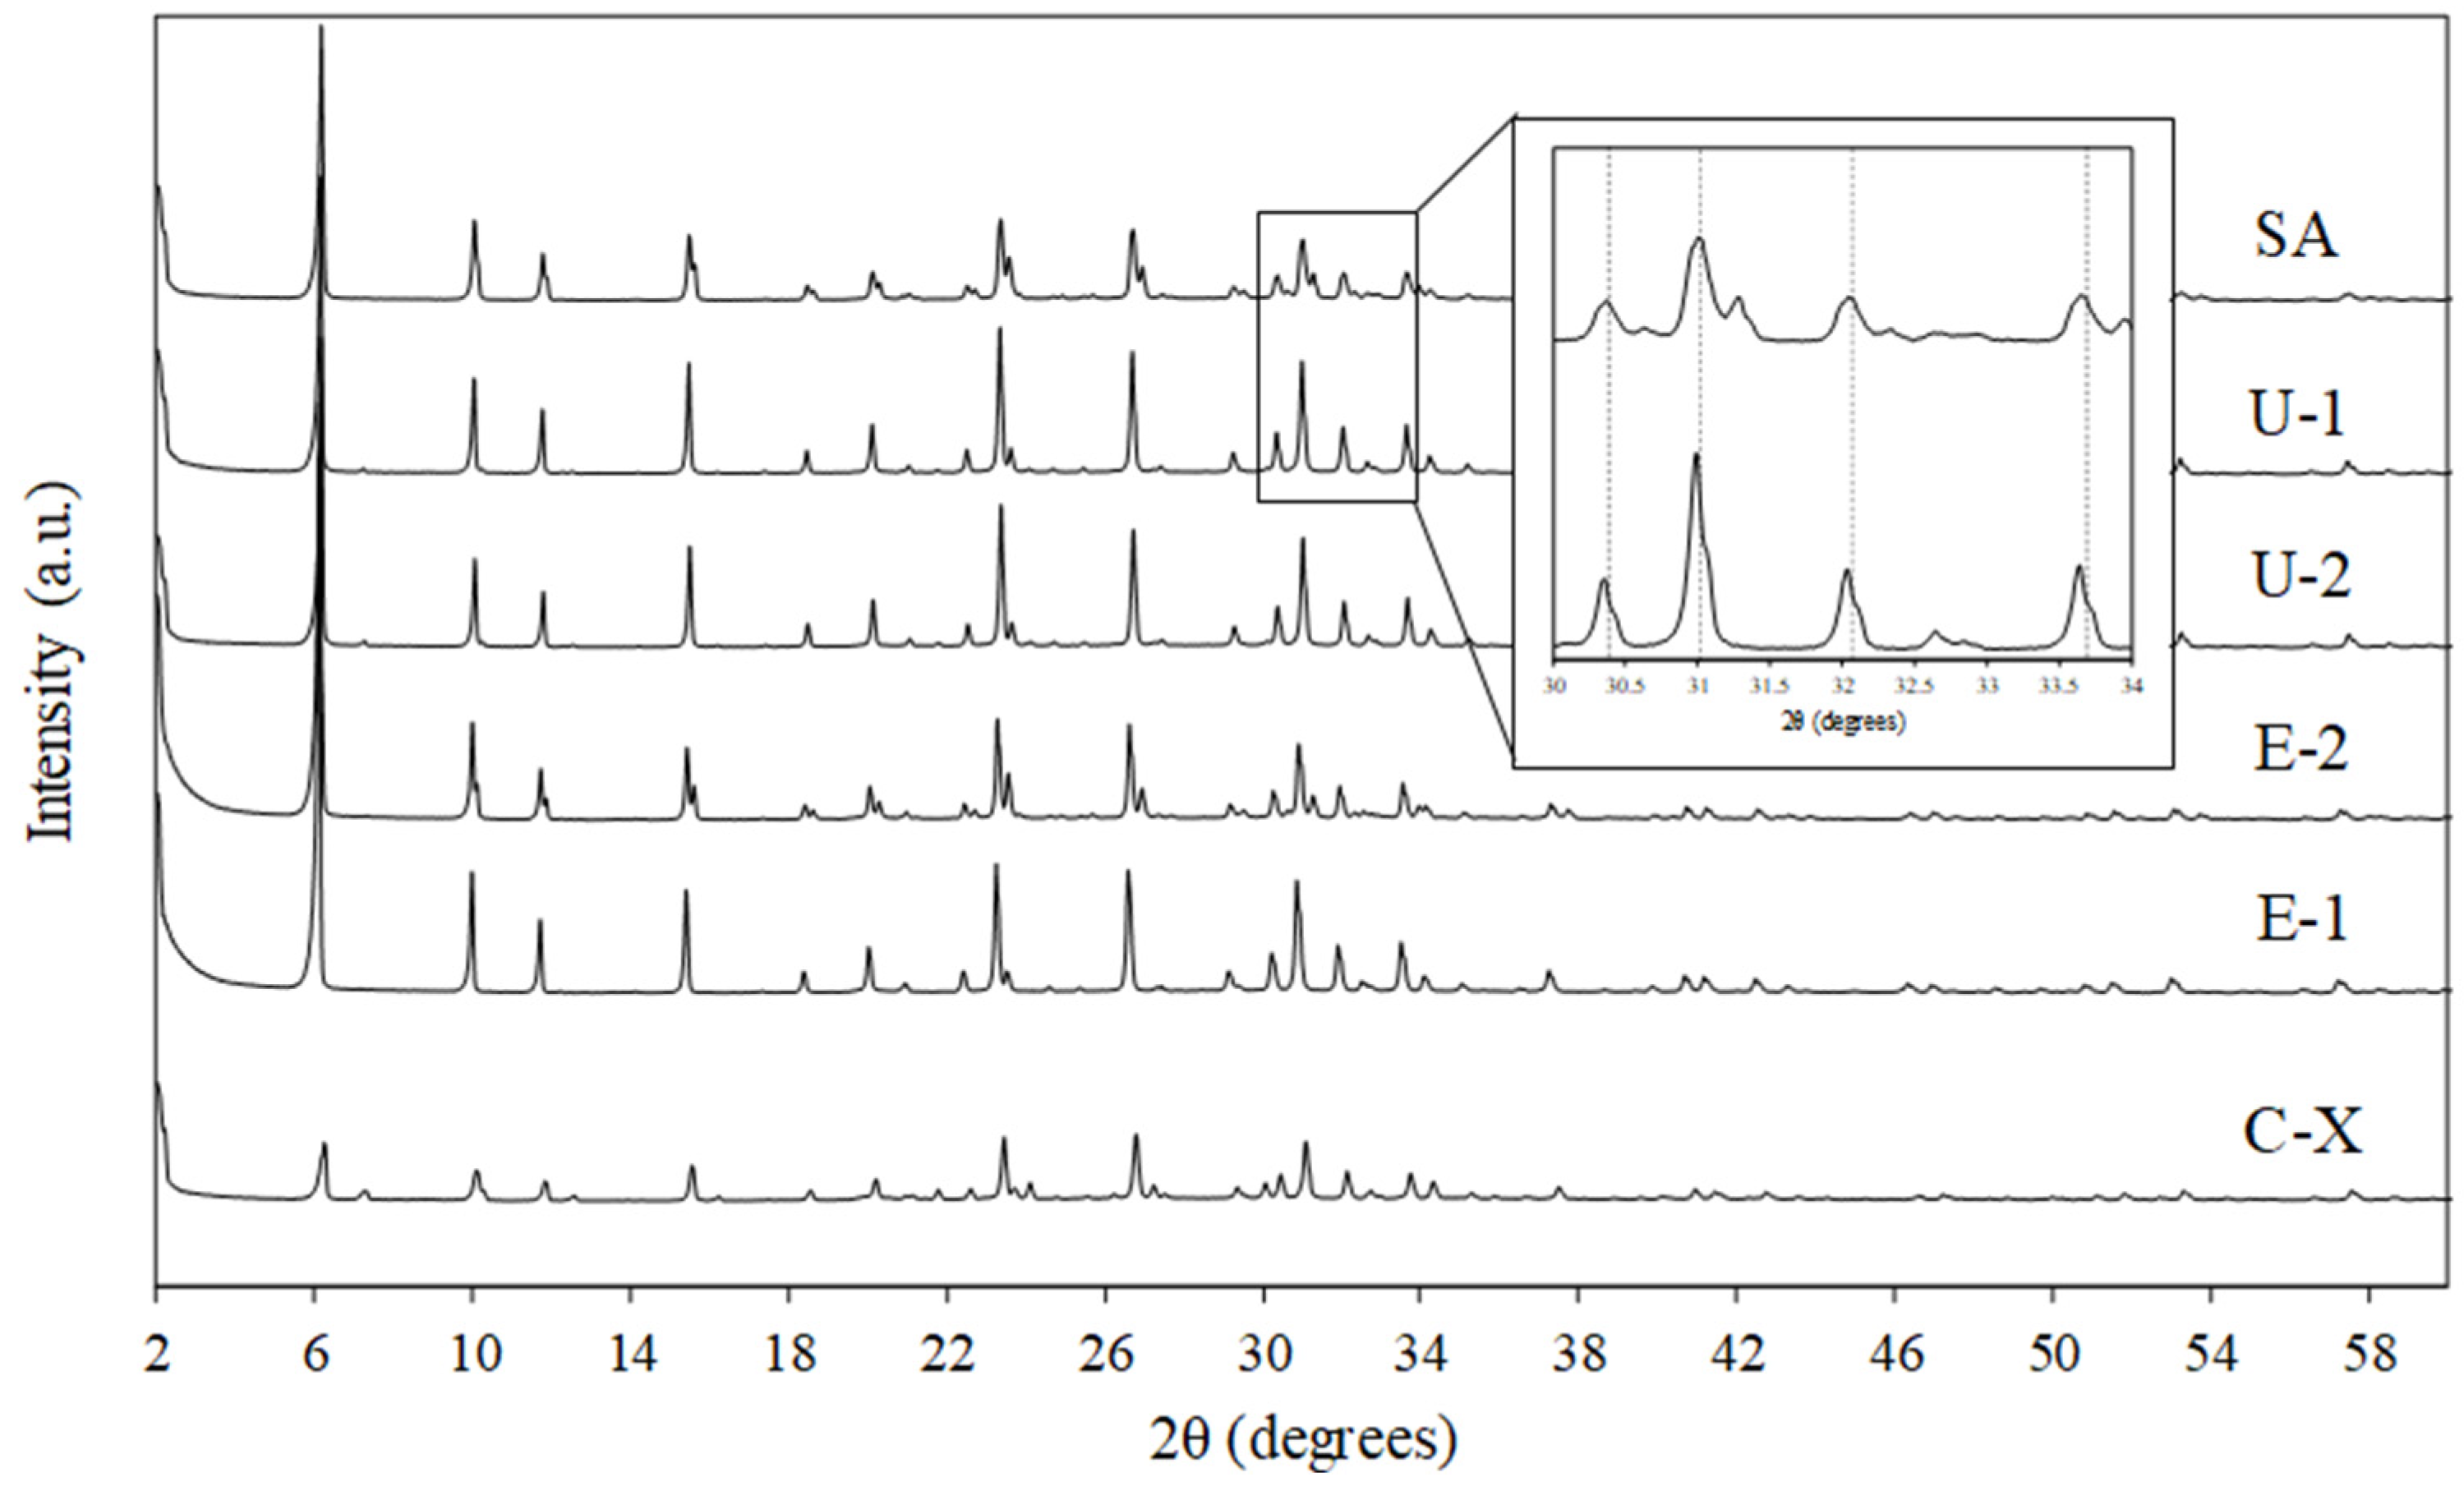
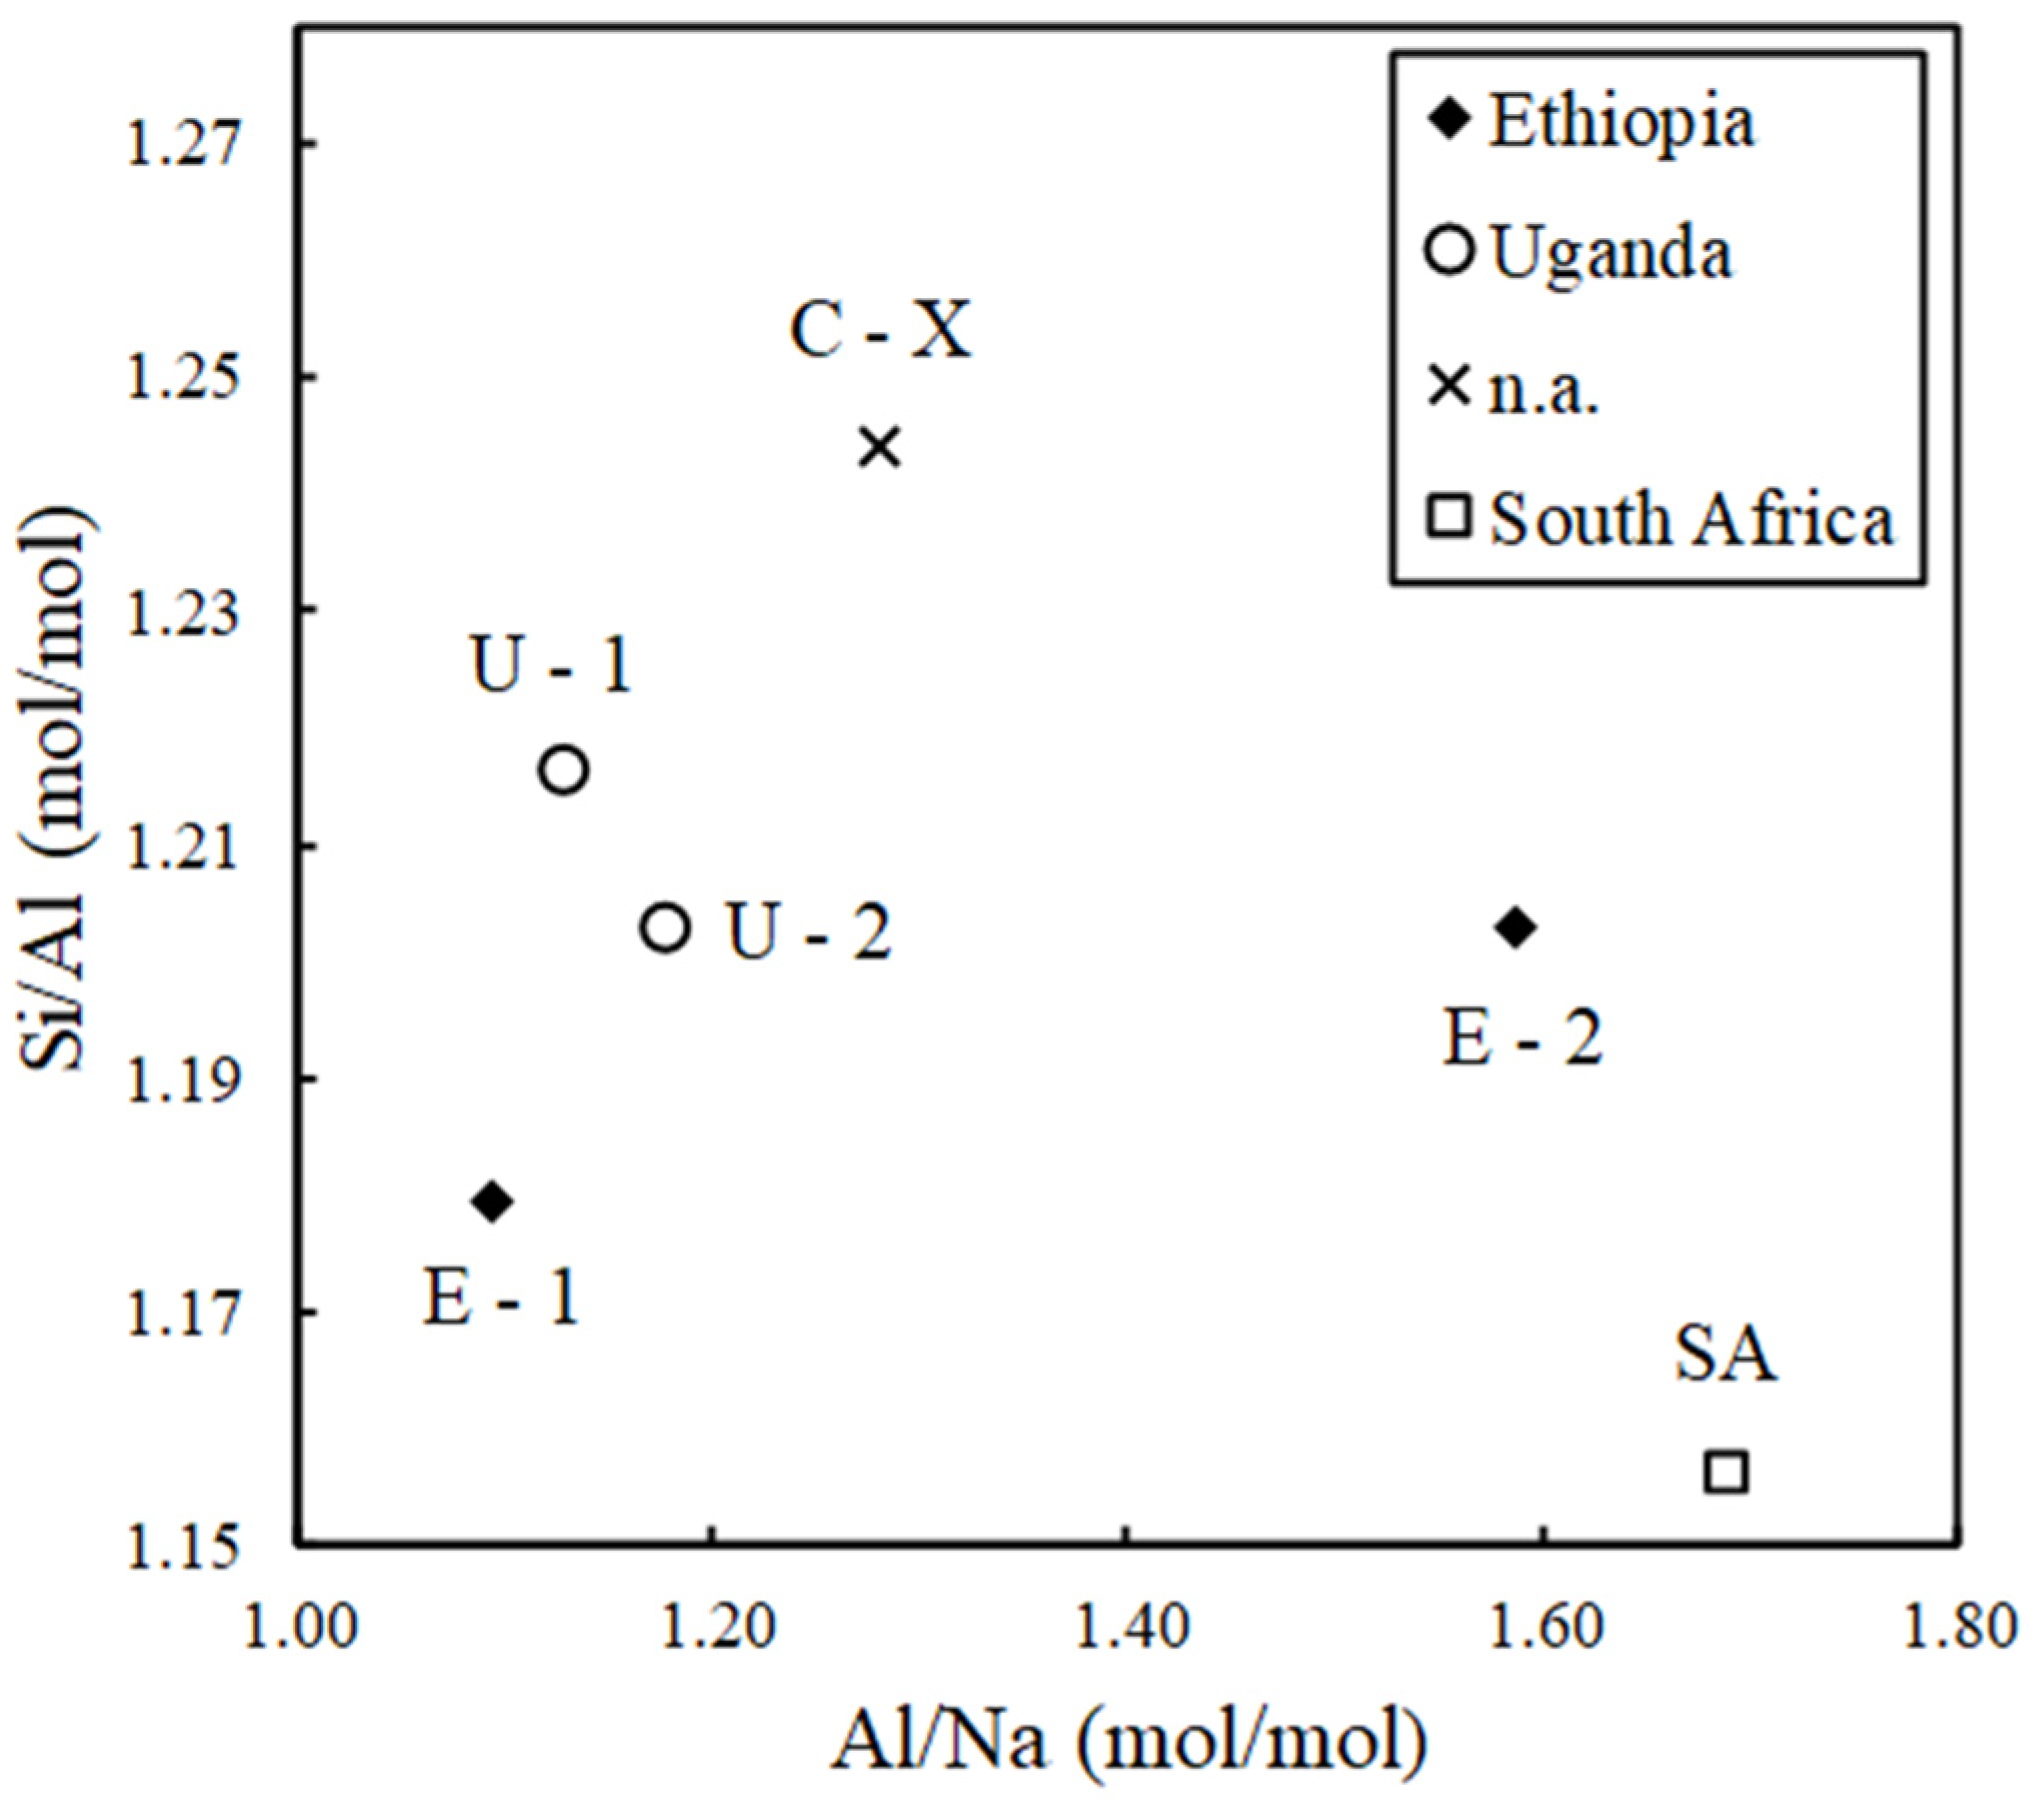
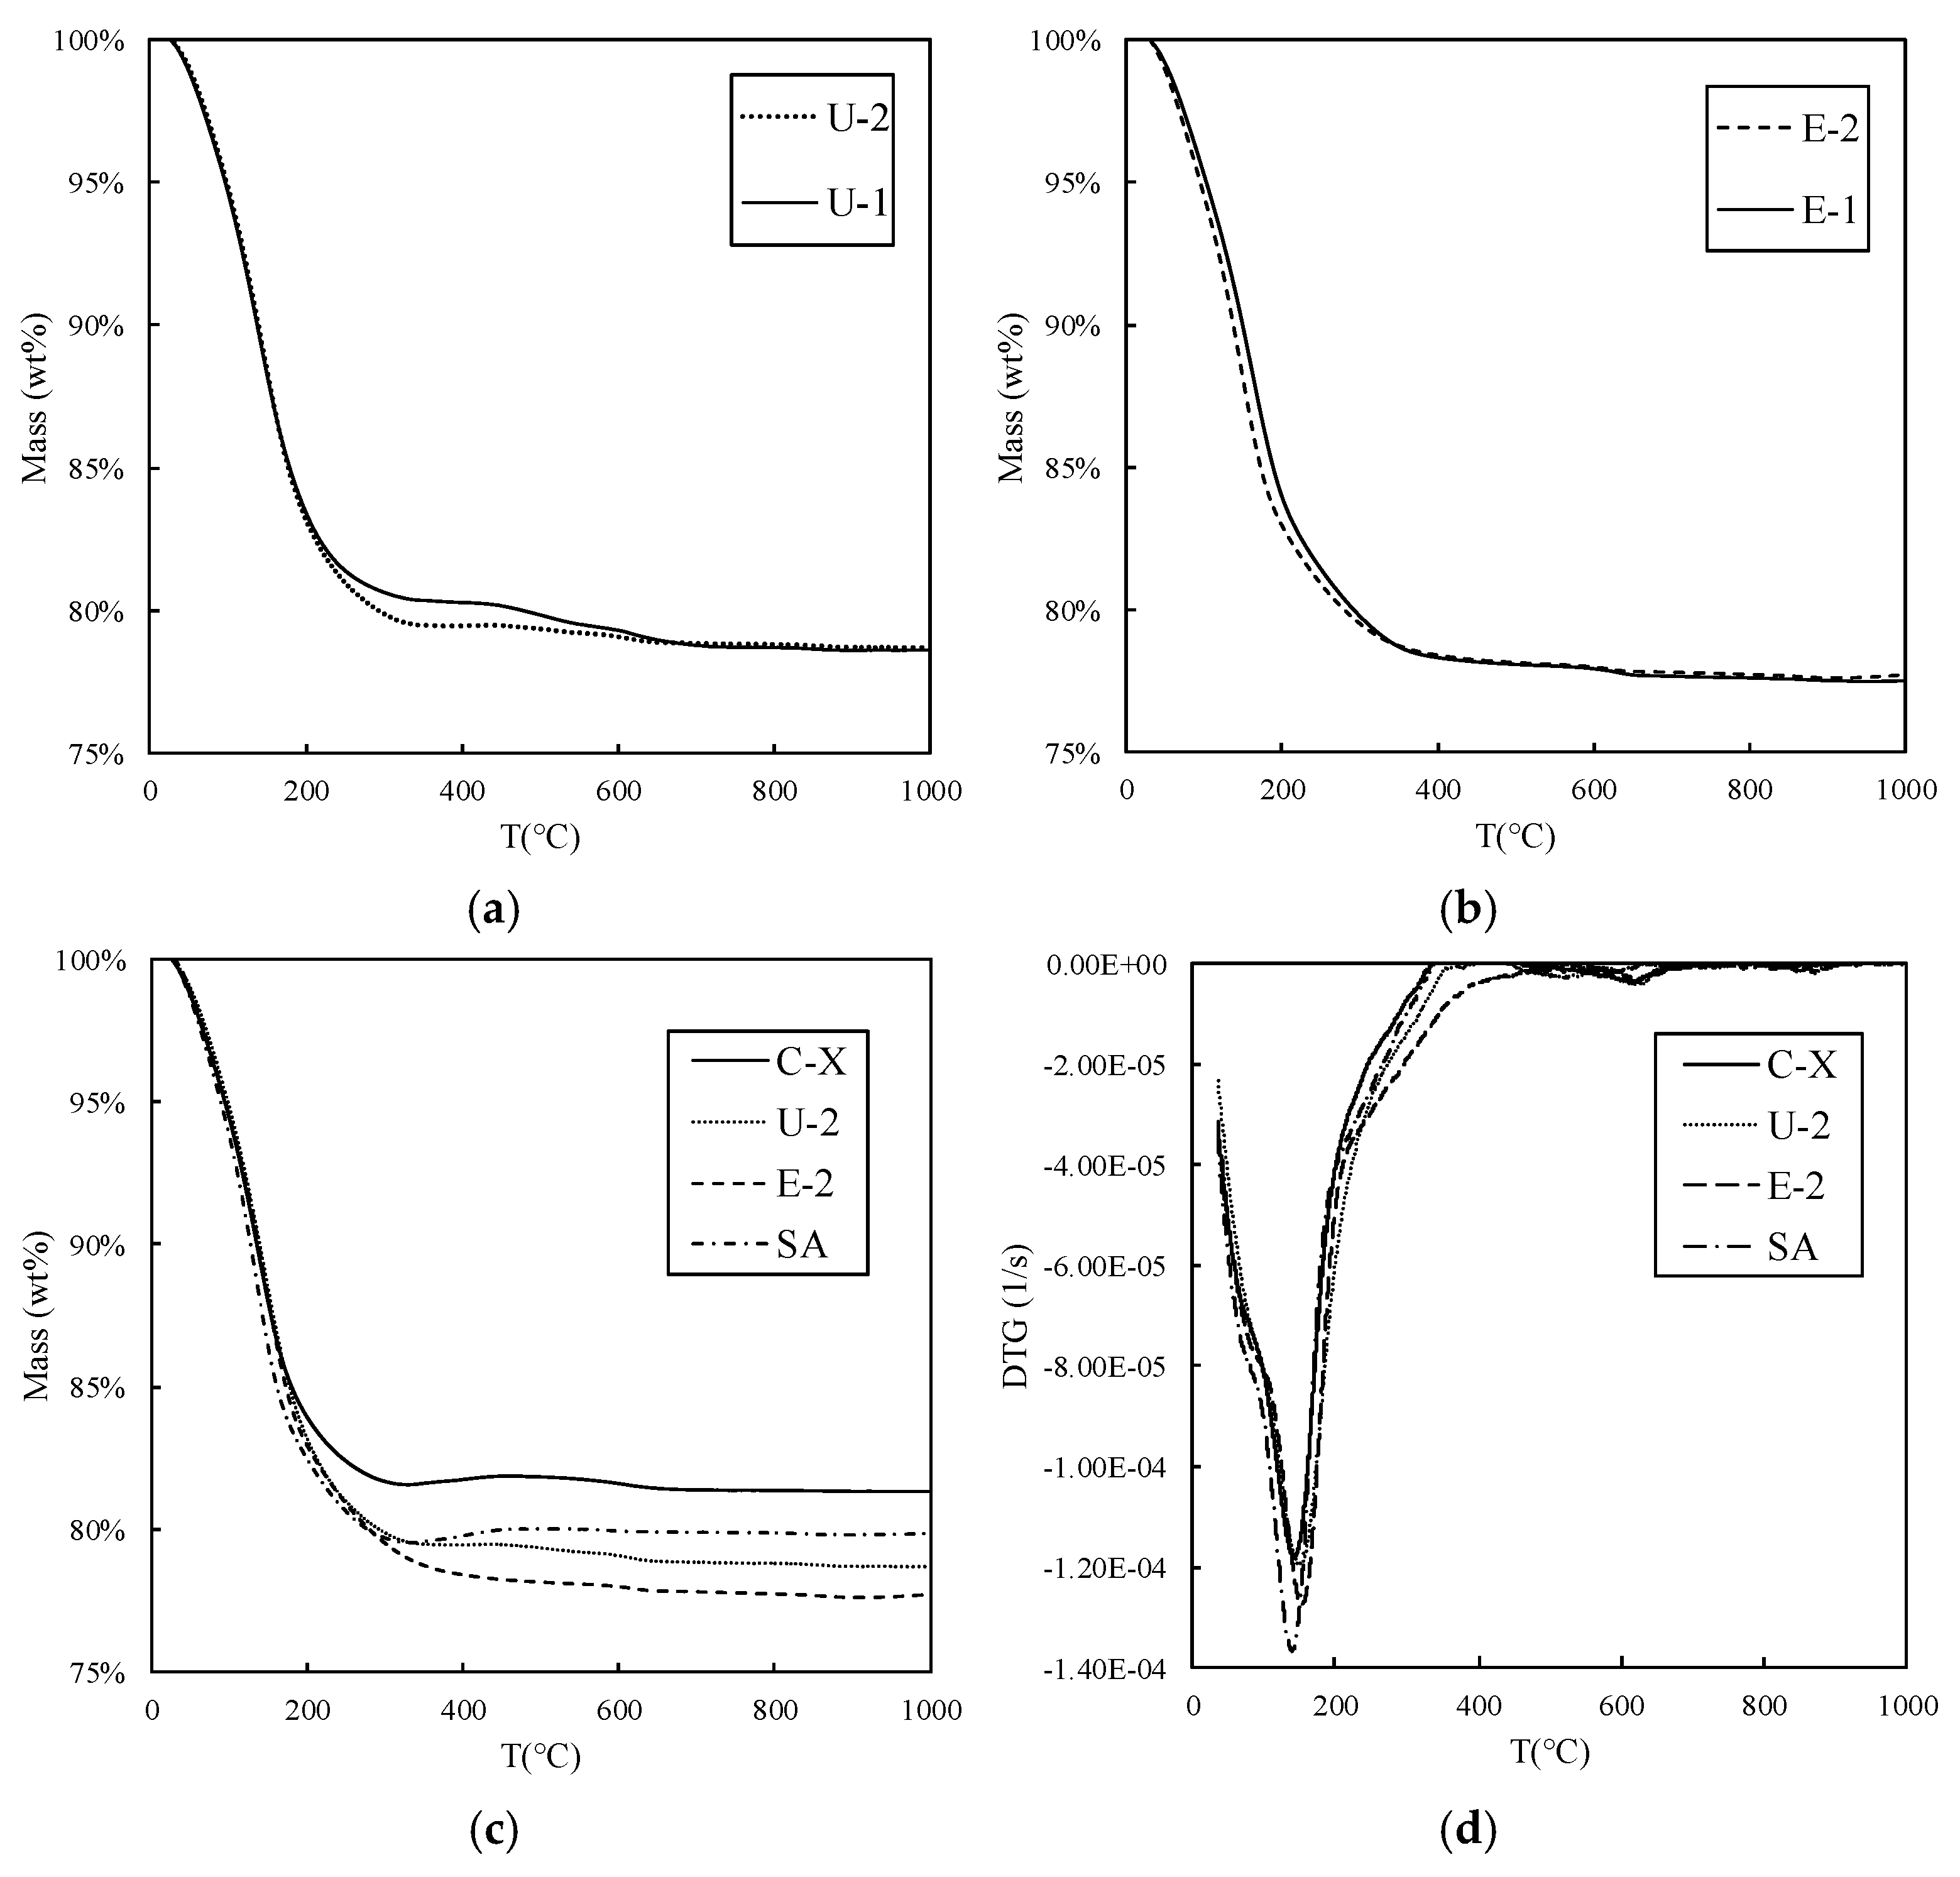
3. Results and Discussion

The XRD analysis of E-1, E-2, U-1, U-2, SA, and C-X zeolite adsorbents is shown in Figure 2. For all the samples, a FAU crystalline framework was observed. More precisely, zeolites were crystallized in a cubic structure (space group: Fd 3 ¯ ) with a refined lattice parameter of 25.0720 (3) Å for sample E-1, 25.0339 (4) Å for sample E-2, 24.9910 (3) Å for sample U-1, 24.9888 (3) Å for sample U-2, 24.9864 (8) Å for sample SA, and 25.0043 (4) Å for sample C-X. An additional faujasite X phase was found in samples E-2 and SA, matched to the literature as having the chemical formula N a 1.84 A l 2 S i 4 O 11.92 · 7 H 2 O [28]. On the other hand, an additional Linde-Type A (LTA) phase was detected in samples U-1, U-2, and C-X (space group Fm 3 ¯ c). It is worth noting that the XRD pattern of the SA sample showed a shift in the characteristic peaks of X zeolite (see insert in Figure 2), possibly resulting from differences in the Na+ and Li+ content, resulting in the contraction of the unit cell [29].
The zeolite samples were characterized through the WDXRF analysis to determine the Si/Al and Al/Na molar ratios for each sample which are presented in Figure 3. The Si/Al ratio falls within the range of 1.16 to 1.24 (mol/mol). It is well known that the adsorption of N2 from the air in OCs is conducted using FAU-LSX-type zeolites with a Si/Al ratio close to one [30,31]. A Si/Al ratio between 1 and 1.5 is consistent with the expected composition of X-type zeolites [32,33], as confirmed by the XRD patterns. On the other hand, a strong presence of Na was observed, resulting in an Al/Na molar ratio between 1.09 and 1.69. This result was expected, as LS zeolites are typically associated with Na+ as the charge-balancing cation, which enhances affinity for molecules with a large quadrupole moment, such as N2 [34]. The variation range of elemental composition is attributed to the presence of additional faujasite phases as well as the presence of other extra framework cations (e.g., Li, Mg, Ca, K, and Fe) that balance the anionic charge of the structure. Specifically, this is observed in sample SA, which is affected by the presence of a second phase and the occurrence of Li.
Metal cations such as Mg, Ca, K, and Fe were found in the samples by WDXRF, as reported in Figure 4 (note that Li cannot be detected by this technique). Here, the results are presented by grouping the samples according to the geographical region of provenance. This was performed to highlight the potential occurrence of impurities on the surface of the materials and to correlate them with the environmental conditions of the country in which they were employed. No significant variation in the wt% of the above-mentioned elements was observed between the samples, with the exception of the K amount in the C-X one. In this case, the higher presence of K is linked to the zeolite framework probably due to an incomplete ion exchange procedure adopted during the conversion from KX to LSX zeolite [35]. Since this sample was not employed as an adsorbent in African medical environmental settings, the presence of some kind of contaminant accumulated on its surface is obviously to be excluded. As explained in Section 2.2, particular attention was given to the eventual detection of Zr, Ti, and Mn, whose occurrence in African dust elevates them as key indicators of dust on the zeolite samples. The WDXRF analysis revealed the presence of only a very small amount of Zr, Ti, and Mn (approximately 30–300 ppm) in all the samples, including the C-X zeolite. Thus, the outcome did not evidence the presence of dust. It should be noted that Fe is present even in the sample of C-X, so this cannot be due to the presence of dust and must be a contaminant in all the samples. The presence of Fe, as well as K and Ca, in 13X zeolite was also reported in the literature by other works [36,37].
The zeolite characterization was completed by the results obtained from the BET analysis, which are reported in Table 2 along with the Si/Al ratio. The values of the BET surface area and the microporous volume for FAU-LSX zeolites are fully consistent with those reported in the literature [38,39,40]. The decrease in both the BET surface area and the microporous volume for sample C-X is likely attributed to the presence of a significant amount of monovalent K+ ions (>1.5% wt), which are larger in size compared to Na+ ions [39]. Such a result is completely in line with the literature evidence [41,42,43].
The TGA measurements are shown in Figure 5. It can be observed that the profile of the mass loss as a function of temperature for samples U-1 and U-2, as well as samples E-1 and E-2, does not exhibit a significant variation (Figure 5a,b). To enhance clarity in presenting all the curves together, E-1 and U-1 are not included in Figure 5c,d. The latter illustrates the first-order derivative of the mass variation over the duration of the TGA test (DTG) and is used to visualize the temperature at which the maximum mass loss rate occurs. This temperature, together with the total percentage of mass loss ( α % ), which was calculated as the ratio between the total mass loss during the test ( M I M F ) and the sample mass at the beginning of the test ( M I ) (see Equation (1)), is reported in Table 3.
α % = M I M F M I × 100
M F represents the sample mass at the end of the test. Moreover, in Table 3, the total adsorbed amount ( q t ) on the zeolites is also included, calculated as shown in Equation (2):
q t = M I M F M F
Table 3 indicates that the maximum mass loss rate occurs within the temperature range of 130–160 °C. Notably, the temperature increase correlates with both the mass loss percentage and a corresponding rise in the adsorbed quantity. Furthermore, the observed temperature range suggests that water is the primary compound released during the zeolite heating process. This hypothesis finds confirmation in the mass spectrometry (MS) results presented in Figure 6, which illustrates the first-order derivative of the mass variation over the duration of the TGA test (DTG) plots against MS curves, with the water mass–charge ratio (m/z) set at 18. Notably, Figure 6 highlights a peak in the water content corresponding to the DTG minimum, indicating water as the primary component contributing to the sample’s mass loss. Conversely, other MS curves corresponding to different m/z ratios did not exhibit similar behavior, further affirming water as the predominant component within the zeolite matrix of the sample.
A comparison of the samples can be made by plotting the oxygen percentage of the gas emitted from the OC instrument at the time of zeolite sampling against the adsorbed amount of water calculated from the TGA results (Figure 7) as previously reported in Equation (2). The two variables appear to be closely connected, with the adsorbed amount notably impacting OC efficiency and potentially leading to instrument failure. Since water constitutes the main adsorbed compound, and it is well known from the literature that it competitively adsorbs on N2 active sites [44], it is possible to conclude that the accumulation of moisture in the solid adsorbents hinders N2 adsorption, causing a premature failure of OCs adopted in the African countries considered in this study.

4. Conclusions

Exhausted zeolite samples used in OCs from Uganda, Ethiopia, and South Africa were collected and analyzed, with the results compared to those of a commercial sample not employed in OCs. The XRD analysis revealed the nature of all the samples, confirming that they all presented a low silicon X-type framework. An additional crystalline faujasite-X phase was detected in samples E-2 and SA, while an additional LTA phase occurred in samples U-1, U-2, and C-X. The presence of counterbalancing Li+ ions was also deduced in sample SA from the observed contraction of its unit cell. The WDXRF highlighted the relative abundance of K+ ions in sample C-X and highlighted the presence of Mg, Ca, and Fe in all the samples. Additional elements such as Zr, Ti, and Mn, considered to be dust markers, were detected only at low levels in every sample analyzed, including the “virgin” C-X. Hence, there was clearly no evidence of the presence of dust on the samples. On the other hand, the TGA-MS results highlighted the predominant occurrence of water in all the samples, with its release observed at the maximum mass loss rate. A positive correlation was found between the amount of water adsorbed and the efficiency of the investigated OCs leading us to conclude that humidity is the main cause of OC failure in LRSs. This outcome is particularly important because it is independent of the region of origin of the zeolite samples. Therefore, while additional data should be collected in future studies from other geographical areas, the knowledge generated by this work holds general significance. Furthermore, this study stands out for its novelty as it analyzed zeolite samples adopted in commercial OCs that operated in harsh, uncontrolled environmental conditions (unlike the controlled conditions typically found in scientific laboratories). This underscores the significance of our findings in understanding the performance of OCs in LRSs. Thus, this paper serves as a valuable guide for engineers, directing their efforts toward modifying OCs to prevent zeolite moisture poisoning. An additional layer on the inlet filter specifically designed for water removal could be a promising route. Additionally, thermal regeneration should be promoted to restore the zeolites’ adsorption properties once saturated with moisture, thereby increasing the OCs’ lifetime. Toward this goal, OCs should be designed to easily remove the canisters, facilitating the regeneration process. For this purpose, sustainable and frugal ways of regenerating existing exhausted zeolites to allow for their reuse should be investigated.

Supplementary Materials

The following supporting information can be downloaded at https://www.mdpi.com/article/10.3390/app15084311/s1, Figure S1: Weight percentages of Si, Al, and Na for each zeolite sample used in this study.

Author Contributions

Conceptualization, D.P. and R.I.W.; methodology, L.M., D.P. and R.I.W.; investigation, L.M., K.S.P. and J.A.O.; data curation, L.M.; writing—original draft preparation, L.M., N.H.I. and E.B.; writing—review and editing, D.P. and R.I.W.; supervision, V.P. and L.P.; project administration, D.P. and R.I.W.; funding acquisition, D.P. All authors have read and agreed to the published version of the manuscript.

Funding

This research was funded in whole by the EPSRC, via the University of Warwick’s Impact Acceleration Account (EP/X525844/1). Some of the analytical equipment used in this work was provided by the University of Warwick’s Research Technology Platforms. For the purpose of open access, the author has applied a Creative Commons Attribution (CC BY) license to any Author Accepted Manuscript version arising from this submission.

Institutional Review Board Statement

Not applicable.

Informed Consent Statement

Not applicable.

Data Availability Statement

The data that support the findings of this study are available from the corresponding author upon request.

Conflicts of Interest

The authors declare no conflicts of interest.

References

  1. Qadir, S.; Ganesan, S.; Canevesi, R.L.S.; Grande, C.A. A portable oxygen-concentrator for climbing to the death zone without oxygen canisters. Sep. Purif. Technol. 2025, 360, 131094. [Google Scholar] [CrossRef]
  2. Choudhury, R. Hypoxia and hyperbaric oxygen therapy: A review. Int. J. Gen. Med. 2018, 11, 431–442. [Google Scholar] [CrossRef] [PubMed]
  3. Jiang, D.; Li, H. Study on Influencing Factors of Molecular Sieve Oxygen-Production System. Processes 2023, 11, 124. [Google Scholar] [CrossRef]
  4. Ramezani, K.; dehaj, F.M.; Hejazi, S.A.H. Optimizing medical oxygen concentrators: Efficiency, flexibility, and patient-centric solutions. Sep. Purif. Technol. 2025, 353, 128549. [Google Scholar] [CrossRef]
  5. Chin, C.; Kamin, Z.; Bahrun, M.H.V.; Bono, A. The Production of Industrial-Grade Oxygen from Air by Pressure Swing Adsorption. Int. J. Chem. Eng. 2023. [Google Scholar] [CrossRef]
  6. Zhang, Q.; Liu, Y.; Li, Z.; Xiao, P.; Liu, W.; Yang, X.; Fu, Y.; Zhao, C.; Yang, R.T.; Webley, P.A. Experimental study on oxygen concentrator with wide product flow rate range: Individual parametric effect and process improvement strategy. Sep. Purif. Technol. 2021, 274, 118918. [Google Scholar] [CrossRef]
  7. Mazzeo, L.; Boscarino, T.; Falasconi, M.B.; Polvi, S.; Piemonte, V.; Pecchia, L. Zeolite Synthesis from Waste Materials for the Medical Field of Oxygen Concentrators: Focus on the African Scenario. Chem. Eng. Trans. 2023, 101, 163–168. [Google Scholar] [CrossRef]
  8. Yadav, V.K.; Choudhary, N.; Inwati, G.K.; Rai, A.; Singh, B.; Solanki, B.; Paital, B.; Sahoo, D.K. Recent trends in the nanozeolites-based oxygen concentrators and their application in respiratory disorders. Front. Med. 2023, 10, 1–13. [Google Scholar] [CrossRef]
  9. Nowadly, C.D.; Portillo, D.J.; Davis, M.L.; Hood, R.L.; De Lorenzo, R.A. The Use of Portable Oxygen Concentrators in Low-Resource Settings: A Systematic Review. Prehosp. Disaster Med. 2022, 37, 247–254. [Google Scholar] [CrossRef]
  10. Maccaro, A.; Piaggio, D.; Leesurakarn, S.; Husen, N.; Sekalala, S.; Rai, S.; Pecchia, L. On the universality of medical device regulations: The case of Benin. BMC Health Serv. Res. 2022, 22, 1031. [Google Scholar] [CrossRef]
  11. Europe, M. The European Medical Technology Industry in Figures 2020 Table of Contents. MedTech Europe. 2021, Volume 5, pp. 1–44. Available online: https://www.medtecheurope.org/resource-library/the-european-medical-technology-industry-in-figures-2019/ (accessed on 13 May 2024).
  12. Ibrahim, N.H.; Wallace, J.; Piaggio, D.; Pecchia, L. Design and maintenance of medical oxygen concentrators in Sub-Saharan Africa: A systematic review. BMC Health Serv. Res. 2025, 25, 171. [Google Scholar] [CrossRef] [PubMed]
  13. Patil, R.; Shrivastava, R.; Juvekar, S.; McKinstry, B.; Fairhurst, K. Specialist to non-specialist teleconsultations in chronic respiratory disease management: A systematic review. J. Glob. Health 2021, 11, 04019. [Google Scholar] [CrossRef] [PubMed]
  14. Piaggio, D.; Castaldo, R.; Cinelli, M.; Cinelli, S.; Maccaro, A.; Pecchia, L. A framework for designing medical devices resilient to low-resource settings. Global. Health 2021, 17, 64. [Google Scholar] [CrossRef]
  15. Nduhuura, P.; Zerga, A.; Garschagen, M. Power Outages in Africa—An Assessment Based on Regional Power Pools. SSRN Electron. J. 2018. [Google Scholar] [CrossRef]
  16. Peake, D.; Black, J.; Kumbakumba, E.; Bagayana, S.; Barigye, C.; Moschovis, P.; Muhumuza, I.; Kiwanuka, F.; Semata, P.; Rassool, K.; et al. Technical results from a trial of the FREO2 low-pressure oxygen storage system, mbarara regional referral hospital, Uganda. PLoS ONE 2021, 16, e0248101. [Google Scholar] [CrossRef]
  17. Rassool, R.P.; Sobott, B.A.; Peake, D.J.; Mutetire, B.S.; Moschovis, P.P.; Black, J.F. A low-pressure oxygen storage system for oxygen supply in low-resource settings. Respir. Care 2017, 62, 1582–1587. [Google Scholar] [CrossRef]
  18. Calderon, R.; Morgan, M.C.; Kuiper, M.; Nambuya, H.; Wangwe, N.; Somoskovi, A.; Lieberman, D. Assessment of a storage system to deliver uninterrupted therapeutic oxygen during power outages in resource-limited settings. PLoS ONE 2019, 14, e0211027. [Google Scholar] [CrossRef]
  19. Otiangala, D.; Agai, N.O.; Olayo, B.; Adudans, S.; Ng, C.H.; Calderon, R.; Forgie, E.; Bachman, C.; Lieberman, D.; Bell, D.; et al. A feasibility study evaluating a reservoir storage system for continuous oxygen delivery for children with hypoxemia in Kenya. BMC Pulm. Med. 2021, 21, 1–9. [Google Scholar] [CrossRef]
  20. Santos, J.C.; Magalhães, F.D.; Mendes, A. Contamination of zeolites used in oxygen production by PSA: Effects of water and carbon dioxide. Ind. Eng. Chem. Res. 2008, 47, 6197–6203. [Google Scholar] [CrossRef]
  21. La Vincente, S.F.; Peel, D.; Carai, S.; Weber, M.W.; Enarson, P.; Maganga, E.; Soyolgerel, G.; Duke, T. The functioning of oxygen concentrators in resource-limited settings: A situation assessment in two countries. Int. J. Tuberc. Lung Dis. 2011, 15, 693–699. [Google Scholar] [CrossRef]
  22. Bradley, B.D.; Chow, S.; Nyassi, E.; Cheng, Y.L.; Peel, D.; Howie, S.R.C. A retrospective analysis of oxygen concentrator maintenance needs and costs in a low-resource setting: Experience from The Gambia. Health Technol. 2015, 4, 319–328. [Google Scholar] [CrossRef]
  23. Williams, E.; Piaggio, D.; Andellini, M.; Pecchia, L. 3D-printed activated charcoal inlet filters for oxygen concentrators: A circular economy approach. Dev. Eng. 2022, 7, 100094. [Google Scholar] [CrossRef] [PubMed]
  24. Peel, D.; Neighbour, R.; Eltringham, R.J. Evaluation of oxygen concentrators for use in countries with limited resources. Anaesthesia 2013, 68, 706–712. [Google Scholar] [CrossRef]
  25. World Health Organization. Increasing Access to Medical Oxygen. In EB152/CONF./4; 2012; pp. 1–6. Available online: https://apps.who.int/gb/ebwha/pdf_files/EB152/B152_CONF4-en.pdf (accessed on 5 September 2024).
  26. Toby, B.H.; Von Dreele, R.B. GSAS-II: The genesis of a modern open-source all purpose crystallography software package. J. Appl. Crystallogr. 2013, 46, 544–549. [Google Scholar] [CrossRef]
  27. Scheuvens, D.; Schütz, L.; Kandler, K.; Ebert, M.; Weinbruch, S. Bulk composition of northern African dust and its source sediments-A compilation. Earth-Sci. Rev. 2013, 116, 170–194. [Google Scholar] [CrossRef]
  28. Warzybok, M. Synthesis of Kaolin-Based Zeolite Y and Its Application for Adsorption of Two Carbonyl Compound Gases. J. Civ. Eng. Environ. Archit. 2018, 65, 13–26. [Google Scholar] [CrossRef]
  29. Shrotri, A.R.; Birje, A.R.; Niphadkar, P.S.; Bokade, V.V.; Mali, N.A.; Nandanwar, S.U. Performance of Li exchange hierarchical X zeolite for CO2 adsorption and H2 separation. J. Ind. Eng. Chem. 2023, 133, 505–514. [Google Scholar] [CrossRef]
  30. Ackley, M.W. Medical Oxygen Concentrators: A Review of Progress in Air Separation Technology; Springer: New York, NY, USA, 2019. [Google Scholar] [CrossRef]
  31. Ivanova, E.N.; Averin, A.A.; Alekhina, M.B.; Sokolova, N.P.; Kon’kova, T.V. Thermal Activation of Type X Zeolites in the Presence of Carbon Dioxide. Prot. Met. Phys. Chem. Surf. 2016, 52, 267–272. [Google Scholar] [CrossRef]
  32. Julbe, A.; Drobek, M. Zeolite X: Type. In Encyclopedia of Membranes; Springer: Berlin/Heidelberg, Germany, 2016. [Google Scholar] [CrossRef]
  33. Bülow, M. Complex sorption kinetics of carbon dioxide in NaX-zeolite crystals. Adsorption 2002, 8, 9–14. [Google Scholar] [CrossRef]
  34. Tishin, A.A. Study of Adsorption Properties of Zeolites NaX, CaA, and CaNaA in Separation of Air Components. Pet. Chem. 2020, 60, 964–970. [Google Scholar] [CrossRef]
  35. Lee, Y.; Carr, S.W.; Parise, J.B. Phase Transition upon K+ Ion Exchange into Na-Low Silica X: Combined NMR and Synchrotron X-ray Powder Diffraction Study. Chem. Mater. 1998, 10, 2561–2570. [Google Scholar] [CrossRef]
  36. Siriwardane, R.V.; Shen, M.S.; Fisher, E.P.; Poston, J.A. Adsorption of CO2 on molecular sieves and activated carbon. Energy Fuels 2001, 15, 279–284. [Google Scholar] [CrossRef]
  37. Rocha, L.C.C.; Zuquette, L.V. Evaluation of zeolite as a potential reactive medium in a permeable reactive barrier (PRB): Batch and column studies. Geosciences 2020, 10, 59. [Google Scholar] [CrossRef]
  38. Mfoumou, C.M.; Mignard, S.; Belin, T. The preferential adsorption sites of H2O on adsorption sites of CO2 at low temperature onto NaX and BaX zeolites. Adsorpt. Sci. Technol. 2018, 36, 1246–1259. [Google Scholar] [CrossRef]
  39. Hammoudi, H.; Bendenia, S.; Marouf-Khelifa, K.; Marouf, R.; Schott, J.; Khelifa, A. Effect of the binary and ternary exchanges on crystallinity and textural properties of X zeolites. Microporous Mesoporous Mater. 2008, 113, 343–351. [Google Scholar] [CrossRef]
  40. Sowunmi, A.R.; Folayan, C.O.; Anafi, F.O.; Ajayi, O.A.; Omisanya, N.O.; Obada, D.O.; Dodoo-Arhin, D. Dataset on the comparison of synthesized and commercial zeolites for potential solar adsorption refrigerating system. Data Brief 2018, 20, 90–95. [Google Scholar] [CrossRef]
  41. El Hadi, Z.; Nibou, D. High-Pressure CO2 Adsorption onto NaX Zeolite: Effect of Li+, K+, Mg2+, and Zn2+ and Equilibrium Isotherms Study. Iran. J. Chem. Chem. Eng. 2021, 40, 1195–1215. [Google Scholar]
  42. Romero, M.D.; Ovejero, G.; Rodríguez, A.; Gómez, J.M.; Águeda, I. O methylation of phenol in liquid phase over basic zeolites. Ind. Eng. Chem. Res. 2004, 43, 8194–8199. [Google Scholar] [CrossRef]
  43. Kosawatthanakun, S.; Pansakdanon, C.; Sosa, N.; Chanlek, N.; Roessner, F.; Prayoonpokarach, S.; Wittayakun, J. Comparative Properties of K/NaX and K/NaY from Ultrasound-Assisted Impregnation and Performance in Transesterification of Palm Oil. ACS Omega 2022, 7, 9130–9141. [Google Scholar] [CrossRef]
  44. Peterson, D. Influence of presorbed water on the sorption of nitrogen by zeolites at ambient temperatures. Zeolites 1981, 1, 105–112. [Google Scholar] [CrossRef]
Figure 1. Schematic representation of an OC unit: (a) air gross particle filter; (b) air inlet filter; (c) air compressor; (d) adsorption molecular sieve bed; and (e) desorption molecular sieve bed.
Applsci 15 04311 g001
Figure 2. XRD patterns for the E-1, E-2, U-1, U-2, SA, and C-X zeolite samples. Moreover, a focus on the shift in the FAU framework peaks of the SA sample is provided.
Applsci 15 04311 g002
Figure 3. The values of Si/Al and Al/Na (mol/mol) determined by WDXRF for each sample highlighting their region of provenance.
Applsci 15 04311 g003
Figure 4. The weight percentage (wt%) of Mg, Fe, Ca, and K in the zeolite samples is presented based on the country in which they were employed.
Applsci 15 04311 g004
Figure 5. Plots of the results of the thermo-gravimetric analysis (TGA). Comparison between sample U-1 and U-2 (a) and sample E-1 and E-2 (b). Additional comparisons for samples C-X, U-2, E-2, and SA for the mass variation (c) and derivative of the mass variation (d).
Applsci 15 04311 g005
Figure 6. Plot of the first-order derivative of the mass variation over the duration of the TGA test (DTG) against MS curves, with the characteristic water mass–charge ratio (m/z) of 18.
Applsci 15 04311 g006
Figure 7. Performance of OCs in terms of the oxygen concentration emitted from the instrument during zeolite sampling versus the amount of adsorbed moisture. The acronym of each sample is provided and the oxygen concentration in air is also highlighted.
Applsci 15 04311 g007
Table 1. Zeolite samples main characteristics (N.S. stands for “Not Specified”).
CountryAcronymOC ModelWorking Time (h)Oxygen Purity (% v/v)
EthiopiaE-1JAY 10 LN.S.41
E-2Yuwell 7F-10 14,36033
UgandaU-1DeVilbiss N.S.40
U-2Drive DeVilbiss17,84250
South AfricaSAN.A.N.S.85
Table 2. Characteristics of the zeolite samples.
CountryAcronymSi/Al (mol/mol)BET Area (m2/g)Pore Volume (cm3/g)
EthiopiaE-11.18561.990.228
E-21.20538.990.220
UgandaU-11.22410.120.231
U-21.20518.190.298
South AfricaSA1.16560.400.285
n.a.C-X1.24338.480.193
Table 3. TGA results for each zeolite sample including the temperature at which the maximum mass loss rate occurs, the mass loss percentage ( α %), and the total adsorbed amount q t .
CountryAcronymTemperature (°C) α % (wt%) q t
EthiopiaE-1156.922.280.286
E-2158.123.000.298
UgandaU-1141.521.280.270
U-2144.021.300.270
South AfricaSA144.320.150.252
n.a.C-X132.619.000.234
Disclaimer/Publisher’s Note: The statements, opinions and data contained in all publications are solely those of the individual author(s) and contributor(s) and not of MDPI and/or the editor(s). MDPI and/or the editor(s) disclaim responsibility for any injury to people or property resulting from any ideas, methods, instructions or products referred to in the content.

