Featured Application
Evaluation of uncertainty levels in thrust measurement of solid propellant rocket motors during static tests.
Abstract
A solid propellant rocket motor is a propulsion system used in missiles and rockets that burns a propellant, typically composed of a mixture of fuel and an oxidizer, to generate the thrust necessary to propel the vehicle. During both the development and quality assurance phases, static firing tests of rocket motors are conducted to verify whether the system requirements meet the product specifications. These tests aim to produce two main types of graphs, “thrust versus burn time” and “pressure versus burn time,” both generated by the rocket motor during the burn. While thrust and pressure are important parameters in the design of a rocket motor, total impulse is the quantity that incorporates the crucial element of time, measuring how high a rocket can be launched. To ensure greater metrological reliability in static tests of rocket motors, it is important to carefully evaluate the uncertainty levels in the measurement chain of the data acquisition system. This work aims to assess the uncertainty levels expressed in the calculated total impulse values during a static firing test of a rocket motor at the Propulsion Jets Testing Laboratory of the Brazilian Army Technological Center. To estimate the measurement uncertainty of the chain in question, approaches based on combined and expanded uncertainty theories were adopted. These methodologies consider Type A and Type B uncertainties, providing a comprehensive and rigorous analysis. In addition to the uncertainties previously mentioned, the oscillation of the measured signal should also be recognized as a contributing factor to the overall uncertainty in the calculation of total impulse. By incorporating these various sources of uncertainty, we can achieve a more comprehensive and reliable understanding of the uncertainty associated with the measurements obtained from the measurement chain. This analysis yields a measurement uncertainty of 0.24% for thrust and 0.007% for impulse, both calculated at a confidence level of 95.45%.
1. Introduction
A solid propellant rocket motor functions as a pressurized container with a single opening, the nozzle, as shown in Figure 1. Inside this container is a solid block formed by a specific mixture of fuel and oxidizer, the propellant [1]. When the ignitor ignites this mixture, a chemical reaction generates gases under high pressure. Due to the difference between the internal and external atmospheric pressure, these gases are rapidly expelled through the nozzle. The expulsion of gases at high-speed results in a force that moves the rocket forward. This reaction force, known as thrust, is directly proportional to the mass and velocity of the gases expelled through the nozzle [1]. Therefore, the greater the quantity and velocity of the expelled gases, the greater the thrust generated.
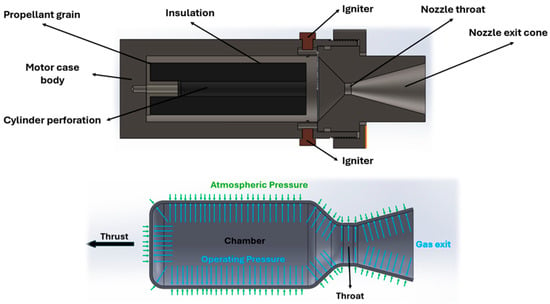
Figure 1.
Cutaway view and operating principle of solid propellant rocket motor.
Besides solid propellant rocket motors, this work focuses on a range of other technologies with similar applications currently being studied. Among them, we can mention liquid propellant, hybrid, gel rocket engines, and their derivatives.
The development and optimization of rocket propulsion systems have been at the forefront of aerospace engineering due to their critical role in enabling space exploration and satellite deployment. Solid rocket motors (SRMs) stand out for their simplicity, reliability, and ability to deliver high thrust in compact designs. Recent advancements in solid propulsion technologies have expanded the performance envelope of SRMs by introducing innovative materials, geometries, and control strategies.
For instance, as investigated by Glascock et al. [2], electric solid propellants offer new avenues for controlled ignition and throttling capabilities, which are essential for multimode propulsion systems.
Beyond traditional SRMs, hybrid rocket technologies have also shown significant promise. A recent study by Takano et al. [3] demonstrated how innovative fuel grain geometries, such as star-fractal swirl designs, can enhance combustion efficiency and performance.
Wetao Li et al. [4] showcased how machine learning and evolutionary algorithms could produce novel grain configurations tailored to specific performance goals, eliminating the need for traditional empirical approaches.
Control strategies play an equally vital role in advancing propulsion systems. A study by Cha and de Oliveira [5] highlighted how innovative control algorithms, including fuzzy PID control and feedback linearization, can improve thrust modulation and pressure stability in variable-thrust SRMs.
Additionally, the integration of structural health monitoring systems into SRMs, as discussed by Desmond Adair et al. [6], introduces new paradigms for ensuring the safety and reliability of propulsion systems through non-invasive diagnostics.
In tandem with these advancements, efforts to tune the ballistic performance of solid rocket motors through material innovations have also gained attention. A study by Wu and Ren [7] revealed how embedded metal wires could strategically enhance burn rates and overall motor performance.
Technological advancements in rocket engines have been vital for developing new capabilities in dual-use missions. The future of rocket engines points to new technological frontiers, with more powerful, environmentally friendly, and reliable engines, promising to transform space travel and open new possibilities for various applications.
Firing static tests is essential to assess technological advancements in rocket engines effectively. They play a critical role in developing and validating propulsion technologies, providing valuable data for ensuring the performance, reliability, and safety of engines before they are used in flight. Static tests are conducted with the rocket motor secured on a test stand, allowing for the measurement and detailed analysis of its performance under controlled conditions.
Such static tests enable the verification of primary parameters such as generated thrust and pressure within the rocket motor casing. They also validate the system’s safety and reliability, identifying potential failures or safety issues before flight tests are conducted [1].
A basic setup for conducting static firing tests on rocket motors includes a test stand, load cells, pressure transducers, other specific sensors (thermocouples, strain gauges, etc.), and a data acquisition system. Figure 2 illustrates a typical configuration for measuring impulse on a test bench used for rocket motors’ static tests (static firing).
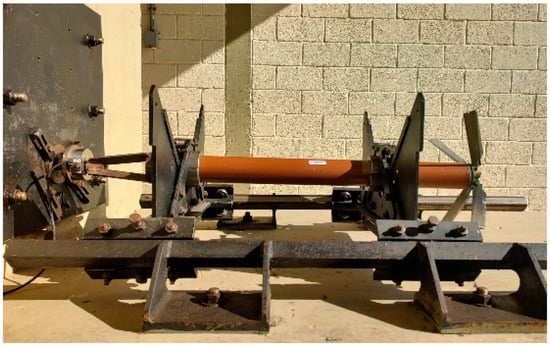
Figure 2.
An example of a rocket motor test firing stand.
Figure 3 presents a typical performance curve of a solid propellant rocket motor, obtained through static tests and a data acquisition system.
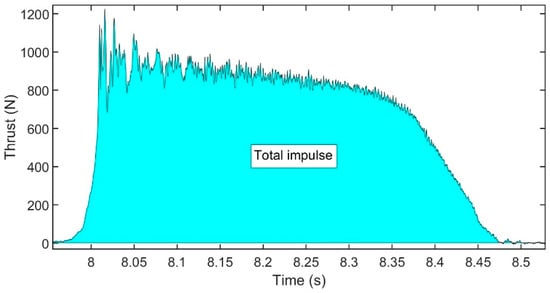
Figure 3.
An example of a typical rocket motor thrust curve. The total impulse is the area under the thrust curve and is generally calculated by numerical integration.
From the thrust graph exemplified in Figure 3, the total impulse is defined as the area under the thrust curve as follows:
where is the total impulse in , and is the rocket motor thrust in . Generally, numerical integration is performed to obtain the total impulse, and this computation might introduce errors.
Indeed, it is well established that no measurement or test is perfect and that imperfections give rise to measurement errors in the result. Consequently, the result of a measurement is only an approximation of the value of the measurement. It is only complete when accompanied by a statement of the uncertainty of this approximation.
According to ISOGUM [8], the uncertainty of the measurement result is a parameter associated with the measurement result that characterizes the dispersion of values that can reasonably be attributed to the measurand.
Metrological reliability in the static testing of rocket motors is a little-explored field but is of great importance in aerospace engineering. Highlighting what was previously mentioned, static tests are fundamental for evaluating the performance of rocket motors before they are used in actual launches. The search for methodologies to increase the accuracy of thrust and total impulse measurements motivates studies focusing on sensor calibration and implementing advanced data analysis techniques to minimize errors and uncertainties.
Recent research on the static testing of rocket motors highlights various advancements and methodologies. However, each measurement chain has intrinsic characteristics and requires specific analysis. The propulsion jet testing laboratory at the Brazilian Army Technological Center has a gap in determining uncertainties in the measurement system and using this information for compliance assessment.
Studies focusing on developing and optimizing thrust measurement systems to evaluate rocket motor performance emphasize the need for accurate measurements using load cells and thrust stands [9,10]. Another significant effort discussed the development of a static test bench that considered two thrust measurement axes arranged at 90° [11].
A study by Shukla et al. [12] also presented an approach to small-scale rocket motor thrust stand designs that emphasize the importance of accurate thrust measurements but address the topic without considering measurement uncertainty.
Roberts et al. [13] presented an uncertainty analysis for thrust measurement of turbofan engines used in civil aviation, among other key insights.
Taylor et al. [14] presented the uncertainty analysis of the thrust measurement system for axial force transmitted through an array of 10 load cells, five of which are under tension and five of which are under compression.
Sims and Coleman [15] analyzed hysteresis and uncertainty in Test Stand 500 at the NASA Marshall Space Flight Center East Test Area, a facility for testing hybrid rocket engines.
Other authors [16,17] have focused on evaluating thrust measurement uncertainty without assessing its effect on total impulse determination. Another article [10] evaluates the uncertainties associated with thrust values obtained during these tests for two different configurations of measurement chains, using the theories of combined and expanded uncertainties. The results indicated that using signal amplifiers increased the measurement uncertainty in the analyzed chain.
Similarly, Davidian et al. [17] detailed the uncertainty analysis for calculating the specific impulse of rocket motors, carried out at the NASA Lewis Research Center. The measured and calculated parameters were listed, including their nominal values, precision errors, degrees of freedom, and uncertainties expressed as percentages. The analysis revealed that the test facility could measure specific impulse with an uncertainty of 1.30%.
Otomański and Szlachta [18] presented the possibilities of utilizing the integrated LabVIEW environment to evaluate the uncertainty of measurement results in direct measurements. They also discussed the possibilities of presenting and visualizing the uncertainty of measurement results in a convenient and user-friendly form, and this methodology could be applied to acquisition programs.
The studies mentioned in this part of the manuscript, such as those by Glascock et al. [2], Takano et al. [3], and Wentao Li et al. [4], highlight significant advancements in propulsion technologies, ranging from electric solid propellants to innovative fuel grain geometries and machine learning applications. However, these works focus on developing new technologies and materials without addressing the uncertainty analysis in measuring critical parameters, such as thrust and total impulse.
Similarly, studies like those by Shukla et al. [12] and Roberts et al. [13] address thrust measurement but do not consider the propagation of uncertainty along the measurement chain or the impact of signal oscillations on the accuracy of the results. These limitations in previous studies underscore the need for a more comprehensive and robust approach, as proposed in this study.
The main objective of this work is to fill this gap by proposing a robust methodology for determining the uncertainty in the estimation of total impulse, considering the propagation of uncertainty in thrust measurement through numerical integration using the trapezoidal method.
Additionally, this study aims to evaluate the impact of signal oscillations on the accuracy of the results, offering a more complete and reliable approach for uncertainty analysis in static tests of rocket motors. This methodology improves metrological reliability and provides a foundation for future research and practical applications in the defense industry.
Thus, the present study contributed to this field by focusing on determining the uncertainty in total impulse estimation, considering the propagation of thrust measurement uncertainty in numerical integration using the trapezoidal method, and the impact of signal oscillation on the accuracy of the results. Thrust measurement uncertainty is one of the main sources of error in determining total impulse. To improve metrological reliability, adopting a robust approach to uncertainty propagation was essential. This approach allowed for a more precise and comprehensive assessment of total uncertainty, considering the uncertainties associated with each thrust measurement point over time.
Previous studies addressing thrust measurement and total impulse calculation partially dealt with the problem of uncertainty propagation but did not perform a complete analysis of the expanded uncertainty involved in this process. These works did not explore in detail the oscillations of the acquired digital signal or the impact of post-processing on accuracy and metrological reliability. In this context, the present article fills an important gap in the literature, offering a more robust and comprehensive approach.
2. Materials and Methods
This section describes the measurement system used in the propulsion jets testing laboratory of the Brazilian Army Technological Center, defining the uncertainty characteristics of each component, as well as presenting the methodology used to determine the numerical value of the expanded uncertainty in the measurement of thrust and in the calculation of total impulse. Additionally, it will be verified how the oscillation of the measured signal affects numerical integration used to calculate the total impulse.
2.1. Measurement Chain
The measurement chain under analysis consists of a pancake-type load cell (Flintec model Q50–0.5T, Flintec Inc., Hudson, MA, USA) and a data acquisition and processing system comprising te National Instruments module model NI 9237 (National Instruments Corporation, Austin, TX, USA) (used with load cells utilizing strain gauge as the measurement method); the National Instruments chassis model NI cDAQ-9174; and a proprietary program developed in the LabVIEW 2022 environment. Figure 4 illustrates the measurement chain at the Propulsion Jets Testing Laboratory of the Brazilian Army Technological Center, and it is possible to observe the key subsystems involved in the static rocket motor test: the rocket motor mounting fixture, which securely holds the motor in place, ensuring no movement occurs during testing; the load cell, which measures the thrust generated by the motor by converting the force into an electrical signal; and the data acquisition system, responsible for collecting and processing the data from the load cell and other sensors in real time, enabling the precise performance evaluation of the rocket motor.
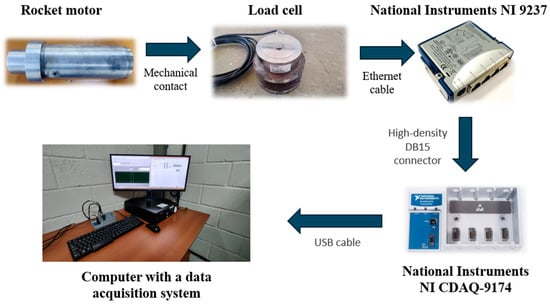
Figure 4.
Measurement chain.
To clarify the operation of a load cell, consider that the model in question is a 2 mV/V load cell, producing an output of 2 millivolts per volt of excitation for its rated load of 5000 N. The output voltage is directly proportional to both the excitation voltage and the applied force, and this specification is used to determine compatibility with data acquisition systems.
In the case of this measurement chain, raw data represented in electrical voltage are converted into engineering units (such as force in N) through a linear equation. The coefficients of this linear equation are determined by comparing the electrical output of the load cell with a standard load cell or with the value of a standard weight, allowing for the precise calibration and conversion of measured values into the desired engineering units.
Two load cells (one standard and one under test) are coupled via an adapter on a tensile and compression machine. Once installed, the load cells undergo mechanical compression testing. The standard load cell serves as a reference to indicate the load to which the evaluated load cell is subjected during the test.
In this way, the system monitors the applied force value. The standard load cell provides accurate and reliable data on the applied force, ensuring that the load cell under test is calibrated correctly. This ensures that the evaluated load cell operates according to desired standards, providing precise and reliable measurements for future tests.
2.2. Mathematical Model of Acquisition
The mathematical model of a system using an NI 9237 module and a Flintec Q50–0.5T load cell can be described in terms of the relationships between the applied force, the sensor output (voltage), and the measurement corrections made by the NI 9237.
The pancake-type load cell converts the applied force F into an output voltage V_out, according to Equation (2):
where is the load cell conversion factor (mV/N) and is the offset voltage when no force is applied.
The NI 9237 module uses remote sensing to correct gain errors caused by the resistance of the excitation wires. Because of the excitation wire resistance, if we consider the excitation voltage and the associated voltage drop , the effective excitation voltage applied is
The module compensates for voltage drop by adjusting the output reading to reflect the correct excitation voltage.
Incorporating the load cell sensitivity and measurement corrections, the final relationship between the applied force and the system output is
where is the output voltage corrected by the NI 9237 module, is the conversion factor, and is the offset voltage. Table 1 specifies the numerical values for the conversion factor and the offset voltage the load cell manufacturer provided.

Table 1.
Coefficients of the mathematical model.
2.3. Calculation of Chain Measurement Uncertainty
The instruments and equipment used in this process have inherent uncertainties. Therefore, the conversion factors must reflect these specific uncertainties in the measurement chain to ensure the process’s metrological reliability. This investigation is important because conversion coefficient errors directly impact the thrust results obtained after firing tests.
This study explores the calculation of uncertainty involved in converting raw thrust data (voltage in V) into engineering units (force in N). It also addresses the numerical integration of the thrust curve to determine the total impulse, as described in the Subsection “Measurement Chain”.
To assess the uncertainty associated with the conversion factor, concepts of combined uncertainty and expanded uncertainty will be applied. According to the JCGM (2008) [8], uncertainties of input quantities are classified as Type A and Type B. Type A uncertainty is assessed through the statistical analysis of a series of repeated measurements during the test. In contrast, Type B uncertainty is a measure of measurement uncertainty based on information sources that do not rely on repeated observations, as is the case with Type A uncertainty. It is estimated from data such as instrument manufacturer specifications, calibration certificates, technical literature, or expert judgment. This uncertainty arises from various sources, such as instrument precision, calibration errors, and environmental factors that can affect the measurement process.
Regarding Type A uncertainty, by analyzing the spread of data collected during multiple trials, the experimental standard deviation provides a quantitative measure of how much individual measurements deviate from the mean value, thereby offering insight into the reliability and accuracy of the measurement system. In this context, the experimental standard deviation of the measurement chain serves as a measure of uncertainty associated with the mean value, indicating the repeatability of the measurement, as shown in Equation (6), where is the standard deviation of the mean, S is the standard deviation, and n is the number of samples.
On the other hand, Type B uncertainty assessment uses approaches distinct from statistical analyses of a series of repeated measurements conducted during the test. According to the GUM (JCGM 2008) [8], this Type B evaluation relies on other types of knowledge, such as historical data on measurement method performance, uncertainties associated with equipment and standards calibration, technical specifications provided by manufacturers, and prevailing environmental conditions.
Consider quantity y that is dependent on other N quantities through function f, as follows:
When the input quantities are not correlated, combined uncertainty is calculated as expressed in Equation (8):
where is the combined uncertainty, are the sensitivity coefficients, and is the standard uncertainty of each input variable. To calculate the effective degrees of freedom (), ISOGUM [8] suggests using Equation (9), also known as the Welch–Satterthwaite formula. In this equation, represents the degrees of freedom corresponding to each source of uncertainty.
The expanded uncertainty provides an interval around the measurement result within which the true value is expected to lie with a specified level of confidence. This interval, where the true value is expected to lie, is calculated by multiplying the combined standard uncertainty by a coverage factor, denoted as “k”, which is selected based on the probability distribution of the uncertainty and the desired level of confidence. Its selection is crucial, as it directly impacts the reliability and interpretation of the uncertainty interval. A higher value of k increases the confidence level but results in a wider interval. On the other hand, a lower value of k provides a narrower interval, albeit with a reduced confidence level.
3. Results and Discussion
3.1. Calculation of Thrust Measurement Uncertainty
According to the methodology applied in the manuscript [13] and with the purpose of gathering data to perform a statistical analysis, 10 compression tests were conducted, applying a force of 2500 N, using a standard tensile and compression machine. Table 2 describes the ten values indicated by the acquisition system and Type A uncertainty of results.

Table 2.
Measurement results.
Applying the partial derivative of Equation (7) to the mathematical model of the acquisition system represented by Equation (5), and using the mathematical transformations based on Equations (2)–(4), the following sensitivity coefficients are obtained:
Table 3 lists the sources of uncertainty involved in determining the thrust measurement.

Table 3.
Sources of uncertainty.
Thus, the standard combined uncertainty for the thrust measurement is as shown below:
where , , and are, respectively, the standard combined uncertainties due to Type A experimental data, the output voltage corrected by the NI 9237 module, the conversion factor, and the offset voltage of the test load cell.
Based on the values presented in Table 4 and considering , , and , we find , corresponding to 0.12 % of the mean of the test values.

Table 4.
Contribution of each uncertainty source.
Equation 9 should be used to calculate the expanded uncertainty to determine the effective degrees of freedom, enabling the selection of an appropriate coverage factor.
For the calculated number of degrees of freedom, and according to the table in JCGM (2008) [2], it is possible to establish a coverage factor , for a confidence level of 95.45%. Therefore, the combined uncertainty is multiplied by the coverage factor () to obtain the estimated expanded uncertainty () for a measurement chain with an amplified signal.
Table 4 presents the components of measurement uncertainty considered in this study, highlighting the main sources of variability that impact the precision of the results.
An analysis of the data presented in Table 4 indicates that the primary source of uncertainty in the measurement chain is the module of the data acquisition system. This highlights the significant impact of the system’s variability on the overall measurement precision. If it is necessary to mitigate this issue, the use of modules with low parameter variation emerges as an effective method to reduce uncertainties in the measurement chain.
3.2. Calculation of Total Impulse Measurement Uncertainty
As described in Equation (1), the total impulse is the integral of thrust over time (area under the thrust curve). This integration is performed using numerical methods, particularly within this acquisition system, using the trapezoidal rule.
In the trapezoidal rule, the integration is given by
where is the acquisition time interval between two consecutive samples, is the first acquisition point, is the nth acquisition point and is the number of acquisition points. represents the thrust values yielded by the measurement system, each associated with an expanded uncertainty of 5.8932 N, as per Equation (15).
Considering that the time measurement uncertainty is infinitesimal, is a constant expressed by , where is the sampling frequency.
Applying the partial derivative of Equation (7) again to the numerical integration model expressed in Equation (16), the following sensitivity coefficients are obtained:
Since the measurement uncertainty of corresponds to that of the thrust, we have
Additionally, we can consider that the uncertainty due to the error in the numerical integration model can be estimated by the following formula [19]:
where is the second derivative of function evaluated at point ξ in interval . In the case of discrete data, directly estimating can be challenging. A common approach is to use a conservative estimate for the error based on the smoothness of the curve. As the sampling frequency is high, meaning the number of sampled points is sufficiently large, resulting in a reduced spacing h, the numerical integration methods tend to produce very close results.
When the number of subdivisions n reaches the order of thousands, the truncation error in the trapezoidal method decreases substantially due to the term in its error formula, reducing the error to around 10−5. Here, a sampling rate of 25,000 Hz was used, ensuring high precision in the results. Considering the lower computational cost and the simplicity of implementation, the trapezoidal method was chosen to integrate thrust curves in static tests of rocket motors. This choice proved to be appropriate as, at high frequencies, the difference between integration methods became negligible, while computational efficiency was preserved.
As a result, the combined standard uncertainty is primarily dominated by the measurement uncertainty of Equation (21).
In the specific case presented in this article, and shown in Figure 3, the numerical integration yields a total impulse , for , , and . Thus, , corresponding to 0.0035% of the total impulse.
Using the same methodology as thrust to calculate the effective degrees of freedom () of the combined uncertainty of total impulse, the following is discerned:
For the calculated degree of freedom, and according to the table in JCGM (2008) [8], it is possible to establish a coverage factor equal to 2 for a confidence level of 95.45%.
Therefore, the combined uncertainty is multiplied by the coverage factor k to obtain the estimated expanded uncertainty () for the numerical integration of the thrust signal.
3.3. The Influence of the Measured Signal’s Oscillation
This section examines how the oscillation of the measured signal affects the error in the numerical integration used to calculate the total impulse.
It is well understood that the issues to be considered in thrust measurement during static testing are the resonant vibration characteristics between the mounting structure and the installed rocket motor [1].
The oscillation in the signal measured by the load cell during static rocket motors tests can result from a combination of factors.
Among the most common are mechanical vibrations induced by the motor’s operation, such as gas flow turbulence, which are transmitted to the load cell and cause signal oscillations. This phenomenon is typical in static tests due to the strong interaction between the motor and the test stand.
Another relevant factor is structural resonance, which occurs when the test stand or the motor itself operates at a frequency close to its natural resonance frequency. This amplifies vibrations and consequently affects the thrust measurement.
Additionally, electronic noise can influence the load cell’s signal, caused by electromagnetic interference from cables and other equipment at the test site.
Inadequate sampling frequency can also lead to distortions. If the data acquisition rate is not high enough to accurately capture the load cell’s response, phenomena such as aliasing may occur, resulting in apparent signal oscillations.
Finally, dynamic coupling between the motor and the load cell may introduce additional forces resulting from lateral or angular movements, leading to undesirable signal oscillations.
To mitigate these effects, some solutions include applying digital filters, such as the low-pass filter, which attenuates high-frequency oscillations, and the notch filter, which eliminates specific frequencies, such as resonances and electromagnetic interference.
Another approach is to use vibration dampers, shock absorbers, or isolating supports between the motor and the load cell, as well as analyze and adjust the natural frequencies of the test structure, thus avoiding unwanted resonances.
These factors directly impact the accuracy of the total impulse calculation, as signal oscillations can distort the result of the thrust integral over time. Properly controlling these variables is essential to ensure reliable measurements. In this study, we apply digital signal filters to mitigate the oscillation.
To evaluate how the application of a digital filter affects the numerical integration of the thrust signal in obtaining the total impulse, we will conduct a case study based on a thrust signal acquired during the static firing test of a rocket motor in the Army Technology Center’s laboratory. Figure 5 shows the profile of this signal.
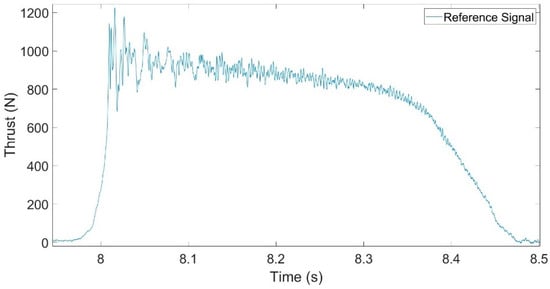
Figure 5.
Thrust vs. time for a static firing test.
The reference signal exhibits an oscillatory behavior that can impact measurement accuracy, particularly in applications such as numerical thrust integration. Using MATLAB R2024b software, we analyzed the frequency distribution of the reference signal through a Fast Fourier Transform—FFT—to identify frequency components contributing to the observed oscillatory characteristics. This technique enables a clear examination of the signal’s frequency distribution, aiding in the identification of components that contribute to the oscillations. With this information, we can select and adjust an appropriate digital filter to effectively attenuate unwanted oscillations, enhancing the thrust signal quality and achieving more precise total impulse measurements. Figure 6 illustrates the frequency spectrum of the normalized thrust signal.
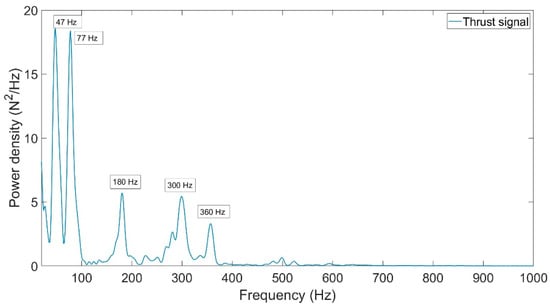
Figure 6.
Thrust signal frequency spectrum over the DC—1000 Hz band.
The frequency spectrum analysis of the reference signal revealed oscillations at 47 Hz, 77 Hz, 180 Hz, 300 Hz, and 360 Hz. Two types of digital filters were applied to filter out these unwanted oscillations: first, third-order notch filters at 47 Hz and 77 Hz, followed by a low-pass filter with a 100 Hz cutoff frequency to mitigate the inherent oscillations in the thrust signal.
The result of this filtering process is shown in Figure 7, where it is possible to view the reference signal alongside the filtered signal.
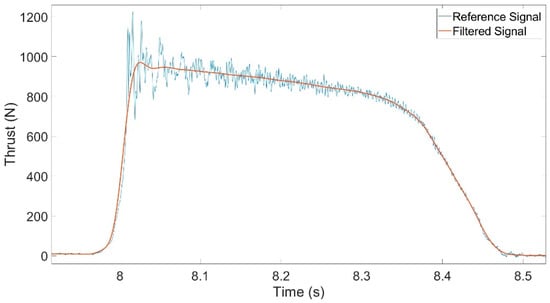
Figure 7.
Filtered signal.
After the filtering process, numerical integrations were performed on both the reference signal and the filtered signals, in accordance with the requirements of the ABNT NBR 8167 standard [20], to evaluate their impact on the total impulse calculation. The results of these integrations are presented in Table 5, providing a comparative view of how filters influence the measurement outcomes.

Table 5.
Comparison of numerical integration in unfiltered and filtered signals.
The data analysis in the table reveals that the effect of the oscillations in the total impulse is a negligible 0.04% of the total impulse value. The application of digital filters, often used to eliminate noise or smooth the captured signals, had a negligible effect on the calculated value of the total impulse. Thus, the stability of the results suggests that the measurement process is consistent, even when some noises or variations could be filtered.
This low impact of the digital filters on calculating of the total impulse indicates that the raw data already present high quality or that the filters are adjusted in a way that does not introduce significant distortions. Therefore, filters serve more to improve the graphical visualization of the results than as a tool to correct large disturbances. The low influence of the filters reinforces confidence in the data and in the methods used to calculate the total impulse.
Nevertheless, if the maximum value of the thrust is needed for further analysis, the filtering has a large impact, reducing the maximum value from 1226.68 N to 970.85 N, a difference of 20.86%. This fact could justify employing digital filters to improve raw data quality.
4. Conclusions
This study detailed the measurement uncertainty associated with the instrument chain used to measure rocket motor thrust and evaluated the uncertainty associated with the numerical integration of these measurements using the trapezoidal method to determine total impulse.
The measurement uncertainty in the thrust acquisition of static firing test at the Propulsion Jets Testing Laboratory of the Brazilian Army Technological Center resulted in a value of 5.8932 N (0.24%). This magnitude is considered low, indicating significant reliability in the data obtained during the experimental tests.
Subsequently, the uncertainty associated with the numerical integration of thrust measurements using the trapezoidal method was addressed. While this method is simple and efficient, it can introduce additional uncertainties due to data discretization. By propagating the uncertainties of thrust measurements throughout the integration process, it was possible to quantify the uncertainty in the calculation of total impulse in 0.0252 Ns (0.0070%).
Furthermore, the analysis of percentual uncertainty in the numerical integration of the collected data yielded similar results to those of direct thrust measurement, owing to the substantial number of data points sampled during the experiment. This study underscores the importance of rigorous uncertainty analysis in validating experimental results and improving measurement and analysis processes.
Integrating uncertainty calculations from thrust measurements and numerical integration offers a comprehensive view of rocket motor test accuracy. This study underscores the importance of rigorous uncertainty analysis to validate experimental results and guide improvements in measurement and analysis processes.
Ultimately, a verification was carried out to determine whether the oscillation of the measured signal could affect the uncertainty in the numerical integration used to calculate total impulse, especially in static rocket motor tests, where mechanical vibrations, structural resonance, and electronic noise are critical factors. These factors could distort thrust measurements over time, compromising the accuracy of the total impulse calculation.
The results obtained after applying digital filters and numerically integrating the thrust signals showed that the variation in the total impulse calculation was minimal. The difference was below 0.04% of the total impulse value, indicating that the signal oscillations had a negligible impact.
The detailed methodology for evaluating measurement uncertainty presented in this article was developed to ensure metrological reliability in rocket motor testing. The approach adopted for uncertainty propagation and digital signal analysis is sufficiently robust to be replicated in other experimental scenarios or similar measurement chains. This characteristic makes the method applicable to different laboratories and contexts, contributing to the standardization and improvement of data quality in propulsion-related studies.
Furthermore, the results indicated that the uncertainties associated with thrust measurement and total impulse calculation, in the case under study, do not significantly affect the rocket’s overall performance. The variations found are within acceptable limits, ensuring that the measured values are suitable for planning, developing, and validating rocket motors. Thus, the analysis reinforces the data’s reliability and relevance for practical applications in the aerospace field.
In conclusion, the primary contribution of this work lies in demonstrating that measurement uncertainty analysis can be applied effectively to enhance the metrological reliability of results, even in scenarios where direct comparisons are unfeasible. By addressing the challenges associated with uncertainty quantification in static rocket motor testing, this study provides a practical framework for improving measurement accuracy and confidence in critical applications. For future research, we recommend pursuing collaborations that enable more comprehensive comparative analyses, further validating and expanding the methodologies presented here. Such efforts would strengthen the findings and contribute to advancing best practices in metrology for the defense industries.
Author Contributions
Conceptualization, F.d.P.L.C., C.R.H.B. and E.C.d.O.; methodology, F.d.P.L.C., C.R.H.B. and E.C.d.O.; software, F.d.P.L.C., C.R.H.B. and E.C.d.O.; validation, F.d.P.L.C., C.R.H.B. and E.C.d.O.; formal analysis, F.d.P.L.C., C.R.H.B. and E.C.d.O.; investigation, F.d.P.L.C., C.R.H.B. and E.C.d.O.; resources, F.d.P.L.C., C.R.H.B. and E.C.d.O.; data curation, F.d.P.L.C., C.R.H.B. and E.C.d.O.; writing—original draft preparation, F.d.P.L.C., C.R.H.B. and E.C.d.O.; writing—review and editing, F.d.P.L.C., C.R.H.B. and E.C.d.O.; visualization, F.d.P.L.C., C.R.H.B. and E.C.d.O.; supervision, F.d.P.L.C., C.R.H.B. and E.C.d.O.; project administration, F.d.P.L.C., C.R.H.B. and E.C.d.O.; funding acquisition, F.d.P.L.C., C.R.H.B. and E.C.d.O. All authors have read and agreed to the published version of the manuscript.
Funding
The authors are grateful for the financial support provided by the scholarship from the Brazilian agency CNPq (305479/2021-0). This study was financed in part by the Coordenação de Aperfeiçoamento de Pessoal de Nível Superior—Brasil (CAPES)—Finance Code 001.
Institutional Review Board Statement
Not applicable.
Informed Consent Statement
Not applicable.
Data Availability Statement
The original contributions presented in this study are included in the article. Further inquiries can be directed to the corresponding author.
DURC Statement
The present research is limited to the academic field of uncertainty analysis in the measurement of thrust and total impulse of rocket motors, which is beneficial for assessing the metrological reliability of static firing tests of rocket motors and does not pose a threat to public health or national security. The authors acknowledge the potential dual use of research involving rocket motors and confirm that all necessary precautions have been taken to prevent potential misuse. As an ethical responsi-bility, authors strictly adhere to relevant national and international laws about DURC. Authors advocate for responsible deployment, ethical considerations, regulatory compliance, and trans-parent reporting to mitigate misuse risks and foster beneficial outcomes.
Acknowledgments
The authors thank the Propulsion Jets Testing Laboratory of the Brazilian Army Technological Center for their willingness to conduct the tests.
Conflicts of Interest
The authors declare that the research was conducted in the absence of any commercial or financial relationships that could be construed as a potential conflict of interest.
References
- Sutton, G.P.; Biblarz, O. Rocket Propulsion Elements; John Wiley & Sons: Hoboken, NJ, USA, 2011. [Google Scholar]
- Glascock, M.S.; Rovey, J.L.; Polzin, K.A. Impulse and Performance Measurements of Electric Solid Propellant in a Laboratory Electrothermal Ablation-Fed Pulsed Plasma Thruster. Aerospace 2020, 7, 70. [Google Scholar] [CrossRef]
- Takano, A.; Yoshino, K.; Fukushima, Y.; Kitamura, R.; Funami, Y.; Takahashi, K.; Takahashi, A.; Kunihiro, Y.; Miyake, M.; Masai, T.; et al. System Design and Launch of a Hybrid Rocket with a Star-Fractal Swirl Fuel Grain Toward an Altitude of 15 km. Appl. Sci. 2024, 14, 11297. [Google Scholar] [CrossRef]
- Li, W.; Li, W.; He, Y.; Liang, G. Reverse Design of Solid Propellant Grain for a Performance-Matching Goal: Shape Optimization via Evolutionary Neural Network. Aerospace 2022, 9, 552. [Google Scholar] [CrossRef]
- Cha, J.; de Oliveira, É.J. Performance Comparison of Control Strategies for a Variable-Thrust Solid-Propellant Rocket Motor. Aerospace 2022, 9, 325. [Google Scholar] [CrossRef]
- Adair, D.; Nagimova, A.; Jaeger, M. Effect of Thrust on the Structural Vibrations of a Nonuniform Slender Rocket. Math. Comput. Appl. 2020, 25, 29. [Google Scholar] [CrossRef]
- Wu, Q.; Ren, Q. Tuning the Ballistic Performance of a Single-Burning-Rate Grain Solid Rocket Motor via New Discontinuous Embedded Metal Wires. Aerospace 2024, 11, 308. [Google Scholar] [CrossRef]
- Joint Committee for Guides in Metrology. Evaluation of Measurement Data—Guide to the Expression of Uncertainty in Meas-453 Urement; BIPM, IEC, IFCC, ILAC, ISO, IUPAC, 454 IUPAP, and OIML, JCGM 100:2008, GUM 1995 with minor corrections; International Bureau of Weights and Measures (BIPM): Sèvres, France, 2008. [Google Scholar]
- Desrochers, M.F.; Olsen, G.W.; Hudson, M.K. A Ground Test Rocket Thrust Measurement System. J. Pyrotech. 2001, 14, 50. [Google Scholar]
- Rezende, R.N.; Alves, L.R.; Mishra, A.; Shukla, H.; Varshney, H.; Dhawan, H.; Kapoor, S.; Jain, U.; Mendonsa, R. Designing a Thrust Vector Test Stand for the TurboRocket. In Proceedings of the AIAA Propulsion and Energy 2021 Forum, Virtual Event, 9–11 August 2021; p. 3350. [Google Scholar]
- Jain, U.; Shukla, H.; Kapoor, S.; Pandey, A.; Nirwal, H. Design and Analysis of 2-Axis Rocket Motor Stand for Thrust Vectoring. In Proceedings of the AIAA Propulsion and Energy 2020 Forum, Virtual Event, 24–28 August 2020; p. 3920. [Google Scholar]
- Shukla, H.; Jain, U.; Kumar, D. Preliminary Design Approach for Sub-Scale Rocket Motor Thrust Stand. In Recent Advances in Mechanical Engineering: Select Proceedings of ERCAM 2021; Springer Nature: Singapore, 2022; pp. 1–17. [Google Scholar]
- Roberts, J.; Lewis, J.; Glicken, D.; Morin, R.; Mancini, J.; Haas, D. Engine Thrust Measurement Uncertainty. In Proceedings of the 21st Joint Propulsion Conference, Monterey, CA, USA, 8–11 July 1985; p. 1404. [Google Scholar]
- Taylor, R.P.; Steele, W.G.; Douglas III, F. Uncertainty Analysis of Rocket Motor Thrust Measurements with Correlated Biases. ISA Trans. 1995, 34, 253–259. [Google Scholar] [CrossRef]
- Sims, J.D.; Coleman, H.W. Hysteresis Effects on Thrust Measurement and Its Uncertainty. J. Propuls. Power 2003, 19, 506. [Google Scholar] [CrossRef]
- Fernandes, F.A.C.; Souto, C.D.A.; Pirk, R. Static Firing Tests of Solid Propellant Rocket Motors: Uncertainty Levels of Thrust Measurements. J. Aerosp. Technol. Manag. 2022, 14, e2022. [Google Scholar] [CrossRef]
- Davidian, K.J.; Dieck, R.H.; Chuang, I. A Detailed Description of the Uncertainty Analysis for High Area Ratio Rocket Nozzle Tests at the NASA Lewis Research Center. In Proceedings of the 24th JANNAF Combustion Meeting, Monterey, CA, USA, 5–9 October 1987. [Google Scholar]
- Otomański, P.; Szlachta, A. The Evaluation of Expanded Uncertainty of Measurement Results in Direct Measurements Using the LabVIEW Environment. Meas. Sci. Rev. 2008, 8, 147. [Google Scholar] [CrossRef]
- Canale, R.P.; Chapra, S.C. Numerical Methods for Engineers; McGraw-Hill Education: New York, NY, USA, 2014. [Google Scholar]
- ABNT NBR 8167; Parâmetros de Desempenho Propulsivo de Motor-Foguete a Propelente Sólido—Curvas Típicas de Leitura e Interpretação. Associação Brasileira de Normas Técnicas: Rio de Janeiro, Brazil, 2012.
Disclaimer/Publisher’s Note: The statements, opinions and data contained in all publications are solely those of the individual author(s) and contributor(s) and not of MDPI and/or the editor(s). MDPI and/or the editor(s) disclaim responsibility for any injury to people or property resulting from any ideas, methods, instructions or products referred to in the content. |
© 2025 by the authors. Licensee MDPI, Basel, Switzerland. This article is an open access article distributed under the terms and conditions of the Creative Commons Attribution (CC BY) license (https://creativecommons.org/licenses/by/4.0/).