
Sound-Quality Perception in Hair Dryers: Functional Near-Infrared Spectroscopy Evidence of Left-Lateralized Dorsolateral Prefrontal Cortex Activation


Abstract
1. Introduction
2. Related Work
2.1. Effects of Product Sound Design
2.2. Methods of Evaluating Perceived Quality of Product
3. Materials and Methods
3.1. Participants
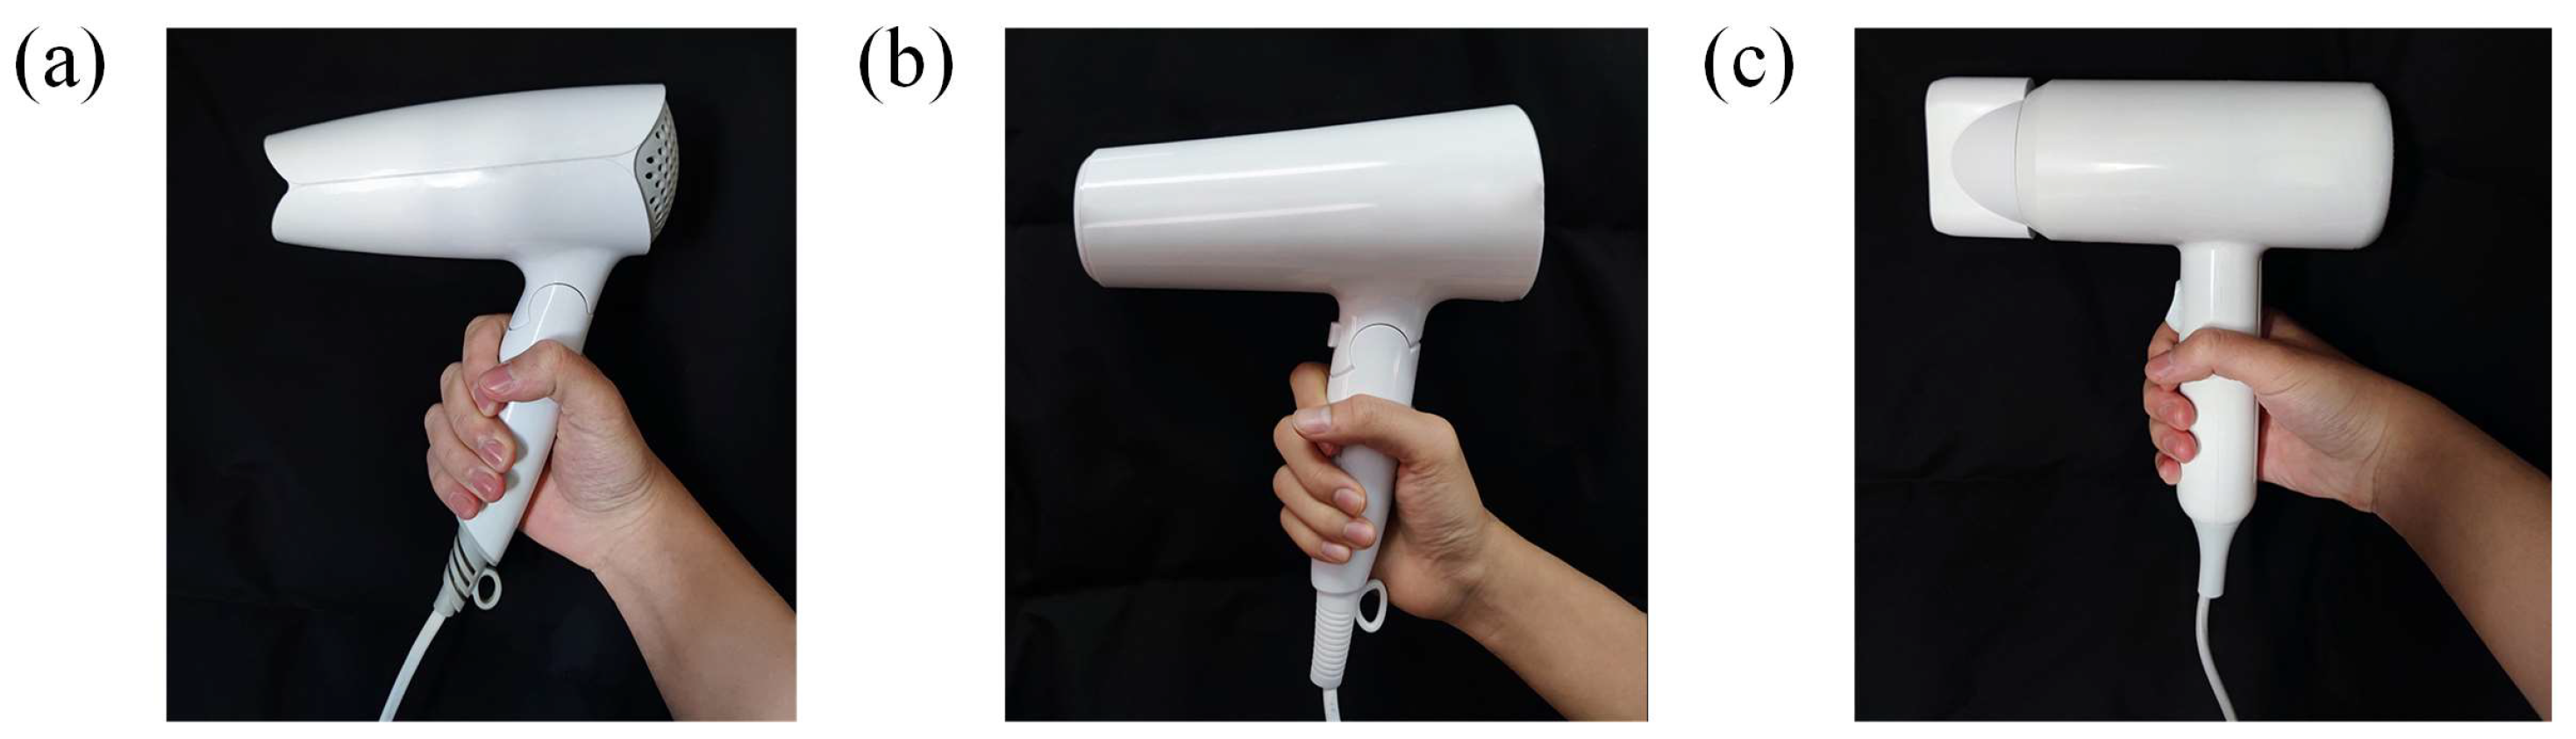
3.2. Stimuli
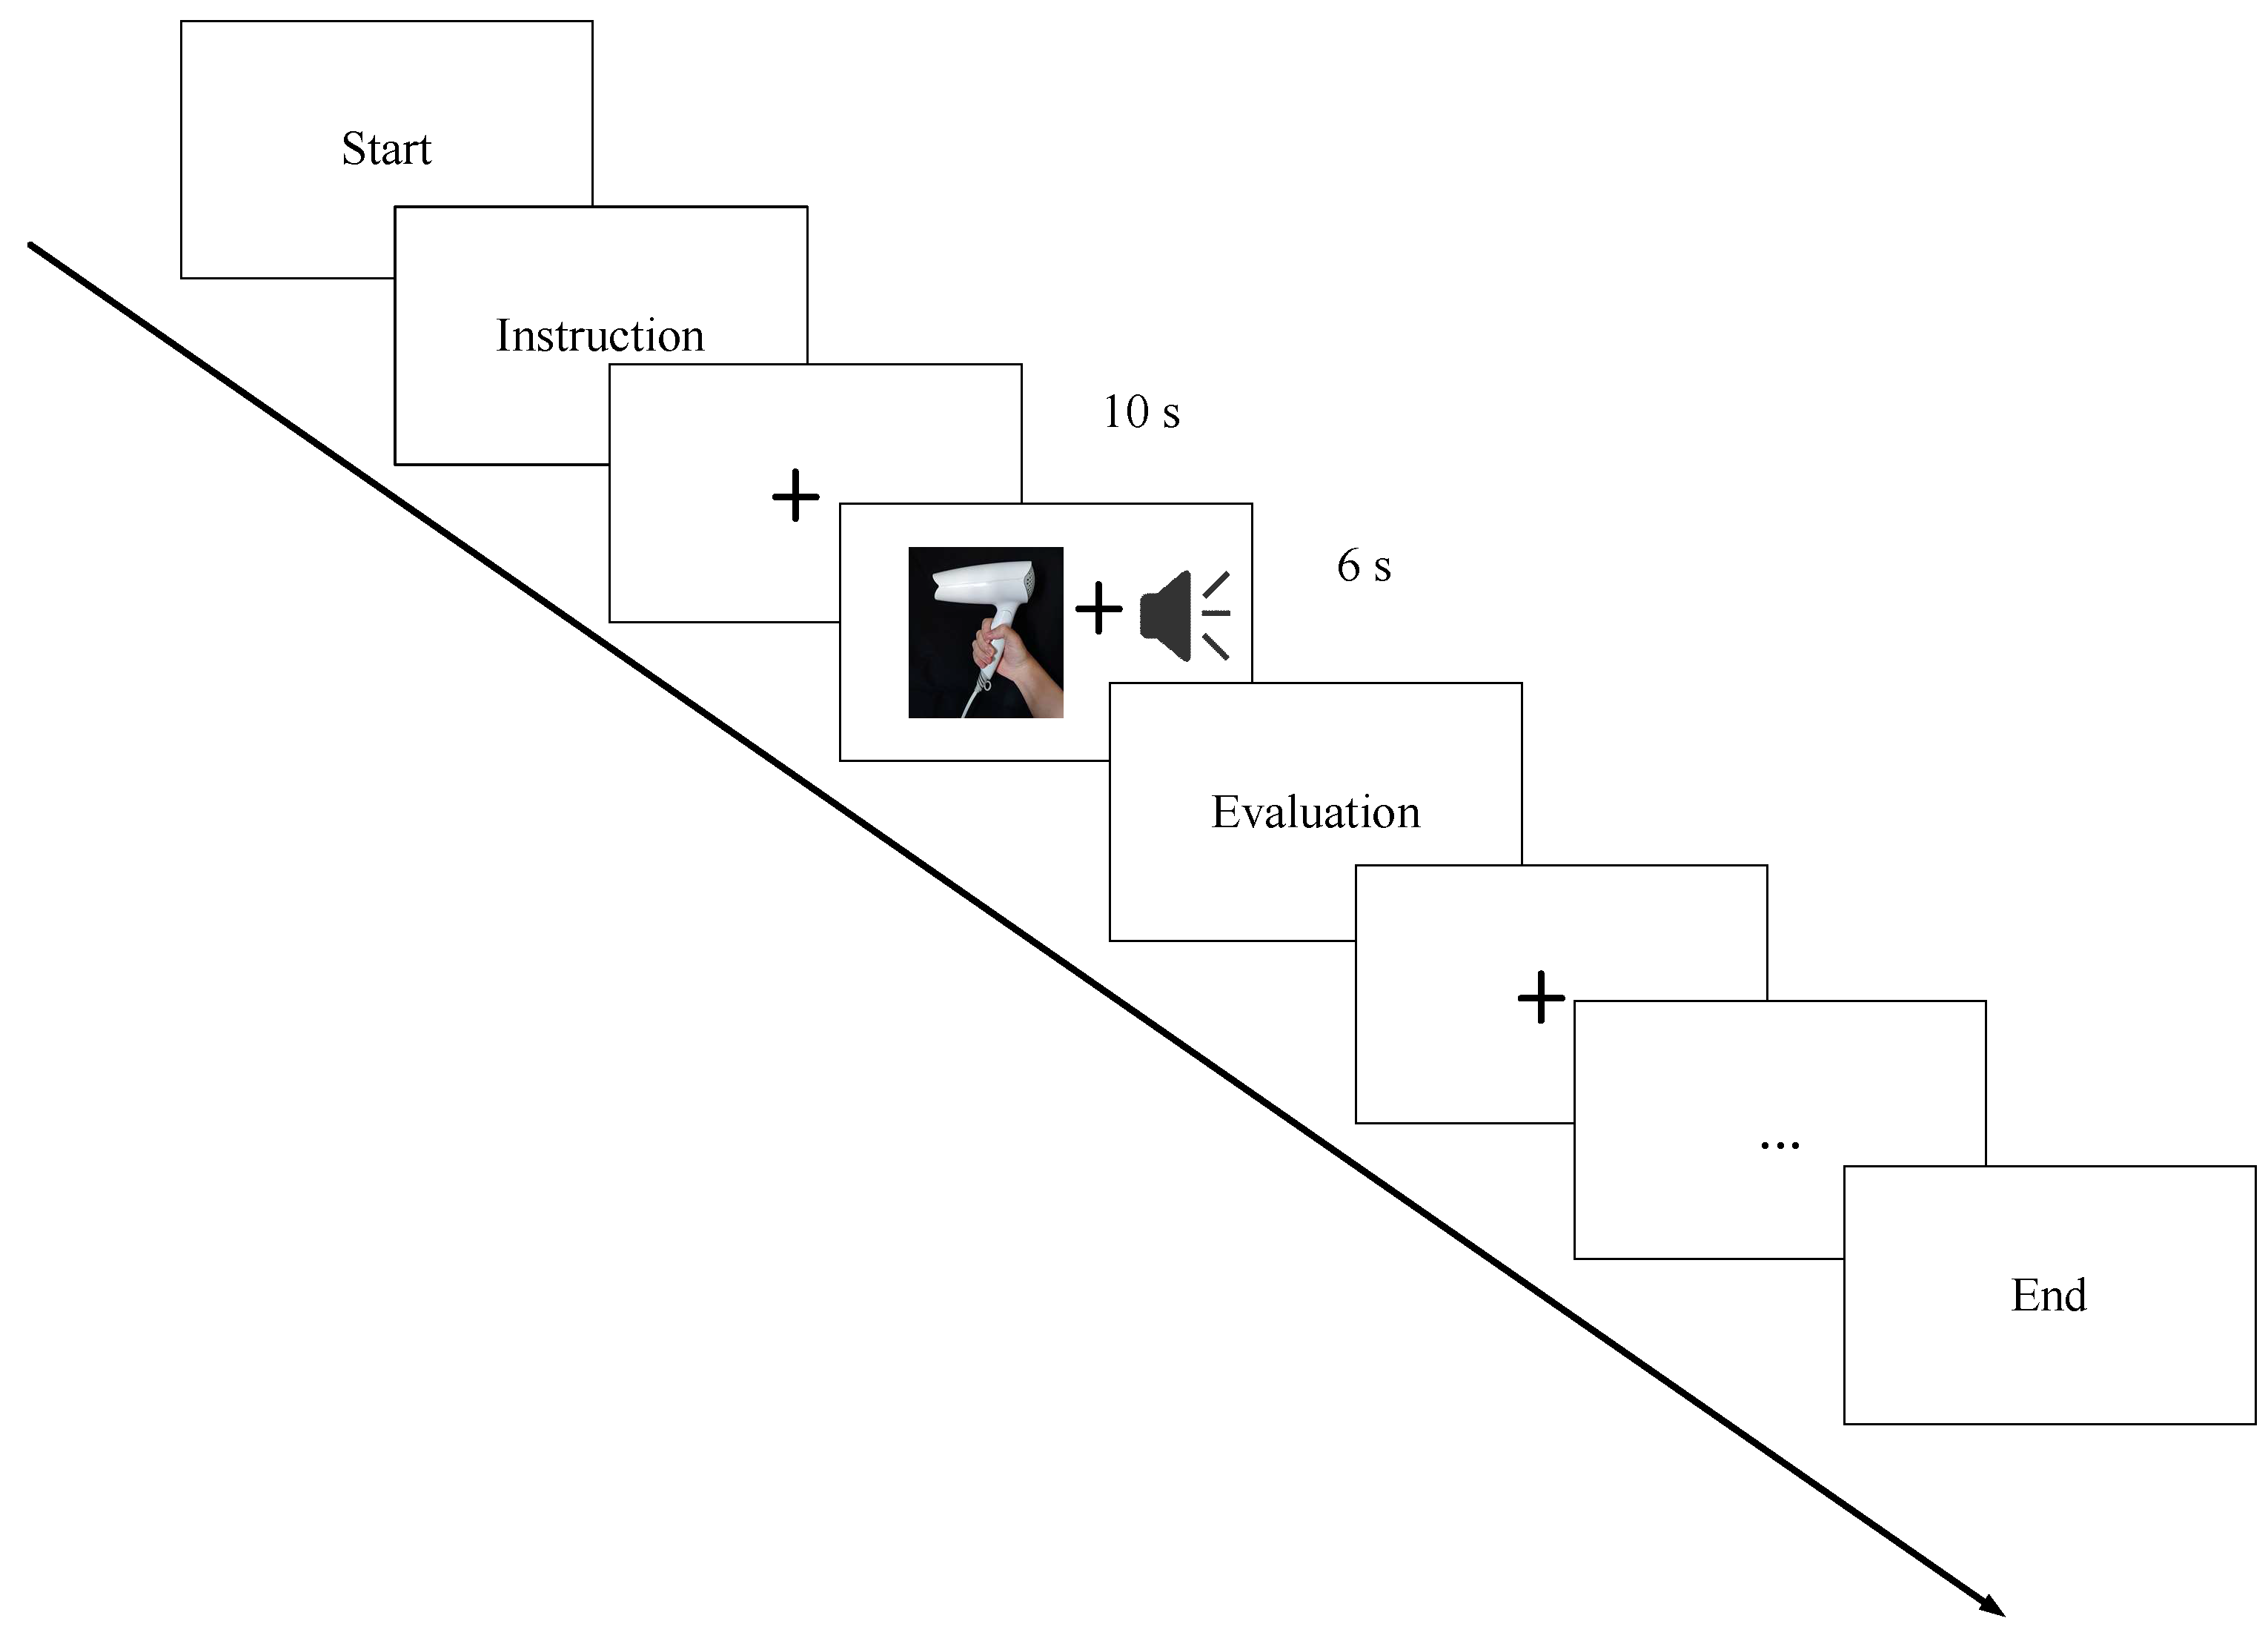
3.3. Procedure
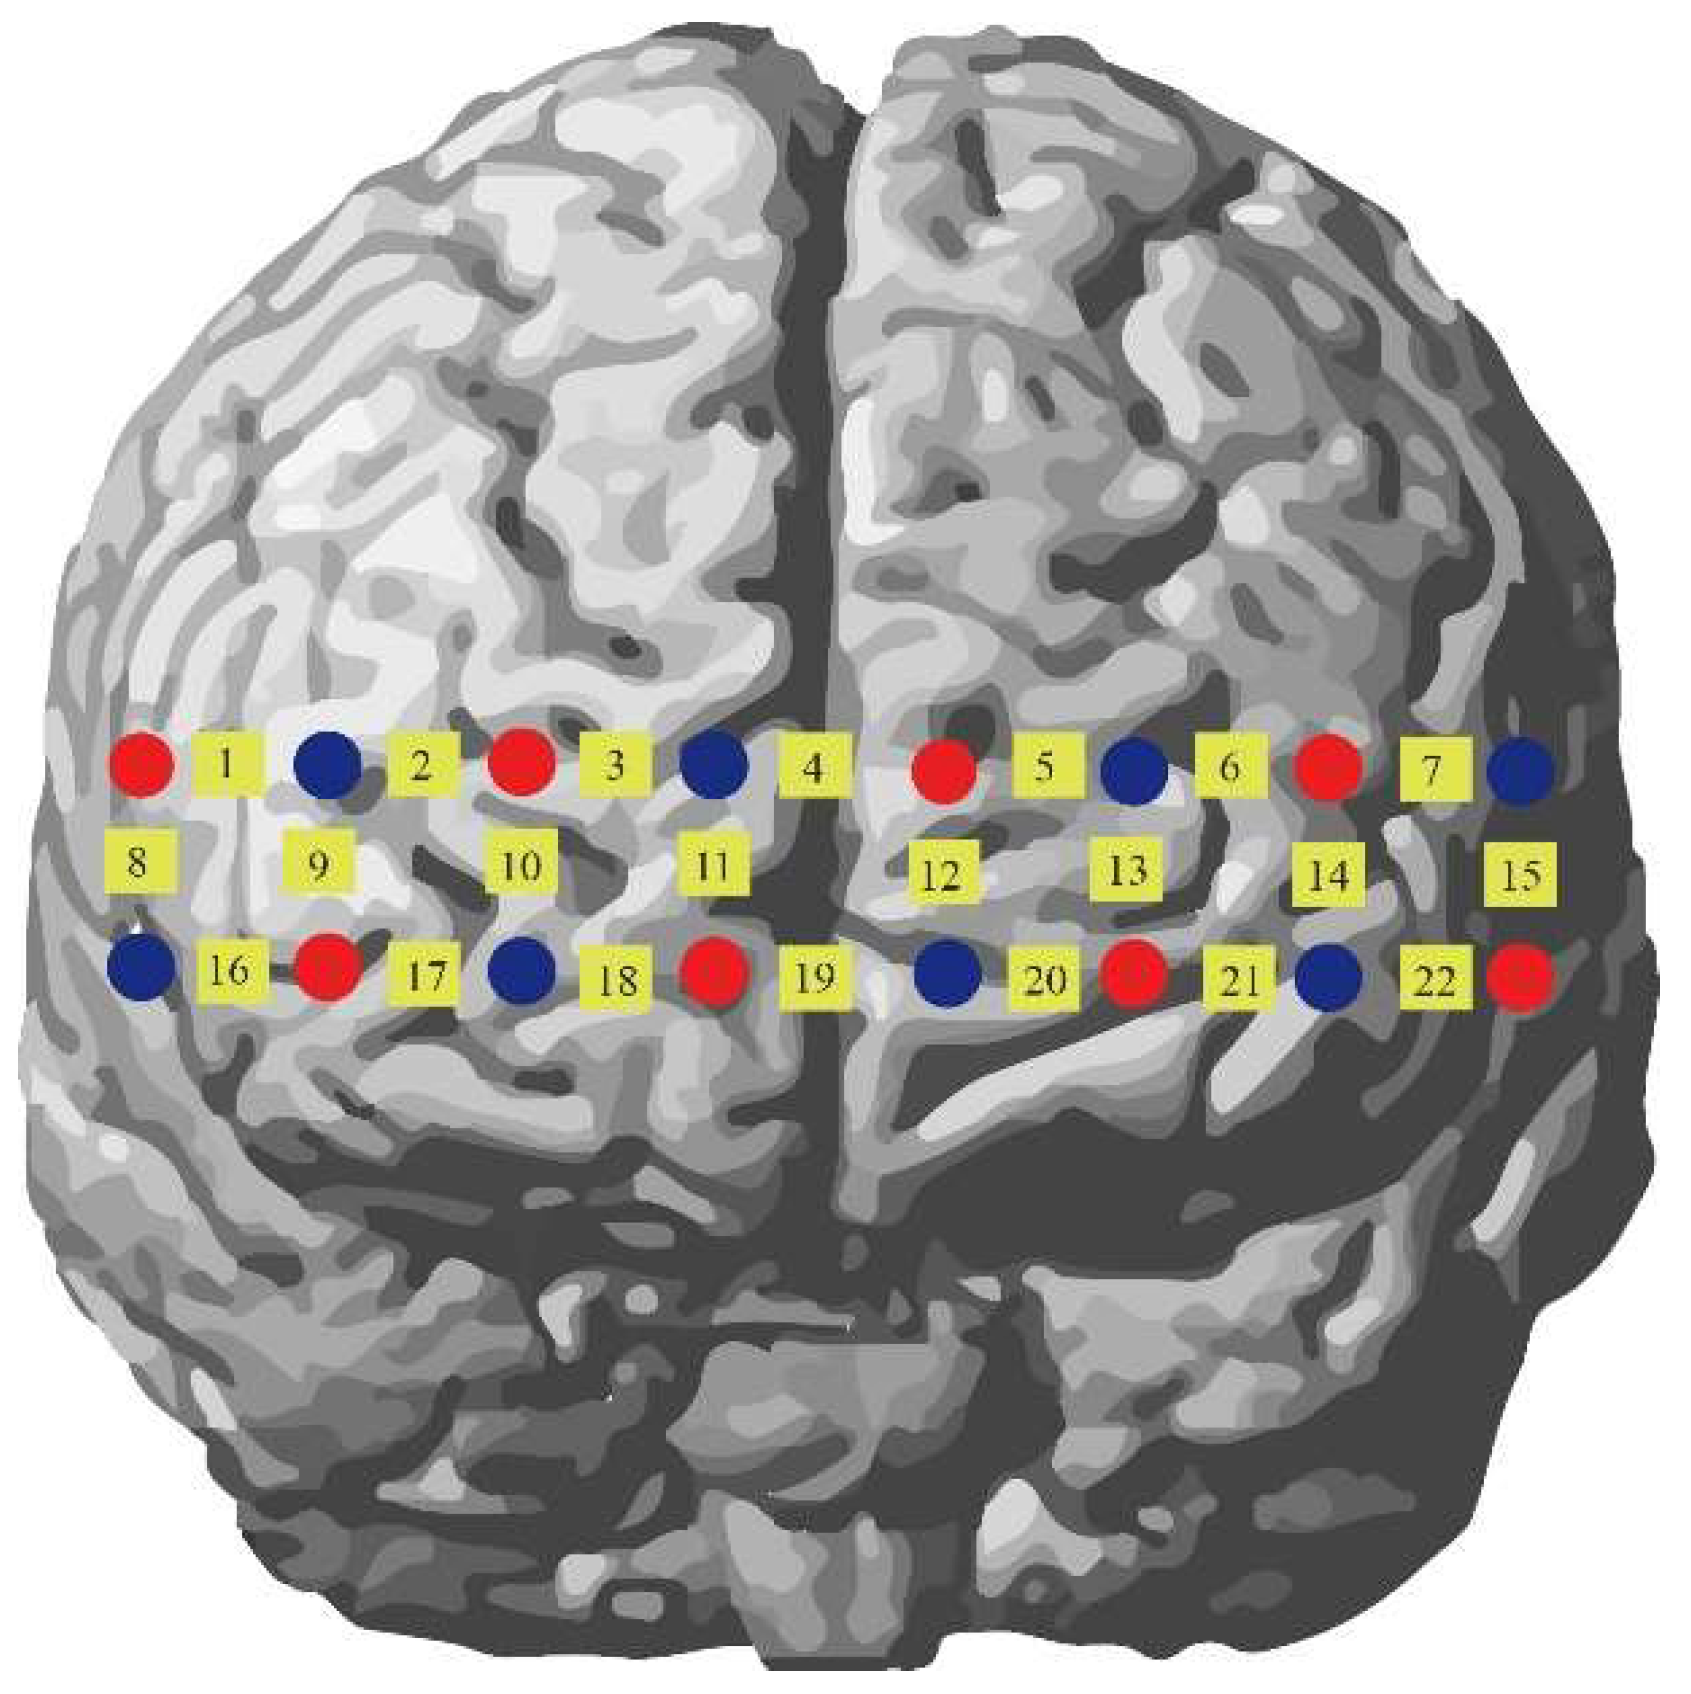
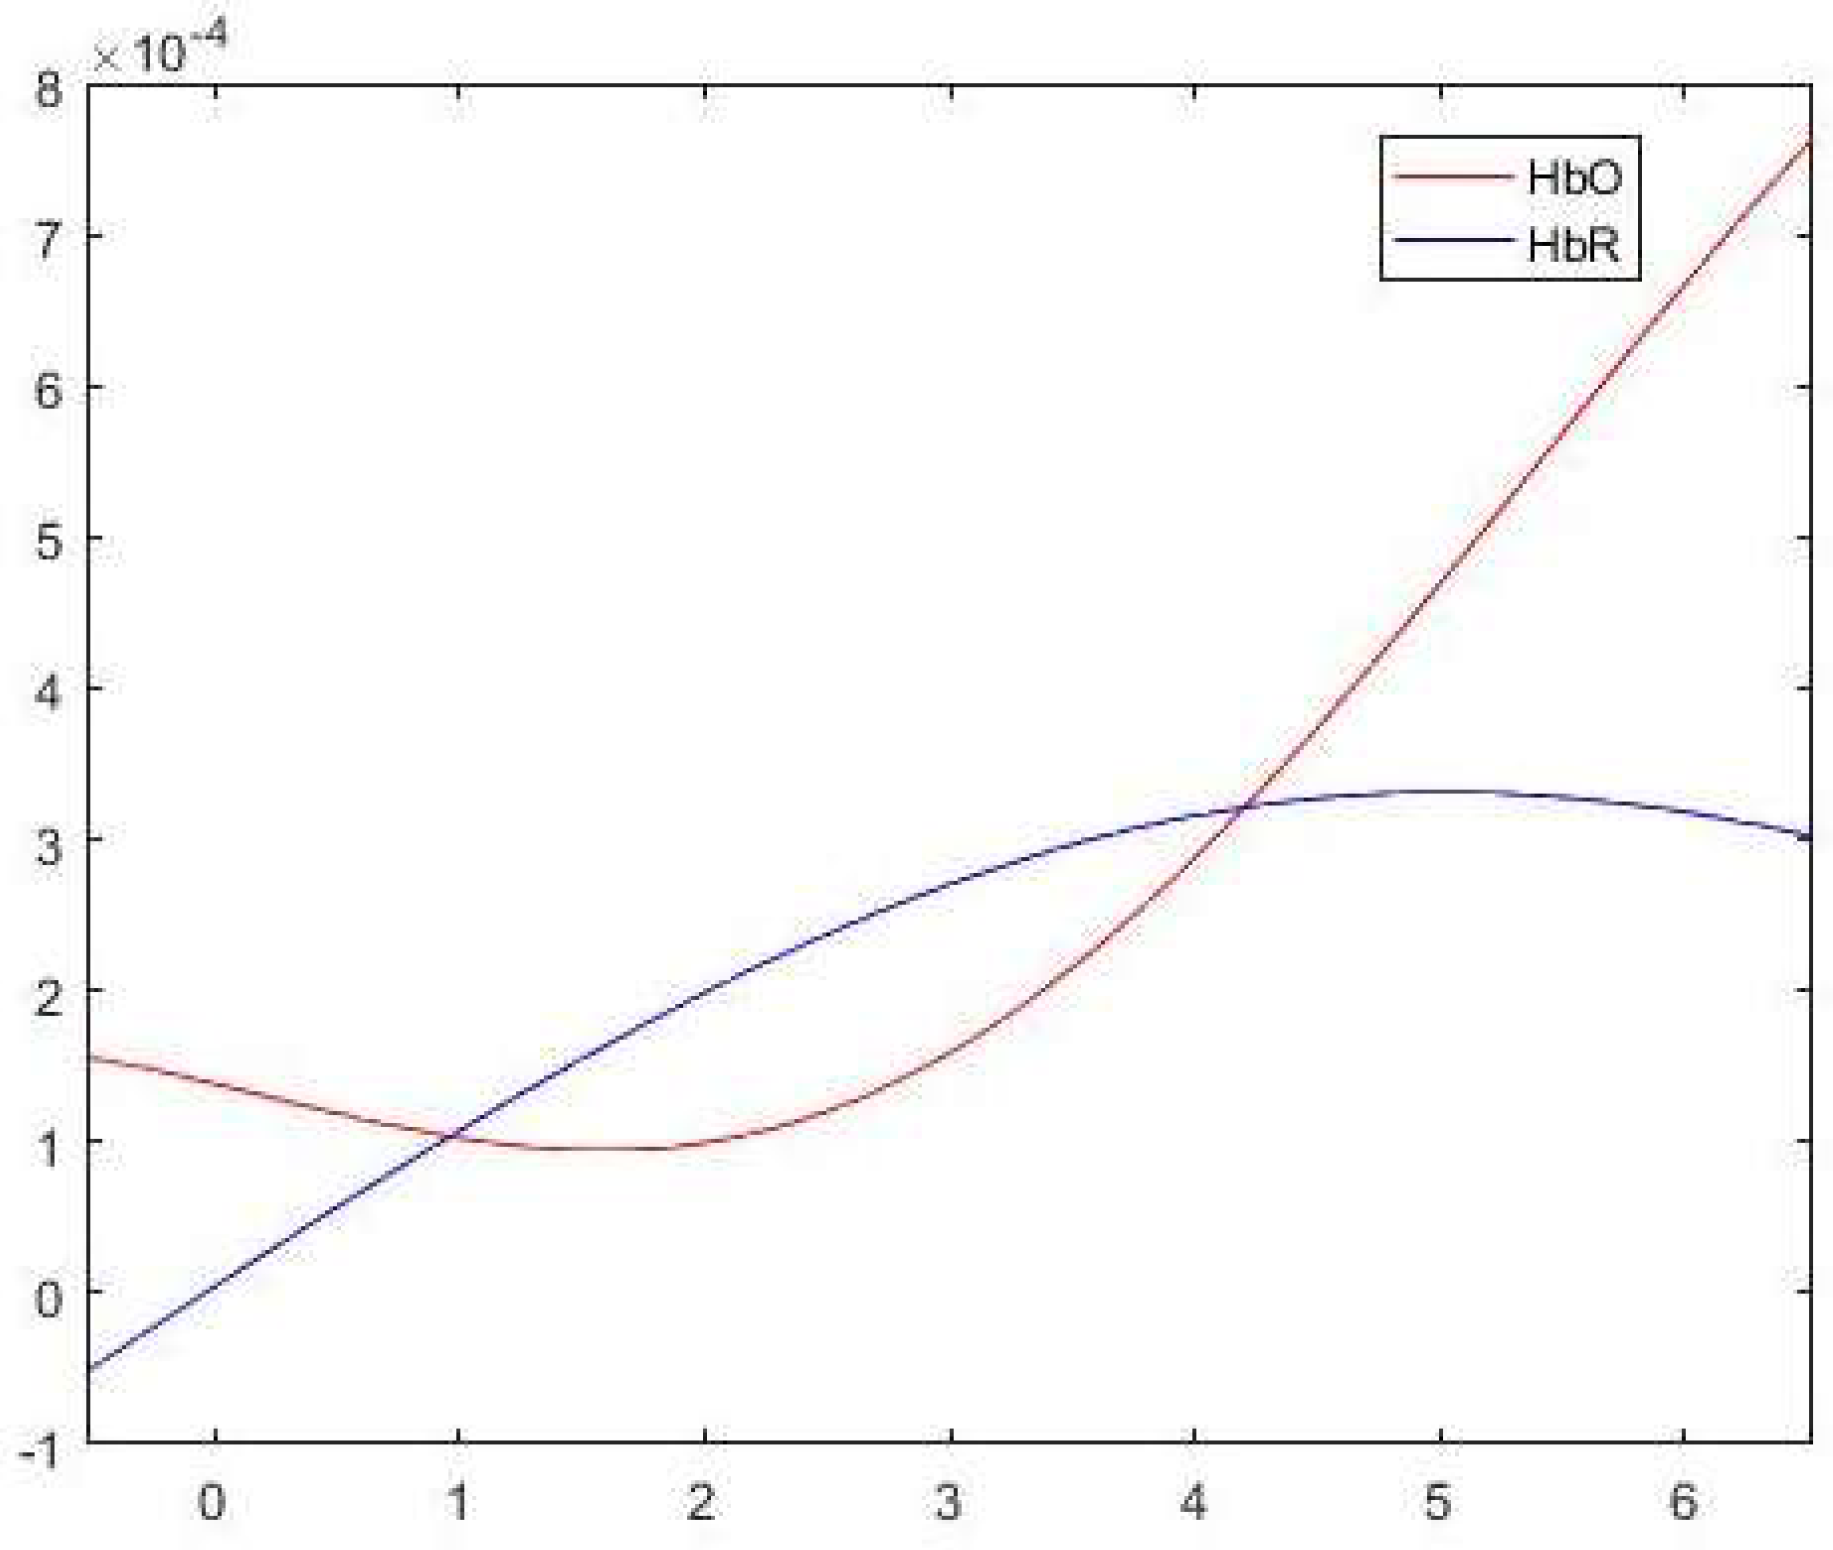
3.4. fNIRS Data Acquisition and Analysis
3.5. Statistical Analyses
4. Results
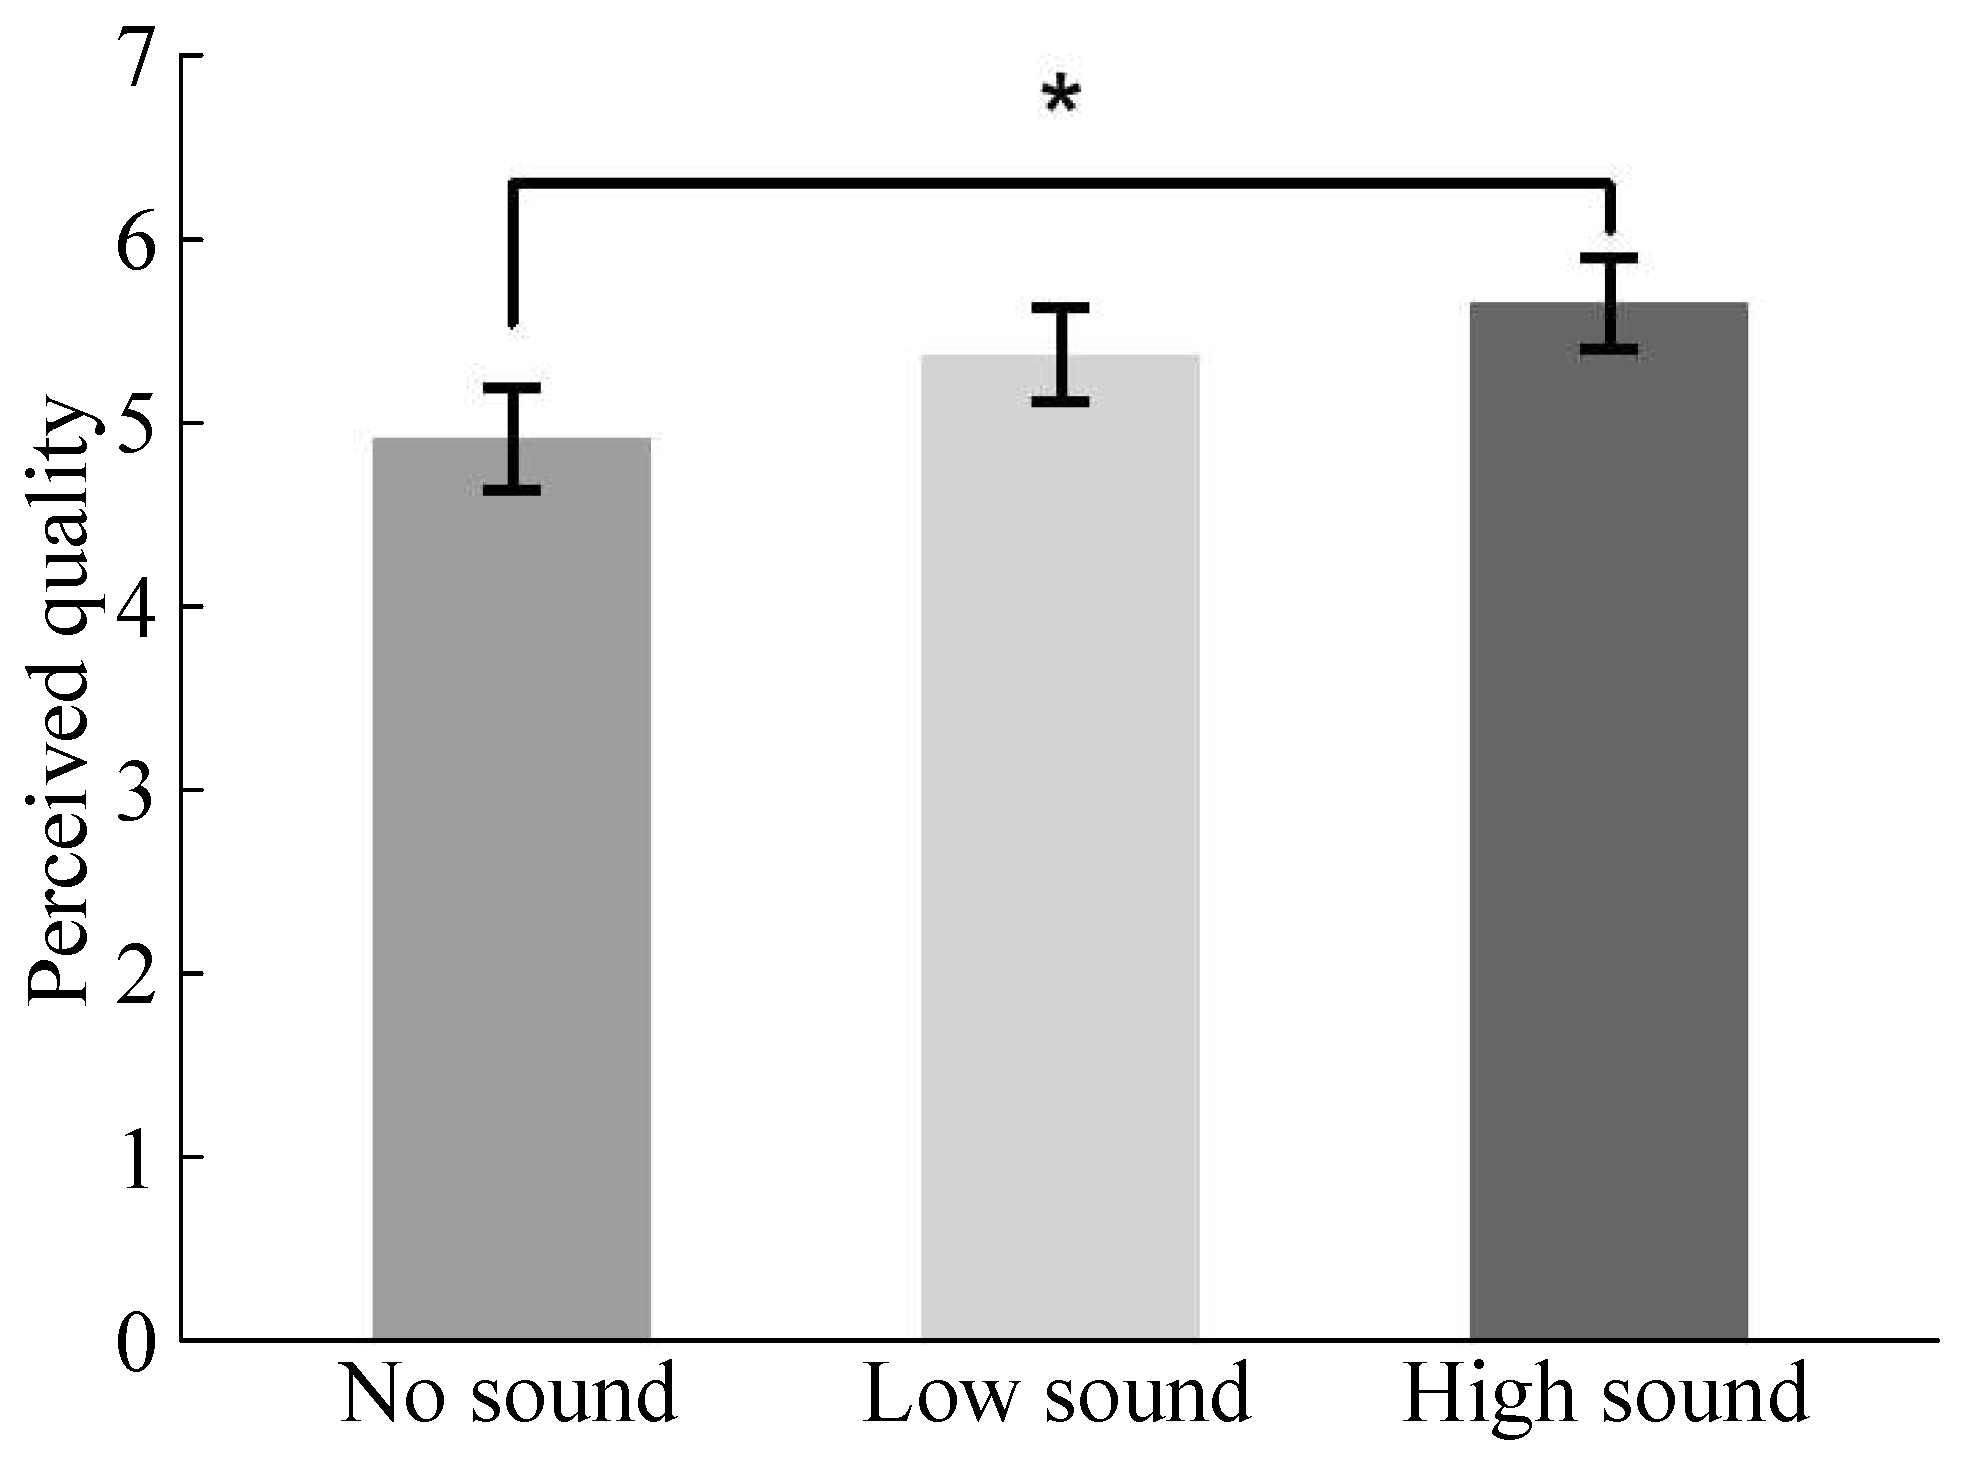
4.1. Perceived Quality Scores
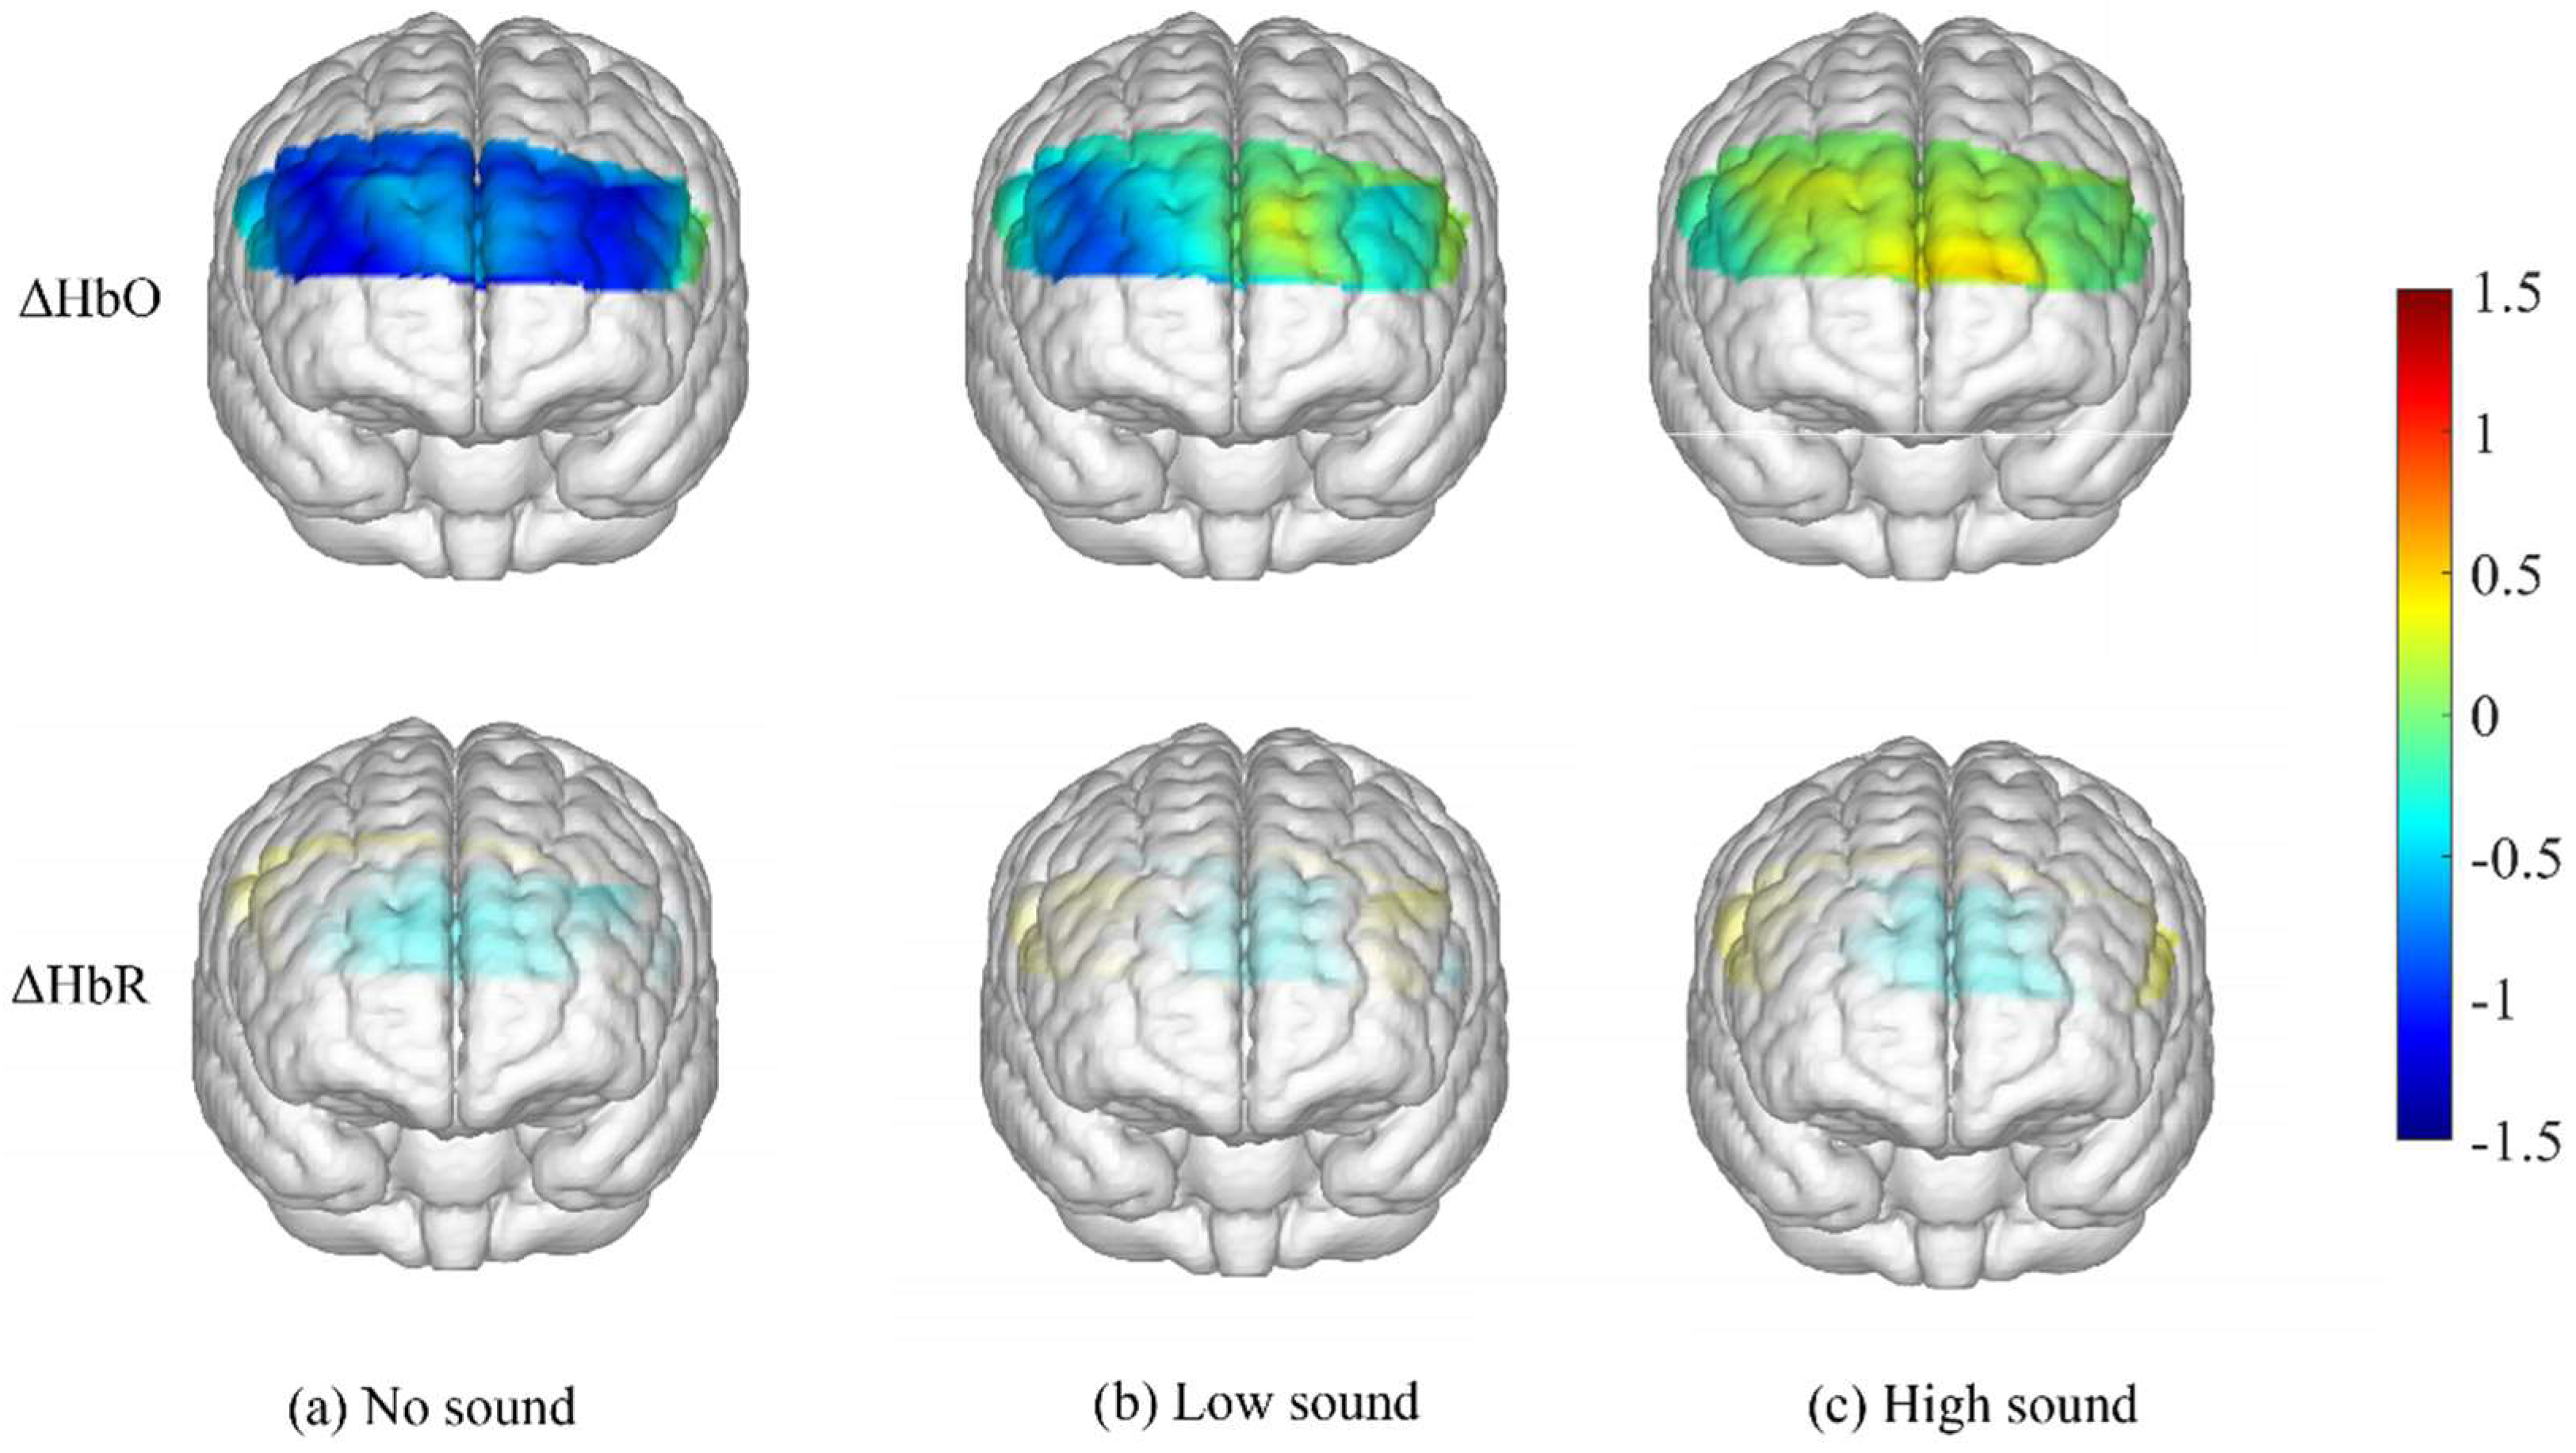
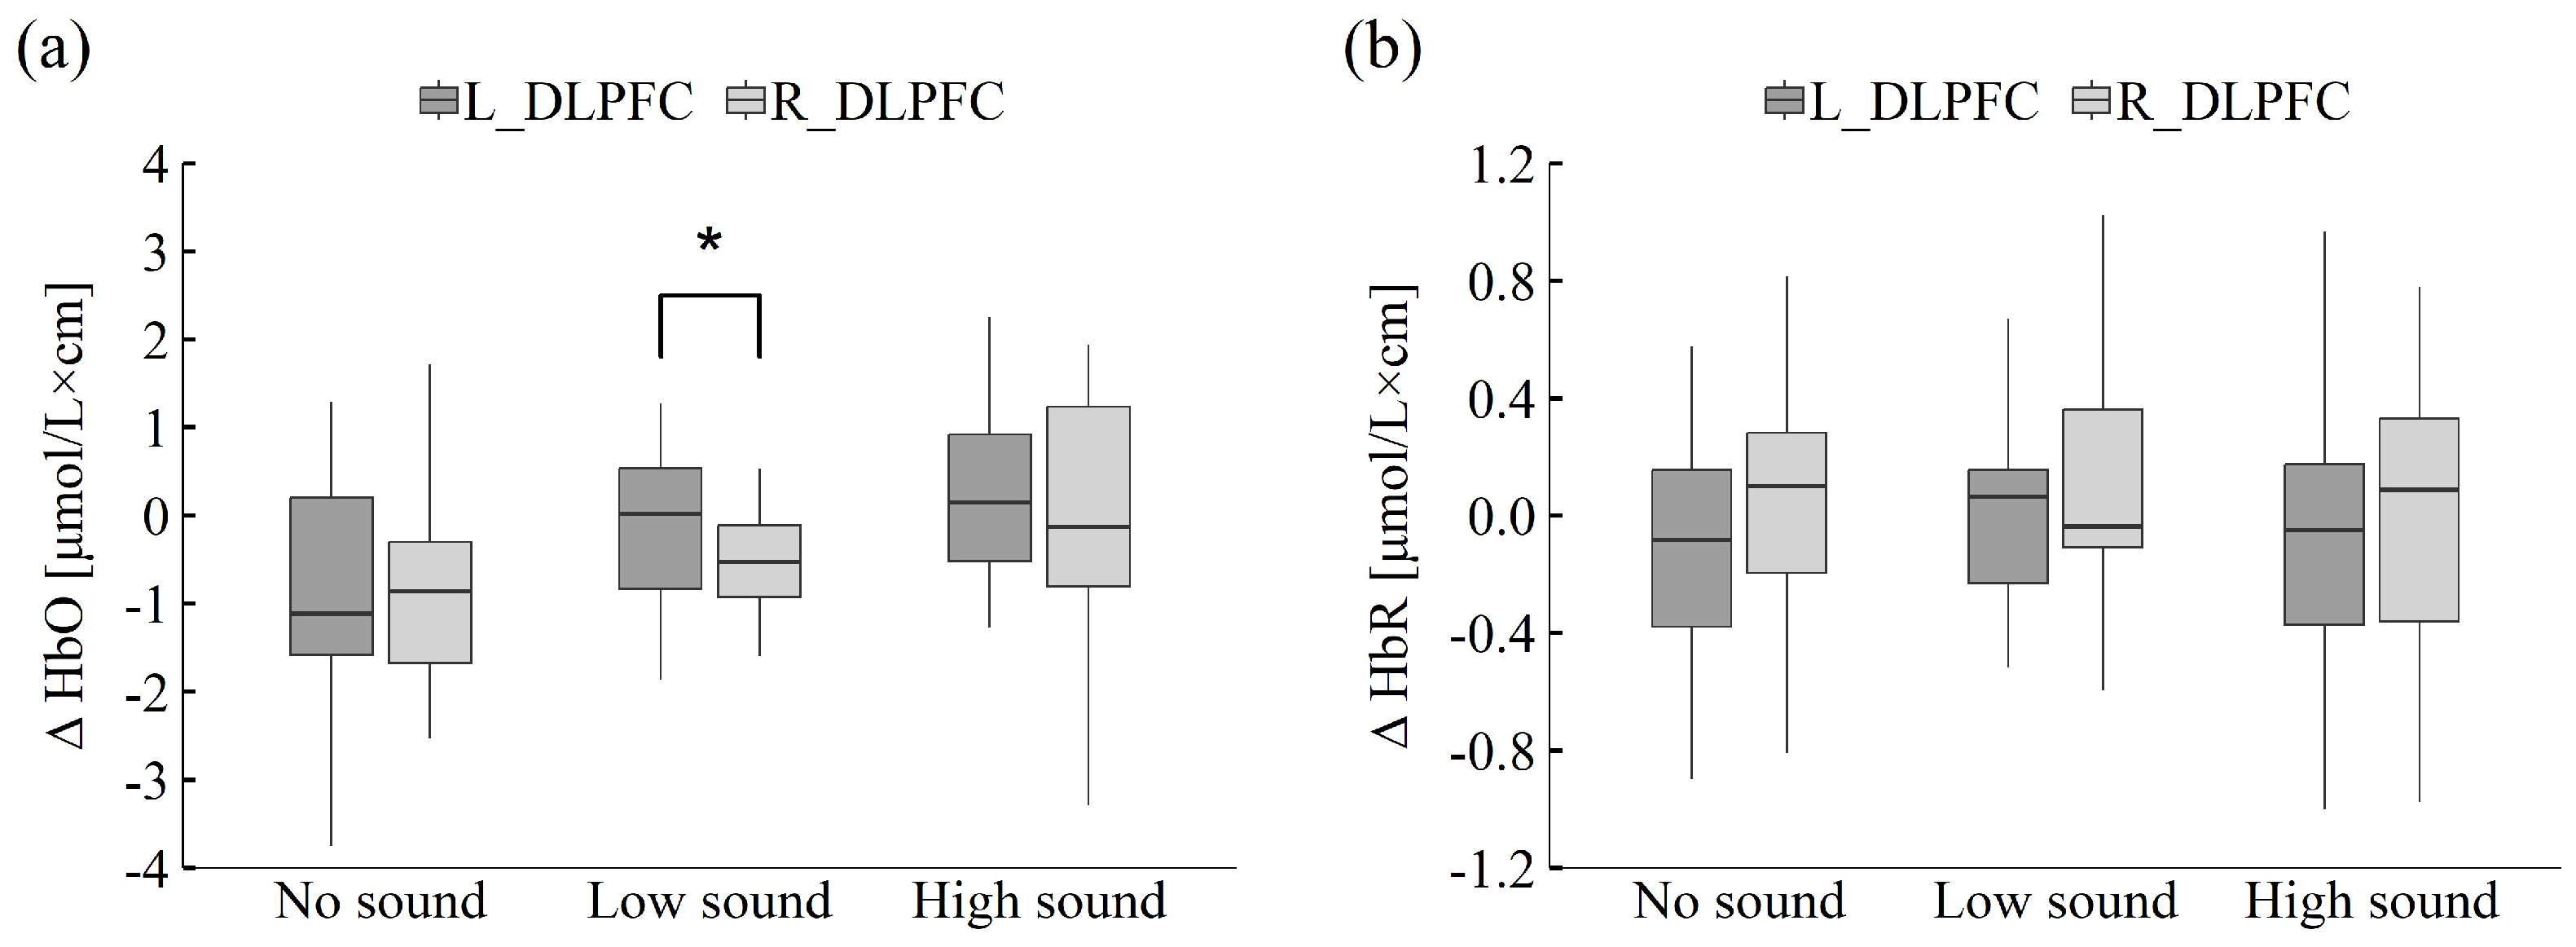
4.2. fNIRS Data
5. Discussion
5.1. Perceived Quality Evaluation Results
5.2. fNIRS Results
5.3. Implications and Limitations
6. Conclusions
Author Contributions
Funding
Institutional Review Board Statement
Informed Consent Statement
Data Availability Statement
Acknowledgments
Conflicts of Interest
Abbreviations
| AOI | Area of Interest |
| DLPFC | Dorsolateral prefrontal cortex |
| ECG | Electrocardiogram |
| EEG | Electroencephalography |
| fMRI | Functional Magnetic Resonance Imaging |
| fNIRS | Functional near-infrared spectroscopy |
| HbO | Oxygenated hemoglobin |
| HbR | Deoxygenated hemoglobin |
| HRI | Human–robot interaction |
| LCD | Liquid Crystal Display |
| LED | Light-Emitting Diode |
| SD | Standard Deviation |
| TDDR | Temporal Derivative Distribution Repair |
References
- Yan, H.B.; Huynh, V.N.; Nakamori, Y. A group nonadditive multiattribute consumer-oriented Kansei evaluation model with an application to traditional crafts. Ann. Oper. Res. 2012, 195, 325–354. [Google Scholar] [CrossRef]
- Khalid, H.M. Embracing diversity in user needs for affective design. Appl. Ergon. 2006, 37, 409–418. [Google Scholar] [CrossRef] [PubMed]
- Yang, C.; Liu, F.; Ye, J. A product form design method integrating Kansei engineering and diffusion model. Adv. Eng. Inform. 2023, 57, 102058. [Google Scholar] [CrossRef]
- Zhong, D.; Fan, J.; Yang, G.; Tian, B.; Zhang, Y. Knowledge management of product design: A requirements-oriented knowledge management framework based on Kansei engineering and knowledge map. Adv. Eng. Inform. 2022, 52, 101541. [Google Scholar] [CrossRef]
- Guo, F.; Liu, W.L.; Cao, Y.Q.; Liu, F.T.; Li, M.L. Optimization Design of a Webpage Based on Kansei Engineering. Hum. Factors Ergon. Manuf. Serv. Ind. 2016, 26, 110–126. [Google Scholar] [CrossRef]
- Schifferstein, H.N.J. The perceived importance of sensory modalities in product usage: A study of self-reports. Acta Psychol. 2006, 121, 41–64. [Google Scholar] [CrossRef]
- Schifferstein, H.N.J.; Desmet, P.M.A. Tools Facilitating Multi-sensory Product Design. Des. J. 2008, 11, 137–158. [Google Scholar] [CrossRef]
- Kim, S.; Shin, K. Smartphone-based active sound design for enhancing engine sound of vehicles. Appl. Acoust. 2024, 225, 110203. [Google Scholar] [CrossRef]
- Özcan, E.; Cupchik, G.C.; Schifferstein, H.N. Auditory and visual contributions to affective product quality. Int. J. Des. 2017, 11, 35–50. [Google Scholar]
- Bayani, M. Squeak and Rattle Prediction for Robust Product Development in the Automotive Industry; Chalmers Tekniska Hogskola: Gothenburg, Sweden, 2021. [Google Scholar]
- Ih, J.-G.; Kim, H.-J.; Lee, S.-H.; Shinoda, K. Prediction of intake noise of an automotive engine in run-up condition. Appl. Acoust. 2009, 70, 347–355. [Google Scholar] [CrossRef]
- Atamer, S.; Altinsoy, M.E. Sound quality of dishwashers: Annoyance perception. Appl. Acoust. 2021, 180, 22. [Google Scholar] [CrossRef]
- Xu, G.; Zhang, M.; Wang, Y.; Liu, Z.; Huo, C.; Li, Z.; Huo, M. Functional connectivity analysis of distracted drivers based on the wavelet phase coherence of functional near-infrared spectroscopy signals. PLoS ONE 2017, 12, e0188329. [Google Scholar] [CrossRef]
- Ihme, K.; Unni, A.; Zhang, M.; Rieger, J.W.; Jipp, M. Recognizing Frustration of Drivers From Face Video Recordings and Brain Activation Measurements With Functional Near-Infrared Spectroscopy. Front. Hum. Neurosci. 2018, 12, 327. [Google Scholar] [CrossRef]
- Pinti, P.; Tachtsidis, I.; Hamilton, A.; Hirsch, J.; Aichelburg, C.; Gilbert, S.; Burgess, P.W. The present and future use of functional near-infrared spectroscopy (fNIRS) for cognitive neuroscience. Ann. N. Y. Acad. Sci. 2020, 1464, 5–29. [Google Scholar] [CrossRef] [PubMed]
- Broadbent, D.P.; D’Innocenzo, G.; Ellmers, T.J.; Parsler, J.; Szameitat, A.J.; Bishop, D.T. Cognitive load, working memory capacity and driving performance: A preliminary fNIRS and eye tracking study. Transp. Res. Part F Traffic Psychol. Behav. 2023, 92, 121–132. [Google Scholar] [CrossRef]
- Mandrick, K.; Derosiere, G.; Dray, G.; Coulon, D.; Micallef, J.-P.; Perrey, S. Prefrontal cortex activity during motor tasks with additional mental load requiring attentional demand: A near-infrared spectroscopy study. Neurosci. Res. 2013, 76, 156–162. [Google Scholar] [CrossRef] [PubMed]
- Balconi, M.; Vanutelli, M.E. Hemodynamic (fNIRS) and EEG (N200) correlates of emotional inter-species interactions modulated by visual and auditory stimulation. Sci. Rep. 2016, 6, 23083. [Google Scholar] [CrossRef]
- Huang, Y.; Zheng, Q. Sound quality modelling of hairdryer noise. Appl. Acoust. 2022, 197, 108904. [Google Scholar] [CrossRef]
- Huang, X.; Huang, H.; Wu, J.; Yang, M.; Ding, W. Sound quality prediction and improving of vehicle interior noise based on deep convolutional neural networks. Expert Syst. Appl. 2020, 160, 113657. [Google Scholar] [CrossRef]
- Sato, S.-i.; You, J.; Jeon, J.Y. Sound quality characteristics of refrigerator noise in real living environments with relation to psychoacoustical and autocorrelation function parameters. J. Acoust. Soc. Am. 2007, 122, 314–325. [Google Scholar] [CrossRef]
- Soeta, Y.; Shimokura, R. Sound quality evaluation of air-conditioner noise based on factors of the autocorrelation function. Appl. Acoust. 2017, 124, 11–19. [Google Scholar] [CrossRef]
- Kim, S.-Y.; Ryu, S.-C.; Jun, Y.-D.; Kim, Y.-C.; Oh, J.-S. Methodology for Sound Quality Analysis of Motors for Automotive Interior Parts through Subjective Evaluation. Sensors 2022, 22, 6898. [Google Scholar] [CrossRef]
- Takada, M.; Arase, S.; Tanaka, K.; Iwamiya, S.-i. Economic valuation of the sound quality of noise emitted from vacuum cleaners and hairdryers by conjoint analysis. Noise Control Eng. J. 2009, 57, 263. [Google Scholar] [CrossRef]
- Kumar, S.; Wing, W.S.; Lee, H.P. Psychoacoustic Analysis of Vacuum Cleaner Noise. Acoustics 2021, 3, 545–558. [Google Scholar] [CrossRef]
- Yanagisawa, H.; Miyazaki, C. A methodology for extracting expectation effect in user-product interactions for multisensory experience design. J. Adv. Mech. Des. Syst. Manuf. 2019, 13, JAMDSM0013. [Google Scholar] [CrossRef]
- Symanczyk, A. The Sound of Stuff–Archetypical Sound in Product Sound Design. J. Sonic Stud 2015, 10. [Google Scholar] [CrossRef]
- Chou, J.R. A Kansei evaluation approach based on the technique of computing with words. Adv. Eng. Inform. 2016, 30, 1–15. [Google Scholar] [CrossRef]
- Yan, H.B.; Huynh, V.N.; Ma, T.J.; Nakamori, Y. Non-additive multi-attribute fuzzy target-oriented decision analysis. Inf. Sci. 2013, 240, 21–44. [Google Scholar] [CrossRef]
- Hsu, S.H.; Chuang, M.C.; Chang, C.C. A semantic differential study of designers’ and users’ product form perception. Int. J. Ind. Ergon. 2000, 25, 375–391. [Google Scholar] [CrossRef]
- Ariely, D.; Berns, G.S. Neuromarketing: The hope and hype of neuroimaging in business. Nat. Rev. Neurosci. 2010, 11, 284–292. [Google Scholar] [CrossRef]
- Guo, F.; Ding, Y.; Liu, W.; Liu, C.; Zhang, X. Can eye-tracking data be measured to assess product design?: Visual attention mechanism should be considered. Int. J. Ind. Ergon. 2016, 53, 229–235. [Google Scholar] [CrossRef]
- Guo, F.; Li, M.M.; Hu, M.C.; Li, F.X.; Lin, B.Z. Distinguishing and quantifying the visual aesthetics of a product: An integrated approach of eye-tracking and EEG. Int. J. Ind. Ergon. 2019, 71, 47–56. [Google Scholar] [CrossRef]
- Köhler, M.; Falk, B.; Schmitt, R. Applying Eye-Tracking in Kansei Engineering Method for Design Evaluations in Product Development. Kansei Eng. Int. 2014, 14, 241–251. [Google Scholar] [CrossRef]
- Bhatti, A.M.; Majid, M.; Anwar, S.M.; Khan, B. Human emotion recognition and analysis in response to audio music using brain signals. Comput. Hum. Behav. 2016, 65, 267–275. [Google Scholar] [CrossRef]
- Mehta, K.; Kliewer, J. Directed information measures for assessing perceived audio quality using EEG. In Proceedings of the 2015 49th Asilomar Conference on Signals, Systems and Computers, Pacific Grove, CA, USA, 8–11 November 2015. [Google Scholar]
- Xie, L.; Lu, C.; Liu, Z.; Chen, W.; Zhu, Y.; Xu, T. The evaluation of automobile interior acceleration sound fused with physiological signal using a hybrid deep neural network. Mech. Syst. Signal Process. 2023, 184, 109675. [Google Scholar] [CrossRef]
- Alyan, E.; Saad, N.M.; Kamel, N. Effects of Workstation Type on Mental Stress: FNIRS Study. Hum. Factors 2021, 63, 1230–1255. [Google Scholar] [CrossRef] [PubMed]
- Shirvan, R.A.; Setaredan, S.K.; Nasrabadi, A.M. Classification of mental stress levels by analyzing fNIRS signal using linear and non-linear features. Int. Clin. Neurosci. J. 2018, 5, 55–61. [Google Scholar] [CrossRef]
- Wang, Y.; Song, F.; Liu, Y.; Li, Y.; Wang, W.; Huang, Q.; Hu, Y. Research on the association mechanism and evaluation model between fNIRS data and aesthetic quality in product aesthetic quality evaluation. IEEE Trans. Affect. Comput. 2023, 15, 1414–1426. [Google Scholar] [CrossRef]
- American Psychiatric Association. Diagnostic and Statistical Manual of Mental Disorders: DSM-5; American Psychiatric Association: Washington, DC, USA, 2013; Volume 5. [Google Scholar]
- Chou, J.-R. Applying fuzzy linguistic preferences to kansei evaluation. In Proceedings of the KEER2014—5th Kanesi Engineering and Emotion Research, International Conference, Linköping, Sweden, 11–13 June 2014; pp. 339–349. [Google Scholar]
- Zhang, H.; Liu, M.; Li, W.; Sommer, W. Human voice attractiveness processing: Electrophysiological evidence. Biol. Psychol. 2020, 150, 107827. [Google Scholar] [CrossRef]
- Kawabata Duncan, K.; Tokuda, T.; Sato, C.; Tagai, K.; Dan, I. Willingness-to-Pay-Associated Right Prefrontal Activation During a Single, Real Use of Cosmetics as Revealed by Functional Near-Infrared Spectroscopy. Front. Hum. Neurosci. 2019, 13, 16. [Google Scholar] [CrossRef]
- Lim, L.G.; Ung, W.C.; Chan, Y.L.; Lu, C.K.; Funane, T.; Kiguchi, M.; Tang, T.B. Optimizing Mental Workload Estimation by Detecting Baseline State Using Vector Phase Analysis Approach. IEEE Trans. Neural Syst. Rehabil. Eng. 2021, 29, 597–606. [Google Scholar] [CrossRef]
- Pinti, P.; Devoto, A.; Greenhalgh, I.; Tachtsidis, I.; Burgess, P.W.; de C Hamilton, A.F. The role of anterior prefrontal cortex (area 10) in face-to-face deception measured with fNIRS. Soc. Cogn. Affect. Neurosci. 2021, 16, 129–142. [Google Scholar] [CrossRef]
- Hou, X.; Zhang, Z.; Zhao, C.; Duan, L.; Gong, Y.; Li, Z.; Zhu, C. NIRS-KIT: A MATLAB toolbox for both resting-state and task fNIRS data analysis. Neurophotonics 2021, 8, 010802. [Google Scholar] [CrossRef] [PubMed]
- Fishburn, F.A.; Ludlum, R.S.; Vaidya, C.J.; Medvedev, A.V. Temporal Derivative Distribution Repair (TDDR): A motion correction method for fNIRS. NeuroImage 2019, 184, 171–179. [Google Scholar] [CrossRef] [PubMed]
- Singh, A.K.; Okamoto, M.; Dan, H.; Jurcak, V.; Dan, I. Spatial registration of multichannel multi-subject fNIRS data to MNI space without MRI. NeuroImage 2005, 27, 842–851. [Google Scholar] [CrossRef]
- Ludden, G.D.S.; Kudrowitz, B.M.; Schifferstein, H.N.J.; Hekkert, P. Surprise and humor in product design. Des. Sens. Metaphor. Mult. Modalities 2012, 25, 285–309. [Google Scholar] [CrossRef]
- Lohani, M.; Payne, B.R.; Strayer, D.L. A Review of Psychophysiological Measures to Assess Cognitive States in Real-World Driving. Front. Hum. Neurosci. 2019, 13, 57. [Google Scholar] [CrossRef] [PubMed]
- Schroeter, M.L.; Zysset, S.; Kupka, T.; Kruggel, F.; von Cramon, D.Y. Near-infrared spectroscopy can detect brain activity during a color–word matching Stroop task in an event-related design. Hum. Brain Mapp. 2002, 17, 61–71. [Google Scholar] [CrossRef]
- Shimizu, T.; Nanbu, T.; Sunda, T. An Exploratory Study of the Driver Workload Assessment by Brain Functional Imaging Using Onboard fNIRS; 0148-7191; SAE Technical Paper. 2011. Available online: https://www.sae.org/publications/technical-papers/content/2011-01-0592/ (accessed on 4 December 2011).
- Weder, S.; Shoushtarian, M.; Olivares, V.; Zhou, X.; Innes-Brown, H.; McKay, C. Cortical fNIRS Responses Can Be Better Explained by Loudness Percept than Sound Intensity. Ear Hear 2020, 41, 1187–1195. [Google Scholar] [CrossRef]
- Ohshima, S.; Koeda, M.; Kawai, W.; Saito, H.; Niioka, K.; Okuno, K.; Naganawa, S.; Hama, T.; Kyutoku, Y.; Dan, I. Cerebral response to emotional working memory based on vocal cues: An fNIRS study. Front. Hum. Neurosci. 2023, 17, 1160392. [Google Scholar] [CrossRef]
- Midha, S.; Maior, H.A.; Wilson, M.L.; Sharples, S. Measuring Mental Workload Variations in Office Work Tasks using fNIRS. Int. J. Hum.-Comput. Stud. 2021, 147, 102580. [Google Scholar] [CrossRef]
- Balconi, M.; Grippa, E.; Vanutelli, M.E. What hemodynamic (fNIRS), electrophysiological (EEG) and autonomic integrated measures can tell us about emotional processing. Brain Cogn. 2015, 95, 67–76. [Google Scholar] [CrossRef]
- Tuscan, L.-A.; Herbert, J.D.; Forman, E.M.; Juarascio, A.S.; Izzetoglu, M.; Schultheis, M. Exploring frontal asymmetry using functional near-infrared spectroscopy: A preliminary study of the effects of social anxiety during interaction and performance tasks. Brain Imaging Behav. 2013, 7, 140–153. [Google Scholar] [CrossRef] [PubMed]
- Wheeler, R.E.; Davidson, R.J.; Tomarken, A.J. Frontal brain asymmetry and emotional reactivity: A biological substrate of affective style. Psychophysiology 2007, 30, 82–89. [Google Scholar] [CrossRef] [PubMed]
- Herrington, J.D.; Mohanty, A.; Koven, N.S.; Fisher, J.E.; Stewart, J.L.; Banich, M.T.; Webb, A.G.; Miller, G.A.; Heller, W. Emotion-Modulated Performance and Activity in Left Dorsolateral Prefrontal Cortex. Emotion 2005, 5, 200–207. [Google Scholar] [CrossRef]
- Gray, J.R.; Braver, T.S.; Raichle, M.E. Integration of emotion and cognition in the lateral prefrontal cortex. Proc. Natl. Acad. Sci. USA 2002, 99, 4115–4120. [Google Scholar] [CrossRef]


| Characteristic | Details |
|---|---|
| Sample Size | 18 |
| Age (M ± SD) | 22.61 ± 0.98 |
| Age Range | 21~25 years |
| Gender Distribution | Male: 50%; Female: 50% |
| Health Status | All participants reported no psychiatric or neurological disorders. |
| Left-hander/right-hander | All participants were right-handed. |
| Experience with Hair Dryers | 100% of participants reported prior experience using hair dryers. |
| Area of Interest (AOI) | Channel | MNI Coordinates | Brodmann Area (BA) | Overlap | ||
|---|---|---|---|---|---|---|
| X | Y | Z | ||||
| Right DLPFC | CH03 | 25.13 | 53.20 | 37.93 | BA9—DLPFC | 0.75 |
| CH10 | 37.69 | 55.19 | 24.78 | BA46—DLPFC | 0.95 | |
| CH17 | 47.37 | 50.74 | 12.48 | BA46—DLPFC | 0.82 | |
| Left DLPFC | CH05 | −20.13 | 54.09 | 38.59 | BA9—DLPFC | 0.80 |
| CH13 | −32.04 | 57.43 | 24.35 | BA46—DLPFC | 0.90 | |
| CH21 | −41.63 | 55.24 | 10.02 | BA46—DLPFC | 0.75 | |
Disclaimer/Publisher’s Note: The statements, opinions and data contained in all publications are solely those of the individual author(s) and contributor(s) and not of MDPI and/or the editor(s). MDPI and/or the editor(s) disclaim responsibility for any injury to people or property resulting from any ideas, methods, instructions or products referred to in the content. |
© 2025 by the authors. Licensee MDPI, Basel, Switzerland. This article is an open access article distributed under the terms and conditions of the Creative Commons Attribution (CC BY) license (https://creativecommons.org/licenses/by/4.0/).
Share and Cite
Xu, S.; Ren, Z.; Qu, Q. Sound-Quality Perception in Hair Dryers: Functional Near-Infrared Spectroscopy Evidence of Left-Lateralized Dorsolateral Prefrontal Cortex Activation. Appl. Sci. 2025, 15, 4278. https://doi.org/10.3390/app15084278
Xu S, Ren Z, Qu Q. Sound-Quality Perception in Hair Dryers: Functional Near-Infrared Spectroscopy Evidence of Left-Lateralized Dorsolateral Prefrontal Cortex Activation. Applied Sciences. 2025; 15(8):4278. https://doi.org/10.3390/app15084278
Chicago/Turabian StyleXu, Shuang, Zenggen Ren, and Qingxing Qu. 2025. "Sound-Quality Perception in Hair Dryers: Functional Near-Infrared Spectroscopy Evidence of Left-Lateralized Dorsolateral Prefrontal Cortex Activation" Applied Sciences 15, no. 8: 4278. https://doi.org/10.3390/app15084278
APA StyleXu, S., Ren, Z., & Qu, Q. (2025). Sound-Quality Perception in Hair Dryers: Functional Near-Infrared Spectroscopy Evidence of Left-Lateralized Dorsolateral Prefrontal Cortex Activation. Applied Sciences, 15(8), 4278. https://doi.org/10.3390/app15084278