Article

Analysis of Heavy Metal Sources in Xutuan Mining Area Based on APCS-MLR and PMF Model

1
School of Earth and Environment, Anhui University of Science and Technology, Huainan 232001, China
2
Anhui Lida Earth and Environment Technology Co., Ltd., Huainan 232001, China
*
Author to whom correspondence should be addressed.
Appl. Sci. 2025, 15(8), 4249; https://doi.org/10.3390/app15084249
Submission received: 6 March 2025 / Revised: 28 March 2025 / Accepted: 1 April 2025 / Published: 11 April 2025

Abstract

:
The present study aims to determine the concentrations and forms of Copper (Cu), Lead (Pb), Zinc (Zn), Chromium (Cr), Cadmium (Cd), and Arsenic (As) in water and sediments of the Xutuan mining area. The geoaccumulation index (Igeo) and ecological risk assessment coding (RAC) methods were used to assess heavy metal pollution levels and ecological risks in sediments. The positive matrix factorization (PMF) model and the absolute principal component score-multiple linear regression (APCS-MLR) model were used to quantitatively analyze the sources of heavy metals in the evaluated sediments. The results showed good water quality in the mining area. Cu, Cr, Zn, and As in the sediments were mainly in the residual form, while Cd and Pb were mainly in the organic matter combined form. The Igeo and RAC results showed that the Cd pollution degree and ecological risk were higher in the sediments. The APCS-MLR and PMF models analyzed the contributions of natural sources (72.5% and 25.1%) and anthropogenic sources, respectively, while the PMF further distinguished the contributions of coal mining (26.4%), agricultural (21.44%), and traffic (27.05%) sources.

1. Introduction

Although mineral resources have greatly contributed to economic development worldwide, they have caused a series of environmental issues [1]. Mining activities are one of the main sources of heavy metal pollution in the environment [2]. In the process of mining and smelting of mineral resources, heavy metals can be transported to the surrounding environment through atmospheric sedimentation, surface water transport (including acid mine drainage), and groundwater seepage [3]. In fact, heavy metals, with different chemical states, can migrate, transform, and accumulate in environmental media (water, soils, and sediments) through coal mining activities, causing environmental contamination or pollution [4,5]. These impacts cannot only affect ecological environments but also endanger human health through the food chain and food web [3]. Heavy metals in water bodies can also gradually migrate and accumulate in sediments through various physicochemical processes. Most of the heavy metals in water are trapped in sediment by co-precipitation with oxides, cation exchange, particle surface adsorption, and the assimilation of organic matter [6,7]. These pollutants are difficult to biodegrade and may cause direct or indirect harm to organisms [8]. The environmental behaviors and toxicity levels of heavy metals in sediments are related mainly to their total amounts and chemical forms. In addition, the transfer, transformation, toxicity, and potential environmental hazards of heavy metals in sediments depend mainly on their forms. Specifically, changes in sediment–water interfaces can consequently release some weakly bound heavy metals from the surfaces of sediments into water bodies, leading to the occurrence of secondary pollution [9,10].
In recent years, many scholars have focused on heavy metals in mining areas. Chen et al. [11] highlighted significantly higher heavy metal pollution levels in river sediments near the Luanchuan mine than those in adjacent water bodies. Zhao et al. [12] showed serious soil heavy metal pollution in an abandoned coal mine area, with significantly higher Cd contents than those of other heavy metals. Sun et al. [13] found moderate to severe total heavy metal amounts in farmland soils near abandoned mining areas in Guangdong Province, China. In addition, Bradl [14] found that farmland soils in a coal mine area in Bangladesh were contaminated by heavy metals to varying degrees, showing clear biological poisoning. However, there is still a lack of unified standards for comprehensively assessing environmental risks associated with heavy metals in water and sediments. Moreover, the different assessment methods used in previous related studies have resulted in different evaluation results. Each method has its advantages and limitations, making the application of a single evaluation method inappropriate for providing comprehensive assessments of heavy metal pollution. Hence, it is crucial to conduct comprehensive assessment studies by combining multiple appropriate methods. Numerous studies have assessed heavy metal contamination and pollution levels in China and other regions worldwide using different parametric methods, such as the geological accumulation index method [15], comprehensive pollution index method [11], risk assessment coding method [16], and potential ecological risk index method [17]. Other studies have shown that the positive matrix factorization (PMF) model [18,19], isotopic tracer method [20], and the Unmix model [21,22] can identify and analyze the sources of heavy metals in environmental media. The Unmix model supports uncertainty analysis but requires high sample data quantity, and high dimensional data need to be reduced. Isotope tracing can be conducted directly but is expensive. Traditional multivariate statistical methods, such as PCA and FA, can only qualitatively predict potential sources of pollution. The APCS-MLR and PMF models can realize the leap from qualitative to quantitative pollution sources. In this study, the APCS-MLR and PMF models are applied to multi-source mixed pollution areas, and the model error is reduced by cross-validation. APCS-MLR evolved from PCA, and source contributions were obtained by performing regression between heavy metal content and the APCS [23]. PMF uses experimental uncertainty in the data matrix and decomposes the data matrix into factor contributions and factor distributions under non-negative constraints. At present, many scholars have applied APCS-MLR and PMF to analyze the source distribution of various pollutants in the atmosphere, soil, and dust [24,25].
The present study aims to assess the concentrations and forms of six heavy metal elements (Cu, Pb, Zn, Cr, Cd, and As) in water bodies and sediments in the Xutuan mining area, taking into account the main findings revealed in previous related research [26,27]. In addition, the ecological risks of the heavy metals in the mining area were further evaluated. The sources of the heavy metals in the sediments were also analyzed using the PMF model to provide a scientific basis for the comprehensive prevention and control of heavy metal pollution in the Xutuan mining area.

2. Materials and Methods

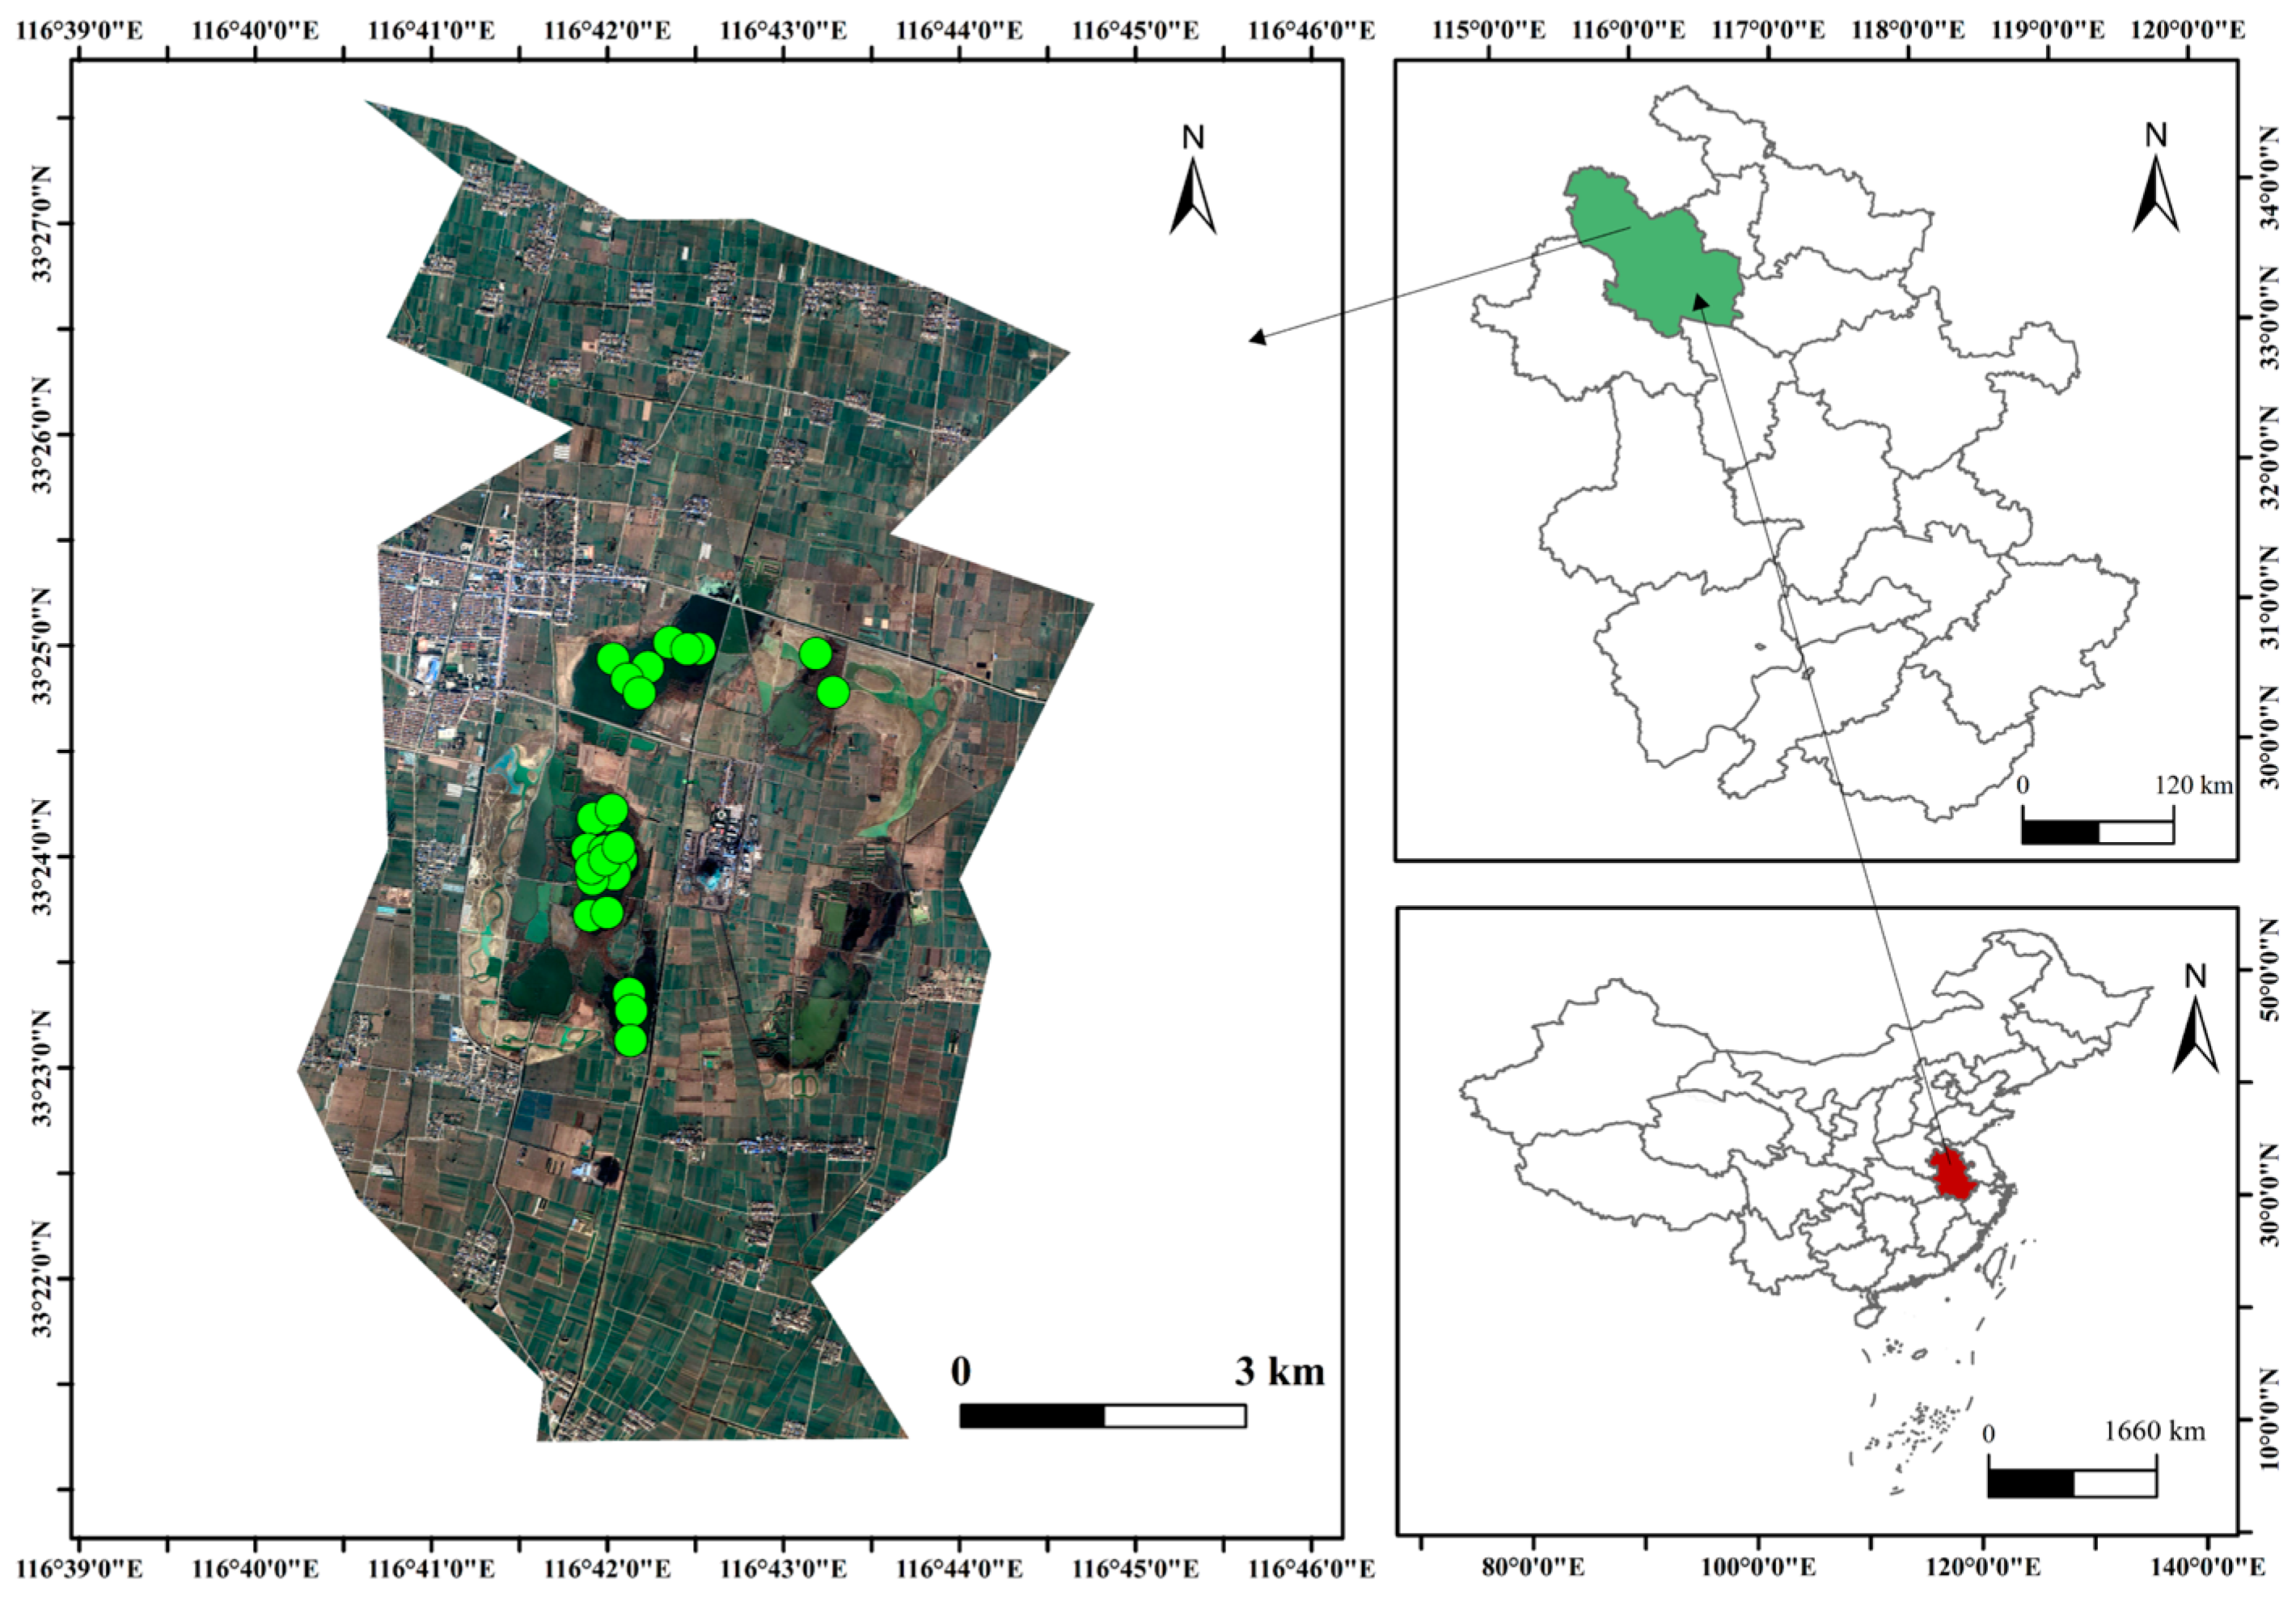
2.1. Overview of the Study Area

The Xutuan Mining District is an important coal mining area in eastern China, located in the northern part of Anhui Province (Figure 1). This region of the study area belongs to the temperate semi-humid monsoon climate zone, with cold and dry winters and rainy summers. The Xu Tuan Coal Mine belongs to the Xutuan Mining Group, located in Mengcheng County, Anhui Province. The construction of this mine was started in October 1997, and it was officially put into operation on 8 November 2004, with a maximum production rate of 34,500,000 t/a. The Xutuan Coal Mine is located in the central part of the Xutuan Plain. The terrain in the area is flat, with comparatively higher slopes in the north than those in the south. This area is characterized by the dominance of fluvial and sand ginger black soils, with the presence of brown soils in hilly and low-slope areas.

2.2. Sample Collection and Analysis

A bottle-type deep-water sampler was used to collect water samples from the water body in the study area. Nitric acid was added to the collected water samples to decrease the pH values to less than 2. The concentrations of the six heavy metal elements in the water samples were analyzed by inductively coupled plasma mass spectrometry (ICP-MS, Agilent Technologies, Santa Clara, CA, USA). On the other hand, sediment samples at the same location as the water body sampling point were collected with the Petersen grab. The collected samples were placed in polyethylene bags, air-dried, then ground evenly with an agate mortar and screened with 100 mesh to remove stones, plants, shells, and other debris. After screening, the sample was analyzed for the contents of heavy metals using the improved Tessier five-step extraction method. In total, five chemical forms were extracted step by step, namely exchangeable (F1), carbonate bound (F2), iron and manganese oxide bound (F3), organic matter bound (F4), and residual (F5) forms. The extraction solutions were analyzed by an inductively coupled plasma emission spectrometer (ICP-OES). All reagents used were of excellent purity. The standard heavy metal reserve solution was 100 μg/mL. All containers were soaked in 5% dilute nitric acid overnight before use, washed three times with ultra-pure water, and then dried for use. A Perkin Elmer Avio550 ICP-OES (Shanghai, China) was used for the determination of heavy metals in sediments, and a Perkin Elmer Nexion 300X ICP-MS (PerkinElmer, Inc., Shelton, CT, USA) was used for the determination of heavy metals in water bodies.

2.3. Analytical Method

In this study, the Igeo and ecological risk assessment coding methods were used to assess the heavy metal pollution levels in the collected sediments. The evaluation criteria considered in these methods are reported in Table 1.

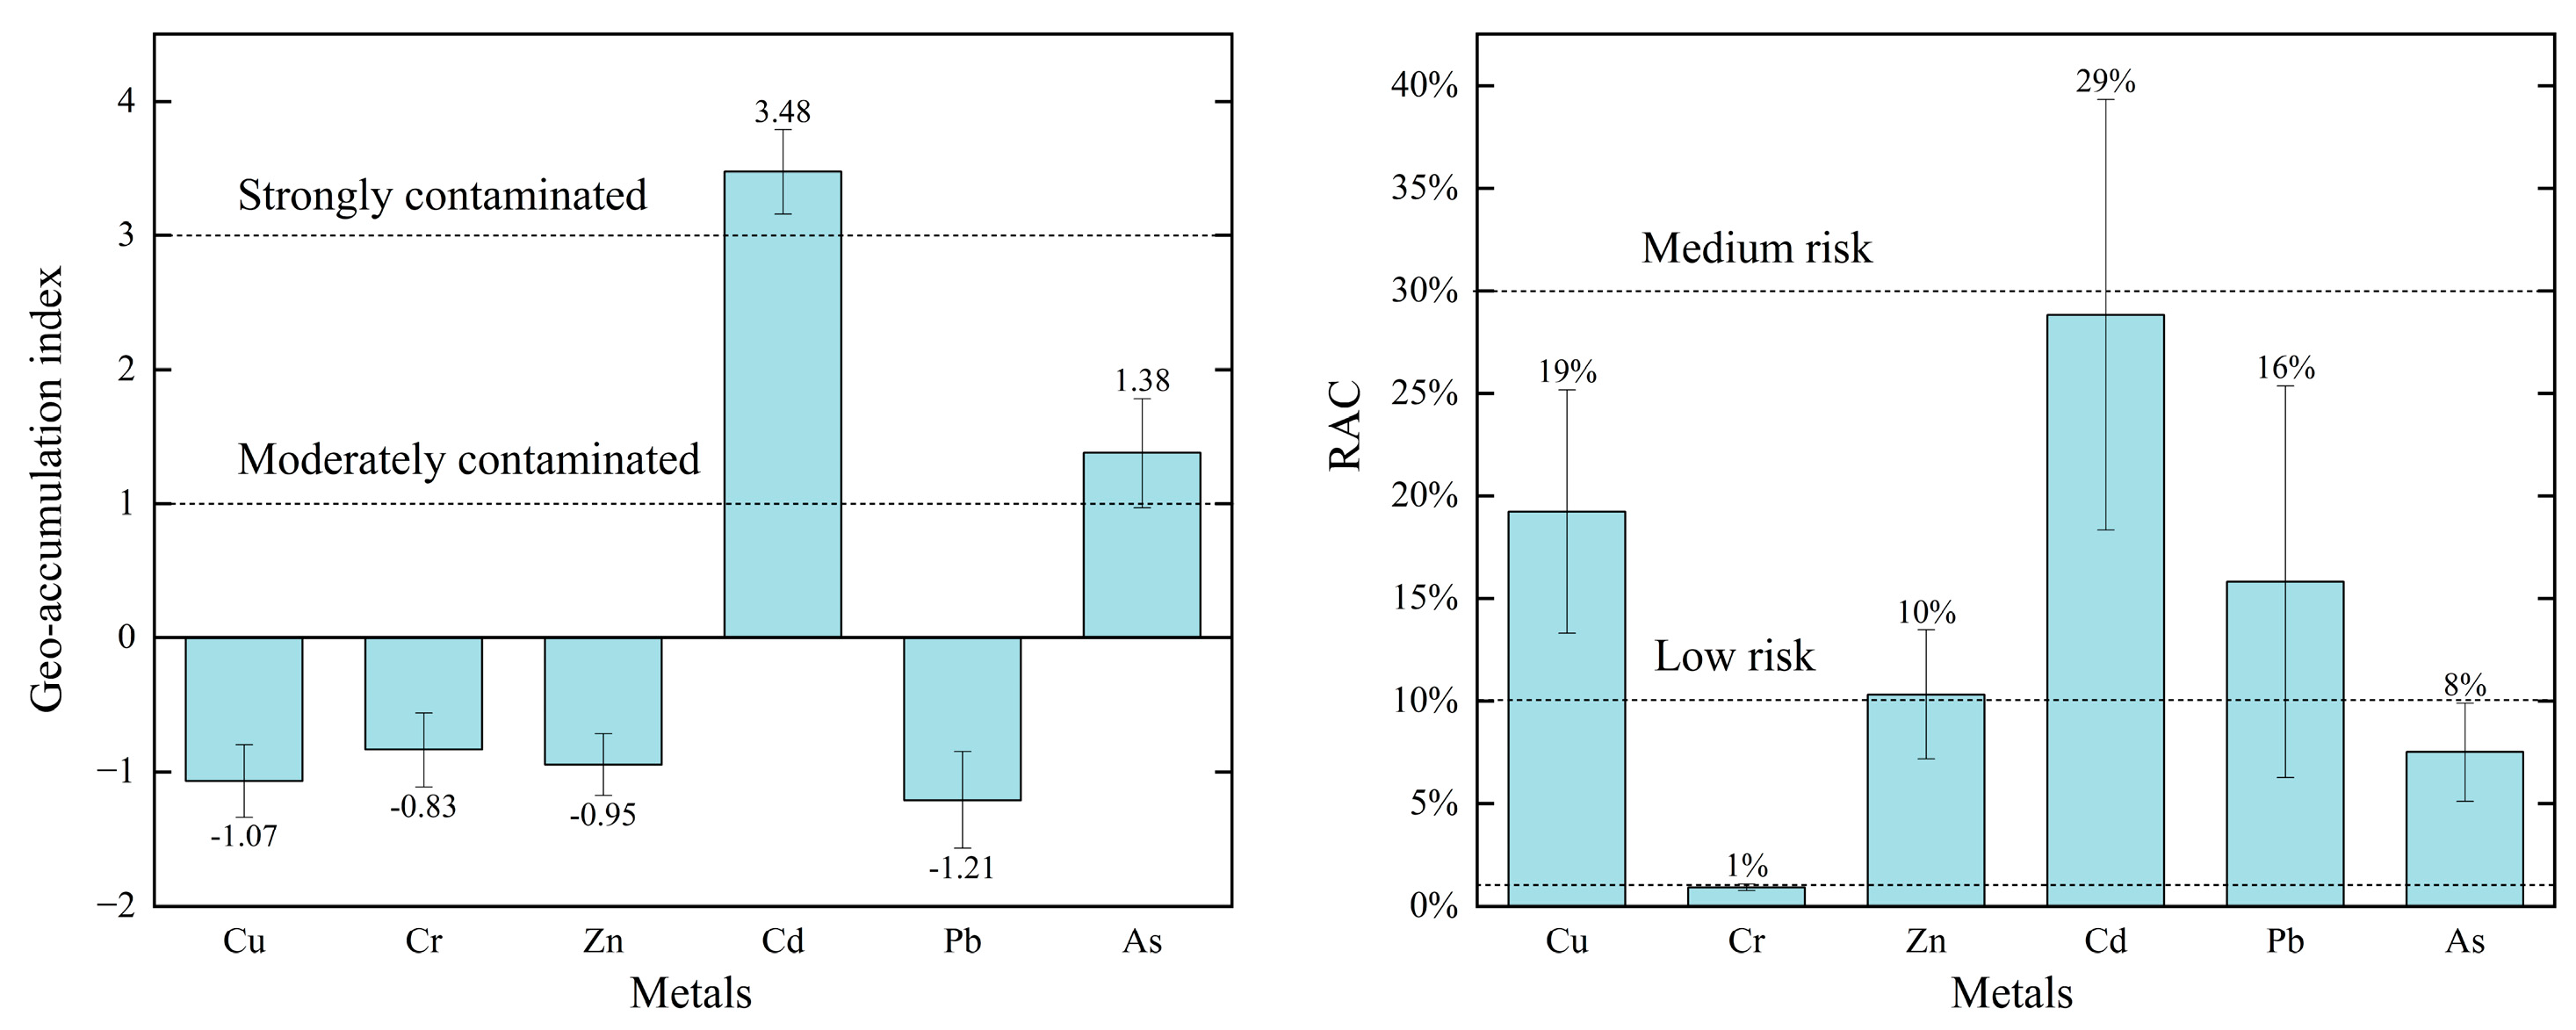
2.3.1. Geological Accumulation Index Method

The geological accumulation index (Igeo) method has been commonly used to evaluate heavy metal pollution in sediments, according to the following formula:
I geo = log 2 C n K B n
where Cn denotes the observed contents of heavy metal n in sediments and Bn denotes the geochemical background value of heavy metal elements in shale. In this study, the soil background values of the Xutuan mining area in Anhui Province were considered. K is a constant used to take into account changes in the soil background values caused by the earth’s rock movements.

2.3.2. Ecological Risk Assessment Coding Methods

The RAC index was used to evaluate the ecological risks associated with the six heavy metals, according to the following formula:
RAC = (F1 + F2)/(F1 + F2 + F3 + F4 + F5) × 100%
where F1, F2, F3, F4, and F5 denote the exchangeable, carbonate bound, iron and manganese oxide bound, organic matter bound, and residual forms, respectively.

2.3.3. APCS-MLR Model

The APCS-MLR model developed from the traditional PCA has been frequently used to calculate the contributions (%) of different sources of single HMs. Regression was performed in SPSS 27.0 software using Formula (3).
C n = ξ 0 + k 1 p ξ k × A P C S k
where Cn is the concentration of HM n; ξ0 is the constant term (the intercept of the regression of HM n); ξk is the regression coefficient; APCSK is the absolute principal component score of source factor p; ξk × APCSk is the contribution of source factor p to Cn; and the mean value of ξk × APCSk is the average contribution of source p to Cn.

2.3.4. PMF Source Analysis Model

In this study, the potential sources of 6 heavy metals in the evaluated sediments were analyzed using PMF5.0, released by the US Environmental Protection Agency (EPA), according to the following formula:
X = GF + E
where X denotes the concentration matrix; G denotes the source contribution matrix; F denotes the source composition matrix; and E denotes the residual matrix.
The basic equation is
U ij = 5 6 × M D L                                                   c 0 M D L 2 + δ × c 2                     c > 0
where Uij denotes the measurement matrix of the j heavy metal element in i samples; MDL denotes the method detection limit; c denotes the contents of the heavy metal elements (mg·kg−1); and δ denotes the relative standard deviation.

2.4. Data Processing Methods

SPSS 27.0 was used in this study for performing descriptive statistics and a Pearson correlation analysis of the heavy metal contents. The potential sources of the heavy metal elements were identified and analyzed using EPA PMF5.0, while Origin 2024 was used to generate graphs. The flow chart of this study is shown in Figure 2.

3. Results and Discussion

3.1. Distributions of the Water and Sediment Heavy Metal Contents

The observed heavy metal concentrations in the water bodies in the coal mining subsidence areas are shown in Table 2. The average Cu, Cr, Cd, Zn, Pb, and As concentrations in the water body in the study area were 6.28, 37.26, 0.41, 26.15, 2.29, and 32.86 μg·L−1, respectively. According to China’s surface water environmental quality standard (GB3838-2002), the average Cu, Pb, Zn, Cd, and As concentrations met the national Class I water quality standard limits of 10, 10, 50, 1, and 50 μg·L−1, respectively, indicating the lack of associated pollution. However, Cr exceeded and met the national Class I and Class II water quality standard limits of 10 and 50 μg·L−1, respectively. Generally, our results revealed a lack of water heavy metal pollution. The pH range of the water in the mining area is 5.96–8.35. The average value is 7.19. The water body in the mining area is weakly alkaline. The results show that the pH value is the main factor affecting the adsorption characteristics of heavy metals, and the acidic to neutral environment promotes the desorption of heavy metal ions [30].
The maximum, minimum, mean, standard deviation, and coefficient of variation values of the six heavy metal elements in the sediments were determined and then compared with the soil background values of the Xutuan mining area and the national soil Class II standards (Table 3).
The obtained results showed lower Cu, Cr, Zn, and Pb contents than the soil background values in the Xutuan mining area, except for Cd and As. Among them, Cd was 17 and 3.3 times higher than the corresponding background and national soil Class II standard values, respectively, whereas the As contents were 4 and 1.3 times higher than the background and national Class II soil standard values, respectively. These findings indicate the enrichment of Cd and As in the sediments of the study area. The concentration of Cd in the sediment of the mine was significantly lower than that in the sediment of Aqyazi River in Iran near the iron ore mine (1.31 mg/kg < Cd < 8.01 mg/kg). However, the concentration of As was higher than that of the river sediment (1.57 mg/kg < As < 2.57 mg/kg) [32]. The concentrations of As and Cd were lower than those in Yujiang sediments, a polymetallic ore concentration area in China [33]. As a dimensionless expression of standard deviation, the coefficient of variation is more effective for reflecting the dispersion degrees of heavy metal contents and can also reflect the influences of human activities to a certain extent [34]. According to the obtained results, the coefficient of variation ranged from 0.18 to 0.26, showing relatively concentrated spatial distributions of the heavy metal contents in the study area.

3.2. Morphological Distribution Characteristics of Heavy Metals in Sediments

Heavy metals extracted by acid solutions are easily susceptible to changes in external environments, resulting in their release from sediments into water bodies, thus affecting water environments. Therefore, different forms of sediment heavy metals can be used to assess associated short-term ecological risks. As can be seen from Figure 3, F5 was the most important form of Cu, accounting for an average proportion of 49.39%, followed by F4 (20.55%), F3 (12.83%), F1 (10.39%), and F2 (6.84%), respectively. Similarly, F5 was the most dominant Cr form (65.78%), followed by F4 (28.33%) and F3 (4.78%) as well as by F1 and F2, which accounted for 1.11%. The main form of Zn was F5 (52.56%), followed, by F4 (30.5%), F2 (7.94%), F3 (6.61%), and F1 (2.39%), respectively. As was also dominated by the F5 form, with a relative proportion of 50.94%, followed by F4 (30.67%), F3 (11.06%), F2 (6.72%), and F1 (0.61%), respectively. In contrast, F4 was the most dominant form of Cd, accounting for 27.89%, followed by F5 (24.89%), F3 (18.5%), F2 (16.06%), and F1 (12.66%), respectively. A similar finding was observed for Pb, showing a comparatively higher proportion of the F4 form (53.39%), followed by F5 (20.94%), F1 (10.61%), F3 (9.89%), and F2 (5.17%), respectively. The F5 form of Cu, Cr, and Zn has a weak release capacity, derived mainly from natural sources due to the lower contents of these heavy metal elements than the corresponding background values of Xutuan City. The higher F4 proportion of Pb might be due to the strong adsorption ability of sediment organic matter to Pb. The content of organic matter in the bottom mud of the mining area is relatively rich (5.14–10.05%), and heavy metal elements easily combine with organic functional groups, humic acids, and small molecular compounds generated by the decomposition of organic matter to form relatively stable compounds. The adsorption capacity of these compounds are much higher than that of other colloids in the sediment. The non-F5 proportions of Cd and Pb were 75.11 and 79.06%, respectively. Studies have shown that there is a strong relationship between the content of heavy metals in sediments and pH value. When the sediment is acidic, the content of heavy metals in the sediment is reduced due to desorption, but when the pH value is 7, the desorption of heavy metals is effectively inhibited. However, when the pH value is >8, the heavy metal content reaches the maximum adsorption capacity and no longer increases with the increase in pH value [35]. The average pH of the sediment in the mining area is 7.09, which can effectively inhibit the desorption of heavy metals. Nevertheless, Cd-related environmental issues cannot be ignored due to the high content and strong toxicity of this heavy metal element. On the other hand, the non-F5 contents of Pb were lower than the corresponding background value of Xutuan soil. The release of the different heavy metal forms into the environment can be enhanced by increasing their proportions and contents of heavy metals, causing sediment and water pollution and consequently increasing their biological availability. The F5 form, on the other hand, can be released mainly through weathering processes, as it is often attached to mineral materials, reducing the likelihood of secondary environmental pollution [36]. Although As exhibited higher contents in the sediments than the national soil level II standard, its F5 form accounted for a relatively high proportion, indicating a low likelihood of associated environmental pollution in the study area.

3.3. Heavy Metal Risk Assessment

Changes in external environments can lead to the re-release of heavy metals from sediments into water bodies, causing secondary pollution. Therefore, it is essential to assess the risks associated with heavy metals using appropriate evaluation methods to accurately reflect their pollution level in the environment. In this study, the Igeo and risk assessment coding methods were used to assess the risks associated with the sediment heavy metal elements. The evaluation results are shown in Figure 4.
The Igeo- and RAC-based heavy metal risk assessment results are shown in Figure 3. The obtained results showed comparatively higher Igeo values of Cd, reaching 3.48 and thus belonging to the strong pollution level, whereas the Igeo values of As reached 1.38, belonging to the moderate pollution level. In contrast, the Cu, Cr, Zn, and Pb Igeo values were lower than 0, indicating the lack of associated accumulation. The RAC values of the six heavy metal elements in the sediments of the subsidence areas followed the decreasing order of Cd (29%) > Cu (19%) > Pb (16%) > Zn (10%) > As (8%) > Cr (1%). Hence, it can be concluded that Cu, Cd, Pb, and Zn were associated with moderate risks (10% ≤ RAC < 30%), while As and Cr were related to low (RAC < 10%) and zero (RAC < 1%) risks, respectively. This is consistent with the results of Yu et al. [37]. Previous studies have shown that Cd has a high degree of pollution and ecological risk in China and globally [38,39]. The contents of active states of Cd, Cu, Pb, and Zn in the sediments were relatively high, which is conducive to their release into the water and causes environmental pollution. Cr and As were mainly in the stable residual form. The high proportion of non-residual Cd (75.11%) in sediments, combined with its Igeo values (3.48) and RAC risk level (29%), suggests significant bioavailability. The high toxicity of heavy metals in high concentrations to aquatic organisms leads to reduced growth, mortality, and reduced species diversity, with potential impacts on ecosystems and human health [40]. Our observed mean Cd content (1.98 mg/kg) exceeds both China’s soil Class II standard (0.6 mg/kg) and National Oceanic and Atmospheric Administration (NOAA) guidelines (1.2 mg/kg) [41], posing acute risks to aquatic food webs. Conversely, As poses lower immediate risks due to its residual dominance (50.94%), but As is a global public health threat and a serious contaminant of drinking water with long-term carcinogenic potential [42]. The two evaluation methods used in this study showed the high Cd-associated risk in the study area, making it urgent to implement effective risk reduction and protection measures.

3.4. Analysis of the Potential Sources of the Sediment Heavy Metal Elements

In order to improve the accuracy of the heavy metal source analysis, we used a correlation analysis, APCS-MLR, and the PMF model to analyze the source of six heavy metals in the study area.

3.4.1. Correlation Analysis

Correlation analysis can be used to assess the relationships between the contents of heavy metals and deduce their transformation and migration pathways [43,44]. The obtained results showed very significant positive correlations between Cu and Cr (r = 0.761), Cu and As (r = 0.646), and Cr and As (0.610), as well as significant positive correlations between Cu and Zn (r = 0.540) and Zn and Cr (r = 0.484) (Table 4). These findings suggest that Cu, Cr, Zn, and As might be derived from the same pollution source and were further precipitated in the sediments through co-precipitation or co-adsorption. Previous studies have shown a strong positive correlation (r = 0.85) between Cu and Zn in sediments, indicating that the sources of these elements are similar, and Cd and As are moderately correlated with other metals [45]. On the other hand, Pb in the sediments might be derived from atmospheric deposition and terrigenous inputs. Previous studies showed that the correlation between Pb and heavy metals such as Mn, Cr, and Ni was not statistically significant (p > 0.05) [46]. Hence, the heavy metal elements had different potential sources.

3.4.2. APCS-MLR-Based Source Analysis

SPSS was used to conduct a principal component analysis of the standardized sediment heavy metal data. KMO and Bartlett tests show that the KMO value is 0.791, and the significance level of the Bartlett test is 0.01. Based on the principle that the eigenvalue is greater than 1, two principal components were extracted by the principal component analysis, and the cumulative variance contribution rate was 83.376%.
As can be seen from Table 5, PC1 explains the variance of 70.247%, in which Cu(0.942), Cr(0.926), Zn(0.909), and As(0.855) have higher positive loads. The results of the correlation analysis showed that Cu, Cr, Zn, and As may come from the same source, which is consistent with the results of the principal component analysis. According to the Igeo results, the Igeo values of Cu, Cr, and Zn elements are less than 0, which is at the clean level, which indicates that they are not significantly polluted. In summary, we believe that Cu, Cr, As, and Zn are less affected by human activities, so Factor 1 is judged to be a natural source. PC2 explains 13.129% of the variance, and Pb(0.405) and Cd(0.663) have higher loads. Cu, Cr, Zn, and As elements have lower loads. The PCA analysis results are basically consistent with those of Feng et al. [47]. Cd in the study area has strong variability and a significant difference in spatial distribution, indicating that it is seriously disturbed by human activities. Studies have shown [48] that the external sources of Cd are mainly industrial sources and fossil fuel combustion, automobile exhaust and traffic dust, and pesticides and fertilizers. The main sources of Pb are gas oil burning, engines, and tire friction. So, Factor 2 is judged to be an industrial source. Based on the APCS-MLR model, the two principal component factor scores of the principal component analysis were converted into absolute principal component factor scores, and multiple linear regression was performed with the contents of six the heavy metals. The correlation coefficient (R2) is used to measure the correlation between the model and the actual observed value. The closer the value is to 1, the higher the linear fit and the better the simulation result. The correlation coefficients (R2) of Cu, Cr, Cd, Zn, As, and Pb were 0.825, 0.729, 0.627, 0.496, 0.689, and 0.476, respectively. Except for Zn and Pb, the elements fit well. According to the common formula in the APCS-MLR model, the tribute rates of the two pollution sources were calculated, and the results are shown in Figure 5. Natural sources have a large contribution rate to Cu, Cr, Zn, Pb, and As, which are 80%, 84%, 87%, 68%, and 75%, respectively. The contribution rate of industrial sources to Cd is 59%. APCS-MLR simplified the complexities of the six heavy metals into two dominant sources, efficiently underscoring natural inputs (72.5%). Compared with Feng et al.’s analysis of heavy metal pollution sources based on the traditional PCA method, the APCS-MLR model quantified the contribution rate of pollution sources [47].

3.4.3. PMF-Based Source Analysis

In this study, a PMF quantitative source analysis was further performed to understand the sources of the heavy metals in the mining areas using EPA PMF5.0 software. The numbers of operations and source factors were set to 20 and within the 3–5 range, respectively. The four-factor solution was determined from the minimum stable Q value, with most residuals between −3 and 3. The signal-to-noise ratio (S/N) > 8 was considered strong, indicating the rationality of the model [49]. The coefficient of determination (R2) values of all the heavy metal elements were greater than 0.9, except for Zn (R2 = 0.4). The contribution rates of Factor 1 to Cr, Zn, Pb, and Cu were relatively high, reaching 31.75, 28.88, 28.57, and 28.27%, respectively (Figure 6). The average sediment values in the Cr, Zn, Pb, and Cu contents were 51.89, 37.29, 16.42, and 16.44 mg/kg, which are lower than the corresponding local background values of 60.6, 47.3, 24.6, and 22.6 mg/kg, respectively. The Pearson correlation analysis results indicated that Cu, Zn, and Cr might come from the same pollution source. In addition, the correlations between the heavy metal elements also suggested the impacts of soil parent materials [50]. Therefore, Factor 1 was related mainly to the natural sources of the heavy metal elements. The contribution rate of Factor 2 to Cd was 57.92%. The results indicated higher Cd contents than the corresponding local background value (Table 2). Moreover, the Igeo and RAC results suggested a strong pollution level and a moderate risk associated with this heavy metal, respectively (Figure 4). The study area was located in coal mining subsidence zones. During the mining process, a large amount of Cd-containing wastewater can flow into water bodies and accumulate in sediments [51,52]. Therefore, it can be concluded that Factor 2 was related to the anthropogenic sources in the study area, particularly coal mining activities. The contribution rate of Factor 3 to As was 36.13%, which is in line with the relatively high sediment contents of this heavy metal element. The Igeo and RAC results indicated a moderate pollution level and a low risk associated with As in the study area. Numerous studies have highlighted the abundance of As in pesticide and fertilizer products, with volatilization and migration characteristics [53,54]. Indeed, the long-term applications of As-containing nitrogen (N) fertilizers, phosphate fertilizers, insecticides, herbicides, and other pesticide products may result in the gradual accumulation of As in soils. The study area is, in fact, surrounded by multiple agricultural fields. The accumulated As in agricultural soils can subsequently migrate into water bodies and sediments through surface runoff. Therefore, Factor 3 can be related to agricultural pollution sources. The contribution rate of Factor 4 to Pb was 36.83%. The main sources of Pb pollution in the study area are oil leakage from machinery and equipment through coal mining activities, as well as automobile exhaust emissions and tire wear [55,56,57]. The study area is characterized by the presence of a surrounding coal mine haulage road, with heavy and frequent traffic flows, promoting the accumulation of Pb in the research area. Therefore, it can be concluded that Factor 4 is related to heavy metal pollution caused by traffic. According to the PMF modeling results, the contribution rates of the natural sources, coal mining activities, agricultural activities, and traffic sources to the sediment heavy metal contents in the study area were 25.1, 26.4, 21.44, and 27.05%, respectively.

3.4.4. Comparison of APCS-MLR and PMF Results

In our study, APCS-MLR simplified the complexities of six heavy metals into two dominant sources, efficiently underscoring natural inputs (72.5%). The results of the APCS-MLR analysis are similar to those of Wang et al. [58]. APCS-MLR is used for rapid primary source screening, and PMF is used for fine analysis. PMF further decomposed the industrial contributions into specific human activities (mining: 26.4%, traffic: 27.05%). For Cd, APCS-MLR attributed 59% to industrial sources, while PMF traced its origin to coal mining (57.92%). This conclusion is roughly the same as the analysis results of heavy metal sources in sediments of the Tuohe subsidence section in the Huaibei mining area [47]. Slightly different is that this paper also analyzes the contribution of traffic pollution to heavy metals. Such synergistic analysis mitigates the risk of misinterpretation inherent in single-model approaches and aligns with the recommendations of Lv.et al. [59]. APCS-MLR is particularly suited for datasets with strong collinearity among variables and provides intuitive source contribution ratios. However, its limitation lies in assuming linearity between factors and pollutants, which may oversimplify complex interactions. So, it only identified two sources of pollution. The reason for the difference in contribution rates between the APCS-MLR and PMF models is that the absolute principal component does not consider the uncertainty of the data in the calculation process, and there is a small amount of information loss. However, the uncertain data of the heavy metal content in the sediment of the PMF model are added in the calculation process and non-negative constraints are applied, which makes the final result more reasonable.

4. Conclusions

In this study, the total amount of six heavy metals in water and the occurrence forms and ecological risks of six heavy metals in sediments in the Xutuan mining area were determined. A correlation analysis, APCS-MLR, and PMF models were used to quantify the heavy metal pollution sources in the sediment. The main conclusions of this study are as follows: 1. The average Cu, Pb, Zn, Cd, As, and Cr concentrations in the collapsed water bodies of the mining area were 6.28, 2.29, 26.15, 0.41, 32.86, and 37.26 μg·L−1, respectively. Cr and the remaining heavy metal elements were in line with the national Class I and Class II water quality standards, respectively. The average pH value of the mining water was 7.19, and the whole water was weakly alkaline. 2. The average Cu, Cr, Cd, Zn, Pb, and As contents in the collapsed sediments of the mining area were 16.44, 51.89, 1.98, 37.29, 16.42, and 31.49 mg/kg, respectively. In fact, Cd and As exhibited higher contents than the corresponding background values of the Xutuan mining area, showing certain enrichment degrees. F5 was the most dominant form of Cu, Cr, Zn, and As, accounting for 49.39, 65.78, 52.56, and 50.94%, respectively. On the other hand, the non-residual forms of Cd and Pb accounted for 75.11 and 79.06%, respectively, of which the F4 form was the most dominant. 3. Igeo indicated that Cd and As were in the polluted forms, while the remaining heavy metal elements were in the unpolluted forms. On the other hand, the RAC evaluation results indicated moderate ecological risks associated with Cu, Zn, Cd, and Pb. These elements can be easily released from sediments into the water bodies, causing secondary pollution. 4. APCS-MLR identified two types of pollution sources, natural and industrial, with contribution rates of 72.5% and 27.5%, respectively. The PMF model results revealed four heavy metal pollution sources, namely natural, coal mining, agricultural, and traffic sources, with relative contribution values of 25.1%, 26.4%, 21.44%, and 27.05%, respectively.
This study quantifies the pollution sources of heavy metals in mine sediment, determines the pollution sources that should be controlled first, and provides a future direction for the prevention and control of sediment pollution. However, the prevention and control of heavy metal pollution sources in mining environments should be combined with the overall research of mining soil. In addition, GIS statistical analysis should be combined with the approaches presented in this study to prove the accuracy of the models’ analysis of heavy metal pollution sources.

Author Contributions

Writing—original draft, J.X.; writing—review and editing, L.G.; data curation, J.Y. All authors have read and agreed to the published version of the manuscript.

Funding

This research was funded by Anhui Provincial Key Research and Development Project, grant number 202004i07020012.

Institutional Review Board Statement

Not applicable.

Informed Consent Statement

Not applicable.

Data Availability Statement

Data will be made available on request to the authors. The data that support the findings of this study are available from the corresponding author upon reasonable request.

Conflicts of Interest

Author Liangmin Gao was employed by the company Anhui Lida Earth and Environment Technology Co., Ltd. The remaining authors declare that the research was conducted in the absence of any commercial or financial relationships that could be construed as a potential conflict of interest.

References

  1. Tang, H.; Deng, Q.; Yuan, Y.; Zhang, S.; Luo, Y.; Chen, Y.; Jiang, L.; Huang, Y. The spatial distribution and source of heavy metals in soil-plant-atmosphere system in a large coal mining area. Ore Energy Resour. Geol. 2024, 17, 100059. [Google Scholar] [CrossRef]
  2. Liu, X.Y.; Bai, Z.K.; Shi, H.D.; Zhou, W.; Liu, X.C. Heavy metal pollution of soils from coal mines in China. Nat. Hazards 2019, 99, 1163–1177. [Google Scholar] [CrossRef]
  3. Zhang, Y.X.; Song, B.; Zhou, Z.Y. Pollution assessment and source apportionment of heavy metals in soil from lead-Zinc mining areas of south China. J. Environ. Chem. Eng. 2023, 11, 109320. [Google Scholar] [CrossRef]
  4. Shi, X.-M.; Liu, S.; Song, L.; Wu, C.-S.; Yang, B.; Lu, H.-Z.; Wang, X.; Zakari, S. Contamination and source-specific risk analysis of soil heavy metals in a typical coal industrial city, central China. Sci. Total Environ. 2022, 836, 155694. [Google Scholar] [CrossRef]
  5. Anaman, R.; Peng, C.; Jiang, Z.; Liu, X.; Zhou, Z.; Guo, Z.; Xiao, X. Identifying sources and transport routes of heavy metals in soil with different land uses around a smelting site by GIS based PCA and PMF. Sci. Total Environ. 2022, 823, 153759. [Google Scholar] [CrossRef]
  6. El Nemr, A.; El-Said, G.F.; Khaled, A.; Ragab, S. Distribution and ecological risk assessment of some heavy metals in coastal surface sediments along the Red Sea, Egypt. Int. J. Sediment Res. 2016, 31, 164–172. [Google Scholar] [CrossRef]
  7. Wang, J.; Ye, S.Y.; Laws, E.A.; Yuan, H.M.; Ding, X.G.; Zhao, G.M. Surface sediment properties and heavy metal pollution assessment in the Shallow Sea Wetland of the Liaodong Bay, China. Mar. Pollut. Bull. 2017, 120, 347–354. [Google Scholar] [CrossRef]
  8. Cheng, W.; Lei, S.; Bian, Z.; Zhao, Y.; Li, Y.; Gan, Y. Geographic distribution of heavy metals and identification of their sources in soils near large, open-pit coal mines using positive matrix factorization. J. Hazard. Mater. 2020, 387, 121666. [Google Scholar] [CrossRef]
  9. Suresh, G.; Sutharsan, P.; Ramasamy, V.; Venkatachalapathy, R. Assessment of spatial distribution and potential ecological risk of the heavy metals in relation to granulometric contents of Veeranam lake sediments, India. Ecotoxicol. Environ. Saf. 2012, 84, 117–124. [Google Scholar] [CrossRef]
  10. Fadlillah, L.N.; Utami, S.; Rachmawati, A.A.; Jayanto, G.D.; Widyastuti, M. Ecological risk and source identifications of heavy metals contamination in the water and surface sediments from anthropogenic impacts of urban river, Indonesia. Heliyon 2023, 9, e15485. [Google Scholar] [CrossRef]
  11. Chen, Z.; Zhao, Y.; Liang, N.; Yao, Y.; Zhao, Y.; Liu, T. Pollution, cumulative ecological risk and source apportionment of heavy metals in water bodies and river sediments near the Luanchuan molybdenum mining area in the Xiaoqinling Mountains, China. Mar. Pollut. Bull. 2024, 205, 116621. [Google Scholar] [CrossRef]
  12. Zhao, J.; Cao, C.; Chen, X.; Zhang, W.; Ma, T.; Irfan, M.; Zheng, L. Source-specific ecological risk analysis and critical source identification of heavy metal(loid)s in the soil of typical abandoned coal mining area. Sci. Total Environ. 2024, 947, 174506. [Google Scholar] [CrossRef] [PubMed]
  13. Sun, Z.; Xie, X.; Wang, P.; Hu, Y.; Cheng, H. Heavy metal pollution caused by small-scale metal ore mining activities: A case study from a polymetallic mine in South China. Sci. Total Environ. 2018, 639, 217–227. [Google Scholar] [CrossRef] [PubMed]
  14. Bradl, H.B. Adsorption of heavy metal ions on soils and soils constituents. J. Colloid Interface Sci. 2004, 277, 1–18. [Google Scholar] [CrossRef] [PubMed]
  15. Zhang, H.; Zhang, F.; Song, J.; Tan, M.L.; Kung, H.-T.; Johnson, V.C. Pollutant source, ecological and human health risks assessment of heavy metals in soils from coal mining areas in Xinjiang, China. Environ. Res. 2021, 202, 111702. [Google Scholar] [CrossRef]
  16. Pejman, A.; Nabi Bidhendi, G.; Ardestani, M.; Saeedi, M.; Baghvand, A. Fractionation of heavy metals in sediments and assessment of their availability risk: A case study in the northwestern of Persian Gulf. Mar. Pollut. Bull. 2017, 114, 881–887. [Google Scholar] [CrossRef]
  17. Yan, T.; Zhao, W.; Yu, X.; Li, H.; Gao, Z.; Ding, M.; Yue, J. Evaluating heavy metal pollution and potential risk of soil around a coal mining region of Tai’an City, China. Alex. Eng. J. 2022, 61, 2156–2165. [Google Scholar] [CrossRef]
  18. Shi, W.; Li, T.; Feng, Y.; Su, H.; Yang, Q. Source apportionment and risk assessment for available occurrence forms of heavy metals in Dongdahe Wetland sediments, southwest of China. Sci. Total Environ. 2022, 815, 152837. [Google Scholar] [CrossRef]
  19. Li, X.; Liu, H.; Meng, W.; Liu, N.; Wu, P. Accumulation and source apportionment of heavy metal(loid)s in agricultural soils based on GIS, SOM and PMF: A case study in superposition areas of geochemical anomalies and zinc smelting, Southwest China. Process Saf. Environ. Prot. 2022, 159, 964–977. [Google Scholar] [CrossRef]
  20. Liu, Y.; Wei, L.Z.; Wu, Q.H.; Luo, D.G.; Xiao, T.F.; Wu, Q.H.; Huang, X.X.; Liu, J.; Wang, J.; Zhang, P. Impact of acid mine drainage on groundwater hydrogeochemistry at a pyrite mine (South China): A study using stable isotopes and multivariate statistical analyses. Environ. Geochem. Health 2023, 45, 771–785. [Google Scholar] [CrossRef]
  21. Lang, Y.-H.; Li, G.-L.; Wang, X.-M.; Peng, P. Combination of Unmix and PMF receptor model to apportion the potential sources and contributions of PAHs in wetland soils from Jiaozhou Bay, China. Mar. Pollut. Bull. 2015, 90, 129–134. [Google Scholar] [CrossRef] [PubMed]
  22. Yu, E.J.; Liu, H.Y.; Dinis, F.; Zhang, Q.Y.; Jing, P.; Liu, F.; Ju, X.H. Contamination Evaluation and Source Analysis of Heavy Metals in Karst Soil Using UNMIX Model and Pb-Cd Isotopes. Int. J. Environ. Res. Public Health 2022, 19, 12478. [Google Scholar] [CrossRef] [PubMed]
  23. Thurston, G.D.; Spengler, J.D. A quantitative assessment of source contributions to inhalable particulate matter pollution in metropolitan Boston. Atmos. Environ. (1967) 1985, 19, 9–25. [Google Scholar] [CrossRef]
  24. Chen, H.Y.; Teng, Y.G.; Chen, R.H.; Li, J.; Wang, J.S. Contamination characteristics and source apportionment of trace metals in soils around Miyun Reservoir. Environ. Sci. Pollut. Res. 2016, 23, 15331–15342. [Google Scholar] [CrossRef] [PubMed]
  25. Jiang, Y.X.; Chao, S.H.; Liu, J.W.; Yang, Y.; Chen, Y.J.; Zhang, A.C.; Cao, H.B. Source apportionment and health risk assessment of heavy metals in soil for a township in Jiangsu Province, China. Chemosphere 2017, 168, 1658–1668. [Google Scholar] [CrossRef]
  26. Zhu, Y.; An, Y.; Li, X.; Cheng, L.; Lv, S. Geochemical characteristics and health risks of heavy metals in agricultural soils and crops from a coal mining area in Anhui province, China. Environ. Res. 2024, 241, 117670. [Google Scholar] [CrossRef]
  27. Liu, X.; Shi, H.; Bai, Z.; Zhou, W.; Liu, K.; Wang, M.; He, Y. Heavy metal concentrations of soils near the large opencast coal mine pits in China. Chemosphere 2020, 244, 125360. [Google Scholar] [CrossRef]
  28. Muller, G. Index of Geoaccumulation in Sediments of the Rhine River. GeoJournal 1969, 2, 109–118. [Google Scholar]
  29. Pardo, R.; Barrado, E.; Lourdes, P.; Vega, M. Determination and speciation of heavy metals in sediments of the Pisuerga river. Water Res. 1990, 24, 373–379. [Google Scholar] [CrossRef]
  30. Li, J.; Wang, W.; Li, X.; Liu, S.; Xu, X.; A., Y.; Ren, S. Heavy metals in the continuous river−estuary−sea system of the Yellow River Delta, China: Spatial patterns, potential sources, and influencing factors. Mar. Pollut. Bull. 2024, 209, 117247. [Google Scholar] [CrossRef]
  31. GB/T 14848-2017; Standard for Groundwater Quality. China Standards Press: Beijing, China, 2017. Available online: https://www.chinesestandard.net/PDF.aspx/GBT14848-2017?English_GB/T%2014848-2017 (accessed on 1 April 2025).
  32. Shahmoradi, B.; Hajimirzaei, S.; Amanollahi, J.; Wantalla, K.; Maleki, A.; Lee, S.M.; Shim, M.J. Influence of iron mining activity on heavy metal contamination in the sediments of the Aqyazi River, Iran. Environ. Monit. Assess. 2020, 192, 521. [Google Scholar] [CrossRef] [PubMed]
  33. Bai, H.L.; Liu, G.N.; Chen, D.L.; Xing, Z.S.; Wang, Y.H.; Wang, J.; Zhao, Y.Y. Heavy Metal Pollution in Sediments of the Yu River in a Polymetallic Ore Concentration Area: Temporal-Spatial Variation, Risk Assessment, and Sources Apportionment. Sustainability 2024, 16, 1154. [Google Scholar] [CrossRef]
  34. Shen, W.; Hu, Y.; Zhang, J.; Zhao, F.; Bian, P.; Liu, Y. Spatial distribution and human health risk assessment of soil heavy metals based on sequential Gaussian simulation and positive matrix factorization model: A case study in irrigation area of the Yellow River. Ecotoxicol. Environ. Saf. 2021, 225, 112752. [Google Scholar] [CrossRef]
  35. He, Z.-P.; Song, J.-M.; Zhang, N.-X.; Xu, Y.-Y.; Zheng, G.-X.; Zhang, P. Variation characteristics and controlling factors of heavy metals in the South Yellow Sea surface seawaters. Huan Jing Ke Xue = Huanjing Kexue 2008, 29, 1153–1162. [Google Scholar]
  36. Nemati, K.; Abu Bakar, N.K.; Sobhanzadeh, E.; Abas, M.R. A modification of the BCR sequential extraction procedure to investigate the potential mobility of copper and zinc in shrimp aquaculture sludge. Microchem. J. 2009, 92, 165–169. [Google Scholar] [CrossRef]
  37. Yu, Z.; Liu, E.; Lin, Q.; Zhang, E.; Yang, F.; Wei, C.; Shen, J. Comprehensive assessment of heavy metal pollution and ecological risk in lake sediment by combining total concentration and chemical partitioning. Environ. Pollut. 2021, 269, 116212. [Google Scholar] [CrossRef]
  38. Wei, B.G.; Yang, L.S. A review of heavy metal contaminations in urban soils, urban road dusts and agricultural soils from China. Microchem. J. 2010, 94, 99–107. [Google Scholar] [CrossRef]
  39. Setu, S.; Strezov, V. Impacts of non-ferrous metal mining on soil heavy metal pollution and risk assessment. Sci. Total Environ. 2025, 969, 178962. [Google Scholar] [CrossRef]
  40. Hu, B.Q.; Cui, R.Y.; Li, J.; Wei, H.L.; Zhao, J.T.; Bai, F.L.; Song, W.Y.; Ding, X. Occurrence and distribution of heavy metals in surface sediments of the Changhua River Estuary and adjacent shelf (Hainan Island). Mar. Pollut. Bull. 2013, 76, 400–405. [Google Scholar] [CrossRef]
  41. Wang, C.; Liu, S.L.; Zhao, Q.H.; Deng, L.; Dong, S.K. Spatial variation and contamination assessment of heavy metals in sediments in the Manwan Reservoir, Lancang River. Ecotoxicol. Environ. Saf. 2012, 82, 32–39. [Google Scholar] [CrossRef]
  42. Jiménez-Oyola, S.; Valverde-Armas, P.E.; Romero-Crespo, P.; Capa, D.; Valdivieso, A.; Coronel-León, J.; Guzmán-Martínez, F.; Chavez, E. Heavy metal(loid)s contamination in water and sediments in a mining area in Ecuador: A comprehensive assessment for drinking water quality and human health risk. Environ. Geochem. Health 2023, 45, 4929–4949. [Google Scholar] [CrossRef] [PubMed]
  43. Lu, X.; Wang, L.; Li, L.Y.; Lei, K.; Huang, L.; Kang, D. Multivariate statistical analysis of heavy metals in street dust of Baoji, NW China. J. Hazard. Mater. 2010, 173, 744–749. [Google Scholar] [CrossRef]
  44. Li, F.; Zhang, J.; Huang, J.; Huang, D.; Yang, J.; Song, Y.; Zeng, G. Heavy metals in road dust from Xiandao District, Changsha City, China: Characteristics, health risk assessment, and integrated source identification. Environ. Sci. Pollut. Res. 2016, 23, 13100–13113. [Google Scholar] [CrossRef]
  45. Wang, N.; Gao, Q.; Cheng, H.; Wang, J. Heavy metals distribution and their ecological risk in the surface sediments of Haizhou Bay, China. Reg. Stud. Mar. Sci. 2024, 78, 103772. [Google Scholar] [CrossRef]
  46. Islam, A.R.M.T.; Rabbi, A.H.M.F.; Anik, A.H.; Khan, R.; Masud, M.A.A.; Nedjoud, G.; Idris, A.M.; Rahman, M.N.; Senapathi, V. Source distribution, ecological risks, and controlling factors of heavy metals in river sediments: Receptor model-based study in a transboundary river basin. Int. J. Sediment Res. 2025, 40, 45–61. [Google Scholar] [CrossRef]
  47. Feng, J.T.; Yu, H.; Wang, Y.; Liu, X.Z.; Yang, M.J.; Wang, J.F.; Du, P.J.; Li, Z.C. Pollution Assessment and Source Apportionment of Heavy Metals in Sediments of Subsidence Section of Luling Mine in the Tuohe River, China. Pol. J. Environ. Stud. 2025, 34, 1529–1538. [Google Scholar] [CrossRef]
  48. Li, Z.; Ma, Z.; van der Kuijp, T.J.; Yuan, Z.; Huang, L. A review of soil heavy metal pollution from mines in China: Pollution and health risk assessment. Sci. Total Environ. 2014, 468–469, 843–853. [Google Scholar] [CrossRef]
  49. Luo, H.; Wang, Q.; Guan, Q.; Ma, Y.; Ni, F.; Yang, E.; Zhang, J. Heavy metal pollution levels, source apportionment and risk assessment in dust storms in key cities in Northwest China. J. Hazard. Mater. 2022, 422, 126878. [Google Scholar] [CrossRef] [PubMed]
  50. Ali, M.H.; Mustafa, A.-R.A.; El-Sheikh, A.A. Geochemistry and spatial distribution of selected heavy metals in surface soil of Sohag, Egypt: A multivariate statistical and GIS approach. Environ. Earth Sci. 2016, 75, 1257. [Google Scholar] [CrossRef]
  51. Yang, K.; Zhang, K.; Zhang, B.; Ao, L.; Tang, Y. Study on environmental characteristics of sustainable biomimetic soil preparation and its application in gangue reclamation. Constr. Build. Mater. 2024, 435, 136874. [Google Scholar] [CrossRef]
  52. Choudhury, B.U.; Malang, A.; Webster, R.; Mohapatra, K.P.; Verma, B.C.; Kumar, M.; Das, A.; Islam, M.; Hazarika, S. Acid drainage from coal mining: Effect on paddy soil and productivity of rice. Sci. Total Environ. 2017, 583, 344–351. [Google Scholar] [CrossRef]
  53. Fei, X.; Lou, Z.; Xiao, R.; Ren, Z.; Lv, X. Contamination assessment and source apportionment of heavy metals in agricultural soil through the synthesis of PMF and GeogDetector models. Sci. Total Environ. 2020, 747, 141293. [Google Scholar] [CrossRef]
  54. Sun, J.; Zhao, M.; Huang, J.; Liu, Y.; Wu, Y.; Cai, B.; Han, Z.; Huang, H.; Fan, Z. Determination of priority control factors for the management of soil trace metal(loid)s based on source-oriented health risk assessment. J. Hazard. Mater. 2022, 423, 127116. [Google Scholar] [CrossRef] [PubMed]
  55. Pang, K.; Li, M.; Liu, L.; Yang, J.-L.; Zhao, H.-J. Evaluation and Source Analysis of Heavy Metal Pollution in Sediments of the Yellow River Basin Based on Monte Carlo Simulation and PMF Model. Huanjing Kexue/Environ. Sci. 2022, 43, 4008–4017. [Google Scholar]
  56. Liu, Z.; Du, Q.; Guan, Q.; Luo, H.; Shan, Y.; Shao, W. A Monte Carlo simulation-based health risk assessment of heavy metals in soils of an oasis agricultural region in northwest China. Sci. Total Environ. 2023, 857, 159543. [Google Scholar] [CrossRef] [PubMed]
  57. Men, C.; Liu, R.; Xu, L.; Wang, Q.; Guo, L.; Miao, Y.; Shen, Z. Source-specific ecological risk analysis and critical source identification of heavy metals in road dust in Beijing, China. J. Hazard. Mater. 2020, 388, 121763. [Google Scholar] [CrossRef] [PubMed]
  58. Wang, M.-H. Source Analysis of Heavy Metals in Typical Farmland Soils Based on PCA-APCS-MLR and Geostatistics. Huan Jing Ke Xue = Huanjing Kexue 2023, 44, 3509–3519. [Google Scholar] [CrossRef]
  59. Lv, J. Multivariate receptor models and robust geostatistics to estimate source apportionment of heavy metals in soils. Environ. Pollut. 2019, 244, 72–83. [Google Scholar] [CrossRef]
Figure 1. Geographic location of the study area.
Applsci 15 04249 g001
Figure 2. Experimental flow chart.
Applsci 15 04249 g002
Figure 3. Proportions of the heavy metal forms in the sediments of the study area.
Applsci 15 04249 g003
Figure 4. Geological accumulation index and ecological risk assessment index.
Applsci 15 04249 g004
Figure 5. Contribution rate of heavy metal pollution sources.
Applsci 15 04249 g005
Figure 6. Sources of the heavy metal elements and their PMF-based factor contribution rates.
Applsci 15 04249 g006
Table 1. Classification of the heavy metal pollution levels.
Igeo [28]RAC [29]
IgeoPollution levelRACPollution level
Igeo < 0Pollution-freeRAC < 1%Risk-free
0 ≤ Igeo < 1No pollution to moderate pollutionRAC < 10%Low risk
1 ≤ Igeo < 2Moderate pollution10% ≤ RAC < 30%Moderate risk
2 ≤ Igeo < 3Moderate pollution to strong pollution30% ≤ RAC < 50%High risk
3 ≤ Igeo < 4Strong pollutionRAC ≥ 50%Extremely high risk
4 ≤ Igeo < 5Strong pollution to extremely intense pollution
5 ≤ IgeoExtreme pollution
Table 2. Descriptive statistics of the heavy metal (μg·L−1) element contents in the water.
MeanSDCV.MinimumMaximumChinese
National Standards *
% of SER
Cu6.281.770.283.2611.0510000.00
Cr37.268.910.2424.1565.795010.00
Cd0.410.330.81BDL1.6850.00
Zn26.1515.190.589.7989.9210000.00
Pb2.291.030.450.894.96500.00
As32.8623.250.71BDL104.255020.00
pH7.190.730.105.968.35
SD: standard deviation; CV. (%): coefficient of variation; % of SER: % of samples exceeding standard value; BDL: below detection limit. * The Class III concentration threshold of the Chinese Surface Water Quality Standard (GB/T 14848-2017, 2017 [31]).
Table 3. Descriptive statistics of the heavy metal (mg/kg) element contents in the sediments.
MaximumMinimumMeanSDCVBackground ValuesLevel II Standards
Cu23.1210.7916.443.020.1822.6100
Cr73.5634.9251.899.940.1960.6250
Cd2.801.281.980.430.220.11620.6
Zn50.7428.1537.296.070.1647.3300
Pb25.5810.7716.424.200.2624.6350
As46.2515.8931.498.110.267.825
pH7.656.107.090.390.05
OM10.055.147.241.320.18
OM: organic matter (%).
Table 4. Pearson correlations between the heavy metal contents.
SedimentCuCrCdZnPbAs
Cu1
Cr0.761 **1
Cd−0.430−0.1791
Zn0.540 *0.484 *−0.3271
Pb0.2470.017−0.0140.1811
As0.646 **0.610 **−0.1700.413−0.0731
Note: * and ** indicate significant correlations at the p < 0.05 and p < 0.01 levels, respectively.
Table 5. Rotational load of main constituent.
ComponentsCuCrZnAsPbCdContributing Percentage %
10.9420.9260.9090.8550.7280.61770.247%
2−0.217−0.184−0.066−0.3150.4050.66383.376%
Disclaimer/Publisher’s Note: The statements, opinions and data contained in all publications are solely those of the individual author(s) and contributor(s) and not of MDPI and/or the editor(s). MDPI and/or the editor(s) disclaim responsibility for any injury to people or property resulting from any ideas, methods, instructions or products referred to in the content.

