Article

An Evaluation of Mine Water Inrush Based on Data Expansion and Machine Learning

School of Information and Electrical Engineering, China University of Mining and Technology, Xuzhou 221000, China
*
Author to whom correspondence should be addressed.
Appl. Sci. 2025, 15(8), 4229; https://doi.org/10.3390/app15084229
Submission received: 11 February 2025 / Revised: 2 April 2025 / Accepted: 9 April 2025 / Published: 11 April 2025

Abstract

:
The accuracy of coal mine water inrush prediction models is affected mainly by the small number of samples and difficulty in feature extraction. A new data augmentation water inrush prediction method is proposed. This method uses the natural neighbor theory and mutual information sparse autoencoder-improved SMOTE to augment and predict the risk of water inrush. By learning features through the autoencoder, we can achieve better separation between classes and weaken the influence of data overlap between classes in the original sample. Then, the natural neighbor search algorithm is used to determine the intrinsic neighbor relationships between samples, remove outliers and noise samples, and use different oversampling methods for borderline samples and center samples in the minority class. Synthetic samples are generated in the feature space, mapped back to the original space, and merged with the original samples to form an expanded water inrush dataset. Finally, the experiment demonstrates that the enhanced SMOTE oversampling algorithm suggested in this paper broadens the dataset. With a Gmean value of 0.9025 from training with the standard dataset, it outperforms the contrast algorithm, SMOTE average of 0.8581, B-SMOTE average of 0.873, and ADASYN average of 0.8909. Additionally, it performs well in the coal mine floor water inrush dataset, increasing the water inrush prediction algorithm’s accuracy.

1. Introduction

The mining environment in North China coalfields is complex. As coal mines continue to be mined deeper, the pressure on coal seam floors has also increased. Under the combined influence of various unfavorable factors, such as high pressure, high water content, and confining layer thinning, the risk of water inrush increases significantly. Through studies on the water inrush mechanism, many scholars have applied data analysis algorithms, such as regression analysis [1,2,3,4], classification [5], support vector machine [6,7,8,9], neural network [10,11,12], and random forest algorithms [13], to the prediction of water inrush in coal mines.
Due to the small amount of water inrush data in coal mines, the data features required for the prediction model cannot be provided, which reduces the accuracy of the prediction model. This paper presents a new oversampling method. Different from the traditional SMOTE [14] method of randomly selecting sampling points and linear interpolation, this paper introduces the natural neighbor theory [15,16,17] to determine the neighbor relationships between samples. The outliers and noise values existing in the water inrush dataset are removed to reduce the risk of overfitting of the prediction model, and the water inrush data samples are divided into center minority class samples and borderline minority class samples [18,19,20]. Since the nearest neighbor of a borderline minority sample contains majority class samples, it is easier to generate new noise samples as sampling points. To address this problem, this paper presents a natural neighbor interpolation method to expand the amount of data. At the same time, for center minority samples, a spatial interpolation method is proposed to generate new synthetic water inrush samples.
At present, the method of expanding the small sample data to achieve data balance is mainly the SMOTE algorithm, which functions by increasing the number of required category samples to achieve the purpose of expanding the dataset. Although the algorithm can effectively expand the water inrush dataset, due to the use of a few quasi-random linear interpolation methods, the diversity of synthesized samples is poor, and it is easier to synthesize samples with similar features to the selected samples, resulting in the overfitting phenomenon of too many similar features learned by the model. At the same time, because of the lack of a SMOTE classification screening mechanism, it is easier to synthesize noise samples in the face of complex sample spatial distribution. This paper presents an improved SMOTE (ISMOTE) algorithm based on natural neighbors and spatial interpolation to expand a water inrush sample set and uses the mutual information dropout sparse autoencoder (MISAE) to extract the characteristics of coal mine water inrush data and evaluate the risk of coal mine water inrush. At present, few studies have focused on water inrush prediction methods based on data augmentation deep learning.

2. Materials and Methods

The occurrence of water inrush accidents in coal mines is the result of a variety of influencing factors. The primary causes of water inrush accidents are fault structure failure, which can impair the aquitard’s resistance to deformation, weaken the integrity of the coal seam, and decrease the strength characteristics of the rocks in the coal seam. The water barrier layer of the coal seam plays a major role in preventing water inrush, and its thickness and mechanical characteristics dictate this ability. The force behind the water inrush is the aquifer’s water pressure, which also has the impact of enlarging and eventually shattering the rock layer crack. The aquifer’s water content serves as a gauge for the damage caused by water inrush, with high water pressure and an abundance of water sources being the most detrimental factors. Water inrush is significantly influenced by mine pressure. The water barrier layer will break due to mine pressure, which will also widen existing rock layer fissures. This will thin the effective water barrier layer and provide the conditions for water inrush in coal mines.
The Ministry of Coal proposed the water inrush coefficient method [21]. In theory, the standard of water inrush prediction is set as the water pressure value received by unit water barrier, and the concept of water inrush coefficient is put forward. The “lower three belts” theory, the “two-zone” model, the “lower four belts” theory, the “Strong Permeability Channel” theory, the “KS” (Key Strata) theory, etc., were all born out of this. Professor Zhang of Shandong University of Science and Technology proposed the theory of the “lower three belts” through the analysis and finite element calculation of the water barrier layer of the floor. In the theory, the coal seam floor is divided into three zones with different water barrier capacity, including the water damage zone guided by the floor mining, the effective protective layer zone and the confined water lift zone. Based on the theory of “lower three belts”, the theory of “ower four belts” is established based on damage mechanics, fracture mechanics and mine pressure theory. The theory divides coal seam floor into mine pressure zone, damage zone, original damage zone and original guide height zone. According to the theory of Strong Permeability Channel, there are two kinds of water inrush channel: when there is the original water inrush channel directly connected with aquifer water source in coal mine floor; When there is no original channel, the mining activity destroys the weak link of the floor and causes it to deform and form a strong seepage channel.
These prediction methods mostly rely on empirical formulas and qualitative analysis, which is difficult to make full use of the multi-dimensional characteristics of water inrush, and the prediction accuracy is greatly limited.
The analysis reveals that the five first-level indicators of aquifer conditions, aquifer conditions, coal seam conditions, structural conditions, and mining conditions, as well as the corresponding twelve secondary indicators, are the primary factors affecting the water inrush from the coal floor. This conclusion is based on the summary of prior studies. Table 1 shows the influencing factors of coal seam water inrush.

2.1. Natural Neighbor Theory

The idea of the natural neighbor theory is inspired by real-world friend relationships. If sample xi has sample xj as a nearest neighbor and xj also has xi as a nearest neighbor, then samples xi and xj are true neighbors of each other. The natural neighbor theory is a detection algorithm without parameter settings. This algorithm continuously searches for the r-nearest neighbors of each sample in the dataset during operation until each sample has r-nearest neighbors of each other, thus forming a stable data structure. At this time, the eigenvalue λ is equal to r.
x i x j r n x i x j x i N N r x j x j N N r x i
In the formula, xi and xj represent two different samples in the dataset, and NNr(xi) and NNr(xj) represent the sets of r nearest neighbors of xi and xj, respectively. In a stable data structure, there is a different sample xj for any xi, making them the r nearest neighbors to each other.
If xi belongs to the λ nearest neighbor of xj, and at the same time, sample xj also belongs to the λ nearest neighbor of sample xi, then the two samples are natural neighbors of each other, as shown in Equation (2):
x i N a N x j x i N N r x j x j N N r x i
In the formula, NNr(xj) represents the natural neighbor set of xj. NaN(xj) denotes the natural neighbor set of xj.
If and only if there is an outlier in the dataset, then all samples except this point have reached the natural stable structure. Outliers have no natural neighbors; that is, NaN (xi) = 0.
Based on the definition of outliers, when the natural neighbor search algorithm is running, the algorithm stops if the number of inverse neighbor samples in two adjacent iterations remains unchanged. At this time, samples without inverse nearest neighbors are outliers, and the search pseudocode is shown in Algorithm 1.
Algorithm 1 Search for NaN (NaN-Search)
Input: Water inrush data set X
Output: natural neighbors feature λ, natural neighbors NaN, number of inverse neighbors of the sample nb
1: Initialize the search round number r = 1, num = 0 (the number of xi with nb = 0), NNr(xi) = , RNN(xi) = (xi’s inverse nearest neighbor), NaN(xi) = ;
2: Establish a k-dimensional tree on the water inrush data set X
3: For each xiX, find its r-th neighbor xj by using k-d tree. Update nb(xj) = nb(xj) + 1, NNr(xi) = NNr(xi) ∪ {xj}, RNN(xj) = RNN(xj) ∪ {xi};
4: Compute the number num of xi with nb(xi) = 0;
5: If num does not change λ = r;
6: For each xiX, NaN(xi) = RNN(xi) ∩ NNr(xi);
7: Otherwise r = r + 1, go to step 3;
8: Return: λ, NaN, nb

2.2. Coal Mine Water Inrush Prediction Model Based on Data Augmentation

The data-expanded surge prediction algorithm presented in this paper consists of three basic sub-structures: the decoder network (for mapping high-dimensional surge data overlapping into characteristic space), the oversampling model (using the natural neighbor theory to remove outliers and noise samples, it generates high-quality new samples using the proposed spatial insert method) and the decoder network (to map the synthetic sample back into the original space). In particular, the method includes the following: 1. Train the mutual information dropout autoencoder using (x, y) from the dataset. 2. Use the trained encoder network to map X into a feature space with better inter-class separability (z = Encoder(x)). 3. Using the natural neighbor theory, remove noisy points and outliers from the datasets and determine center and borderline samples. In order to produce high-quality synthetic data znew, samples are oversampled using the two spatial oversampling techniques presented in this article. 4. Map znew back to the original space using the trained decoder network; then, combine it with the data x to create an expanded dataset. After obtaining the expanded dataset, an autoencoder is used to predict water inrush accidents [22,23].

2.3. Natural Neighbor-Based Spatial Interpolation SMOTE

This paper introduces the natural neighbor theory into the SMOTE algorithm. First, the natural neighbor search algorithm in Algorithm 1 is used to search the dataset to remove noise and outliers. Then, the minority class samples are divided into center samples and borderline samples based on the natural neighbor theory, and two different spatial interpolation methods are used to generate new water inrush samples. Finally, we add the synthesized water inrush samples to the dataset to expand the water inrush dataset [24,25]. Figure 1 shows the main structure of the algorithm proposed in this article.
The model performs three steps in the oversampling stage, including removing outliers and noise points, distinguishing borderline samples and center samples, and synthesizing new instances.
A binary classification dataset X consists of majority class samples Smaj and minority class samples Smin. Label(xi) represents the class label of sample xiX. Based on the natural neighbor theory, noise samples and outlier samples are defined as follows:
Definition 1. 
If sample xi satisfies ∀xj ∈ NaN(xi) and Label(xj) ≠ Label(xi), then xi is a noise point. That is, if xi belongs to the minority class sample but its natural neighbors are all majority class samples, then xi is defined as a noise point.
Definition 2. 
If sample xi satisfies ∣NaN(xi)∣ = 0, ∣NaN(xi)∣ represents the number of natural neighbors of xi. Then, xi is defined as an outlier.
Noise and outliers in the dataset will affect the normal data distribution of the sample, making it difficult for the classifier to fit the offset points and thus resulting in a decrease in the generalizability of the prediction model. Therefore, in the coal mine water inrush prediction model, noise and outliers must first be removed from the dataset. After removing noise and outliers from the preprocessed water inrush dataset, it becomes a regularly distributed dataset, and better prediction accuracy can be achieved.
Definition 3. 
If sample xi ∈ Smin and xi is not noise or an outlier, if ∃xj ∈ NaN(xj) makes Label(xj) ≠ Label(xi), then xi is defined as a borderline minority class sample.
There are majority class samples in the natural neighbor sample of the borderline samples, but when their natural neighbors are all majority class samples, xi is a noise point. Figure 2 shows the noise points and outliers in the dataset.
According to the natural neighbor search algorithm, borderline minority class samples existing in the dataset can be identified through traversal, and the Danger dataset is used to store these borderline samples. Since there are majority class samples among the natural neighbors of the borderline samples, it is easier to synthesize incorrect class samples during oversampling. Therefore, in this paper, two different spatial oversampling methods are used to oversample center minority samples and borderline minority class samples, thereby generating new samples of the required categories and reducing noise and damage to the distribution of the dataset [26].
For the borderline sample SiDanger, two minority class natural neighbor samples, Si1 and Si2, of xi are randomly selected. The algorithm first uses the natural neighbor sample Si1 and Si2 to synthesize the midpoint according to Formulas (3) and (4) and then connects xi and the midpoint and performs interpolation to synthesize a new sample.
S mid = S i 1 + δ 1 ( S i 2 S i 1 )
S i n e w = S i + δ 2 ( S m i d S i )
δ1 and δ2 in the formula are two random numbers between 0 and 1. This step is repeated until borderline sample oversampling is complete. Figure 3 shows the borderline sample oversampling method.
For the center minority sample xiSafe in the dataset, sample S1 is selected, and the sample point Snew with the largest Euclidean distance d between the selected sample and the Safe dataset is calculated to form a sampling space, as shown in Figure 4. Assume that S1 = (x1,y1) and the farthest Euclidean distance sample point in the minority class sample set is Sd = (x2,y2). A data point is randomly sampled in the adoption space as a synthetic sample point Snew = (xnew,ynew), where xnew = random(x2,x1) and ynew = random(y2,y1). Different from the SMOTE, the new synthetic sample point is located in the sampling space formed by the selected sample and its farthest sample in the minority class rather than on the line connecting the two points.
The ISMOTE algorithm’s training steps are as follows:
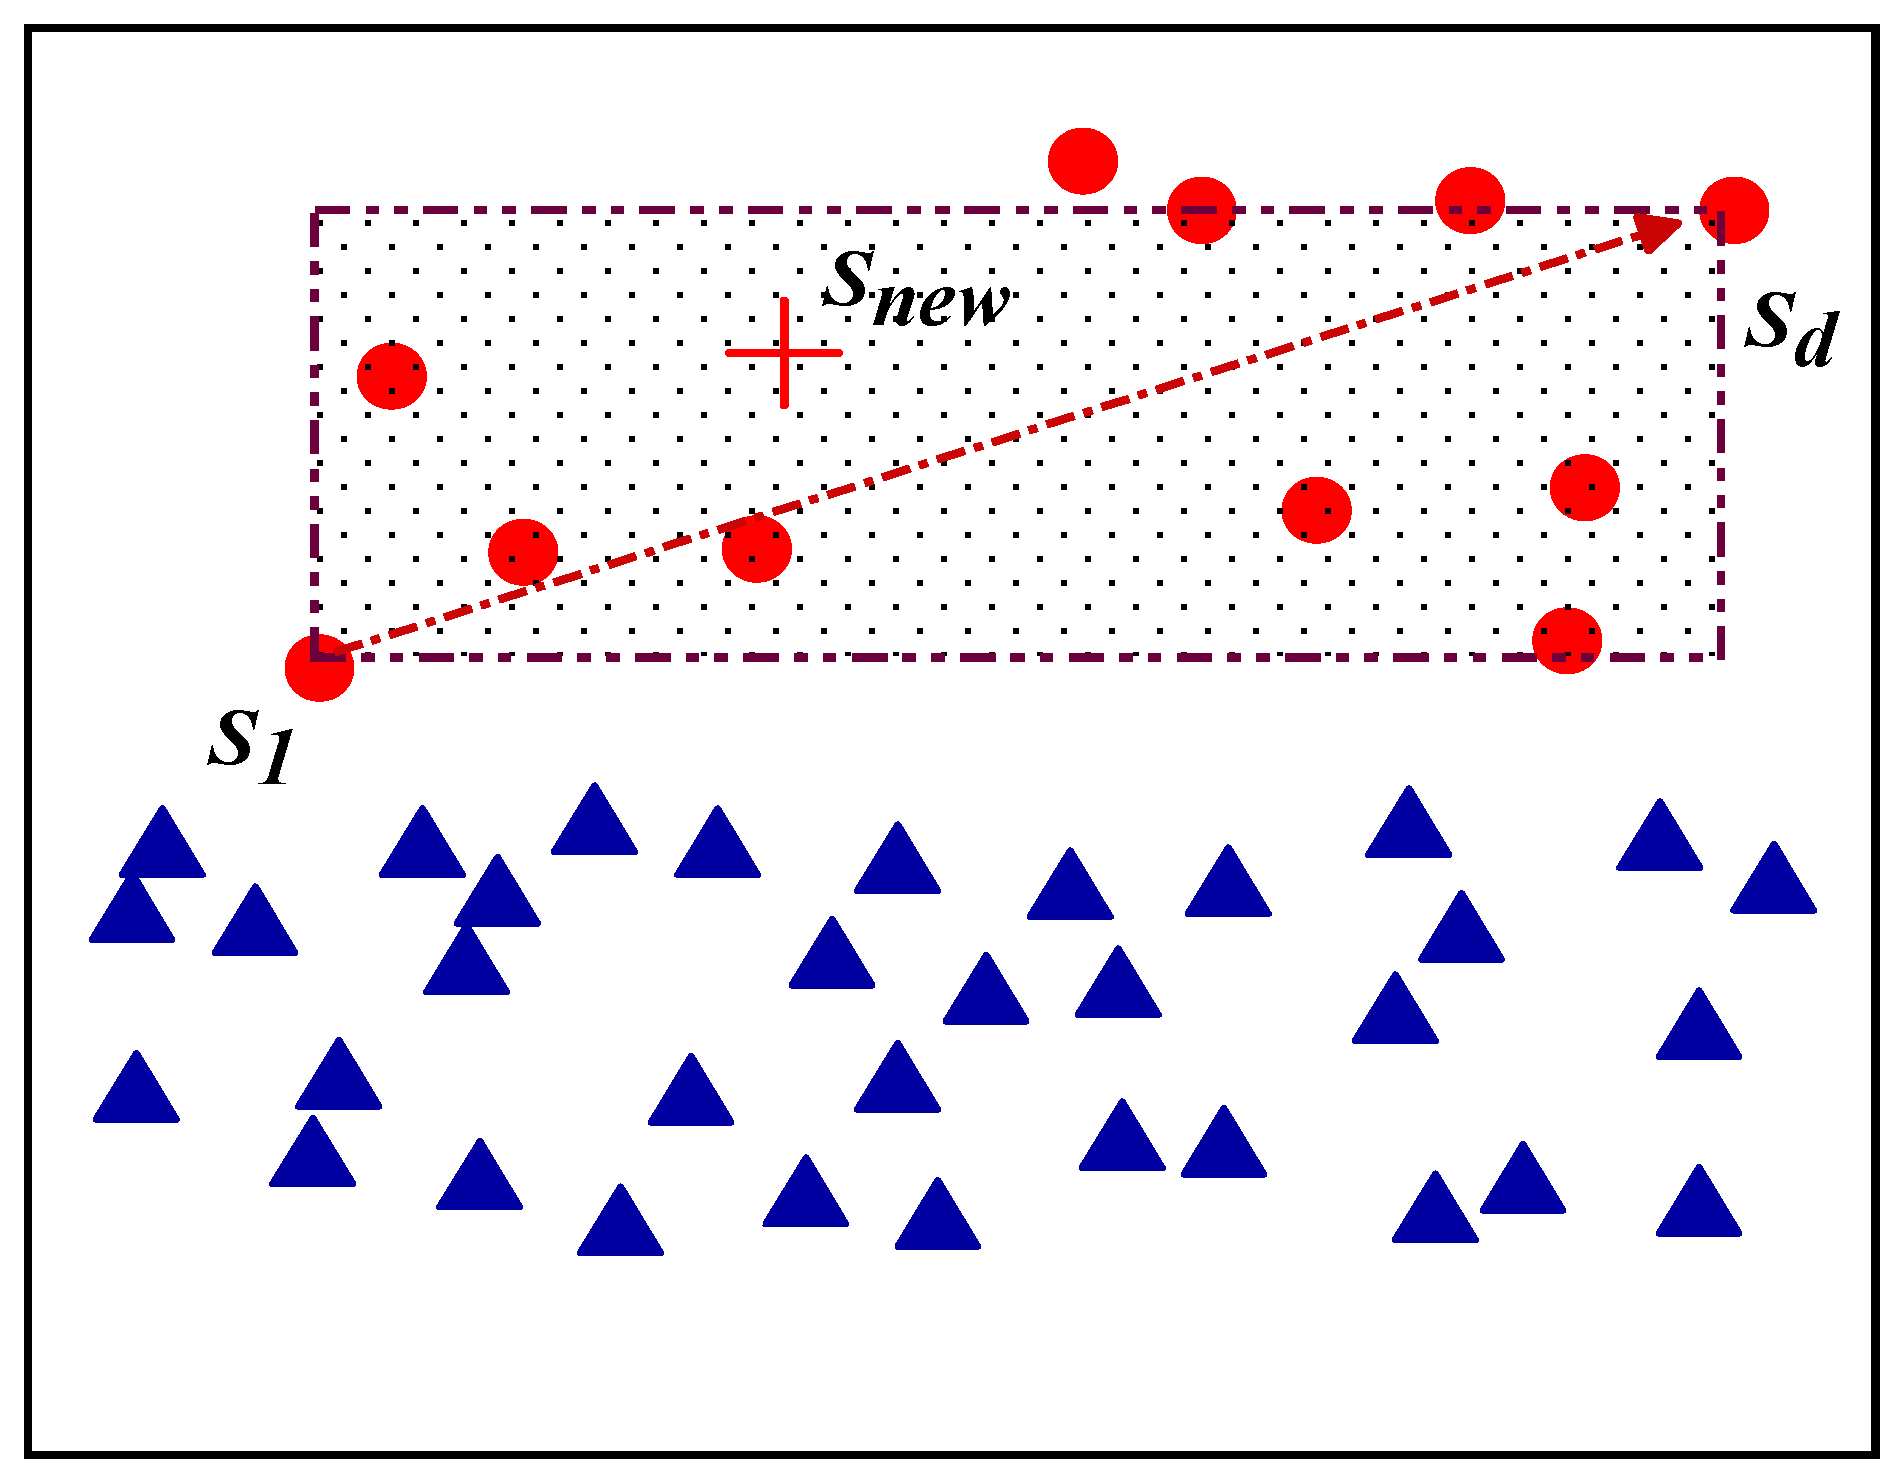
  • Assuming that the minority class samples in the sample dataset are {S1, S2, …, Sn}, define K as the chosen hyperparameter (often the difference between the number of majority class data and the number of minority class data);
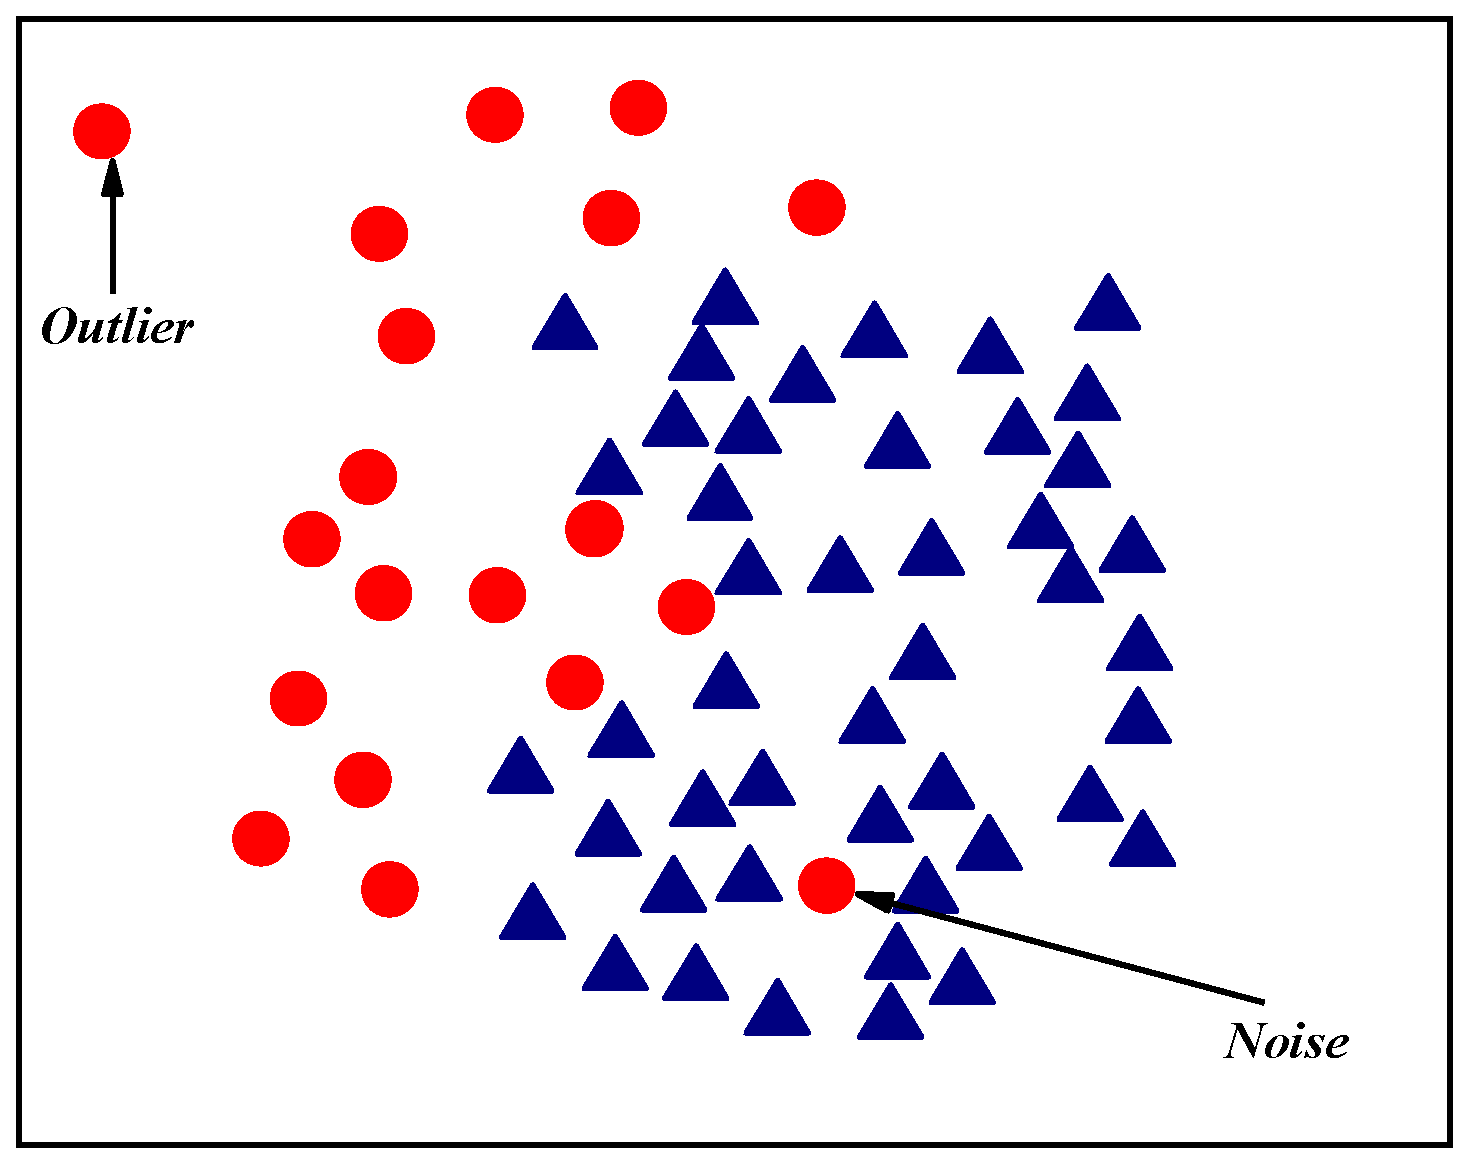
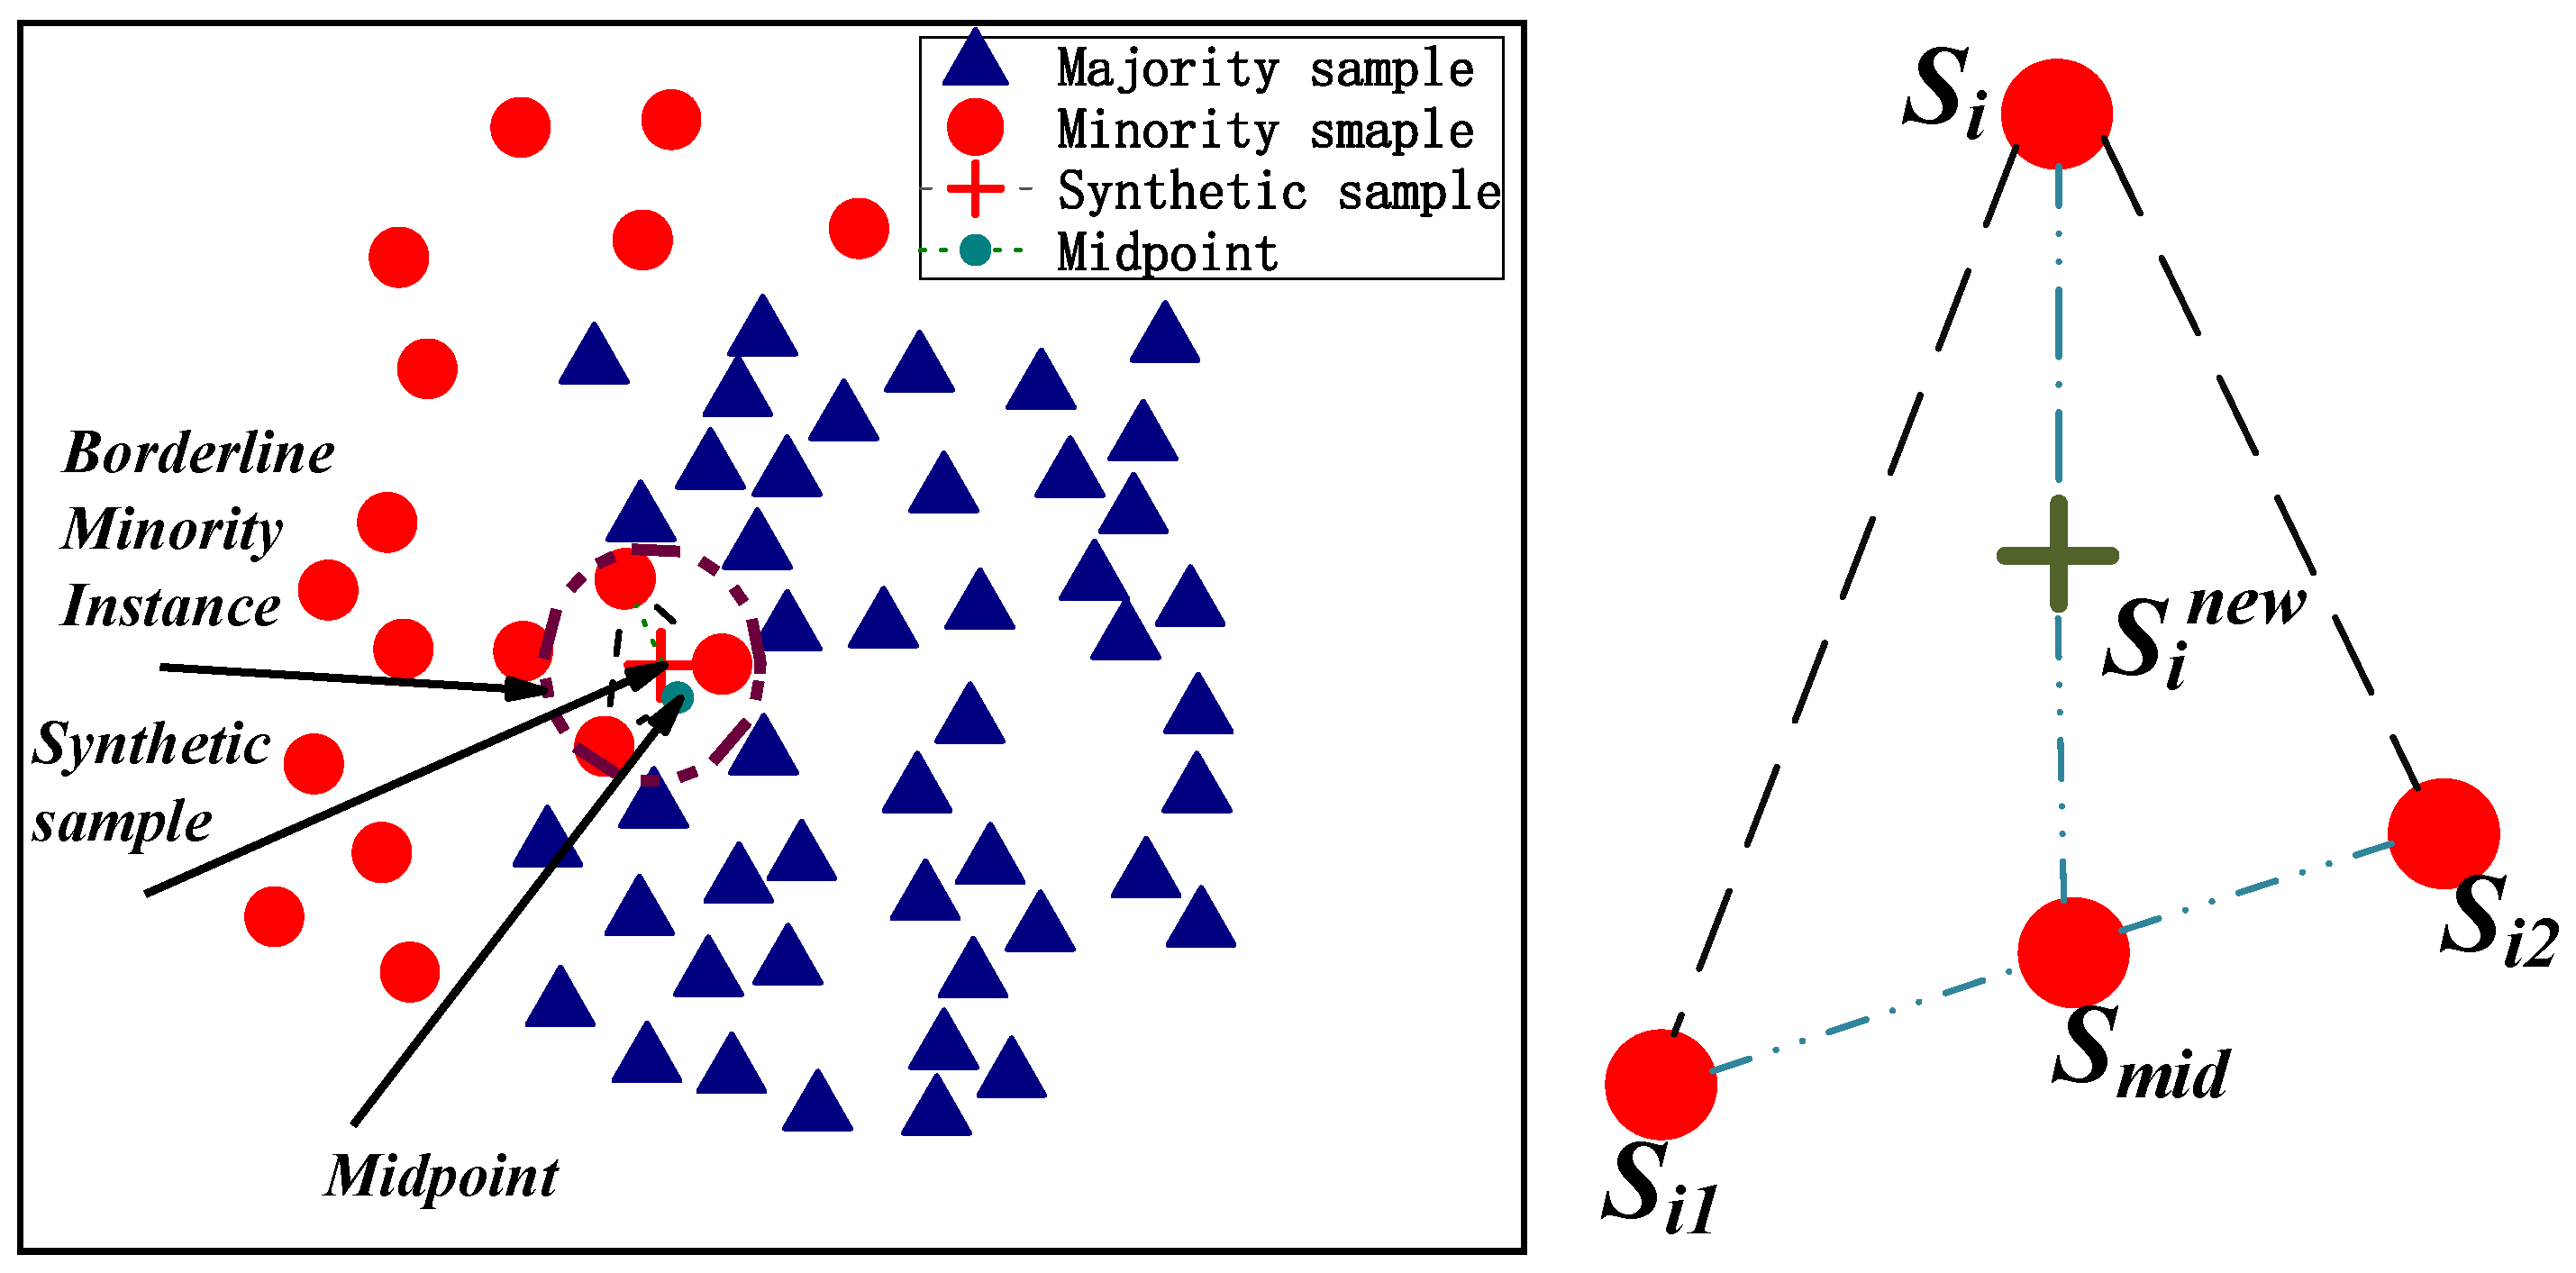
  • Determine how many natural neighbors each sample has using the natural neighbor search technique, eliminate noise and outliers, separate a few samples into boundary and safe regions, and establish the edge sample set SiDanger and the safe sample set SiSafe;
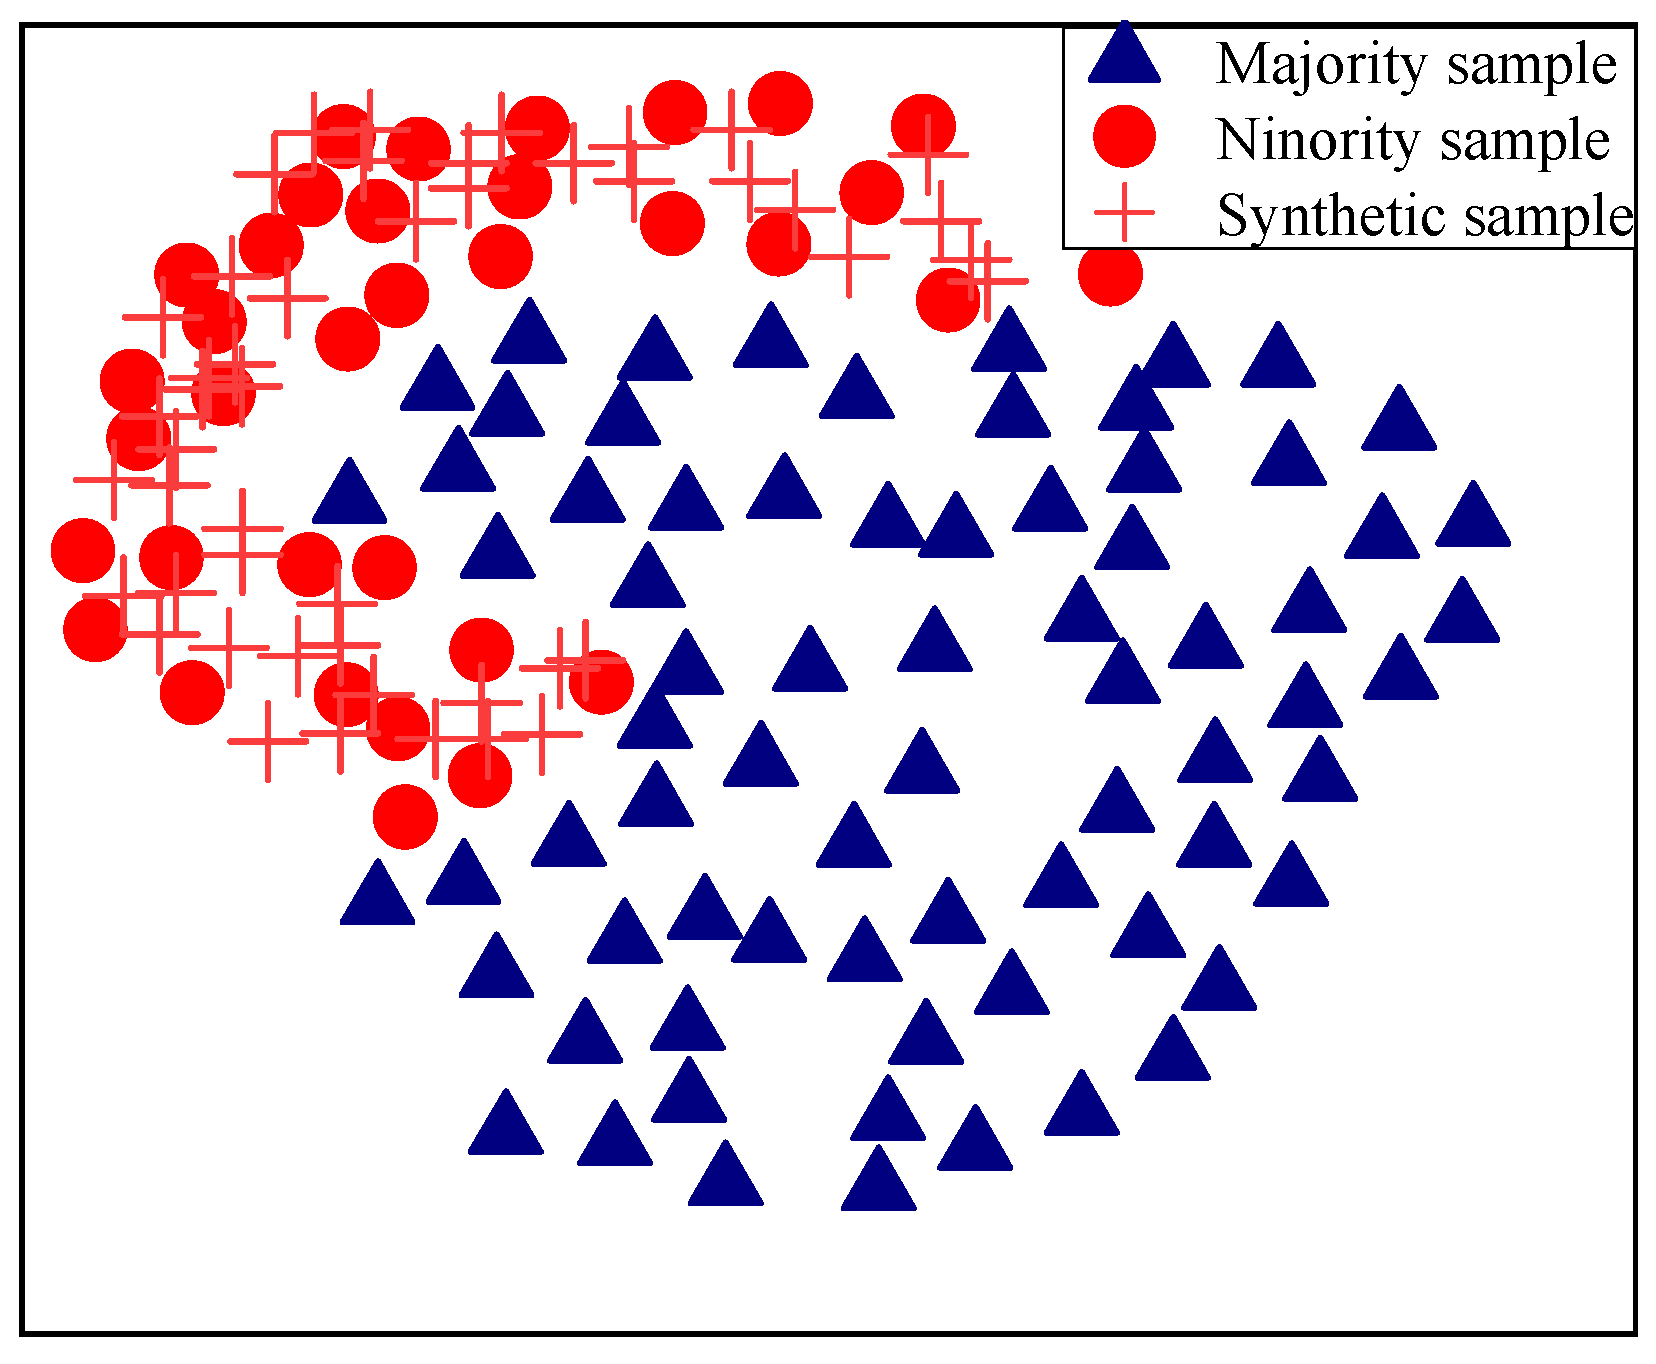
  • The spatial interpolation sampling technique suggested in this paper is applied to oversample Si if SiSafe. If SiDanger, Si is sampled using the natural nearest intermediate point random interpolation suggested in this research, and a new sample Snew is created.
  • Determine the average distance a and b between the majority and minority samples and the composite sample;
  • Add the synthetic sample to the dataset if a < b, and remove it if a > b.
  • If the number of iterations approaches K, the program terminates; if not, proceed to step (2).
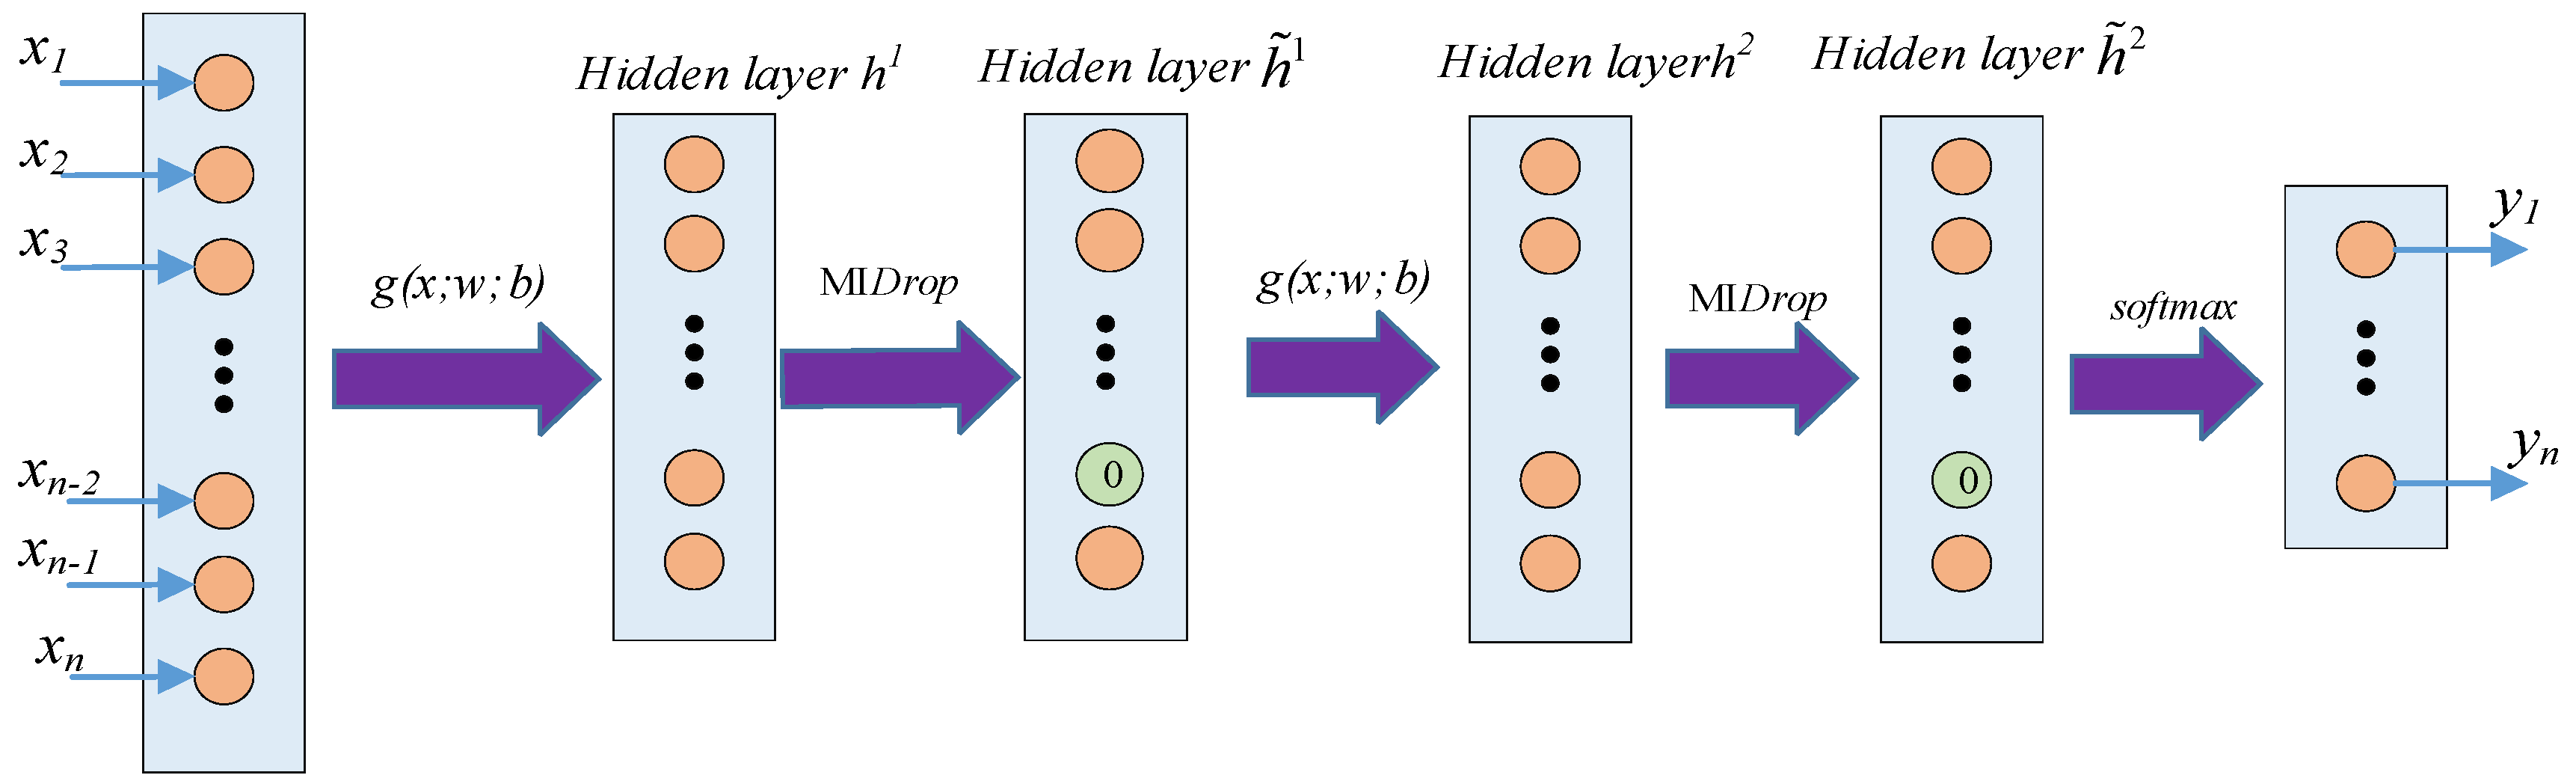
The farthest-distance sample point is selected to form a sampling space to randomly form synthetic samples. Compared with linear sampling, the proposed sampling approach can form a more diverse synthetic sample set, and there will be no situation where sample-dense areas become denser and sparse areas become sparser and effectively addresses the drawbacks of the SMOTE algorithm, which alters the data distribution pattern with ease. The spatial interpolation method enhances the sample set’s mathematical features’ comprehensiveness and diversifies the characteristics of the minority class data. The results of NaN-ISMOTE algorithm under complex data distribution conditions is shown in Figure 5.
The G-mean was employed as the evaluation metric to assess overall classification performance, particularly suitable for imbalanced small-sample datasets. The G-mean is mathematically defined as follows:
G-mean = T P P × T N Q
In the formula, the G-mean index can evaluate the overall effect of the algorithm on unbalanced small sample data. When good classification results are obtained on both positive and negative class datasets, a larger G-mean value can be obtained.
Ten standard small sample datasets similar to the collected water inburst sample sets of coal mine floor were selected, all of which were binary classification data with feature quantities ranging from 5 to 30 and imbalance ratios ranging from 1.25 to 129.44. All samples were standardized before sampling to reduce the impact of different dimensions on the algorithm. We used ISMOTE and SMOTE with a value of K = 5.
As can be seen from Table 2, based on the evaluation index G-mean, the improved algorithm proposed in this chapter has better performance on 10 data, with an average value of 0.9021. It is better than the other three methods: the average value of the SMOTE algorithm is 0.8581, and the average value of the B-SMOTE algorithm is 0.873. The average value of the ADASYN algorithm is 0.8909. It can be seen from the results that the method proposed in this chapter performs better.

2.4. MISAE

In this paper, an encoder–decoder is used to learn a separable feature space so that samples of different categories are far apart. In this case, the synthetic samples are also far from the majority class samples, thus reducing the risk of falling into the danger zone.
The encoder network aims to map raw data into a separable feature space and consists of multiple encoder layers. The encoder is represented as:
z = f ( W x + b )
In the formula, f represents the activation function of the neuron, W is defined as the weight matrix, and b is the bias vector of the hidden layer.
The function of the encoder is to transform the output from the hidden layer to the reconstructed data output vector.
x = h ( W z + b )
In the formula, h is the activation function of the hidden layer of the autoencoder, W is the weight matrix between model layers, and b is the bias vector output by the output layer. The objective function of the autoencoder can be defined as follows:
J = 1 N m = 1 M ( 1 2 y m x m 2 2 )
In the formula, the error between the input data x of the original sample set and the reconstructed data y decoded by the decoder is represented as J. By minimizing the error J, each parameter of the autoencoder is optimized to obtain the optimal data representation of the input data.
Since the influencing factors of water inrush accidents have different contributions to accidents, MI-Dropout is introduced into the encoder layer. By establishing a binary mask moment of mutual information sorting, the weight of feature neurons with a small correlation is set to 0, and the neurons that are beneficial to the expression of water intrusion features are retained. The mutual information is expressed as follows:
I ( X , Y ) = H ( x ) + H ( y ) H ( x , y )
H ( X ) = x p ( x ) log p ( x ) d x
The marginal probability density function is represented by p(x) and p(y), while the joint probability density is denoted by p(x,y). H(x) is defined as the entropy of parameter x. The water inrush label dataset defines the output matrix of the l-th hidden layer of the model as hil. Then, the mutual information between the target expression and the output of the hidden layer neuron is calculated:
I ( h i l , Y ) = H ( h i l ) + H ( y ) H ( h i l , y )
where mutual information is a vector matrix, elements represent the contribution of hidden layer neurons to the output. The mutual information is sorted to obtain the vector S in descending order, and a new mask matrix is constructed:
ε i l = 1 S i l k · μ 0 S i l < k · μ
In the formula, Sil is the position of the i-th neuron in the l-th hidden layer in the vector. Μ is the loss rate in the random deactivation strategy. μ is the loss rate in the random inactivation strategy. The larger the value μ is, the more neurons in the hidden layer are activated. The forward propagation process of the model is expressed as follows:
h ˜ i l = ε i l h i l
z i l + 1 = w i l + 1 h ˜ i l + b i l + 1
h i l + 1 = f ( z i l + 1 ) = f ( w i l + 1 h ˜ i l + b i l + 1 )
The mutual information random deactivation strategy is more conducive to preserving the information of hidden layer neurons that are conducive to feature representation during model training, while discarding some neurons that contribute less to model prediction to reduce the risk of model overfitting. The gradient descent method is used to update the autoencoder parameters during reverse training.
MISAE includes three basic modules:
  • Feature extraction layer. An autoencoder is used as the feature extraction layer structure, which is defined as g(x; w; b), where x is the input function of the model and w and b are the interlayer weights and bias sizes, respectively, that need to be learned in the SAE model. G() is the feature extractor function constructed by the SAE, which is used to extract hidden features in water inrush data.
  • The MI-Dropout layer. In this layer, the neurons in the hidden layer are sorted through mutual information, and a binary mask matrix is constructed to randomly deactivate the neurons in the hidden layer. The output vector of the mutual information drop layer is used as the input of the next feature extraction layer or combined with the softmax layer for model prediction.
  • The softmax classification layer is defined as y = s o f t max ( h ˜ i l ; w ; b ) . The structure is shown in Figure 6.
The oversampling algorithm is shown in Algorithm 2.
Algorithm 2 Oversampling Algorithm
Input: MISAE model, data set (x, y), oversampling factor N
Output: augmented data set
1: Use the data set to train MISAE;
2. Use the trained encoder to map x to the feature space, Z = Encoder(x);
3. The natural neighbors algorithm traverses Z and calculates the number of natural neighbors of all samples in Z;
4. Remove outliers and noise points, divide the remaining data points into center samples and borderline samples, and define the center sample set Safe and the borderline sample set Danger;
5. If zSafe, use the spatial interpolation sampling method proposed in the article to oversample zi; if zDanger, use the random intermediate point interpolation proposed in the article to sample zi and synthesize N new samples Znew;
6. Use the trained decoder to map [Z, Znew] to the original space, and the reconstructed sample set is X ^ X ^ n e w ;
7. Output the expanded water inrush sample set { X , X ^ n e w , Y , Y N E W }

3. Results and Discussions

In this section, we evaluate the performance of the coal mine water inrush prediction algorithm proposed in this paper and test it on water inrush data extracted from actual working faces in typical mining areas in North China. Comparison algorithms include IWOA-SVM, PCA-OPF, PCA-Fisher and other recent water inrush prediction algorithms [27,28,29], as well as the oversampling algorithms SMOTE and Borderline-SMOTE. The SMOTE parameters are set to k1 = 5, and the BL-SMOTE parameters are set to k1 = 5 and k2 = 5. The algorithm presented in this paper uses cross-validation experiments to find the MISAE module’s hyperparameters while keeping the model’s top-level decoder and using the root-mean-square error between the model’s input and output values as the data reconstruction error that MISAE obtains. This model utilizes three autoencoder structures to create a four-layer SAE structure, with 17, 12, 8, and 6 neuron units per layer.
Classification algorithms generally use Accuracy as the main result analysis indicator. Recall and the F-measure are also used for performance evaluation.
A c c u r a c y = T P + T N T P + T N + F P + F N R e c a l l = T P T P + F N F m e a s u r e = ( 1 + β ) 2 * r e c a l l * p r e c i s i o n β 2 * r e c a l l * p r e c i s i o n
The accuracy is calculated as the ratio of the number of correct classifications of the algorithm to the total number of samples. The higher the Accuracy is, the better the performance of the prediction algorithm. F1 is the harmonic mean of precision and recall, mainly focusing on the minority class. The Recall indicates the number of positive samples correctly predicted by the algorithm among the original samples present in the dataset samples.

3.1. Water Inrush Dataset Experiment

All water inrush data used in the experiments in this section were collected from the Internet of Things Research Center of the China University of Mining and Technology, who measured water inrush data on working faces in typical mining areas in North China. A total of 80 sets of collected data were used in the experiments. Owing to the varying dimensions and magnitudes of water inrush data features, the data characteristics will have varying influences on the forecast of water inrush, some of which will outweigh their appropriate weight, if they are employed directly in the prediction. Therefore, every water inrush instance datum was first standardized to the interval [0, 1] in order to remove its influence. The standardized formula is
x n o r m = x x min x max x min
The features of the collected water inrush data are discrete, and the correlation between the features is difficult to extract. The occurrence of water inrush accidents is the result of a variety of natural and mining conditions.

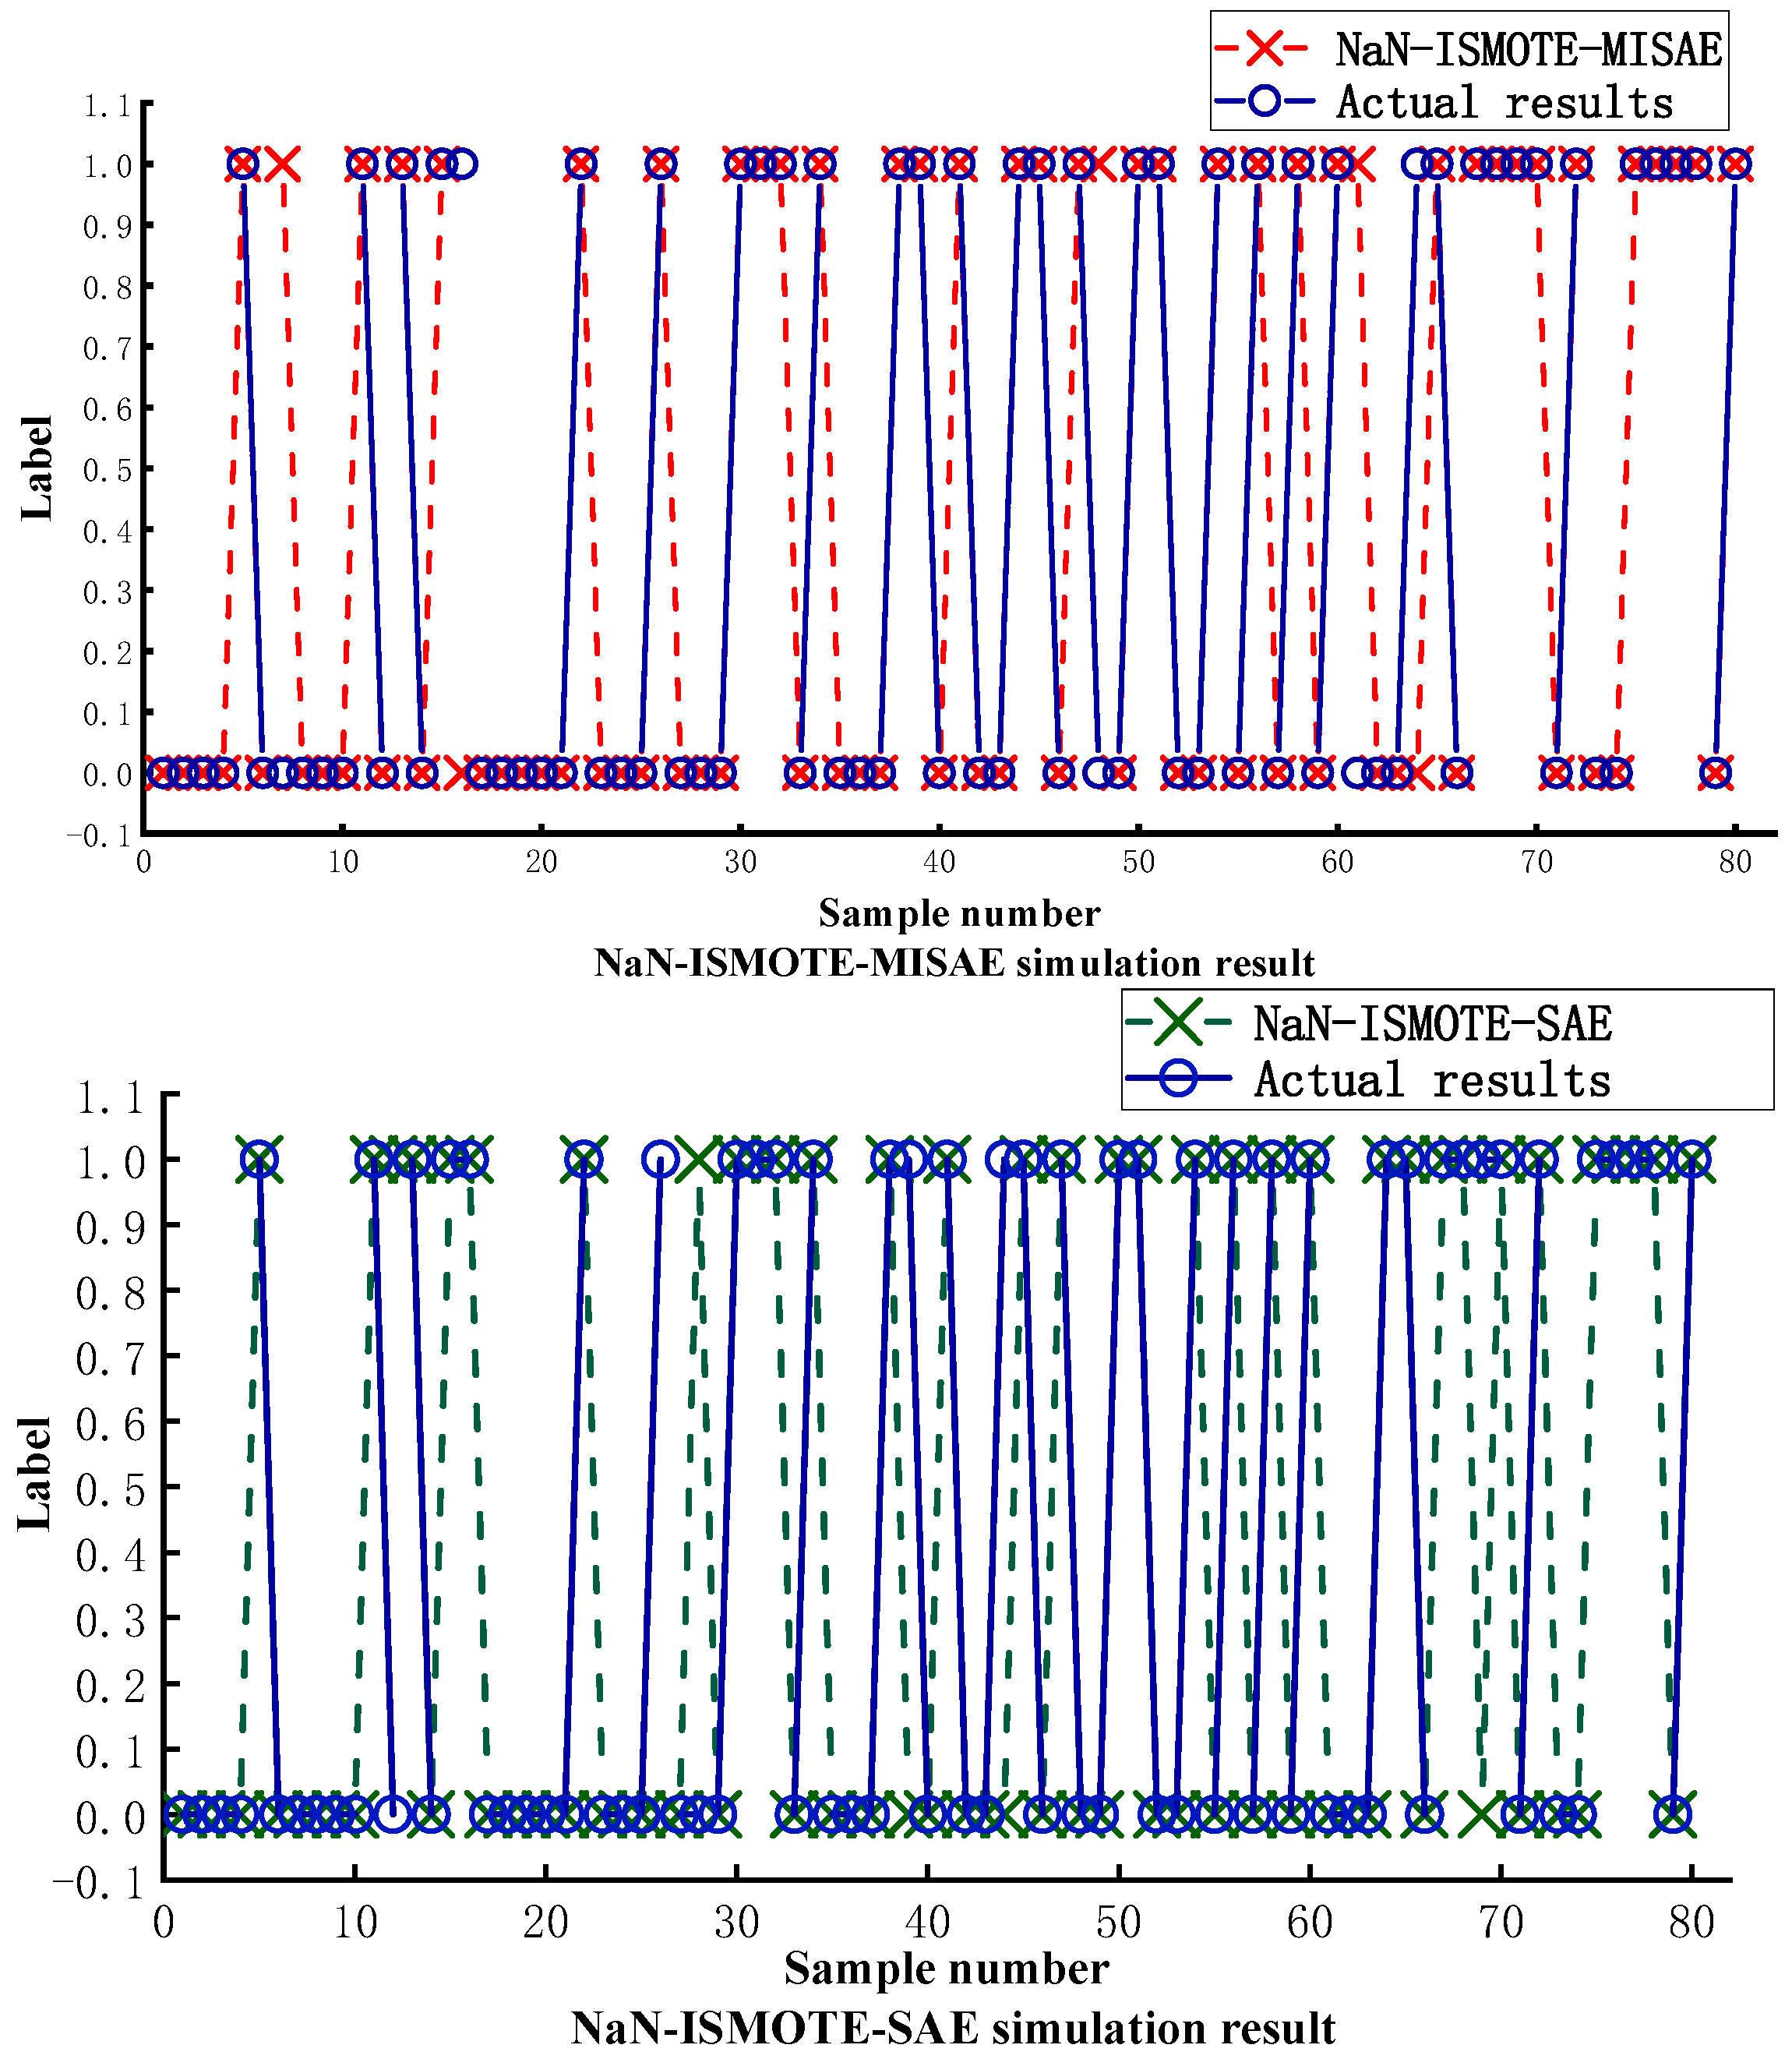
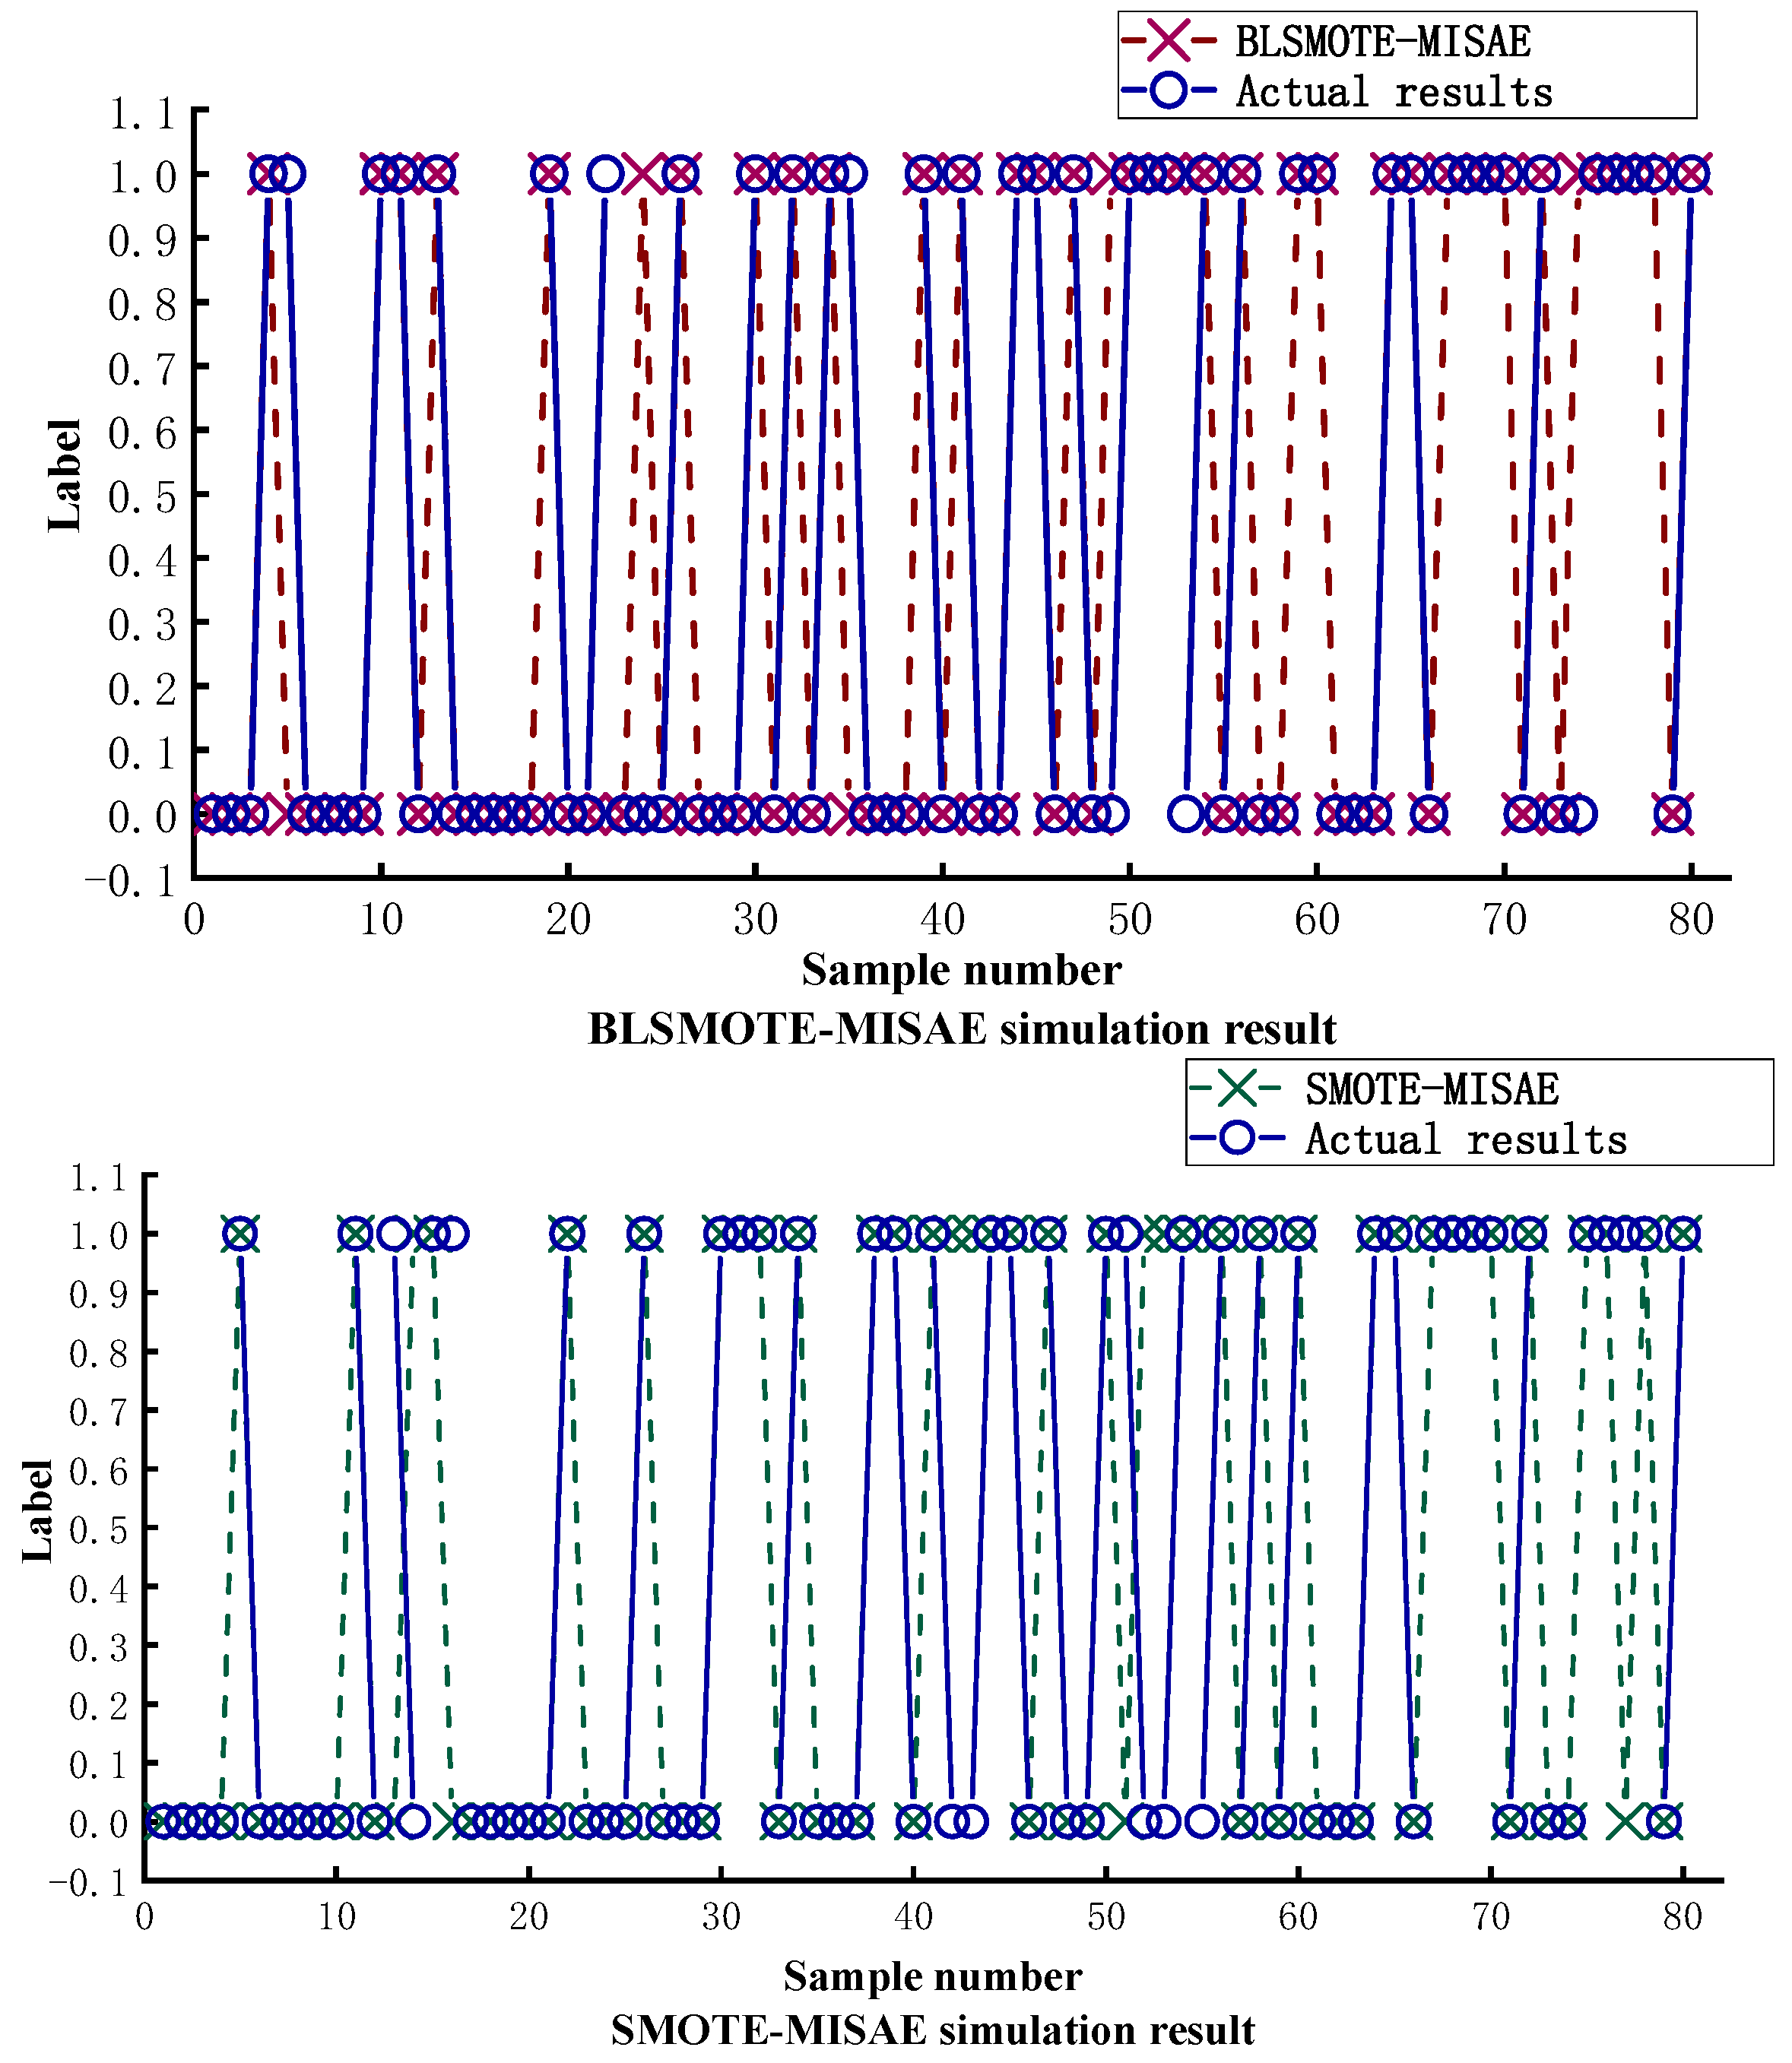
3.2. NaN-ISMOTE-MISAE Algorithm Ablation Experiment

The NaN-ISMOTE-MISAE algorithm proposed in this article first uses natural neighbors to remove noise points and outliers and then uses different interpolation methods for data expansion according to the different areas where the minority class samples are located. Second, the prediction model uses the MISAE algorithm to extract highly relevant water inrush features. Therefore, two SMOTE prediction models without natural neighbor data preprocessing and refined sampling methods were used to verify the effectiveness of the proposed oversampling method. The prediction results of the SAE and MISAE were compared using the same dataset to verify the effectiveness of the proposed water inrush feature extraction method. Figure 7 and Table 3 shows the prediction curves of the different models.
The comparison of Figure 7 and Table 3 with the comparison algorithm demonstrates that the best results were obtained with the same dataset and operating environment in terms of prediction accuracy, recall rate, and F1 Score. This study compared the prediction accuracy while calculating the recall rate and F1 Score due to the small sample size of the water inrush samples in the dataset. The algorithm suggested in this research has the highest recall rate and F1 score, as the table illustrates. It demonstrates that the NaN-ISMOTE-MISAE can successfully recognize small samples of water inrush data and has strong sensitivity.
It is evident from a comparison of the ISMOTE-SAE and ISMOTE-MISAE algorithm results in the table that the SAE algorithm performs poorly in terms of sensitivity and small sample classification. This is because the SAE algorithm treats input data equally when extracting features. However, the same weight will extract variable information with less correlation since different factors contribute to the occurrence of water inrush accidents in varying degrees, which will reduce the forecast accuracy. The MISAE algorithm, on the other hand, increases the accuracy of feature extraction by keeping the neurons that are favorable to the expression of water inburst characteristics and resets the weight of the less relevant feature neurons to 0. For small-sample water inburst data, ISMOTE-MISAE performs better in terms of accuracy and prediction outcomes when compared to the ISMOTE-SAE algorithm under the same data expansion settings.
The model proposed in this paper performs better under the same prediction algorithm when compared to the prediction results of ISMOTE-MISAE, SMOTE-MISAE, and BLSMOTE-MISAE. This is because the natural neighbor technology is introduced to preprocess the dataset, remove noise points and outliers, and create a dataset with a regular distribution. The prediction model’s capacity for generalization is enhanced. In the safe sample zone and the edge sample, the ISMOTE algorithm uses distinct sampling techniques. When edge samples are oversampled, the likelihood of producing noise is effectively decreased by randomly interpolating the nearest natural intermediate points. The diversity of the synthetic dataset and the precision of the ensuing prediction algorithm can both be increased by using the spatial random interpolation approach in the safe sample area.
As illustrated in the accompanying figures and tables, the NaN-ISMOTE-MISAE framework incorporates an anomaly detection mechanism grounded in natural neighbor theory to systematically eliminate outliers. By leveraging natural neighbor-based class partitioning for minority samples, we propose two novel oversampling methods: feature-space stochastic interpolation and natural neighbor midpoint interpolation, which enhance synthetic sample diversity while preserving distributional equilibrium. Furthermore, mutual information criteria are introduced to evaluate variable importance within hidden layers, effectively reducing the influence of irrelevant features and improving predictive accuracy by 3.7 percentage points. In coal mine water inrush prediction scenarios, where missed detection may lead to catastrophic safety incidents and substantial economic losses, the NaN-ISMOTE-MISAE model demonstrates critical operational advantages. Its high recall rate (0.9524) significantly enhances prediction system reliability, confirming its capability to extract discriminative features strongly associated with inrush precursors.

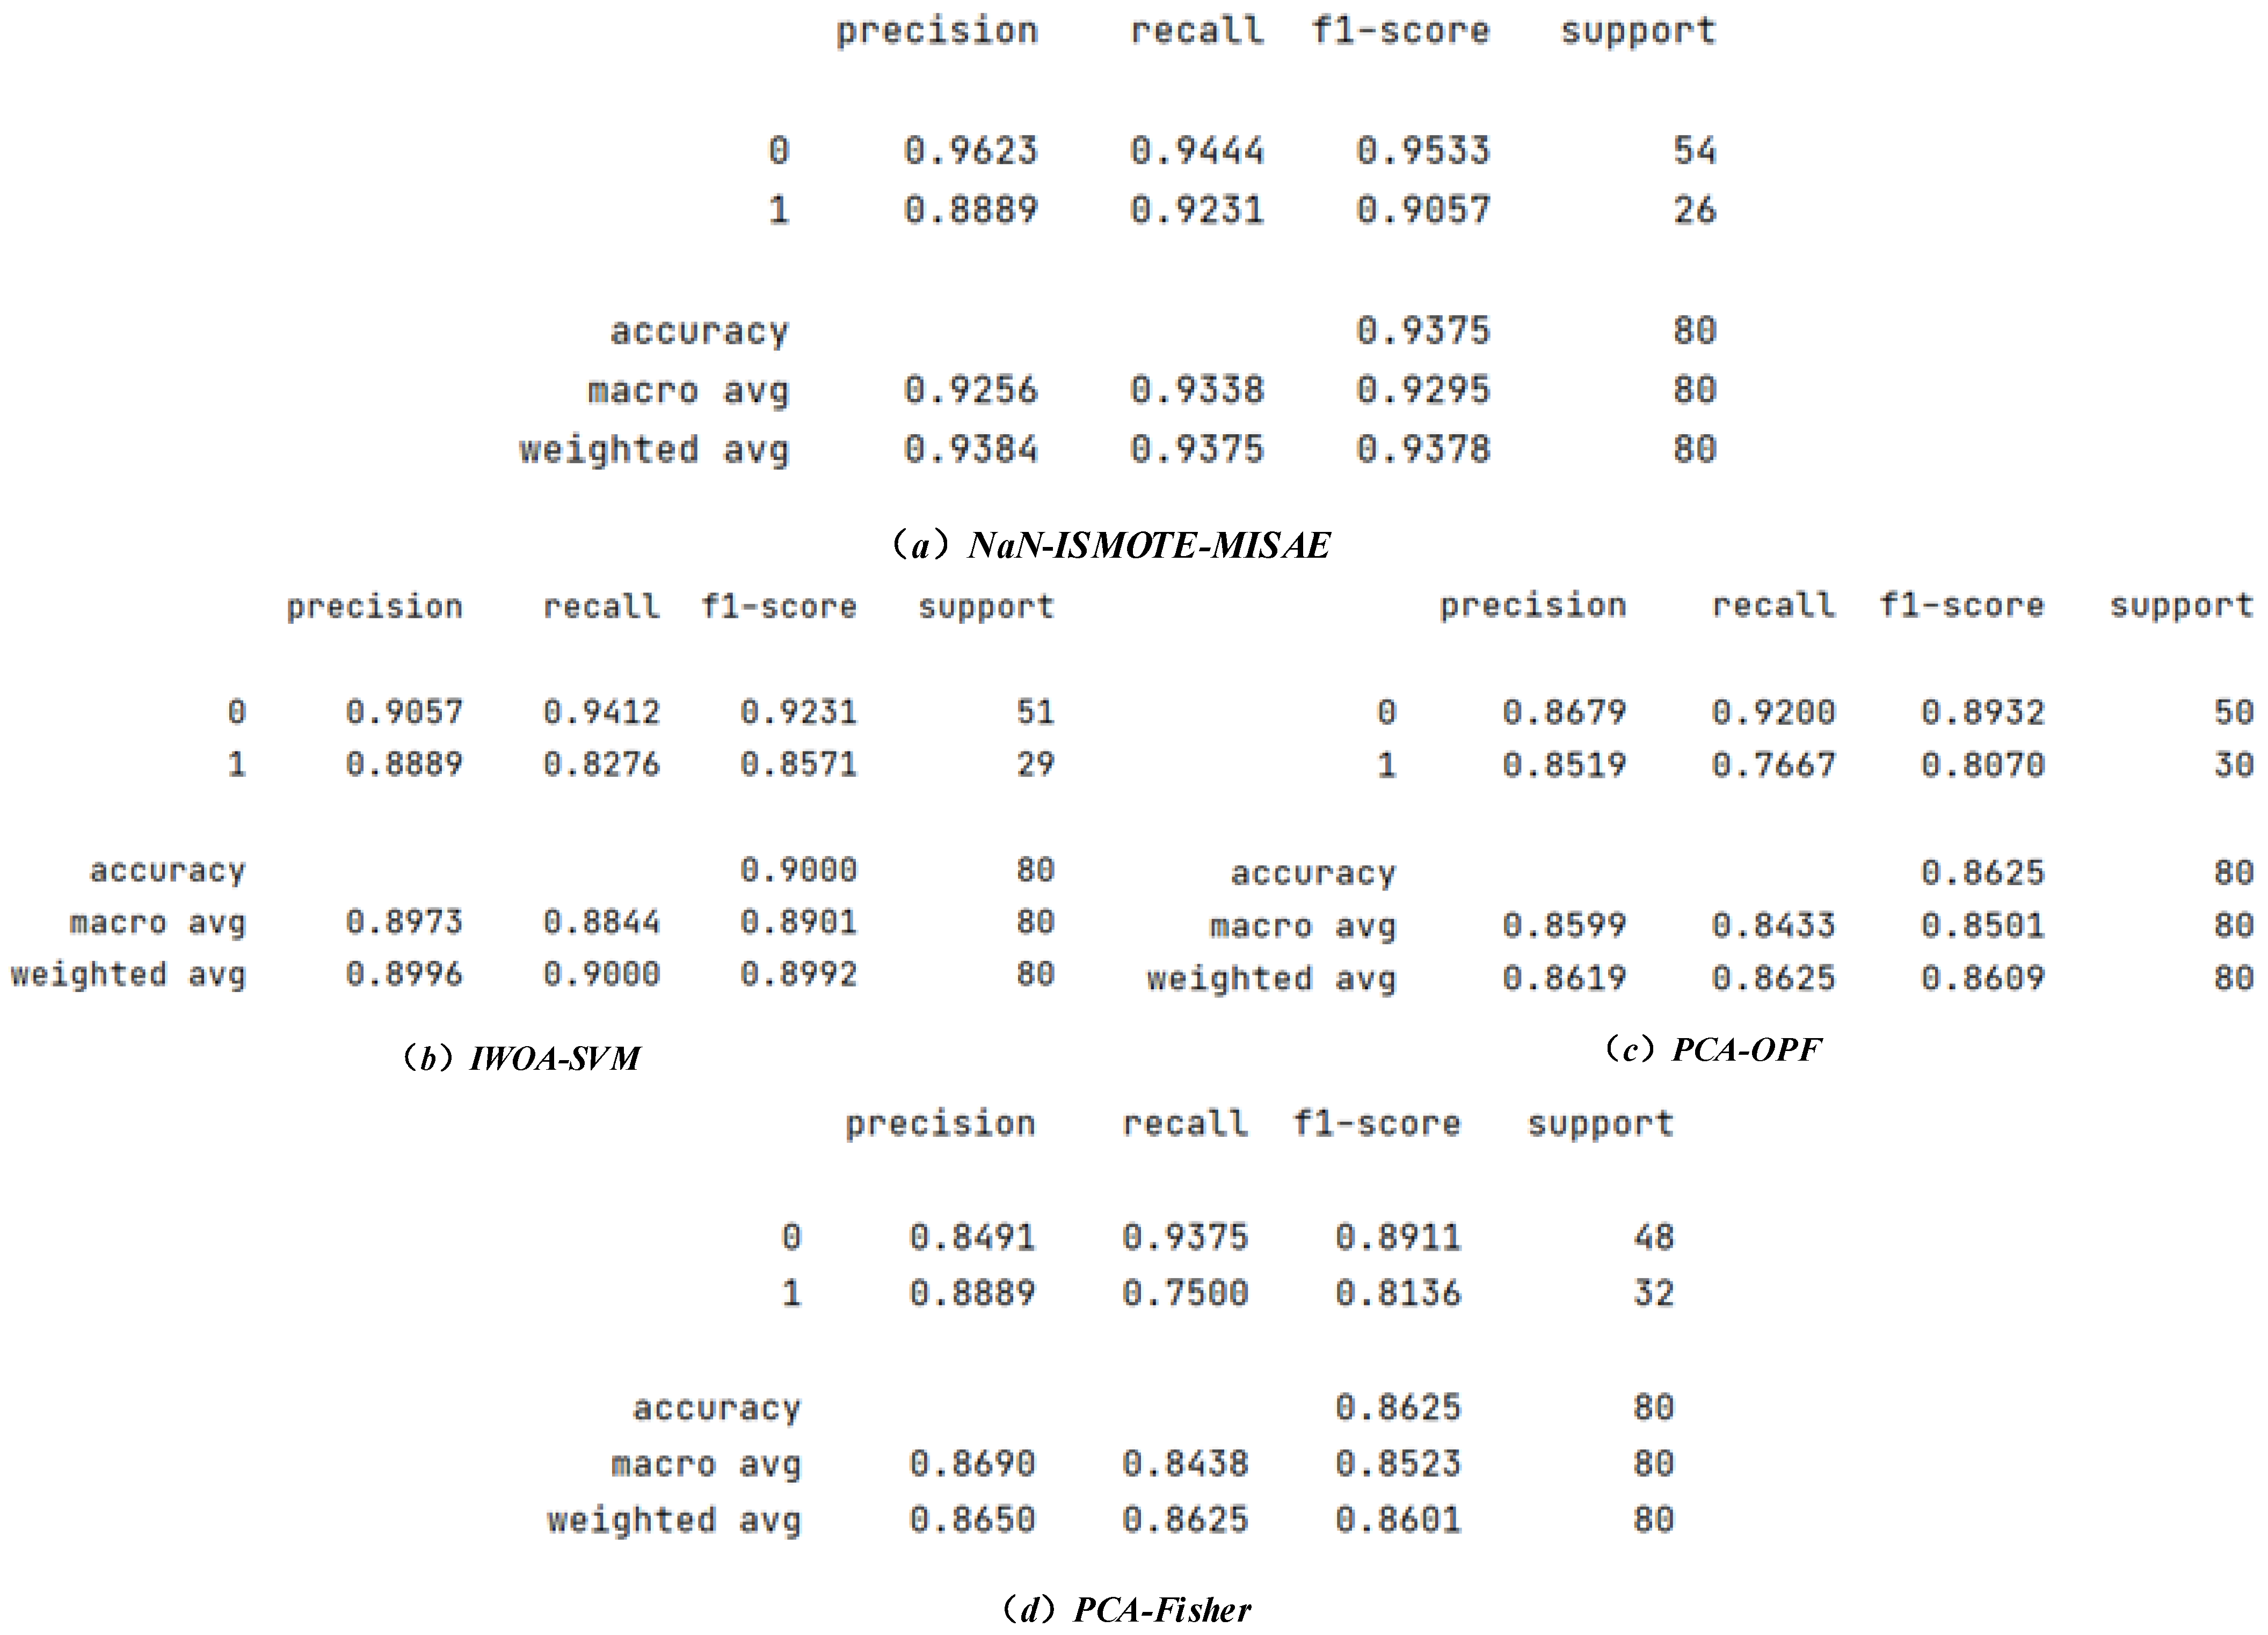
3.3. Comparison Between the NaN-ISMOTE-MISAE Algorithm and Water Inrush Prediction Algorithms in Recent Years

The comparison results between the prediction algorithm proposed in this paper and the coal mine floor water inrush prediction algorithm proposed in recent years are shown in Figure 8 and Table 4. The NaN-ISMOTE expanded water inrush dataset was used. Compared with traditional algorithms such as PCA, the MISAE algorithm causes less damage to the secondary features in the water inrush data and can more completely preserve the feature vector of the sample. Compared with the IWOA-SVM, the shallow network has difficulty mining the complex mapping relationship between water inrush characteristics and accident occurrence. Therefore, the MISAE is needed to extract hidden features from water inrush data and reduce the impact of irrelevant feature information on model expression. Moreover, compared with other classification algorithms such as the Fisher and OPF algorithms, the MISAE has greater advantages in the field of water inrush prediction and is highly suitable for analyzing and predicting nonlinear and complex floor water inrush data. NaN-ISMOTE-MISAE improving predictive accuracy by 7.5 percentage points. The high recall rate of the NaN-ISMOTE-MISAE model (0.9524) significantly improves the reliability of the prediction system, provides advance warning for mine safety mining, and plays an important role in ensuring coal mine safety production.

4. Conclusions

To solve the problems of small numbers of floor water inrush data samples and difficulty in extracting water inrush features, the NaN-ISMOTE and MISAE methods were introduced to improve the prediction model. The NaN-ISMOTE algorithm expands the water inrush dataset while addressing the issue of noise and preventing changes to the dataset’s distribution pattern. This paper introduces the natural neighbor theory to reduce the risk of overfitting of the prediction model by removing outliers and noise samples from the water inrush dataset. The water inrush data samples are divided into center minority class samples and borderline minority class samples, and two targeted oversampling methods are proposed for oversampling. These two methods improve the diversity of the synthetic data and enhance the coverage of the minority class data area by synthetic samples while retaining the distribution pattern of the dataset and reducing the impact of borderline samples on oversampling. The MISAE is used to extract water inrush accident features, and mutual information is used to evaluate the importance of neurons in the hidden layer of the model for predicting the target. Suppressing the interference of factors that are less relevant to the occurrence of water inrush accidents in the model improves the feature extraction performance of the classifier and increases the model prediction accuracy. The experimental results show that the model proposed in this paper can more accurately analyze the characteristics of water inrush accident, improve the accuracy of water inrush accident prediction, and promote the application of deep learning and data extension in coal mine water inrush prediction. The proposed ISMOTE method also has good performance in public datasets.
Building upon foundational research in the field, this study incorporates machine learning theory and data augmentation techniques to conduct systematic investigations, yielding promising preliminary results. Subsequent research work can be conducted on the following aspects:
  • The pseudo-label approach still has the flaw of having a fuzzy boundary between positive and negative data, as well as noise in the expansion of water-inrushing data. While this problem is somewhat resolved by the improved approach shown in this paper, it remains unresolved. In the subsequent research, the field of floor water inrush may be subjected to novel data-generating methods, such as GAN networks, and the data may undergo preprocessing and subsequent prediction.
  • The majority of current data-based modeling techniques focus on static data and ignore the water inrush accident’s dynamic process. To improve the integrity and diversity of the floor water inrush dataset, future work must take into account the time dynamics of the data and collaborate with coal mines to collect time period series data of mine water inrush control factors during data collection.
  • The control factors of water inrush in mine floor will change with the process of coal mining. The existing algorithms mainly focus on the study of constant weight statistics, and the model parameters can be updated in real time in future work through the variable weight mechanism.

Author Contributions

All authors contributed to the study conception and design. Material preparation, data collection and analysis were performed by S.T. and Y.Z. The manuscript was written by Y.Z. and all authors commented on previous versions of the manuscript. All authors have read and agreed to the published version of the manuscript.

Funding

The funding was provided by the Key Technologies Research and Development Program (Grant No. 2017YFF0205500).

Data Availability Statement

The raw data supporting the conclusions of this article will be made available by the authors on request.

Acknowledgments

The authors sincerely acknowledge the support and contributions from the China University of Mining and Technology (CUMT) in the completion of this research.

Conflicts of Interest

The authors declare no conflicts of interest.

References

  1. Shi, L.Q.; Han, J. Floor Water Inrush Mechanism and Prediction; China University of Mining and Technology Press: Xuzhou, China, 2004. [Google Scholar]
  2. Du, C.L.; Zhang, X.Y.; Li, F. Application of improved CART algorithm in prediction of water inrush from coal seam floor. Ind. Mine Autom. 2014, 40, 52–56. [Google Scholar] [CrossRef]
  3. Liu, W.T.; Liao, S.H.; Liu, S.L.; Liu, H. Principal component logistic regression analysis in application of water outbursts from coal seam floor. J. Liaoning Tech. Univ. 2015, 34, 905–909. [Google Scholar]
  4. Liu, Z.; Jin, D.; Liu, Q. Prediction of water inrush from seam floor based on binomial logistic regression model and CART tree. Coal Geol. Explor. 2009, 37, 56–61. [Google Scholar]
  5. Liu, Z.; Jin, D.; Liu, Q. Prediction of water inrush through coal floors based on data mining classification technique. Procedia Earth Planet. Sci. 2011, 3, 166–174. [Google Scholar] [CrossRef]
  6. Shi, L.; Gao, W.; Han, J.; Tan, X. A nonlinear risk evaluation method for water inrush through the seam floor. Mine Water Environ. 2017, 36, 597–605. [Google Scholar] [CrossRef]
  7. Cao, Q.K.; Zhao, F. Prediction of water inrush from coal floor based on genetic-support vector regression. J. Coal 2011, 36, 2097–2101. [Google Scholar]
  8. Yan, Z.G.; Bai, H.B.; Zhang, H.R. A novel SVM model for the analysis and prediction of water inrush from coal mine. China Saf. Sci. J. 2008, 18, 166–170. [Google Scholar] [CrossRef]
  9. Qiao, Y.F. Application Research of Genetic Algorithm and Artificial Neural Networks in the Prediction of Mine Water Gushing-out. Master’s Thesis, Xi’an University of Architecture and Technology, Xi’an, China, 2010. (In Chinese). [Google Scholar]
  10. Zhao, Z.; Hu, M. Multi-level forecasting model of coal mine water inrush based on self-adaptive evolutionary Extreme learning machine. Appl. Math. Inf. Sci. Lett. 2014, 2, 103–110. [Google Scholar] [CrossRef]
  11. Zhao, Z.; Li, P.; Xu, X. Forecasting model of coal mine water inrush based on extreme learning machine. Appl. Math. Inf. Sci. 2013, 7, 1243–1250. [Google Scholar] [CrossRef]
  12. Shi, L. Analysis of water inrush coefficient and its applicability. J. Shandong Univ. Sci. Technol. 2012, 31, 6–9. [Google Scholar] [CrossRef]
  13. Zhao, D.; Wu, Q.; Cui, F.; Xu, H.; Zeng, Y.; Cao, Y.; Du, Y. Using random forest for the risk assessment of coal-floor water inrush in Panjiayao Coal Mine, northern China. Hydrogeol. J. 2018, 26, 2327–2340. [Google Scholar] [CrossRef]
  14. Chawla, N.V.; Bowyer, K.W.; Hall, L.O.; Kegelmeyer, W.P. SMOTE: Synthetic minority over-sampling technique. J. Artif. Intell. Res. 2002, 16, 321–357. [Google Scholar] [CrossRef]
  15. Li, J.; Zhu, Q.; Wu, Q.; Fan, Z. A novel oversampling technique for class-imbalanced learning based on SMOTE and natural neighbors. Inf. Sci. 2021, 565, 438–455. [Google Scholar] [CrossRef]
  16. Leng, Q.; Guo, J.; Jiao, E.; Meng, X.; Wang, C. NanBDOS: Adaptive and parameter-free borderline oversampling via natural neighbor search for class-imbalance learning. Knowl.-Based Syst. 2023, 274, 110665. [Google Scholar] [CrossRef]
  17. Li, J.; Zhu, Q.; Wu, Q.; Zhang, Z.; Gong, Y.; He, Z.; Zhu, F. SMOTE-NaN-DE: Addressing the noisy and borderline examples problem in imbalanced classification by natural neighbors and differential evolution. Knowl.-Based Syst. 2021, 223, 107056. [Google Scholar] [CrossRef]
  18. Xu, Z.; Shen, D.; Kou, Y.; Nie, T. A synthetic minority oversampling technique based on Gaussian mixture model filtering for imbalanced data classification. IEEE Trans. Neural Netw. Learn. Syst. 2022, 35, 3740–3753. [Google Scholar] [CrossRef]
  19. Douzas, G.; Bacao, F. Geometric smote a geometrically enhanced drop-in replacement for smote. Inf. Sci. 2019, 501, 118–135. [Google Scholar] [CrossRef]
  20. Susan, S.; Kumar, A. Ssomaj-smote-ssomin:Three-step intelligent pruning of majority and minority samples for learning from imbalanced datasets. Appl. Soft Comput. 2019, 78, 141–149. [Google Scholar] [CrossRef]
  21. Huang, H.; Wang, J.M. Research on water inrush from the blind fault of coal floor by physical experiment. J. North China Inst. Sci. Technol. 2015, 12, 11–16. [Google Scholar]
  22. Liu, D.; Zhong, S.; Lin, L.; Zhao, M.; Fu, X.; Liu, X. Deep attention SMOTE: Data augmentation with a learnable interpolation factor for imbalanced anomaly detection of gas turbines. Comput. Ind. 2023, 151, 103972. [Google Scholar] [CrossRef]
  23. Soltanzadeh, P.; Hashemzadeh, M. RCSMOTE: Range-controlled synthetic minority over-sampling technique for handling the class imbalance problem. Inf. Sci. 2021, 542, 92–111. [Google Scholar] [CrossRef]
  24. Wahid, A.; Annavarapu, C.S.R. NaNOD: A natural neighbour-based outlier detection algorithm. Neural Comput. Appl. 2020, 33, 2107–2123. [Google Scholar] [CrossRef]
  25. Elreedy, D.; Atiya, A.F. A comprehensive analysis of synthetic minority oversampling technique (SMOTE) for handling class imbalance. Inf. Sci. 2019, 505, 32–64. [Google Scholar] [CrossRef]
  26. Pan, T.; Zhao, J.; Wu, W.; Yang, J. Learning imbalanced datasets based on SMOTE and Gaussian distribution. Inf. Sci. 2020, 512, 1214–1233. [Google Scholar] [CrossRef]
  27. Chen, L.; Yuan, M.; Xiang, W. Application of Pca-Fisher Discriminant Model in Prediction of Water Inrush from Coal Seam Floor. J. Math. Pract. Theory 2021, 51, 9. [Google Scholar]
  28. Jiang, Z.H.; Yuan, Z.G.; Xie, D.H. Prediction of Coal Seam Floor Water Inrush Based on PCA-OPF Model. Miner. Eng. Res. 2021, 36, 6. [Google Scholar]
  29. Qiu, X.G.; Li, J. Prediction model of water inrush in coal mine based on IWOA-SVM. Ind. Min. Autom. 2022, 48, 7. [Google Scholar]
Figure 1. The overview of the proposed model.
Applsci 15 04229 g001
Figure 2. Noise points and outliers in the dataset.
Applsci 15 04229 g002
Figure 3. Borderline sample oversampling method.
Applsci 15 04229 g003
Figure 4. Center sample space oversampling method.
Applsci 15 04229 g004
Figure 5. Results of ISMOTE algorithm under complex data distribution conditions.
Applsci 15 04229 g005
Figure 6. Sparse autoencoder structure based on mutual information.
Applsci 15 04229 g006
Figure 7. Ablation experiment results.
Applsci 15 04229 g007aApplsci 15 04229 g007b
Figure 8. Simulation comparison between NaN-ISMOTE-MISAE and water inrush prediction algorithms.
Applsci 15 04229 g008
Table 1. Main influencing factors of coal seam water inrush.
First-Level IndicatorsSecondary-Level Indicators
Aquifer conditionsAquifer thickness
Aquifer water pressure
Working surface distance
Water barrier conditionsMuddy rock thickness
Sandy rock thickness
Limestone section thickness
Coal seam conditionsCoal seam thickness
Coal seam dip
Construction conditionsFault drop
Mining conditionsMining area
Strike length
Mining height
Table 2. Comparisons of G-mean among improved SMOTE and other oversampling methods.
ISMOTESMOTEB-SMOTEADASYN
Ar10.8917 ± 0.0150.8153 ± 0.01410.8424 ± 0.0110.8601 ± 0.009
Ar50.8818 ± 0.0160.8251 ± 0.0050.8478 ± 0.0750.8798 ± 0.012
Segment10.905 ± 0.0040.895 ± 0.0110.835 ± 0.0300.870 ± 0.027
Ecoli30.895 ± 0.0030.8172 ± 0.0440.8413 ± 0.0040.8617 ± 0.023
Ecoli40.892 ± 0.0170.913 ± 0.0010.906 ± 0.0030.891 ± 0.005
Year1-2-8-9v70.9127 ± 0.0070.8687 ± 0.00150.8814 ± 0.00180.8958 ± 0.005
Bank0.939 ± 0.0210.8975 ± 0.0140.906 ± 0.0080.9204 ± 0.006
Abalone5-190.9482 ± 0.020.8757 ± 0.0170.909 ± 0.0220.9226 ± 0.008
Glass10.8531 ± 0.0060.7226 ± 0.0090.791 ± 0.0330.837 ± 0.012
Abalone190.9027 ± 0.0020.8702 ± 0.0170.873 ± 0.0130.8937 ± 0.002
Table 3. Ablation experiment results.
NaN-ISMOTE-MISAENaN-ISMOTE-SAEBLSMOTE-MISAESMOTE-MISAE
Accuracy0.93750.91250.90.8750
Recall0.95240.92590.92450.9057
F1 Score0.93620.93460.92450.9057
Table 4. The simulation results.
NaN-ISMOTE-MISAEIWOA-SVMPCA-OPFPCA-Fisher
Accuracy0.93750.90000.86250.8625
Recall0.94440.94120.92000.9375
F1 Score0.95330.92310.89320.8911
Disclaimer/Publisher’s Note: The statements, opinions and data contained in all publications are solely those of the individual author(s) and contributor(s) and not of MDPI and/or the editor(s). MDPI and/or the editor(s) disclaim responsibility for any injury to people or property resulting from any ideas, methods, instructions or products referred to in the content.

