Abstract
Colorectal cancer is one of the most commonly diagnosed cancers in developed countries. Although the gold-standard diagnosis technique is the histological analysis of colon biopsies, it is important to investigate different diagnostic tools because the microscope examination of stained tissues provides indications partially depending on the experience of the pathologist. This study reports a Raman-spectroscopy-based analysis of healthy and cancerous colon cells to detect biochemical differences at the subcellular level and discriminate the former from the latter. FHC and CaCo-2 cell lines were used to model healthy and cancerous cells, respectively. The comparison of the Raman spectra measured inside subcellular volumes including the nucleus (nucleus spectra) and excluding it (cytoplasm spectra), as well as principal component analysis and partial least squares analysis of these spectra, suggest that the differences between the spectra of healthy and cancerous cells are very small, and they mainly involve the different relative content of lipids and nucleic acid components. The relative intensity of lipid peaks is higher in the Raman spectra of healthy samples, while nucleic acid peaks show higher relative intensity in the spectra of cancer cells. Linear discriminant analysis of a few principal components and partial least squares components was used to estimate the classification accuracy of a set of Raman spectra measured inside nucleus and cytoplasm. Both methods are able to classify unknown cells with excellent accuracy (100% and 96%, respectively). The findings of this study confirm the general applicability of subcellular Raman analysis in clinical practice for diagnosis of cytological samples.
1. Introduction
Colorectal cancer originates in the tissues of the colon or rectum. Like all cancers, it is a consequence of the uncontrolled growth of cells, in this case the epithelial cells of the mucosa lining the intestine. It is the third most common cancer worldwide. In 2022, more than 1.9 million cases were diagnosed [1]. The first step towards a reliable diagnosis is to collect information about the patient’s medical history, followed by a complete examination and several blood and urine chemistry tests. However, additional instrumental examinations are necessary to complete the diagnosis, such as colonoscopy, which is based on the collection of a piece of tissue (biopsy) and subsequent histological analysis, after a proper staining procedure. Histologic analysis is a diagnostic procedure that involves microscope observation of tissue samples and specifically the cells that make up the tissue. This examination is carried out by a pathologist (a physician who specializes in the interpretation of cellular and tissue changes), who provides detailed information on the sample structure, composition and any abnormalities in order to obtain an accurate diagnosis. Training and skills may vary among clinicians, meaning that differences in expertise among pathologists can affect the accuracy of cancer diagnosis [2].
Therefore, the interest of researchers has recently focused on cancer diagnosis by means of analytical chemical techniques; in fact, biochemical alterations characterize the evolution of a cell from a normal to a cancerous state [3,4,5]. Besides analytical techniques based on the detection of biochemical markers [6,7], it has been shown that Raman spectroscopy can be considered as a possible diagnostic technique providing information about differences in the relative content of biochemical components of healthy and cancerous cellular samples [8,9,10]. However, the adoption of Raman spectroscopy in the clinical diagnostics has not been fully realized yet, because of technical difficulties (relatively low signal-to-noise ratio, excitation power cannot be very high because of possible thermal destruction of the sample, difficulty of measurements for paraffin-embedded samples because of disturbance by paraffin, etc.) and also because Raman spectra of healthy and cancerous cells are often only slightly different and almost overlapping. In this latter case, spectral differences between cell samples of different types can be highlighted by means of suitable multivariate statistical methods [11,12,13]. These are mathematical methods that address and solve the problem of classifying unknown spectra in two successive stages. During the first stage, spectra belonging to known classes are used to develop a classification method based on the spectral differences. In the second stage, such a method that has been built and optimized is used to classify unknown spectra.
We have previously used logistic regression, support vector machines, k nearest neighbours and neural networks to successfully classify Raman [14] and FTIR [15] spectra of healthy and cancer colon cells. However, the achievement of reliable results by means of such methods depends on optimization of the values of some parameters: consequently, high skills of the analyst are required. Moreover, the classification by means of the above methods relies on the intensity values of several spectral peaks, which should be properly selected. Therefore, it is preferable to use simple algorithms in order to minimize the analyst skills and choices. In recent years, linear discriminant analysis of principal components (PCA-LDA) and least squares discriminant analysis (PLS-DA) have been used to classify unknown spectra with good accuracy [16,17]. Such techniques operate so that the selection of spectral features used for classification is made by the model itself, during the optimization procedure.
In this work, we investigated the classification of Raman spectra of healthy and cancerous colon cells using PCA-LDA and PLS-DA methods. This task was carried out firstly by optimizing the two models with a part of the whole dataset of measured spectra and then estimating the classification accuracy by using a remaining set of unknown spectra. The obtained results are promising for the clinical translation of Raman spectroscopy to cytopathology.
2. Materials and Methods
2.1. Cell Culture and Preparation
Foetal human colon (FHC) cells, purchased from ATCC (CRL-1831), have been used as a model of healthy colon cells. Indeed, FHC cells are derived from normal foetal colon tissue. They were grown in Dulbecco’s Modified Eagle’s medium (DMEM) F12, with the addition of 10 mM Hepes, 10 ng/mL cholera toxin, 5 μg/mL insulin, 5 μg/mL transferrin, 100 ng/mL hydrocortisone, 20 ng/mL EGF and foetal bovine serum at a final concentration of 10%.
Human colorectal adenocarcinoma (CaCo-2) cells, obtained from ATCC (Manassas, VA, USA), have been used as a model of cancerous colon cells, because they have been isolated by human colorectal adenocarcinoma epithelium. CaCo-2 cells were grown in DMEM, supplemented with 4 mmol/dm3 L-glutamine, 1% penicillin/streptomycin, 10% foetal bovine serum (FBS) and 1% non-essential amino acids (NEAA) at 37 °C and 5% CO2.
The cells were grown on a poly-lysine-coated glass coverslip, and they were fixed in 3.7% paraformaldehyde. Then, the cell samples were stored in phosphate-buffered saline (PBS) solution and rinsed in deionized water before Raman measurements.
2.2. Raman Spectroscopy
Raman measurements were carried out with a Raman microspectrometer (Labram by Horiba Italia S.r.l., Roma, Italy) in the range of 980–1800 cm−1. Before each spectrum acquisition, the single cell to be measured was visualized using a video camera in order to choose the cell region from which to collect the signal. In fact, for each cell, the signal was collected from two regions: one including the nucleus and the other excluding it (and including the cytoplasm). The measured spectra are referred to as nucleus spectra and cytoplasm spectra, respectively. The coverslips containing the cell samples were placed and maintained inverted on a well containing PBS during the Raman measurements. Each measurement was performed by focusing, through a 100× oil-immersion Olympus objective (Olympus Italia S.r.l., Segrate, Italy), a laser beam (514.5 nm line of an Ar-ion laser) with a power of 6 mW. About 50 randomly selected cells from each cell type were measured. The acquisition time was 10 s, and 3 acquisitions were averaged for each spectrum. The backscattered radiation from the sample was analysed by a diffraction grating with 600 grooves/mm, which was detected by a CCD detector. The spectral resolution was 5 cm−1/pixel. The background signal was collected within regions of the coverslip where no cells were located.
2.3. Spectral Processing and Data Analysis
Preprocessing of each spectrum was accomplished by 4 sequential steps. First of all, the background signal was subtracted from measured spectra. Then, a signal simulating fluorescence and stray light was subtracted using the adaptive algorithm of Spectragryph software (version 1.2.16) [18], with a coarseness value of 30. This algorithm is able to remove the broad, featureless spectral features underlying the Raman peaks while maintaining the effective peaks. Next, the spectra were area-normalized. Finally, each spectrum was smoothed with a Savitzky–Golay filter with interval size 5 and polynomial order 3 using the Spectragryph software [18].
After the preprocessing, the two spectra datasets were independently split to obtain a calibration set (50% of the spectra of both healthy and cancerous cells) and a test set (the remaining cells). This separation was performed to estimate the classification performance of the investigated methods by considering only the test set. The spectra in the calibration group were randomly selected by a random number generator.
Principal component analysis (PCA) of the calibration set spectra was carried out to investigate (i) the possibility of discriminating the spectra of healthy cells from those of cancerous cells and (ii) the spectral variables mainly involved in such a discrimination. A full cross-validation was used to validate the PCA results.
Next, the calibration set was used to develop and optimize classification models discriminating the spectra of the healthy and cancerous classes using PCA-LDA and PLS-DA techniques. The model optimization step, performed by a full cross-validation procedure, allows us to properly choose the number of components (as for PCA-LDA) and factors (as for PLS-DA) to be used in the classification of unknown spectra. In the end, spectra from the test set were used to estimate the classification accuracy of each of the two models. The PCA, PCA-LDA and PLS-DA techniques were performed with Unscrambler X CAMO software (version 10.4).
3. Results and Discussion
The mean and standard deviation spectra measured on the nucleus (a) and cytoplasm (b) region of healthy and cancer cells from the calibration set are reported in Figure 1. The spectral positions of the main Raman signals (labelled in Figure 1) correspond to vibrational modes detailed in Table 1, in agreement with the literature paper by Talari et al. [19]. The spectral positions labelled in Figure 1 were obtained by calculating the second derivative signal of the mean spectra and considering the negative minima of such spectra. It is clearly evident that the spectra of both cell types are quite similar, as well as being similar to previously reported Raman spectra of colon cells [20,21] and tissues [22].
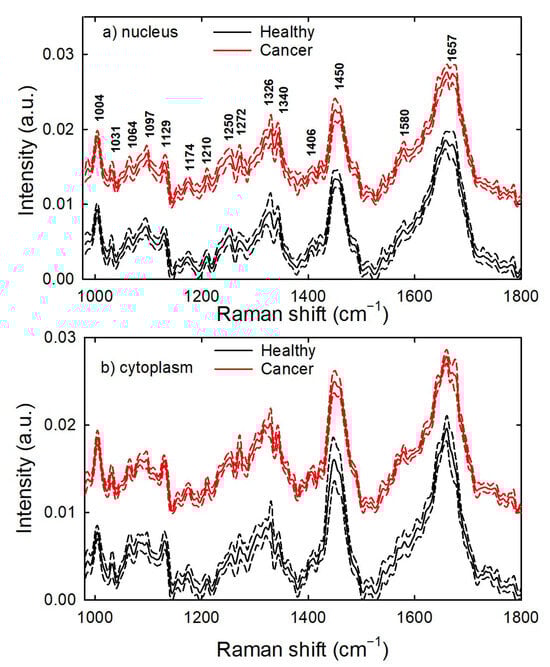
Figure 1.
Mean Raman spectra of normalized healthy and cancerous colon cells. The spectra were measured within a cell volume including the nucleus (a) and excluding it (b). Standard deviation spectra are shown as dashed lines. The spectra have been vertically shifted. The labels indicate the spectral position of the main Raman peaks.

Table 1.
Attribution of Raman peaks according to the literature results [19]. Abbreviations: p.—proteins; l.—lipids; n.a.—nucleic acids.
In particular, the spectra are dominated by the amide I peak at about 1660 cm−1 and the CH2 deformation peak at about 1450 cm−1. Both these main peaks are related to vibrational modes in protein components. The protein components also contribute to the Raman spectra with the amide III peaks at 1250 and 1272 cm−1, the phenylalanine ring breathing peak at 1004 cm−1, the C-N stretching peaks at 1088 and 1129 cm−1, and aromatic ring vibrations of several amino acids at 1031, 1174 and 1210 cm−1. The Raman peaks related to nucleic acid components (mainly visible in the nucleus core spectra) are located at 1097 cm−1 (PO2 phosphodioxy bond), 1326 and 1340 cm−1 (CH3/CH2 wagging mode in the bases of DNA and ring mode of DNA/RNA bases, respectively), and 1580 cm−1 (vibrational ring breathing mode of adenine and guanine). One well-resolved Raman peak corresponding to the lipid vibrational mode is found at 1064 cm−1, due to the C-C stretching mode. However, other lipid peaks overlap with protein peaks at 1088, 1129 and 1450 cm−1, mainly in the cytoplasm spectra.
The Raman signal values of most peaks are not very different for the spectra of the two cell types: consequently, the intensity value of a specific Raman peak does not reliably allow the identification of which class it belongs to. Therefore, multivariate analysis techniques (in which many spectral intensity values are considered) may be useful to study the possibility of discriminating healthy cells from cancer cells according to the measured Raman spectra. A proper multivariate technique able to estimate the possibility to discriminate spectra from two different groups on the basis of their Raman intensity values is PCA. In fact, although PCA is not a classification technique, it is a reliable method to identify differences between spectral data. Therefore, we analysed data from the calibration set by PCA, using a full cross-validation method.
Figure 2a,b show the PCA score plot of PC2 vs. PC1 and PC3 vs. PC2, respectively, for the Raman spectra of the calibration set. The PC2 and PC3 score values discriminate the spectra of cancerous cells from those of healthy cells well, regardless of the cell region in which the spectra were measured. Indeed, Figure 2a points out that the healthy cells’ spectra have mainly negative PC2 score values, whereas the cancerous cells have positive values. The opposite occurs for the PC3 score values of the cytoplasm spectra (Figure 2b). In particular, 10 and 6 principal components are needed to include 68% of all the variance of the spectra in the nucleus and cytoplasm calibration sets, respectively.
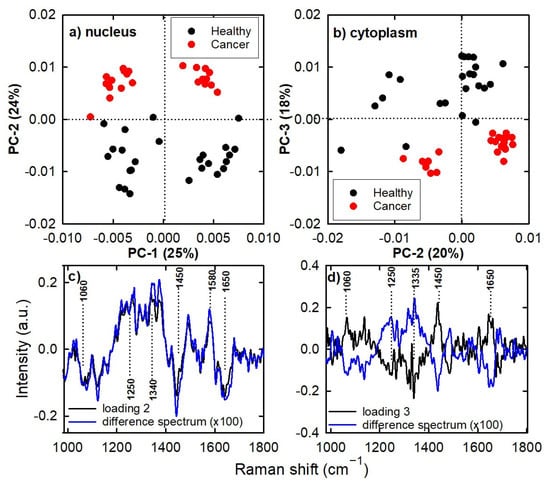
Figure 2.
PC2 vs. PC1 (a) and PC3 vs. PC2 (b) score plot for the Raman spectra of the calibration set. Difference in mean spectra (cancer–healthy signal) and loading 2 and loading 3 spectra are also reported for the Raman nucleus spectra (c) and Raman cytoplasm spectra (d).
A comparison of the loading plots of the PCs most involved in discrimination in Figure 2a,b with the difference in mean spectra could provide useful information regarding the Raman signals responsible for the spectral differences between the two classes of spectra. The good matching of loading plots and difference spectra is clearly visible in Figure 2c,d. In particular, the loading plot of nucleus spectra presents positive peaks at about 1250, 1340 and 1580 cm−1 and negative peaks at about 1060, 1450 and 1650 cm−1. In contrast, the loading plot of cytoplasm spectra has positive peaks at about 1060, 1440 and 1650 cm−1 and negative peaks at about 1250 and 1335 cm−1. The attribution of Raman signals at the above spectral positions (as shown in Table 1) confirms that the differences between healthy and cancer cells is mainly due to the relative contents of lipids and nucleic acids. Specifically, lipid content is higher in healthy cells (as specified by the negative peak at 1060 cm−1 in Figure 2c and positive peak at 1450 cm−1 in Figure 2d), while nucleic acid content is higher in cancer cells (as suggested by the positive peaks at 1340 and 1580 cm−1 in Figure 2c). Similar findings were also reported by us [14] and other authors by means of Raman [22,23] and FTIR [24] measurements of colon cells and tissue. Instead, contradictory results are obtained about the relative protein content; indeed, each loading plot shows protein-related signals of opposite sign (at 1250, 1450 and 1650 cm−1 in Figure 2c and at 1250, 1335, 1650 cm−1 in Figure 2d). Such a result is in disagreement with that reported by other authors, who measured more intense protein Raman peaks in normal cells compared to cancerous ones [22,25]. The explanation for this disagreement could be due to the fact that each of the two cell lines is characterized by its own Raman spectrum with its own characteristic relative peak intensities. In particular, the relative intensities of protein peaks in the spectra of CaCo-2 cells are larger than the relative intensities of the corresponding peaks in FHC cells. They do not necessarily have to be different, because CaCo-2 cells do not correspond to FHC cells that have evolved into a cancerous state (and therefore the intensities of some protein Raman peaks should decrease). Despite this disagreement with the literature reports, it is important to remark that a change in the relative intensity of some Raman peaks (as occurs in the evolution of a cell from a healthy to a cancerous state) can be detected by Raman spectroscopy and PCA analysis. Therefore, PCA promotes the possibility of classification of spectra of unknown nature by means of proper multivariate techniques, based on the simultaneous use of whole Raman spectra (instead of single Raman peaks).
The obtained results suggest that a PCA-based classification model should be developed that allows unknown spectra to be assigned to the right class. The classification model that we used, known as PCA-LDA, firstly uses linear combinations of some PCA scores of the calibration set to build and optimize a model that maximizes the separability between classes. In this stage, the model works in a supervised way, that is, it is provided with the classes to which each Raman spectrum belongs. Then, the spectra of the test set are provided to the developed and optimized model, without specifying the class to which they belong, in order to evaluate the attribution that the model outputs.
Taking into account the PCA results, the scores of the first 10 PCs and 6 PCs of the Raman spectra from the calibration set were used as input parameters to develop an LDA model for the nucleus spectra and cytoplasm spectra, respectively. The constructed PCA-LDA model is shown by filled circles in Figure 3a,b for the nucleus spectra and cytoplasm spectra, respectively. Since the model is developed by assigning to each spectrum a discriminant score value for belonging to each of the two classes and each spectrum is assigned to the class for which this value is larger [26], it is evident in Figure 3 that each spectrum is correctly classified during the model building stage. Indeed, the discriminant score value is negative, and the closer it is to zero, the greater the value.
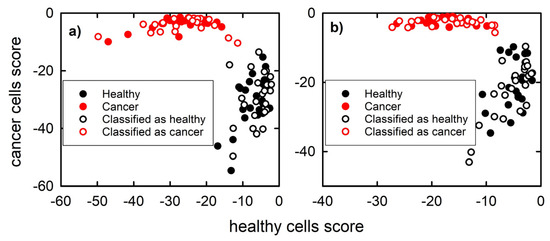
Figure 3.
Discrimination plot built from Raman nucleus spectra (a) and cytoplasm spectra (b) of the calibration set (filled circles) and projections of the spectra from the test set using the PCA-LDA model (hollow circles).
The test set spectra have been used to estimate the classification accuracy of the constructed PCA-LDA model. The projection of the test set spectra onto the PCA-LDA plot in Figure 3 (hollow circles) highlights that the discriminant score values of the test set spectra correctly classify them (this can be inferred from the higher discriminant score value for belonging to the right class). Therefore, an excellent (100%) classification accuracy has been obtained for both nucleus spectra and cytoplasm spectra by means of the constructed PCA-LDA model.
Recently, there has been widespread use of the PCA-LDA technique for classifying Raman spectra measured on healthy and colon cancer biological samples, although there is a lack of recent research on colon cells. In particular, colon cancer diagnostic investigations by means PCA-LDA of surface-enhanced Raman spectroscopy (SERS) of human serum reported accuracy values of 87.5% [27] and 84.1% [28]. Moreover, a PCA-LDA-based investigation of Raman spectra measured for human colorectal tissue samples stated sensitivity and specificity values of 82% and 51%, respectively [29]. The above works used a cross-validation strategy to estimate the classification parameters.
The difference between our investigation and that of the above authors consists in the validation stage of the constructed PCA-LDA model. In particular, we separated the model building stage (for which we used calibration set spectra) from the classification accuracy estimation stage (which we performed by using test set spectra). In fact, we have used a full cross-validation only during the model building stage, in order to optimize the number of PCs to be used. The estimation of classification accuracy using an independent set of spectra (test set) is considered to provide a more realistic estimate of the classification performance [26]. In addition, S. Peng et al. performed SERS measurements of human serum of healthy people and colon cancer patients: such spectra, combined with a PCA-LDA model, detected colon cancer with 90% accuracy [30]. However, they stated that the serum spectral dataset was used to train the classification algorithm, but they did not mention any validation stage of the constructed model.
Besides the PCA technique, the PLS method is also frequently used to reduce and model spectral data. It differs from PCA because both the spectral data and the related class membership (coded with numbers) are used together iteratively to build a model. This model is built by linking spectral datasets to numbers encoding class membership with the aim of optimizing separation between samples belonging to different classes. The PLS model transforms the variables of the original spectral dataset into a set of a few latent variables, called factors, which are computed maximizing the covariance between the original spectral dataset and the numbers encoding class membership [26,31].
Then, the spectra of the original dataset can be projected onto the subspace of the factors. This projection corresponds to a number predicting the class membership: for example, if +1 and −1 are the encoding values for two classes, a projection value above zero corresponds to membership attributed to the first class, whereas a projection value below zero corresponds to the attribution to the second class. PLS model is characterized by scores and loadings, similarly to PCA. PLS scores are the coordinates of the original spectra along the factors, and they are calculated in such a way that they capture the part of the structure in the original dataset which is most predictive for class membership. The PLS loadings specify how much each original variable contributes to a specific PLS factor. Similar to the PCA-LDA technique, after the PLS model has been built, it can be used with a linear discriminant classifier for classifying unknown spectra.
Therefore, we used the calibration set spectra to build a PLS model in order to classify Raman spectra of the test set. Figure 4a,b show the score plots of the nucleus spectra and cytoplasm spectra, respectively, after a full cross-validation procedure. It is clearly evident that in both cases the healthy and cancer spectra are discriminated according to factor 1 values, which are mainly positive for the spectra of healthy cells and negative for the spectra of cancer cells. The first four PLS factors included more than 50% of all the variance of the spectra from calibration set in both calibration sets. The loading 1 plots, shown in Figure 4c,d for the spectra measured inside the two cellular compartments, are quite similar to the difference spectrum (with positive and negative peaks exchanged). Therefore, the PLS model confirms the results obtained by PCA about the main cellular components responsible for the differentiation between healthy and cancer cells.
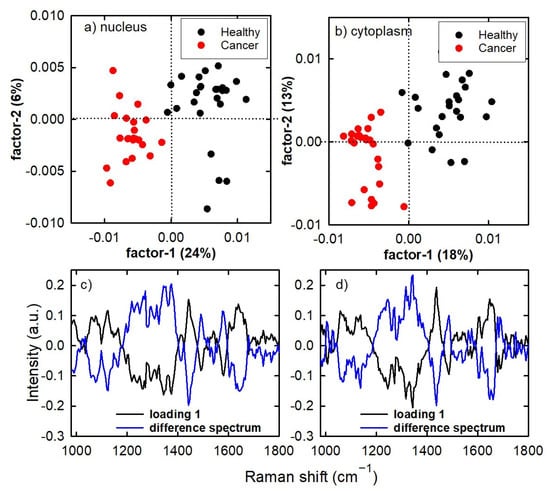
Figure 4.
PLS score plot for the Raman spectra of healthy cells and cancerous cells of the calibration set in the nucleus region (a) and cytoplasm region (b). The corresponding loading 1 and difference of mean spectra are displayed in (c,d).
Figure 5a,c show the predicted class for the calibration set spectra measured on nucleus and cytoplasm region, respectively. Membership of the healthy and cancer classes has been encoded with +1 and −1 values, respectively. It turns out that all spectra take values close to the reference values.
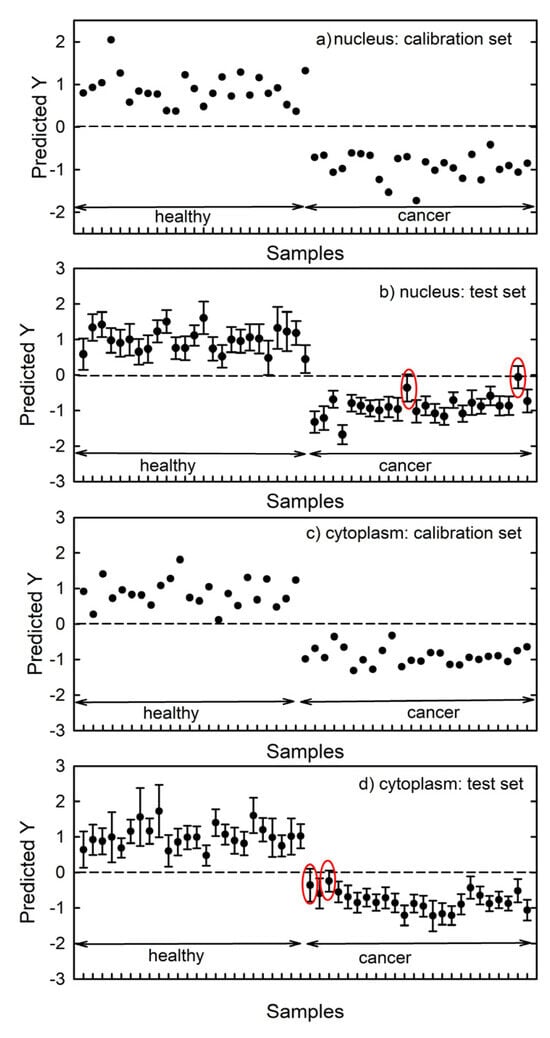
Figure 5.
Prediction values (1: healthy cells; −1: cancerous cells) for the Raman nucleus spectra of the calibration (a) and test (b) set. The prediction values for Raman cytoplasm spectra are displayed in (c,d). The red ellipses correspond to cases whose uncertainty bars cross zero. The root mean square error from cross-validation (RMSECV) is 0.35 and 0.34 for the nucleus- and cytoplasm spectra, respectively.
Figure 5b,d show the classification predictions of the PLS model estimated from the test set spectra of the nucleus and cytoplasm region, respectively. Most of the spectra in the test set are correctly encoded and assigned to the proper class. However, the uncertainty bars cross zero in two cases (circled by red ellipses) in both Figure 5b,d. Therefore, a prediction accuracy of the PLS-DA model of 96% for spectra of both nucleus and cytoplasm regions can be estimated.
M.S. Bergholt et al. reported that Raman spectra, performed in vivo for colon tissues, were able to separate cancerous tissue from normal tissues with 88.8% accuracy by PLS-DA analysis with leave-one-patient-out cross validation [32]. In a work apparently very similar to ours, W. Liu et al. performed Raman micro-spectroscopy of the nucleus and cytoplasm of human colon tissues for cancer diagnosis [33]. PLS-DA analysis, with leave-one-patient-out cross validation, yielded excellent results (98.4% sensitivity and 97.5% specificity) for spectra measured in the cytoplasm region, and good results (84.0% sensitivity and 87.0% specificity) were obtained for spectra measured in the nucleus region. Unlike the results reported in the above papers, our results (i) consider cytological samples, (ii) provided excellent values of classification parameters and (iii) these parameters were estimated by means of an independent test set of spectra. As for colon cells, Raman spectra of healthy and cancer cells were investigated by B. Brozek-Pluska [34]. She stated that PLS-DA yielded effective cell classification, with excellent sensitivity and specificity; nonetheless, the data were analysed by means of a cross-validation procedure, without creating an appropriate test set for estimating the classification performance.
Overall, excellent classification results of healthy and cancerous colon samples (mainly biological fluids and tissues) had already been obtained previously by other authors by both PCA-LDA and PLS-DA analysis and cross-validation procedures. Therefore, the novelty of our work concerns (i) the use of two independent spectral sets, i.e., a calibration set for building and optimizing the classification models and a test set for estimating classification accuracy, and (ii) the analysis of cytological samples with Raman spectroscopy. The obtained results suggest the translation of the Raman technique into clinical settings for cytological diagnosis.
4. Conclusions
In summary, we investigated the use of PCA-LDA and PLS-DA techniques to obtain reliable classification of Raman spectra measured inside healthy and cancerous colon cells. Specifically, for each cell type, we initially formed two spectral datasets, one comprising spectra measured in regions including the nucleus and another consisting of spectra measured in regions excluding the nucleus. Each of the two whole datasets was randomly split into two subsets: the calibration set, comprising data used to build and optimize classification models, and the test set, comprising data to be used to estimate classification accuracy. We found excellent classification accuracy for both classification techniques in both cell regions, with the PCA-LDA method performing slightly better compared to the PLS-DA method (100% accuracy for the former and 96% accuracy for the latter).
Although these findings are interesting in promoting translation of Raman spectroscopy and machine learning algorithms in cytology diagnostics, there are still some steps to be taken before assuming such translation possibility is valid. In fact, the main limitation of our findings concerns the use of cell lines instead of cytological specimens from patients. Indeed, cell lines may not fully represent the heterogeneity of the clinical cytological samples. Nonetheless, we believe that the quite large values of standard deviation spectra in Figure 1 could partially account for the heterogeneity of clinical samples and make the results reliable. Moreover, the achieved results should be confirmed for cell samples characterized by different degrees of pathology. However, we maintain that it is possible to apply the suggested approach to any other type of cancer cells. Therefore, this investigation can be considered as a preliminary step towards the adoption of Raman spectroscopy in clinical practice related to cytological diagnostics.
Author Contributions
Conceptualization, G.P and V.C.; methodology, G.P.; software, G.P.; validation, M.L.; formal analysis, G.P.; investigation, M.L. writing—original draft preparation, G.P.; writing—review and editing, G.P. and V.C.; supervision, V.C. All authors have read and agreed to the published version of the manuscript.
Funding
This research received no external funding.
Institutional Review Board Statement
Not applicable.
Informed Consent Statement
Not applicable.
Data Availability Statement
The data are available upon request from the corresponding author.
Conflicts of Interest
The authors declare no conflicts of interest.
References
- International Agency for Research on Cancer. Available online: https://www.iarc.who.int/cancer-type/colorectal-cancer/ (accessed on 11 June 2024).
- Nass, S.J.; Cohen, M.B.; Nayar, R.; Zutter, M.M.; Balogh, E.P.; Schilsky, R.L.; Hricak, H.; Elenitoba-Johnson, K.S.J. Improving Cancer Diagnosis and Care: Patient Access to High-Quality Oncologic Pathology. Oncologist 2019, 24, 1287–1290. [Google Scholar] [CrossRef] [PubMed]
- Ruddon, R.W. What Makes a Cancer Cell a Cancer Cell? In Holland-Frei Cancer Medicine, 6th ed.; Kufe, D.W., Pollock, R.E., Weichselbaum, R.R., Bast, R.C., Gansler, T.S., Holland, J.F., Frei, E., Eds.; BC Decker: Hamilton, ON, USA, 2003. [Google Scholar]
- Suresh, S. Biomechanics and biophysics of cancer cells. Acta Biomater. 2007, 3, 413–438. [Google Scholar] [CrossRef] [PubMed]
- Beloribi-Djefaflia, S.; Vasseur, S.; Guillaumond, F. Lipid metabolic reprogramming in cancer cells. Oncogenesis 2016, 5, e189. [Google Scholar] [CrossRef]
- Jelski, W.; Mroczko, B. Biochemical Markers of Colorectal Cancer-Present and Future. Cancer Manag. Res. 2020, 22, 4789–4797. [Google Scholar] [CrossRef]
- Zhang, Y.; Wang, Y.; Zhang, B.; Li, P.; Zhao, Y. Methods and biomarkers for early detection, prediction, and diagnosis of colorectal cancer. Biomed. Pharmacother. 2023, 163, 114786. [Google Scholar] [CrossRef]
- Abramczyk, H.; Brozek-Pluska, B.; Jarota, A.; Surmacki, J.; Imiela, A.; Kopec, M. A look into the use of Raman spectroscopy for brain and breast cancer diagnostics: Linear and non-linear optics in cancer research as a gateway to tumor cell identity. Expert Rev. Mol. Diagn. 2020, 20, 99–115. [Google Scholar] [CrossRef] [PubMed]
- Elumalai, S.; Managó, S.; De Luca, A.C. Raman Microscopy: Progress in Research on Cancer Cell Sensing. Sensors 2020, 20, 5525. [Google Scholar] [CrossRef]
- Movasaghi, Z.; Rehman, S.; Rehman, I.U. Raman Spectroscopy Can Detect and Monitor Cancer at Cellular Level: Analysis of Resistant and Sensitive Subtypes of Testicular Cancer Cell Lines. Appl. Spectrosc. Rev. 2012, 47, 571–581. [Google Scholar] [CrossRef]
- Gautam, R.; Vanga, S.; Ariese, F.; Umapathy, S. Review of multidimensional data processing approaches for Raman and infrared spectroscopy. EPJ Tech. Instrum. 2015, 2, 8. [Google Scholar] [CrossRef]
- Morais, C.L.M.; Lima, K.M.G.; Singh, M.; Martin, F.L. Tutorial: Multivariate classification for vibrational spectroscopy in biological samples. Nat. Protoc. 2020, 15, 2143–2162. [Google Scholar] [CrossRef]
- Guo, S.; Popp, J.; Bocklitz, T. Chemometric analysis in Raman spectroscopy from experimental design to machine learning–based modelling. Nat. Protoc. 2021, 16, 5426–5459. [Google Scholar] [CrossRef] [PubMed]
- Lasalvia, M.; Gallo, C.; Capozzi, V.; Perna, G. Classifying Raman Spectra of Colon Cells Based on Machine Learning Algorithms. Photonics 2024, 11, 275. [Google Scholar] [CrossRef]
- Lasalvia, M.; Gallo, C.; Capozzi, V.; Perna, G. Discrimination of Healthy and Cancerous Colon Cells Based on FTIR Spectroscopy and Machine Learning Algorithms. Appl. Sci. 2023, 13, 10325. [Google Scholar] [CrossRef]
- Lasalvia, M.; Capozzi, V.; Perna, G. A comparison of PCA-LDA and PLS-DA techniques for classification of vibrational spectra. Appl. Sci. 2022, 12, 5345. [Google Scholar] [CrossRef]
- Ning, T.; Li, H.; Chen, Y.; Zhang, B.; Zhang, F.; Wang, S. Raman spectroscopy based pathological analysis and discrimination of formalin fixed paraffin embedded breast cancer tissue. Vib. Spectrosc. 2021, 115, 103260. [Google Scholar] [CrossRef]
- Menges, F. Spectragryph, version 1.2.16; Optical Spectroscopy Software; Spectragryph: Oberstdorf, Germany, 2023. Available online: http://www.effemm2.de/spectragryph/ (accessed on 15 March 2024).
- Talari, A.C.S.; Movasaghi, Z.; Rehman, S.; Rehman, I.U. Raman Spectroscopy of Biological Tissues. Appl. Spectrosc. Rev. 2015, 50, 46–111. [Google Scholar] [CrossRef]
- Beton, K.; Brozek-Płuska, B. Biochemistry and Nanomechanical Properties of Human Colon Cells upon Simvastatin, Lovastatin, and Mevastatin Supplementations: Raman Imaging and AFM Studies. J. Phys. Chem. B 2022, 126, 7088–7103. [Google Scholar] [CrossRef]
- Brozek-Pluska, B.; Beton, K. Oxidative stress induced by tBHP in human normal colon cells by label free Raman spectroscopy and imaging. The protective role of natural antioxidants in the form of β-carotene. RSC Adv. 2021, 11, 16419–16434. [Google Scholar] [CrossRef]
- Brozek-Pluska, B.; Jarota, A.; Kania, R.; Abramczyk, H. Zinc Phthalocyanine Photochemistry by Raman Imaging, Fluorescence Spectroscopy and Femtosecond Spectroscopy in Normal and Cancerous Human Colon Tissues and Single Cells. Molecules 2020, 25, 2688. [Google Scholar] [CrossRef]
- Beton-Mysur, K.; Brozek-Pluska, B. Raman Spectroscopy and Imaging Studies of Human Digestive Tract Cells and Tissues—Impact of Vitamin C and E Supplementation. Molecules 2023, 28, 137. [Google Scholar] [CrossRef]
- Dong, L.; Sun, X.; Chao, Z.; Zhang, S.; Zheng, J.; Gurung, R.; Du, J.; Shi, J.; Xu, Y.; Zhang, Y.; et al. Evaluation of FTIR spectroscopy as diagnostic tool for colorectal cancer using spectral analysis. Spectrochim. Acta Part A Mol. Biomol. Spectrosc. 2014, 122, 288–294. [Google Scholar] [CrossRef]
- Beton, K.; Wysocki, P.; Brozek-Pluska, B. Mevastatin in colon cancer by spectroscopic and microscopic methods-Raman imaging and AFM studies. Spectrochim. Acta A Mol. Biomol. Spectrosc. 2022, 5, 120726. [Google Scholar] [CrossRef] [PubMed]
- Varmuza, K.; Filzmoser, P. Introduction to Multivariate Statistical Analysis in Chemometrics; CRC Press: Boca Raton, FL, USA, 2009. [Google Scholar]
- You, R.; Li, J.; Wang, H.; Wu, Y.; Weng, J.; Lu, Y. High-performance SERS biosensor based on in-situ reduction of silver nanoparticles in an ultra-filtration centrifuge device for label-free detection of colon cancer in serum. J. Membr. Sci. 2023, 678, 121688. [Google Scholar] [CrossRef]
- Li, J.; She, Q.; Wang, W.; Liu, R.; You, R.; Wu, Y.; Weng, J.; Liu, Y.; Lu, Y. Label-Free SERS Analysis of Serum Using Ag NPs/Cellulose Nanocrystal/Graphene Oxide Nanocomposite Film Substrate in Screening Colon Cancer. Nanomaterials 2023, 13, 334. [Google Scholar] [CrossRef]
- Blake, N.; Gaifulina, R.; Griffin, L.D.; Bell, I.M.; Rodriguez-Justo, M.; Thomas, G.M.H. Deep Learning Applied to Raman Spectroscopy for the Detection of Microsatellite Instability/MMR Deficient Colorectal Cancer. Cancers 2023, 15, 1720. [Google Scholar] [CrossRef]
- Peng, S.; Lu, D.; Zhang, B.; You, R.; Chen, J.; Xu, H.; Lu, Y. Machine learning-assisted internal standard calibration label-free SERS strategy for colon cancer detection. Anal. Bioanal. Chem. 2023, 415, 1699–1707. [Google Scholar] [CrossRef] [PubMed]
- Lee, L.C.; Liong, C.Y.; Jemain, A.A. Partial least squares-discriminant analysis (PLS-DA) for classification of high-dimensional (HD) data: A review of contemporary practice strategies and knowledge gaps. Analyst 2018, 143, 3526–3539. [Google Scholar] [CrossRef] [PubMed]
- Bergholt, M.S.; Zheng, W.; Lin, K.; Wang, J.; Xu, H.; Ren, J.L.; Ho, K.Y.; Teh, M.; Yeoh, K.G.; Huang, Z. Characterizing variability of in vivo Raman spectroscopic properties of different anatomical sites of normal colorectal tissue towards cancer diagnosis at colonoscopy. Anal. Chem. 2015, 87, 960–966. [Google Scholar] [CrossRef]
- Liu, W.; Wang, H.; Du, J.; Jing, C. Raman microspectroscopy of nucleus and cytoplasm for human colon cancer diagnosis. Biosens. Bioelectron. 2017, 97, 70–74. [Google Scholar] [CrossRef]
- Brozek-Pluska, B. Statistics assisted analysis of Raman spectra and imaging of human colon cell lines—Label free, spectroscopic diagnostics of colorectal cancer. J. Mol. Struct. 2020, 1218, 128524. [Google Scholar] [CrossRef]
Disclaimer/Publisher’s Note: The statements, opinions and data contained in all publications are solely those of the individual author(s) and contributor(s) and not of MDPI and/or the editor(s). MDPI and/or the editor(s) disclaim responsibility for any injury to people or property resulting from any ideas, methods, instructions or products referred to in the content. |
© 2025 by the authors. Licensee MDPI, Basel, Switzerland. This article is an open access article distributed under the terms and conditions of the Creative Commons Attribution (CC BY) license (https://creativecommons.org/licenses/by/4.0/).