Abstract
Sulfamic acid (SA) is extensively utilised in industry as a component in the production of flameproof materials, a catalyst for swift and highly efficient synthesis, in dye and pigment manufacturing processes, or as herbicide. Under ambient conditions, this compound exists as a solid in zwitterionc form, undergoing pressure-induced isosymmetric polymorphic phase transition (IPT), starting at approximately 10.0 GPa. In this work, multiple computational approaches were used to predict and describe this transition. While geometry optimisation at an increased pressure using periodic DFT-level calculations have not resulted in the anticipated IPT, the comparison of the experimental and theoretical Raman spectra confirmed this transformation. Thermodynamic calculations enabled the comparison of the stability of the modelled phases and explained the experimental observations. Ab initio molecular dynamics simulations revealed the mechanisms behind the observed transition. This work presents a complex methodology that can be successfully used to predict the IPT of molecular crystals.
1. Introduction
Polymorphisms, defined as the property of a substance to manifest in two or more crystalline phases with distinct molecular arrangements or conformations in the crystal lattice, are a phenomenon of significant relevance in applied sciences [1,2,3]. Molecular-level changes among polymorphs can result in distinct properties, including hygroscopicity, solubility, thermal stability, release rate, hardness, and chemical reactivity [4].
Since its inception, chemistry has predominantly utilised temperature to generate or alter materials; nevertheless, the application of pressure above a few tens of atmospheres for similar reasons has been infrequently recorded.
The application of high pressure has demonstrated efficacy in uncovering fresh states in solid-state materials, exemplified by the transformation of graphite into diamond [5]. Under increased pressure, the organisation of both inter- and intramolecular contacts can often be altered, new hydrogen bonds can form, and existing ones can be broken or symmetrized.
Pressure-induced phase transitions often manifest in one of three forms: a direct transition between higher- and lower-symmetry space groups (type I), a transition including a low-symmetry state linking higher-symmetry initial and final structures (type II), or a more complex transformation process (type III).
Isosymmetric structural phase transitions (IPT, type 0), characterised by the absence of alterations in the occupation of Wyckoff positions, the atom count in the unit cell, and the space group symmetry, are rather rare [6]. Nonetheless, there exist several notable and newly identified instances of such transitions; sodium oxalate [7], 1,3-cyclohexanedione [8], L-serine [9], chlorothiazide [10], biurea [11], and glycylglycine [12] are just some of the well-known examples.
Density functional theory (DFT) methods are frequently applied to model the structure and properties of organic materials and compounds.
The distinctiveness of each polymorphic form primarily arises from both short- and long-range intermolecular interactions. Consequently, DFT-based approaches modelling a single molecule in vacuum or solution were deemed insufficient and imprecise for investigating polymorphism-related events. Although “single molecule” methods are typically effective in various areas of sciences, such as investigating drug–biomolecule interactions or predicting complex formation, the study on molecular crystals necessitated the use of alternative calculations, often referred to as “periodic DFT calculations” [13]. The term “periodic” abbreviates “performed under periodic boundary conditions”, a critical prerequisite for precise crystal modelling. Moreover, in these computations, pseudopotentials are commonly employed to depict an effective interaction that approximates the potential encountered by valence electrons. Furthermore, plane wave-basis sets are usually utilised in lieu of localised ones.
Sulfamic acid (SA) is the derivative of sulfuric acid and serves as a model for investigating the properties of hydrogen-bonded molecular crystals under severe circumstances. This classical chemical is extensively utilised in industry and has garnered significant interest owing to its broad applications and distinctive features. For example, it is an acidic cleaning agent and can be utilised as a component in the production of flameproof materials [14]. Simultaneously, the steady characteristics of SA render it a standard substance for nonaqueous titrimetric analysis [15]. The most renowned application of SA is its role as a catalyst for swift and highly efficient synthesis [16]. It is important to acknowledge that SA exists as a zwitterion, NH3+SO3−, in the solid state under ambient conditions. The zwitterionic characteristic of SA not only results in distinctive physical qualities, such as a high melting point of around 205 °C, unlike other sulfonic acids, but also enables it to function as a recyclable catalyst, which may be reused via straightforward filtration and washing. Given its wide-ranging applications, SA is indispensable for use in harsh environments.
The crystal structure of SA has been thoroughly analysed under ambient conditions. SA crystallises in the orthorhombic space group Pbca with Z’ = 1 and Z = 8. In the ICSD database, four similar structures of SA can be found, with the most recently published ones obtained from X-ray diffraction and characterised by the following cell parameters: a = 8.034(1) Å, b = 8.020(1) Å, c = 9.236(2) Å; and neutron diffraction with the following cell parameters: a = 8.036(3) Å, b = 8.025(3) Å, c = 9.236(5) Å [17]. Despite the small size of SA molecules, the hydrogen bonding arrangement in its crystal lattice is quite complex. In the solid state, SA exists in the form of zwitterions, characterised by anti-periplanar conformation. Both ends of this molecule participate in independent hydrogen bonding with neighbouring molecules; the NH3+ group is surrounded by five oxygen atoms at short interatomic distances (about 2.79–2.95 Å), but only three of those oxygens are directly implicated in hydrogen bonding. It should be also noted that the shortest N-O distance is not in the direction of any hydrogen atom. The zwitterionic form of SA, which boosts the intermolecular electrostatic interactions, and presence of multiple strong H-bonds, results in distinctive physical features of this compound, including a high melting point of around 205 °C, unlike other sulfonic acids (Figure 1).
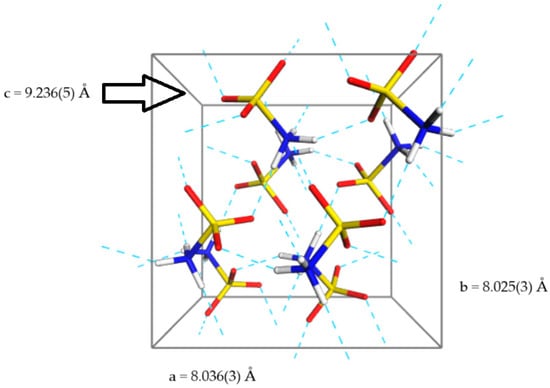
Figure 1.
Unit cell of SA in a perspective projection. Blue dashed lines represent the hydrogen bonds.
Recently, it has been discovered experimentally that SA undergoes pressure-induced IPT, resulting in the abrupt decrease in “c” and increase in “a” and “b” unit cell lengths (Figure 2) [18]. The authors of [18] have used Raman spectroscopy to additionally characterise this transition of initial Phase I into newly discovered Phase II, starting at approximately 10.0 GPa. Although the authors of [18] have performed the Rietveld refinement of the powder pattern of Phase II recorded at 13.7 GPa, they have not published nor deposited in a database the final coordinates after refinement, presenting the structure of Phase II solely in a form of a Figure (Figure 9 in [18]) and the unit cell dimensions resulting from the analysis of the PXRD patterns.
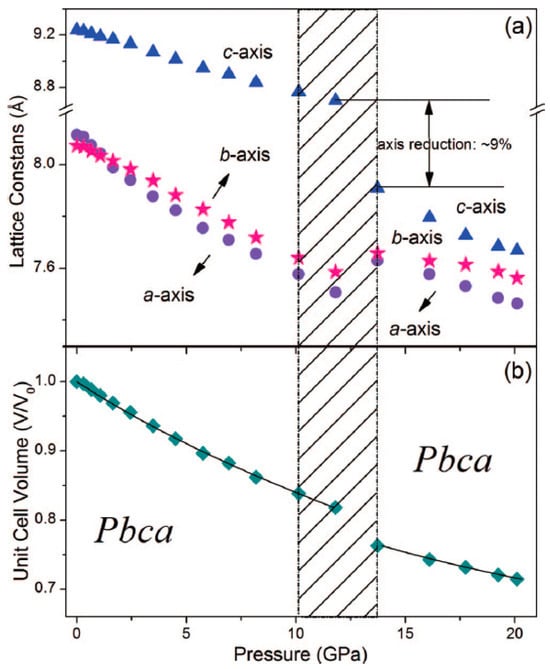
Figure 2.
Compression of (a) lattice constants and (b) unit cell volume of SA with respect to pressure. Shadow represents the phase transition region. Reprinted from [18], with the permission of AIP Publishing.
As we have shown in a recent review [19], computational methods developed to mimic the solid state are typically calibrated using structural data at an ambient pressure, making their application to high-pressure scenarios a significant challenge for validating their computational accuracy. Nonetheless, quantum chemical calculations, particularly utilizing the density functional theory (DFT), have consistently demonstrated their efficacy as a valuable instrument for predicting properties that can subsequently be validated by experimentalists, as well as elucidating, at the molecular level, the findings of high-pressure experiments.
On the one hand, the application of high pressure can result in the formation of the new phase, which makes this approach a tempting direction for widespread exploration and application. On the other hand, high-pressure experiments are experimentally demanding; therefore, the methods that can be accurately used to guide those experiments and predict their outcomes are highly anticipated. Therefore, the aim of this work was to assess if the periodic DFT methods can predict the pressure-induced polymorphic phase transition of SA, describe the thermodynamic aspects of this transformation and explain the differences in the Raman spectra observed experimentally.
2. Materials and Methods
Calculations at the density functional theory (DFT) level, in particular enthalpy minimisation, phonon dispersion, density of states, ab initio molecular dynamics (aiMD), and Raman-active vibrations, were conducted using the CASTEP [20] program integrated within the Materials Studio 2020 software (Materials Studio CASTEP version 2020), employing the plane wave pseudopotential formalism. On-the-fly-generated (OTFG) norm-conserving pseudopotentials (H_2017R2ncp.otfg for H, N_2017R2ncp.otfg for N, O_2019ncp.otfg for O, S_2017R2ncp.otfg for S) were obtained utilizing the Koelling–Harmon scalar relativistic method.
2.1. DFT Functionals and Dispersion Correction Methods
The complete list of the DFT functionals and dispersion corrections used in this study is presented in Table 1.

Table 1.
DFT-based computational methods used in this study.
2.2. Geometry Optimisation
Geometry optimisation was carried out using the limited-memory Broyden−Fletcher−Goldfarb−Shanno (LBFGS) optimisation algorithm and smart method for finite-basis set correction. The kinetic energy cutoff for the plane waves (Ecut) was optimised and set to 1020 eV. The Monkhorst–Pack k-points used for sampling the Brillouin zone integration of the primitive cell were adjusted to maintain separation lower than 0.07 Å−1.
The experimental crystal structure of sulfamic acid (ref. code ICSD_802 [17]) from the Inorganic Crystal Structure Database (ICSD) served as the initial structure for calculations. Two approaches for geometry optimisation were employed: “full + cell”, wherein all atomic positions and cell parameters are relaxed, and “full”, in which all atomic positions are optimised but the cell parameters are fixed at experimental values. The convergence criteria applied were 5 × 10⁻⁶ eV/atom for energy, 1 × 10⁻² eV/Å for interatomic forces, 2 × 10⁻² GPa for stresses, and 5 × 10⁻⁴ Å for displacements. The fixed-basis set quality approach was employed for cell optimisation calculations, with a limit of 5 × 10⁻⁷ eV/atom for SCF.
2.3. Thermodynamic Parameters and Raman Activity Calculations
Phonon frequencies were obtained using the diagonalisation of dynamical matrices computed using linear response techniques, known also as density functional perturbation theory (DFPT). DFPT is the primary ab initio technique utilised for phonon computations. This method is different from the direct method, as DFPT calculates the change in the Hamiltonian due to a specific perturbation in charge density or wavefunction, rather than actually displacing atoms as in a direct method. The q-point separation parameter, denoting the mean distance between Monkhorst–Pack mesh q-points utilised in real space dynamical matrix computations, was established at 0.05 Å−1. The convergence criterion for the force constants during a phonon properties calculation was established at 1 × 10⁻⁵ eV/Å2. This model was utilised to compute band structure, density of states (DOS), phonon spectrum, and phonon density of states (phonon DOS) features. For the dispersion calculations the distance between q-vectors along the reciprocal space trajectory was established at 0.015 Å−1. The DOS calculations employed a 3 × 3 × 3 Monkhorst–Pack k-points grid, yielding a q-vector separation of 0.04 Å−1.
The outcomes of a phonon spectra calculation were utilised to ascertain, within the quasi-harmonic approximation, zero-point vibrational energy (Ezp), entropy (S), Gibbs free energy (G), and enthalpy (H) as functions of temperature, employing Equations (1)–(4) formulated by Baroni et al. [33]. In the equation, ω represents phonon frequency, F(ω) indicates the vibrational density of states for a phonon spectrum, Etot symbolises the total electronic energy at absolute zero, k is Boltzmann’s constant, and ħ is Dirac’s constant.
Activities for Raman vibrations were calculated with the required convergence for the second-order response to the electric field set as 1.0 × 10⁻⁵ Å3 and with the finite displacement method has been used to calculate Raman intensities. CASTEP analysis was used to construct Raman-mode intensities for a given temperature (298 K) and laser wavelength (532 nm) from calculated activities. No imaginary frequencies for both Phase I and Phase II were observed at 20.1 GPa.
2.4. Ab Initio Molecular Dynamic (aiMD) Simulations
Born–Oppenheimer ab initio molecular dynamic (aiMD) simulations [34] were conducted in CASTEP utilising an NPT ensemble, kept at a constant temperature of 298 K and pressures of either 1.01325 × 10⁻⁴ or 20.1 GPa, employing a Nosé thermostat, Parrinello barostat, and PBE TS functional. The kinetic energy cutoff for the plane waves (Ecut) was established at 1020 eV, and the integration time step was set to 0.5 fs. No symmetry requirements were imposed during the simulations. The simulation duration was established at 9 ps. A limit of 5 × 10⁻⁷ eV/atom for SCF was employed. It should be noted that CASTEP does not require user-defined convergence criteria for energy/forces during dynamics, relying instead on adaptive algorithms.
3. Results
3.1. Geometry Optimisation of SA at 1 atm and 20.1 GPa
The first stage of this work consisted of geometry optimisation, including the all atom positions and unit cell dimensions of SA Phase I at 1 atm and 20.1 GPa.
Optimisation at 1 atm was performed for two reasons: first, to perform the benchmark of the available functionals (Table 1), by comparing the unit cell dimensions of calculated and experimentally recorded crystal structures; and second, to choose the most accurate method for the further calculations such as phonon DOS and aiMD. It is well known that the choice of the DFT functional can significantly affect the final results, both in non-periodic and periodic calculations. The obtained results (Table 2) confirm this statement, revealing major differences among the results obtained using various approaches. For example, the calculated unit cell dimensions differ by more than 1Å, a: 9.222 Å for RPBE and 7.993 Å for PBESOL, which is a significant difference as it corresponds to more than 10% of the experimentally determined value. Also, some functionals (i.e., RPBE, BLYP) significantly overestimated the unit cell dimensions; however, adding the dispersion correction generally increased the accuracy of the results. The meta-GGA functional, RSCAN is located at the higher rung of the so-called Jacob’s ladder of the density functional theory, with each rung generally leading to approximations with better accuracy. However, in this case, the values obtained using RSCAN were found to be underestimated. The accuracy of the PBESOL functional, designed to improve the results obtained for the solid materials, was lower than original PBE. Interestingly, in most of the cases, the calculated “c” unit cell length was larger than the experimentally obtained one, being also the one that undergoes rapid decrease upon IPT (Figure 2).

Table 2.
Comparison of experimentally determined (blue) and geometrically optimised unit cell dimensions of SA Phase I at 1 atm.
The second step of this work was the geometry optimisation ad 20.1 GPa using the experimentally obtained crystal structure of Phase I as the initial structure. According to the experimental results [18], Phase I does not exist at this pressure; therefore, the phase transition of Phase I into Phase II during the geometry optimisation was anticipated, as observed in our earlier works [37,38]. However, no such transition was observed this time, regardless of the method used (Table 3). The experimentally determined “c” length of Phase II at 20.1 GPa was 7.68 Å, while in the calculations, the values higher by about 1.0 Å (13%) were obtained. However, the obtained values were not just the inaccurate predictions of Phase II. A comparative analysis of Figure 2 and Table 3 indicated that the obtained values (a = 7.249 Å, b = 7.376 Å, c = 8.489 Å, V = 453.9 Å3 for PBE TS, Table 3) were close to those that would be characterising Phase I if it did not undergo the IPT, and would have been stable at this elevated pressure, assuming that the compression of the unit cell dimensions continued, as modelled in Figure 2 (a = 7.5 Å, b = 7.7 Å, c = 8.8 Å, V = 508 Å3).

Table 3.
Comparison of the experimentally determined (blue, a = 7.46 Å, b = 7.57 Å, c = 7.68 Å, V = 433.7 Å3) and geometrically optimised unit cell dimensions of SA at 20.1 GPa.
These results could indicate two possible scenarios. First, the energy barrier between Phase I and II is too large to be overcome during the geometry optimisation [37,38]. Second, the experimentally observed Phase II is, for some reason, not a DFT minimum at 20.1 GPa. Therefore, to verify these hypotheses, calculations of geometry optimisation at 20.1 GPa were repeated, but this time using the Phase II as the initial structure (Table S1). No significant differences were observed, indicating that the choice of either Phase I or Phase II initially for calculations had no influence on the results received. This excluded the first hypothesis, as starting with the experimental Phase II structure initially for calculations should not require overcoming the energy barrier during the geometry optimisation if it was indeed the DFT minimum.
Another set of geometry optimisation calculations at 20.1 GPa was performed using again the experimental structure of Phase II as the initial, but this time allowing only for the atomic positions to relax, with unit cell dimensions constrained to their experimental values. Since the authors of [18] did not deposit the crystal structure of Phase II, Phase II was created by us using the experimental structure of Phase I and changing the values of the unit cell dimensions to those presented in [18]. This approach was deemed justified as it has been determined experimentally that Phase I and Phase II exist in the same space group: Pbca, with Z′ = 1 and Z = 8. Additionally, since the conformational space of SA was very limited, we could assume that the same anti-periplanar conformation was present in both forms. Additionally, although the authors of [18] did not deposit the crystal structure of Phase II, they compared both phases in Figure 9 of [18], revealing that no major changes in the molecular structure occurred during IPT. Finally, as during geometry optimisation, all atom positions were relaxed, and molecular properties (distance, angles, torsions) were optimised to reach the lowest enthalpy conformation. Then, the energy of Phase I and Phase II was compared (Table 4).

Table 4.
Energy differences between Phase II and Phase I of SA optimised at 20.1 GPa. Unit cell dimensions of Phase II were fixed to their experimental values, while unit cell dimensions of Phase I were optimised.
Analysis of the results presented in Table 4 revealed that at 20.1 GPa Phase I was energetically preferable (ΔE > 0). Since the results of the DFT calculations may depend on the choice of the DFT functional, a large variety of methods (functional + dispersion correction) were used in this study to validate if the sign of ΔE will depend in the choice of the method. The positive value of ΔE between Phase II and Phase I of dozen kJ/mol was obtained, regardless of the method used. It was confirmed that functional/dispersion choice does not alter the conclusion that Phase I is higher in energy. This explained why the optimisation of Phase I at 20.1 GPa did not result in the phase transition and why the optimisation of Phase II at 20.1 GPa ended with its transformation to Phase I, which is in disagreement with the experimental results.
The comparison of the molecular and crystal structures of Phase I and Phase II is presented in Figure 3. No major differences were observed between the molecular structures of SA zwitterions, and the values of angles were preserved while the differences in the bond lengths were lower than 0.02 Å (Figure 3A). In both forms, the SA crystal structure was stabilised by a dense network of hydrogen bonds. The comparison of the H-bonding between Phase I and Phase II (Figure 3C) revealed that while the number of hydrogen bonds was preserved, their lengths were altered. Some H-bonds of Phase II were longer (i.e., 1.680 Å vs. 1.580 Å) while the other were shorter (i.e., 2.003 Å vs. 2.265 Å) than the corresponding ones of Phase I. Moreover, the phase transition resulted in alterations in the intermolecular S–N distances between the neighboring molecules (Figure 3D). While some of those S–N distances remained unchanged (5.280 vs. 5.283 Å), the other ones were significantly shortened (i.e., 3.575 vs. 3.799 Å). This confirms that transition results from anisotropic compression and sliding of the molecules among the specific direction. Overall, Phases I and I are clearly different from each other (Figure 3B).

Figure 3.
Comparison of the molecular and crystal structures of Phases I and II optimised at 20.1 GPa, showing the structural differences resulting from polymorphic transitions. (A) Comparison of bond lengths; (B) superimposed unit cells; (C) comparison of H-bonding network and lengths of the H-bonds present in the unit cells; (D) comparison of the intermolecular S–N distances.
3.2. Raman Spectra Calculations and Comparison with Experiment
Although the geometry optimisation of Phase I at 20.1. GPa did not result in the anticipated IPT, this did not discourage us from continuing our research. Since apart from XRD Raman spectrometry was also used to describe the IPT of SA [18], we decided to calculate the Raman spectra of Phase I at 1 atm and 20.1 GPa, as well as Phase II at 20.1 GPa. Here, it should be noted that in order to obtain the Raman spectra of Phase II at 20.1 GPa, we could not optimise the unit cell dimensions, as it resulted in its transition to Phase I (Table S1). Therefore, for that purpose, we performed the optimisation of Phase II at 20.1 GPa with the constrained unit cell dimensions using the same approach described above (Table 4). Then, the calculated (at 1 atm and 20.1 GPa) Raman spectra were compared with the experimental ones, recorded in the pressure range of 1 atm–18.9 GPa (Figure 4).
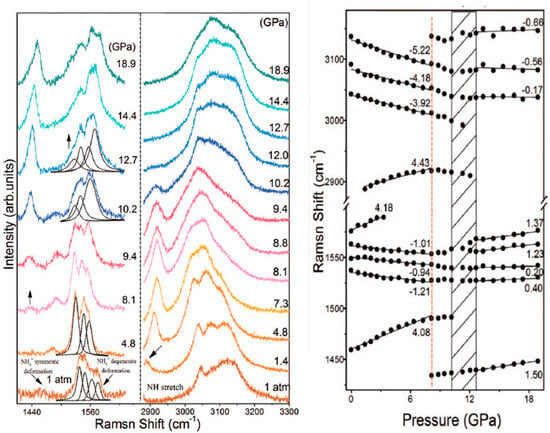
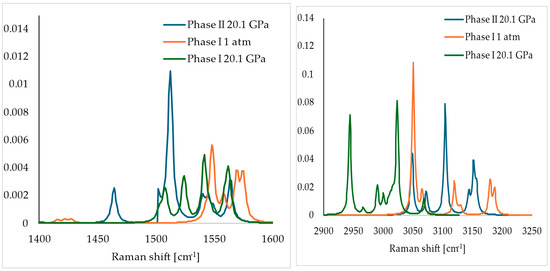
Figure 4.
Comparison of experimental (top) (recorded in the pressure range 1 atm–18.9 GPa) and theoretical (bottom) (calculated at 1 atm and 20.1 GPa) Raman spectra of SA. Reprinted from [18], with the permission of AIP Publishing.
Analysis of the spectra recorded and calculated at 1 atm, within the 1400–1600 cm−1 range, revealed the presence of the low-intensity overlapping peaks at 1440 cm−1. Also, for both experimental and theoretical spectra, four peaks were observed in the 1540–1580 cm−1 range. In the 2900–3300 cm−1 region, the peaks in the experimental spectrum were more overlapping; however, both for experimental and theoretical spectra, few peaks were observed, with the most intensive one at c.a. 3050 cm−1. Overall, good agreement between the experimental and calculated Raman spectra of Phase I at 1 atm was observed, with the differences between the corresponding peaks lower than 50 cm−1.
Analysis of the theoretical spectra of Phase I and Phase II at 20.1 GPa revealed some major differences among them. In the 1400–1600 cm−1 range, in the theoretical spectrum of Phase II, a peak can be observed at 1455 cm−1, which was absent in the spectrum of Phase I. This peak was also observed in the experimental spectra recorded at a higher pressure, and was associated by the authors of [18] with the formation of the new Phase II. Additionally, the theoretical spectra of Phase I and II differed substantially in the 2900–3250 cm−1 region. For example, solely in the spectrum of Phase I, the intensive peak was observed at 2950 cm−1. This peak was observed experimentally at 1 atm, but disappeared at a higher pressure due to the phase transition. In the experimental spectrum, the overlapping peaks were observed in the 3000–3200 cm−1 region. Also, a couple of peaks in the theoretical spectrum of Phase II were present in this range. On the contrary, the peaks in the theoretical spectrum of Phase I at 20.1 GPa were characterised by lower wavenumbers in the range of 2920–3200 cm−1.
In conclusion, the comparative analysis of the experimental and theoretical Raman spectra revealed the good agreement between the experimental spectrum recorded at a higher pressure and spectrum of Phase II calculated at 20.1 GPa, with the differences between the corresponding peaks being lower than 50 cm−1.
This confirmed that the modelled structure of Phase II at 20.1 GPa was observed experimentally, but the questioned remained on the stability of this form, taking into account its higher lattice energy, in comparison to Phase I (Table 4). To answer this question, we calculated and compared the thermodynamic properties of Phase I and Phase II.
3.3. Thermodynamic Paramater Calculations
Although the phonon dispersion and density of states calculations are quite computationally demanding, they can be very informative as they allow for calculating the thermodynamic properties to assess the stability of the analysed polymorphic forms. The differences (Δ, Phase I–Phase II) between the chosen thermodynamic properties, including Gibbs free energy (ΔG), enthalpy (ΔH), and temperature times entropy (TΔS) of the structures modelled using PBE TS functional at 20.1 GPa, with respect to the temperature, are presented in Figure 5.
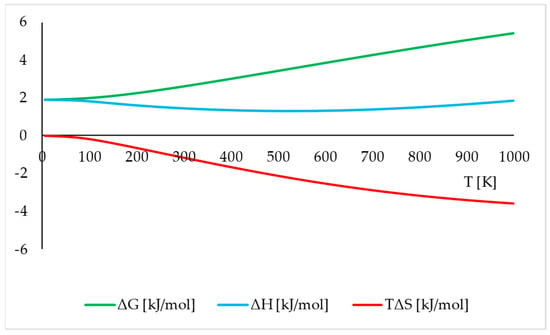
Figure 5.
Differences (Phase I–Phase II) between the thermodynamic parameters: Gibbs free energy (ΔG), enthalpy (ΔH), and temperature times entropy (TΔS) of the structures modelled using PBE TS functional at 20.1 GPa, with respect to the temperature.
The positive values of ΔG in the whole range of T indicate the higher thermodynamic stability of Phase II at 20.1 GPa, which is in agreement with the experimental observations. In addition, the differences at the level of a few kJ/mol were reasonable, as the lattice energy differences between experimentally observed polymorphs were usually less than 4.2 kJ/mol (1 kcal/mol) per molecule, but could be even lower than 1 kJ/mol [39]. The higher thermodynamic stability of Phase II at 20.1 GPa was a result of both entropic (S) and enthalpic (H) contributions, as Phase II is characterised by higher S and lower H in the whole region of studied temperatures than Phase I.
Thermodynamic analysis explains the experimentally observed IPT and highlights the important role of phonon DOS calculations required for the thermodynamic analysis, as the analysis of solely lattice energies can be misleading and does not reflect the true order of the stability of polymorphs.
3.4. Molecular Dynamics Simulations
Molecular dynamics (MD) simulations can be very useful in the computational analysis of complex phenomena such as polymorphic phase transitions. The kinetic energy, associated with the non-zero T, added to the system, may allow for overcoming the potential energy barriers between the forms. Moreover, it allows for including the entropic contributions, which are neglected at 0 K.
To check the dynamic stability of SA, we conducted MD simulations at both 1 atm and 20.1 GPa using the Phase I as the initial (Figure 6).

Figure 6.
Evolution of the unit cell parameters during the aiMD simulations at 1 atm (left) and 20.1 GPa (right).
At 1 atm, no major changes in the unit cell dimensions were being observed, apart from oscillations resulting from lattice dynamics. The average values of the unit cell lengths were close to those obtained from geometry optimisation and simultaneously to the recorded experimental values.
However, at 20.1 GPa, the increase in the amplitude of the oscillations was being observed. Additionally, at c.a. 6 ns of simulation time, the significant increase in the lengths of “a” and “b” with the simultaneous decrease in “c” was being observed, which indicated the IPT and formation of Phase II (Figure 2). Nevertheless, Phase II was only present during the short period of the simulation time, and the backward transition to Phase I was being observed at the end of simulation.
As the unit cell dimensions at 6 ns of aiMD simulation resembled those of Phase II, we used the snapshot from the trajectory, recorded at 6 ns, and optimised it at 20.1 GPa. The results were compared with those obtained for Phase I and Phase II using the same computational method (Table 5).

Table 5.
Comparison between Phase I and Phase II, and snapshot taken at 6 ns of aiMD of SA optimised at 20.1 GPa using the PBE TS method. Unit cell dimensions of Phase II were fixed to their experimental values while unit cell dimensions of Phase I and “6 ns” were optimised. All atoms positions were optimised as well for all three structures. E stands for relative energy, with reference to the energy of Phase I.
Optimisation of the 6 ns structure resulted in the local minimum, as its energy was higher than those of Phase I and Phase II. Moreover, the space group of 6 ns was not preserved and changed from Pbca to P1.
As the intramolecular H-bonds between the – groups and oxygen atoms were the main forces stabilising the structure of SA (Figure 7), we analysed the length distribution (Figure 8) and length evolution (Figure 9 and Figure 10) of the representative bond during the MD simulations at the two studied pressures (1 atm and 20.1 GPa).
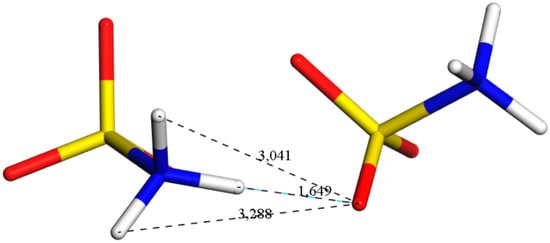
Figure 7.
Fragment of the crystal structure of Phase I optimised at 1 atm. H-bond (black–blue dashed line, 1.649 Å), and the distances between the other two H atoms of – group and oxygen atom from the neighbouring molecule. The H-bond length analysis during the aiMD simulations is presented in Figure 8, Figure 9 and Figure 10.
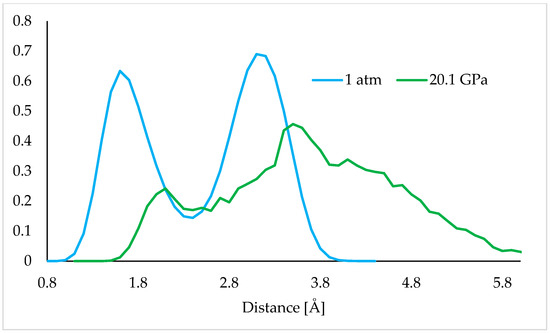
Figure 8.
Length distribution of the H-bond during the aiMD simulations at 1 atm (blue) and 20.1 GPa (green).
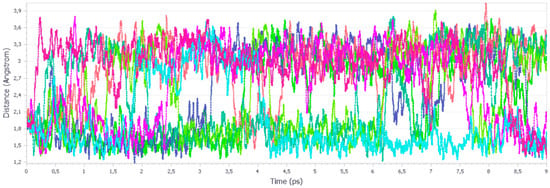
Figure 9.
Length evolution of the H-bonds during the aiMD simulations at 1 atm. Different colors represent the unique H-bonds within the unit cell.
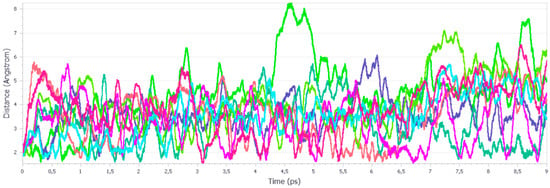
Figure 10.
Length evolution of the H-bonds during the aiMD simulations at 20.1 GPa. Different colors represent the unique H-bonds within the unit cell.
Analysis of the length distribution at 1 atm (Figure 8) indicates the presence of two peaks. First, more intensive, confirms the presence of strong, stable H-bond, with an approximate length of 1.7 Å. During the MD simulations the rotation of the group is being observed, it is possible for the H atoms of a particular group to switch positions (i.e., 2–4 ns, Figure 9), which results in the larger distance of the tracked H atom from the O atom, and consequently, the presence of the second peak at 3.0 Å is shown in Figure 8.
The analysis of the H-bonds during the simulation at 20.1 GPa reveals their completely different behaviour. The reasonable distance, for an H-bond, was observed only during the initial stage of simulation (Figure 10), while during the rest of it, the observed ∙∙∙O distance increased and fluctuated. This indicates that the H-bonds were being broken, which resulted in the experimentally observed IPT.
The structural differences between Phase I and Phase II, as well as the molecular mechanism responsible for this transition, were already described in details in [18]. Based on the experimental results, the authors deduced the mechanism of the phase change as follows. Under ambient conditions, hydrogen bonding and electrostatic interactions are the predominant forces within SA. The transition of SA under high pressure is anticipated to arise from the cooperativity of these two interactions. As pressure escalates, the distances between molecules diminish. Hydrogen bonding and electrostatic interactions between the adjacent SO3− and NH3+ groups are intensified, leading to an increase in the total Gibbs free energy. Thus, to maintain structural equilibrium, clusters of SO3− and NH3+ begin to deform beyond 8.1 GPa, accompanied by the formation of new hydrogen bonds. Upon additional compression between 10.1 and 12.7 GPa, the structure can no longer accommodate the rising free energy, prompting SA to transition to a new conformation to minimise the free energy. Pressure causes relative sliding movements between adjacent molecular chains in SA, accompanied by the reconfiguration of hydrogen bonding and the intensification of electrostatic interactions. Nevertheless, the phase change does not cause an obvious breakdown of the structure. Following the relative displacement of the molecules, the high-pressure structure retains a resemblance to the ambient structure. Despite a sudden alteration in unit cell characteristics, the high-pressure phase can maintain the same symmetry as the ambient phase. As a result, SA undergoes an isosymmetric transition at an elevated pressure. Phase II can be seen as the outcome of the relative displacement between adjacent hydrogen-bonded molecular chains of Phase I. The apparent direction of the slippage is just along the c-axis. The c-axis exhibits a significant contraction following the phase shift. Concurrently, the movement between the molecules results in a slight elongation of a- and b-axes. Moreover, in the ab plane, the angle of intersection between two SA molecules diminishes, corroborating our assertion that Phase II is more compact than Phase I. The tight structure of Phase II renders the hydrogen-bonded network challenging to compress under high pressure.
4. Conclusions
In this work, we analysed the IPT of SA using multiple diverse computational approaches, comparing the obtained theoretical results with the corresponding experimental ones. Despite the high accuracy of the calculations of unit cell dimensions of Phase I at 1 atm, the optimisation of SA at 20.1 GPa did not result in the anticipated IPT. At this pressure, Phase II was characterised by a higher lattice energy than Phase I. However, the simulation of Raman spectra indicated the greater compliance between the theoretical spectrum of Phase II with the experimental results than that of Phase I. The thermodynamic calculations revealed that Phase II is characterised by a lower G and H, and higher S than Phase I, which indicates the higher thermodynamic stability of Phase II at an elevated pressure. No major changes were observed during the MD simulations at 1 atm; however, at 20.1 GPa, significant changes in both unit cell dimensions, as well as in the H-bond lattice were observed, indicating the instability of Phase I and pointing to the anticipated IPT.
Thermodynamic analysis explains the experimentally observed IPT and highlights the important role of phonon DOS calculations required for the thermodynamic analysis, as the analysis of solely lattice energies can be misleading and does not reflect the true order of stability of polymorphs. However, it should also be noticed that the kinetic factors play a significant role in the stability and rate of polymorphic phase transition, determining i.e., the order and constant of this transformation. To our knowledge, kinetic effects have yet to be examined in crystal structure prediction simulations conducted at a fully first-principles level. However, this is only attributable to the deficiency of requisite processing power to do these calculations. Future studies should, therefore, include the prediction of the transition state between Phase I and Phase II, which would allow for calculating the free energy barrier and, subsequently, the kinetic constant (k). While calculation of the kinetic aspects of this transition is computationally expensive, it would allow for observing the energy barriers and reaction pathways, contributing to a more complete understanding of this phenomenon.
In conclusion, the answer to the question stated in the title of this work is positive; however, the prediction of IPT is not a straightforward task and requires careful analysis. This work points on several aspects, such as thermodynamic calculations and MD simulations that, despite their high computational costs, should be taken into account when analysing phenomena such as polymorphic phase transitions.
Additionally, it should be noted that while in [18] a detailed crystallographic and Raman analysis of the studied IPT were conducted, additional SCXRD or ssNMR experiments could provide more information on this phenomenon.
Supplementary Materials
The following supporting information can be downloaded at: https://www.mdpi.com/article/10.3390/app15084185/s1, Table S1. Comparison of the results of calculations of “full + cell” geometry optimisation at 20.1 GPa obtained using the initial structures of Phase I ICSD_802 and Phase II, created using the experimental structure of Phase I and changing the values of the unit cell dimensions to those presented in [18], as described in Section 3.1.
Author Contributions
Conceptualisation, Ł.S., M.F.-R. and A.M.M.; methodology, Ł.S.; software, Ł.S.; validation, Ł.S.; formal analysis, Ł.S. and A.M.M.; investigation, Ł.S. and A.M.M.; resources, Ł.S.; data curation, Ł.S. and A.M.M.; writing—original draft preparation, Ł.S. and A.M.M.; writing—review and editing, Ł.S., M.F.-R. and A.M.M.; visualisation, Ł.S. and A.M.M.; supervision, Ł.S. and M.F.-R.; project administration, Ł.S.; funding acquisition, Ł.S. All authors have read and agreed to the published version of the manuscript.
Funding
This research received no external funding.
Institutional Review Board Statement
Not applicable.
Informed Consent Statement
Not applicable.
Data Availability Statement
The raw data supporting the conclusions of this article will be made available by the authors on request.
Conflicts of Interest
The authors declare no conflicts of interest.
References
- Şaşmaz, A.; Kılıç, A.D.; Konakçı, N. Chemical and Thermal Changes in Mg3Si2O5(OH)4 Polymorph Minerals and Importance as an Industrial Material. Appl. Sci. 2024, 14, 10298. [Google Scholar] [CrossRef]
- Wilińska, J.; Turek, A.; Rech, J.; Janeczek, H.; Pastusiak, M.; Kordyka, A.; Borecka, A.; Kobielarz, M.; Kasperczyk, J. Hot Melt Extrusion as a Formulation Method of Terpolymer Rods with Aripiprazole: A Preliminary Study. Appl. Sci. 2023, 13, 9521. [Google Scholar] [CrossRef]
- Takajo, D.; Sudoh, K. Stability of Two-Dimensional Polymorphs for 10,12-Pentacosadyn-1-ol on Graphite Investigated by SPM. Appl. Sci. 2018, 8, 503. [Google Scholar] [CrossRef]
- Braga, D.; Casali, L.; Grepioni, F. The Relevance of Crystal Forms in the Pharmaceutical Field: Sword of Damocles or Innovation Tools? Int. J. Mol. Sci. 2022, 23, 9013. [Google Scholar] [CrossRef] [PubMed]
- Chen, C.; Li, Y.; Guo, D.; Ke, C.; Fan, D.; Lu, S.; Li, X.; Jiang, M.; Hu, X. Monodispersed Transition Metals Induced Ordinary-Pressure Phase Transformation from Graphite to Diamond: A First-Principles Calculation. ACS Appl. Mater. Interfaces 2023, 15, 30684–30691. [Google Scholar] [CrossRef]
- Christy, A.G. Isosymmetric structural phase transitions: Phenomenology and examples. Acta Crystallogr. Sect. B Struct. Sci. 1995, 51, 753–757. [Google Scholar] [CrossRef]
- Goryainov, S.V.; Boldyreva, E.V.; Smirnov, M.B.; Ahsbahs, H.; Chernyshev, V.V.; Weber, H.P. Isosymmetric Reversible Pressure-Induced Phase Transition in Sodium Oxalate at 3.8 GPa. Dokl. Phys. Chem. 2003, 390, 154–157. [Google Scholar] [CrossRef]
- Szafrański, M.; Czarnecki, P.; Katrusiak, A.; Habrylo, S. DTA investigation of phase transitions in 1,3-cyclohexanedione under high pressures. Solid State Commun. 1992, 82, 277–281. [Google Scholar] [CrossRef]
- Fisch, M.; Lanza, A.; Boldyreva, E.; Macchi, P.; Casati, N. Kinetic control of high-pressure solid-state phase transitions: A case study on L-Serine. J. Phys. Chem. C 2015, 119, 18611–18617. [Google Scholar] [CrossRef]
- Oswald, I.D.H.; Lennie, A.R.; Pulham, C.R.; Shankland, K. High-pressure structural studies of the pharmaceutical, chlorothiazide. CrystEngComm 2010, 12, 2533. [Google Scholar] [CrossRef]
- Bull, C.L.; Funnell, N.P.; Ridley, C.J.; Pulham, C.R.; Coster, P.; Tellam, J.P.; Marshall, W.G. Pressure-Induced Isosymmetric Phase Transition in Biurea. CrystEngComm 2019, 21, 5872–5881. [Google Scholar] [CrossRef]
- Clarke, S.M.; Steele, B.A.; Kroonblawd, M.P.; Zhang, D.; Kuo, I.-F.W.; Stavrou, E. An Isosymmetric High-Pressure Phase Transition in α-Glycylglycine: A Combined Experimental and Theoretical Study. J. Phys. Chem. B 2019, 124, 1–10. [Google Scholar] [CrossRef] [PubMed]
- Mazurek, A.H.; Szeleszczuk, Ł.; Pisklak, D.M. Periodic DFT Calculations—Review of Applications in the Pharmaceutical Sciences. Pharmaceutics 2020, 12, 415. [Google Scholar] [CrossRef]
- Spillane, W.; Malaubier, J.-B. Sulfamic Acid and Its N- and O-Substituted Derivatives. Chem. Rev. 2014, 114, 2507–2586. [Google Scholar] [PubMed]
- Caso, M.M.; Cefola, M. The use of sulfamic acid as a primary standard in nonaqueous titrimetry. Anal. Chim. Acta 1959, 21, 205–214. [Google Scholar] [CrossRef]
- Rajitha, B.; Kumar, B.S.; Reddy, Y.T.; Reddy, P.N.; Sreenivasulu, N. Sulfamic acid: A novel and efficient catalyst for the synthesis of aryl-14H-dibenzo[a.j]xanthenes under conventional heating and microwave irradiation. Tetrahedron Lett. 2005, 46, 8691–8693. [Google Scholar] [CrossRef]
- Bats, J.W.; Coppens, P.; Koetzle, T.F. The Experimental Charge Density in Sulfur-Containing Molecules: A Study of the Deformation Electron Density in Sulfamic Acid at 78 K by X-ray and Neutron Diffraction. Acta Cryst. 1977, B33, 37–45. [Google Scholar] [CrossRef]
- Li, Q.; Li, S.; Wang, K.; Li, X.; Liu, J.; Liu, B.; Zou, G.; Zou, B. Pressure-induced isosymmetric phase transition in sulfamic acid: A combined Raman and x-ray diffraction study. J. Chem. Phys. 2013, 138, 214505. [Google Scholar] [CrossRef]
- Napiórkowska, E.; Milcarz, K.; Szeleszczuk, Ł. Review of Applications of Density Functional Theory (DFT) Quantum Mechanical Calculations to Study the High-Pressure Polymorphs of Organic Crystalline Materials. Int. J. Mol. Sci. 2023, 24, 14155. [Google Scholar] [CrossRef]
- Clark, S.J.; Segall, M.D.; Pickard, C.J.; Hasnip, P.J.; Probert, M.J.; Refson, K.; Payne, M.C. First principles methods using CASTEP. Z. Kristallogr. Cryst. Mater. 2005, 220, 567–570. [Google Scholar]
- Perdew, J.P.; Burke, K.; Ernzerhof, M. Generalized Gradient Approximation Made Simple. Phys. Rev. Lett. 1996, 77, 3865–3868. [Google Scholar] [CrossRef]
- Tkatchenko, A.; Scheffler, M. Accurate Molecular Van Der Waals Interactions from Ground-State Electron Density and Free-Atom Reference Data. Phys. Rev. Lett. 2009, 102, 073005. [Google Scholar] [CrossRef] [PubMed]
- Grimme, S. Semiempirical GGA-type density functional constructed with a long-range dispersion correction. J. Comput. Chem. 2006, 27, 1787–1799. [Google Scholar] [CrossRef] [PubMed]
- Ambrosetti, A.; Reilly, A.M.; DiStasio, R.A., Jr.; Tkatchenko, A. Long-range correlation energy calculated from coupled atomic response functions. J. Chem. Phys. 2014, 140, 18A508. [Google Scholar] [CrossRef] [PubMed]
- Hammer, B.; Hansen, L.B.; Nørskov, J.K. Improved adsorption energetics within density-functional theory using revised Perdew–Burke–Ernzerhof functionals. Phys. Rev. B 1999, 59, 7413–7421. [Google Scholar] [CrossRef]
- Perdew, J.P.; Chevary, J.A.; Vosko, S.H.; Jackson, K.A.; Pederson, M.R.; Singh, D.J.; Fiolhais, C. Atoms, molecules, solids, and surfaces: Applications of the generalized gradient approximation for exchange and correlation. Phys. Rev. B 1992, 46, 6671–6687. [Google Scholar] [CrossRef]
- Ortmann, F.; Bechstedt, F.; Schmidt, W.G. Semiempirical van der Waals correction to the density functional description of solids and molecular structures. Phys. Rev. B 2006, 73, 205101. [Google Scholar] [CrossRef]
- Wu, Z.; Cohen, R.E. More accurate generalized gradient approximation for solids. Phys. Rev. B 2006, 73, 235116. [Google Scholar] [CrossRef]
- Perdew, J.P.; Ruzsinszky, A.; Csonka, G.I.; Vydrov, O.A.; Scuseria, G.E.; Constantin, L.A.; Zhou, X.; Burke, K. Restoring the Density-Gradient Expansion for Exchange in Solids and Surfaces. Phys. Rev. Lett. 2008, 100, 136406. [Google Scholar] [CrossRef]
- Becke, A.D. Density-functional exchange-energy approximation with correct asymptotic behavior. Phys. Rev. A 1988, 38, 3098–3100. [Google Scholar] [CrossRef]
- Lee, C.; Yang, W.; Parr, R.G. Development of the Colle-Salvetti correlation-energy formula into a functional of the electron density. Phys. Rev. B 1988, 37, 785–789. [Google Scholar] [CrossRef] [PubMed]
- Bartók, A.P.; Yates, J.R. Regularized SCAN functional. J. Chem. Phys. 2019, 150, 161101. [Google Scholar] [CrossRef]
- Baroni, S.; de Gironcoli, S.; Dal Corso, A.; Giannozzi, P. Phonons and related crystal properties from density-functional perturbation theory. Rev. Mod. Phys. 2001, 73, 515–532. [Google Scholar] [CrossRef]
- Arias, T.A.; Payne, M.C.; Joannopoulos, J.D. Ab initio molecular dynamics: Analytically continued energy functionals and insights into iterative solutions. Phys. Rev. Lett. 1992, 69, 1077–1080. [Google Scholar] [CrossRef] [PubMed]
- Cameron, A.F.; Duncanson, F.D. Refinement of sulphamic acid. Acta Crystallogr. Sect. B Struct. Sci. 1976, 32, 1563–1564. [Google Scholar] [CrossRef]
- Osaki, K.; Tadokoro, H.; Nitta, I. Structure of Sulphamic Acid Molecule from a Three-dimensional Fourier Analysis. Bull. Chem. Soc. Jpn. 1955, 28, 524–528. [Google Scholar] [CrossRef]
- Szeleszczuk, Ł.; Mazurek, A.H.; Milcarz, K.; Napiórkowska, E.; Pisklak, D.M. Can We Predict the Isosymmetric Phase Transition? Application of DFT Calculations to Study the Pressure Induced Transformation of Chlorothiazide. Int. J. Mol. Sci. 2021, 22, 10100. [Google Scholar] [CrossRef]
- Mazurek, A.; Szeleszczuk, Ł.; Pisklak, D.M. Can We Predict the Pressure Induced Phase Transition of Urea? Application of Quantum Molecular Dynamics. Molecules 2020, 25, 1584. [Google Scholar] [CrossRef]
- Cruz-Cabeza, A.J.; Reutzel-Edens, S.M.; Bernstein, J. Facts and fictions about polymorphism. Chem. Soc. Rev. 2015, 44, 8619–8635. [Google Scholar] [CrossRef]
Disclaimer/Publisher’s Note: The statements, opinions and data contained in all publications are solely those of the individual author(s) and contributor(s) and not of MDPI and/or the editor(s). MDPI and/or the editor(s) disclaim responsibility for any injury to people or property resulting from any ideas, methods, instructions or products referred to in the content. |
© 2025 by the authors. Licensee MDPI, Basel, Switzerland. This article is an open access article distributed under the terms and conditions of the Creative Commons Attribution (CC BY) license (https://creativecommons.org/licenses/by/4.0/).