Article

Influence of Structural Parameters on Deformation Behavior of Metal Rhombic Chain Mesh

1
College of Ocean and Civil Engineering, Dalian Ocean University, Dalian 116023, China
2
Key Laboratory of Facility Fisheries, Ministry of Education, Dalian Ocean University, Dalian 116023, China
*
Author to whom correspondence should be addressed.
Appl. Sci. 2025, 15(8), 4144; https://doi.org/10.3390/app15084144
Submission received: 19 February 2025 / Revised: 29 March 2025 / Accepted: 3 April 2025 / Published: 9 April 2025

Abstract

:
Metal net cages, with their wave resistance, corrosion resistance, and anti-fouling properties, have gained attention as promising ecological aquaculture systems. The deformation of netting directly affects the effective culture volume under load. This study aims to explore the deformation resistance of metal diamond chain netting and the impact of structural parameters on its deformation characteristics. Using beam and contact elements, this study employs finite element analysis (FEA) to simulate static deformation and validate the model with experimental results. Simulations under various structural parameters were performed to assess the effects of netting solidity and initial tension on bending deformation under concentrated and distributed loads. The results show that both increased solidity and initial tension lead to enhanced bending stiffness and reduced deformation. Specifically, increasing netting solidity from 0.11 to 0.29 reduces displacement by 53.07% and 68.68%, respectively, and force by 71.89% and 41.55%. Similarly, increasing initial tension from 200 N to 300 N results in minor reductions in displacement (3.48% and 3.52%). This study concludes that netting solidity has a more significant effect on deformation than initial tension, which aligns with the experimental results showing greater reductions in displacement and wire force with increasing solidity. These findings support the model’s validity and offer guidance for metallic netting design.

1. Introduction

Metal diamond netting is widely utilized in aquaculture for constructing various types of fish cages, providing a relatively enclosed and secure cultivation space for aquatic organisms, thereby facilitating large-scale, intensive fishery production modes. With the continuous expansion of marine aquaculture, China’s coastal cage farming faces serious challenges including insufficient cultivation space, severe water pollution, and poor product quality. To achieve green, high-quality, and sustainable development of marine fisheries, it is urgent to adopt efficient, environmentally friendly, and economically viable fishing methods [1,2,3]. Netting, as the primary component of aquaculture cages, directly influences the cultivation water volume through its deformation resistance capacity. Compared to traditional flexible fiber netting, metal netting exhibits superior characteristics, including minimal deformation under wind, wave, and current loads, anti-fouling properties, and low environmental impact [4], showing promising prospects for widespread application. As mariculture advances into deeper and more remote ocean areas, aquaculture systems are increasingly subjected to complex and harsh marine loading conditions. Traditional flexible nettings are becoming inadequate in ensuring structural stability and fatigue resistance under such environments. In contrast, metallic nettings, with their superior resistance to deformation, corrosion, and biofouling, have emerged as a promising solution for next-generation deep-sea ecological cages. To enhance the structural safety and service life of these systems, it is essential to systematically investigate the mechanical response and deformation behavior of metallic nettings under varying structural parameters. Such research holds significant practical and engineering value in promoting the green, efficient, and sustainable development of offshore aquaculture.
Research on the hydrodynamic characteristics of aquaculture netting has primarily focused on flexible fiber netting, encompassing studies on netting drag coefficients [5,6,7,8,9], model test similarity criteria [10,11,12,13], hydrodynamic characteristics under wave–current interactions [14,15,16], and systematic hydrodynamic studies of entire aquaculture cages’ resistance to wind, waves, and currents [17,18]. In recent years, with the successful demonstration and application of metal netting, domestic and international scholars have conducted extensive research on the hydrodynamic characteristics and wind–wave resistance of metal cages. Drach et al. [19] established a finite element model of copper alloy diamond chain netting using solid elements to analyze stress conditions at connection points under static loading. Cha et al. [20] employed PIV (Particle Image Velocimetry) to study copper alloy chain netting drag coefficients under different flow directions, comparing them with fiber netting drag coefficients to conclude the correlation between surface roughness and drag coefficients. Tsukrov et al. [21] developed a hydrodynamic response model for netting panels under wave and current environmental loads based on empirical force equations using an equivalent net surface method. Yuan Guiyang et al. [22] applied vertical loading to bound-connected metal diamond and cross nets, concluding that diamond nets bear axial forces in an “X”-shaped pattern centered at the middle, while warp and weft nets bear forces in a cross-shaped pattern. Liu Hangfei et al. [23] modeled metal netting as beam elements based on finite element principles, discussing the relationship between netting forces under water flow, mesh size, and wire diameter. Chen Changping et al. [24] calculated metal netting drag forces under water flow using the Gauss–Seidel coupling method, examining the relationship between netting forces, mesh size, and wire diameter. Wu et al. [25] investigated the drag and lift characteristics of rigid metal meshes with different structures under varying flow velocities and angles of attack through flume experiments and proposed corresponding hydrodynamic models. Fan et al. [26] reviewed recent advances in the study of netting hydrodynamics, highlighting the high stiffness and anti-fouling properties of metal meshes, and outlined future directions for net–current interaction research. Yu et al. [27] conducted flume experiments to determine that the drag on rigid metal meshes is significantly influenced by twine diameter, mesh size, flow velocity, and incident angle and provided corresponding calculation formulas.
Studies of the hydrodynamic characteristics of metal netting remain relatively limited, yet studying the force-bearing characteristics of metal netting is fundamental to the rational and efficient development of metal cage aquaculture facilities. This paper focuses on a three-dimensional diamond metal chain netting structure, employing beam elements to simulate netting strands and contact elements to simulate wire interactions at connection points using the finite element method. The accuracy and feasibility of the numerical method for metal netting are validated through an experimental apparatus and testing methodology proposed in this paper, which accounts for pretension effects. Building upon this foundation, numerical simulations are conducted on the metal diamond chain netting structure across 108 working conditions, considering five parameters: load distribution, load magnitude, pretension, mesh size, and wire diameter. Deformation results are obtained from 23 measuring points under various conditions, and the influence patterns of netting solidity and initial tension on the bending deformation of metal diamond chain netting are investigated. These findings aim to provide a basis for further structural optimization and the design of metal fishing cages used in marine aquaculture.

2. Materials and Methods

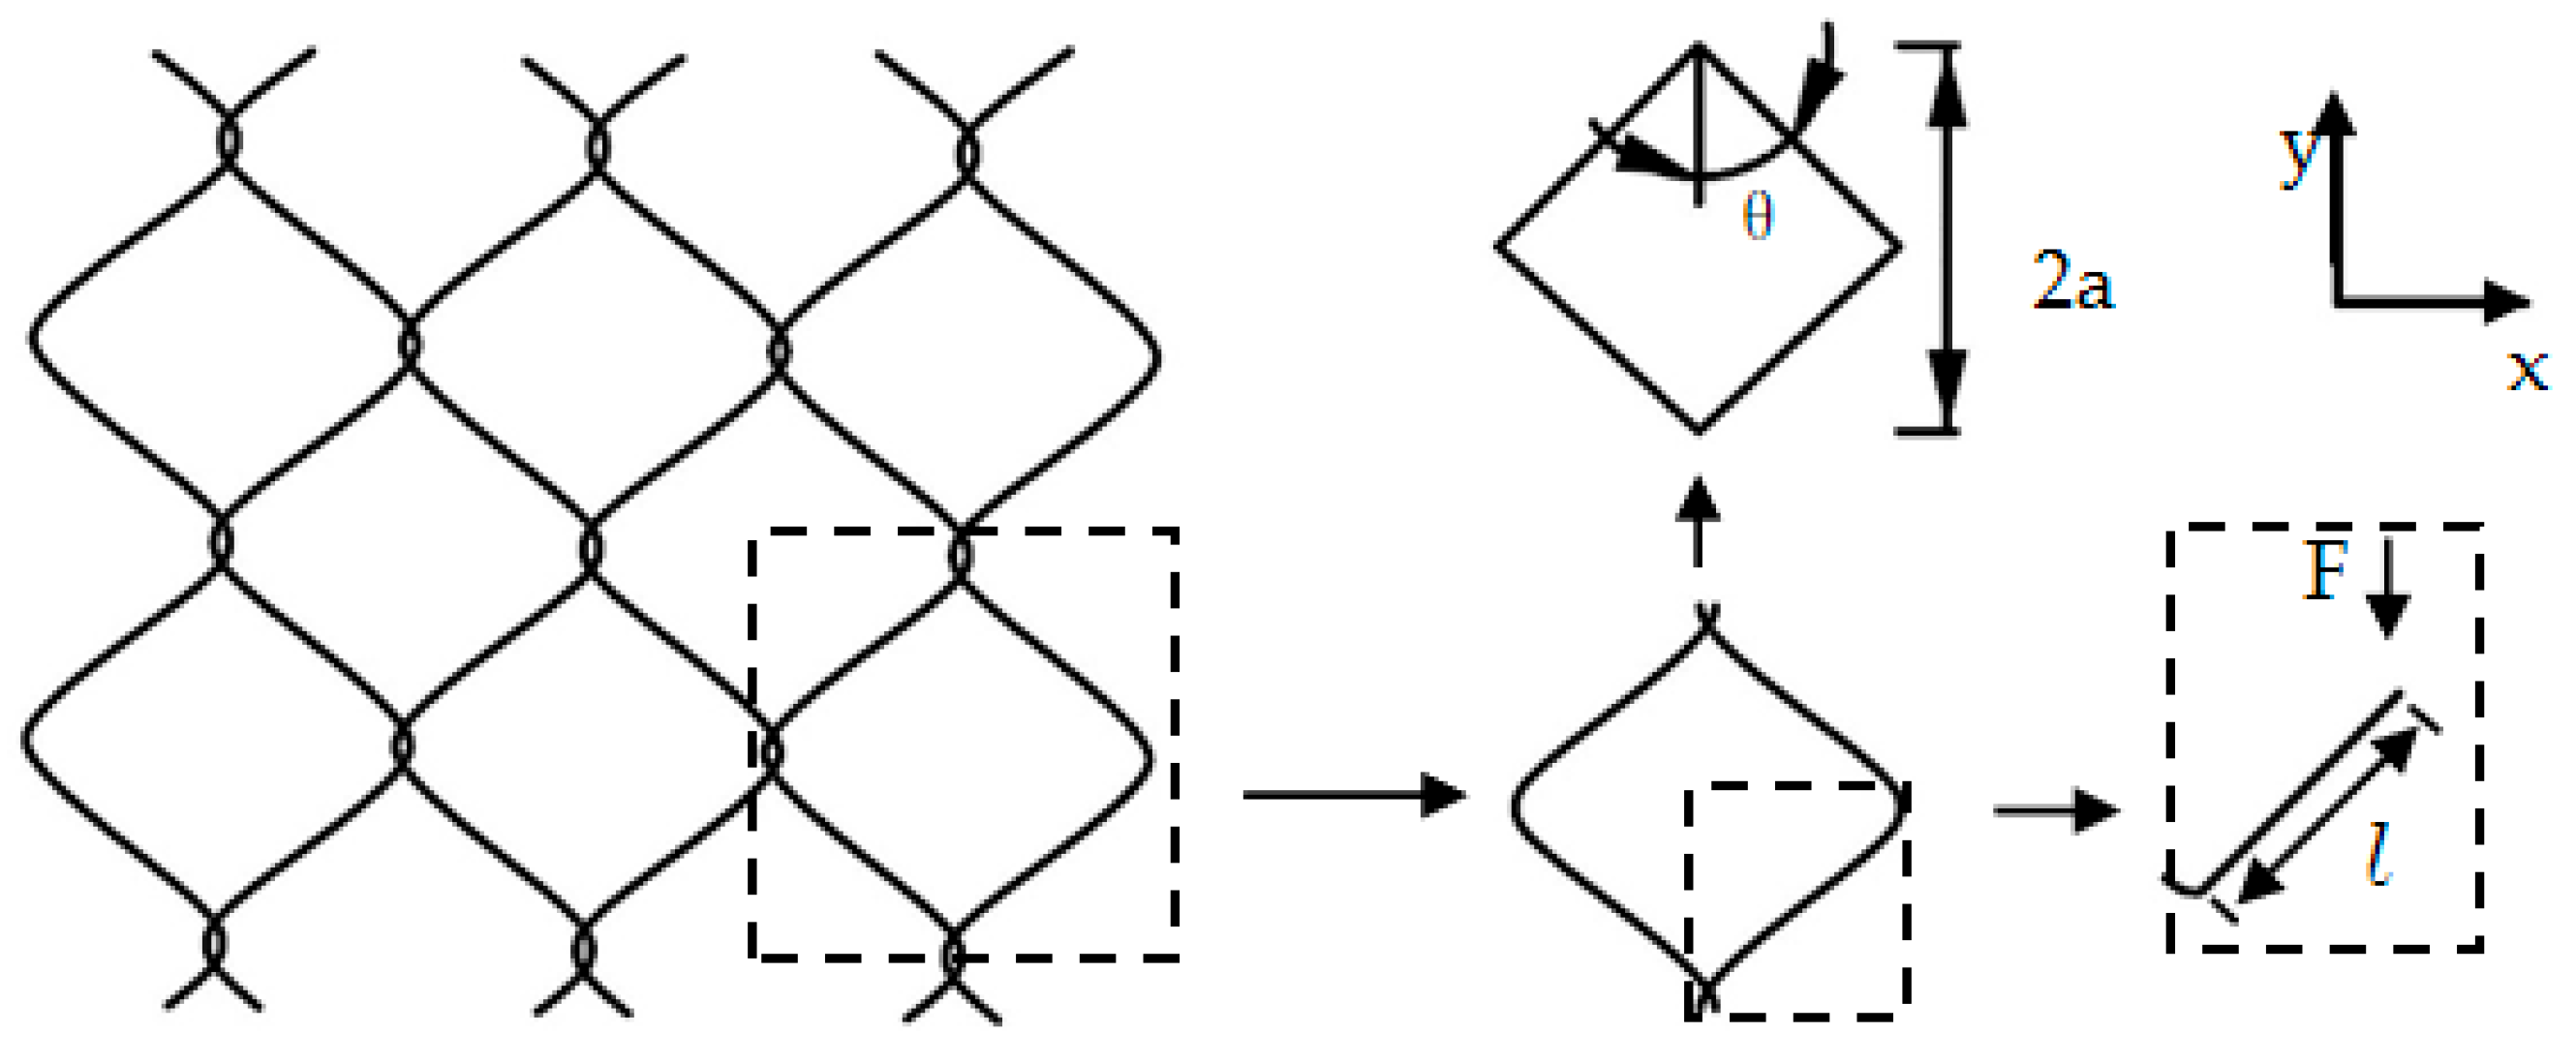
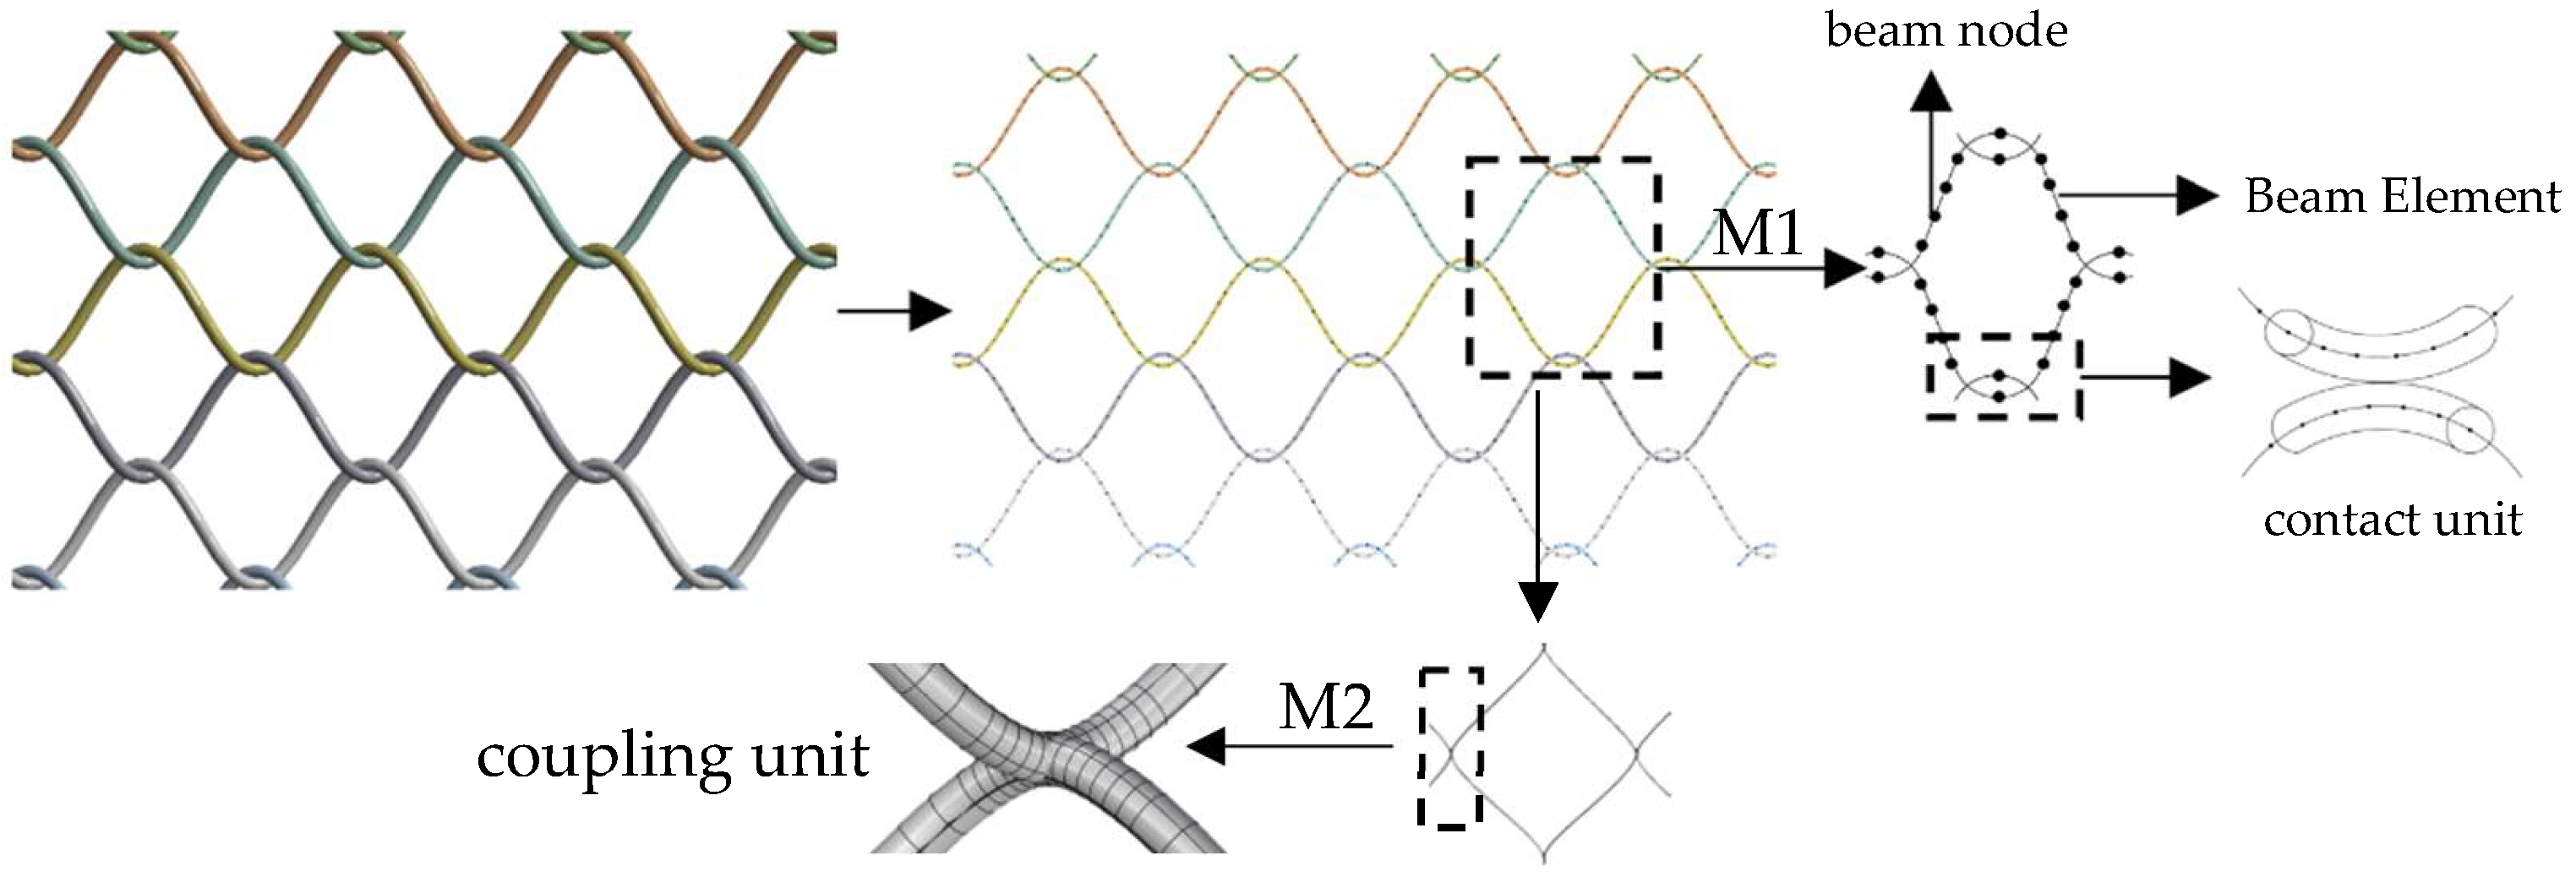
2.1. Numerical Model of Metal Netting

Metal diamond chain netting is a three-dimensional porous structure with small-diameter wires, formed by interlacing and combining multiple spirally curved metal wires. It represents one of the most widely used netting types in aquaculture cages. Chain netting is typically arranged and installed along the x-direction according to metal wire length. This assembly configuration provides a certain bending resistance, which helps reduce netting deformation, as shown in Figure 1.
To analyze the bending deformation capability of chain netting, we first examine the strain energy generated by the deformation of a single mesh in the metal netting. An imaginary force F is applied to one half of a mesh unit, with the other end being rigidly fixed. The total strain energy U comprises deformation energies from bending, shearing, torsion, and axial deformation. Since axial and shear forces are significantly smaller than bending and torsional moments, the strain energy U can be approximated as the sum of deformation energies from bending and torsional moments.
U T o t a l = 0 L M 2 x 2 E I z z d x + 0 L T 2 x 2 G J 0 d x
M T o t a l = 0 L M 2 x 2 E I z z d x = F 2 c o s 2 θ 0 l c o s θ x 2 d x 2 E I z z = F 2 l 3 c o s 5 θ 6 E I z z
T T o t a l = 0 L T 2 x 2 G J 0 d x = F 2 0 l c o s θ x 2 d x 2 E × 2 1 + ν J 0 = F 2 l c o s θ 3 1 + ν 3 E J 0
where x represents the distance along the warp direction; L is the total length of metal wire along the warp direction; M denotes the bending moment; T represents the torsional moment; E is Young’s modulus; G is the shear modulus; I z z is the moment of inertia; and J 0 is the polar moment of inertia. Assuming linear elastic behavior, the total strain energy can be described as follows:
U T o t a l = M T o t a l + T T o t a l = F 2 l cos θ 3 6 E 2 1 + v J 0 + cos 2 θ I z z
where ν is Poisson’s ratio. The definitions of θ and l are shown in Figure 1.
I e q = 2 1 + v J 0 + cos 2 θ I z z 1
The equivalent moment of inertia of the mesh wire cross-section represents the bending resistance capacity of the netting. It can be observed that the bending stiffness depends on the wire diameter, material Poisson’s ratio, and netting weaving angle.
The numerical simulation of the metal planar netting structure is conducted in ANSYS Workbench 2022 using the finite element method. To analyze the influence of different mechanical models at chain netting nodes on netting deformation, two modeling approaches—node coupling and contact connection—are established to simulate wire interactions at connection points. The element types and local mesh divisions for both models are shown in Figure 2. The physical model of the metal netting is created using Rhino 8.0 software and imported into ANSYS for numerical simulation.
The node coupling model (M1) considers two adjacent nodes at the metal wire connection points as coupled into a single node, representing a connection model where nodes neither separate nor slip, and is simulated using beam elements in ANSYS. The contact connection model (M2) considers the mutual contact pressure between connecting nodes and is simulated using solid elements in ANSYS. The contact boundary problem between two adjacent nodes in metal netting connections with solid contact constraints can be described as finding the displacement field X within the region that minimizes the system’s potential energy under contact boundary conditions, expressed as follows:
Π X = 1 2 X T K X X T F s . t . Δ 0
where K, X, and F represent the stiffness matrix, unknown nodal displacement vector, and nodal load vector in the finite element displacement method, respectively, as well as the penetration amount between two bodies. This constrained optimization problem can be transformed into an unconstrained optimization problem by appropriately processing the contact boundary conditions through contact constraint algorithms. The penalty function method for unconstrained optimization assumes a “spring” relationship between contact surfaces. This contact model allows for certain penetration between contact and target surfaces, coordinating force and deformation through contact stiffness (spring). The contact stiffness and contact penetration constitute a penalty function, which is incorporated into our model, as shown in Figure 3, with the penalty function defined as follows:
F N = K N X
where FN is the contact pressure between contact surfaces, KN is the contact stiffness between two contact surfaces (appropriate values range from 0.01 to 0.2 for bending-dominated problems), and X is the penetration amount between two contact surfaces.
Contact stiffness significantly affects the convergence of the penalty function method. This issue can be resolved by introducing a constant term, resulting in the modified penalty function:
F N = K N X + λ
The constant term λ is formed through certain strategies and does not require manual setting. This additional constant term reduces the sensitivity of contact forces to contact stiffness, thereby enhancing convergence. The element stiffness matrix established for simulating wire contact at netting nodes is a nonlinear element stiffness matrix, which can be solved iteratively using the Newton–Raphson method.

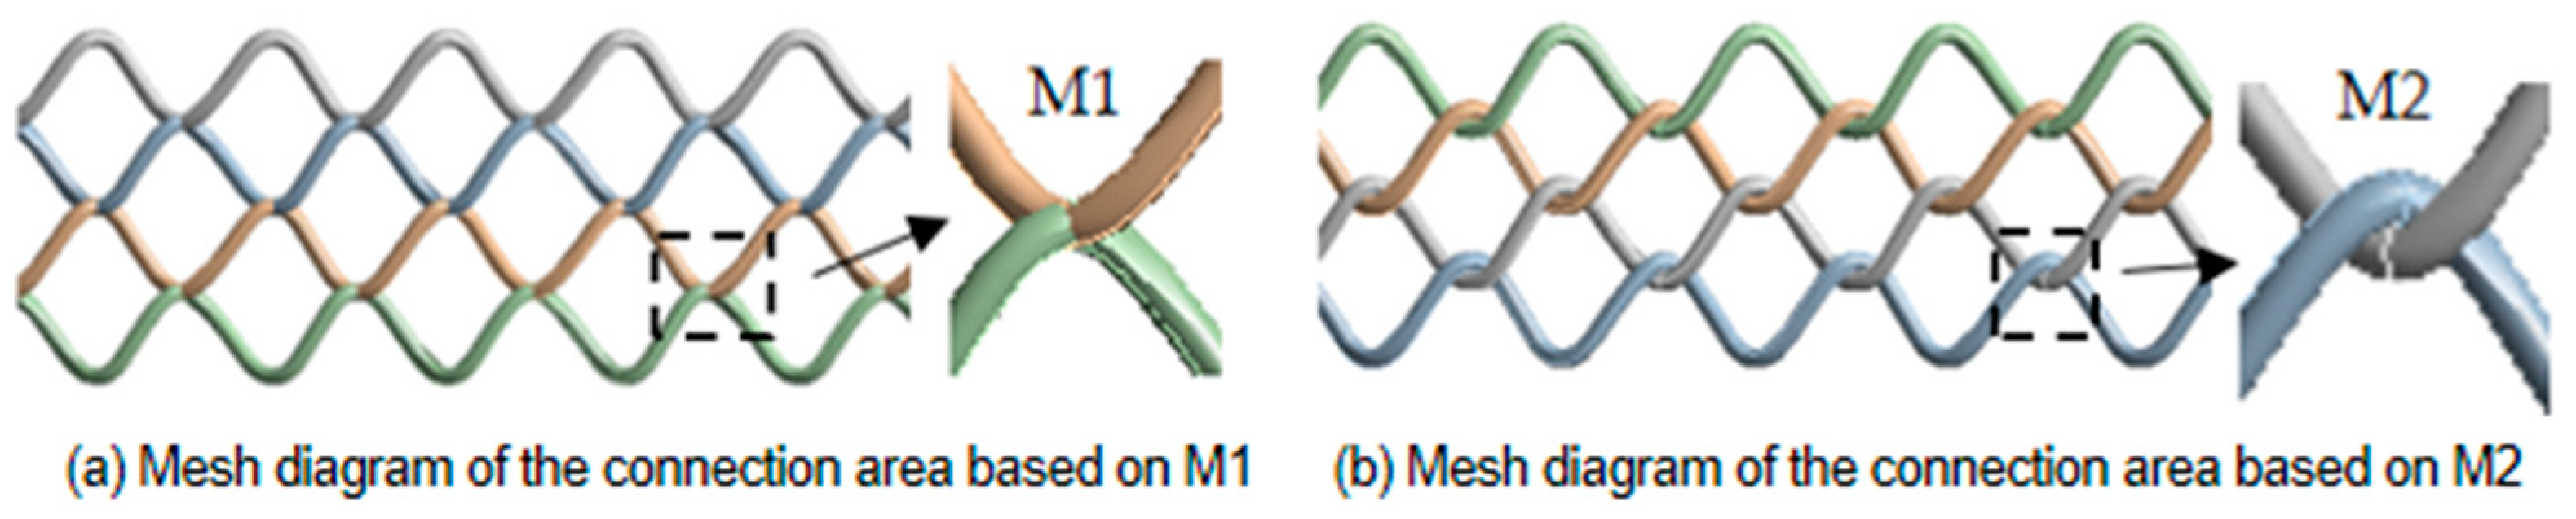
2.2. Analytical Method Validation

To analyze the effectiveness of different numerical models, Judson’s [25] four-point bending beam case is selected as an example, with the material and geometric parameters of the metal netting shown in Table 1. The beam has a support span of 0.75 m, with loading points located 0.125 m from both ends. Table 2 presents comparative results of maximum netting deformation under a 4 N mid-span load, comparing the analytical method [25], node coupling model (M1), and contact connection model (M2), where the metal netting force model is abstracted as a four-point bending beam.
The M1 netting element and local mesh division are shown in Figure 4a, while the M2 netting element is shown in Figure 4b, with a total of 141,456 elements and 106,020 nodes.
δ = F a 48 E I e q 3 L 2 4 a 2
As shown in Table 2, the numerical simulation results from both M1 and M2 models align with Judson’s analytical values in terms of their variation trends. Under three working conditions, the maximum errors for M1 and M2 numerical simulations are 6.7% and 5.43%, respectively. When calculating netting deformation, factors such as friction between metal chain netting wires and small displacements also influence the experimental deformation results. The comparison of the results indicates that the M2 model simulates metal netting deformation under external forces with greater precision than the M1 model. This demonstrates that using M2 to simulate contact interactions between metal netting wires offers the advantages of lower computational cost while maintaining higher calculation accuracy, thus effectively meeting the computational requirements for metal netting deformation.

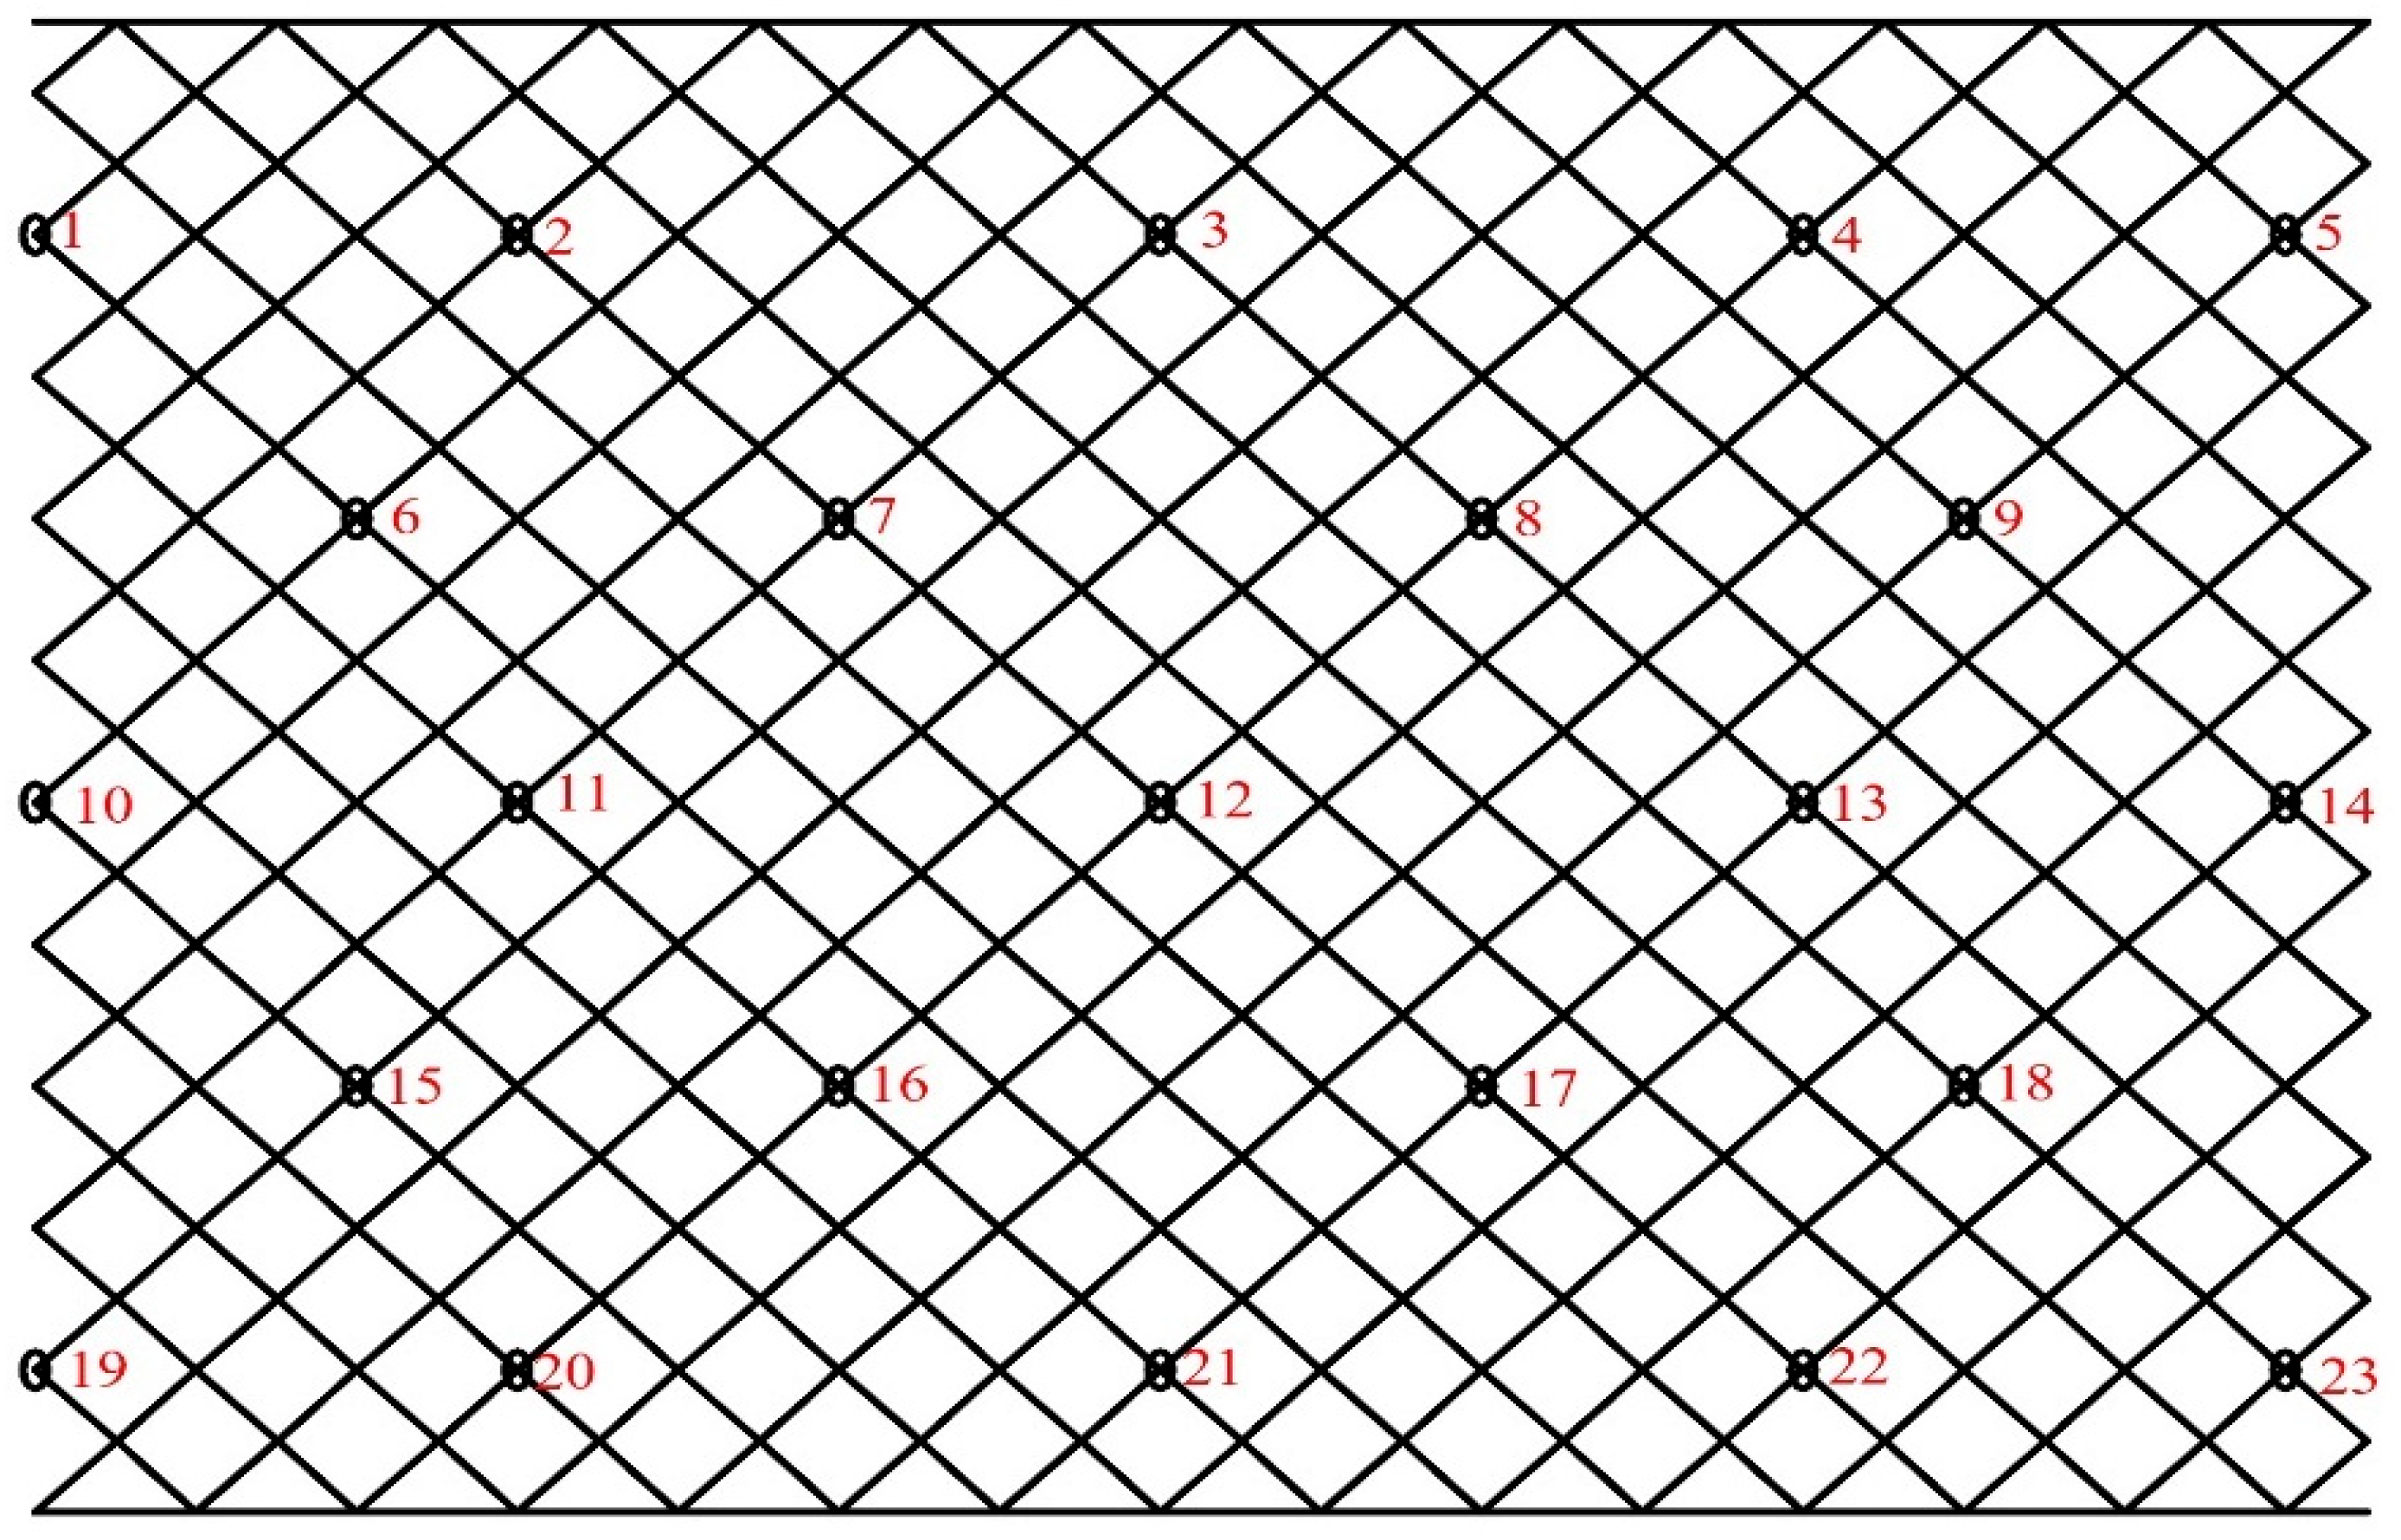
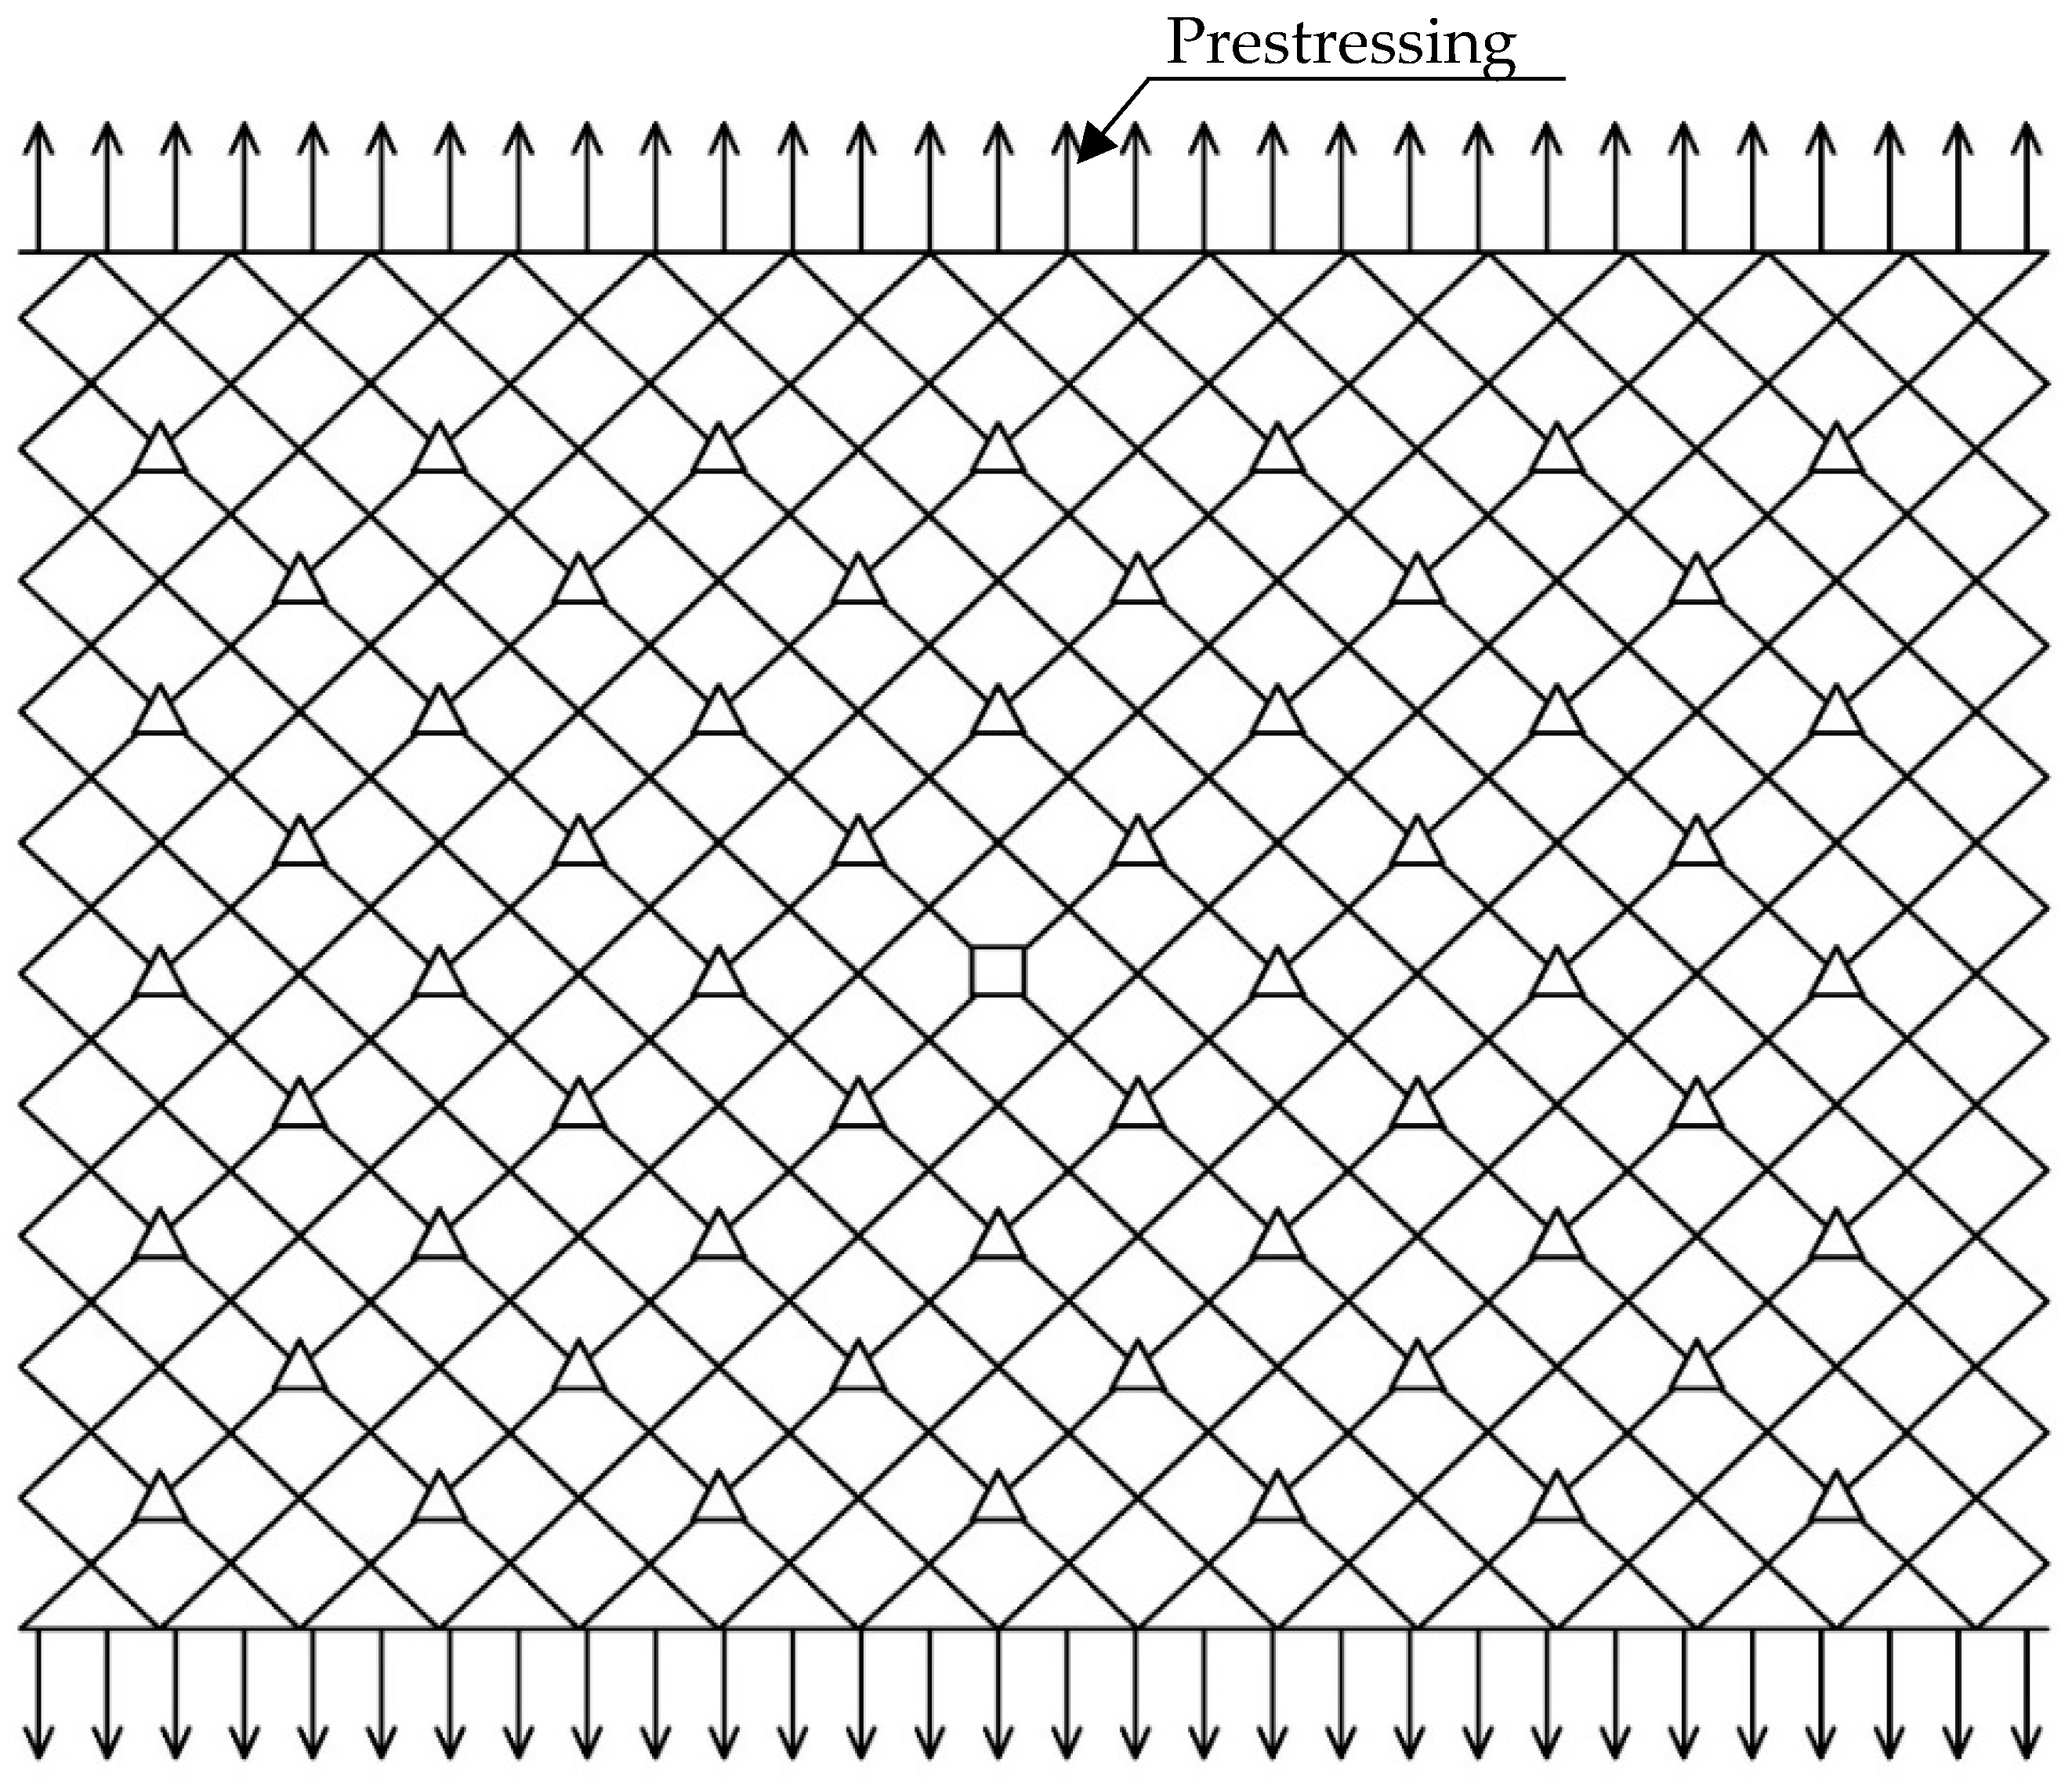
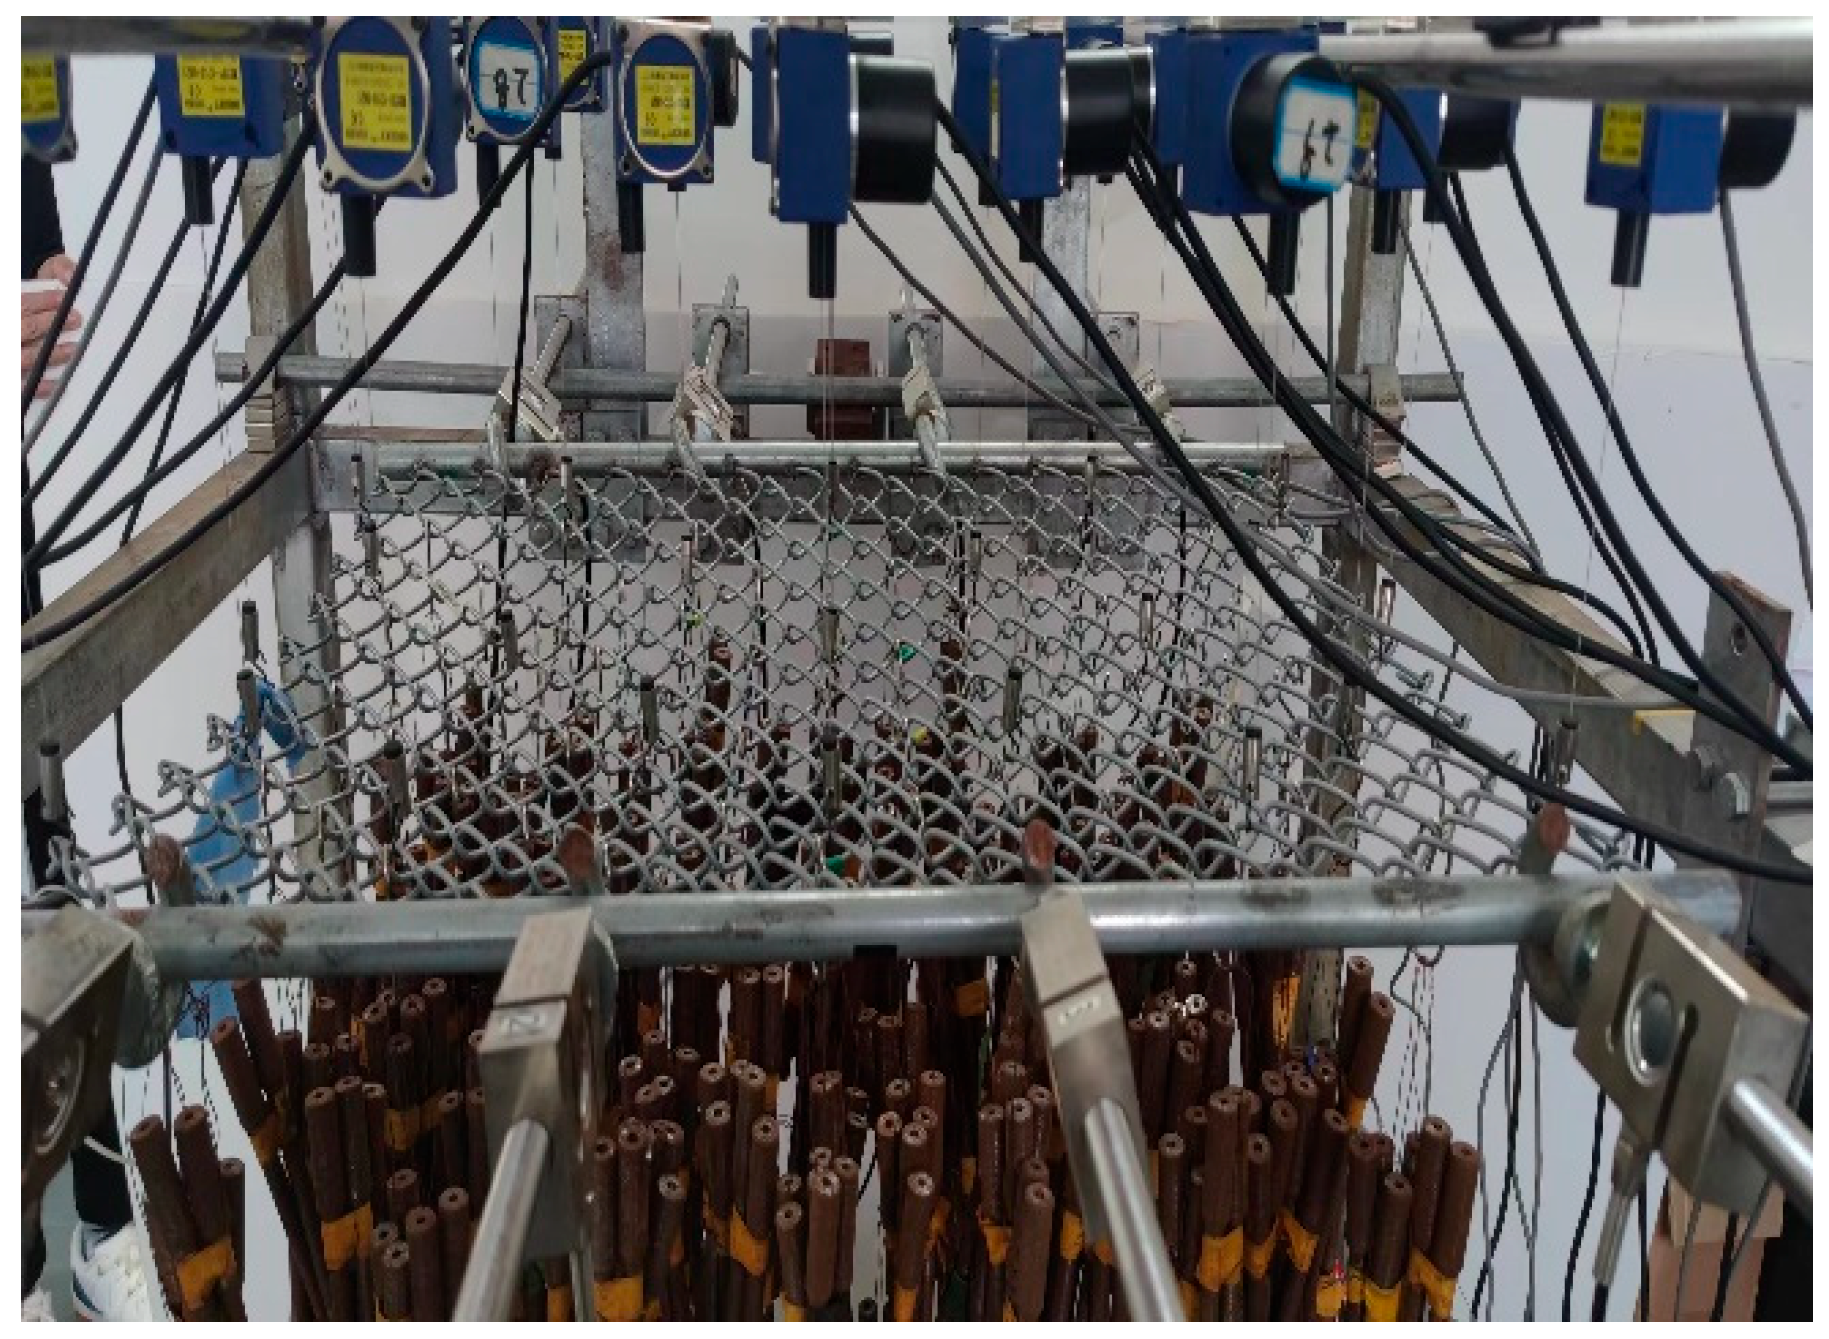
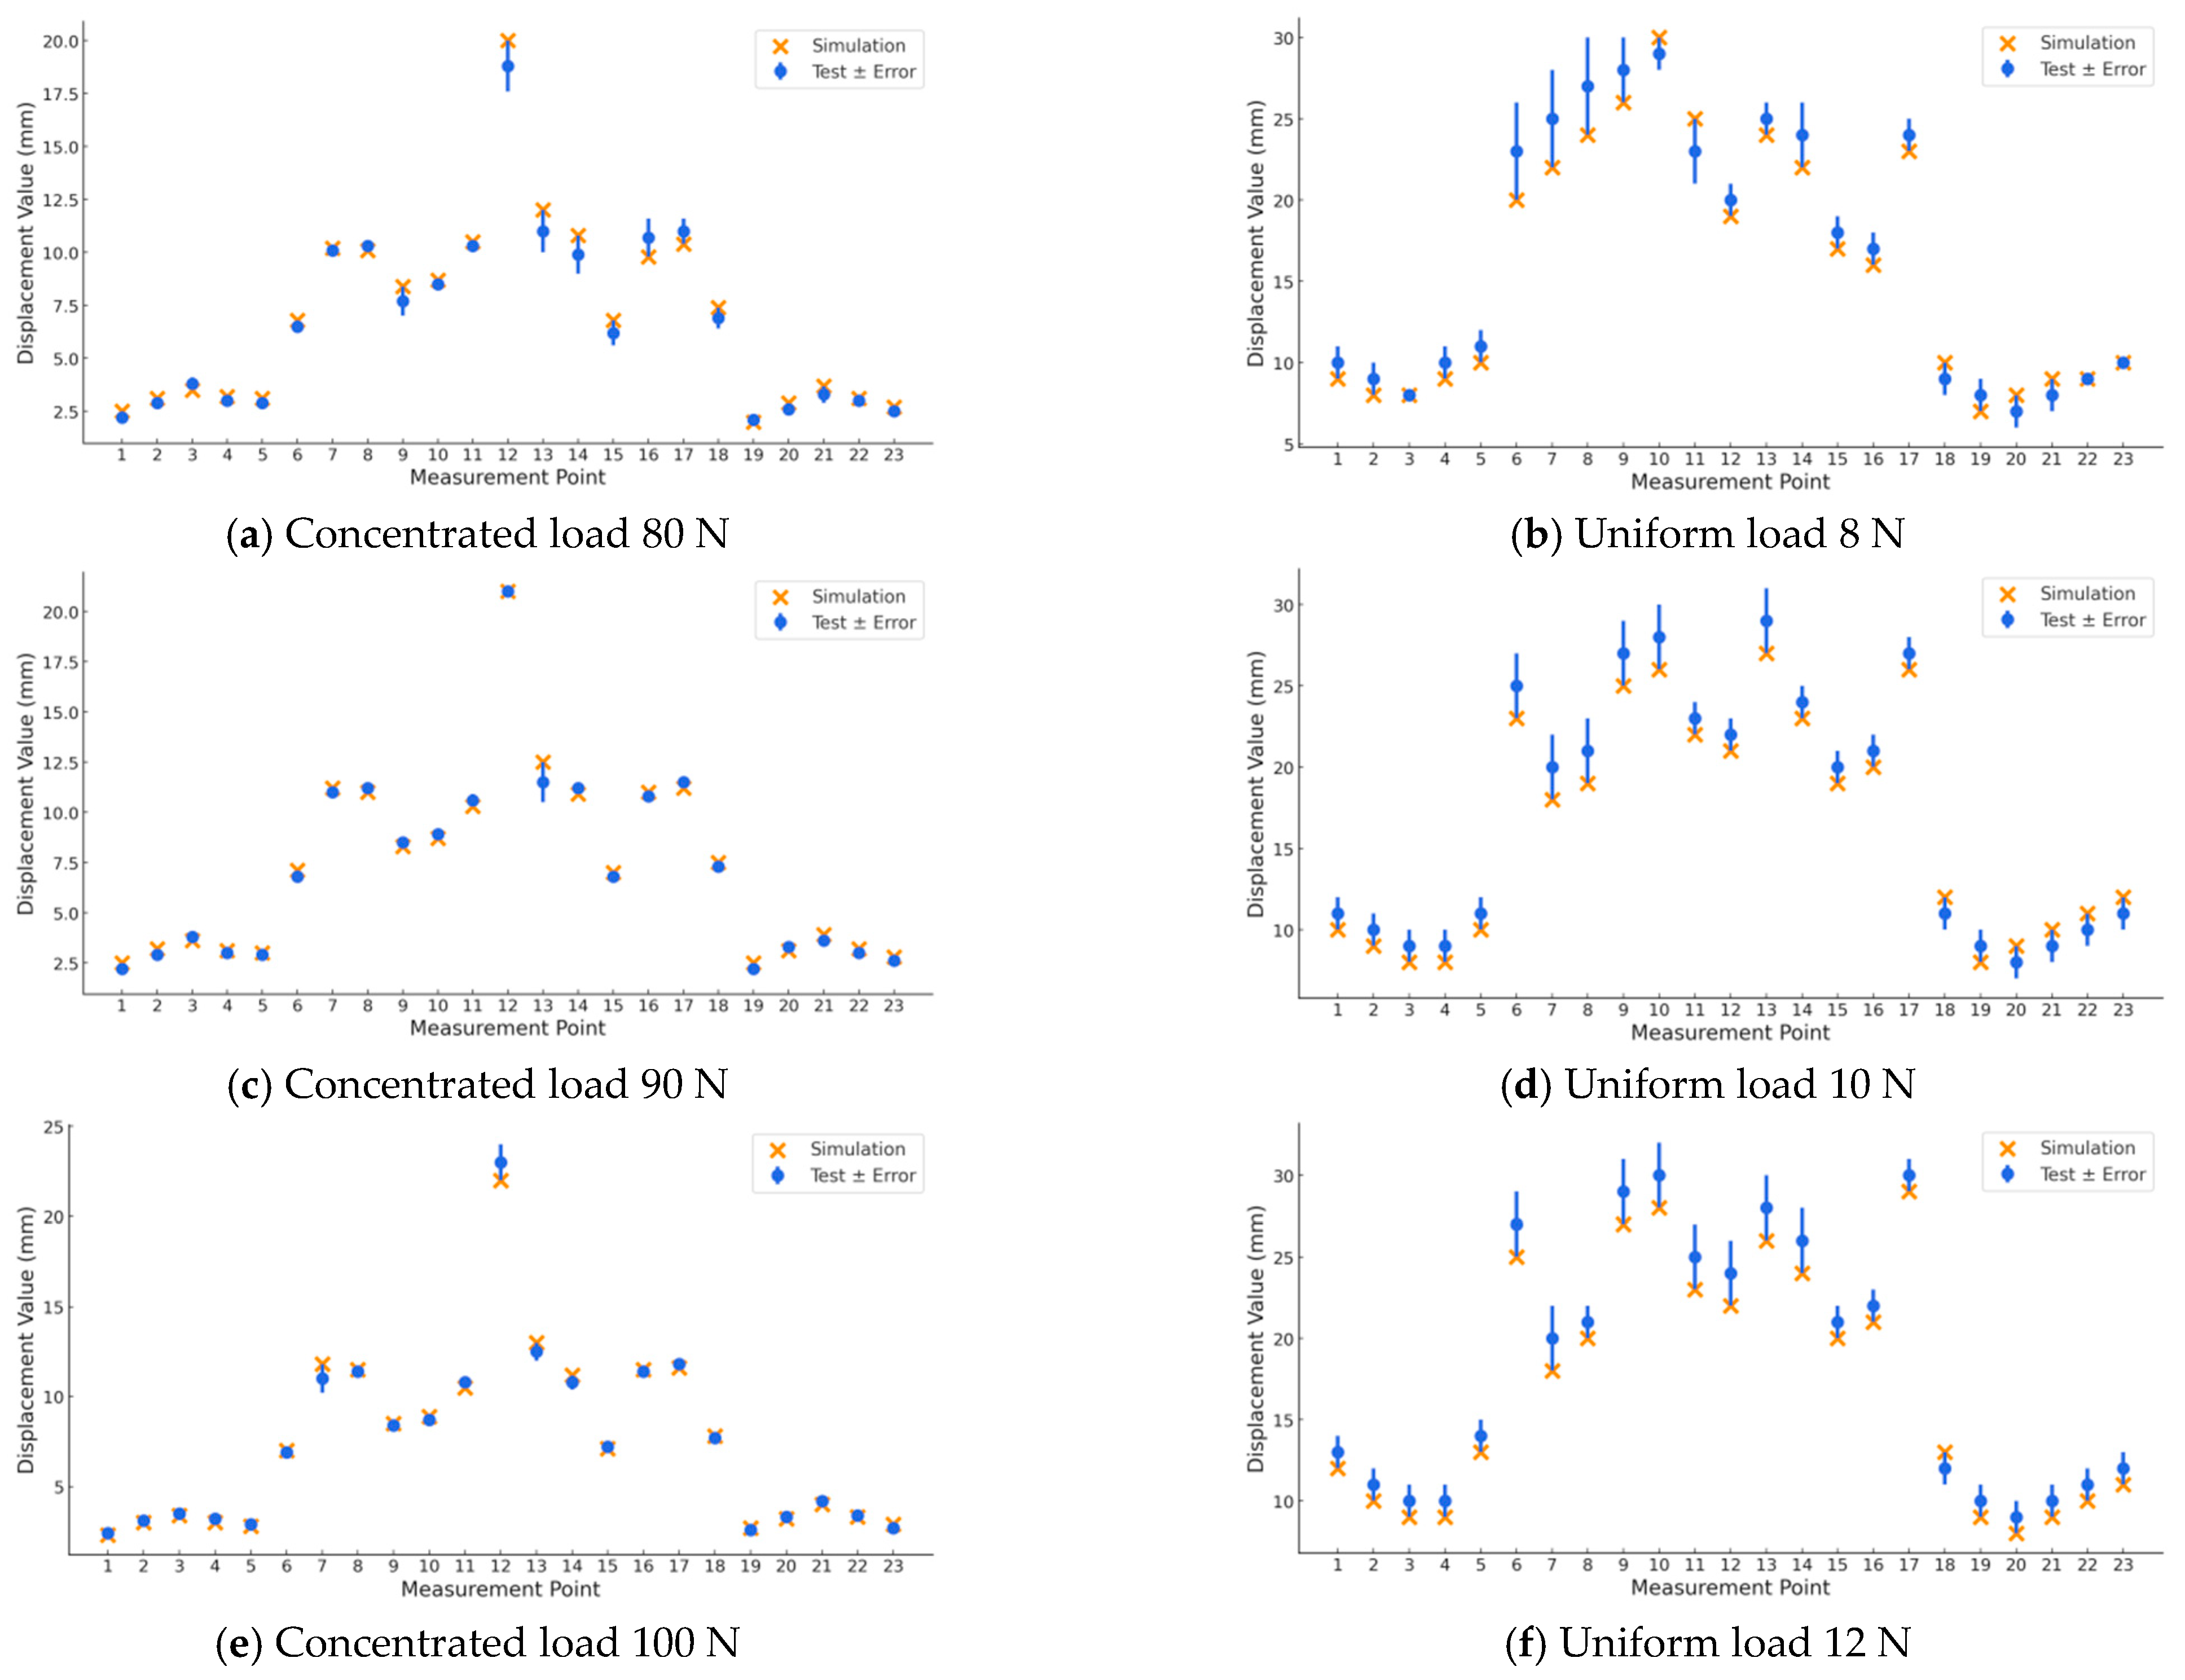
2.3. Model Test Validation

To validate the effectiveness of the numerical simulation method considering pretension effects, a testing apparatus and methodology incorporating pretension effects were designed. The test netting measured 770 mm × 570 mm, with a wire diameter of 3.2 mm and a mesh size of 53 mm for the metal chain netting. The netting material had an elastic modulus of 193 GPa and a density of 6300 kg/m3. To ensure uniform force transmission, angle steel of 40 mm × 40 mm × 4 mm was selected for the test frame. Pretension was applied unidirectionally with four tension points on each side, with tension forces measured through force sensors. The chain netting was tested under five initial pretension (FT) conditions: 200 N, 250 N, 300 N, 350 N, and 400 N; four concentrated load (FN) conditions: 80 N, 90 N, 100 N, and 110 N; and four distributed load (FD) conditions: 8 N, 9 N, 11 N, and 12 N. Both concentrated and distributed loads were applied statically by hanging mass blocks at chain netting nodes. Wire displacement at measurement points was measured using a WXY80 wire-pull current pulse displacement sensor, as shown in Figure 5.
The metal netting was configured with 1 concentrated load point and 59 distributed load points, as shown in Figure 6, and 23 vertical displacement measurement points, as shown in Figure 7. All loads were applied perpendicular to the netting plane, with load application points and displacement measurement points illustrated in Figure 8.
Figure 9 presents the validation of the numerical simulation against the experimental results for vertical displacements at 23 measurement points under concentrated and distributed loads. During testing, the initial chain netting pretension (FT) was 200 N, with concentrated loads (FN) of 80 N, 90 N, and 100 N, and distributed loads (FD) of 8 N, 10 N, and 12 N. The vertical displacement refers to the change in vertical direction measured by wire-pull displacement sensors after load stabilization.
As shown in Figure 9, under the initial tension of 200 N, the vertical displacement trends at various measurement points in the numerical simulation results closely match the experimental results for both concentrated and distributed loads. Comparing the simulation results with experimental data, the maximum displacement errors under concentrated and distributed loads are 6.70% and 5.65%, respectively, with average relative errors of 6.07% and 4.86%. The comparison of netting simulation data demonstrates that this numerical simulation method effectively simulates metal netting deformation under external forces, thereby validating the effectiveness of the numerical model in this study. This further confirms that using the M2 model to simulate contact interactions between metal netting wires offers the advantages of a lower computational cost while maintaining a higher calculation accuracy, effectively meeting the computational requirements for metal netting deformation.

3. Results

The solidity Sn represents the ratio of wire projection area to the overall netting projection area. In netting structural design, changes in wire diameter and mesh size both lead to variations in netting solidity, directly affecting netting force distribution and deformation. As a crucial parameter in hydrodynamic calculations of netting, the solidity calculation is shown in Equation (10).
S n = 2 d l d l 2
Pretension involves pre-stretching the metal netting wires, utilizing this pre-stretch to generate static friction force between connected components through compression, thereby transmitting tension and deformation. To investigate the effects of netting solidity and initial pretension FT on netting deformation, numerical simulations were conducted under two loading conditions: concentrated loads of 60 N, 80 N, 100 N, 120 N, and 140 N and distributed loads of 6 N, 8 N, 10 N, 12 N, and 14 N, combined with three initial pretension conditions of 200 N, 250 N, and 300 N. The vertical displacement of the metal diamond chain netting was analyzed for three solidity values, which are shown in Table 3.

3.1. Effects of Solidity on Metal Netting Force and Deformation

Figure 10 illustrates the variations in the vertical displacement of netting with different solidities under concentrated and distributed loading conditions at an initial tension of 200 N. Figure 11 shows the changes in netting forces for different solidity values of metal netting under increasing concentrated and distributed loads with an initial tension of 200 N.

3.2. Effects of Initial Tension on Metal Netting Deformation

Figure 12 demonstrates the vertical displacement variations in metal netting with different initial tensions under changing concentrated and distributed loads at a solidity of 0.11. Figure 13 illustrates the deformation patterns of netting with different solidities under a concentrated load of 100 N and a distributed load of 10 N at an initial pretension of 200 N. Figure 14 shows the deformation patterns of netting with varying pretension under a concentrated load of 100 N and a distributed load of 10 N at a netting solidity of 0.11.
Under a solidity of 0.11, the vertical displacement of the chain net structure increases linearly with increasing concentrated and uniformly distributed loads. At the same load level, greater initial pretension results in smaller structural deformation. For example, under concentrated loading, when the initial pretension increases from 200 N to 300 N, the maximum vertical displacement decreases by approximately 3.52%, indicating that increased pretension enhances structural stiffness and provides a certain degree of deformation suppression.
When the initial pretension is held constant at 200 N, increasing the solidity from 0.11 to 0.29 leads to a significant reduction in overall chain net deformation, with maximum displacement reductions of 53.07% and 68.68%, respectively. These results demonstrate that solidity is a key parameter influencing the flexural stiffness of the metallic chain net, and its increase can markedly improve deformation control performance.
A further comparison of deformation performance under different initial pretension levels reveals that, although increasing pretension reduces displacement at measurement points, the degree of improvement is significantly lower than that achieved through increased solidity. This indicates that initial pretension acts as a secondary adjustment factor in structural optimization. Overall, both solidity and initial pretension positively influence the performance of the chain net structure; however, solidity plays a more dominant role in enhancing structural stiffness and controlling deformation, making it the primary parameter governing the mechanical behavior of the metallic chain net.net deformation.

4. Discussion

Table 4 shows the reduction magnitude of vertical displacement at various points under the aforementioned conditions. The results indicate that netting solidity significantly influences the deformation of metal diamond chain netting. Overall, the vertical displacement at measurement points notably decreases with increasing netting solidity, showing similar trends under both concentrated and distributed load conditions, with the maximum displacement occurring at the central measurement point. Under identical initial pretension conditions, compared to the displacement at solidity 0.11, the average displacement reduction at measurement points for solidities of 0.17 and 0.29 is 53.07% and 86.38% under concentrated loads and 68.68% and 74.72% under distributed loads, respectively. This indicates an accelerating rate of displacement reduction with increasing netting solidity. Under identical solidity conditions, using the displacement at 200 N initial pretension as a reference, when initial pretension increases to 250 N and 300 N, the average reduction in vertical displacement at measurement points shows specific patterns. The results demonstrate that initial tension significantly affects metal diamond chain netting deformation, with measurement point displacements clearly decreasing as initial pretension increases. The average reductions in vertical displacement at measurement points are 3.48% and 8.07% under concentrated loads and 3.52% and 8.14% under distributed loads.
Table 5 presents the reduction magnitude of maximum force at measurement points when solidity increases to 0.17 and 0.29, using the maximum force at 0.11 solidity as a reference, under both concentrated and distributed loads. The results show that solidity significantly influences metal diamond chain netting deformation, with measurement point forces notably decreasing as solidity increases. Under an initial pretension of 200 N, for netting solidities of 0.17 and 0.29, the force reduction at measurement points is 71.89% and 85.03% under concentrated loads and 41.55% and 66.34% under distributed loads, respectively.
According to the static equilibrium equations considering friction, as netting solidity and initial pretension increase, the total contact area at diamond chain netting nodes increases, leading to higher contact pressure. This results in reduced relative displacement and rotation angles between wires and decreased measurement point displacements and forces. Consequently, the bending resistance of the diamond chain netting increases, with netting deformation decreasing as solidity increases and the bending resistance of metal diamond chain netting increasing with initial pretension.

5. Conclusions

This study investigated the deformation behavior of metallic rhombic chain netting under static loading conditions. A finite element numerical model incorporating beam elements and contact elements was developed using the Ansys platform. The effects of netting solidity and initial pretension on the structural performance of the chain net were thoroughly examined. Validation through comparison with experimental data demonstrated that the model achieved maximum displacement errors of 6.70% and 5.65% under concentrated and uniformly distributed loads, respectively. The deviation from the results reported in Reference [28] remained within 10%, indicating that within a certain deformation range, the proposed finite element model based on beam and contact connector elements can effectively simulate the deformation of netting structures while reducing computational workload.
Both netting solidity and initial pretension were found to significantly affect the deformation and internal forces of the metallic rhombic chain net. Increases in either parameter contributed to reduced deformation and enhanced structural stiffness. Among them, solidity showed a more pronounced influence. As the solidity increased from 0.11 to 0.29, the displacement at measurement points decreased at an accelerating rate, with the maximum reduction exceeding 68%. Moreover, the effect of solidity on wire forces was greater than that of pretension. Increasing netting solidity effectively reduced the tensile force in the wire elements, with the maximum reduction exceeding 70%, helping to alleviate local stress concentrations and improve overall structural stability.
The findings of this study provide theoretical support and practical reference for the structural design and assembly of metallic netting systems.

Author Contributions

Methodology, J.Y. and L.W.; Software, J.Y.; Validation, J.Y.; Formal analysis, J.Y.; Investigation, J.Y. and W.X.; Resources, W.X. and D.W.; Data curation, W.X. and D.W.; Writing—original draft, J.Y.; Writing—review & editing, W.X. and C.C.; Project administration, C.C.; Funding acquisition, C.C. All authors have read and agreed to the published version of the manuscript.

Funding

This research was funded by 1. National Key Research and Development Program, grant number 2024YFD2400200; 2. Liaoning Provincial Science and Technology Plan, grant number 2024-MSLH-045; 3. Liaoning Provincial Department of Education Project, grant number JYTM20230471.

Institutional Review Board Statement

Not applicable.

Informed Consent Statement

Not applicable.

Data Availability Statement

The original contributions presented in this study are included in the article. Further inquiries can be directed to the corresponding author.

Conflicts of Interest

The authors declare no conflicts of interest.

References

  1. Chu, Y.I.; Wang, C.M.; Park, J.C.; Lader, P.F. Review of cage and containment tank designs for offshore fish farming. Aquaculture 2020, 519, 734928. [Google Scholar] [CrossRef]
  2. Xu, Z.; Qin, H. Fluid-structure interactions of cage based aquaculture: From structures to organisms. Ocean Eng. 2020, 217, 107961. [Google Scholar] [CrossRef]
  3. Liao, J. Deep-water wind and wave-resistant net-pen aquaculture technology: Extending the ‘blue granary’ to the deep sea. Ocean. Fish. 2019, 9, 64–66. [Google Scholar]
  4. Nie, Z.W.; Wang, L.; Liu, Y.L.; Shi, J.G.; Min, M.H.; Yu, W.W.; Chen, X.X.; Wang, L.M. Development and application of fishery copper alloy netting. Mar. Fish. 2016, 38, 329–336, (In Chinese with English abstract). [Google Scholar]
  5. Song, W.; Liang, Z.; Chi, H.; Huang, L.; Zhao, F.; Zhu, L.; Chen, B. Experimental study on the effect of horizontal waves on netting panels. Fish. Sci. 2006, 72, 967–976. [Google Scholar] [CrossRef]
  6. Swift, M.R.; Fredriksson, D.W.; Unrein, A.; Fullerton, B.; Patursson, O.; Baldwin, K. Drag force acting on biofouled net panels. Trans. Chin. Soc. Agric. Eng. 2006, 35, 292–299. [Google Scholar] [CrossRef]
  7. Zhan, J.; Jia, X.; Li, Y.; Sun, M.; Guo, G.; Hu, Y. Analytical and experimental investigation of drag on nets of fish cages. Aquac. Eng. 2006, 35, 292–299. [Google Scholar] [CrossRef]
  8. Li, Y.; Gui, F. Study on the drag coefficient of nodeless plane fishing net. Acta Oceanol. Sin. 2006, 28, 145–151, (In Chinese with English abstract). [Google Scholar]
  9. Zhan, J.; Su, W.; Li, Y.; Jia, X.; Huang, W. Comparison of Drags on Fish Cages of Different Shapes. China Ocean. Eng. 2006, 20, 457–471. [Google Scholar]
  10. Fredriksson, D.W. Open Ocean Fish Cage and Mooring System Dynamics; University of New Hampshire: Durham, NH, USA, 2001. [Google Scholar]
  11. Lader, P.; Fredheim, A.; Lien, E. Dynamic behavior of 3D nets exposed to waves and current. In Proceedings of the 20th International Conference on Offshore Mechanics and Arctic Engineering, Rio de Janeiro, Brazil, 3–8 June 2001. [Google Scholar]
  12. Gui, F.K.; Li, Y.C.; Zhang, H.H. The Proportional Criteria for Model Testing of Force Acting on Fishing Cage Net. China Offshore Platf. 2002, 17, 22–25, (In Chinese with English abstract). [Google Scholar]
  13. Li, Y.C.; Gui, F.K.; Zhang, H.H.; Guan, C.T. Simulation criteria of fishing nets in aquiculture sea cage experiments. J. Fish. Sci. China 2005, 12, 179–187, (In Chinese with English abstract). [Google Scholar]
  14. Lader, P.F.; Fredheim, A. Dynamic properties of a flexible net sheet in waves and current—A numerical approach. Aquac. Eng. 2006, 35, 228–238. [Google Scholar] [CrossRef]
  15. Chen, T.H.; Meng, A.; Gui, F.K. Effect of wave height and direction on hydraulic characteristics of net of pile-column type net enclosure aquaculture system. Trans. Chin. Soc. Agric. Eng. (Trans. CSAE) 2017, 33, 245–251. [Google Scholar]
  16. Wang, S.; Feng, D.J.; Gui, F.K. Hydrodynamic characteristics of the net of seam-edge type net enclosure under thecombined wave-current loads. Trans. Chin. Soc. Agric. Eng. (Trans. CSAE) 2022, 38, 60–68. [Google Scholar]
  17. Tsukrov, I.; Eroshkin, O.; Fredriksson, D.; Swift, M.; Celikkol, B. Finite element modeling of net panels using a consistent net element. Ocean. Eng. 2003, 30, 251–270. [Google Scholar] [CrossRef]
  18. Zhao, Y.P.; Li, Y.C.; Dong, G.H. Hydrofynamics of fishing net cages in the open sea. Fish. Mod. 2011, 38, 10–16, (In Chinese with English abstract). [Google Scholar]
  19. Drach, A.; Tsukrov, I.; Decew, J.; Robinson Swift, M.; Celikkol, B.; Hurtado, C.F. Design and modeling of submersible fish cages with copper netting for open ocean aquaculture. In Proceedings of the MARINE V: Proceedings of the V International Conference on Computational Methods in Marine Engineering, Hamburg, Germany, 29–31 May 2013; CIMNE: Barcelona, Spain, 2013. [Google Scholar]
  20. Cha, B.J.; Kim, H.Y.; Bae, J.H.; Yang, Y.S.; Kim, D.H. Analysis of the hydrodynamic characteristics of chain-link woven copper alloy nets for fish cages. Aquac. Eng. 2013, 56, 79–85. [Google Scholar] [CrossRef]
  21. Tsukrov, I.; Eroshkin, O.; Paul, W.; Celikkol, B. Numerical modeling of nonlinear elastic components of mooring system. IEEE J. Ocean. Eng. 2005, 30, 37–46. [Google Scholar] [CrossRef]
  22. Yuan, G.; Gao, F.; Lou, J.; LI, J.; Wang, X. Experimental study on mechanical properties and force transfer mechanism of bolt supported metal mesh. J. China Coal Soc. 2022, 47, 1512–1522, (In Chinese with English abstract). [Google Scholar]
  23. Liu, H.F.; Chen, C.P.; Zheng, Y.N.; Liang, X.Y. Study of the numerical simulation of characteristics of different flow resistances on a metal chain–link net for aquaculture under currents. Fish. Mod. 2017, 44, 73–79, (In Chinese with English abstract). [Google Scholar]
  24. Chen, C.P.; Wang, W.; Zheng, J.C.; Shi, X.Y.; Liu, C.F. Numerical simulation on hydrodynamic characteristics of the plane metal net under current. J. Dalian Ocean Univ. 2017, 32, 363–368, (In Chinese with English abstract). [Google Scholar]
  25. Wu, Q.; You, X.; Huang, L.; Bi, C.; He, S.; Yang, Y.; Wang, G. Hydrodynamic characteristics of rigid net panels for mariculture facilities as determined in flume-tank experiment. Appl. Ocean Res. 2024, 147, 103969. [Google Scholar] [CrossRef]
  26. Ling, A.J.; Liang, Y.H.; Zhao, D.H.; Fan, Z.Q.; Zhao, Y.P. Progress in hydrodynamic characterization of flexible mesh coat structures for marine aquaculture. Adv. Fish. Sci. 2024, 45, 223–236, (In Chinese with English abstract). [Google Scholar]
  27. Yu, S.; Qin, H.; Li, P.; Gong, F.; Tian, Y. Experimental study on drag characteristics of the practical rigid net under different current conditions. Front. Mar. Sci. 2023, 10, 1134278. [Google Scholar] [CrossRef]
  28. Decew, J.C.; Osienski, M.; Drach, A.; Celikkol, B.; Tsukrov, I. Effect of the bending stiffness on the volumetric stability of fish cages with copper alloy netting. In Proceedings of the MARINE V: Proceedings of the V International Conference on Computational Methods in Marine Engineering, Hamburg, Germany, 29–31 June 2013; CIMNE: Barcelona, Spain, 2013. [Google Scholar]
Figure 1. Geometry and force diagram of metal mesh (2a: Mesh width; l: Mesh side length).
Applsci 15 04144 g001
Figure 2. Finite element model of net structure (M1: Node coupling model method; M2: Contact connection model method).
Applsci 15 04144 g002
Figure 3. Schematic diagram of penalty function method.
Applsci 15 04144 g003
Figure 4. Integral and local finite element model of mesh coat.
Applsci 15 04144 g004
Figure 5. Mesh coat arrangement diagram.
Applsci 15 04144 g005
Figure 6. Arrangement of measurement points.
Applsci 15 04144 g006
Figure 7. Arrangement of loading points. ‘□’ indicates the location of the loading point for centralized loading, and ‘△’ indicates the location of the loading point for distributed loading.
Applsci 15 04144 g007
Figure 8. Model test facility.
Applsci 15 04144 g008
Figure 9. Measured vs. predicted displacement with error bars.
Applsci 15 04144 g009
Figure 10. Variation in maximum displacement of mesh coat with the increase in centralized load and uniform load under different densities.
Applsci 15 04144 g010
Figure 11. Variation in maximum force of mesh with increasing centralized load and uniform load for different densities of mesh coating.
Applsci 15 04144 g011
Figure 12. Variation in maximum displacement of mesh coat with increasing centralized load and uniform load under different initial tensile force.
Applsci 15 04144 g012
Figure 13. Schematic diagram of mesh coat deformation under concentrated load and uniform load with different mesh coat densities.
Applsci 15 04144 g013
Figure 14. Schematic diagrams of mesh coat deformation under centralized and uniform loads with different initial pretensions.
Applsci 15 04144 g014
Table 1. Material properties of metal mesh coat.
Mesh Coat ParametersMesh Coat Model
M2.5-25M2.5-30M3.5-50
Mesh size (mm)253050
Wire diameter (mm)2.52.53.5
Modulus of elasticity E (GPa)102109119
Poisson’s ratio0.350.320.36
Densities ρ (kg/m3)830084008400
Table 2. Comparison of vertical deformation of mesh coat with different analysis methods.
Operating ConditionResolved Value (mm)M1 (mm)Errors (%)M2 (mm)Errors (%)
M2.5-2537.836.82−2.5937.49−1.66
M2.5-3035.3733.6−534.8−1.61
M3.5-508.669.246.79.135.43
Table 3. Characteristic parameters of metal net.
Snd/mm
Net Diameter
l/mm
Mesh Size
0.112.545
0.173.235
0.294.025
Table 4. Statistics on the magnitude of change in displacement of metal mesh coat due to changes in mesh coat compactness and initial pretension under centralized loading and uniform loading.
Magnitude of Change
Concentrated LoadsDistributed Load
Initial pretension 200 N ε 0.17 / 0.11 53.07%68.68%
ε 0.29 / 0.11 86.38%74.72%
Compactness Sn = 0.11 ε 250 / 200 3.48%3.52%
ε 300 / 200 8.07%8.14%
Table 5. Statistics on the magnitude of force changes at metal mesh clothing measurement points due to centralized and uniform load changes.
ε 0.17 / 0.11 Average Magnitude of Change ε 0.29 / 0.11 Average Magnitude of Change
Concentrated loads60 N71.20%71.89%84.98%85.03%
80 N71.70%84.75%
100 N72.00%85.11%
120 N72.20%85.14%
140 N72.35%85.17%
Distributed load6 N48.94%41.55%71.22%66.34%
8 N44.59%68.04%
10 N40.76%65.75%
12 N37.86%64.02%
14 N35.60%62.67%
Disclaimer/Publisher’s Note: The statements, opinions and data contained in all publications are solely those of the individual author(s) and contributor(s) and not of MDPI and/or the editor(s). MDPI and/or the editor(s) disclaim responsibility for any injury to people or property resulting from any ideas, methods, instructions or products referred to in the content.

