Article

Geological Hazard Risk Assessment Based on Time-Series InSAR Deformation: A Case Study of Xiaojin County, China

China Areo Geophysical Survey and Remote Sensing Center for Natural Resources, Beijing 100083, China
*
Author to whom correspondence should be addressed.
Appl. Sci. 2025, 15(8), 4143; https://doi.org/10.3390/app15084143
Submission received: 18 December 2024 / Revised: 16 January 2025 / Accepted: 20 January 2025 / Published: 9 April 2025
(This article belongs to the Topic Remote Sensing and Geological Disasters)

Abstract

:
Geological hazard risk assessment provides essential scientific support for geological disaster prevention and governance. The selection of appropriate evaluation factors is crucial to the accuracy and practicality of the risk assessment results. The existing factors for geological hazard risk assessment often suffer from issues such as poor timeliness and insufficient completeness. Interferometric Synthetic Aperture Radar (InSAR) technology, which offers large-scale, high spatiotemporal resolution monitoring of surface deformation, can effectively compensate for the shortcomings of existing risk assessment factors. How to effectively integrate time-series InSAR deformation results into geological hazard risk assessment has become a focus of research. This study fully considers the time-series InSAR deformation information; both the ascending and descending orbit results of the time-series InSAR deformation are introduced as two categories of evaluation factors in the risk assessment model. Subsequently, 11 types of assessment factors are selected by the Pearson correlation coefficient method, while the Information Volume Model and Evidence Weight Model are applied in the partitioning and assessment of risks in Xiaojin County, China. Finally, ROC (Receiver Operating Characteristic Curve) analysis is utilized to compare the accuracy of model evaluations before and after incorporating time-series InSAR deformation results. The results indicate that: (1) after incorporating time-series InSAR deformation monitoring results as evaluation factors into the information volume model and evidence weight model, the evaluation accuracy of the two models improved by 9.69% and 11.26%, respectively; (2) there are differences in risk partitioning among different evaluation models. From the risk partitioning result of Xiaojin County in this study, the evaluation accuracy of the information volume model is higher than that of the evidence weight model, and the performance is more prominent after adding the time-series InSAR deformation results.

1. Introduction

Geological hazard risk assessment is a scientific method used to evaluate the possibility and potential hazards of geological disasters in specific areas, aiming to provide a basis for disaster prevention, land use planning, and public safety [1,2,3]. China has a complex geological structure and frequently experiences geological disasters, which pose severe challenges to society and the natural environment. Therefore, the role of geological hazard risk assessment is becoming increasingly prominent. Previous studies have developed various evaluation models, such as logistic regression [4,5], fuzzy and gray clustering [6], GIS-assisted models [7,8], and analytic hierarchy processes [9,10]. These models have played certain roles in different scenarios, but the existing models have also revealed some shortcomings in practical applications. For example, the logistic regression model exhibits limited adaptability in complex geological environments and struggles to accurately capture the subtle changes associated with geological disaster occurrences. GIS-assisted models frequently fail to fully account for the dynamic changes and interactions among multiple factors, leading to a lack of timeliness and precision in the evaluation outcomes. Moreover, challenges in data acquisition and processing represent a significant constraint on the application of these models. Therefore, it is particularly urgent to explore more efficient and accurate evaluation methods to overcome the limitations of existing models.
InSAR technology not only provides large-scale, high-precision, and high spatiotemporal resolution surface deformation information but also has strong continuity, making it widely applied in geological hazard monitoring and assessment [11,12]. Currently, some research results have been achieved by integrating time-series InSAR deformation information as an evaluation factor in geological disaster risk assessment [13,14]. For instance, several studies have shown that the combination of ascending or descending InSAR deformation to evaluate geological hazard susceptibility assessment has significant advantages. One study replaced traditional geological hazard points with ascending time-series InSAR deformation points and integrated deformation magnitude into the evaluation model for assessing geological hazard susceptibility in Baiyin City, confirming the feasibility and effectiveness of this approach [15]. In addition, another study combined dynamic factors derived from InSAR deformation decomposition with 14 static factors to construct a landslide susceptibility model for Lanzhou City. The results showed that the dynamic factors could significantly improve the accuracy of the model [16]. A further study explored landslide identification using InSAR data, incorporating deformation results as evaluation factors in the susceptibility model, highlighting the potential application of this method in susceptibility assessment [17]. Additionally, the integration of machine learning and InSAR technology for landslide hazard assessment provides a novel approach for related research [18]. InSAR deformation data has also been used to update geological hazard susceptibility zoning maps for river basins and slopes, improving the accuracy of disaster prediction [19,20,21]. Based on the above, it is evident that integrating InSAR deformation results into assessment models has emerged as a new research focus. Existing studies often utilize deformation information obtained from single or differential InSAR methods but frequently overlook issues such as incomplete deformation information and limited coherence caused by topographic variations. Furthermore, most studies neglect the deformation magnitude information when incorporating InSAR deformation rates into assessment models, failing to fully leverage the detailed information contained in the deformation data.
This study focuses on Xiaojin County, a region frequently affected by geological disasters in Sichuan Province. A total of 23 Sentinel-1A satellite ascending and descending orbit SAR images covering the area were acquired. Time-series InSAR technology was used to obtain surface deformation data from January to December 2021. The deformation data from both ascending and descending orbits were incorporated as two distinct evaluation factors into the geological hazard risk assessment model. Hazard zoning and risk evaluation were then conducted for Xiaojin County, with the results validated through accuracy assessment using the ROC curve.

2. Study Area and Data
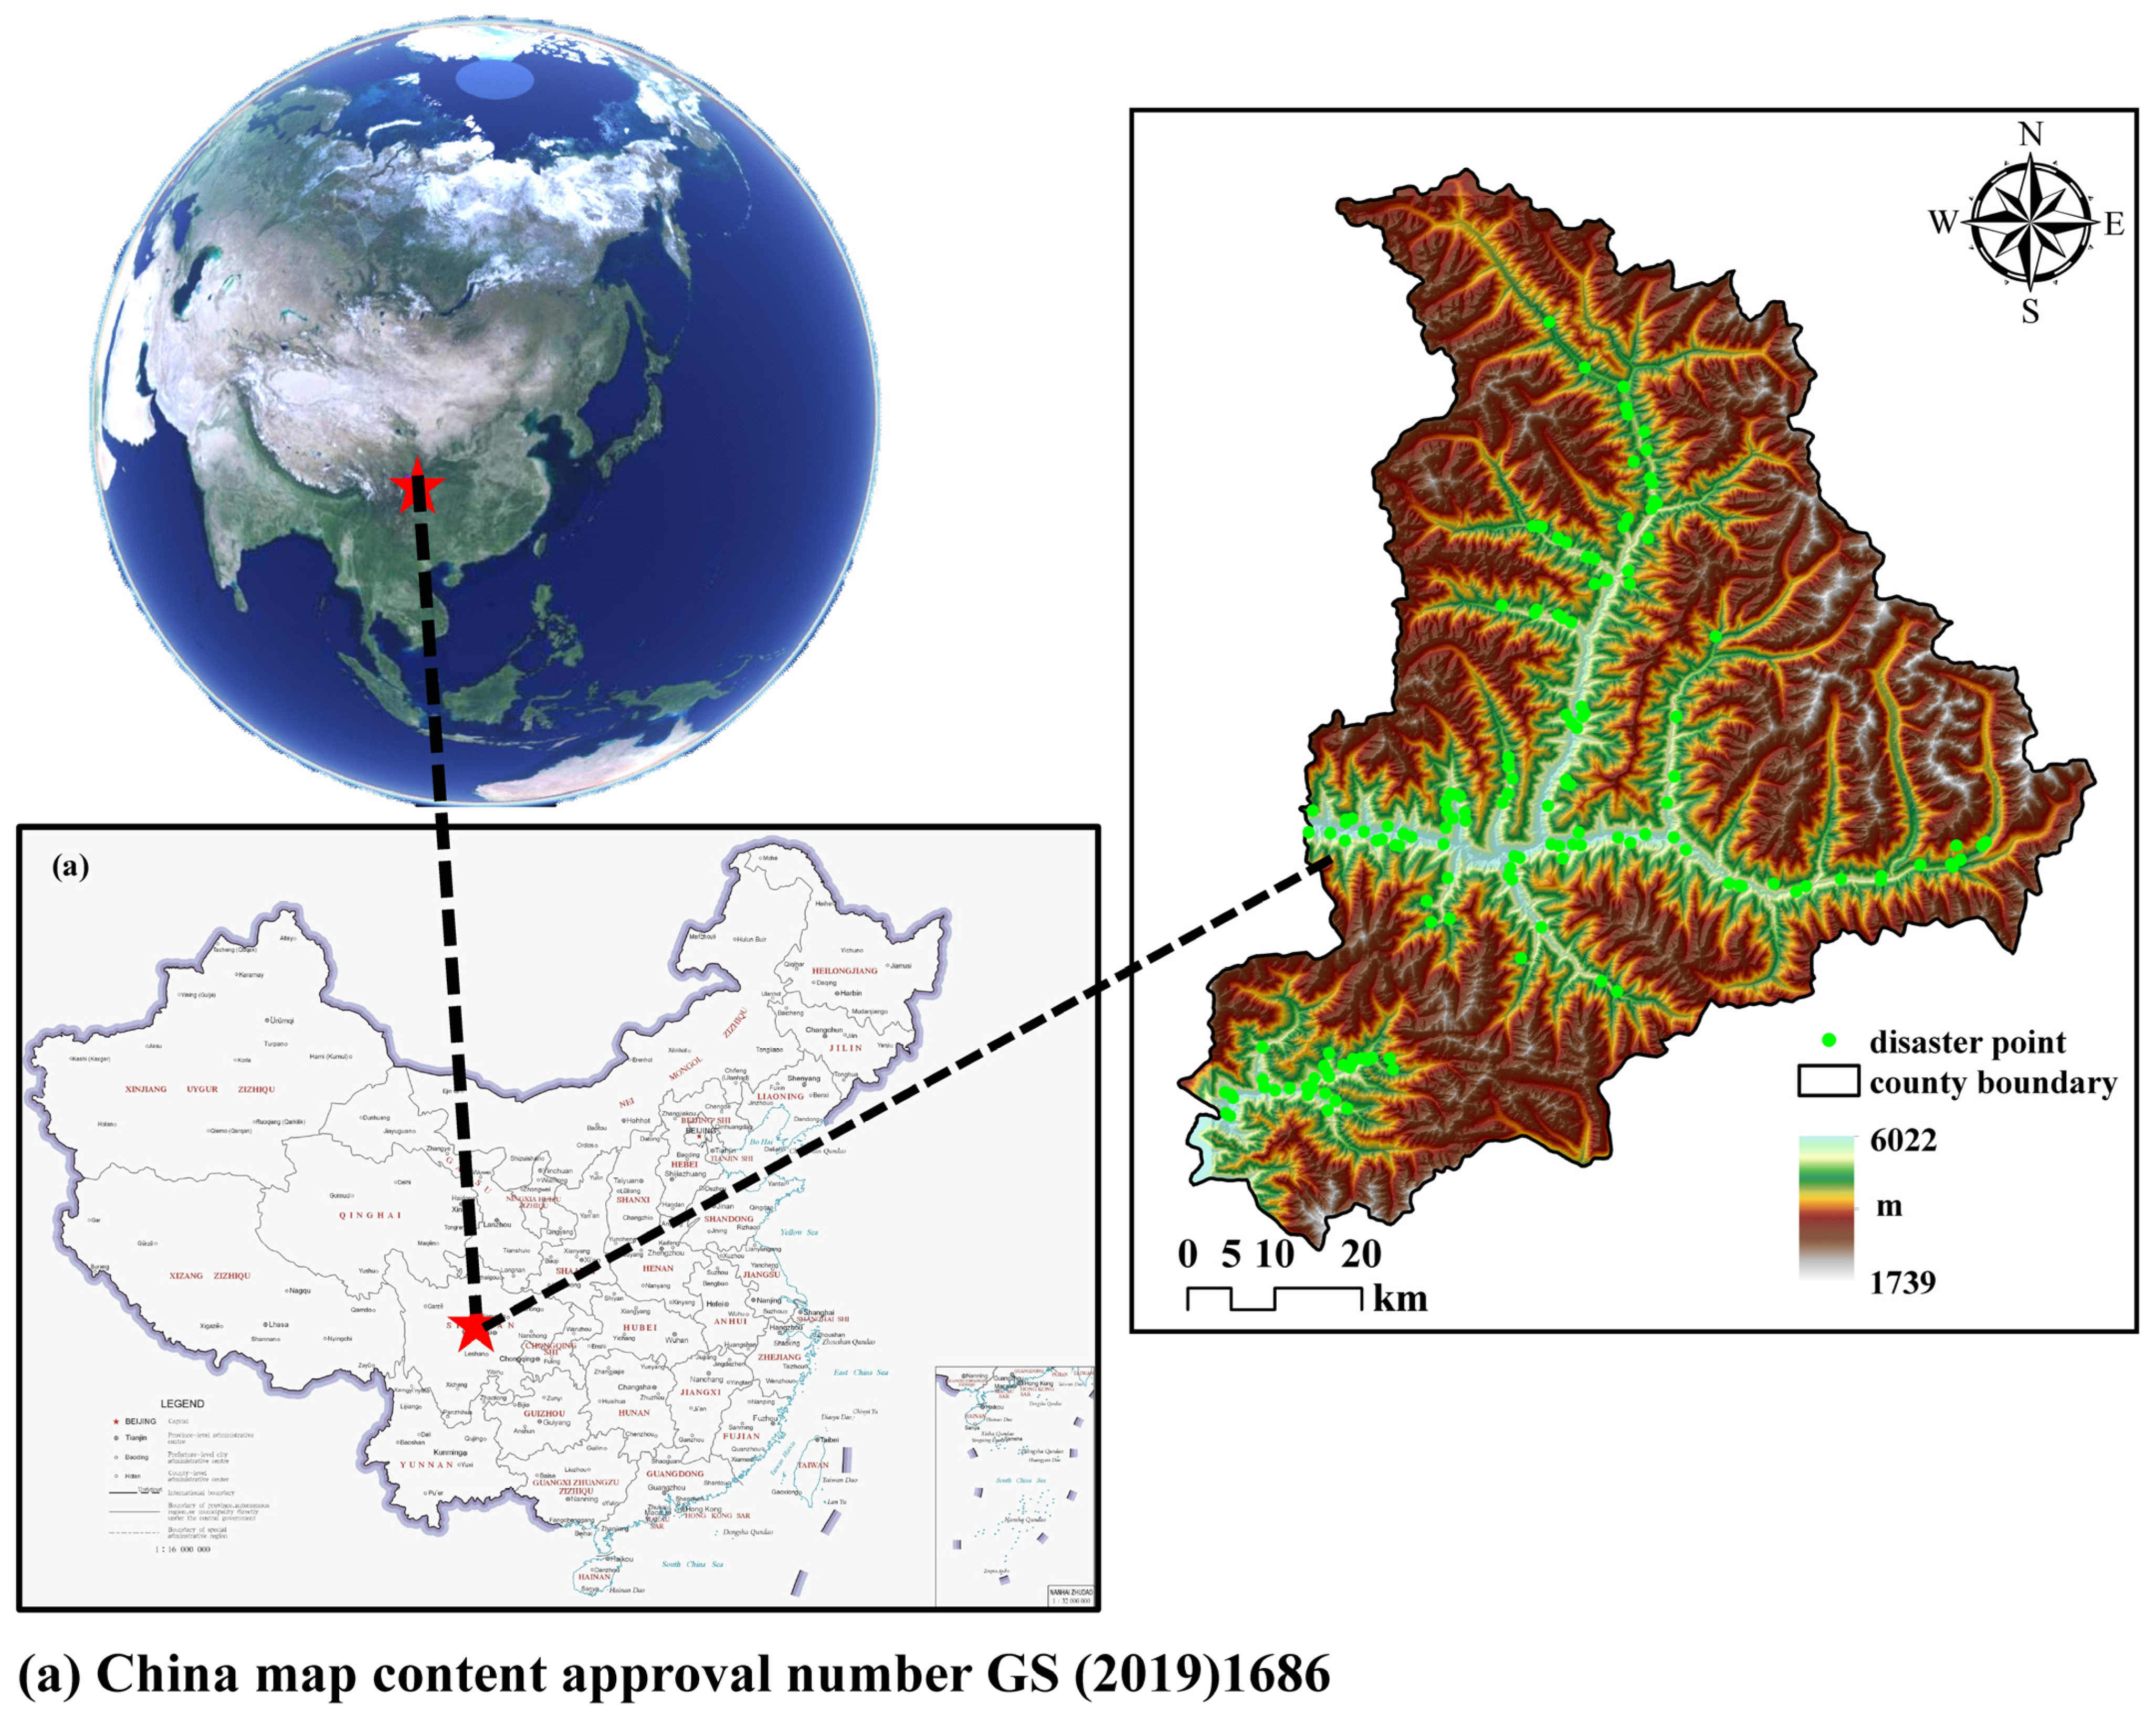
2.1. Study Area

Xiaojin County is located in the southeastern part of the Aba Tibetan and Qiang Autonomous Prefecture, Sichuan Province, with geographic coordinates ranging from 30°35′ N–31°43′ N, 102°01′ E–102°59′ E. The county is characterized by typical alpine canyon terrain, complex geological structures, and variable climatic conditions, which makes it a high-risk area with frequent geological disasters. The geographical location of the study area is shown in Figure 1. In recent years, the frequency and extent of geological disasters such as landslides, collapses, and debris flows have been increasing due to factors like climate change and intensified human activities, posing serious threats to the local ecological environment and the safety of people’s lives and property.

2.2. Data

This study utilizes a total of 23 ascending and 23 descending orbit Sentinel-1A radar images, along with 11 additional datasets for geological hazard risk assessment. These datasets include DEM and derived data (such as slope and aspect), lithology data, fault data, land use data, soil type data, hydrological data, road data, vegetation cover data, and precipitation data [22]. Detailed information on each dataset is shown in Table 1, and the parameters of the Sentinel-1A data are shown in Table 2.
The selection of parameters is based on their key roles in the occurrence mechanism of geological disasters. Among them, the ascending and descending orbit Sentinel-1A radar data provides surface deformation information, which helps to identify potential hidden dangers. DEM and derived data reflect the topographic and geomorphic characteristics, which are crucial for assessing the risk of geological disasters. Stratigraphic lithology and fault data reveal the geological structural background. Land use and soil type data reflect the surface cover and soil properties. Water system and road data reveal the impact of river erosion and human engineering activities on the instability of geological structures. Vegetation coverage and rainfall data reflect surface protection and rainfall intensity, respectively, which have an important impact on the assessment of geological disaster risks. Comprehensively considering the impact of each evaluation factor in the assessment of geological hazard risk can more comprehensively assess the risk of geological disasters.

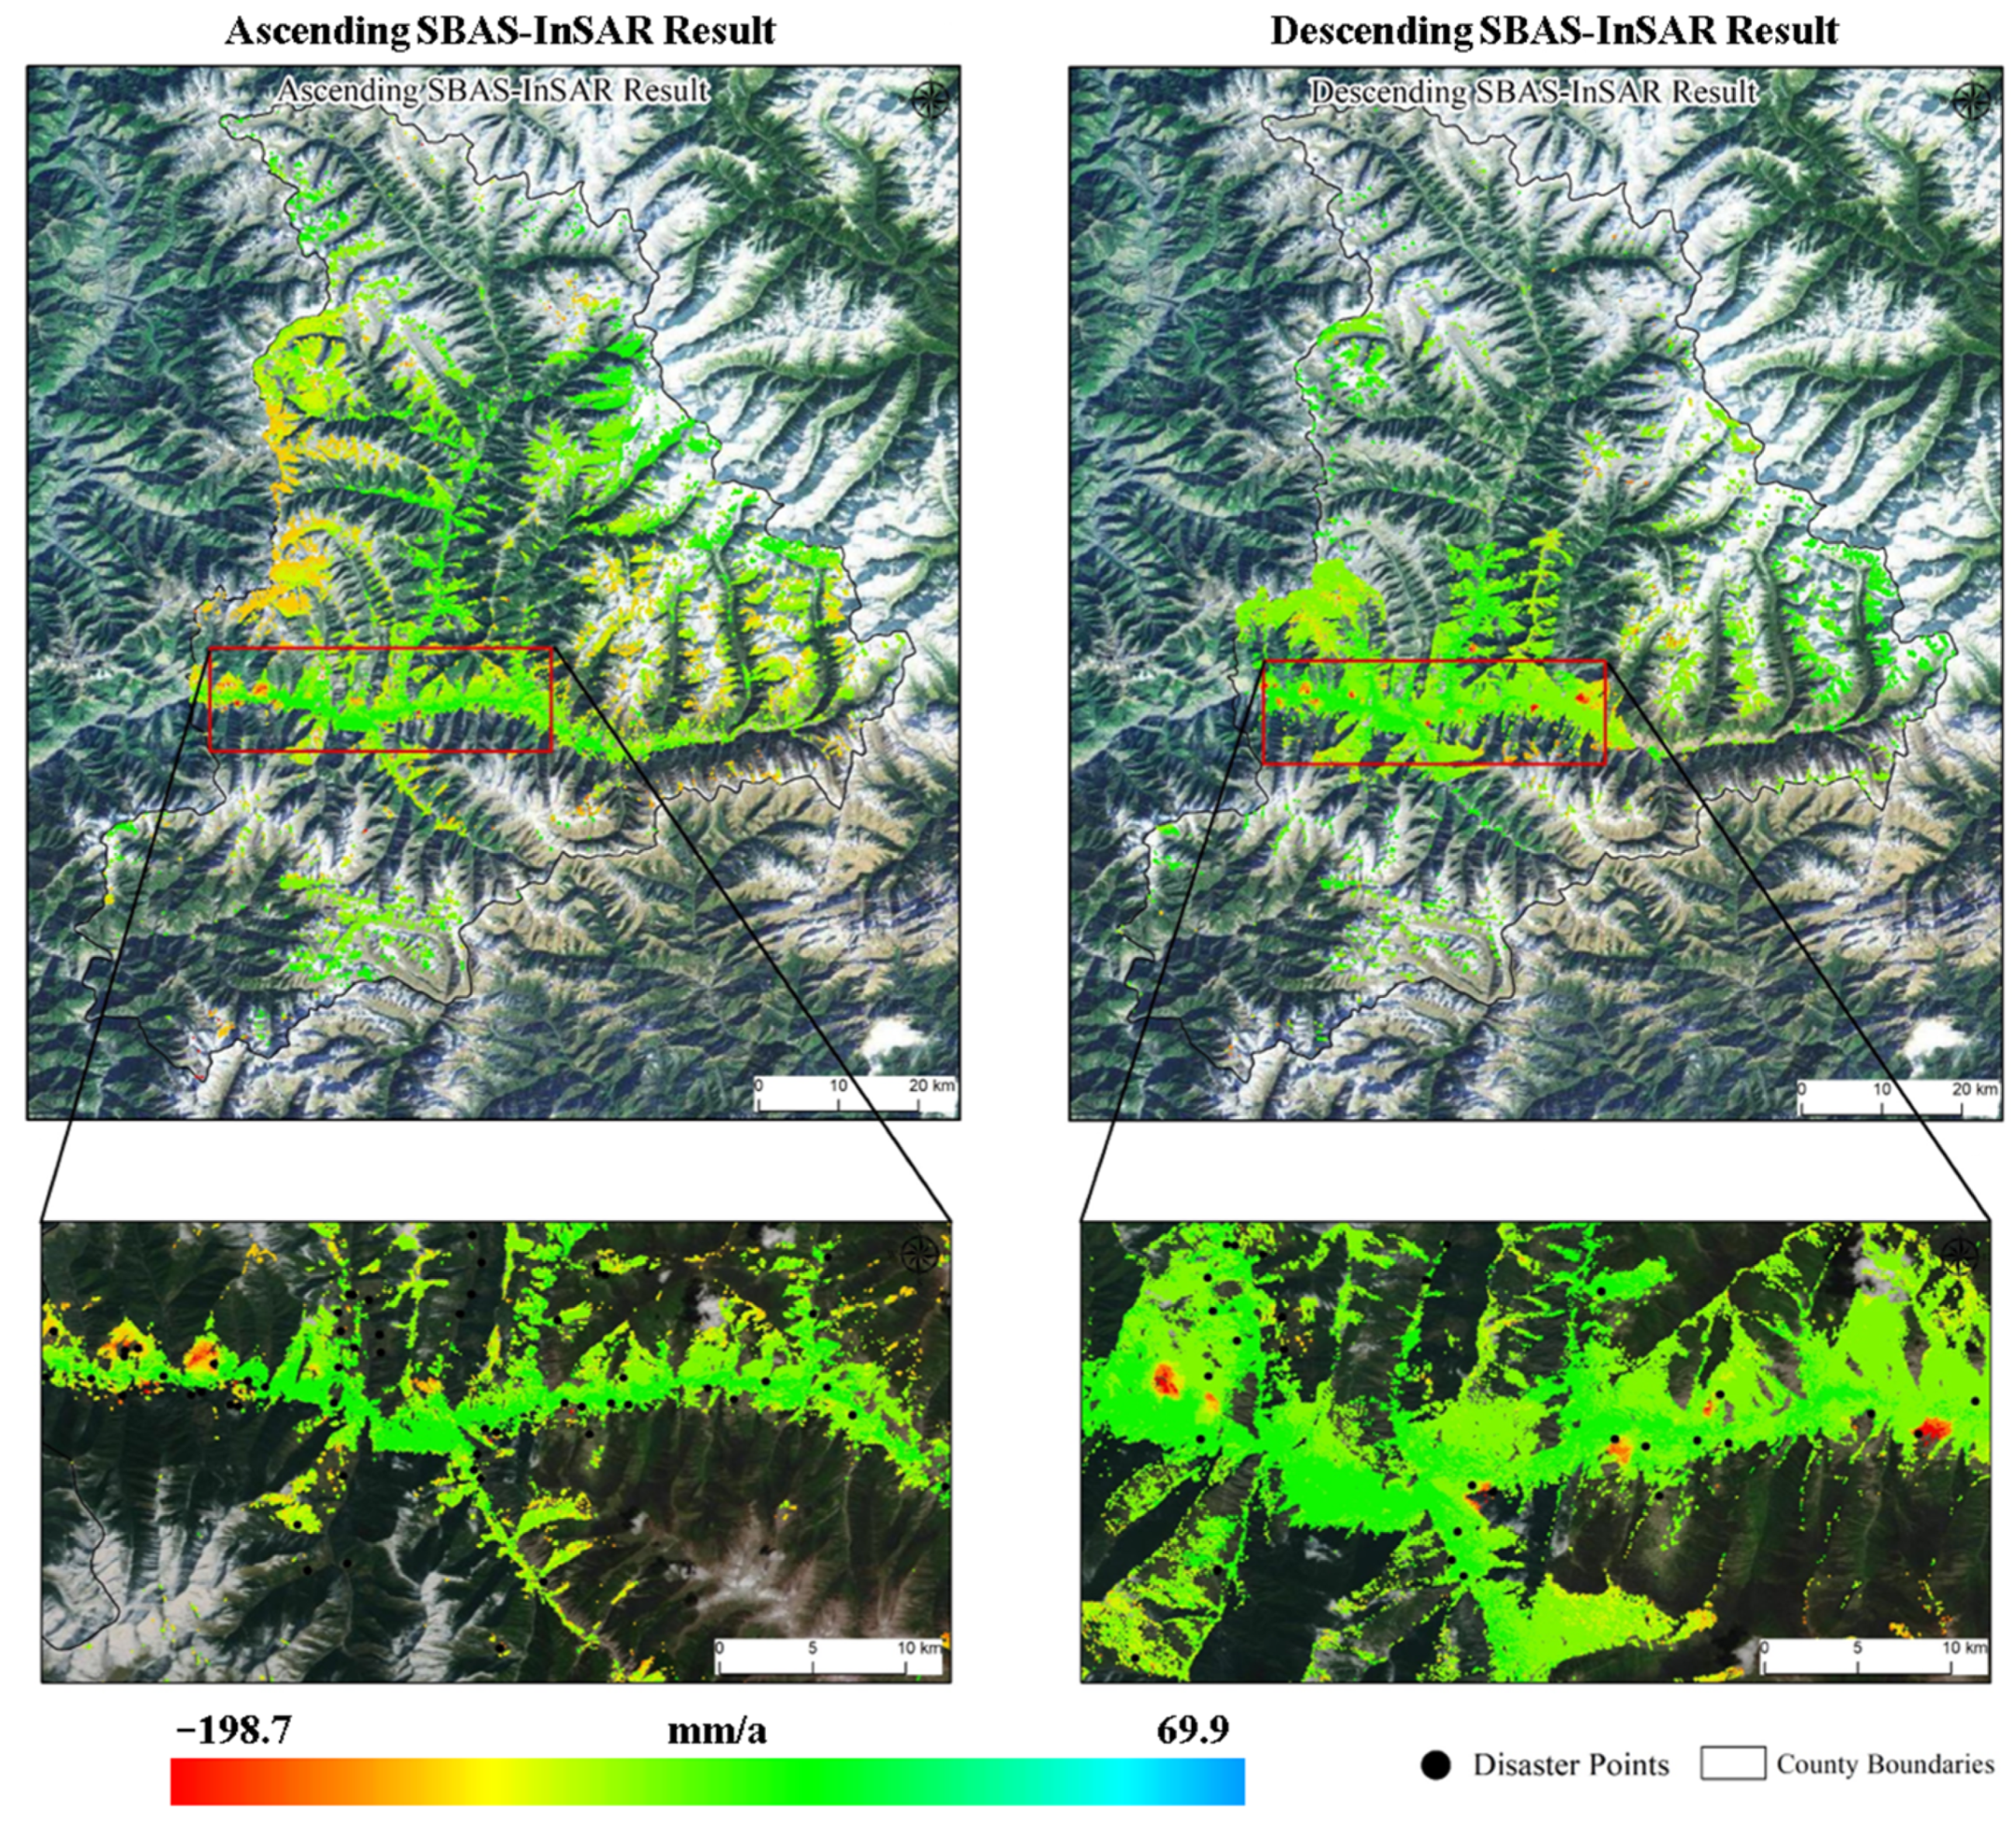
2.3. Preprocessing of Time-Series InSAR Data

Generally, regions with larger surface deformations are more susceptible to geological hazards. However, since InSAR technology only monitors deformation along the Line of Sight (LOS), and geological disasters typically involve multi-directional and multi-dimensional deformation processes, monitoring with a single orbit’s deformation data has certain limitations in geological hazard assessment. Therefore, this study incorporates surface deformation data from both ascending and descending orbit time-series InSAR as two independent evaluation factors and integrates them into the geological hazard risk assessment model.
This study employs the SBAS-InSAR technique. By restricting the temporal and spatial baselines between images, SAR images covering the same area are divided into several subsets, thereby effectively enhancing the quality and correlation of the interferograms [23]. The phase information after interferometry is processed to remove the flat ground phase and topographic phase using orbital information and SRTM DEM, and the differential interferometric phase information is obtained. High coherence points are extracted for phase unwrapping. To address the rank deficiency issue during pixel unwrapping, this paper converts the phase solution into the calculation of the phase change rate and uses the singular value decomposition method for solving. After obtaining the phase change in each time series, the phase time series is calculated and restored. Based on the polynomial deformation model, the linear deformation signal is solved, and the elevation error caused by inaccurate DEM is modeled and solved. The differential interferometric phase is then unwrapped after subtracting the linear deformation signal and elevation error. Due to the presence of noise and atmospheric phase in the phase after the above processing, to effectively separate the nonlinear deformation phase, this paper, based on the differences in spatiotemporal characteristics between the two, filters out the noise phase through spatial low-pass filtering and the atmospheric phase through temporal high-pass filtering, thereby obtaining the nonlinear deformation information within the study area. Adding the nonlinear deformation to the linear deformation yields the complete deformation time series [24,25].
Based on the 23 radar interferograms with a 20 m resolution obtained from the Sentinel-1A satellite system between January and December 2021, the SBAS-InSAR technique was used to derive surface deformation monitoring data for Xiaojin County. The average deformation rates calculated by SBAS-InSAR are shown in Figure 2 (positive values indicate displacement of the observed target toward the radar line of sight, while negative values indicate displacement away from the radar line of sight). As shown in Figure 2, the deformation rate range for the ascending orbit is [−159.1 mm/a, 69.9 mm/a], and for the descending orbit, the deformation rate range is [−198.7 mm/a, 49.9 mm/a].

3. Establishment of Geological Hazard Risk Assessment Model

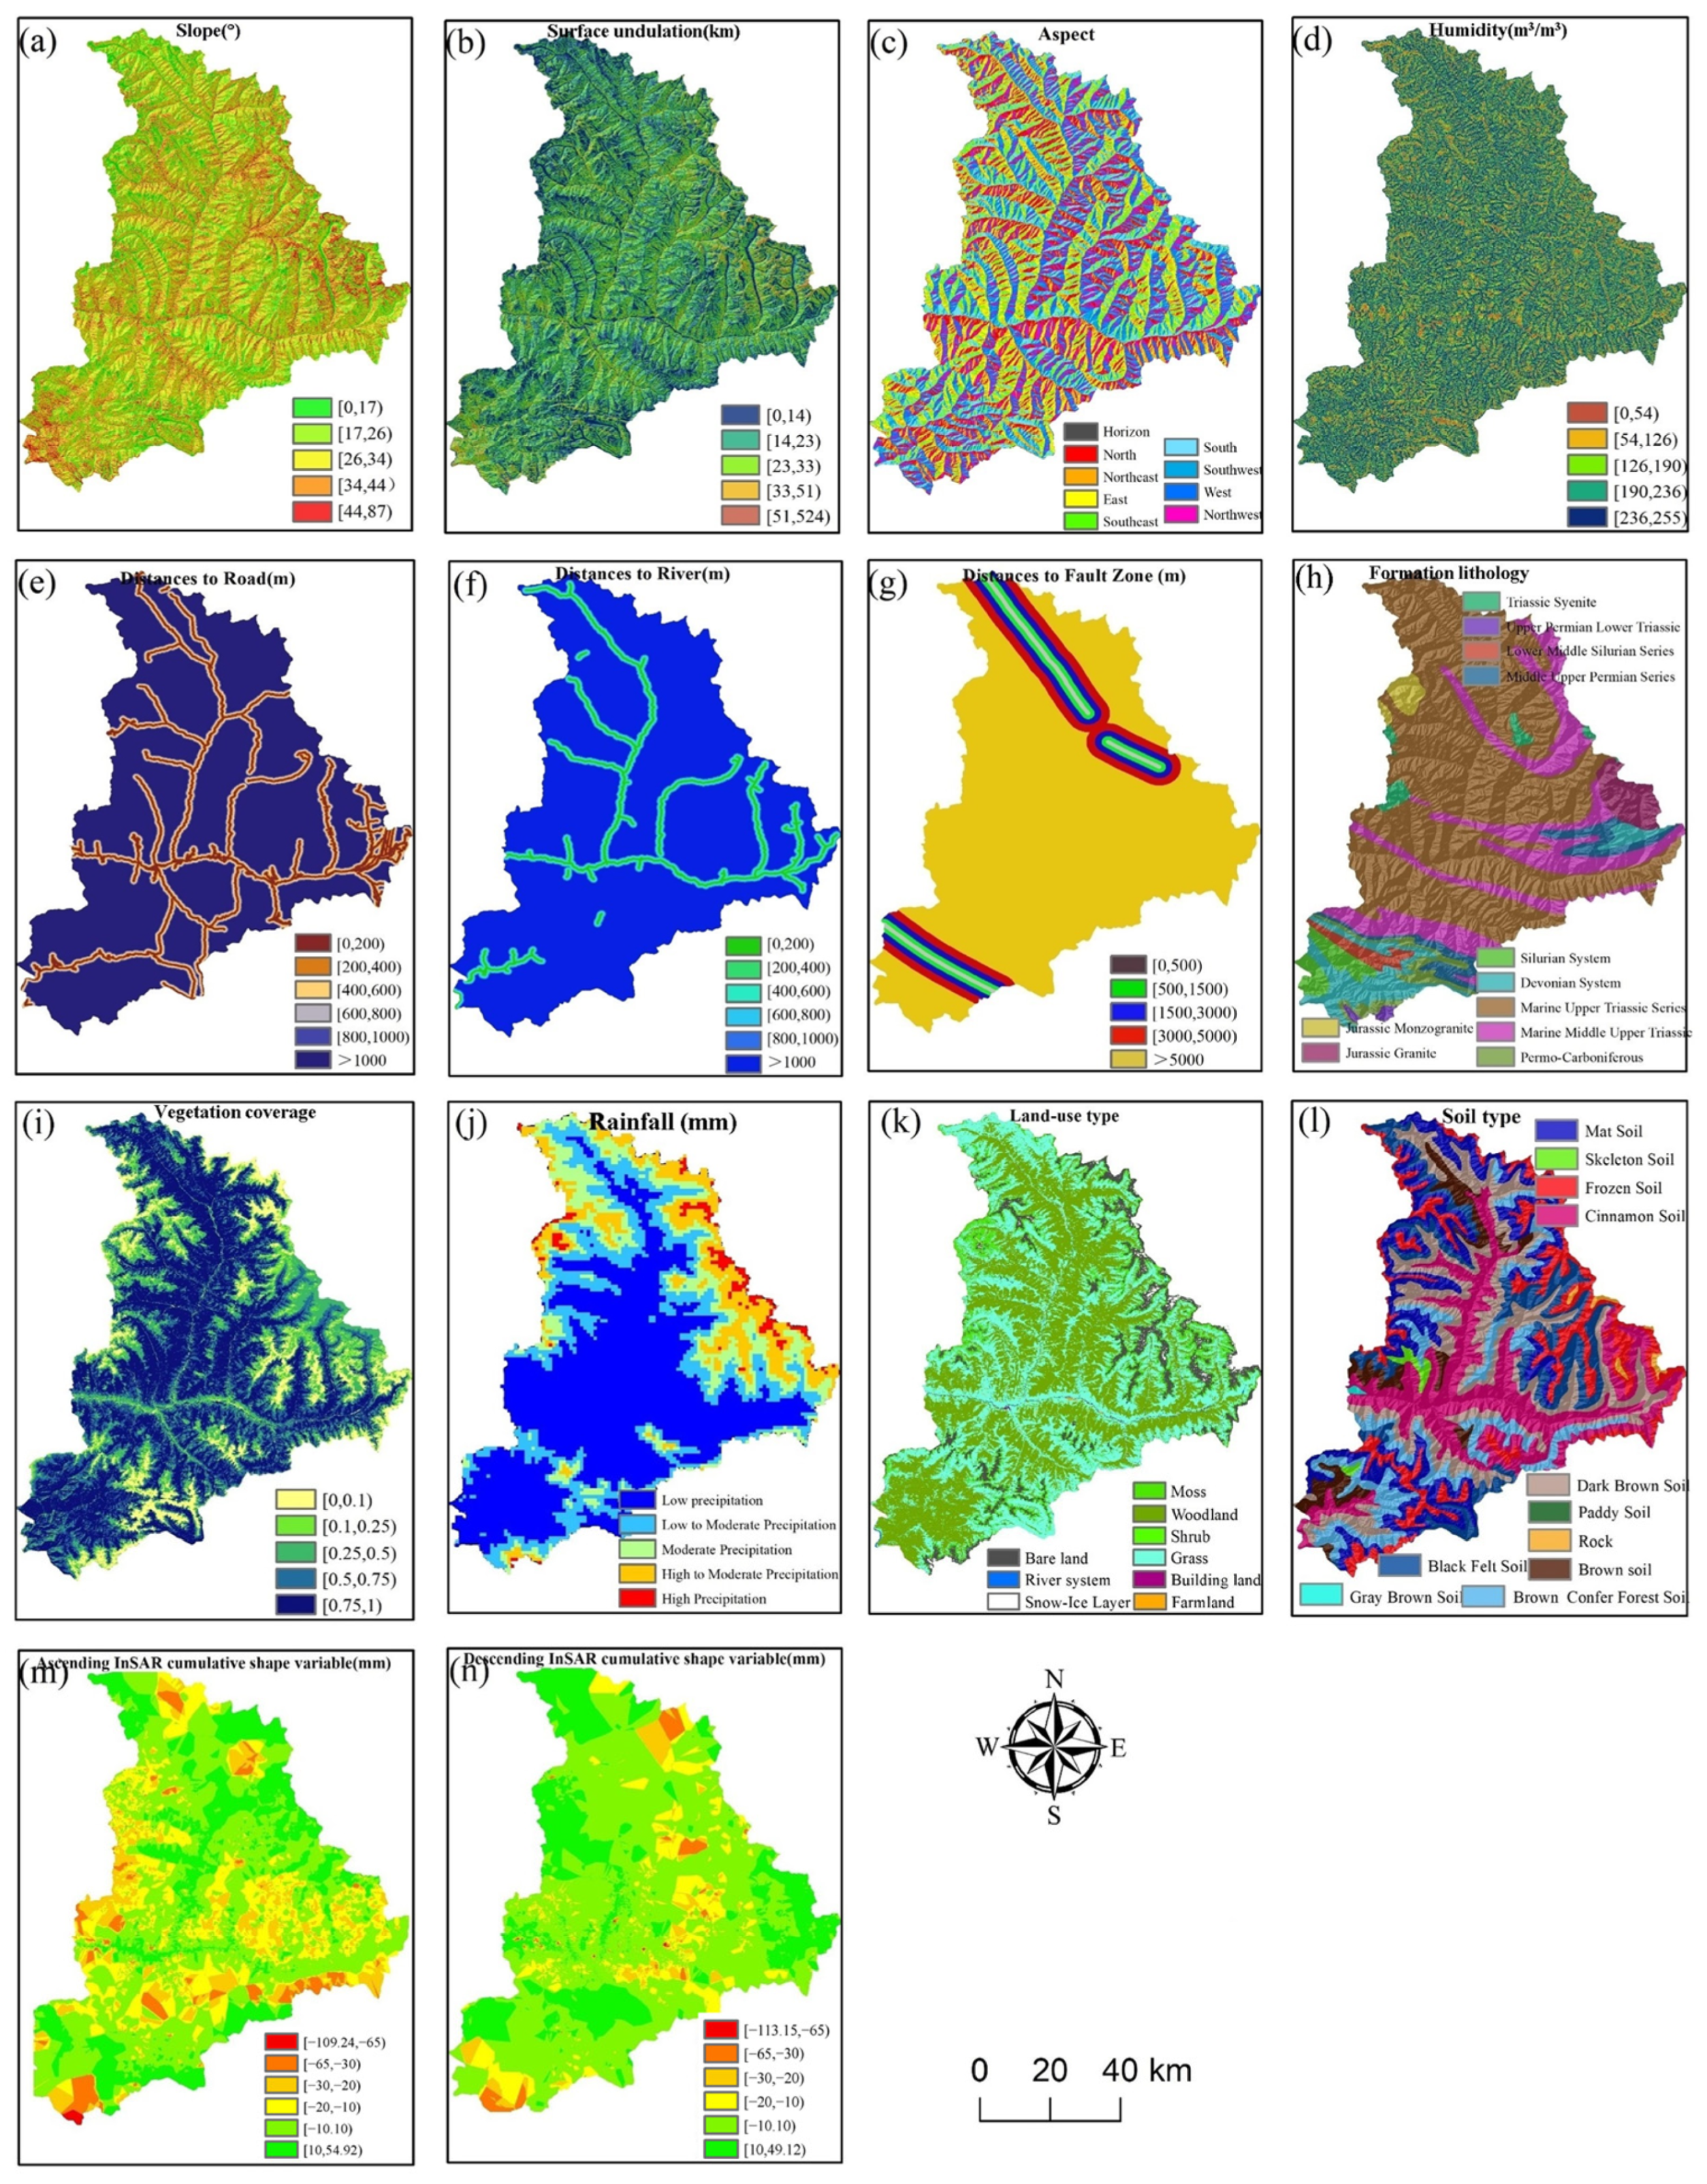
3.1. Evaluation Factors

Geological hazard risk assessment aims to evaluate the likelihood of geological disasters occurring within a specific area, determined by the underlying geological conditions that contribute to disaster formation. The selection of evaluation factors is crucial to the accuracy of the results. However, due to regional differences, there is no standardized set of geological hazards influencing factors to date. Therefore, the process of selecting evaluation factors must be rigorous and scientific [26]. Considering the specific conditions of Xiaojin County, the chosen evaluation factors should be accessible, representative, and relevant [27]. Based on a detailed survey of existing geological disaster data in Xiaojin County and referencing commonly used geological hazard risk factors from both domestic and international studies [28,29,30], this study selected 14 preliminary evaluation factors, including slope, surface undulation, aspect, surface moisture, distance to roads, distance to rivers, distance to fault zones, lithology, vegetation cover, precipitation, land use type, soil type, ascending orbit InSAR deformation, and descending orbit InSAR deformation. The thematic maps for each evaluation factor are shown in Figure 3.

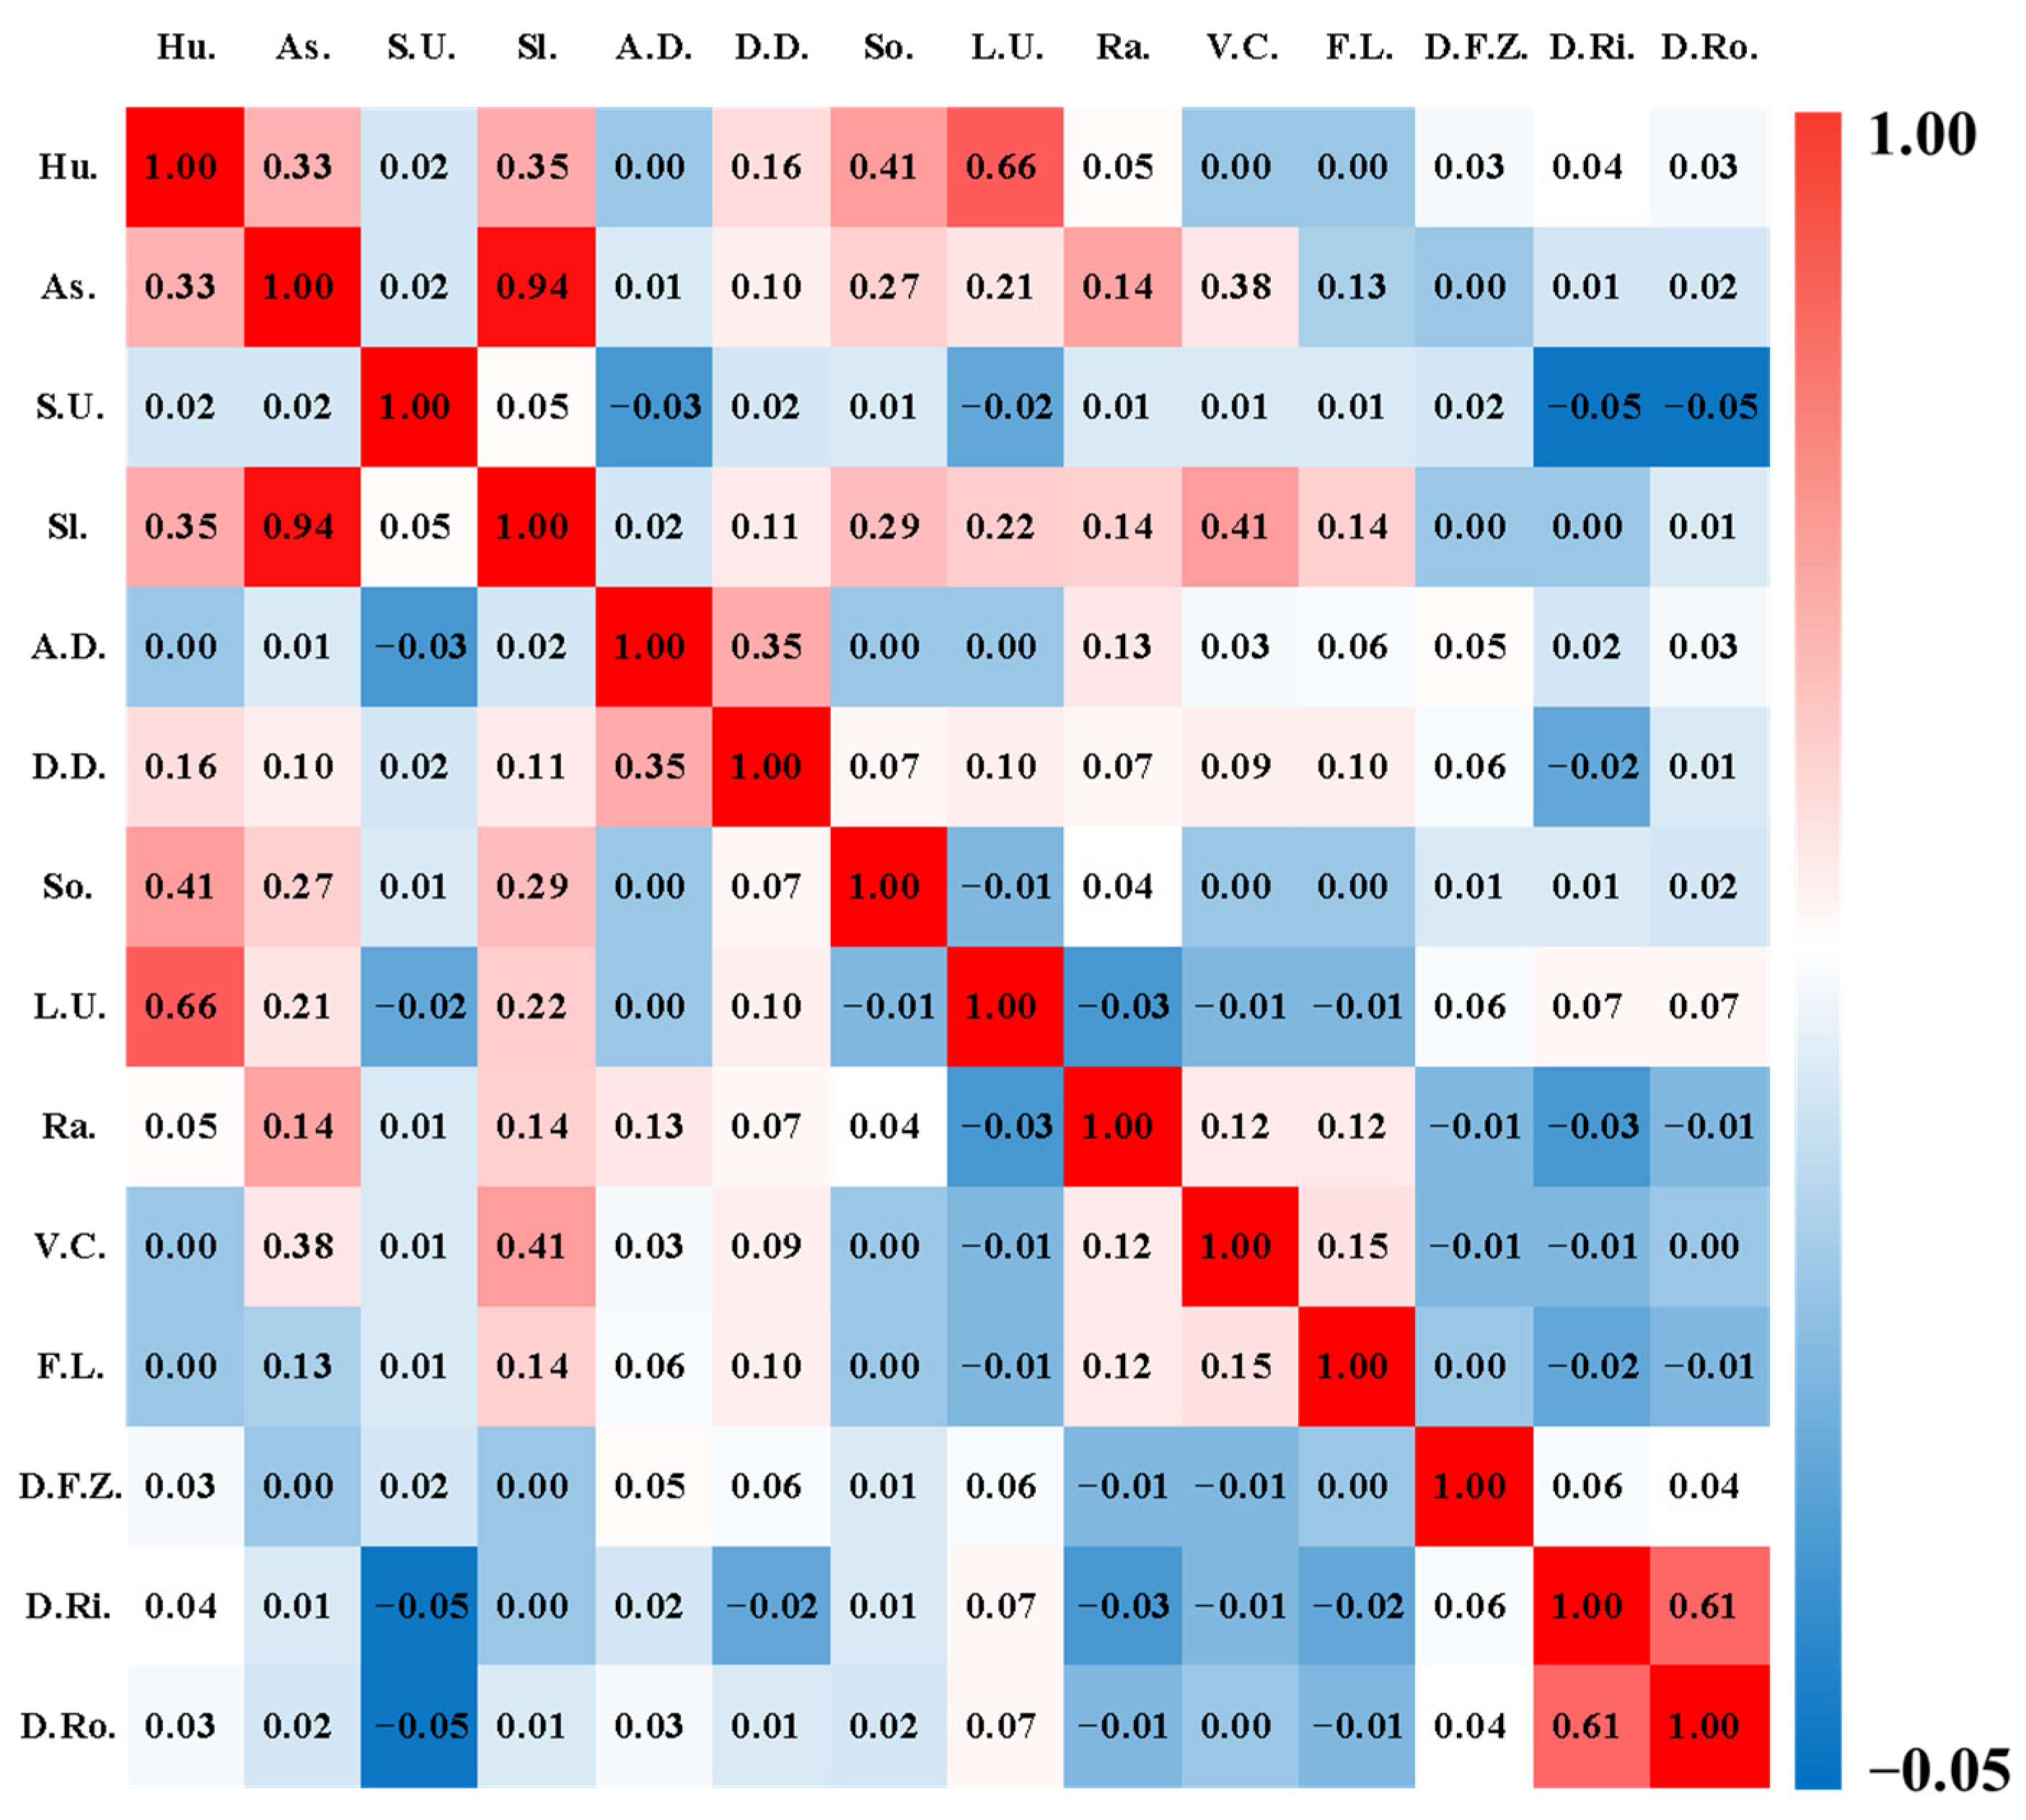
3.2. Factor Selection

Considering that the selection of indicators for geological hazard risk assessment should be objective and ensure the independence of each factor, it is essential to assess the correlation between the indicators to improve the model’s evaluation accuracy. In this study, the Pearson correlation coefficient method [31] was used to analyze the correlations between the evaluation factors. The correlation coefficients between the factors are shown in Figure 4. The explanation is as follows. All factors form two feature sets, x 1 , x 2 , , x i , , x n and y 1 , y 2 , , y i , , y n , with a length of n. The calculation formula of the correlation coefficient r is as follows:
r = i = 1 n x i x ¯ y i y ¯ i = 1 n x i x ¯ 2 i = 1 n x i x ¯ 2
where n is the sample size, x ¯ and y ¯ are the means of the samples within the two feature sets, and x i , y i represent the values of the i-th sample in x and y, respectively. In this study, the correlation between factors is evaluated based on the absolute value of r. When 0.8 < ∣r∣ ≤ 1, the correlation between factors is considered extremely high; when 0.6 < ∣r∣ ≤ 0.8, the correlation is high; when 0.4 < ∣r∣ ≤ 0.6, the correlation is moderate; when 0.2 < ∣r∣ ≤ 0.4, the correlation is weak; and when ∣r∣ ≤ 0.2, the correlation between factors is considered very weak or negligible.
The Pearson correlation coefficient method was used to quantify the correlations between different evaluation factors. When the absolute value of the correlation coefficient ∣r∣ exceeds 0.6, there is a high or very high correlation between the factors. In this study, for evaluation factors with a correlation greater than 0.6, only one factor is retained for analysis. This is because including highly correlated factors in the model can lead to collinearity, which can distort the model’s calculations and reduce its accuracy. By following the correlation threshold principle, optimization and selection of strongly correlated factors are key measures to ensure the efficient and accurate operation of the model.
As shown in Figure 4, the correlation coefficient between slope and aspect is 0.94, between land use type and soil moisture is 0.66, and between distance to the river and distance to the road is 0.61. These factors exhibit strong correlations. Based on the Pearson correlation coefficient method and the difficulty level of each factor in triggering geological hazards, this study excluded the following three factors: aspect, soil moisture, and distance to the road. Ultimately, the following 11 evaluation factors were selected for the geological hazard risk assessment: surface undulation, slope, cumulative deformation from ascending orbit, cumulative deformation from descending orbit, soil type, land use type, precipitation, vegetation cover, lithology, distance to fault zones, and distance to rivers.

3.3. Evaluation Model

3.3.1. Information Volume Model

The information value method was originally proposed by Shannon [32] and has been widely applied in regional geological hazard assessment, landslide stability prediction, and other related studies. The information value model primarily utilizes the frequency or density of geological hazard occurrences to convert the influence of evaluation factors ( x i ) on geological disaster events ( Y ) into information entropy. A higher information entropy indicates a greater influence of the factor. The model spatially overlays the information entropy of each factor to assess regional landslide hazard risk [33]. The information content I x i , Y provided by the i-th influencing factor ( x i ) in relation to the occurrence of a geological hazard event ( Y ) can be expressed as follows:
I x i , Y = l n N i / N S i / S
In the formula, x i represents the i-th geological hazard influencing factor within the evaluation unit; I x i , Y represents the information content contributed by factor x i to the geological hazard; S denotes the total number of grids in the evaluation unit; S i indicates the number of grids containing factor x i within the study area; N represents the total number of grids containing geological hazards in the study area; and N i refers to the number of grids with geological hazards in a specific category associated with factor x i .
According to the information, the content of a single indicator factor can be calculated for the whole evaluation unit within the study area. A larger information content value indicates a higher probability of geological hazard occurrence within the evaluation unit [34]. The expression for the total information content of the evaluation unit is as follows:
I = i = 1 n I x i , Y = i = 1 n l n N i / N S i / S
In the formula, I represents the total information content provided by all factors within the evaluation unit, reflecting the degree of susceptibility to geological hazards; n represents the number of influencing factors.

3.3.2. Evidence Weight Model

The evidence-weighting model is a method based on the Bayesian model, which integrates various evidence layers to assess the probability of an event occurring [35]. It combines multiple evaluation factors to assess the degree of hazard associated with geological disasters. The weight of each hazard factor reflects its degree of influence on geological disasters. By aggregating the weights of all factors and performing spatial correlation analysis between existing disaster points and hazard factors, the geological hazard risk index is obtained. The value of this index represents the probability of a geological disaster occurring in the study area [36]. The formula for calculating the evidence weight is as follows:
W i + = l n P F / L P F / L ¯
W i = l n P F ¯ / L P F ¯ / L ¯
C i = W i + W i
In the formula, L represents the total number of grid cells in the area affected by geological disasters; F represents the total number of grid cells in the evaluation factor where geological disasters occur; L ¯ represents the total number of grid cells in areas without geological disasters; F ¯ represents the total number of grid cells in the evaluation factor where geological disasters have not occurred; W i + represents the positive weight; W i represents the negative weight; C i represents the final weight value of the evaluation factor, i.e., the evidence weight. A larger C value (greater than 0) indicates that the factor promotes the occurrence of geological disasters; otherwise, it does not. When C = 0, it means that the influencing factor is unrelated to the occurrence of geological disasters.

4. Results and Accuracy Assessment
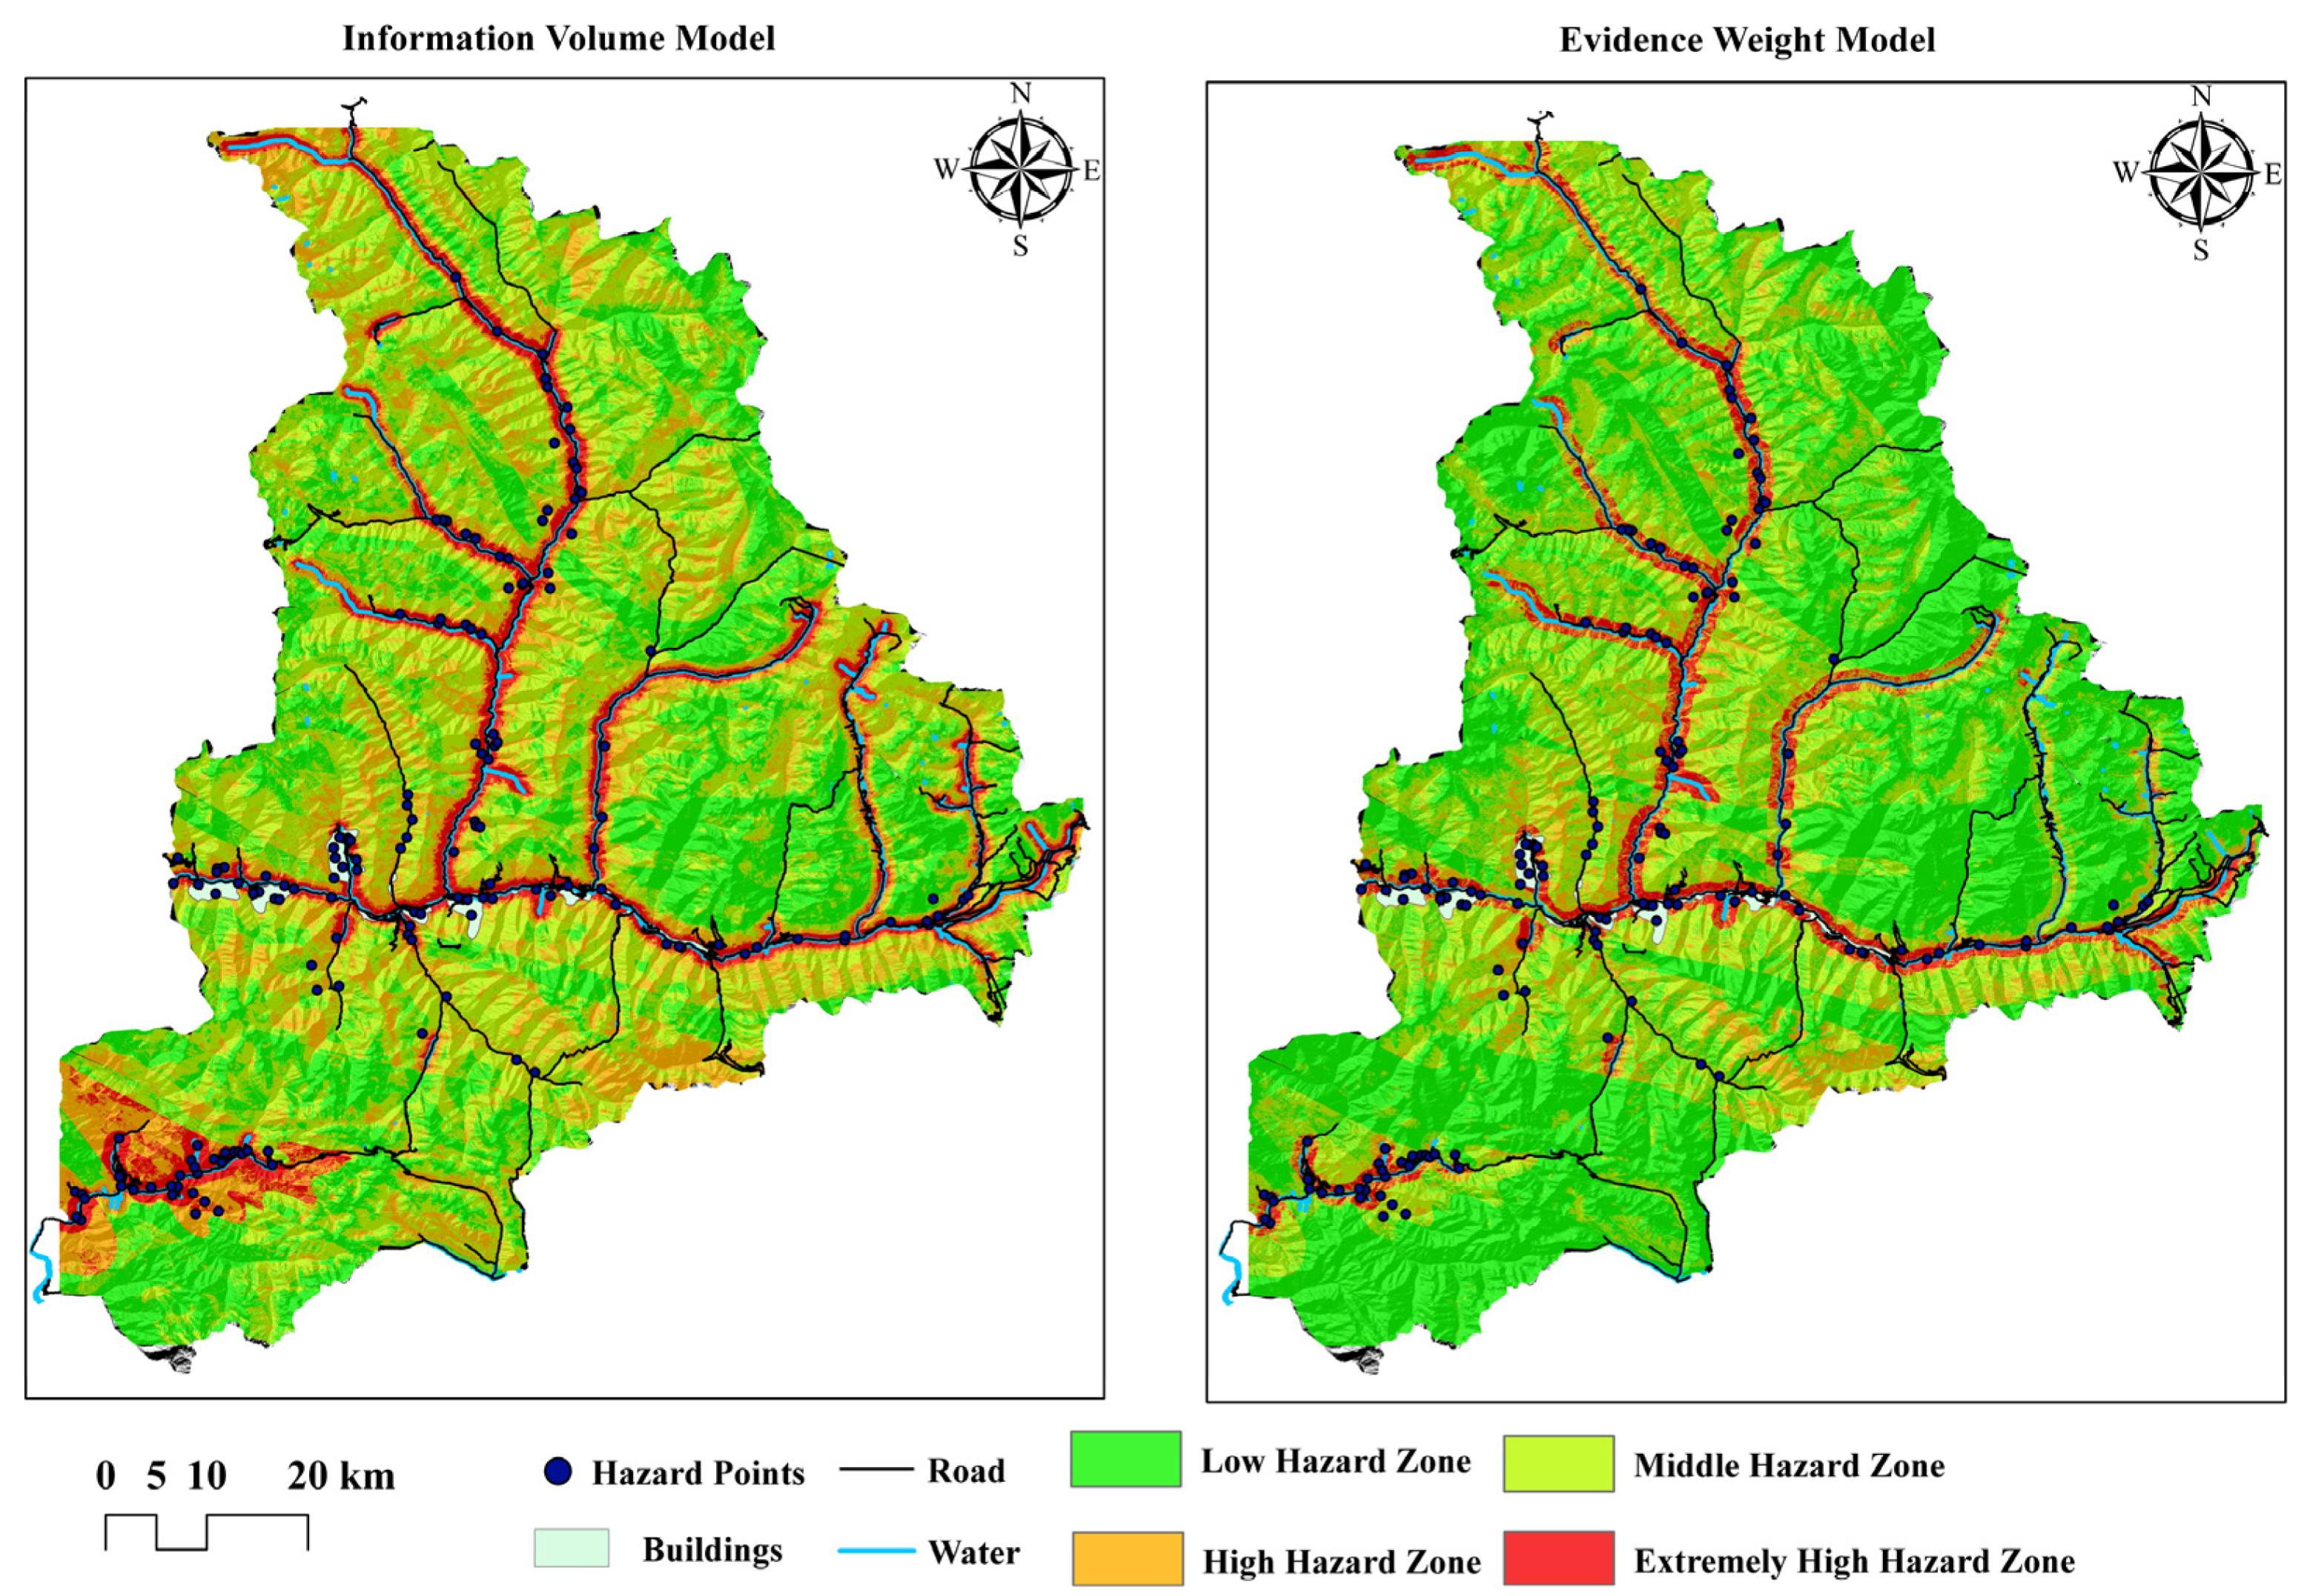
4.1. Results

This study employs both the information volume and evidence weight models, using grid units as the evaluation units. By performing grid calculations on 11 influencing factors, the information volume model and the evidence weight model were applied to assign weights and overlay them, ultimately resulting in the geological hazard risk zoning for Xiaojin County, as shown in Figure 5. A total of 152 disaster points were used for hazard zoning validation, including 82 landslides, 23 debris flows, 2 collapses, and 45 unstable slopes.
The hazard assessment results and the statistical distribution of geological disaster points are shown in Figure 5. As shown in Figure 5, the areas of medium and low hazard zones are the largest, while the disaster point density is highest in the high and very high hazard zones. Additionally, the high and very high-hazard zones in Xiaojin County are mainly concentrated along rivers and valleys. Furthermore, as indicated in Table 3, cross-validation with existing geological disaster points shows that 90.79% and 85.53% of the geological disaster points are located within the high and very high hazard zones defined by the information volume model and the evidence weight model, respectively. Therefore, the geological hazard risk assessment results obtained in this study show a good consistency with the distribution of existing geological disasters. In the areas of high and very high hazard zones of geological disasters, the information on ground objects such as roads, houses, and water systems is densely distributed, which will cause great losses once a disaster occurs. Therefore, disaster prevention and mitigation measures are essential.

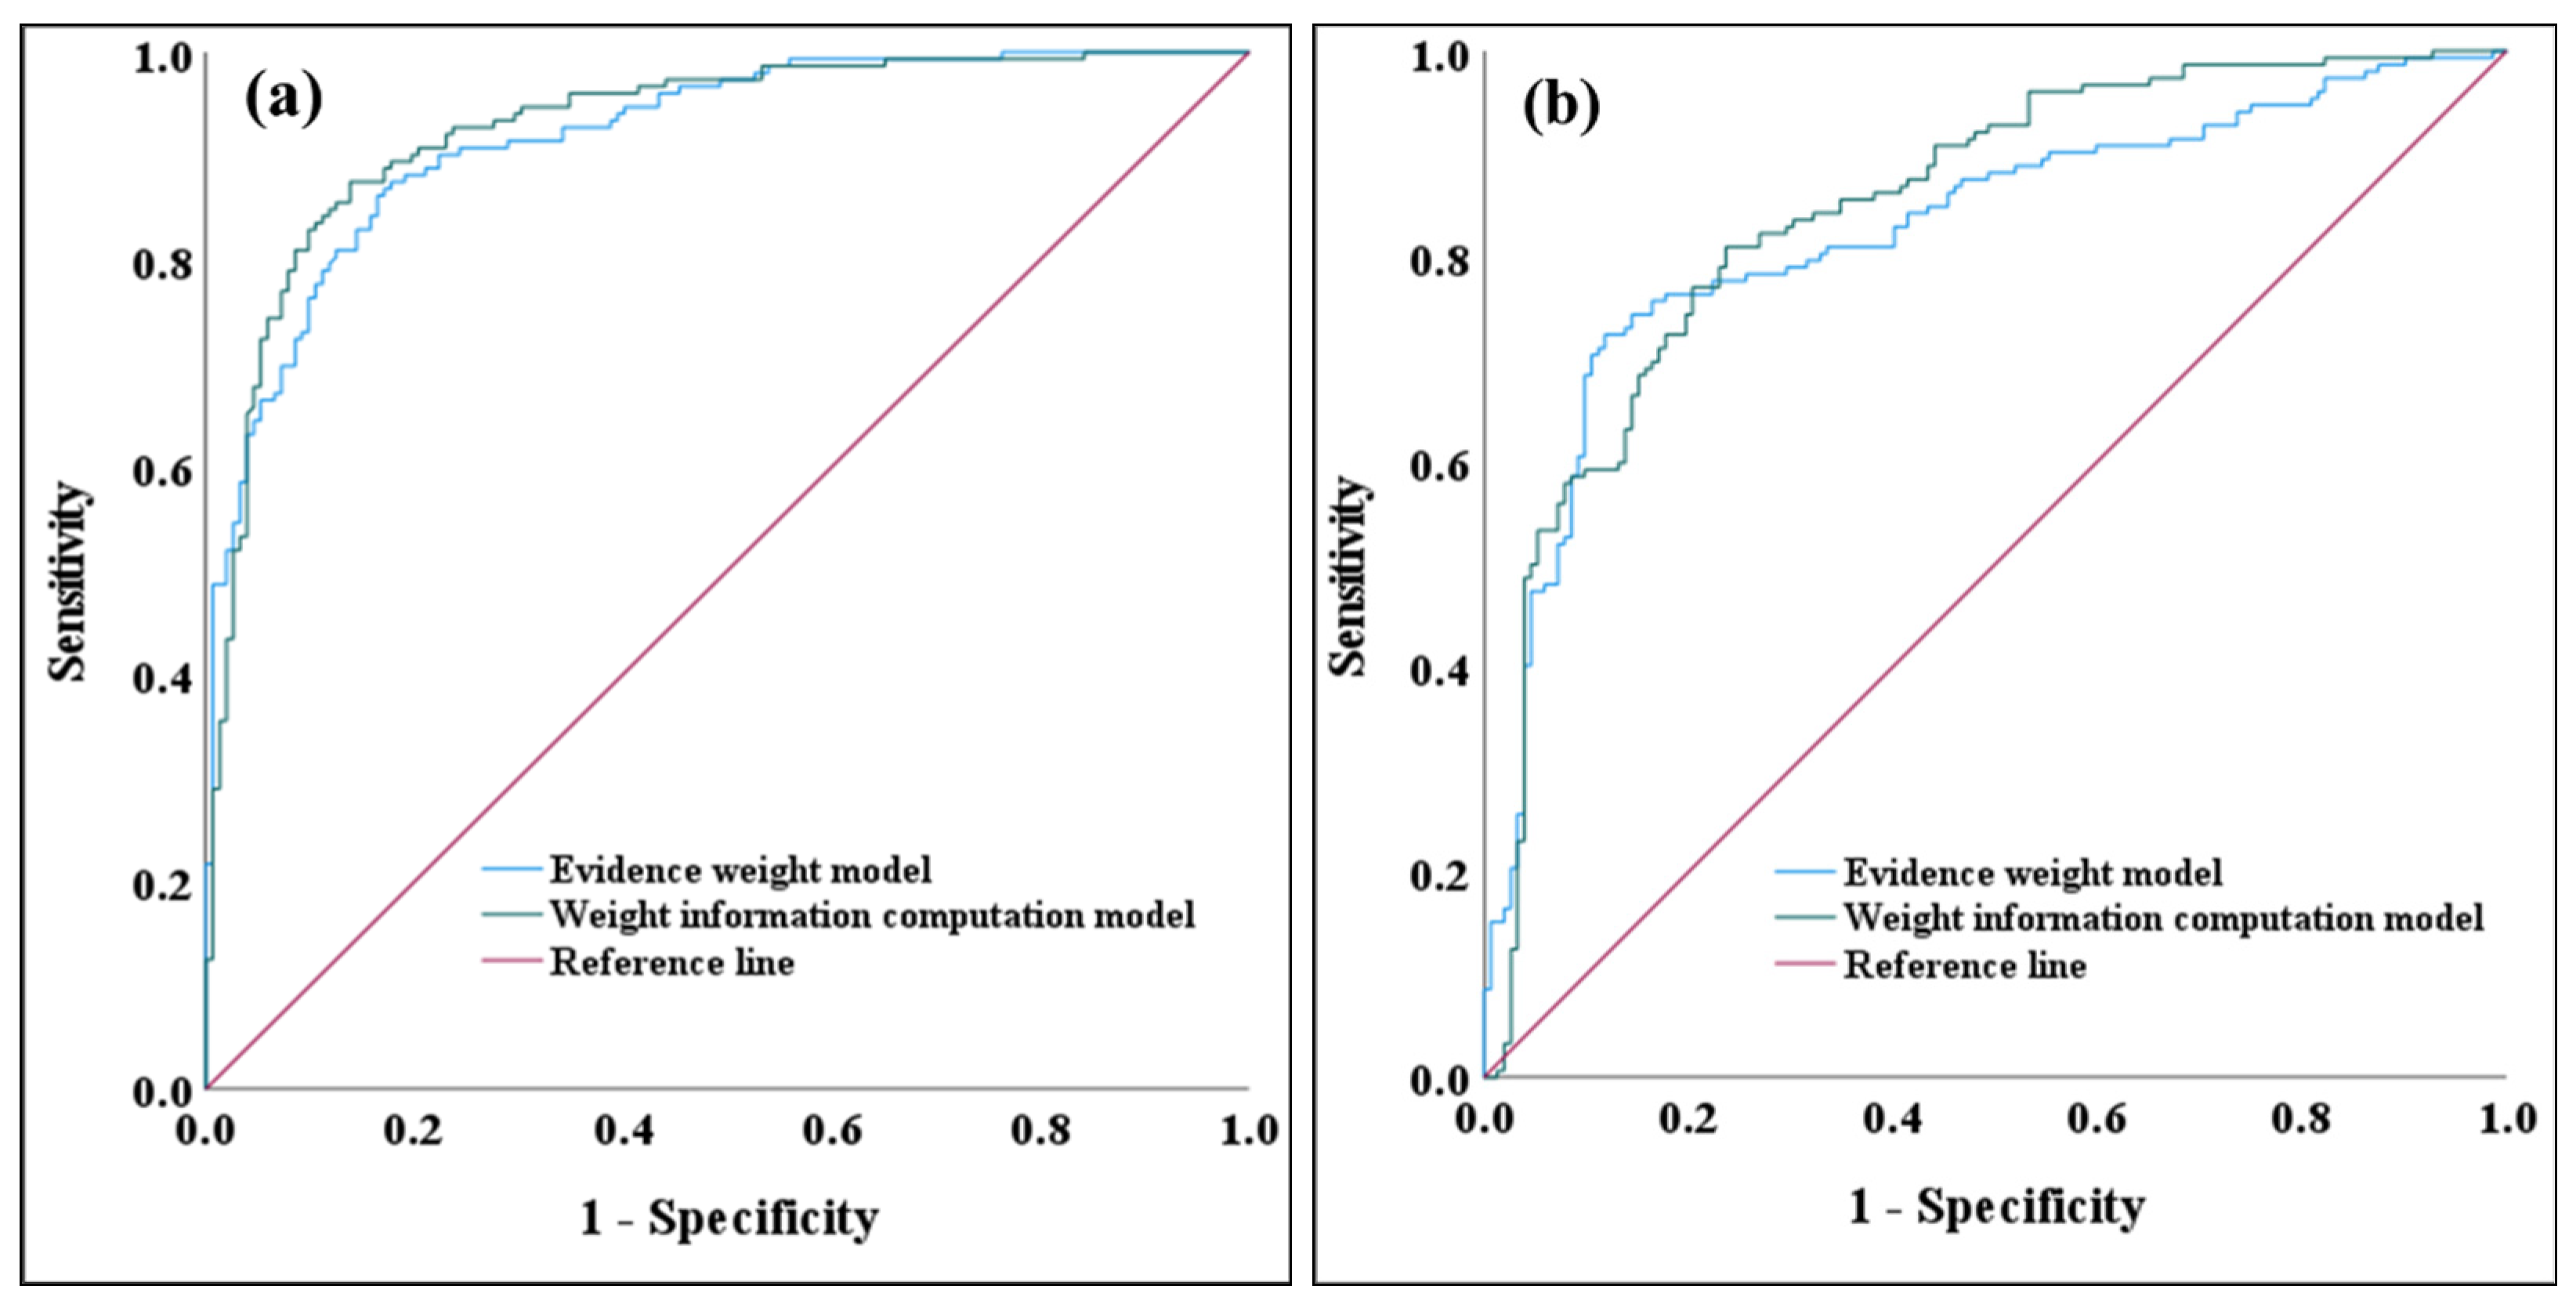
4.2. Accuracy Assessment

To evaluate the impact of time-series InSAR deformation data on the accuracy of the hazard assessment results, this study uses the ablation experiment method to compare the risk level assessment results of two models, with and without the inclusion of time-series InSAR deformation data as evaluation factors. The accuracy of the results is validated using the ROC (Receiver Operating Characteristic) curve [37]. The ROC curve is a tool used to assess the performance of classification models by calculating the AUC (Area Under the Curve) value, which is used to evaluate the accuracy of the model’s zoning results [38]. The AUC value is used to assess model accuracy, with an AUC between 0.5 and 0.7 indicating poor accuracy, an AUC between 0.7 and 0.9 indicating good accuracy, and an AUC above 0.9 indicating excellent accuracy. The closer the AUC value is to 1, the higher the model’s precision.
The experimental results are shown in Figure 6. The horizontal axis of the ROC curve represents the cumulative percentage of area, ranked from high to low information value, while the vertical axis represents the cumulative percentage of geological disaster points within the corresponding information value range. The AUC values obtained from the Information Value model before and after incorporating the time-series InSAR deformation results were 0.846 and 0.928, respectively. For the Evidence Weight model, the AUC values before and after including the time-series InSAR deformation results were 0.826 and 0.919, respectively. The results show the following: (1) After incorporating the time-series InSAR deformation results into the models, the accuracy of the hazard assessment results increased by 9.69% and 11.26% for the two evaluation models, respectively. This indicates that integrating time-series InSAR deformation data into the evaluation models can enhance the accuracy of hazard assessment; (2) There are differences in hazard zoning between the evaluation models. According to the hazard zoning results for Xiaojin County in this study, the Information Value model achieved higher accuracy than the Evidence Weight model, with the performance further improving after incorporating the InSAR monitoring results.

5. Conclusions

This study takes Xiaojin County as a case study to explore the application of time-series InSAR deformation results in geological hazard risk assessment. The ascending and descending orbit results of time-series InSAR deformation were incorporated as two evaluation factors into the geological hazard risk assessment model, combined with 11 other evaluation factors, including slope, aspect, lithology, and precipitation. The model was then used to perform hazard zoning and risk assessment for Xiaojin County.
From the hazard zoning map, it can be seen from the hazard zoning map that the high and very high hazard zones in Xiaojin County are mainly concentrated along rivers and valleys. The overlay analysis of the hazard assessment results and geological disaster points shows the proportion of existing disaster points in the Information Volume Model and Evidence Weight Model as follows: In the low hazard zone, the proportions are 0.66% and 2.63%, respectively; in the medium hazard zone, the proportions are 8.55% and 11.84%; in the high hazard zone, the proportions are 17.76% and 26.32%; and in the very high hazard zone, the proportions are 73.03% and 59.21%, respectively. By comparing with existing geological disaster points, the hazard assessment results for Xiaojin County, which integrate time-series InSAR deformation data, show good consistency with the distribution of existing geological disasters. Therefore, by providing detailed risk zoning and risk factor analysis, this study provides a scientific basis for urban planning and infrastructure construction, helping to designate more effective disaster prevention and reduction protocols to ensure the safety of urban construction and infrastructure.
Comparing the evaluation accuracy of the Information Volume Model and the Evidence Weight Model, ROC curves were plotted before and after incorporating the time-series InSAR deformation results into both models. The AUC values for the Information Volume Model were higher than those for the Evidence Weight Model. After integrating the time-series InSAR deformation monitoring results, the evaluation accuracy of the Information Volume Model and Evidence Weight Model improved by 9.69% and 11.26%, respectively. In terms of hazard zoning accuracy, the results from the Information Volume Model were superior to those from the Evidence Weight Model. The hazard assessment results for the Information Volume Model after incorporating time-series InSAR deformation data are as follows: low hazard zone area of 1518.95 km2 (27.28%), medium hazard zone area of 2402.04 km2 (43.1%), high hazard zone area of 1077.96 km2 (19.36%), and very high hazard zone area of 569.05 km2 (10.22%). The high and very high hazard zones are primarily concentrated along rivers and valleys at lower altitudes.

Author Contributions

J.L. and Y.W. put forward the idea of this paper. Z.Y. processed and analyzed the sentinel data and geological hazard risk assessment, contributed to the manuscript of the paper, made criticisms, and revised the manuscript. Z.Y. analyzes the results of SBAS-InSAR. S.Y. analyzed the ROC curves and criticized the manuscript. L.T. analyzed the information volume model and the evidence weight model and made criticism of the manuscript. All authors have read and agreed to the published version of the manuscript.

Funding

This research received no external funding.

Institutional Review Board Statement

Not applicable.

Informed Consent Statement

Not applicable.

Data Availability Statement

The data presented in this study are openly available in these webpages: Sentinel-1A (https://dataspace.copernicus.eu/, accessed on 10 May 2023), DEM (http://srtm.csi.cgiar.org/srtmdata, accessed on 10 May 2023), satellite precise orbit data (https://s1qc.asf.alaska.edu/aux_poeorb/, accessed on 10 May 2023), stratigraphic lithology data (https://www.ngac.cn/, accessed on 12 May 2023), Fault zone data (https://www.ngac.cn/, accessed on 10 June 2023), land use data (https://viewer.esa-worldcover.org/worldcover/, accessed on 20 May 2023), soil types data (https://www.resdc.cn/, accessed on 23 May 2023), river data (https://www.openstreetmap.org/, accessed on 10 June 2023), road data (https://www.openstreetmap.org/, accessed on 10 June 2023), Landsat8 data (http://www.gscloud.cn/, accessed on 5 June 2023), rainfall data (http://data.cma.cn, accessed on 12 June 2023).

Acknowledgments

Thanks to the Sentinel-1A image and satellite precise orbit data provided by ESA, DEM data provided by NASA, stratigraphic lithology and fault zone data provided by NGAC, land use type data provided by ESA, soil type data provided by Resource and Environmental Science Data Platform, river and road data provided by OpenStreetMap, Landsat8 data provided by Geospatial Data Cloud, rainfall data provided by China National Meteorological Science Data Center, disaster points data provided by China Geological Environment Monitoring Institute.

Conflicts of Interest

The authors declare no conflicts of interest.

References

  1. Zhang, J.; Qian, J.; Lu, Y.; Li, X.; Song, Z. Study on Landslide Susceptibility Based on Multi-Model Coupling: A Case Study of Sichuan Province, China. Sustainability 2024, 16, 6803. [Google Scholar] [CrossRef]
  2. Cheng, Y.; Gan, Y.; Shi, C.; Huo, A.; Pei, Y.; Song, Y.; Wang, X.; Ahmed, A. A Critical Analysis of Geological Hazard Risk Assessment Including Future Perspectives. Sustainability 2024, 16, 3701. [Google Scholar] [CrossRef]
  3. Zhang, X.; Jiang, L.; Deng, W.; Shu, Z.; Gao, M.; Liu, G. Risk Assessment of Geological Hazards in the Alpine Gorge Region and Its Influencing Factors: A Case Study of Jiulong County, China. Sustainability 2024, 16, 1949. [Google Scholar] [CrossRef]
  4. Fan, Z.; Gou, X.; Qin, M.; Fan, Q.; Yu, J.; Zhao, J. Information and logistic regression models based coupl-Ing analysis for susceptibility of geological hazards. J. Eng. Geol. 2018, 26, 340–347. [Google Scholar]
  5. Dong, J.; Tung, Y.; Chen, C.; Liao, J.; Pan, Y. Logistic regression model for predicting the failure probability of a landslide dam. Eng. Geol. 2011, 117, 52–61. [Google Scholar] [CrossRef]
  6. Ba, Q.; Chen, Y.; Deng, S.; Wu, Q.; Yang, J.; Zhang, J. An Improved Information Value Model Based on Gray Clustering for Landslide Susceptibility Mapping. ISPRS Int. J. Geo-Inf. 2017, 6, 18. [Google Scholar] [CrossRef]
  7. Dou, J.; Yunus, A.P.; Tien Bui, D.; Sahana, M.; Chen, C.-W.; Zhu, Z.; Wang, W.; Thai Pham, B. Evaluating GIS-Based Multiple Statistical Models and Data Mining for Earthquake and Rainfall-Induced Landslide Susceptibility Using the LiDAR DEM. Remote Sens. 2019, 11, 638. [Google Scholar] [CrossRef]
  8. Wang, Y.; Nanehkaran, Y.A. GIS-based fuzzy logic technique for mapping landslide susceptibility analyzing in a coastal soft rock zone. Nat. Hazards 2024, 120, 10889–10921. [Google Scholar]
  9. Wei, A.; Li, D.; Zhou, Y.; Deng, Q.; Yan, L. A novel combination approach for karst collapse susceptibility assessment using the analytic hierarchy process, catastrophe, and entropy model. Nat. Hazards 2021, 105, 405–430. [Google Scholar]
  10. Hu, S.; Cao, M.; Li, T.; Qiu, H.; Zhang, Z.; Liu, Q.; Bao, Y. Danger assessment of earthquake-induced geological disasters in Shaanxi Province based on AHP and GIS. Quat. Sci. 2014, 34, 336–345. [Google Scholar]
  11. Zheng, Z.; Xie, C.; He, Y.; Zhu, M.; Huang, W.; Shao, T. Monitoring Potential Geological Hazards with Different InSAR Algorithms: The Case of Western Sichuan. Remote Sens. 2022, 14, 2049. [Google Scholar] [CrossRef]
  12. Dai, K.; Chen, C.; Shi, X.; Wu, M.; Feng, W.; Xu, Q.; Liang, R.; Zhuo, G.; Li, Z. Dynamic landslides susceptibility evaluation in Baihetan Dam area during extensive impoundment by integrating geological model and InSAR observations. Int. J. Appl. Earth Obs. Geoinf. 2023, 116, 103157. [Google Scholar] [CrossRef]
  13. Zhong, J.; Li, Q.; Zhang, J.; Luo, P.; Zhu, W. Risk Assessment of Geological Landslide Hazards Using D-InSAR and Remote Sensing. Remote Sens. 2024, 16, 345. [Google Scholar] [CrossRef]
  14. Du, Z.; Ge, L.; Ng, A.; Zhu, Q.; Horgan, F.; Zhang, Q. Risk assessment for tailings dams in Brumadinho of Brazil using InSAR time series approach. Sci. Total Environ. 2020, 717, 137125. [Google Scholar] [CrossRef]
  15. Ge, Q.; Sun, Q.; Zhang, N.; Hu, J. Evaluation of Geological Hazard Susceptibility of Baiyin City Based on Multi-temporal InSAR Deformation Measurements. Geomat. Inf. Sci. Wuhan Univ. 2024, 49, 1434–1443. [Google Scholar]
  16. Gao, B.; He, Y.; Zhang, L.; Yao, S.; Yang, W.; Chen, Y.; He, X.; Zhao, Z.; Chen, H. Dynamic evaluation of landslide susceptibility by CNN considering InSAR deformation: A case study of Liujiaxia reservoir. Chin. J. Rock Mech. Eng. 2023, 42, 450–465. [Google Scholar]
  17. Yuan, R.; Chen, J. A hybrid deep learning method for landslide susceptibility analysis with the application of InSAR data. Nat. Hazards 2022, 114, 1393–1426. [Google Scholar] [CrossRef]
  18. Novellino, A.; Cesarano, M.; Cappelletti, P.; Martire, D.; Napoli, M.; Ramondini, M.; Sowter, A.; Calcaterra, D. Slow-moving landslide risk assessment combining Machine Learning and InSAR techniques. Catena 2021, 203, 105317. [Google Scholar] [CrossRef]
  19. Carl, T.; Intrieri, E.; Raspini, F.; Bardi, F.; Farina, P.; Ferretti, A.; Colombo, D.; Novali, F.; Casagli, N. Perspectives on the prediction of catastrophic slopefailures from satellite InSAR. Sci. Rep. 2019, 9, 14137. [Google Scholar]
  20. Lu, P.; Catani, F.; Tofani, V.; Casagli, N. Quantitative hazard and risk assessment for slow-moving landslides from Persistent Scatterer Interferometry. Landslides 2014, 11, 685–696. [Google Scholar] [CrossRef]
  21. Ciampalini, A.; Raspini, F.; Lagomarsino, D.; Catani, F.; Casagli, N. Landslide susceptibility map refinement using PSInSAR data. Remote Sens. Environ. 2016, 184, 302–315. [Google Scholar]
  22. Li, J.; Jin, G.; Xiong, X.; Zhou, L.; Ye, H.; Shi, Q.; Yang, H. Surface time series response and deformation cause analysis in 2021 Zhengzhou extreme weather, China. Earth Space Sci. 2024, 11, 3643. [Google Scholar] [CrossRef]
  23. Li, J.; Zhou, L.; Zhu, Z.; Qin, J.; Xian, L.; Zhang, D.; Huang, L. Surface Deformation Mechanism Analysis in Shanghai Areas Based on TS-InSAR Technology. Remote Sens. 2022, 14, 4368. [Google Scholar] [CrossRef]
  24. Zhao, Y.; Zhou, L.; Wang, C.; Li, J.; Qin, J.; Sheng, H.; Huang, L.; Li, X. Analysis of the Spatial and Temporal Evolution of Land Subsidence in Wuhan, China from 2017 to 2021. Remote Sens. 2022, 14, 3142. [Google Scholar] [CrossRef]
  25. Li, J.; Zhou, L.; Ren, C.; Liu, L.; Zhang, D.; Ma, J.; Shi, Y. Spatiotemporal Inversion and Mechanism Analysis of Surface Subsidence in Shanghai Area Based on Time-Series InSAR. Appl. Sci. 2021, 11, 7460. [Google Scholar] [CrossRef]
  26. Escanoglu, M.; Gokceoglu, C. Assessment of landslide susceptibility for a landslide-prone area (north of Yenice, NW Turkey) by fuzzy approach. Environ. Geol. 2002, 41, 720–730. [Google Scholar]
  27. Oh, H.; Pradhan, B. Application of a neuro-fuzzy model to landslide-susceptibility mapping for shallow landslides in a tropical hilly area. Comput. Geosci. 2011, 37, 1264–1276. [Google Scholar]
  28. Wang, B.; Ma, X.; Shao, C.; Song, W.; Lv, F. Risk assessment of ground fissures based on AHP and information method. Explor. Eng. (Rock Soil Drill. Tunneling) 2018, 45, 91–96. [Google Scholar]
  29. Du, Q.; Fan, W.; Li, K.; Yang, D.; Lv, J. Geohazard susceptibility assessment by using binary logical regression and information value model. J. Catastrophology 2017, 32, 220–226. [Google Scholar]
  30. Kumar, R.; Anbalagan, R. Landslide susceptibility mapping using analytical hierarchy process (AHP) in Tehri reservoir rim region, Uttarakhand. J. Geol. Soc. India 2016, 87, 271–286. [Google Scholar]
  31. Liu, R.; Xin, Y.; Li, Y. Dynamic signature verification method based on Pearson correlation coefficient. Chin. J. Sci. Instrum. 2022, 43, 279–287. [Google Scholar]
  32. Shannon, C. A mathematical theory of communication. Bell Syst. Tech. J. 1948, 27, 379–423. [Google Scholar]
  33. Li, R.; Tan, S.; Zhang, M.; Zhang, S.; Wang, H.; Zhu, L. Geological Disaster Susceptibility Evaluation Using a Random Forest Empowerment Information Quantity Model. Sustainability 2024, 16, 765. [Google Scholar] [CrossRef]
  34. Xu, W.; Yu, W.; Jing, S.; Zhang, G.; Huang, J. Debris flow susceptibility assessment by GIS and information value model in a large-scale region, Sichuan Province (China). Nat. Hazards 2013, 65, 1379–1392. [Google Scholar]
  35. Zhang, G.; Wang, S.; Chen, Z.; Liu, Y.; Xu, Z.; Zhao, R. Landslide susceptibility evaluation integrating weight of evidence model and InSAR results, west of Hubei Province, China. Egypt. J. Remote Sens. Space Sci. 2023, 26, 95–106. [Google Scholar]
  36. Goyes-Peñafiel, P.; Hernandez-Rojas, A. Landslide susceptibility index based on the integration of logistic regression and weights of evidence: A case study in Popayan, Colombia. Eng. Geol. 2021, 280, 105958. [Google Scholar]
  37. Jiang, W.G.; Rao, P.Z.; Cao, R.; Tang, Z.H.; Chen, K. Comparative evaluation of geological disaster susceptibility using multi-regression methods and spatial accuracy validation. J. Geogr. Sci. 2017, 27, 439–462. [Google Scholar] [CrossRef]
  38. Wang, X.D.; Zhang, C.B.; Wang, C.; Liu, G.W.; Wang, H.X. GIS-based for prediction and prevention of environmental geological disaster susceptibility: From a perspective of sustainable development. Ecotoxicol. Environ. Saf. 2021, 226, 112881. [Google Scholar]
Figure 1. Geographical Location of Xiaojin County.
Applsci 15 04143 g001
Figure 2. Deformation rate in Xiaojin County from January 2021 to December 2021.
Applsci 15 04143 g002
Figure 3. Geological disaster evaluation factors. (a) Slope (Sl.); (b) Surface undulation (S.U.); (c) Aspect (As.); (d) Humidity (Hu.); (e) I Distance to road (D.Ro.); (f) Distance to river (D.Ri.); (g) Distance to fault zone (D.F.Z.); (h) Formation lithology (F.L.); (i) Vegetation coverage (V.C.); (j) Rainfall (Ra.); (k) Land use type (L.U.); (l) Soil type (So.); (m) Ascending deformation (A.D.); (n) Descending deformation (D.D.).
Applsci 15 04143 g003
Figure 4. Correlation coefficients among evaluation factors.
Applsci 15 04143 g004
Figure 5. Geological hazard risk zoning map.
Applsci 15 04143 g005
Figure 6. Receiver operating characteristic curve. (a) InSAR deformation results were added to the factor, (b) InSAR deformation results were not added to the factor.
Applsci 15 04143 g006
Table 1. Factor data information.
DataEvaluation FactorsResolutionData Source
Sentinel-1AInSAR deformation20 mhttps://dataspace.copernicus.eu/ (accessed on 10 May 2023)
DEMSlope, aspect, and terrain undulation30 mhttp://srtm.csi.cgiar.org/srtmdata (accessed on 10 May 2023)
Stratigraphic lithologyStratigraphic lithology2 kmhttps://www.ngac.cn/ (accessed on 12 May 2023)
Fault zoneDistance from the fault zone2 kmhttps://www.ngac.cn/ (accessed on 10 June 2023)
Land useLand use type10 kmhttps://viewer.esa-worldcover.org/worldcover/ (accessed on 20 May 2023)
Soil typesSoil types1 kmhttps://www.resdc.cn/ (accessed on 23 May 2023)
RiverDistance from river1 kmhttps://www.openstreetmap.org/ (accessed on 10 June 2023)
RoadDistance from road1 kmhttps://www.openstreetmap.org/ (accessed on 10 June 2023)
Landsant8Vegetation coverage30 mhttp://www.gscloud.cn/ (accessed on 5 June 2023)
Rainfall dataAnnual average rainfall1 kmhttp://data.cma.cn (accessed on 12 June 2023)
Table 2. Basic parameters of Sentinel-1A image.
ParametersDescription
SatelliteSentinel-1A
Imaging modeIW
Data typeSLC
BandC
Revisit cycle12 days
PolarizationVV
Time spanJanuary 2021–December 2021
Orbit direction
Central incidence angle on the test site
Ascending and Descending
33.7° and 35.3°
Number of scenes23 and 23
Table 3. Comparison between the results of hazard assessment and the distribution of existing geological disasters.
Hazard LevelArea Ratio
(IVM)
Area Ratio
(EWM)
NEGHP
(IVM)
NEGHP
(EWM)
PEGHP
(IVM)
PEGHP
(EWM)
NEGHPA
(IVM)
NEGHPA
(EWM)
Low hazardous area27.28%50.93%140.66%2.63%0.00070.0014
Medium hazardous area43.14%33.18%13188.55%11.84%0.00550.0099
High hazardous area19.36%9.04%274017.76%26.32%0.02550.0809
Extremely hazardous area10.22%6.85%1119073.03%59.21%0.19860.2403
NEGHP: Number of existing geological disaster points; PEGHP: Proportion of existing geological disaster points; IVM: Information Volume Model; EWM: Evidence Weight Model; NEGHPA: Number of existing geological disaster points per unit area.
Disclaimer/Publisher’s Note: The statements, opinions and data contained in all publications are solely those of the individual author(s) and contributor(s) and not of MDPI and/or the editor(s). MDPI and/or the editor(s) disclaim responsibility for any injury to people or property resulting from any ideas, methods, instructions or products referred to in the content.

