Article

Enhanced Conditional Ground Motion Selection Model Considering Spectral Compatibility and Variability of Three Components for Multi-Directional Analysis

1
Department of Civil Engineering, Bolu Abant Izzet Baysal University, Bolu 14030, Türkiye
2
Department of Civil Engineering, Istanbul Arel University, Istanbul 34537, Türkiye
3
Department of Civil Engineering, Pamukkale University, Denizli 20070, Türkiye
*
Author to whom correspondence should be addressed.
Appl. Sci. 2025, 15(8), 4135; https://doi.org/10.3390/app15084135
Submission received: 12 February 2025 / Revised: 6 April 2025 / Accepted: 7 April 2025 / Published: 9 April 2025
(This article belongs to the Section Civil Engineering)

Abstract

:
In this study, the solution model based on the stochastic harmony search algorithm was proposed to obtain real ground motion (GM) records for nonlinear dynamic analysis of structures. Obtaining the GM record problem was formulated as a constrained engineering optimization problem. The solution model ensures spectral compatibility between the mean horizontal spectrum of selected ground motion (GM) records and the target horizontal spectrum, as well as the mean vertical spectrum of the selected GMs with the target vertical spectrum. This model also allows the management of record-to-record variability in both horizontal and vertical components of the selected GMs. Moreover, the model effectively addresses the period-dependent record-to-record variability in all orientations of seismic excitations simultaneously using a single-scale value, preserving the relative amplitude and phasing of actual GM components. The efficiency of the model has been demonstrated through numerical examples with various uniform hazard spectra, specifically those based on Eurocode-8 and the Turkish Building Earthquake Code, as well as scenario-based target spectra. The results demonstrate that through using the proposed model it is possible to obtain GM records with the desired spectral compatibility and spectral dispersion for both horizontal and vertical GM components. Thus, the model can be used as an efficient way to obtain appropriate GM records for nonlinear dynamic analyses of both two- and three-dimensional structural models for performance-based designs and/or evaluation frameworks, considering seismic excitations in both horizontal and vertical directions.

1. Introduction

Recently, nonlinear dynamic analysis (NDA) has gained significant traction in the performance-based design and assessment of structures, as it is recognized as the most precise approach available. NDA takes into account energy absorption and force redistribution due to progressive deterioration in the inelastic range, as well as the influence of higher modes. To ensure the overall reliability of NDA, it is essential to both develop a robust nonlinear structural model and select ground motion (GM) records that align with the seismic hazard of the area being studied [1,2,3]. The use of actual GM records from prior earthquake events is the most common practice for NDA, as these records encapsulate the seismic GM characteristics effectively [4,5,6,7].
Spectral matching is a widely employed technique for the selection of actual ground motions (GMs). This method focuses on the spectral compatibility between the spectra of selected GMs and the designated spectral target. There are mainly two approaches associated with this technique: scenario-based and target-based. In the former approach, seismological and site parameters related to specific earthquake scenarios of interest are primarily taken into account. Subsequently, efforts are made to achieve the necessary compatibility with the spectral target. In the latter approach, GM selection is performed based on the compatibility with the spectral target, initially considering the relevant earthquake magnitude, distance, and local soil class. The uniform hazard spectrum (UHS) is commonly used as the target spectrum. As an alternative to the UHS, the conditional mean spectrum or scenario-based spectra can be used [8,9,10]. Various procedures have been used for real GM selection based on spectral matching regardless of the target spectrum [11,12]. Modern seismic codes have also recommended spectral matching-based GM selection [13,14,15] and provide simplified guidelines for selection and scaling. To establish the necessary alignment between the mean and/or individual spectrum of selected GMs and the relevant target spectrum, the amplitudes of the GMs are consistently scaled [16,17,18,19].
GM selection procedures may vary according to structural typology. GM component sets are necessary for uni-directional analyses of 2D models where one of the horizontal axes is critical. In certain instances, bi-directional analyses of 3D models for particularly irregular buildings are essential [20]. For this purpose, GM component pair sets, consisting of two horizontal components of a record, are utilized [21,22,23,24]. The seismic response can significantly depend on the vertical component of ground motions for more complex structures, such as base-isolated buildings, long-span bridges, dams, and nuclear power plants [25,26,27]. These types of structures often exhibit greater sensitivity to acceleration compared to displacement. Additionally, the vertical component of seismic excitation can play a crucial role in the seismic performance of structures [28,29]. Therefore, the vertical component of ground motions should be included in the nonlinear dynamic analyses, necessitating three-dimensional analyses [28,29,30,31,32,33,34]. Furthermore, depending on the research needs, one or two horizontal components of a record can be used for uni-directional analyses. For instance, two horizontal components of the records were used by Ruggieri and Uva [35] to assess the capacity of both nonlinear static analysis and dynamic analysis for 2D archetype buildings. Also, Ruggieri and Vukobratović [36] used a 3D analysis model to capture acceleration demands for a plan irregular building and performed uni-directional analysis since the critical axes were determined as perpendicular to the floor eccentricity.
Various GM record sets can be obtained by selecting and amplitude scaling from online GM record databases [37,38,39]. Seismic responses obtained from NDAs are directly influenced by the ground motion records used. Consequently, these responses vary depending on the GM records utilized for the NDAs [40,41]. In light of this situation, it is essential to evaluate the statistical distribution of seismic responses—specifically their mean and variation—for effective seismic design and assessment. For instance, code-based seismic performance evaluations typically focus on the mean of seismic responses, such as the average derived from a minimum of seven analyses for Eurocode-8 (EC8) and at least eleven analyses for the Turkish Building Earthquake Code (TBEC). Importantly, this mean response is subject to variability due to differences in seismic records [5,20]. On the other hand, the mean and variability of seismic responses are essential for probabilistic risk assessment [42]. When selecting GMs, focusing solely on the spectral compatibility between the mean spectrum of the chosen GMs and the target spectrum can lead to an uncontrolled variation in the individual spectrum of the GMs. Depending on this situation, the variation in seismic responses can also be uncontrolled [21,37,43,44]. It should be noted that the variability of seismic responses derived from NDAs can be managed by controlling the variability of the individual spectra of the selected GMs [6]. Several researchers have taken into account both the mean and variability of the target spectrum in the selection of GMs [45,46,47,48].
The issue of selecting GMs using spectral matching can be framed as a constrained engineering optimization problem [23,49]. The predefined requirements to be selected for GMs are handled as the constraints of the problem. Harmony search (HS) is a stochastic algorithm employed for addressing engineering optimization challenges [50]. Recently, HS has also been used in the studies about GM selection [24,51]. In these studies, record-to-record spectral variability was not considered. Various stochastic algorithms were also used for only the selection of horizontal components considering the mean and variability [23,52,53,54,55].

Research Significance

Based on the discussions above, when selecting a GM for structural analysis emphasizing the vertical direction is particularly crucial for accurately determining structural response statistics and ensuring the safety and resilience of buildings. For this purpose, in this study an efficient stochastic HS-based solution model is proposed to select and consistently scale real GM records for NDAs of 2D and/or 3D structural models considering both horizontal and vertical seismic excitation. It should be noted that the desired spectral compatibility and record-to-record spectral variability for horizontal and vertical components of selected GMs can be handled simultaneously by the proposed model. In addition, a single-scale value is used for both horizontal and vertical components of selected GMs to maintain the relative amplitude and phasing of GMs in all orientations. This option also shows the efficiency of the proposed solution algorithm by considering a stricter constraint about scale factors to be used for the components.
It is essential to emphasize that another utmost advantage (specifically, its substantial contribution) of the suggested model is its ability to select and scale GMs to achieve spectral compatibility with the target, as well as its variability derived from an available ground motion model (GMM), which differs from prior models found in the literature [32,45,46,47,48,51,52,53,54,55]. Prior models mainly concentrated on the definition of bounds to enhance spectral compatibility, which does not directly control the period-dependent record-to-record variability especially considering all three orientations and GMMs.
The efficiency of the proposed model went under investigation in a quantitative manner along with different numerical examples such as UHS-based modern seismic codes like EC8 and TBECand scenario-based target spectra. The results indicate that the proposed solution model can efficiently determine GM record sets that exhibit both the desired spectral compatibility and spectral variability for horizontal and vertical components simultaneously. By employing this model, it becomes feasible to obtain appropriate GM record sets for nonlinear dynamic analyses of both 2D and 3D structural models, taking into account horizontal and vertical seismic excitations within a probabilistic seismic risk assessment framework.

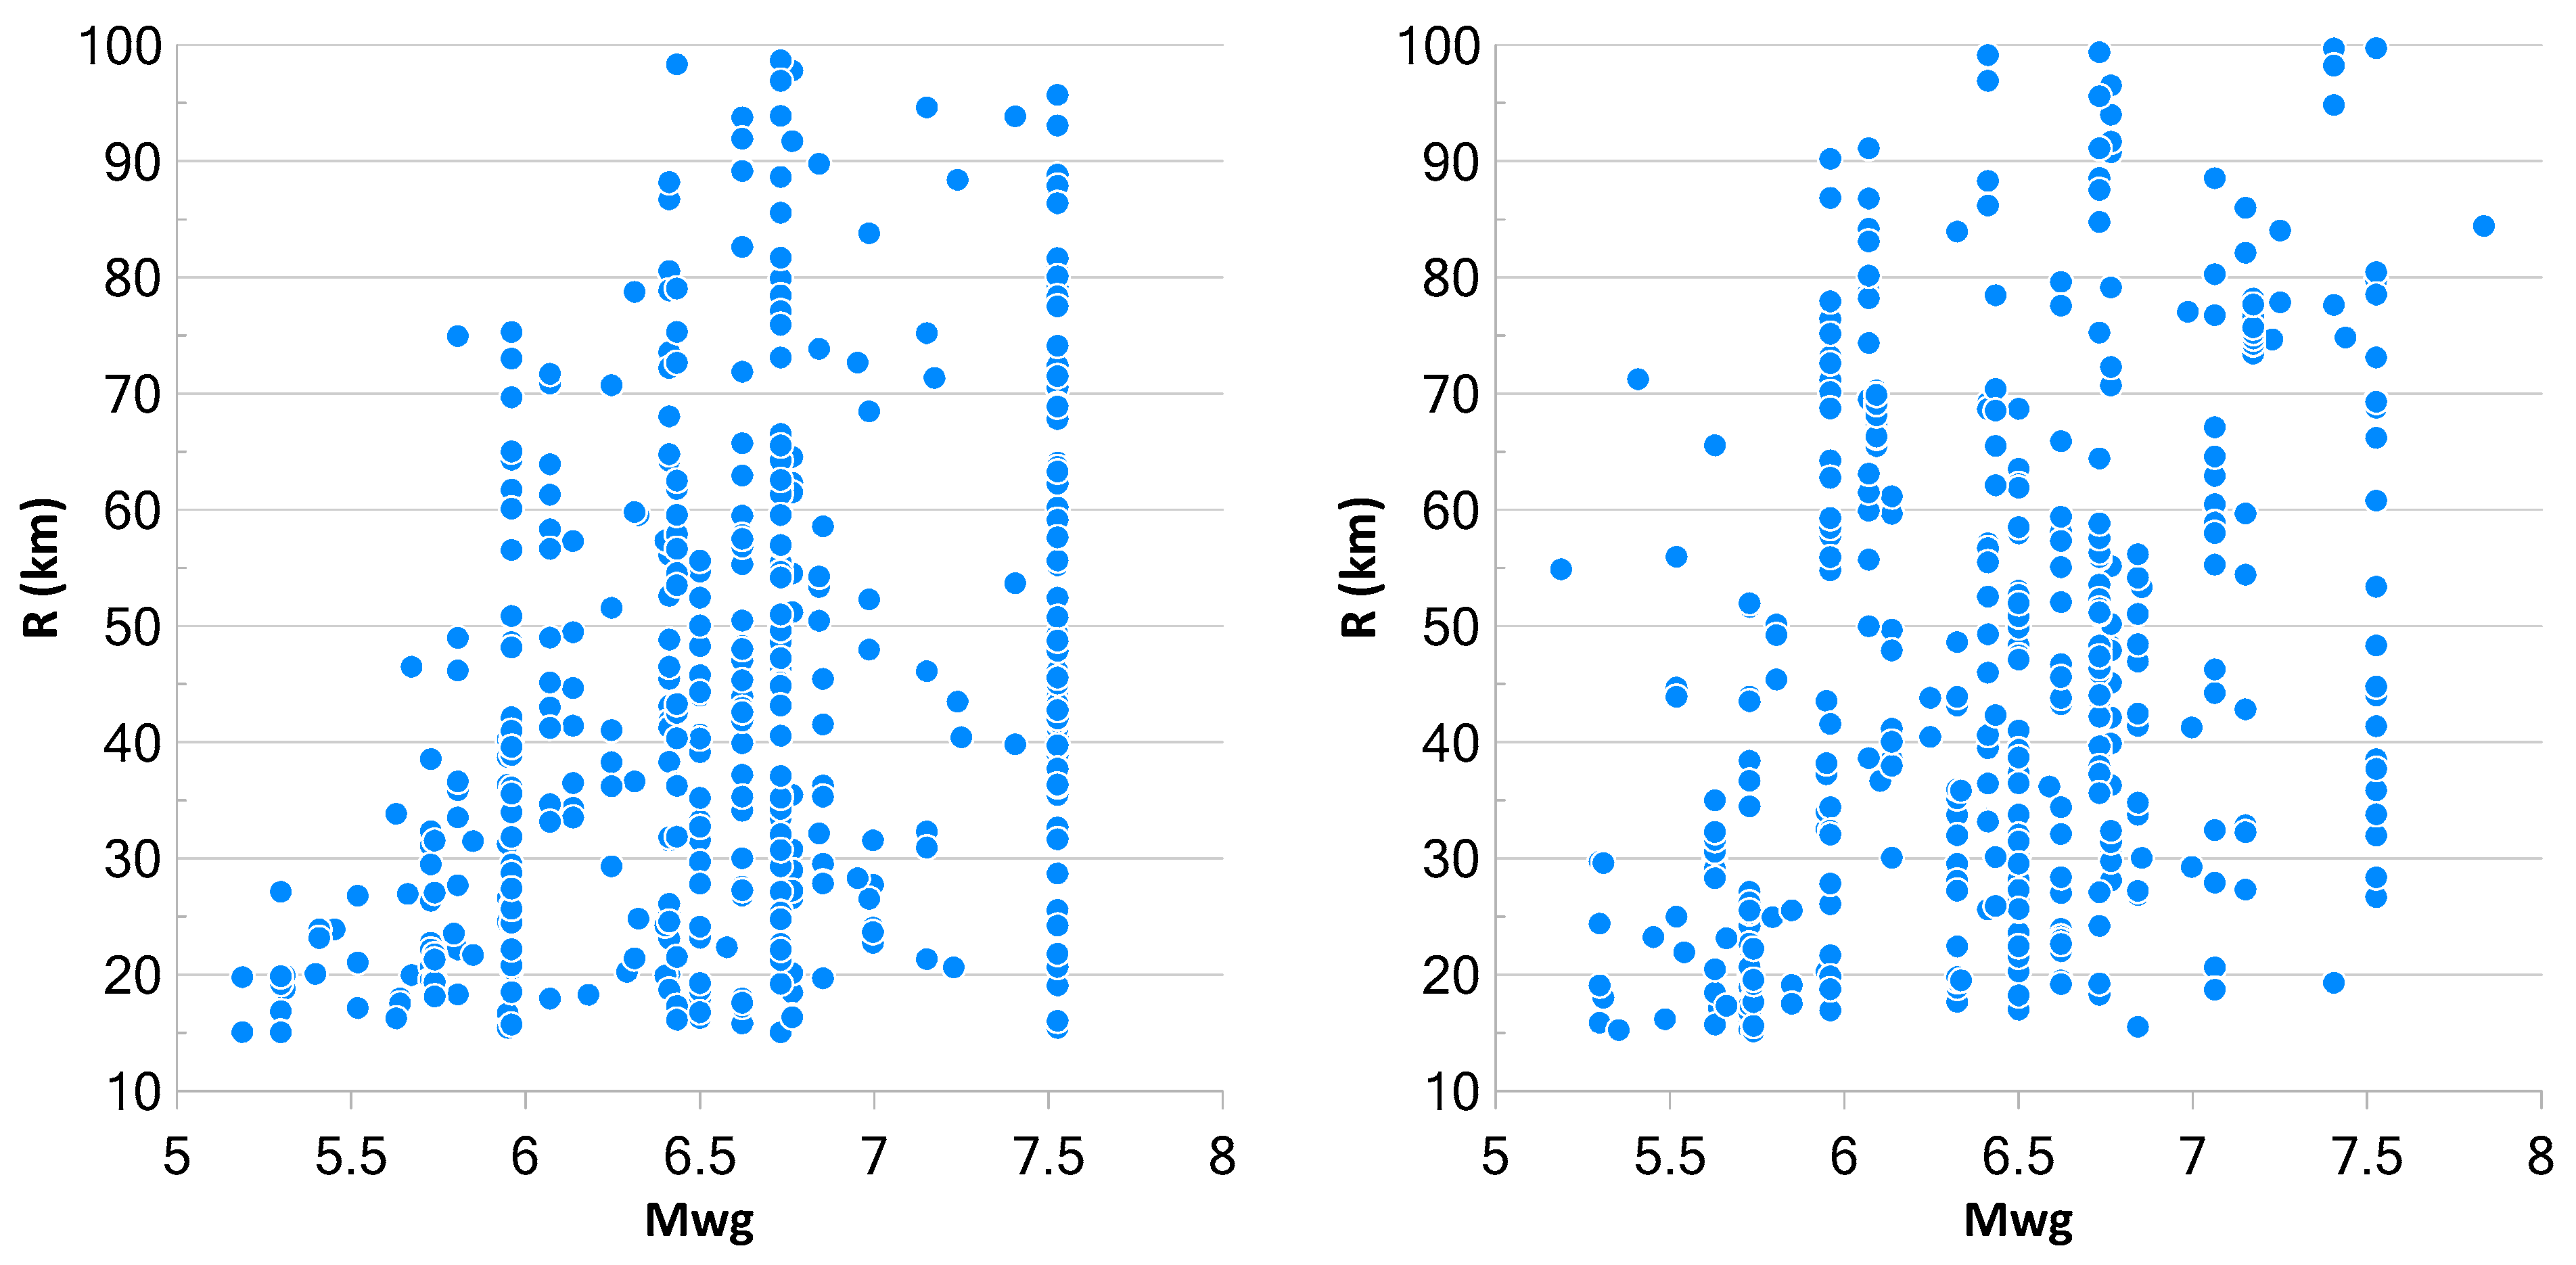
2. Ground Motion Record Selection

2.1. Spectral Matching-Based Record Selection

The GM records that should be utilized for the linear and/or nonlinear dynamic analyses must align with the designated level of the target spectrum, which is typically defined by the uniform hazard spectrum as per seismic codes, the conditional mean spectrum, and similar criteria. Different approaches can be employed, whether in the frequency domain or the time domain, to match real ground motion records with the corresponding target spectrum. Frequency-domain methods to adjust the frequency spectrum of the records or modify the original GM records by incorporating wavelets were studied by different researchers [56,57]. On the other hand, scaling the amplitude of the spectrum in time-domain methods are also used in the literature [24,58,59]. Several studies in the literature have assessed the alignment of the chosen GM spectra with the target spectra [58,59]. Iervolino et al. [59] used the δ parameter to assess the alignment of the selected GM spectra with the target spectra. It was observed that the δ parameter was between 4% and 17%. Another study conducted by Naeim et al. [58] used the MSE (mean squared error) parameter. In the study, the MSE was calculated as 3.1% and 4.3% for the considered period ranges. In this study, the MSE parameter is used to evaluate the alignment of the selected GM spectra with the target spectra. The equation of the MSE is given in Equation (1). In Equation (1), k denotes the number of equal segments for the specified period range, and Sa(Ti) indicates the spectral acceleration of the ith for the target spectra. Additionally, SM shows the spectral acceleration of the mean spectrum of selected GMs.
M S E = 1 k i = 1 k ( S M T i S a T i ) 2

2.2. Code-Based Record Selection

Modern seismic codes mainly use the spectral matching-based GM selection [13,14,15] and provide simplified and similar guidelines for the selection and scaling of GMs. Differences are mainly due to the number of GM records and period ranges for compatibility with the mean spectrum of selected GMs and the target spectrum. For example, EC8 recommends using seven GM records to evaluate the mean structural response, while both the TBEC and ASCE 7-16 suggest using eleven GM records. The period range where compatibility between the mean spectrum and target spectrum must be ensured should be 0.2T–2.0T, 0.2T–2.0T, and 0.2T–1.5T for EC8, ASCE 7-16, and the TBEC, respectively. The other difference is about the limit of the ratio of the mean spectrum to the target spectrum. The lower limits of this ratio are 0.90, 0.90, and 1.00 for EC8, ASCE 7-16, and the TBEC, respectively. Neither the compatibility of the individual spectrum in the sets nor the upper limit for the mean-spectrum-to-target-spectrum ratio is controlled in these codes. It is also worth noting that the choice of the period interval for matching may vary depending on the type of study. For building a specific analysis, the assumptions provided in these codes may be viable. On the other hand, the interval for matching can be larger for large-scale analysis.
It should be also noted that uni-directional and bi-directional analysis, which also affect the GM selection, are recommended for two- and three-dimensional structural models. For uni-directional analysis, one of two horizontal components for the critical axis of the structure is considered. The combined spectrum refers to the use of both horizontal GM component pairs for three-dimensional analysis. Generally, three types of combined spectra are employed: (a) the square root of the sum of squares (SRSS), (b) the geometric mean, and (c) period-dependent rotated spectra, which may include minimum (0th percentile), median (50th percentile), or maximum (100th percentile) directional values. The SRSS combined spectrum is used for three-dimensional analysis of structures according to the TBEC and EC8.
In this study, TBEC and EC8 target spectra were considered for GM selection in the orientation of horizontal and vertical directions. The parameters used to derive the target spectrum according to the TBEC and EC8 are given in Table 1. To assess the ability of the solution model, different local soil classes (i.e., Soil B and C for EC8 and Soil ZC and ZD for the TBEC) were also considered. It can be seen in the table that the Vs,30 values of distinct soil classes are different for both the seismic codes. The horizontal and vertical target spectra of the EC8 and TBEC are also given in Figure 1. The figure clearly illustrates that the capability of the solution model will be tested under a variety of target spectra for both seismic codes.
In this study, GM selection was performed considering real GM records obtained by recent earthquakes. These earthquakes have different spectral characteristics, such as earthquake magnitude, local soil types, the distance, etc. For this purpose, the Pacific Earthquake Engineering Research (PEER) database, which consists of thousands of records with different features, was used and three components (two horizontal (X and Y) and one vertical (Z)) of GM records were downloaded from it [60]. While downloading the GM records, the magnitude (Mw), epicentral distance (R), and Vs,30 were considered. GM records with an Mw value greater than 5.5 and a distance between 15 km and 100 km were downloaded. Considering the recently proposed Mwg scale, which uses body-wave magnitude instead of surface waves [61], Mwg values of the downloaded records are between 5.19 and 7.53 for Soil B-ZC and between 5.19 and 7.83 for Soil C-ZD. As a result, 467 and 498 GM records have been downloaded for Soil B-ZC and Soil C-ZD local soil classes, respectively. Mwg-R values of selected GM records for the catalogue are given in Figure 2. Figure 2 demonstrates the different features of the selected GM records.
In Figure 3, the target horizontal spectrum for the TBEC and EC8, mean and mean ± 0.5xSD (i.e., standard deviation), and spectrum of horizontal selected GMs for both soil classes are plotted. In the figure, the gray shaded areas illustrate the spectral acceleration distribution of individual earthquakes in the catalogue. As can be seen in the figure, the spectral acceleration values at T = 0.0 s (or peak ground acceleration (PGA) values) are between 0.048 g and 2.469 g for EC8_B and TBEC_ZC. The PGA values for EC8_C and TBEC_ZD local soil classes vary between 0.062 g and 0.883 g. It can be said that target horizontal spectra are placed in between the shaded areas, but this situation does not guarantee the perfect compatibility between them since the spectral shape of individual GMs is not equally matched with target horizontal spectra. Similarly, Figure 4 is plotted to illustrate the spectral shape and distribution of vertical spectra for the selected GMs and target vertical spectra for both soil classes. It can be observed that the distribution of vertical spectral acceleration is higher than the horizontal ones when the spectral acceleration range of shaded areas is compared.

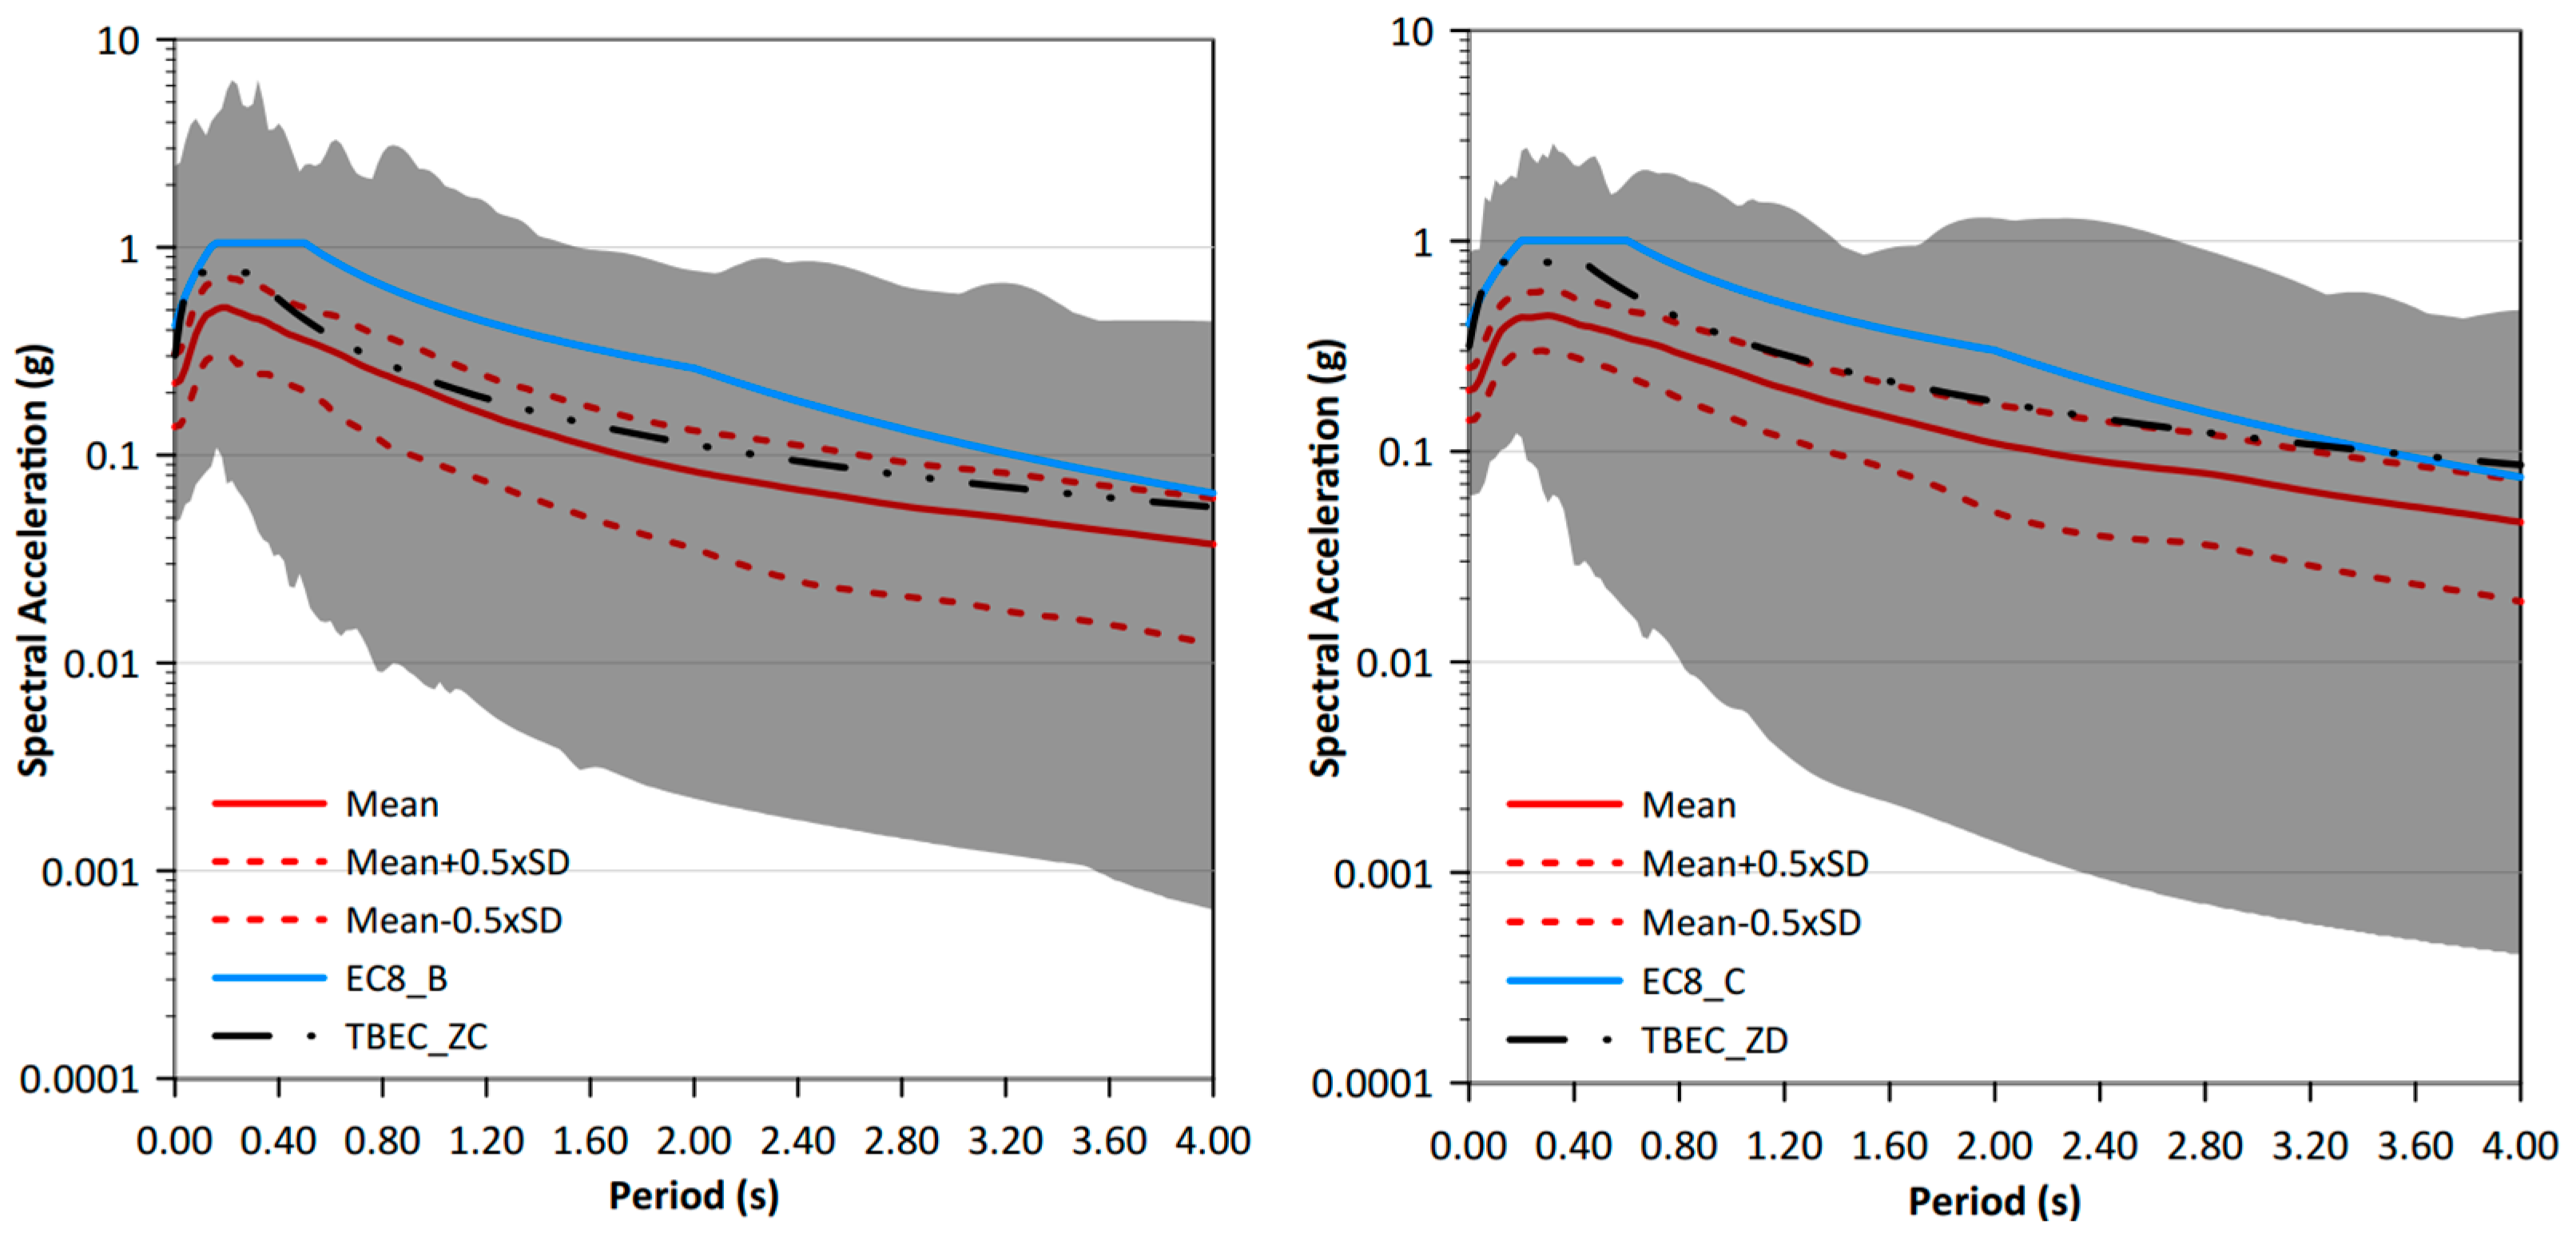
2.3. Record Selection Based on Scenario-Based Spectrum

To illustrate the ability of the suggested model, the spectral shape and variability of target spectra derived from an available ground motion model (GMM) are utilized. For this aim, target spectra determined from the deterministic seismic hazard analysis (DSHA) problem [9] were considered. In the problem, magnitudes (Mw) were provided as 5.5, 7.0, and 6.8 for three different line sources, respectively. The style of faulting was assumed as strike-slip style. The shear wave velocity was taken (Vs,30) 300 m/s and the epicentral distance (Repi) was used for the distance between the site and faults suitable for the problem. The controlling scenario earthquake was determined by a hypothetical earthquake with a magnitude of Mw = 7.0 and epicentral distance of Repi = 16 km. Using the controlling parameters such as Mw and Repi, the target horizontal spectrum and its standard deviation were calculated by the [62] GMM, and their vertical counterparts were computed from the [63] GMM. Scenario-based target horizontal and vertical target spectra, and their standard deviations, are plotted in Figure 5. In this study, these spectra were utilized when scenario-based GM record selection was performed.

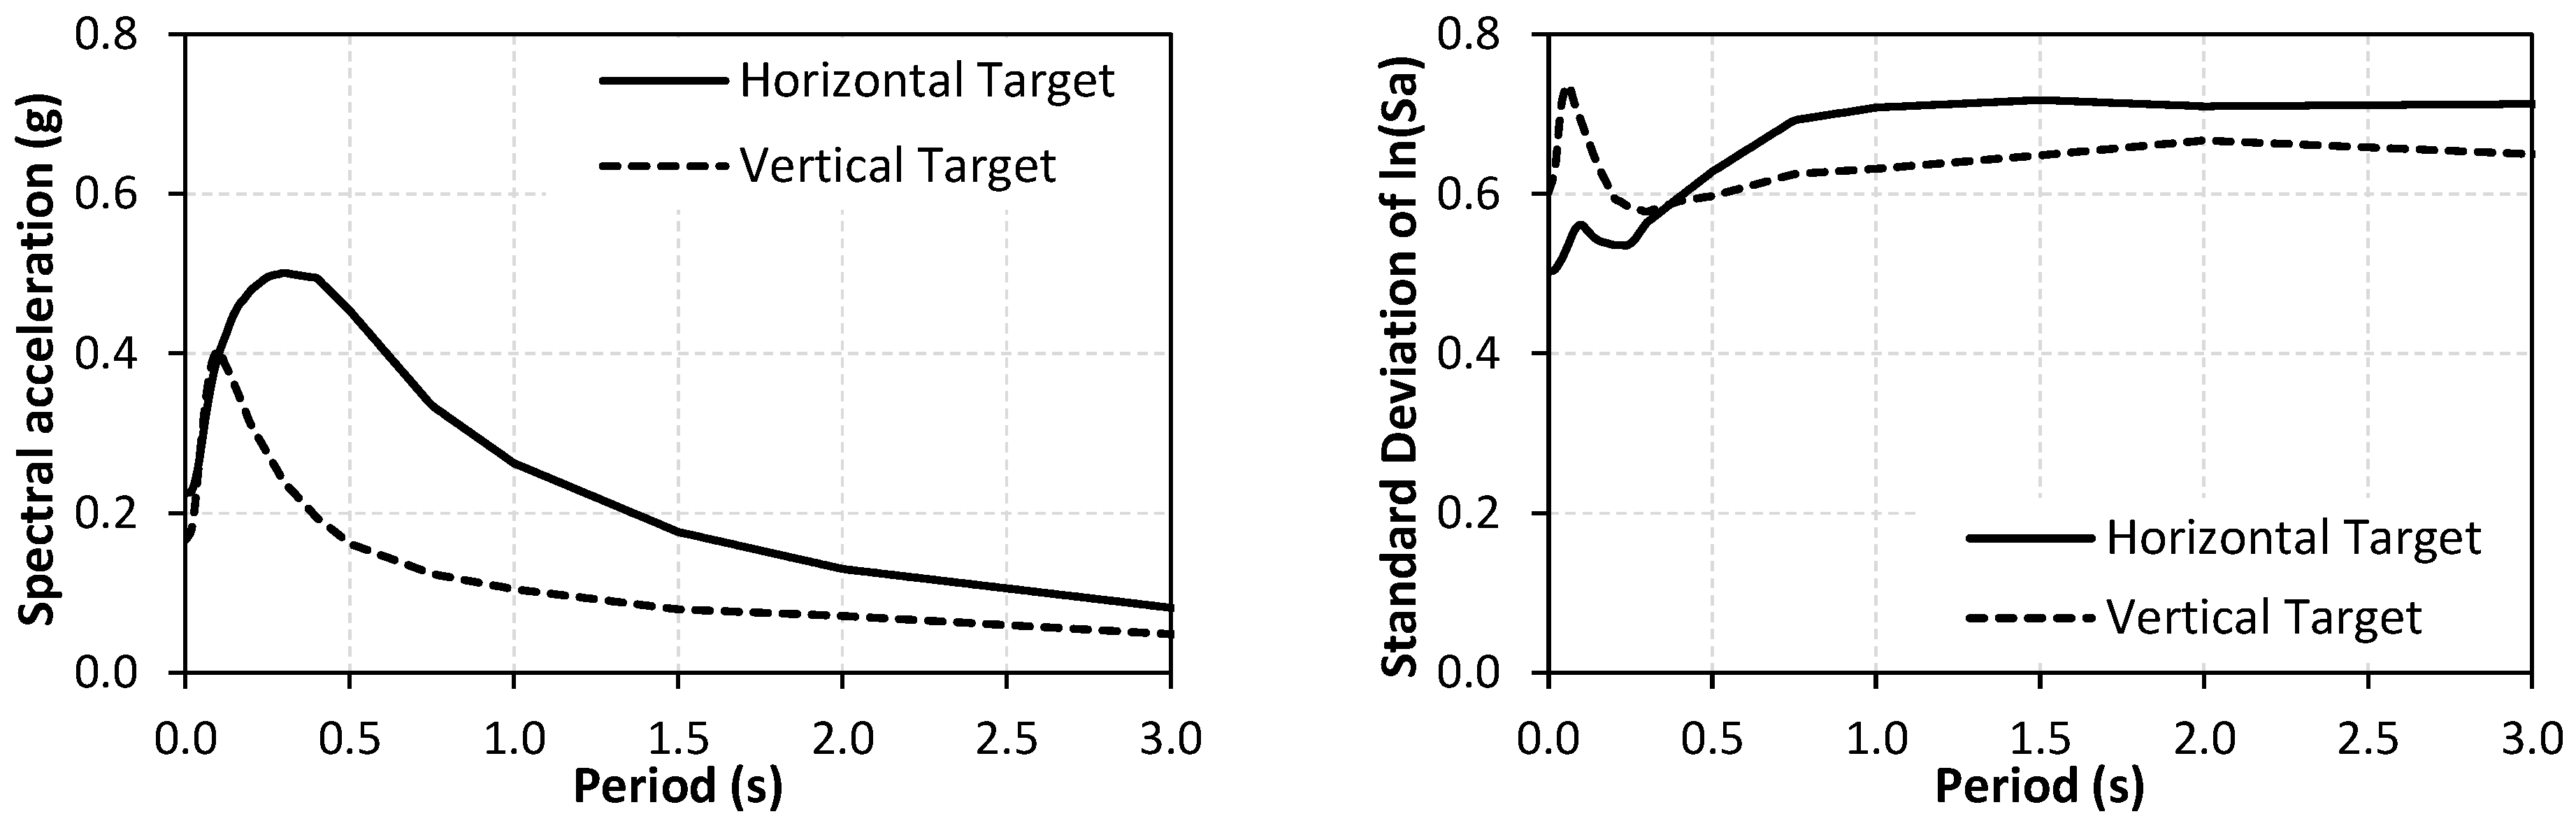
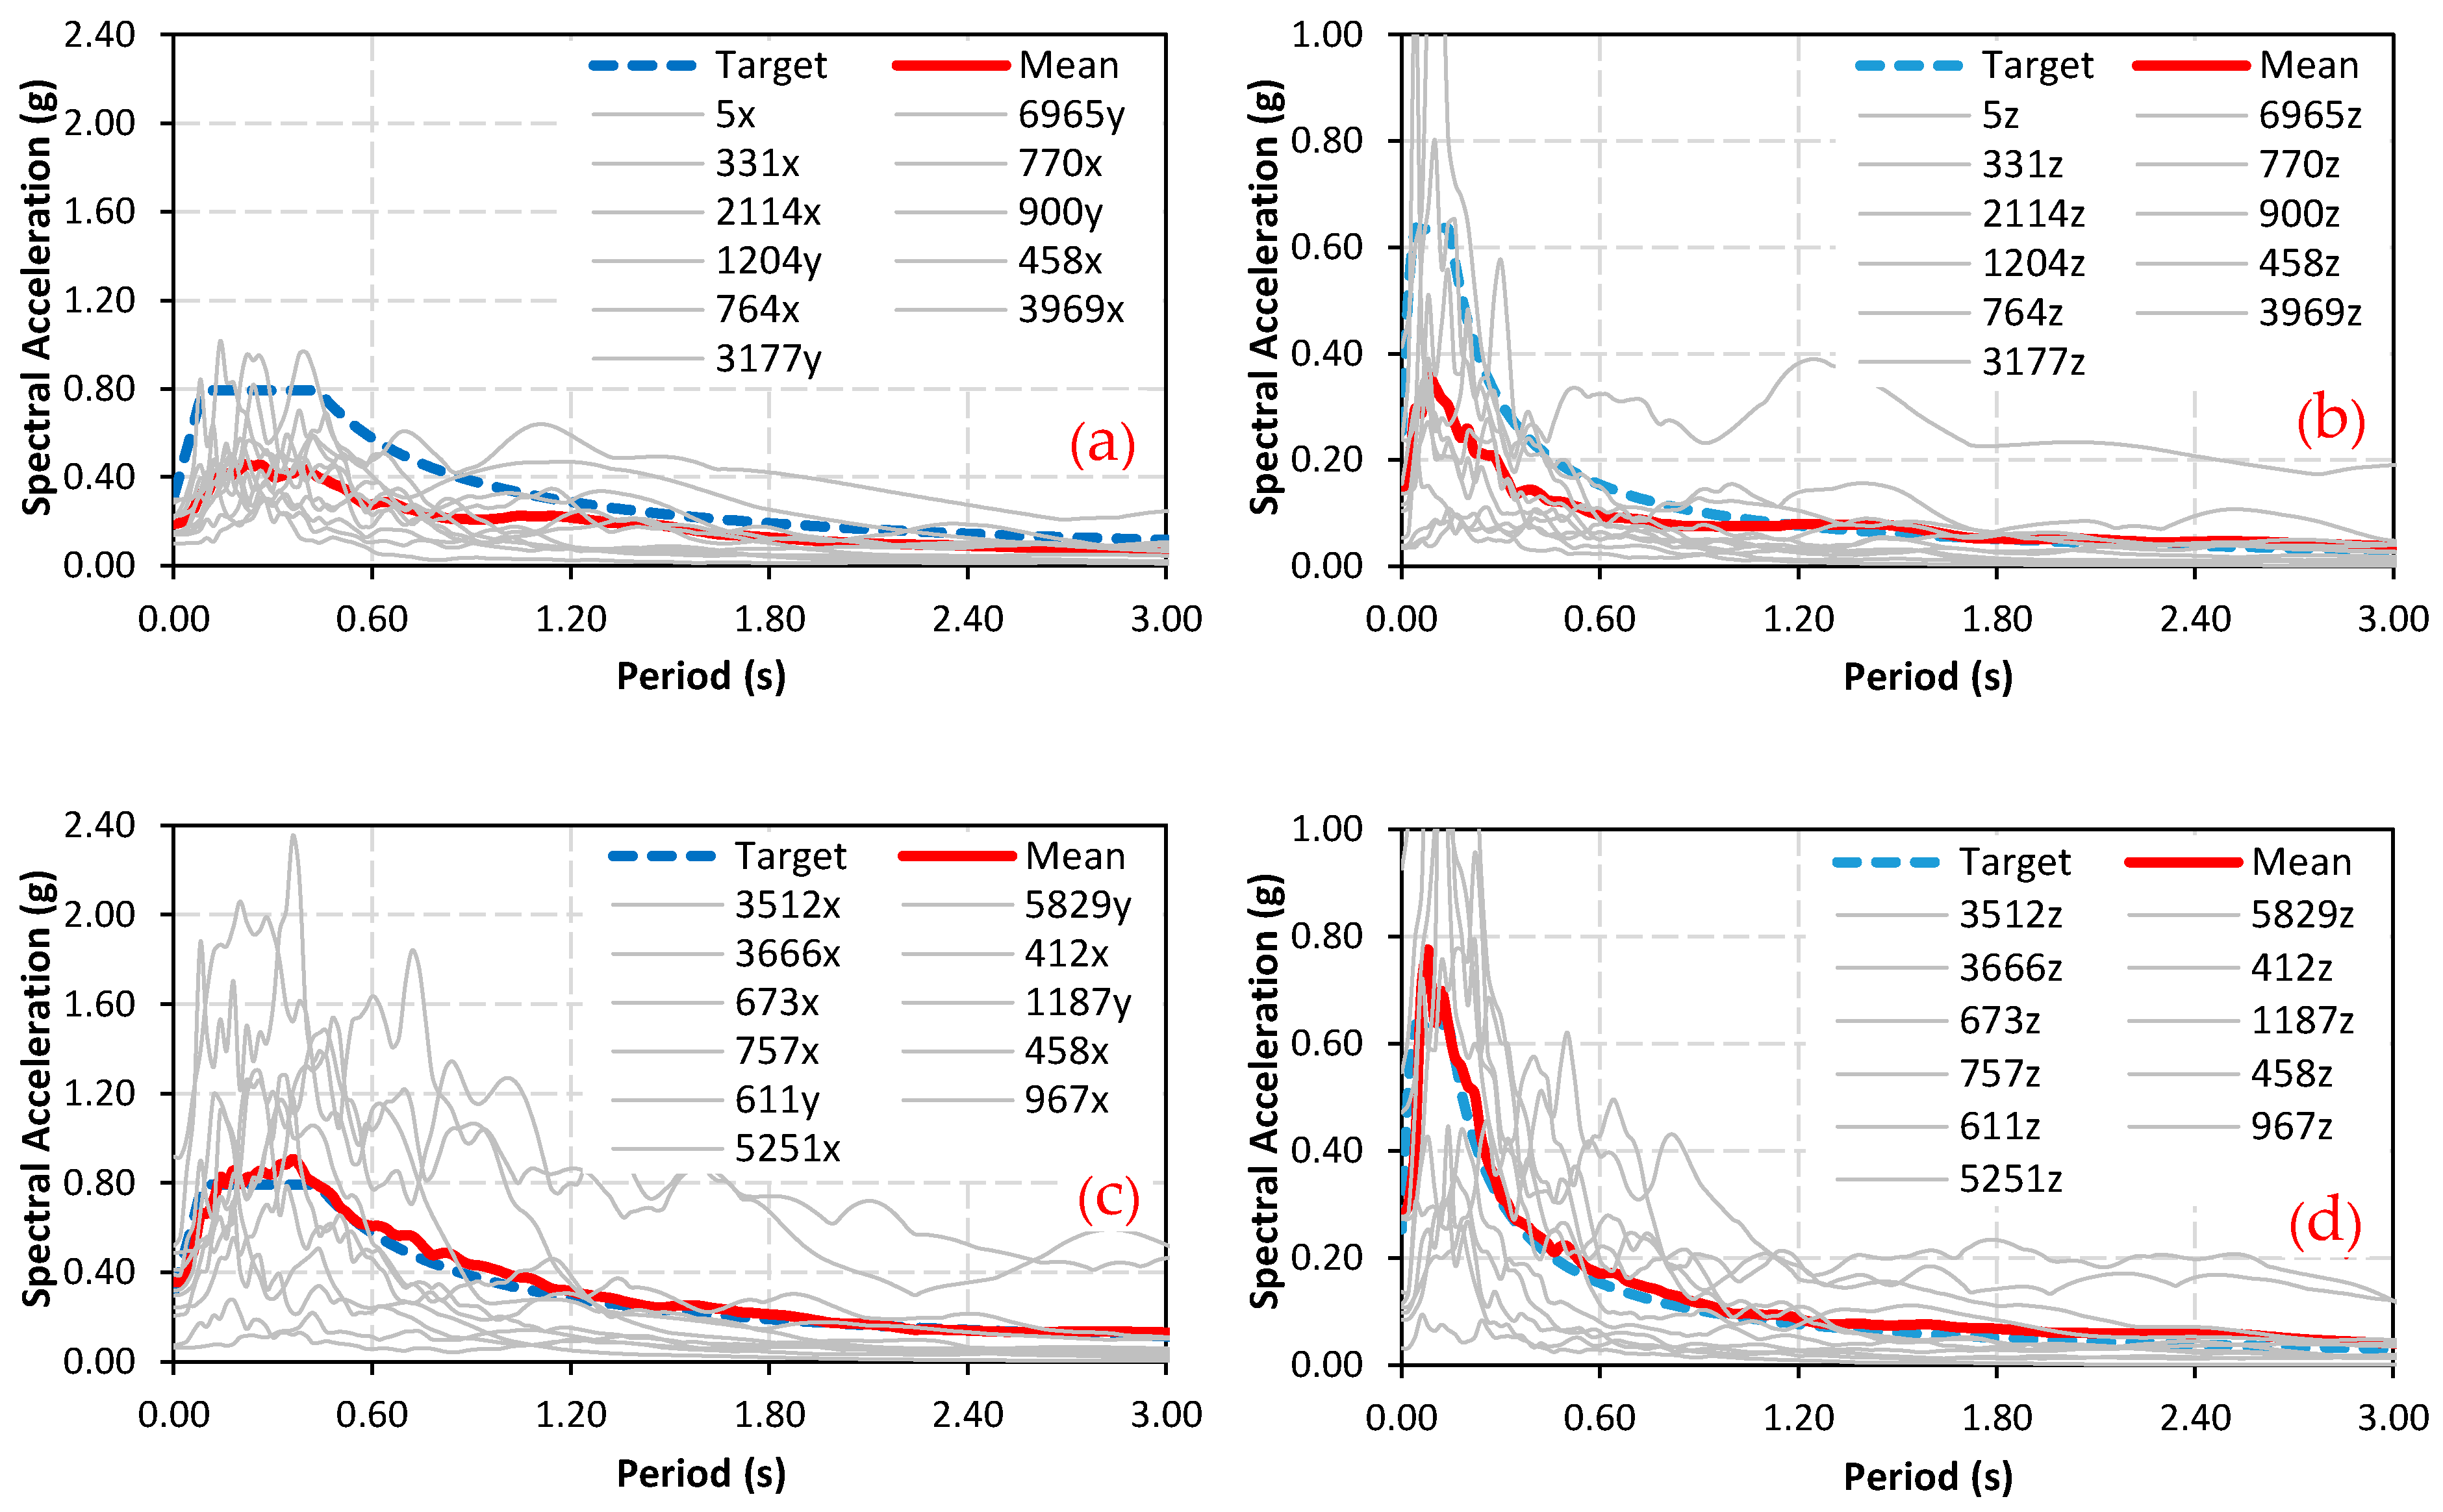
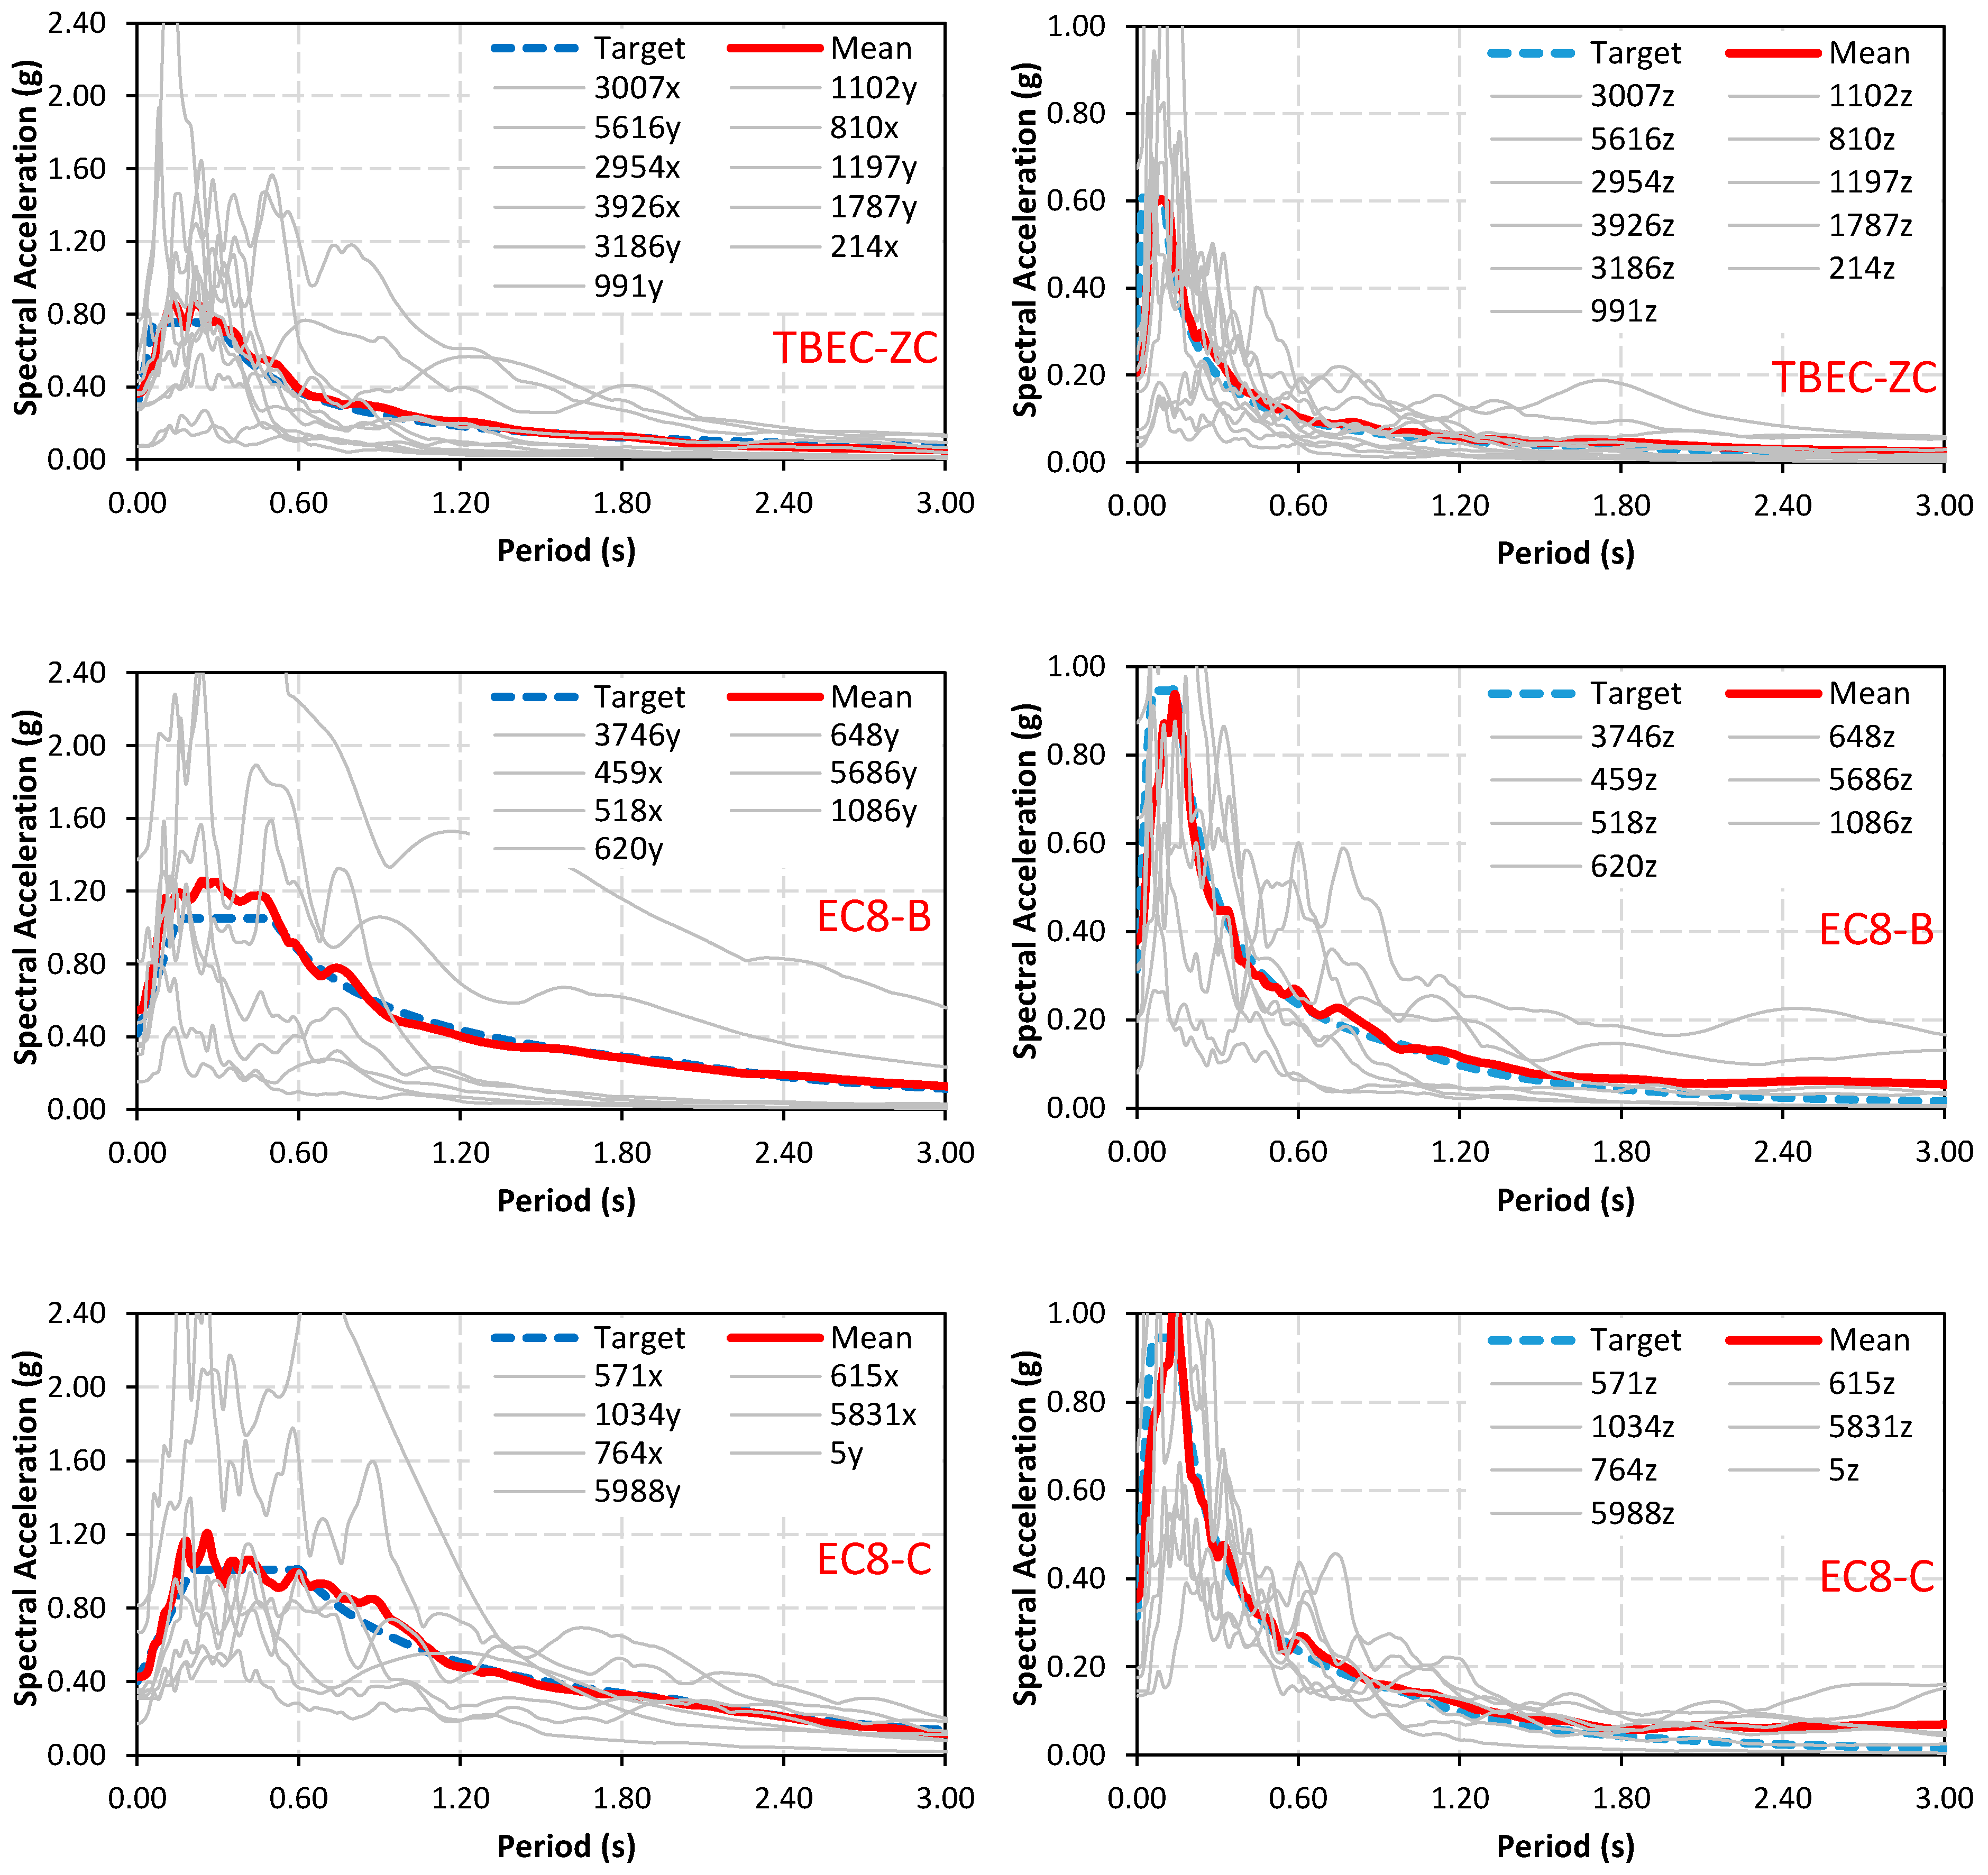
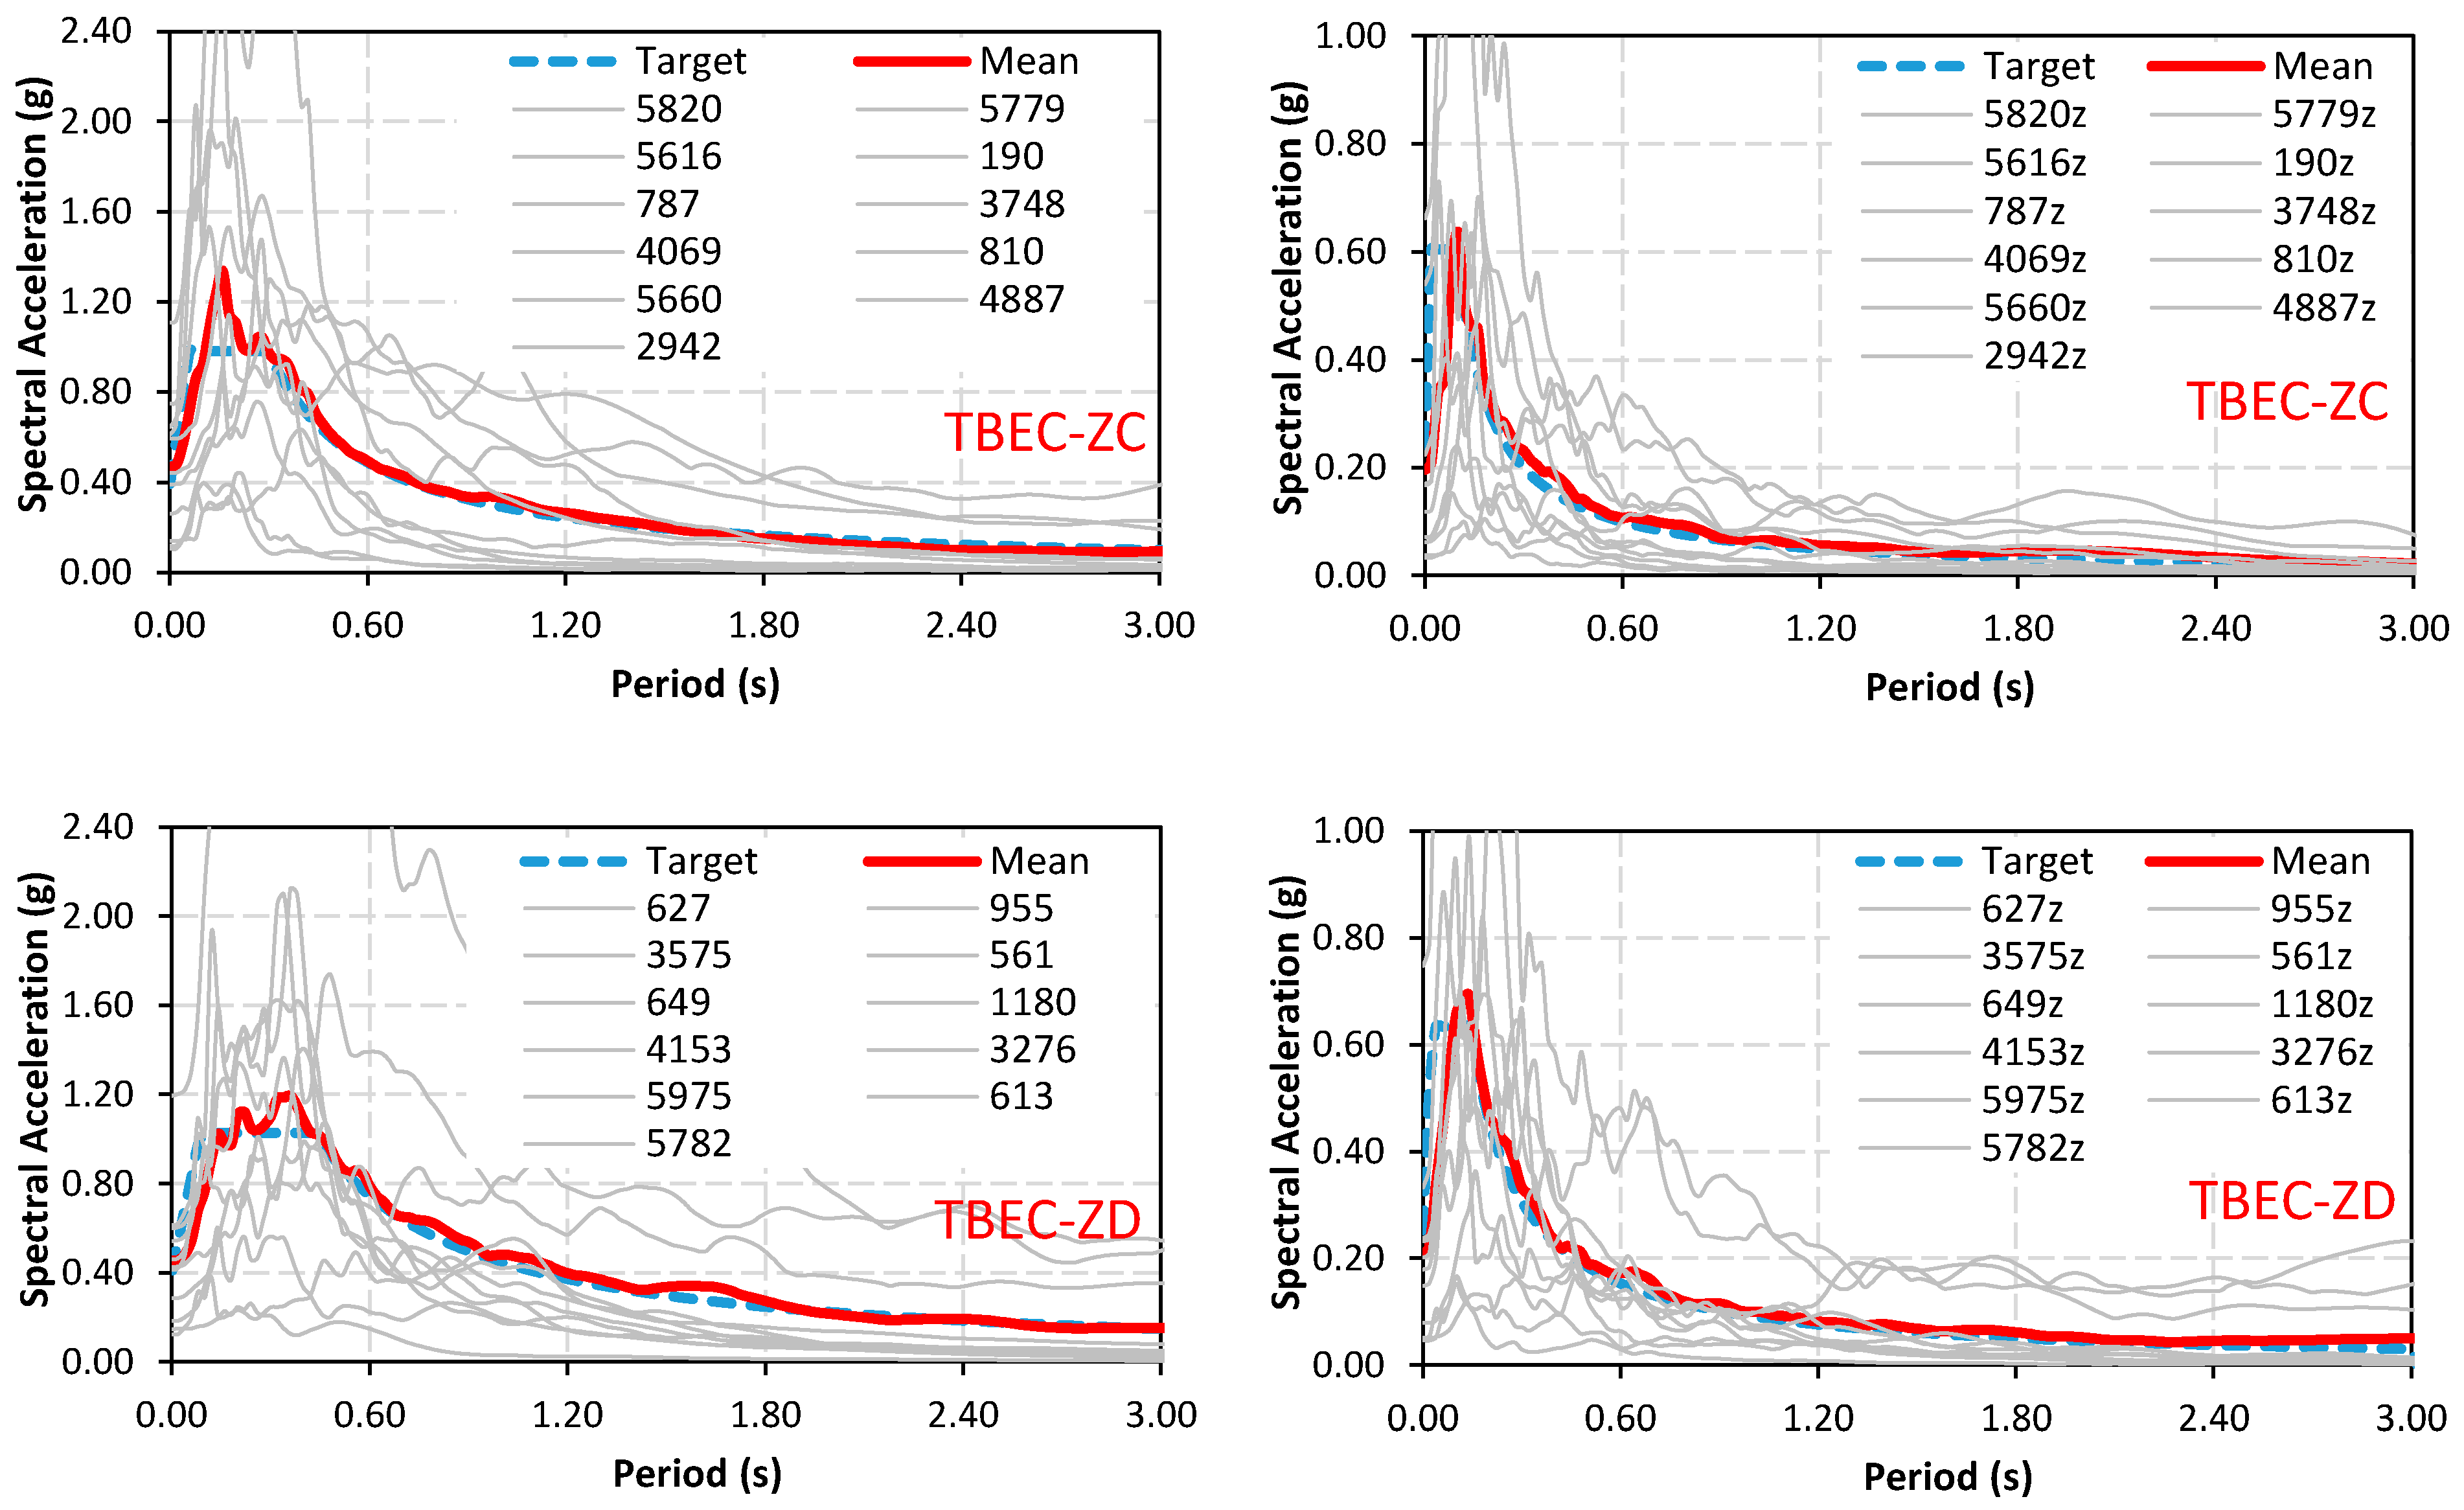
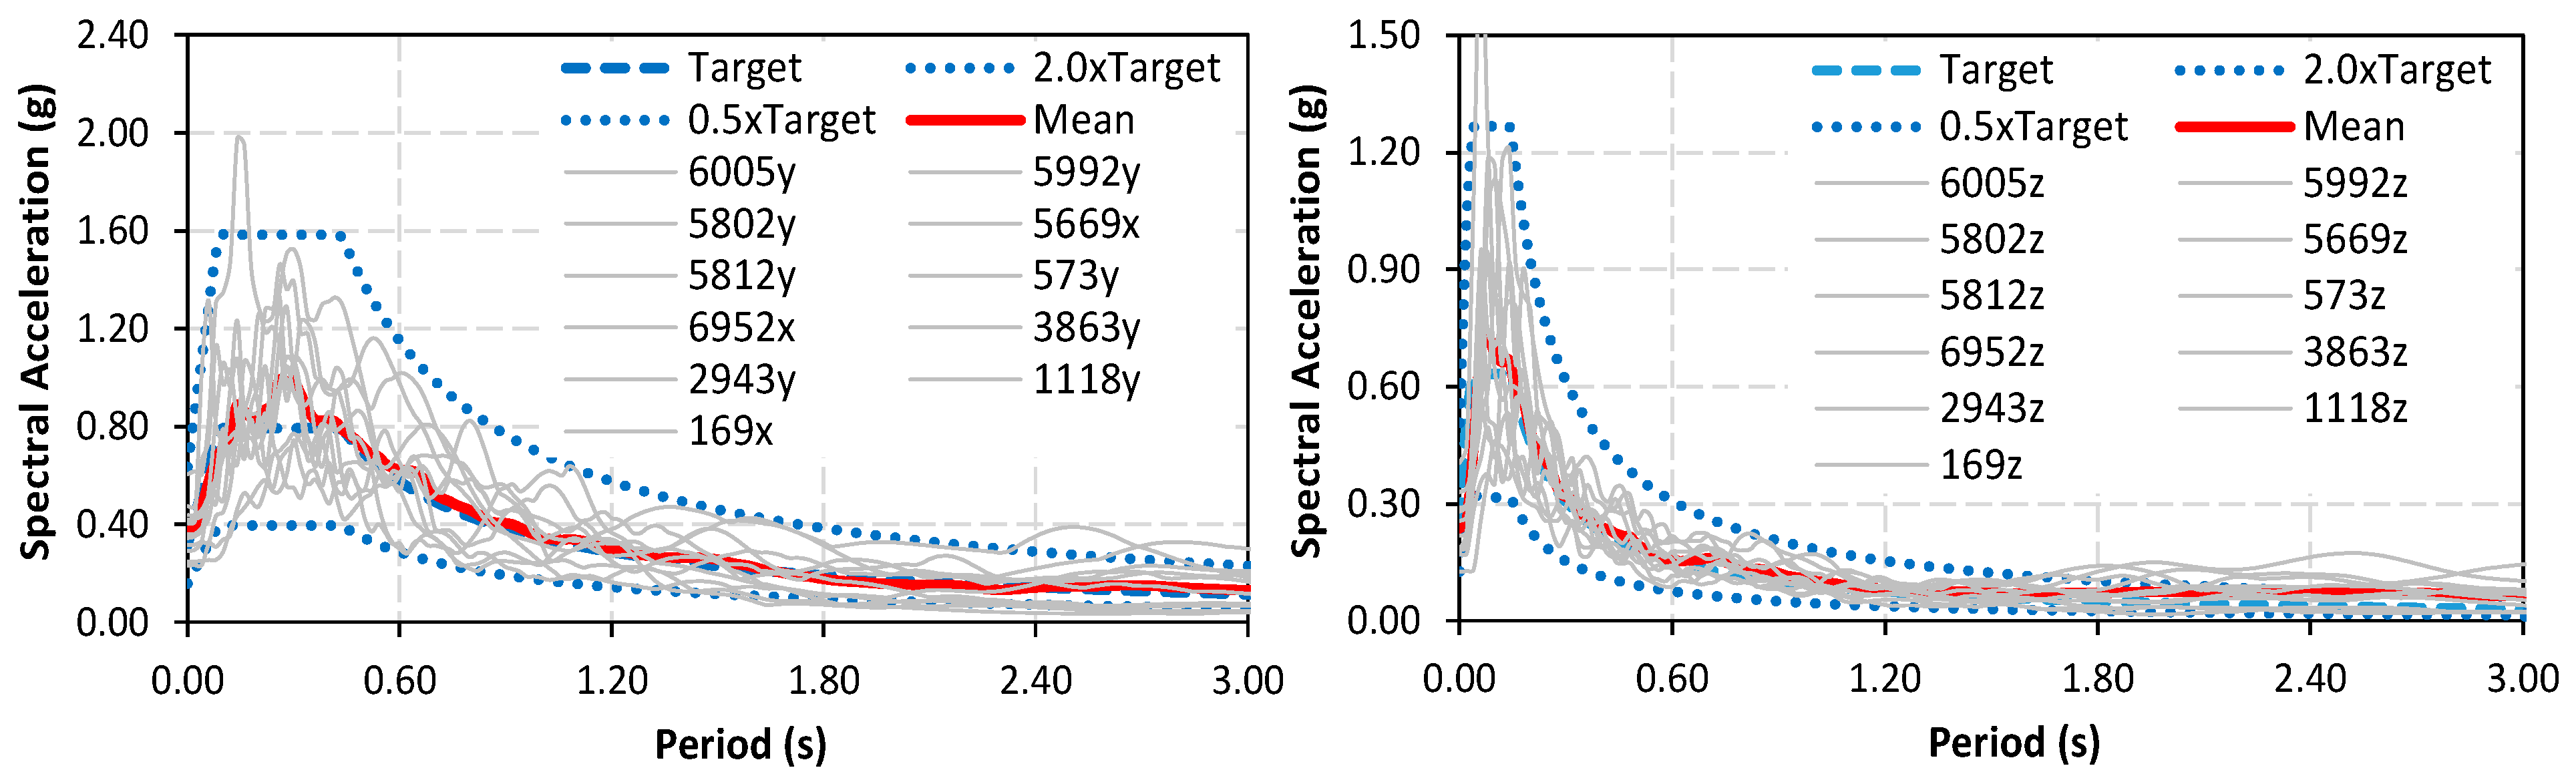
2.4. Two- and Three-Directional Ground Motion Selection Considering the Vertical Component

In this section, multi-directional GM selection was discussed utilizing the code-based UHS and scenario-based spectrum for two- and three-directional NDAs. In code-based selection, two different approaches were used. In the first approach, only matching of target horizontal and target vertical spectra was considered. In the second approach, not only mean spectra but also standard deviations (0.5- and 2.0-times the target) of the records were considered, while this is not specified by most codes. In both approaches, different combinations of GM orientations (e.g., XZ or YZ and XYZ directions) were used. On the other hand, the distribution of the standard deviations (SDs) of selected GM records for multiple GM orientations conformed to the standard deviations calculated from the GMM and aligned with the target spectrum in horizontal and vertical directions. Accordingly, the topics discussed in this section can be divided into two categories: code-based two- or three-directional GM selection and scenario-based GM selection. Two-directional GM selection represents the XZ or YZ components of GMs. For instance, if the X or Y horizontal component of a GM record (e.g., 101x or 101y) is selected then the vertical component of this record (e.g., 101z) is considered for matching. Three-dimensional GM selection requires using a combined horizontal spectrum such as the SRSS (e.g., 101, which is the SRSS of 101x and 101y). Once again, the vertical component of the same record (viz, 101z) is used for spectral matching. It is important to highlight that the solution model relies not only on the SRSS; other combined spectra, such as the geometric mean and period-dependent rotated spectra, can also be easily implemented and utilized. During selection, two different target and mean spectra (i.e., vertical and horizontal) are computed and checked simultaneously and the number of selected GM components changes depending on two- or three-directional analysis. For example, let us say that we use seven GM components for GM sets (i.e., EC8-based selection). The number of selected GM components is 14 (7 components × 2 orientations) for two-dimensional analysis while it is 14 for three-dimensional analysis (7 component pairs for horizontal and 7 components for vertical orientation). When the selection is extended for scenario-based selection, the number of selected GM components remains the same but the computation and controlling of the matching of target spectra are doubled. In other words, four different target spectra, namely two for target spectral accelerations and two for target SDs of spectral accelerations of horizontal and vertical orientations, are obtained.
A typical representation of the alignment of target and mean spectra of selected GMs is shown in Figure 6 as an example. Target and mean spectra can be either horizontal or vertical. The enhanced solution algorithm utilized in this study is designed to minimize the areas between the mean spectrum and the target spectrum. Given the stochastic and random nature of the algorithm, the area between the mean of the selected scaled/unscaled GMs and the target spectrum can be substantial (refer to Figure 6a). However, the area between the mean and the target spectrum is minimized (see Figure 6b) with the increasing iterations of the algorithm. The same idea applies to the SD of selected GMs and the target SD at the considered period ranges, as demonstrated in Figure 7. Detailed information about the algorithm and definition of the problem is given in Section 3.

3. Problem Definition and Solution Model

3.1. Definition of the Problem

The improved model is capable of selecting GMs for both code-based and scenario-based selection practices and seismic code applications need to define two different functions (at least) for horizontal and vertical directions. These functions are called fch(x) and fcv(x), as given in Equation (2). The scenario-based selection, or if desired the code-based selection, on the other hand, requires definition of four different functions considering the mean and dispersion for horizontal and vertical directions. Therefore, fdh(x) and fdv(x) functions are superimposed to consider the dispersion of spectral accelerations in addition to fch(x) and fcv(x) for horizontal and vertical directions, respectively. The GM selection issue essentially involves minimizing the difference in shapes between the target and the chosen GMs. Consequently, it is necessary to develop an objective function and decision variables pertaining to GM selection. Besides the minimization of the gap between the shapes, criteria defined by the codes and/or practitioners need to be incorporated. For this reason, the GM record selection problem is addressed as a constrained optimization problem. Each constraint can be described as gi(x) and summations of penalties are also added to the objective function, which increases the function, which in fact needs to be minimized. The criteria outlined in Section 2.4 for choosing the GMs are handled as constraints of the problem. Accordingly, the objective function F(x), intended for minimization to determine the optimal solution, is specified in Equation (2). This function is also viable for determining both GM component pair sets.
F x = f c h x + f c v x + f d h x + f d v x + i = 1 k g i x
In Equation (2), vector x comprises the decision variables, and its size is dictated by the number of GMs in a given record set. For instance, if there are 11 GMs in a record set, the size of x would be 22, representing the labels of the 11 GMs along with 11 corresponding scale values. In Equation (2), k denotes the number of penalty functions under consideration.
The function fch(x) is defined as the sum of squares of the error (SSE) between the mean horizontal spectrum of selected GMs and the corresponding target horizontal spectrum (Equation (3a)). This function is evaluated over the selected period range [Tmin, Tmax] for m number of discrete period values:
f c h ( x ) = i = 1 m S M , h ( T i ) S a , h ( T i ) 2
f c v ( x ) = i = 1 m S M , v ( T i ) S a , v ( T i ) 2
In Equation (3), SM,h(Ti) and SM,v(Ti) represent the spectral value of the mean horizontal and vertical spectrum at period Ti. These values may represent either the average of individual components in the set or the average of individual combined component pairs (for instance, the SRSS, geometric mean, maximum directional, etc.) in GM pair sets. Sa,h(Ti) and Sa,v(Ti) represent the spectral values of the target horizontal and vertical spectrum, respectively. The target spectrum can be also described in terms of the UHS or scenario-based CMS spectra. Like fch(x), fcv(x) is defined as the SSE between the average of selected GMs and the corresponding target in the vertical direction (Equation (3b)).
f d h ( x ) = i = 1 m σ S , ln S a , h T i σ T , ln S a , h T i 2
f d v ( x ) = i = 1 m σ S , ln S a , v T i σ T , ln S a , v T i 2
As defined earlier, the compatibility of spectral shapes of standard deviations of accelerations are computed (see Equations (4a) and (4b)) using the SSE between the standard deviation of the target ( σ T , ln S a , h T i ) and acceleration spectra of selected GM records ( σ S , ln S a , h T i ). In these terms, subscript “h” is used to define the horizontal direction, but also computations can be made on the other orientation of GMs, so subscript term “v” reflects the vertical direction. In this study, target standard deviations (e.g., σ T , ln S a , h and σ T , ln S a , v ) are obtained from GMPEs, as described earlier. However, these values can be changed by either users or practitioners based on their needs.
The assessments of compatibility associated with Equations (3) and (4), which rely on the SSE, must be identified through the calculation of average spectral values of horizontal and vertical GMs. For this reason, the mean horizontal spectrum (SM,h(T)) and mean vertical spectrum SM,v(T) of a GM set are formulated by Equation (5a) and Equation (5b), respectively. In the equations, n is the number of GM records used in the set, SVj is the scaling value of the jth horizontal/vertical component (note that the single-scale value is considered in all orientations) in the set, Saj,h is the acceleration spectrum of the jth horizontal component, and Saj,v is the acceleration of the spectrum of the jth vertical component in the set. In the equations, the mean spectrum or spectra of the individual GMs (e.g., S M , h T , S M , v T , S a , h ( T ) , or S a , v ( T ) ) can be specified as vectors over the predefined period range [Tmin, Tmax] with equal interval periods and/or m numbers of discrete period values, as in Equations (3) and (4). The scaled GMs, which are the numerator part of Equations (5a) and (5b), are also used to compute the standard deviation of the natural logarithm of spectral accelerations (e.g., σ S , ln S a ).
S M , h ( T ) = j = 1 n S V j ×   S a j , h ( T ) n
S M , v ( T ) = j = 1 n S V j ×   S a j , v ( T ) n
Optimization problems frequently include constraints that may be in the form of equalities or inequalities based on the characteristics of the problem. In stochastic optimization methods, penalty functions are typically used to manage these constraints [64]. For this study, the penalty functions related to the selection conditions outlined in Section 2.4 are also specified as functions of gi(x). Details about the computations behind Equation (2) including both spectral shapes and the application of penalty functions for a compatibility check are clearly sketched in the next section as a figure with proposed model steps. For this reason, penalty functions related to spectral shapes are not given here. In addition to ensuring compatibility with the spectral shape of the GM selection, it is also possible to introduce variety in the selection process by opting for only one horizontal component from any GM record in the set and/or limiting the selection to no more than three GM records originating from the same earthquake event, as previously established [23,24].

3.2. Stochastic Solution Model

Once the problem to be maximized or minimized is formulated, it can be solved using either deterministic or stochastic solution algorithms. Deterministic methods often need extensive gradient information to locate global optimum solutions, which can be challenging for engineering optimization problems that are non-convex or discrete. For this reason, stochastic methods stand out as a widely preferred option for solving these types of problems. It is worth noting that this study does not focus on comparing the efficiency of different optimization algorithms. Various stochastic optimization algorithms such as harmony search [23,51], genetic algorithm [53,58], differential evolution [55], and particle swarm optimization [49,54] are available to handle the GM selection problem. In this study, a solution model based on the stochastic harmony search (HS) algorithm [50] was preferred to solve the GM selection problem.
The HS algorithm mimics the natural techniques that musicians employ to discover harmonious sounds while performing. Similar to how jazz improvisations strive for musical harmony, the optimization process aims to determine the best solution. Five algorithm parameters should be first set, namely harmony memory size (HMS), harmony memory considering rate (HMCR), pitch adjusting rate (PAR), distance bandwidth (bw), and termination criterion. The HS-based solution algorithm for the real GM selection problem involves five main steps. The representative display of each step of the solution algorithm is shown in Figure 8. In the figure, code-based and scenario-related problems are sketched, and spectral shapes can be applied for either horizontal or vertical GM components.
At Step 1, the GM catalogue is created for all orientations (X, Y, and Z) or individual combined horizontal spectra (for example, the SRSS or so on) (XY, Z) according to Mw, R, and Vs,30 to reflect the local soil class. Based on the analysis model (e.g., two- or three-dimensional analysis), target spectral shapes, constraints about the compatibility of spectral shapes including both the mean and/or standard deviations, limits for scaling values, and the required number of GMs in the set are defined. Then, HS algorithm parameters with the termination criterion are established (see Section 4). Note that the GM sets are obtained by selection and scaling from the catalogue defined in Step 1. Thus, the practitioners can create their own catalogue in terms of regional seismic characteristics accounting for local soil class, source mechanisms, type of fault such as near-fault sites, and so on. In Step 2, the HM is created multiple times as the HMS using randomly generated decision variables, including GMs and their corresponding scaling values. Each GM set, called a harmony vector, is calculated by Equation (2) and stored in the HM. In this step, the worst harmony in the HM, which has the highest value of the objective function for minimization problems, is also determined.
In Step 3, a new harmony (viz., a new GM set) is generated through a process referred to as improvisation, which is governed by three fundamental principles: HMCR, pitch adjusting, and random choosing. HCMR represents the likelihood of utilizing the memory consideration rule, while (1-HMCR) signifies the likelihood of employing a random selection rule. These rules are applied for each variable separately and a new harmony is created in this step. For example, if the memory consideration rule is applied, this means that the corresponding variable of the new harmony is selected from the HM. If not, then the regarding variable is randomly chosen from the feasible space of the corresponding variable (viz., the random choosing rule is applied). Pitch adjusting is applied to the variable selected from the HM considering the probability of PAR. After generation of the new harmony (viz., a new GM set), Equation (2) is re-calculated for the new harmony. If the new harmony is superior to (lower than) the worst harmony according to the objective function, the worst harmony is replaced by the new one (Step 4), and the process of updating the HM continues throughout the iterations. In Step 5, the termination criterion is checked and if satisfied the solution model is stopped. Then, the best harmony in the HM is obtained as the solution to the GM selection problem.

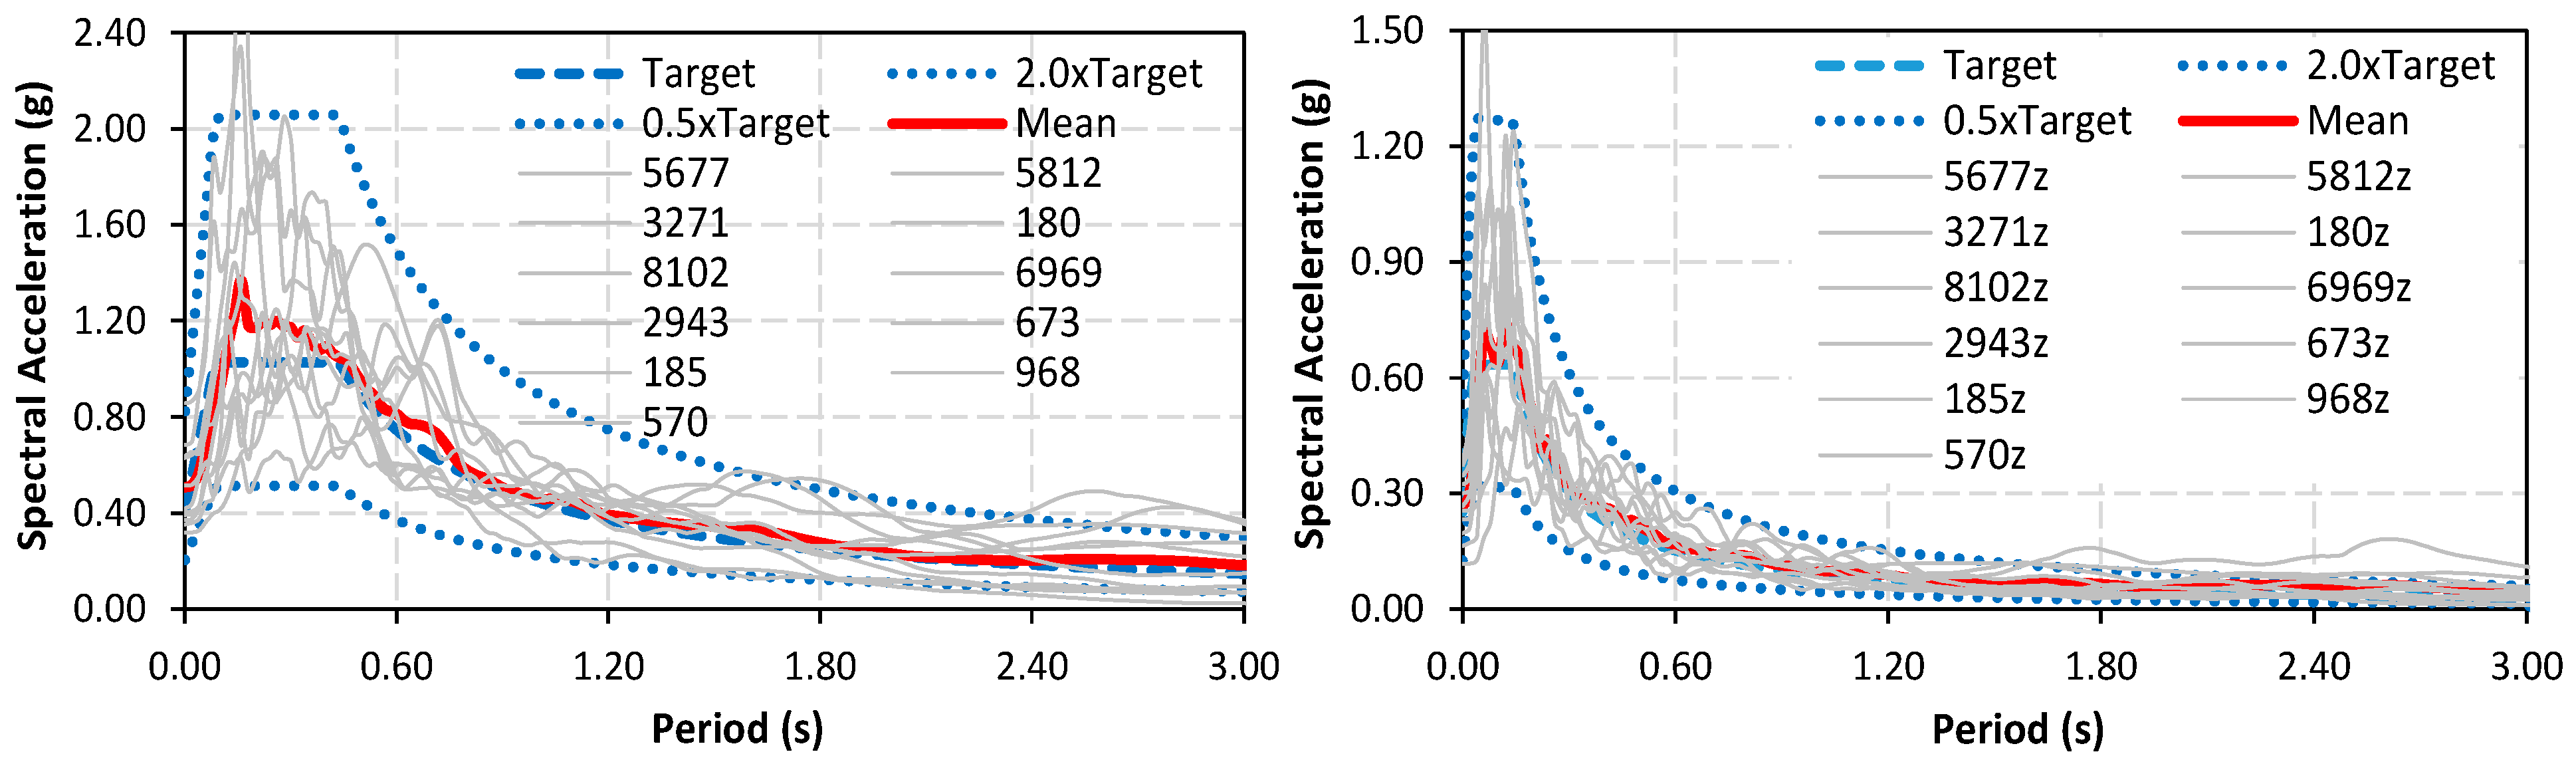
4. Application of Record Selection Model

In this section, the target spectra of different seismic codes (i.e., EC8 and the TBEC) and scenario-based target spectra are taken into consideration to demonstrate the capacity of the solution model. As highlighted in Section 2, code recommendations of selection conditions are considered for making the applications code compliant. In addition to the general requirements provided, some other critical issues considered are given below:
  • A single-scale value was used for all components of GMs.
  • Vertical components were selected with horizontal counterparts of the same GM record simultaneously.
  • Recent studies indicate that amplitude scaling does not significantly impact a building’s response if spectral shapes are compatible [18,19]. Nonetheless, the scale value was confined to between 0.25 and 4.00 for selections based on seismic codes and scenarios.
  • The lower bound for the ratio of the mean spectrum to target spectrum was defined as 1.00, 0.90, and 0.8 for the TBEC, EC8, and scenario-based selections, respectively. The upper bound of this ratio was taken as equal to 1.25. These constraints were applied to both vertical and horizontal GM components.
  • Different period ranges for the fitness of horizontal spectral shapes were set: they were set as between 0.1 s and 1.5 s, and 0.2 s and 2.0 s, for T  =  1.0 s, and 0.05 s and 0.75 s, and 0.1 s and 1.0 s, for T = 0.5 s for the TBEC and EC8, respectively. For scenario-based selection, the period range was taken as between 0.2 s and 2.0 s. The period range between the mean spectrum and target spectrum for the vertical direction was between 0.1 s and 1.5 s for both seismic code- and scenario-based selections [31,65].
  • GMs were selected separately for two- and three-dimensional analysis. Only one orientation of the same GM record (X or Y) in the horizontal direction was enforced in sets for two-dimensional analysis.
  • The number of GMs was taken as equal to 7, 11, and 11 for EC8, TBEC, and scenario-based selections.
  • Optimization algorithm parameters such as HMS, HMCR, PAR, and bw were taken as equal to 30, 0.9, 0.3, and 0.01, respectively. The maximum iteration was set to 100,000 [23].
Based on the issues given above, GM records were selected satisfying all conditions. Figure 9 shows the selected GM response spectra for horizontal and vertical directions according to the TBEC considering Soil ZD. Selection was performed for two-dimensional (or uni-directional) analysis. In Figure 9a,b, randomly selected GM records at earlier steps of the solution model are represented for horizontal (Figure 9a) and vertical (Figure 9b) directions. Figure 9c,d indicate the final run results that satisfy the selection constraints. It can be seen in the figures that the results for the horizontal direction based on predefined conditions perfectly matched with the target spectrum and the same situation is valid for the vertical direction. As shown in the figures, vertical GM components are selected from the counterparts of horizontal GM components of the same GM. For example, when the horizontal GM is given as the 3512x component, based on the constraints defined, the 3512z component is also automatically selected for vertical GM sets. The rest of the GM records were also picked for this purpose for the number of GMs defined in the TBEC, which is eleven for this example. Note that the single-scale value was attained for both the horizontal and vertical components in the sets. For instance, the scaling value for the 3512x component was 0.552, which was the same for the 3512z component. The other scaling values were 5829y − 1.382, 3666x − 3.439, 412x − 1.594, 673x − 3.304, 1187y − 3.204, 757x − 0.496, 458x − 1.324, 611y − 0.678, 967x − 1.710, and 5251x − 2.476. Furthermore, it was found that the MSE values of selected GMs were dramatically low, and they were calculated as 0.23% and 0.05% for the horizontal and vertical GM sets, respectively.
Horizontal and vertical GM selection according to the TBEC and EC8 for different soil classes are plotted in Figure 10. As seen in the figures, the mean spectrum of the horizontal and vertical selected GMs aligns with the corresponding target spectrum. These figures also show that the vertical components correspond to the horizontal direction components (e.g., 3007y and 3007z for TBEC-ZC) and the same scaling value is used with the horizontal component. The MSE values of the horizontal GM sets were calculated as 0.14%, 0.61%, and 0.45% for TBEC-ZC, EC8-B, and EC8-C, while the MSE values of the vertical GM sets were calculated as 0.04%, 0.07%, and 0.07% for TBEC-ZC, EC8-B, and EC8-C.
Besides the two-dimensional NDAs, determination of full structural behavior necessitates using three-dimensional NDAs. For this purpose, three components of GM records (X, Y, and Z) can be used for performing the NDAs. In this case, bi-directional GM selection, which accounts for both the horizontal orientation of GMs and their vertical component, should be selected accordingly. For this aim, the proposed model is run, and the results are plotted in Figure 11 for three components of the GM simultaneously according to ZC and ZD soil classes in the TBEC. It should be noted that the horizontal response spectrum of selected GMs was computed by the SRSS of the two horizontal components of the same GM, as suggested in the TBEC. For example, 627 represents the SRSS spectrum of 627x and 627y. Figure 11 shows that the refined solution model achieves excellent compatibility between the mean of selected GMs for both horizontal and vertical directions according to the TBEC compatible selection for both soil classes. The results demonstrated that the scaling values of GMs in a set for the ZD soil class were 2.110, 2.040, 1.160, 0.614, 2.885, 2.425, 2.054, 3.075, 3.159, 3.473, and 0.652 for 627, 955, 3575, 561, 649, 1180, 4153, 3276, 5975, 613, and 5782, respectively. The same scaling values were also applied for the vertical direction of GMs. Finally, it was observed that the MSE values of selected records for ZC were considerably lower, such as 0.13% and 0.04% for horizontal and vertical GMs, respectively. Similarly, the MSE values for ZD were calculated as 0.26% and 0.04% for the horizontal and vertical GMs set.
Three components of records according to EC8-based GM selection using different local soil classes are plotted in Figure 12. It should be noted that the compatibility between the mean spectrum of scaled horizontal and vertical GM spectra and their target spectrum is quite high. The MSE values of horizontal GM sets were calculated as 1.57% and 0.99% for EC8-B and EC8-C, respectively. For vertical GM sets, the MSE values were found as 0.07% and 0.05% for B and C soil classes, as recommended in EC8, respectively.
To make quantitative comparisons, three more GM sets (four sets in total) for different seismic codes were added and the MSE values are aggregated in Table 2. It is worth noting that Table 2 results are obtained for T = 1.0 s. It can be seen in the table that the maximum MSE value is 1.566% for the horizontal direction obtained for 3D analysis considering the ZC soil class for EC8. Nevertheless, the obtained MSE value is quite low compared to the MSE values in the literature [58]. When the MSE results are compared in terms of 2D and 3D selection, it can be said that the MSE values determined for 2D analysis models are generally lower than those for 3D models. This situation may be due to stricter constraints in 3D selection. When the average of four sets, as calculated in the right side of Table 2, are evaluated it can be said that the MSE values of vertical sets are lower than 0.09% while the MSE values of horizontal sets are lower than 1.24%.
Comparisons are also made for further investigation for buildings with T = 0.5 s considering the different seismic codes using four GM sets, and the MSE values are computed and provided in Table 3. It can be seen in Table 3 that the maximum MSE value is 1.321% for the horizontal direction obtained for 3D analysis considering the ZC soil class for EC8. The maximum MSE value for the vertical direction is 0.349%, which is obtained from 3D analysis considering the ZD soil class for EC8. Similar to T = 1.0 s results, the MSE values determined for 2D analysis models are generally lower than those for 3D models. Considering the diverse period ranges, soil type, spectral shapes, and the stochastic nature of the process used in the solution algorithm, it is expected that the MSE values will vary for different building periods. Nevertheless, when the MSE values for T = 1.0 s and T = 0.5 s are compared, it can be concurrently said that the MSE values are generally close.
Although the calculated MSE values in earlier examples are low, it should be reminded that the standard deviation (or record-to-record variability) of selected GMs was not considered (Figure 9, Figure 10, Figure 11 and Figure 12) for uni- and bi-directional selection since compatibility between the individual spectra of selected GMs and the target spectra was ignored in code-based selection. Accordingly, record-to-record variability is obvious [6,20,37,59]. On the other hand, the proposed model can control the variability of the records in both directions even for code-based target spectra. As can be seen in Figure 13 and Figure 14, individual spectra are between considered constraints (e.g., 2- and 0.5-times the target spectra) within the predefined period range. The MSE values of uni-directional selection between the individual GMs in the set were calculated as 17.71% and 3.37% for the horizontal and vertical GM sets, respectively. When the variation is constrained, these values dramatically decreased to 3.25% and 0.60% for horizontal and vertical directions. The same trend was also observed when constraints were applied to bi-directional selection. The MSE values were 30.83% and 6.32% when record-to-record variability is ignored (this is allowed by most codes), while these values were 5.03% and 0.66% when subjected to predefined constraints.
In addition to the above assessments, three components of GM selection according to the scenario-based target spectrum were also considered. It is worth reminding that scenario-based three-component compatible GM selection requires definition of four different targets. The first two are about the target horizontal and vertical target acceleration spectrum. The other two are about the dispersion of horizontal and vertical target acceleration spectra. Dispersion of acceleration spectra versus natural periods can be determined by GMMs proposed in the literature. Therefore, in addition to the compatibility between the mean spectrum of the selected horizontal and vertical spectrum and their corresponding target spectrum, dispersion (or the standard deviation of the acceleration spectrum) of the horizontal and vertical GM spectra must be also compatible with the corresponding target dispersion. Since there is no explicit definition for the compatibility of the spectrum according to scenario-based selection, the ratio between the mean spectrum and the target spectrum was assumed to range from 0.80 to 1.25 in both orientations. The same assumption was also made for horizontal and vertical GMs regarding the compatibility of SD distribution.
In this study, the period range for scenario-based GM selection was assumed as 0.2 s–2.0 s and 0.1 s–1.5 s for horizontal and vertical directions, respectively. Based on the period range considered, and the selection constraints defined in Section 4, a solution model is run for GM record sets and the initially and finally obtained results according to a scenario-based earthquake are plotted in Figure 15. In Figure 15a,b, both the mean and SD of the selected horizontal/vertical GM spectrum were not compatible with their corresponding target spectrum since the initial steps of the model are created with a random variable. In this step, the MSE values in Figure 15a were computed as 0.98% and 23.15% for the mean and SD of the selected GMs in the horizontal direction, respectively. In addition, the MSE values in Figure 15b were also determined as 0.36% and 21.31% for the mean and SD of the selected GMs in the vertical direction, respectively. After a certain number of iterations repeated between Step 3 and Step 5, as shown in Figure 8, the compatibility of GM sets with target spectra increased and the termination creation is satisfied, as seen in Figure 15c,d. It is important to highlight that all constraints were met during all runs for both code- and scenario-based selections. It is clear in Figure 15c,d that the mean and SD of the selected horizontal/vertical GM spectra are highly compatible with the corresponding targets after selection and scaling. The MSE values for the mean and SD of selected GMs at the final stage were calculated as 0.04% and 0.04% (Figure 15c) for the horizontal direction, respectively. Similarly, the MSE values for the mean and SD of selected GMs at the final stage were determined as 0.05% and 0.06% (Figure 15c) for the vertical direction, respectively. Starting from the initial step to the final step, the MSE values decreased from 23.15% to 0.04% for the standard deviation of accelerations for both directions by the proposed solution model. The same discussions can be also made for both directions considering the target and mean spectral shape of selected GMs. It is noteworthy that the proposed model enforces a single-scale value for all orientations of GMs (x, y, and z), without specifying a range or limits, to ensure the spectral shape compatibility of both the target and period-dependent variability.

5. Summary and Conclusions

A novel solution model based on the stochastic HS algorithm was proposed to obtain GM record sets for NDAs of 2D and/or 3D structural models considering both horizontal and vertical seismic excitation. The efficiency of the model was demonstrated using different numerical examples considering various UHS-based and scenario-based target spectra. It was observed that the model can be used efficiently to obtain suitable GM record sets with the desired spectral compatibility and spectral variability for both horizontal and vertical components. Below are some key characteristics and consequences of the solution model:
  • Practitioners can develop customized catalogues by considering the regional seismic characteristics of their site of interest to obtain tailored ground motion records for their analysis.
  • The MSE parameter is used to assess the quality of matching between the selected GMs and target spectra. If the MSE values are higher, the compatibility between the selected GMs and target spectra decreases. The scatter in the spectra will generally produce more scatter in the responses, making it difficult to obtain reliable response statistics. The results demonstrated that it is possible to obtain quite low MSE values with the proposed model.
  • If desired, the model can incorporate period-dependent spectral variability in both horizontal and vertical components of the selected GM records, irrespective of the target spectral shapes.
  • The proposed model is capable of defining limits for record-to-record spectral variability in code-based selection, which may be advantageous for practicing engineers seeking a more comprehensive understanding of structural behavior.
  • A single-scale value was used for horizontal and vertical components of a selected GM record to maintain the relative amplitude and phasing of the real GM components.
There are some considerations of the proposed approach used in this study. Firstly, for 3D ground motion selection the means of the selected SRSS spectra were used for compatibility. It is also important to check that the means of both the x (first direction of horizontal spectra) and y (other direction of horizontal spectra) horizontal spectra are compatible with the target spectra, separately. Secondly, the effects of the single-scale value considering three orientations of GM and period-dependent record-to-record variability on the structural responses should be investigated as future work.

Author Contributions

Conceptualization, A.D., M.P. and A.H.K.; Methodology, A.D., M.P. and A.H.K.; Software, A.D., M.P. and A.H.K.; Investigation, A.D., M.P. and A.H.K.; Resources, M.P.; Writing—original draft, A.D., M.P. and A.H.K.; Writing—review & editing, A.D., M.P. and A.H.K.; Visualization, A.D., M.P. and A.H.K. All authors have read and agreed to the published version of the manuscript.

Funding

This research received no external funding.

Institutional Review Board Statement

Not applicable.

Informed Consent Statement

Not applicable.

Data Availability Statement

The original contributions presented in this study are included in the article. Further inquiries can be directed to the corresponding author.

Conflicts of Interest

The author declares no conflicts of interest.

References

  1. Sextos, A.G. Selection of Ground Motions for Response History Analysis. In Encyclopedia of Earthquake Engineering; Springer: Berlin/Heidelberg, Germany, 2014; pp. 1–10. [Google Scholar]
  2. Han, S.W.; Seok, S.W. Efficient Procedure for Selecting and Scaling Ground Motions for Response History Analysis. J. Struct. Eng. 2014, 140, 06013004. [Google Scholar] [CrossRef]
  3. Strukar, K.; Sipos, T.K.; Jelec, M.; Hadzima-Nyarko, M. Efficient Damage Assessment for Selected Earthquake Records Based on Spectral Matching. Earthq. Struct. 2019, 17, 271–282. [Google Scholar] [CrossRef]
  4. Iervolino, I.; Galasso, C.; Cosenza, E. REXEL: Computer Aided Record Selection for Code-Based Seismic Structural Analysis. Bull. Earthq. Eng. 2010, 8, 339–362. [Google Scholar] [CrossRef]
  5. Palanci, M.; Demir, A.; Kayhan, A.H. The Investigation of Displacement Demands of Single Degree of Freedom Models Using Real Earthquake Records Compatible with TBEC-2018. Pamukkale Univ. J. Eng. Sci. 2021, 27, 251–263. [Google Scholar] [CrossRef]
  6. Demir, A.; Palanci, M.; Kayhan, A.H. Evaluation of Supplementary Constraints on Dispersion of EDPs Using Real Ground Motion Record Sets. Arab. J. Sci. Eng. 2020, 45, 8379–8401. [Google Scholar] [CrossRef]
  7. Xu, G.; Guo, T.; Li, A.; Zhou, T.; Shuang, C. Seismic Performance of Steel Frame Structures with Novel Self-Centering Beams: Shaking-Table Tests and Numerical Analysis. J. Struct. Eng. 2025, 151, 04025002. [Google Scholar] [CrossRef]
  8. Baker, J.W. Conditional Mean Spectrum: Tool for Ground-Motion Selection. J. Struct. Eng. 2011, 137, 322–331. [Google Scholar] [CrossRef]
  9. Datta, T.K. Seismic Analysis of Structures; Wiley: Hoboken, NJ, USA, 2010; ISBN 9780470824610. [Google Scholar]
  10. Akkar, S.; Sandıkkaya, M.A.; Bommer, J.J. Empirical Ground-Motion Models for Point- and Extended-Source Crustal Earthquake Scenarios in Europe and the Middle East. Bull. Earthq. Eng. 2014, 12, 359–387. [Google Scholar] [CrossRef]
  11. Katsanos, E.I.; Sextos, A.G.; Manolis, G.D. Selection of Earthquake Ground Motion Records: A State-of-the-Art Review from a Structural Engineering Perspective. Soil Dyn. Earthq. Eng. 2010, 30, 157–169. [Google Scholar] [CrossRef]
  12. Caicedo, D.; Karimzadeh, S.; Bernardo, V.; Lourenço, P.B. Selection and Scaling Approaches of Earthquake Time-Series for Structural Engineering Applications: A State-of-the-Art Review. Arch. Comput. Methods Eng. 2024, 31, 1475–1505. [Google Scholar] [CrossRef]
  13. EN 1998-1:2004; Eurocode-8 Eurocode 8: Design of Structures for Earthquake Resistance—Part 1: General Rules, Seismic Actions and Rules for Buildings. European Committee for Standardization: Brussels, Belgium, 2004; ISBN 0580458725.
  14. TBEC; Turkish Building Earthquake Code. Disaster and Emergency Management Presidency: Ankara, Turkiye, 2018.
  15. ASCE/SEI 7–16; Minimum Design Loads and Associated Criteria for Buildings and Other Structures. American Society of Civil Engineers (ASCE): Reston, VA, USA, 2017; ISBN 9780784479964.
  16. Huang, Y.-N.; Whittaker, A.S.; Luco, N.; Hamburger, R.O. Scaling Earthquake Ground Motions for Performance-Based Assessment of Buildings. J. Struct. Eng. 2011, 137, 311–321. [Google Scholar] [CrossRef]
  17. Shakeri, K.; Khansoltani, E.; Pessiki, S. Ground Motion Scaling for Seismic Response Analysis by Considering Inelastic Response and Contribution of the Higher Modes. Soil Dyn. Earthq. Eng. 2018, 110, 70–85. [Google Scholar] [CrossRef]
  18. Palanci, M.; Demir, A.; Kayhan, A.H. Quantifying the Effect of Amplitude Scaling of Real Ground Motions Based on Structural Responses of Vertically Irregular and Regular RC Frames. Structures 2023, 51, 105–123. [Google Scholar] [CrossRef]
  19. Demir, A.; Palanci, M.; Kayhan, A.H. Evaluation the Effect of Amplitude Scaling of Real Ground Motions on Seismic Demands Accounting Different Structural Characteristics and Soil Classes. Bull. Earthq. Eng. 2024, 22, 365–393. [Google Scholar] [CrossRef]
  20. Demir, A.; Kayhan, A.H.; Palanci, M. Response- and Probability-Based Evaluation of Spectrally Matched Ground Motion Selection Strategies for Bi-Directional Dynamic Analysis of Low- to Mid-Rise RC Buildings. Structures 2023, 58, 105533. [Google Scholar] [CrossRef]
  21. Sextos, A.G.; Katsanos, E.I.; Manolis, G.D. EC8-Based Earthquake Record Selection Procedure Evaluation: Validation Study Based on Observed Damage of an Irregular R/C Building. Soil Dyn. Earthq. Eng. 2011, 31, 583–597. [Google Scholar] [CrossRef]
  22. Kohrangi, M.; Bazzurro, P.; Vamvatsikos, D. Conditional Spectrum Bidirectional Record Selection for Risk Assessment of 3D Structures Using Scalar and Vector IMs. Earthq. Eng. Struct. Dyn. 2019, 48, 1066–1082. [Google Scholar] [CrossRef]
  23. Kayhan, A.H.; Demir, A.; Palanci, M. Multi-Functional Solution Model for Spectrum Compatible Ground Motion Record Selection Using Stochastic Harmony Search Algorithm. Bull. Earthq. Eng. 2022, 20, 6407–6440. [Google Scholar] [CrossRef]
  24. Kayhan, A.H. Scaled and Unscaled Ground Motion Sets for Uni-Directional and Bi-Directional Dynamic Analysis. Earthq. Struct. 2016, 10, 563–588. [Google Scholar] [CrossRef]
  25. Zhang, L.; Zhang, W. Influence of Structural Parameters on the Vertical Pounding between Girder and Pier in Unequal-Span Girder Bridges under near-Fault Vertical Ground Motions. Sci. Rep. 2025, 15, 9740. [Google Scholar] [CrossRef]
  26. Yang, H.; Yin, X.; Hao, H.; Bi, K. Theoretical Investigation of Bridge Seismic Responses with Pounding under Near-Fault Vertical Ground Motions. Adv. Struct. Eng. 2015, 18, 453–468. [Google Scholar] [CrossRef]
  27. Ryan, K.L.; Dao, N.D. Influence of Vertical Ground Shaking on Horizontal Response of Seismically Isolated Buildings with Friction Bearings. J. Struct. Eng. 2016, 142, 04015089. [Google Scholar] [CrossRef]
  28. Manoukas, G.E. Structural Modelling of Reinforced Concrete Planar Frames under Vertical Ground Motion. Asian J. Civ. Eng. 2021, 22, 1563–1580. [Google Scholar] [CrossRef]
  29. Manoukas, G.; Tsiggelis, V. The Influence of Vertical Ground Motion on the Design of Common R/C Frames. Appl. Sci. 2025, 15, 1711. [Google Scholar] [CrossRef]
  30. Gremer, N.; Adam, C.; Medina, R.A.; Moschen, L. Vertical Peak Floor Accelerations of Elastic Moment-Resisting Steel Frames. Bull. Earthq. Eng. 2019, 17, 3233–3254. [Google Scholar] [CrossRef]
  31. ALMahdi, F.; Fahjan, Y.; Doğangün, A. Scaling of Vertical Component of Seismic Ground Motion. Alex. Eng. J. 2020, 59, 3827–3845. [Google Scholar] [CrossRef]
  32. Tsalouchidis, K.T.; Moschen, L.; Adam, C. Efficient Selection of up to Three-Component Ground Excitation Sets for Earthquake Engineering Applications. Soil Dyn. Earthq. Eng. 2021, 148, 106734. [Google Scholar] [CrossRef]
  33. Kumar, A.; Choudhury, D.; Katzenbach, R. Effect of Earthquake on Combined Pile–Raft Foundation. Int. J. Geomech. 2016, 16, 04016013. [Google Scholar] [CrossRef]
  34. Løkke, A.; Chopra, A.K. Direct Finite Element Method for Nonlinear Analysis of Semi-unbounded Dam–Water–Foundation Rock Systems. Earthq. Eng. Struct. Dyn. 2017, 46, 1267–1285. [Google Scholar] [CrossRef]
  35. Ruggieri, S.; Uva, G. Extending the Concepts of Response Spectrum Analysis to Nonlinear Static Analysis: Does It Make Sense? Innov. Infrastruct. Solut. 2024, 9, 235. [Google Scholar] [CrossRef]
  36. Ruggieri, S.; Vukobratović, V. The Influence of Torsion on Acceleration Demands in Low-Rise RC Buildings. Bull. Earthq. Eng. 2024, 22, 2433–2468. [Google Scholar] [CrossRef]
  37. Araújo, M.; Macedo, L.; Marques, M.; Castro, J.M. Code-Based Record Selection Methods for Seismic Performance Assessment of Buildings. Earthq. Eng. Struct. Dyn. 2016, 45, 129–148. [Google Scholar] [CrossRef]
  38. Kohrangi, M.; Bazzurro, P.; Vamvatsikos, D.; Spillatura, A. Conditional Spectrum-Based Ground Motion Record Selection Using Average Spectral Acceleration. Earthq. Eng. Struct. Dyn. 2017, 46, 1667–1685. [Google Scholar] [CrossRef]
  39. Katsanos, E.I.; Sextos, A.G. Structure-Specific Selection of Earthquake Ground Motions for the Reliable Design and Assessment of Structures. Bull. Earthq. Eng. 2018, 16, 583–611. [Google Scholar] [CrossRef]
  40. Iervolino, I. Assessing Uncertainty in Estimation of Seismic Response for PBEE. Earthq. Eng. Struct. Dyn. 2017, 46, 1711–1723. [Google Scholar] [CrossRef]
  41. Baltzopoulos, G.; Baraschino, R.; Giorgio, M.; Iervolino, I. Why Determining the Number of Code Spectrum-Matched Records Based on Usual Statistics Is an Ill-Posed Problem. In Proceedings of the 17th World Conference on Earthquake Engineering, Sendai, Japan, 13–18 September 2020. [Google Scholar]
  42. Demir, A.; Palanci, M.; Kayhan, A.H. Probabilistic Assessment for Spectrally Matched Real Ground Motion Records on Distinct Soil Profiles by Simulation of SDOF Systems. Earthq. Struct. 2021, 21, 395–411. [Google Scholar] [CrossRef]
  43. Hancock, J.; Bommer, J.J.; Stafford, P.J. Numbers of Scaled and Matched Accelerograms Required for Inelastic Dynamic Analyses. Earthq. Eng. Struct. Dyn. 2008, 37, 1585–1607. [Google Scholar] [CrossRef]
  44. Kayhan, A.H.; Demir, A. Statistical Evaluation of Drift Demands of Rc Frames Using Code-Compatible Real Ground Motion Record Sets. Struct. Eng. Mech. 2016, 60, 953–977. [Google Scholar] [CrossRef]
  45. Jayaram, N.; Lin, T.; Baker, J.W. A Computationally Efficient Ground-Motion Selection Algorithm for Matching a Target Response Spectrum Mean and Variance. Earthq. Spectra 2011, 27, 797–815. [Google Scholar] [CrossRef]
  46. Baker, J.W.; Lee, C. An Improved Algorithm for Selecting Ground Motions to Match a Conditional Spectrum. J. Earthq. Eng. 2018, 22, 708–723. [Google Scholar] [CrossRef]
  47. Ha, S.J.; Han, S.W. An Efficient Method for Selecting and Scaling Ground Motions Matching Target Response Spectrum Mean and Variance. Earthq. Eng. Struct. Dyn. 2016, 45, 1381–1387. [Google Scholar] [CrossRef]
  48. Kwong, N.S.; Chopra, A.K. Selecting, Scaling, and Orienting Three Components of Ground Motions for Intensity-Based Assessments at Far-Field Sites. Earthq. Spectra 2020, 36, 1013–1037. [Google Scholar] [CrossRef]
  49. Akhani, M.; Alidadi, N.; Pezeshk, S. Application of Metaheuristic Algorithms in Ground Motion Selection and Scaling for Time History Analysis of Structures. J. Struct. Eng. 2024, 150, 04024094. [Google Scholar] [CrossRef]
  50. Geem, Z.W.; Kim, J.H.; Loganathan, G.V. A New Heuristic Optimization Algorithm: Harmony Search. Simulation 2001, 76, 60–68. [Google Scholar] [CrossRef]
  51. Ye, K.; Chen, Z.; Zhu, H. Proposed Strategy for the Application of the Modified Harmony Search Algorithm to Code-Based Selection and Scaling of Ground Motions. J. Comput. Civ. Eng. 2014, 28, 04014019. [Google Scholar] [CrossRef]
  52. Macedo, L.; Castro, J.M. SelEQ: An Advanced Ground Motion Record Selection and Scaling Framework. Adv. Eng. Softw. 2017, 114, 32–47. [Google Scholar] [CrossRef]
  53. Moschen, L.; Medina, R.A.; Adam, C. A Ground Motion Record Selection Approach Based on Multiobjective Optimization. J. Earthq. Eng. 2019, 23, 669–687. [Google Scholar] [CrossRef]
  54. Kaveh, A.; Mahdipou Moghanni, R.; Javadi, S.M. Ground Motion Record Selection Using Multi-Objective Optimization Algorithms: A Comparative Study. Period. Polytech. Civ. Eng. 2019, 63, 812–822. [Google Scholar] [CrossRef]
  55. Georgioudakis, M.; Fragiadakis, M. Selection and Scaling of Ground Motions Using Multicriteria Optimization. J. Struct. Eng. 2020, 146, 04020241. [Google Scholar] [CrossRef]
  56. Carballo, J.E.; Cornell, C.A. Probabilistic Seismic Demand Analysis: Spectrum Matching and Design; Reliability of Marine Structures Program, Department of Civil Engineering, Stanford University: Stanford, CA, USA, 2000. [Google Scholar]
  57. Abrahamson, N.A. Non-Stationary Spectral Matching. Seismol. Res. Lett. 1992, 63, 30. [Google Scholar]
  58. Naeim, F.; Alimoradi, A.; Pezeshk, S. Selection and Scaling of Ground Motion Time Histories for Structural Design Using Genetic Algorithms. Earthq. Spectra 2004, 20, 413–426. [Google Scholar] [CrossRef]
  59. Iervolino, I.; Maddaloni, G.; Cosenza, E. Eurocode 8 Compliant Real Record Sets for Seismic Analysis of Structures. J. Earthq. Eng. 2008, 12, 54–90. [Google Scholar] [CrossRef]
  60. Ancheta, T.D.; Darragh, R.B.; Stewart, J.P.; Seyhan, E.; Silva, W.J.; Chiou, B.S.-J.; Wooddell, K.E.; Graves, R.W.; Kottke, A.R.; Boore, D.M.; et al. NGA-West2 Database. Earthq. Spectra 2014, 30, 989–1005. [Google Scholar] [CrossRef]
  61. Das, R.; Sharma, M.; Choudhury, D.; Gonzalez, G. A Seismic Moment Magnitude Scale. Bull. Seismol. Soc. Am. 2019, 109, 1542–1555. [Google Scholar] [CrossRef]
  62. Campbell, K.W.; Bozorgnia, Y. NGA-West2 Ground Motion Model for the Average Horizontal Components of PGA, PGV, and 5% Damped Linear Acceleration Response Spectra. Earthq. Spectra 2014, 30, 1087–1115. [Google Scholar] [CrossRef]
  63. Bozorgnia, Y.; Campbell, K.W. Vertical Ground Motion Model for PGA, PGV, and Linear Response Spectra Using the NGA-West2 Database. Earthq. Spectra 2016, 32, 979–1004. [Google Scholar] [CrossRef]
  64. Coello Coello, C.A. Theoretical and Numerical Constraint-Handling Techniques Used with Evolutionary Algorithms: A Survey of the State of the Art. Comput. Methods Appl. Mech. Eng. 2002, 191, 1245–1287. [Google Scholar] [CrossRef]
  65. Sriwastav, R.K.; Basu, D. Selection and Scaling of 3-Component Ground Motion Suite for Scenario- and Intensity-Based Assessment of Buildings and Structures. Bull. Earthq. Eng. 2023, 21, 2533–2568. [Google Scholar] [CrossRef]
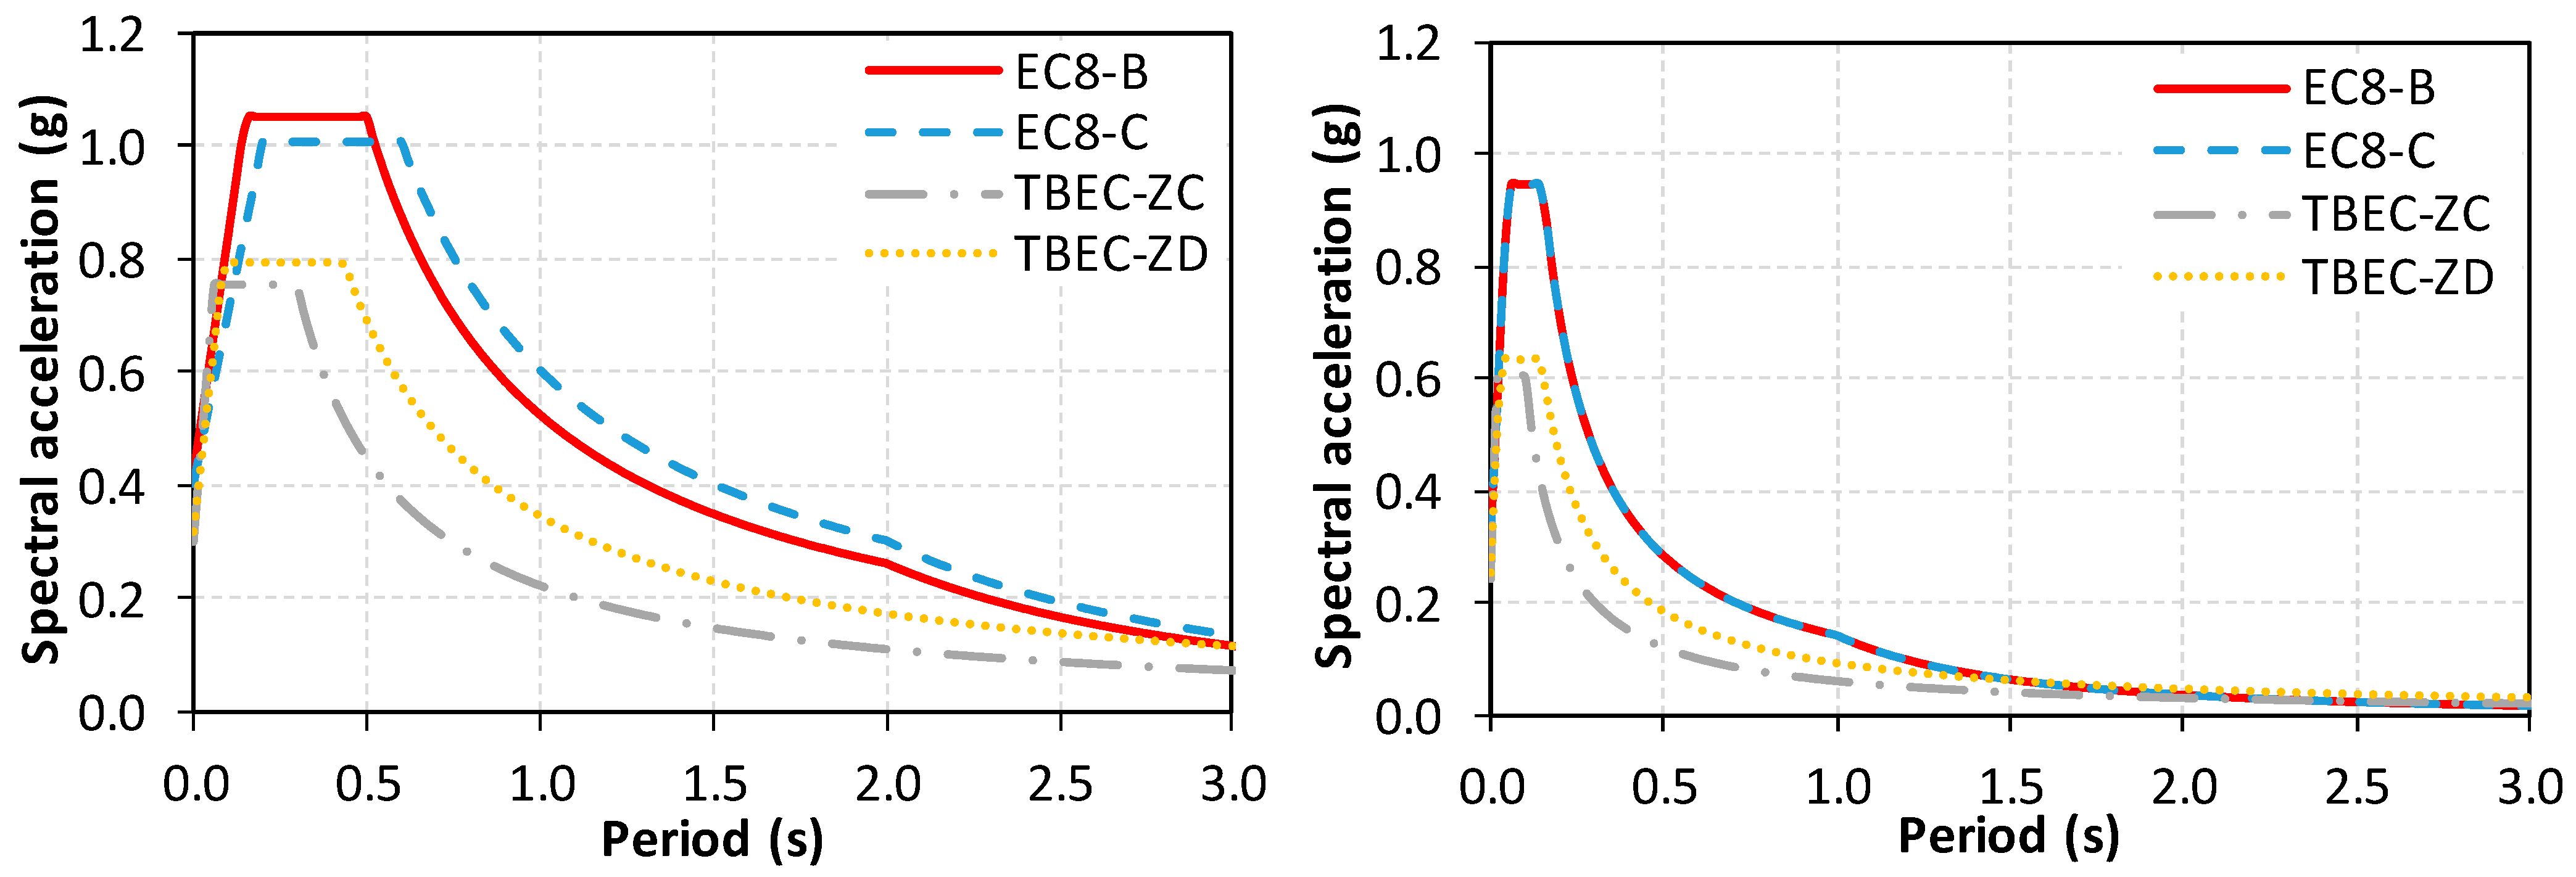
Figure 1. Target spectra according to EC8 and the TBEC (left: horizontal target spectrum; right: vertical target spectrum).
Applsci 15 04135 g001
Figure 2. Mwg-R values of GM records for the catalogue (left: EC8_B-TBEC_ZC; right: EC8_C-TBEC_ZD).
Applsci 15 04135 g002
Figure 3. Mean horizontal spectral acceleration and target spectrum according to EC8 and the TBEC (left: EC8_B-TBEC_ZC; right: EC8_C-TBEC_ZD).
Applsci 15 04135 g003
Figure 4. Mean vertical spectral acceleration in database and target spectrum according to EC8 and the TBEC (left: EC8_B-TBEC_ZC; right: EC8_C-TBEC_ZD).
Applsci 15 04135 g004
Figure 5. Scenario-based target spectrum (left) and period-dependent standard deviation (right) for both horizontal and vertical directions.
Applsci 15 04135 g005
Figure 6. Typical representation of the alignment of target and mean spectra (a) before; (b) after iterations of the algorithm.
Applsci 15 04135 g006
Figure 7. Typical representation of the alignment of target spectra and the standard deviation of ln (Sa) of selected records (a) before; (b) after iterations of the algorithm.
Applsci 15 04135 g007
Figure 8. Representative display of the HS-based solution model for GM selection.
Applsci 15 04135 g008
Figure 9. GM selection for uni-directional selection according to the TBEC for Soil ZD: (a) initial steps of the model for the horizontal direction; (b) initial steps of the model for the vertical direction; (c) final GM records for the horizontal direction; (d) final GM records for the vertical direction.
Applsci 15 04135 g009
Figure 10. GM selection for uni-directional selection with the vertical component for different seismic codes and local soil classes (left: scaled GM of the X or Y direction; right: scaled GM of the Z direction).
Applsci 15 04135 g010
Figure 11. Selection of three components simultaneously according to the TBEC and soil classes of ZC and ZD (left: SRSS spectrum of horizontal GMs; right: mean spectrum of selected records in the vertical direction).
Applsci 15 04135 g011
Figure 12. Selection of three components simultaneously according to EC8 and the soil classes of B and C (left: SRSS spectrum of horizontal GMs; right: mean spectrum of selected records in the vertical direction).
Applsci 15 04135 g012
Figure 13. GM selection for uni-directional selection according to the TBEC for soil class ZD considering the record-to-record variability (left: scaled GM of the X or Y direction; right: scaled GM of the Z direction).
Applsci 15 04135 g013
Figure 14. GM selection for bi-directional selection according to the TBEC for soil class ZD considering the record-to-record variability (left: SRSS spectrum of horizontal GMs; right: scaled GM of the Z direction).
Applsci 15 04135 g014
Figure 15. GM selection according to a scenario-based earthquake. Initial steps of the model for the spectral shape of acceleration and its deviation: (a) horizontal direction; (b) vertical direction. Final obtained GM records for the spectral shape of acceleration and its deviation: (c) horizontal direction; (d) vertical direction.
Applsci 15 04135 g015
Table 1. The parameters of the target spectrum for both EC8 and the TBEC.
ParameterEC8 Horizontal EC8 Vertical ParameterTBEC HorizontalTBEC Vertical
Soil BSoil CSoil BSoil CSoil ZCSoil ZDSoil ZCSoil ZD
Ag0.350.350.350.35SS0.600.600.600.60
ƞ1.001.001.001.00S10.150.150.150.15
S1.201.150.320.32SDS0.760.790.760.79
TB (s)0.150.200.050.05SD10.230.350.230.35
TC (s)0.500.600.150.15TA (s)0.060.090.020.03
TD (s)2.002.001.001.00TB (s)0.300.440.100.15
TL (s)6.006.003.003.00
Vs,30 (m/s)360–760180–360360–760180–360Vs,30 (m/s)360–760180–360360–760180–360
Table 2. The MSE values (units in percentage) of the sets for T = 1.0 s.
Seismic Codes1. Set2. Set3. Set4. SetMean
Hor.Ver.Hor.Ver.Hor.Ver.Hor.Ver.Hor.Ver.
TBDY_2D_ZC0.1430.0360.1620.0330.0540.0340.1780.0520.1340.039
TBDY_3D_ZC0.1260.0360.2320.0330.1770.0480.1310.0690.1660.046
EC8_2D_ZC0.6070.0680.2790.0450.8600.0830.3100.0630.5140.065
EC8_3D_ZC1.5660.0701.4170.0600.8430.0691.1130.0501.2350.062
TBDY_2D_ZD0.2260.0530.1170.0180.1480.0130.1660.0200.1640.026
TBDY_3D_ZD0.2620.0390.0620.0140.1930.0370.2980.0280.2040.029
EC8_2D_ZD0.4540.0710.2310.0780.3100.1300.1230.0880.2800.091
EC8_3D_ZD0.9900.0470.6140.0591.2510.1271.4880.0691.0860.076
Table 3. The MSE values (units in percentage) of the sets for T = 0.5 s.
Seismic Codes1. Set2. Set3. Set4. SetMean
Hor.Ver.Hor.Ver.Hor.Ver.Hor.Ver.Hor.Ver.
TBDY_2D_ZC0.1710.0570.1290.0420.1910.0770.1620.0580.1630.059
TBDY_3D_ZC0.3640.0760.2450.0140.2570.0640.1970.0630.2660.054
EC8_2D_ZC0.0930.1000.1160.0370.0990.1090.0490.0200.0890.067
EC8_3D_ZC1.3210.1631.1200.1600.4280.1091.0830.1380.9880.142
TBDY_2D_ZD0.1830.0680.1420.0580.1270.0490.1880.0730.1600.062
TBDY_3D_ZD0.2760.1380.6230.1060.2950.0720.4380.0690.4080.096
EC8_2D_ZD0.2650.1340.1360.1090.1930.1020.0570.0450.1630.098
EC8_3D_ZD0.7180.1080.7960.1820.7270.3490.7720.1840.7530.206
Disclaimer/Publisher’s Note: The statements, opinions and data contained in all publications are solely those of the individual author(s) and contributor(s) and not of MDPI and/or the editor(s). MDPI and/or the editor(s) disclaim responsibility for any injury to people or property resulting from any ideas, methods, instructions or products referred to in the content.

