Article

Effect of Zn2+ Ion Concentration on the Light-Induced Scattering and Holographic Storage Properties of Zn:Cu:Fe:LiNbO3 Crystals

School of Materials Science and Chemical Engineering, Harbin University of Science and Technology, 52 Xuefu Road, Nangang District, Harbin 150001, China
*
Author to whom correspondence should be addressed.
Appl. Sci. 2025, 15(8), 4129; https://doi.org/10.3390/app15084129
Submission received: 21 February 2025 / Revised: 24 March 2025 / Accepted: 1 April 2025 / Published: 9 April 2025
(This article belongs to the Section Chemical and Molecular Sciences)

Abstract

:
Lithium niobate (LiNbO3), a multifunctional crystalline material, has critical importance in advancing holographic storage systems. However, persistent challenges such as optical damage, limited diffraction efficiency, and slow response kinetics hinder its practical implementation. This work systematically examines the correlation between the Zn2+ dopant concentration and the defect architecture, photodamage resistance, and holographic storage properties of Zn:Cu:Fe:LiNbO3 crystals, employing advanced characterization techniques to elucidate structure–property relationships and optimize performance metrics. The experimental data reveal a pronounced Zn2+ doping concentration dependence in both photodamage resistance and holographic storage capabilities. Notably, Zn:Cu:Fe:LiNbO3 crystals doped with 7 mol% Zn2+ achieve a substantial 416-fold improvement in photodamage resistance (786.55 J/cm2) relative to the 1 mol% doped variant. Concurrently, these optimally doped crystals demonstrate superior holographic storage performance, characterized by a response time of 196.4 s, a dynamic range of 9.81, a diffraction efficiency of 66.7%, and a sensitivity of 1.04. The observed performance enhancement is fundamentally attributed to Zn2+ doping, which concomitantly suppresses intrinsic defect formation and tailors the spatial distribution of Fe3+/Cu2+ photorefractive centers within the crystal lattice. These mechanistic insights establish critical guidelines for the rational design of next-generation holographic storage materials with optimized photorefractive response and defect engineering capabilities.

1. Introduction

Lithium niobate (LiNbO3, LN) crystals have established themselves as pre-eminent candidates for holographic volume storage applications owing to their exceptional electro-optic coefficients and nonlinear optical properties [1,2]. Nevertheless, the practical deployment of undoped LiNbO3 in advanced storage systems faces substantial barriers stemming from inherent recombination centers, ionic mobility restrictions, volatile charge retention, and pronounced optical susceptibility [3]. To circumvent these limitations, recent advances have focused on the strategic incorporation of transition metal dopants (e.g., Fe3⁺, Cu2⁺, Mn2⁺, Ni2⁺), which engineer defect-mediated bandgap states to regulate carrier dynamics and amplify the photorefractive response through controlled electron-hole trapping mechanisms [4,5,6].
Among transition metal-doped LiNbO3 systems, iron-doped crystals (Fe:LiNbO3) have emerged as benchmark materials, achieving saturation diffraction efficiencies exceeding 70% at 488 nm illumination while demonstrating exceptional hologram stability, with grating persistence exceeding several months under dark storage conditions [7]. This material has enabled groundbreaking progress in volumetric data storage, notably demonstrated by the successful encoding of 10,000 high-resolution holograms within a 5.0 mm-thick crystal, achieving a record volumetric density of 6.7 Gbits/cm3 [8] and facilitating correlation recognition systems with 95% operational accuracy [9]. Despite these advances, Fe:LiNbO3 crystals remain constrained by two critical shortcomings: inherent fan-out scattering noise arising from photovoltaic field anisotropies and intrinsically slow response kinetics, which collectively impede their deployment in real-time storage architectures [10].
Recent advances in multi-element co-doping have yielded notable progress in non-volatile holographic storage, with Mn:Fe:LiNbO3, Tb:Fe:LiNbO3, and Ce:Cu:LiNbO3 crystals demonstrating enhanced charge retention and spatial phase stability under prolonged illumination [11,12,13,14,15]. Among these systems, dual doping with Fe3⁺ and Cu2⁺ has proven particularly effective: Fe:Cu:LiNbO3 crystals exhibit a 60-fold acceleration in writing speed and a 67-fold increase in sensitivity compared to single-doped analogues, attributed to synergistic electron-hole trapping at multivalent defect sites [16,17]. Despite these improvements, persistent limitations in secondary response kinetics underscore the need for advanced defect engineering approaches.
Building on these developments, the strategic integration of optical-damage-resistant ions (e.g., Mg2+, Sc3+, In3+, Hf4+, Zr4+) with photorefractive species has emerged as a promising strategy for suppressing intrinsic lattice defects and optimizing charge carrier dynamics [18,19,20,21,22]. Particularly noteworthy is Zn2+ doping, which exhibits exceptional multifunctionality: At concentrations above 6.2 mol%, it simultaneously enhances the photorefractive response while achieving an unprecedented ~200-fold improvement in photodamage resistance compared to undoped counterparts [23,24,25,26]. This unique dual-action mechanism establishes Zn2+ as a paradigm-shifting dopant for engineering high-performance holographic storage media.
In this study, we present an innovative Zn:Fe:Cu:LiNbO3 crystal system that synergistically integrates Zn2+ ion doping with dual photorefractive centers (Fe3+ and Cu2+). Building upon prior investigations by our group, high-concentration Zn2+ doping in Cu:Fe:LiNbO3 crystals significantly improves structural homogeneity, a critical factor in minimizing holographic distortion and noise during recording/readout processes [27]. Here, we systematically explore the impact of high-concentration Zn2+ doping on two underexamined yet technologically vital properties: photodamage resistance and holographic storage performance. By combining defect structure analysis with holographic parameter characterization, this work establishes a materials optimization framework to advance next-generation holographic storage technologies.

2. Materials and Methods

2.1. Material Preparation

The Zn:Cu:Fe:LiNbO3 crystals, which contained 1 mol% Fe2O3 and 1 mol% CuO, were grown in air using the Czochralski technique with varying doping concentrations of ZnO (1, 3, 5, and 7 mol%). The optical quality of the crystal is highly dependent on the purity level of its raw materials, namely, Nb2O5, LiCO3, ZnO, CuO, and Fe2O3. Therefore, these raw materials used for crystal growth must have a minimum purity level of 99.99%. The Nb2O5, LiCO3, ZnO, CuO, and Fe2O3 materials were thoroughly mixed for over 24 h before being placed into a platinum crucible. They were then heated to 750 °C for 2 h to eliminate CO2 and subsequently further heated to 1150 °C for another 2 h to facilitate the formation of a solid reaction polycrystalline material suitable for crystal growth.
The growth conditions were selected as follows: the temperature gradient was set at 2 °C/mm, while the polling rate and rotation rate were controlled within the range of 0.7 to 1.7 mm/h and 15–28 rpm, respectively. After the completion of crystal growth, it was gradually cooled to room temperature at a controlled rate of 35–40 °C/h. Simultaneously, to mitigate the impact of crystal spontaneous polarization on optical properties, all crystals were subjected to an artificial polarization process for 8 h in an intermediate-frequency furnace with a temperature of 1100 °C with a nearly zero temperature gradient, and a current density of 5 mA/cm2, resulting in the attainment of single-domain crystals. The wafers with dimensions of 5 mm × 8 mm × 2 mm (x × y × z) were obtained by cutting from the central region of the Zn:Cu:Fe:LiNbO3 crystals along the y-axis. The samples, denoted as Zn1, Zn3, Zn5, and Zn7, had varying concentrations of Zn2+ ions.

2.2. Characterization of Infrared Absorption Spectrum

The defect structures of Zn:Cu:Fe:LiNbO3 crystals were systematically characterized using Fourier-transform infrared (FTIR) spectroscopy. Infrared absorption spectra were acquired using an AVATAR370 spectrometer(Thermo Fisher Scientific, USA) under consistent experimental conditions, with a spectral range of 3400–3600 cm−1, corresponding to the characteristic OH stretching vibration region. This analytical approach is particularly effective for defect structure analysis, as identical molecular groups and bond types exhibit characteristic and reproducible absorption peaks [28].
During crystal growth, the H⁺ ions from both the raw materials and growth atmosphere incorporate into the LiNbO3 lattice, predominantly existing as OH groups [29]. The OH stretching vibration demonstrates exceptional sensitivity to local ionic environments, making infrared spectroscopy an invaluable tool for investigating ion occupancy and defect configurations in LiNbO3 crystals. The precise analysis of OH absorption bands provides critical insights into the distribution and coordination of dopant ions within the crystal lattice.

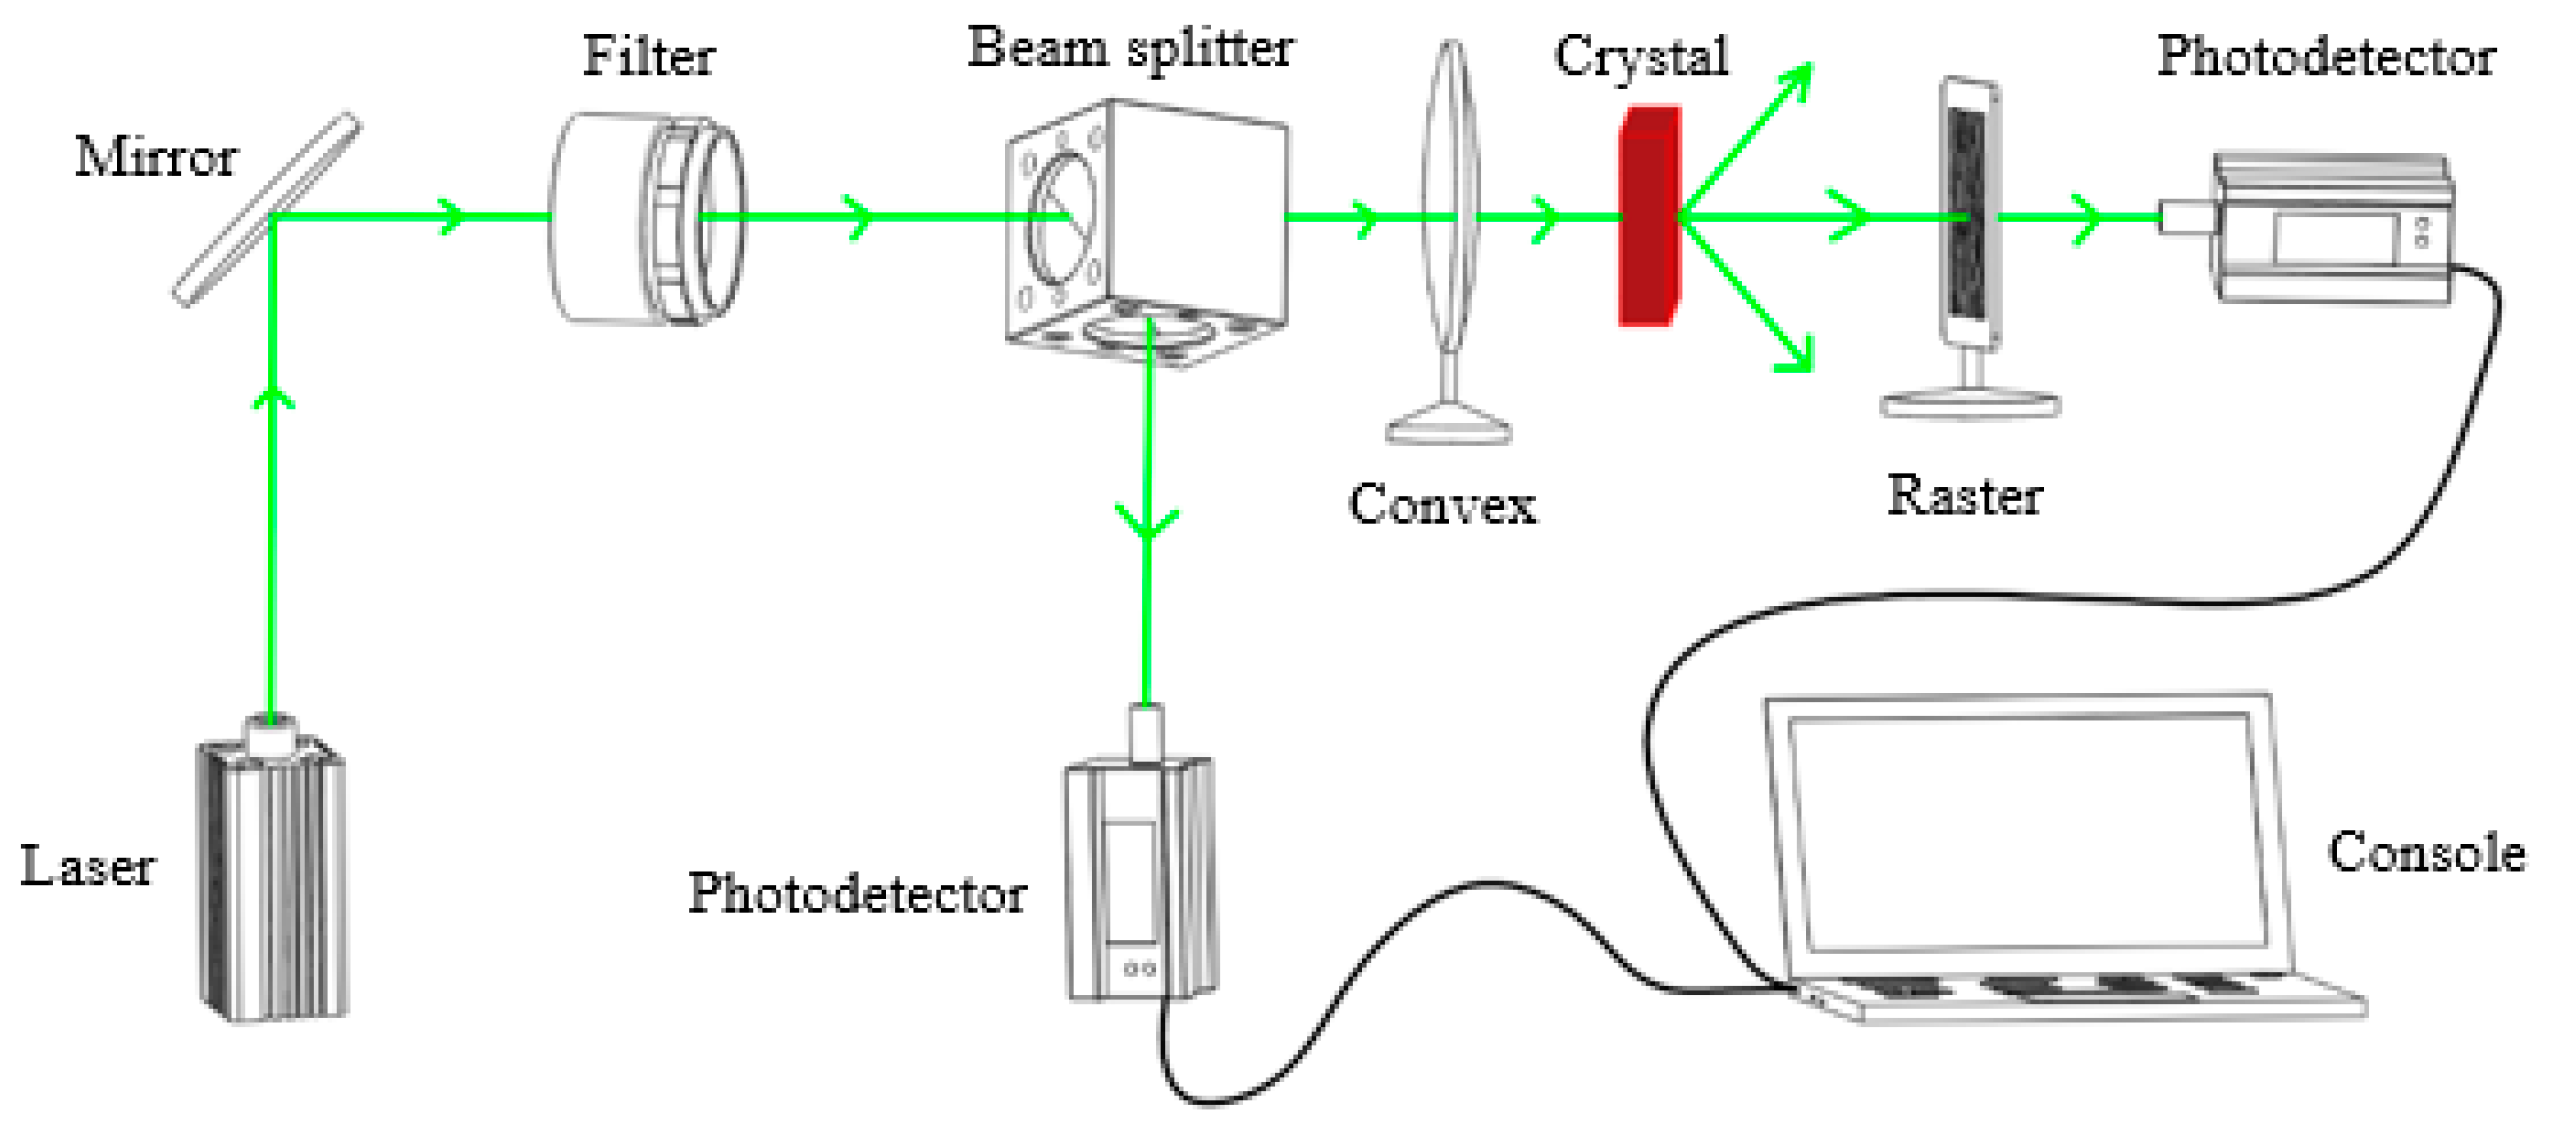
2.3. Characterization of Light-Induced Scattering

The optical damage resistance of Zn:Cu:Fe:LiNbO3 crystals with varying Zn2+ ion concentrations was quantitatively evaluated using the light scattering energy flux threshold method. This phenomenon, characterized by the onset of pronounced internal scattering when incident laser energy exceeds a critical threshold, is a well-established indicator of optical damage in photorefractive materials. The scattering intensity exhibits saturation behavior, reaching a maximum value that remains constant despite further increases in incident energy, a characteristic known as the light-induced scattering threshold effect.
The experimental setup, illustrated in Figure 1, employed a semiconductor laser source with an adjustable attenuator for precise power control. When incident light (I0) interacts with the crystal, it partitions into three components according to the following energy balance equation:
I 0 = I T + I A + I R
where IT, IA, and IR represent transmitted, absorbed, and reflected light intensities, respectively. The scattering phenomenon is quantitatively described by the relationship between scattered light intensity (IS) and transmitted light [30]:
I S = I T 0 I T t
Here, IT0 and ITt denote the transmitted light intensities at the initial time and time t, respectively. The scattering ratio (Rs) is defined as
R s = I S / I T 0
The scattering ratio serves as a quantitative measure of scattering intensity. The effective incident light intensity (Ieff) is determined by
I e f f + I R = I 0
where R represents the surface reflectivity. The exposure energy (Er), a critical parameter for optical damage resistance, is calculated through temporal integration of the effective intensity,
E r = I e f f τ = ( 1 R ) × I 0 τ
where τ represents the scattering time constant, determined by fitting the dynamic scattering curve to the following equation:
R s = R s , s a t 1 e x p t τ
The saturation scattering ratio (Rs,sat) and time constant (τ) provide quantitative measures of the crystal’s optical damage resistance. Longer saturation times and higher exposure energies correlate with enhanced resistance to optical damage, offering crucial insights into the material’s performance characteristics.

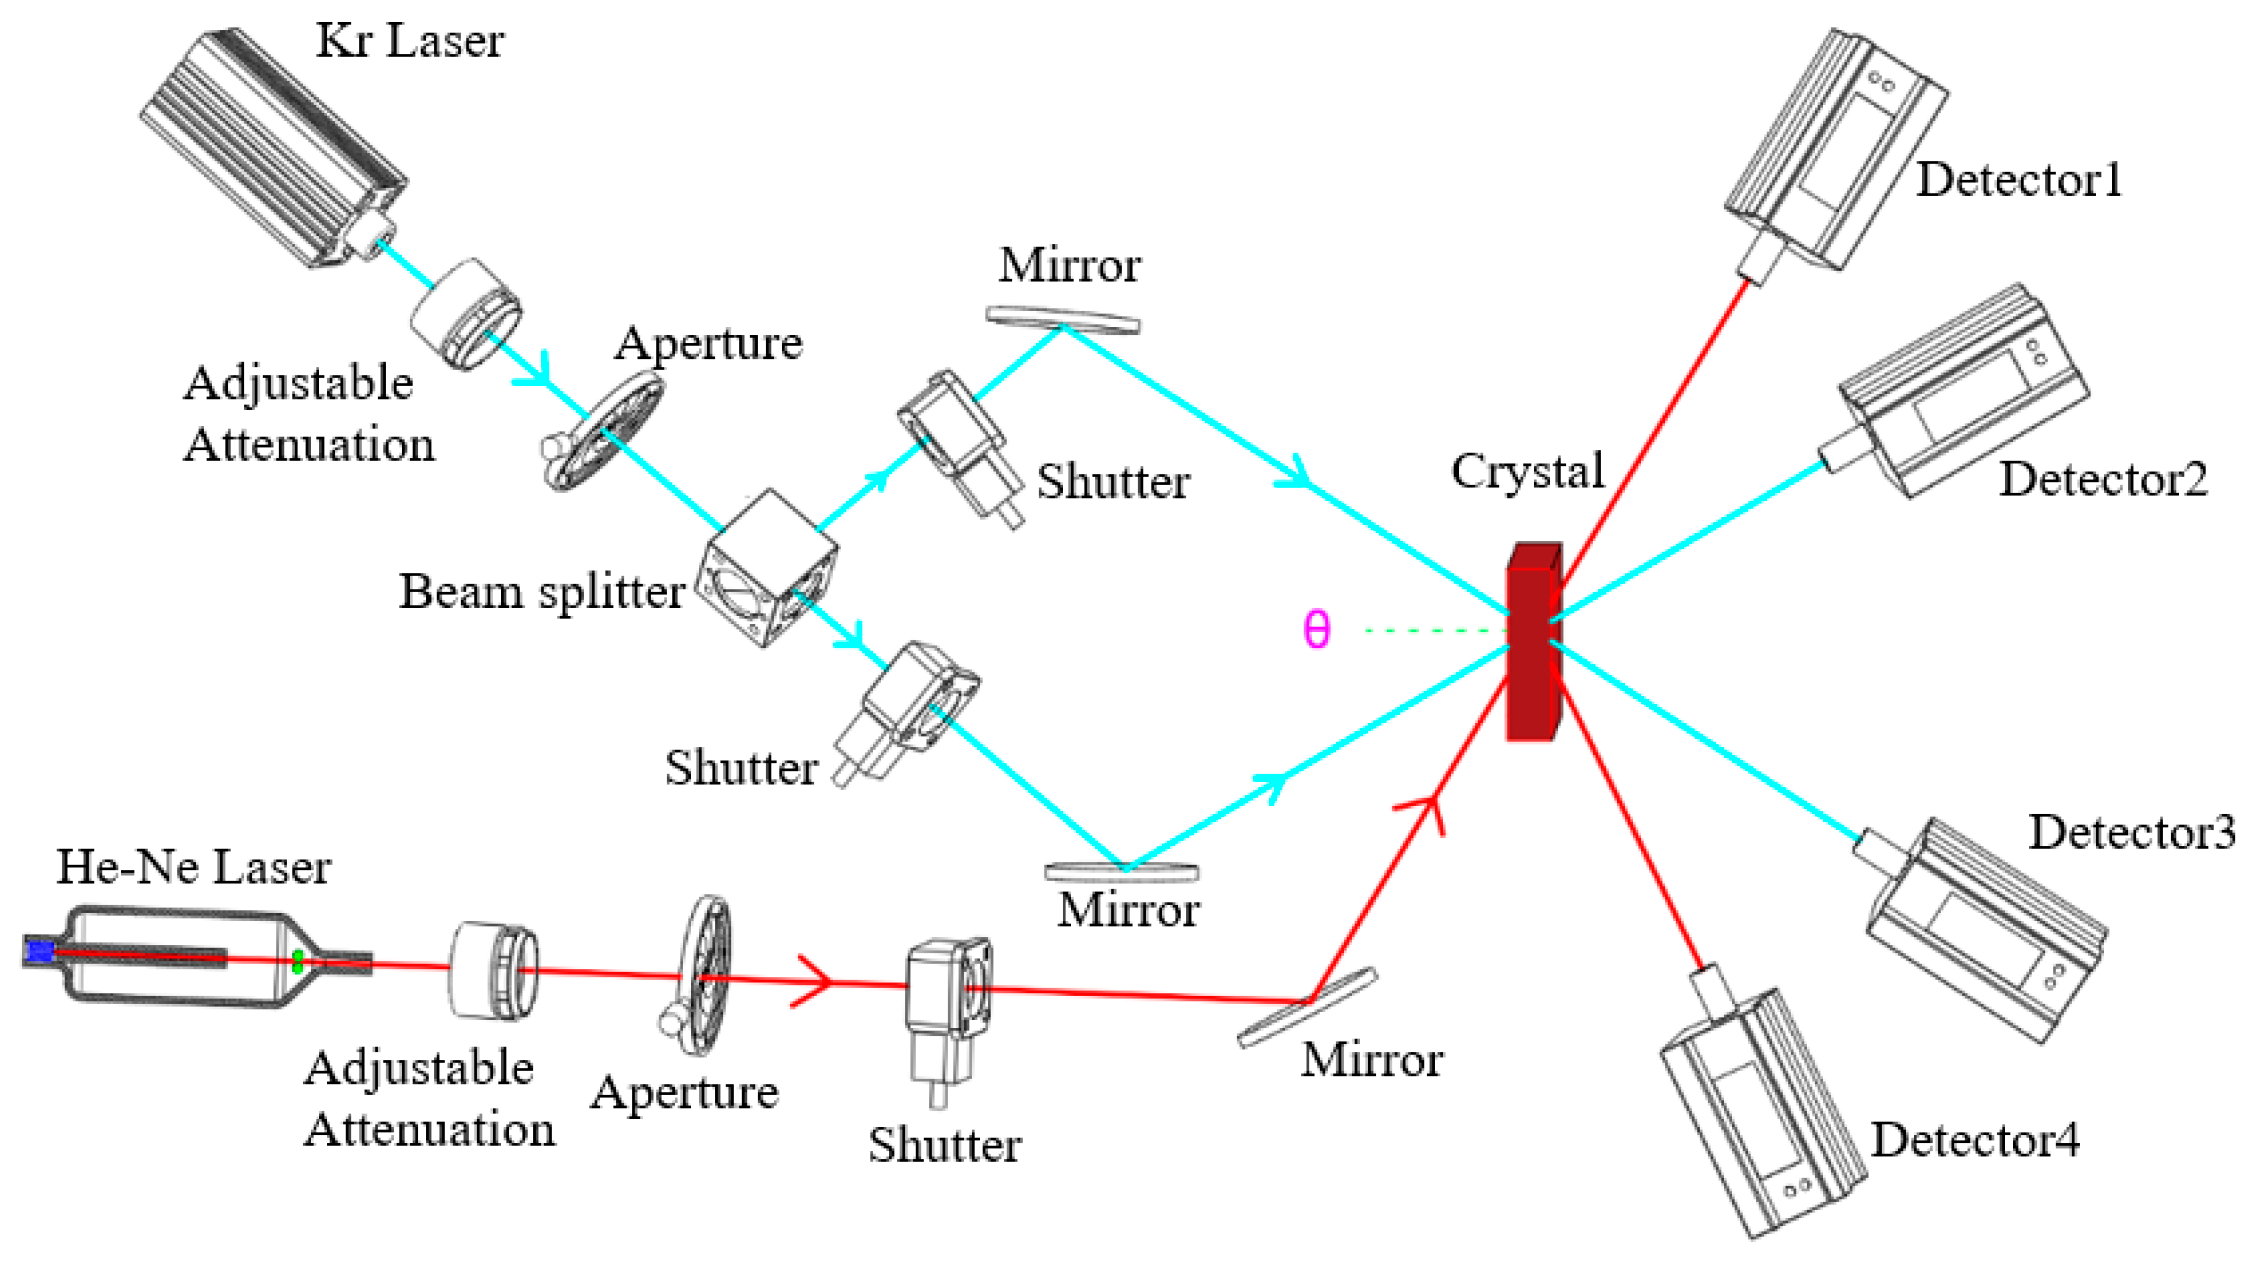
2.4. Characterization of Two-Wavelength Coupling Experiment

The holographic storage properties of Zn:Cu:Fe:LiNbO3 crystals were investigated using a two-wavelength coupling experiment [31,32]. This technique is employed to study the interaction between two light waves in nonlinear optical materials, enabling the observation and analysis of phenomena such as energy transfer and phase modulation between light waves. Consequently, it provides insights into the nonlinear optical properties of the materials. The experimental setup is illustrated in Figure 2. A Kr+ laser operating at a wavelength of 476 nm and a He-Ne laser operating at a wavelength of 633 nm were used to generate the recording and readout beams, respectively. The recording beam was split into two beams, Is and Ir, of equal intensity (120 mW/cm2) using a continuously adjustable beam splitter. These beams were polarized in the incidence plane and directed toward the crystal at the corresponding Bragg angle of 16°, intersecting symmetrically inside the crystal to form a grating vector along the c-axis.
The beams were precisely controlled by electronic shutters placed in the object light, reference light, and detection light paths, separating the holographic storage into different storage processes. During grating recording, the shutters in the object light and reference light paths were simultaneously opened to record the refractive index grating, while the probe light was activated to detect the diffraction grating in real time. During grating reading, only the shutter in the probe light path was opened, allowing the shallow-level grating to be erased while the deep-level grating was fixed, enabling nonvolatile reading. This process, known as the erasure process, involves eliminating the grating recorded in the shallow layer and fixing the grating recorded in the deep center. The variation in the diffracted light intensity over time was measured using a precision power meter.
In the two-wavelength coupling experiment, several parameters, including diffraction efficiency (η), sensitivity (S), and dynamic range (M/#), were used to evaluate the holographic storage performance of the materials. Diffraction efficiency is a critical indicator for assessing the performance of holographic storage systems, as it directly reflects the efficiency of information recording and reading. Holographic storage records information in materials through interference patterns, and the diffraction efficiency indicates the material’s response capability to these patterns. High diffraction efficiency implies that the material can efficiently record interference patterns, thereby storing more information.
The diffraction efficiency is defined as the ratio of the intensity of the diffracted light (Id) to that of the transmitted light (It):
η = I d I t × 100 %  
The writing time, or response time, is a crucial parameter in holographic storage, reflecting the dynamic formation of gratings. The formation of a refractive index grating through a dynamic time process can be described by
η = η s a t ( 1 exp ( t / τ w ) )
Here, τw represents the writing time, which determines the speed of recording, and ηsat is the saturation diffraction efficiency during recording, a fixed parameter determined by the material’s properties.
The process of eliminating the refractive index grating can be described by
η = η s a t ( 1 exp ( t / τ e ) )
In this equation, τe represents the time constant for erasing, which characterizes the rate at which the grating is eliminated [33]. The saturation diffraction efficiency during recording, ηsat, is determined by
η s = s i n 2 π d η s a t λ c o s θ c r y
Here, ηs is the maximum diffraction efficiency, determined by the sample thickness (d), the recording beam wavelength (λ), and the refraction angle (θcry) of the incident light within the crystal.
Photorefractive sensitivity is another critical parameter for evaluating the performance of photorefractive materials. It reflects the efficiency of the material in generating refractive index changes under light irradiation. Higher photorefractive sensitivity indicates a faster response to light intensity and more significant refractive index changes, which are beneficial for applications such as holographic storage and optical information processing. The photorefractive sensitivity S is defined as [34]
S = d η d t t = 0 / I L
This equation represents the relationship between the total optical intensity (I) and the thickness of the crystal plate (L).
The dynamic range M/# is another essential parameter for evaluating photorefractive materials. It describes the maximum range of light intensity changes that the material can effectively record and read. A larger dynamic range indicates a wider range of light intensity changes that the material can handle, enhancing its performance in applications such as holographic storage and optical information processing. The dynamic range M/# is defined as [35]
η ω = M / # M 2
Here, ηω represents the diffraction efficiency when the M-th hologram is stored, and M indicates the number of holograms.
In the two-wave coupling experiment, only one recording is performed, the erasing process of the phase grating is recorded, and the writing time is short. Therefore, the sensitivity (S) and dynamic range M/# can be approximated as
S = d η d t t = 0 / I L η s / ( τ w × I L )
M / # = τ e d η d t t = 0 τ e τ w η s
These equations provide a simplified yet effective way to estimate the sensitivity and dynamic range in the context of the two-wavelength coupling experiment.

3. Results and Discussion

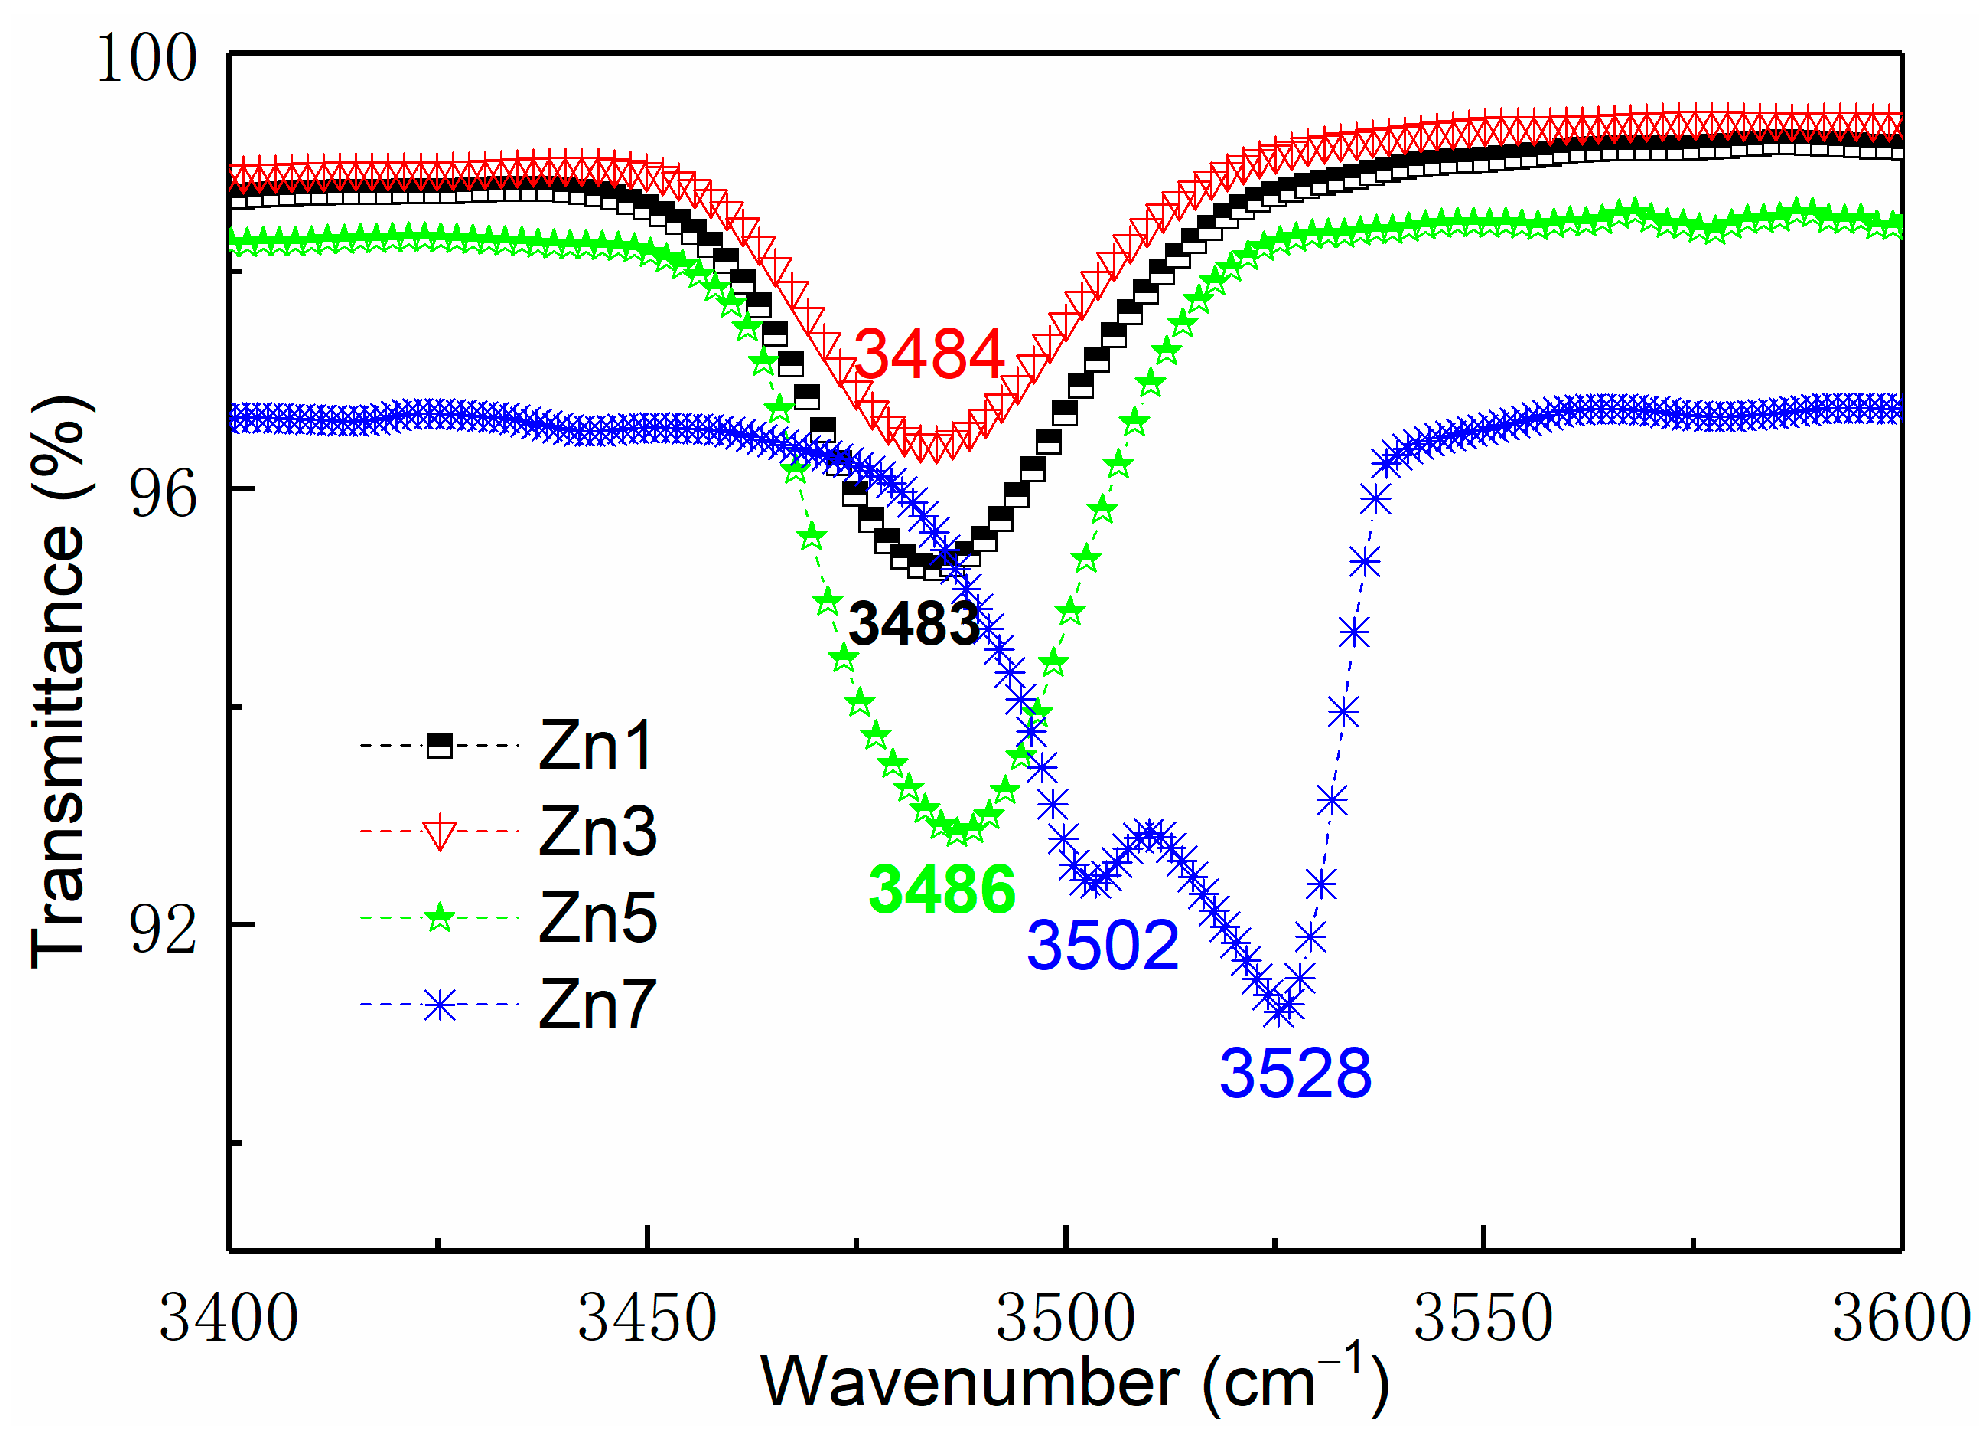
3.1. Infrared Absorption Spectrum

The OH absorption peak of pure LiNbO3 crystal is 3482 cm−1. V L i possesses a negative charge and exhibits an attractive force toward H+ ions, thereby resulting in the formation of a complex defect group N b L i 4 + 3 V L i O H L i , corresponding to the absorption peak at 3482 cm−1 [36,37].
The absorption peaks of samples Zn1, Zn3, and Zn5 in Figure 3 exhibit slight deviations from those observed in pure LiNbO3 crystal, occurring at 3483 cm−1, 3484 cm−1, and 3486 cm−1, respectively, while sample Zn7 displays two distinct OH absorption peaks at 3502 cm−1 and 3528 cm−1. The shift in the absorption peak can be elucidated by the underlying mechanism, as follows: The [Li]/[Nb] ratio of the congruent LiNbO3 crystals is 0.946, leading to the generation of intrinsic defects such as Li vacancy and anti-site Nb during the crystal growth process due to the absence of Li. The presence of a significant number of Li vacancies in the crystal leads to the incorporation of Nb into the Li site, resulting in the formation of anti-site Nb. In this study, the concentrations of doped Fe3+ and Cu2+ ions were fixed at a low level. When Fe3+ and Cu2+ ions enter the LiNbO3 crystal, they first occupy N b L i 4 + and form defects F e L i 2 + and C u L i + , which are positively charged and therefore do not attract H+. The doping of Fe3+ and Cu2+ ions has little impact on the absorption peak.
Therefore, the primary factor influencing the absorption peak is the variable Zn2+ ions, and it has been reported that the threshold concentration of Zn2+ ions is approximately 6 mol%. Additionally, when Zn2+ ions enter LiNbO3 crystals, they exhibit a preference for occupying N b L i 4 + to form Z n L i + . Before the doping concentration of Zn2+ reached the threshold, the main components in the crystal were still N b L i 4 + and V L i , so the absorption peaks of samples Zn1, Zn3, and Zn5 were still N b L i 4 + 3 V L i O H L i . The OH absorption bands of samples Zn1, Zn3, and Zn5 were all located at about 3482 cm−1. With the increase in the Zn2+ ion concentration, the decrease in the concentrations of N b L i 4 + and V L i in the crystal had a certain effect on H+, and the position of the absorption peak moved within a certain range.
When the concentration of Zn2+ ions exceeds the threshold concentration of 7 mol%, Zn2+ ions continue to occupy the conventional Li sites owing to their ionic radius and polarization capabilities, while pushing Fe3+ ions and Cu2+ ions to the Nb site, resulting in defect groups of F e N b 2 and C u N b 3 . Subsequently, some H+ ions are attracted toward the vicinity of F e N b 2 , resulting in the formation of a defect group consisting of F e N b 2 O H L i Z n L i + , leading to an absorption peak near 3502 cm−1. The H+ ion exhibits a higher affinity toward C u N b 3 compared to V L i and F e N b 2 , leading to the aggregation of H+ ions near C u N b 3 and the formation of a defect group of C u N b 3 O H L i 2 Z n L i + , thereby resulting in an additional absorption peak at 3528 cm−1. From the above analysis, we can draw the conclusion that when the doping concentration of Zn2+ ions reaches 7 mol%, Fe3+ and Cu2+ ions occupy the Nb sites, and Zn2+ ions continue to occupy the Li sites to complete the charge compensation.

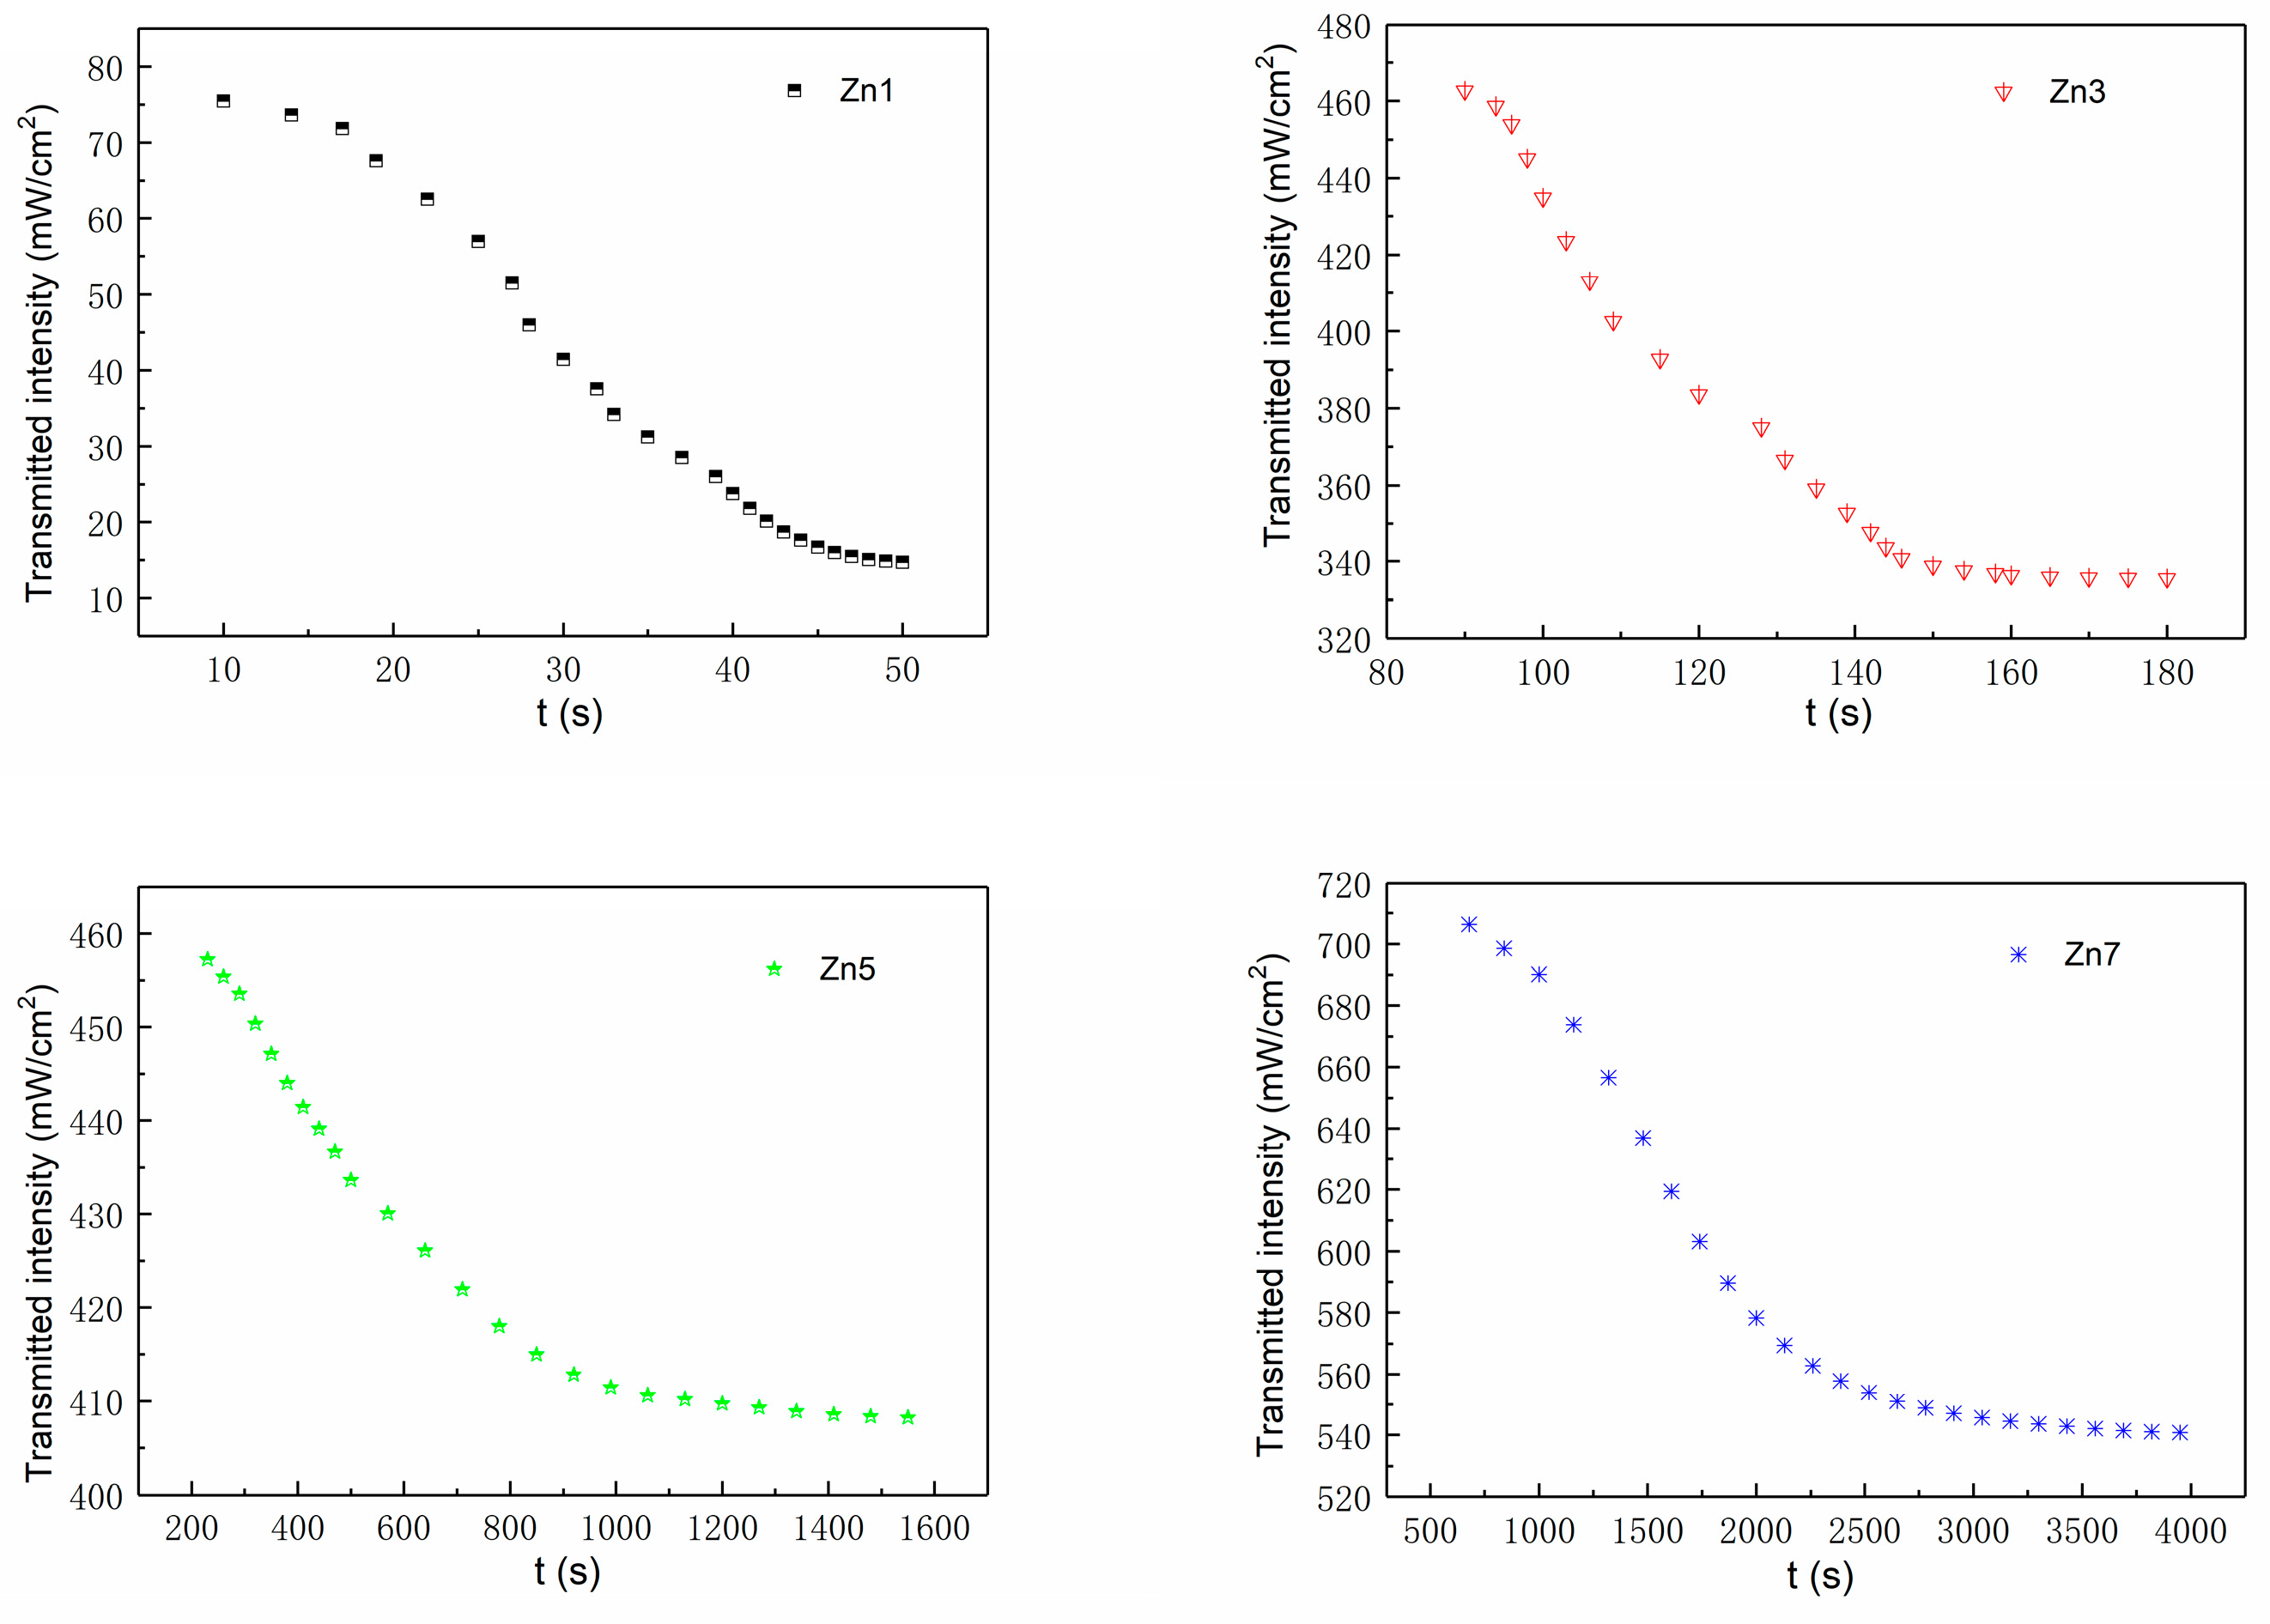
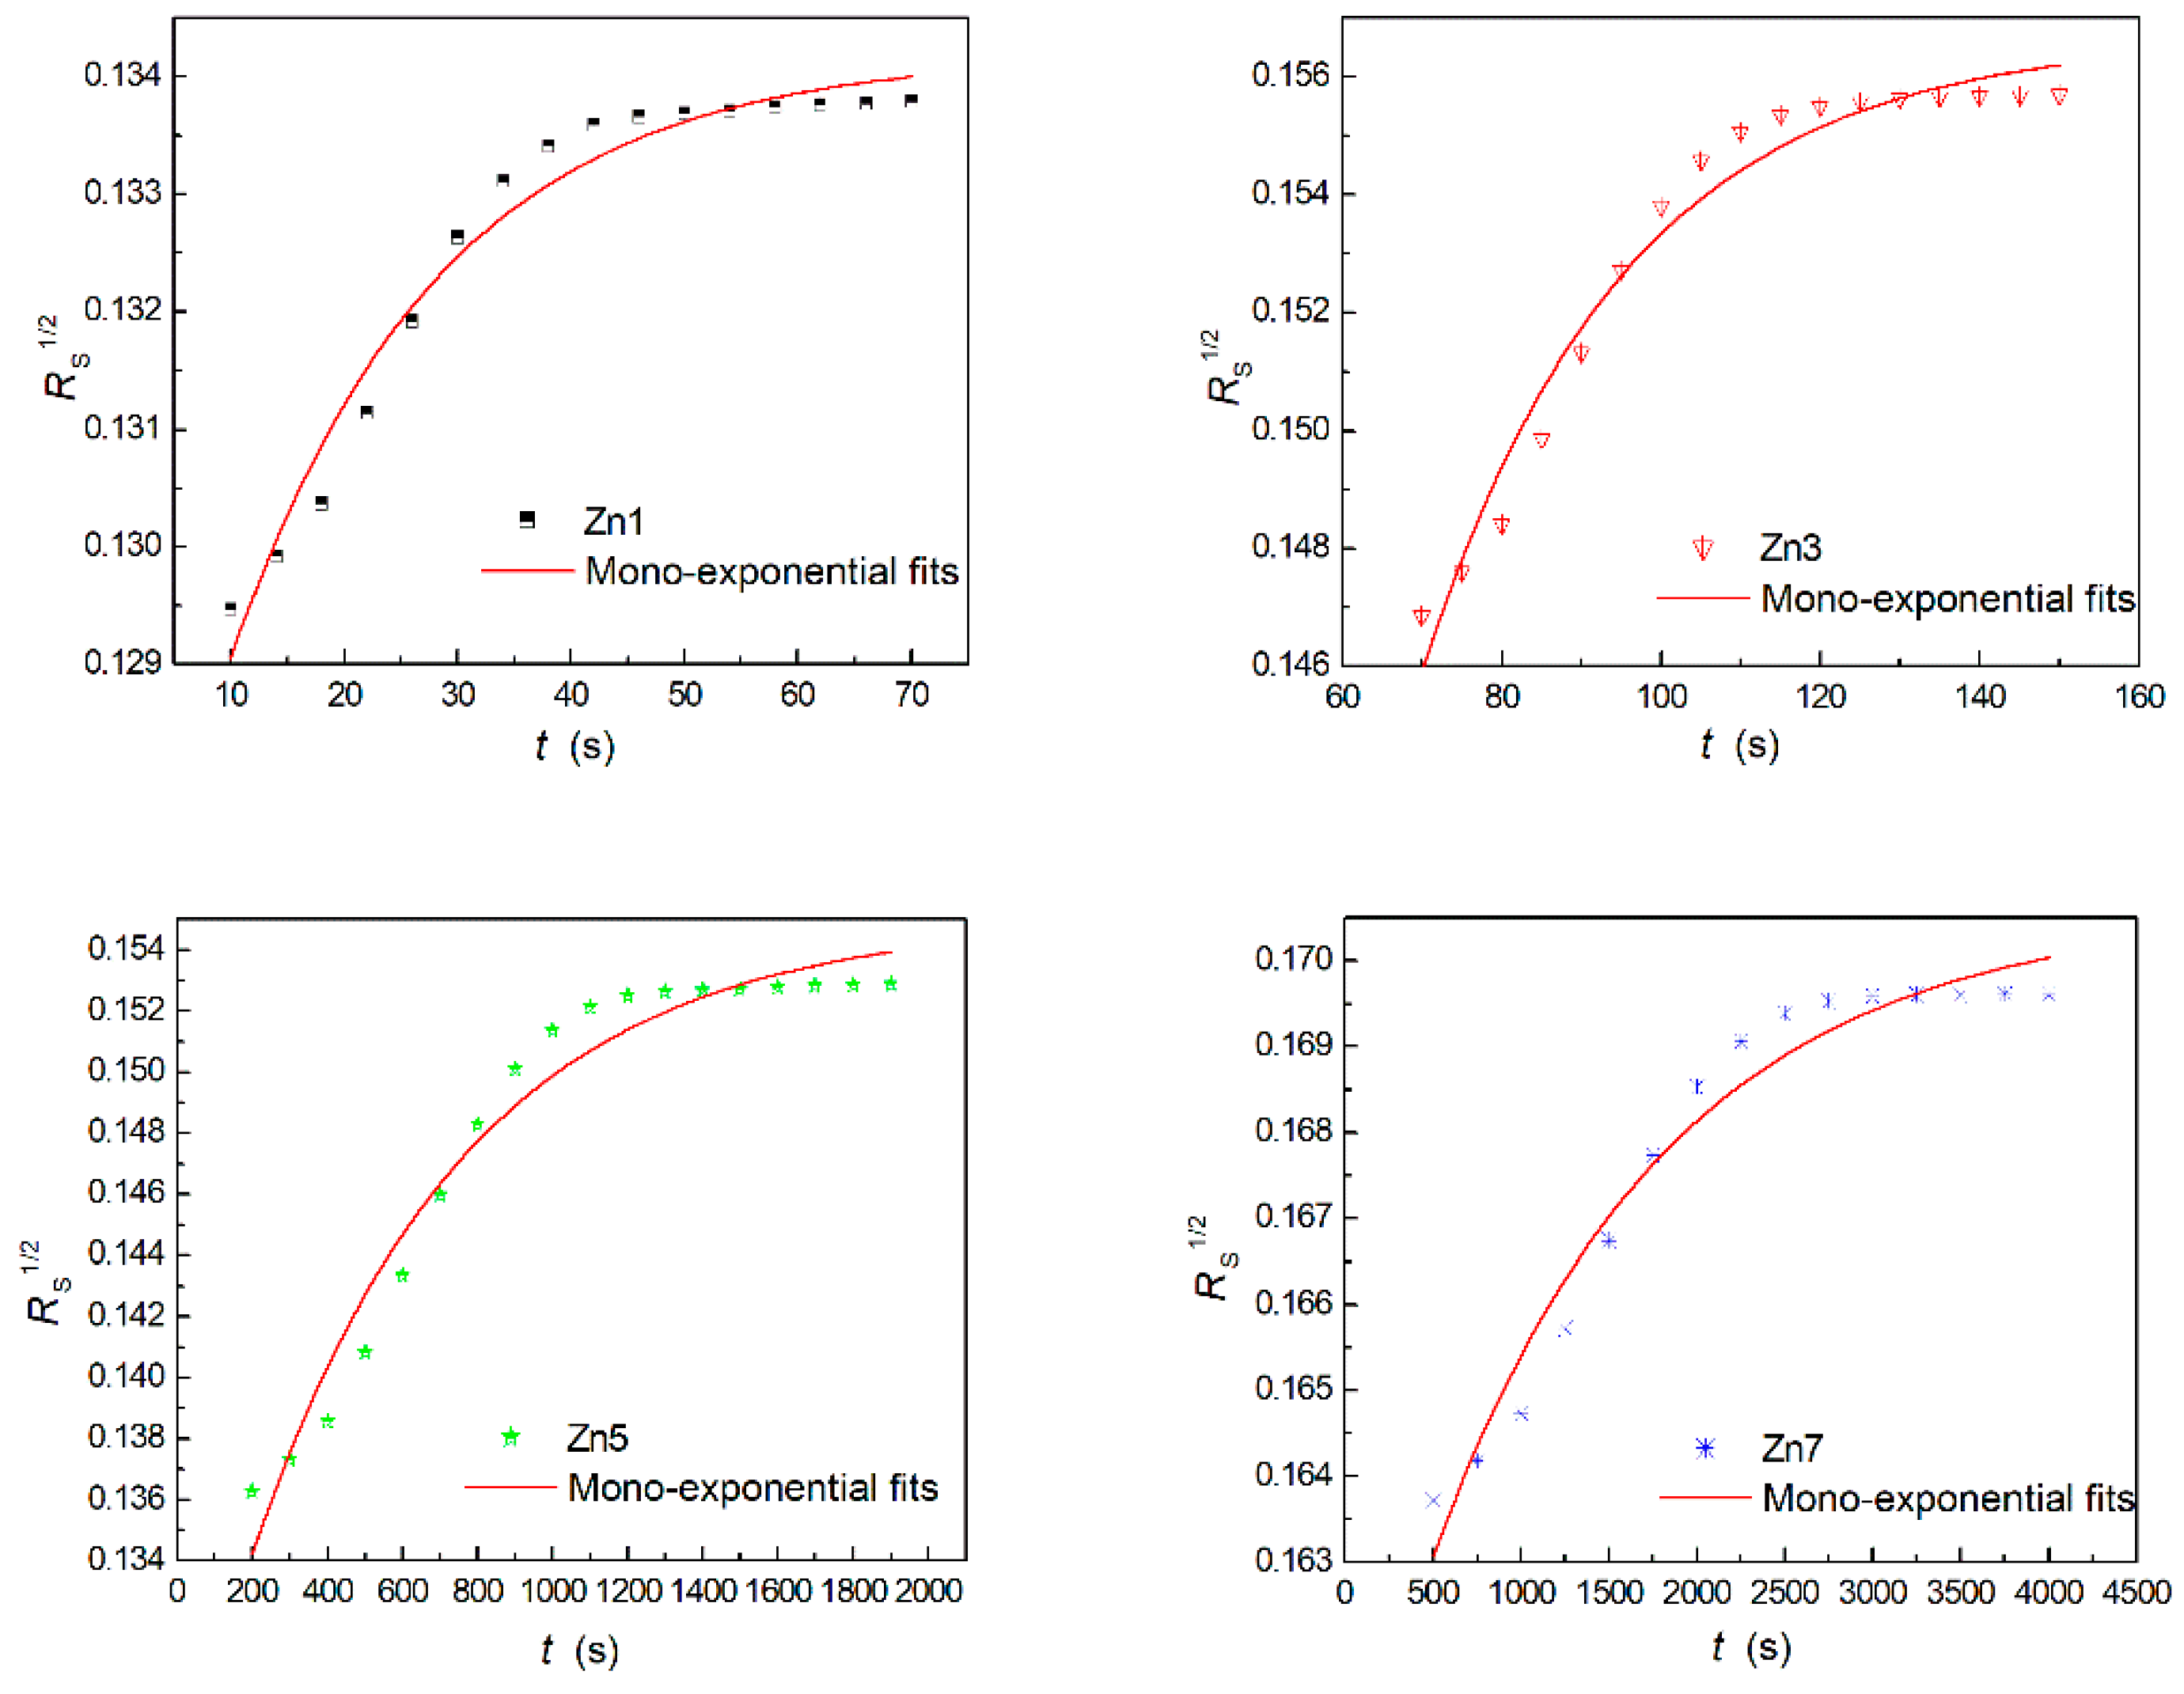
3.2. Light-Induced Scattering

The change curve in Figure 4 demonstrates a negative correlation between the transmitted light intensity and the duration of illumination. As the exposure time increases, there is an initial rapid decline in transmitted light intensity, followed by a gradual leveling off. The increase in Zn2+ doping concentration can be observed to significantly prolong the stabilization time for transmitted light intensity, particularly when the doping concentration reaches 7 mol%. At this level of doping, the time required for the curve slope to approach zero is extended by an order of magnitude. According to the analysis of the crystal scattering ratio in Figure 5, it can be observed that the square root of the crystal scattering ratio exhibits a positive correlation with exposure time and demonstrates a gradual and steady change following a significant increase as exposure time increases. To facilitate analysis, the calculated data for light-induced scattering of the Zn:Cu:Fe:LiNbO3 crystals are listed in Table 1.
According to the Li-site vacancy model, the intrinsic defects N b L i 4 + and V L i in LiNbO3 crystals serve as photorefractive sensitive centers, thereby compromising the resistance ability of light-induced scattering [38,39,40]. The enhanced resistance ability to light-induced scattering of Zn2+ ions is mainly formed into Z n L i + by substituting N b L i 4 + , which reduces V L i in order to maintain the charge balance. The non-radiative compound effect of the intrinsic defect on the electron is thus significantly attenuated, thereby enhancing the resistance ability to light-induced scattering.
With the increase in the Zn2+ ion concentration, N b L i 4 + is almost completely replaced, the exposure energy of sample Zn5 reaches 469.71 J/cm2, and the resistance ability of light-induced scattering was greatly improved. When the concentration of Zn2+ ions increases to 7 mol%, Zn2+ ions continue to occupy the normal Li position, and part of Fe3+ and Cu2+ ions are crowded out from the Li position to the Nb position. The defective structures of F e L i 2 + and C u L i + transform into F e N b 2 and C u N b 3 , which have weak electron trapping ability; the corresponding photoconductance in the crystal increases sharply, thereby significantly increasing the exposure energy. Due to the high concentration of Zn2+ ions within the crystal, self-compensating defect clusters of F e N b 2 C u N b 3 5 Z n L i + are formed within the crystal, thereby significantly enhancing the resistance ability to the light-induced scattering of Zn:Cu:Fe:LiNbO3 crystal. Sample Zn7 is the preferred material for mitigating the light-induced scattering effect, having an Er value of 786.55 J/cm2, which is approximately 416 times higher than that of Zn1.

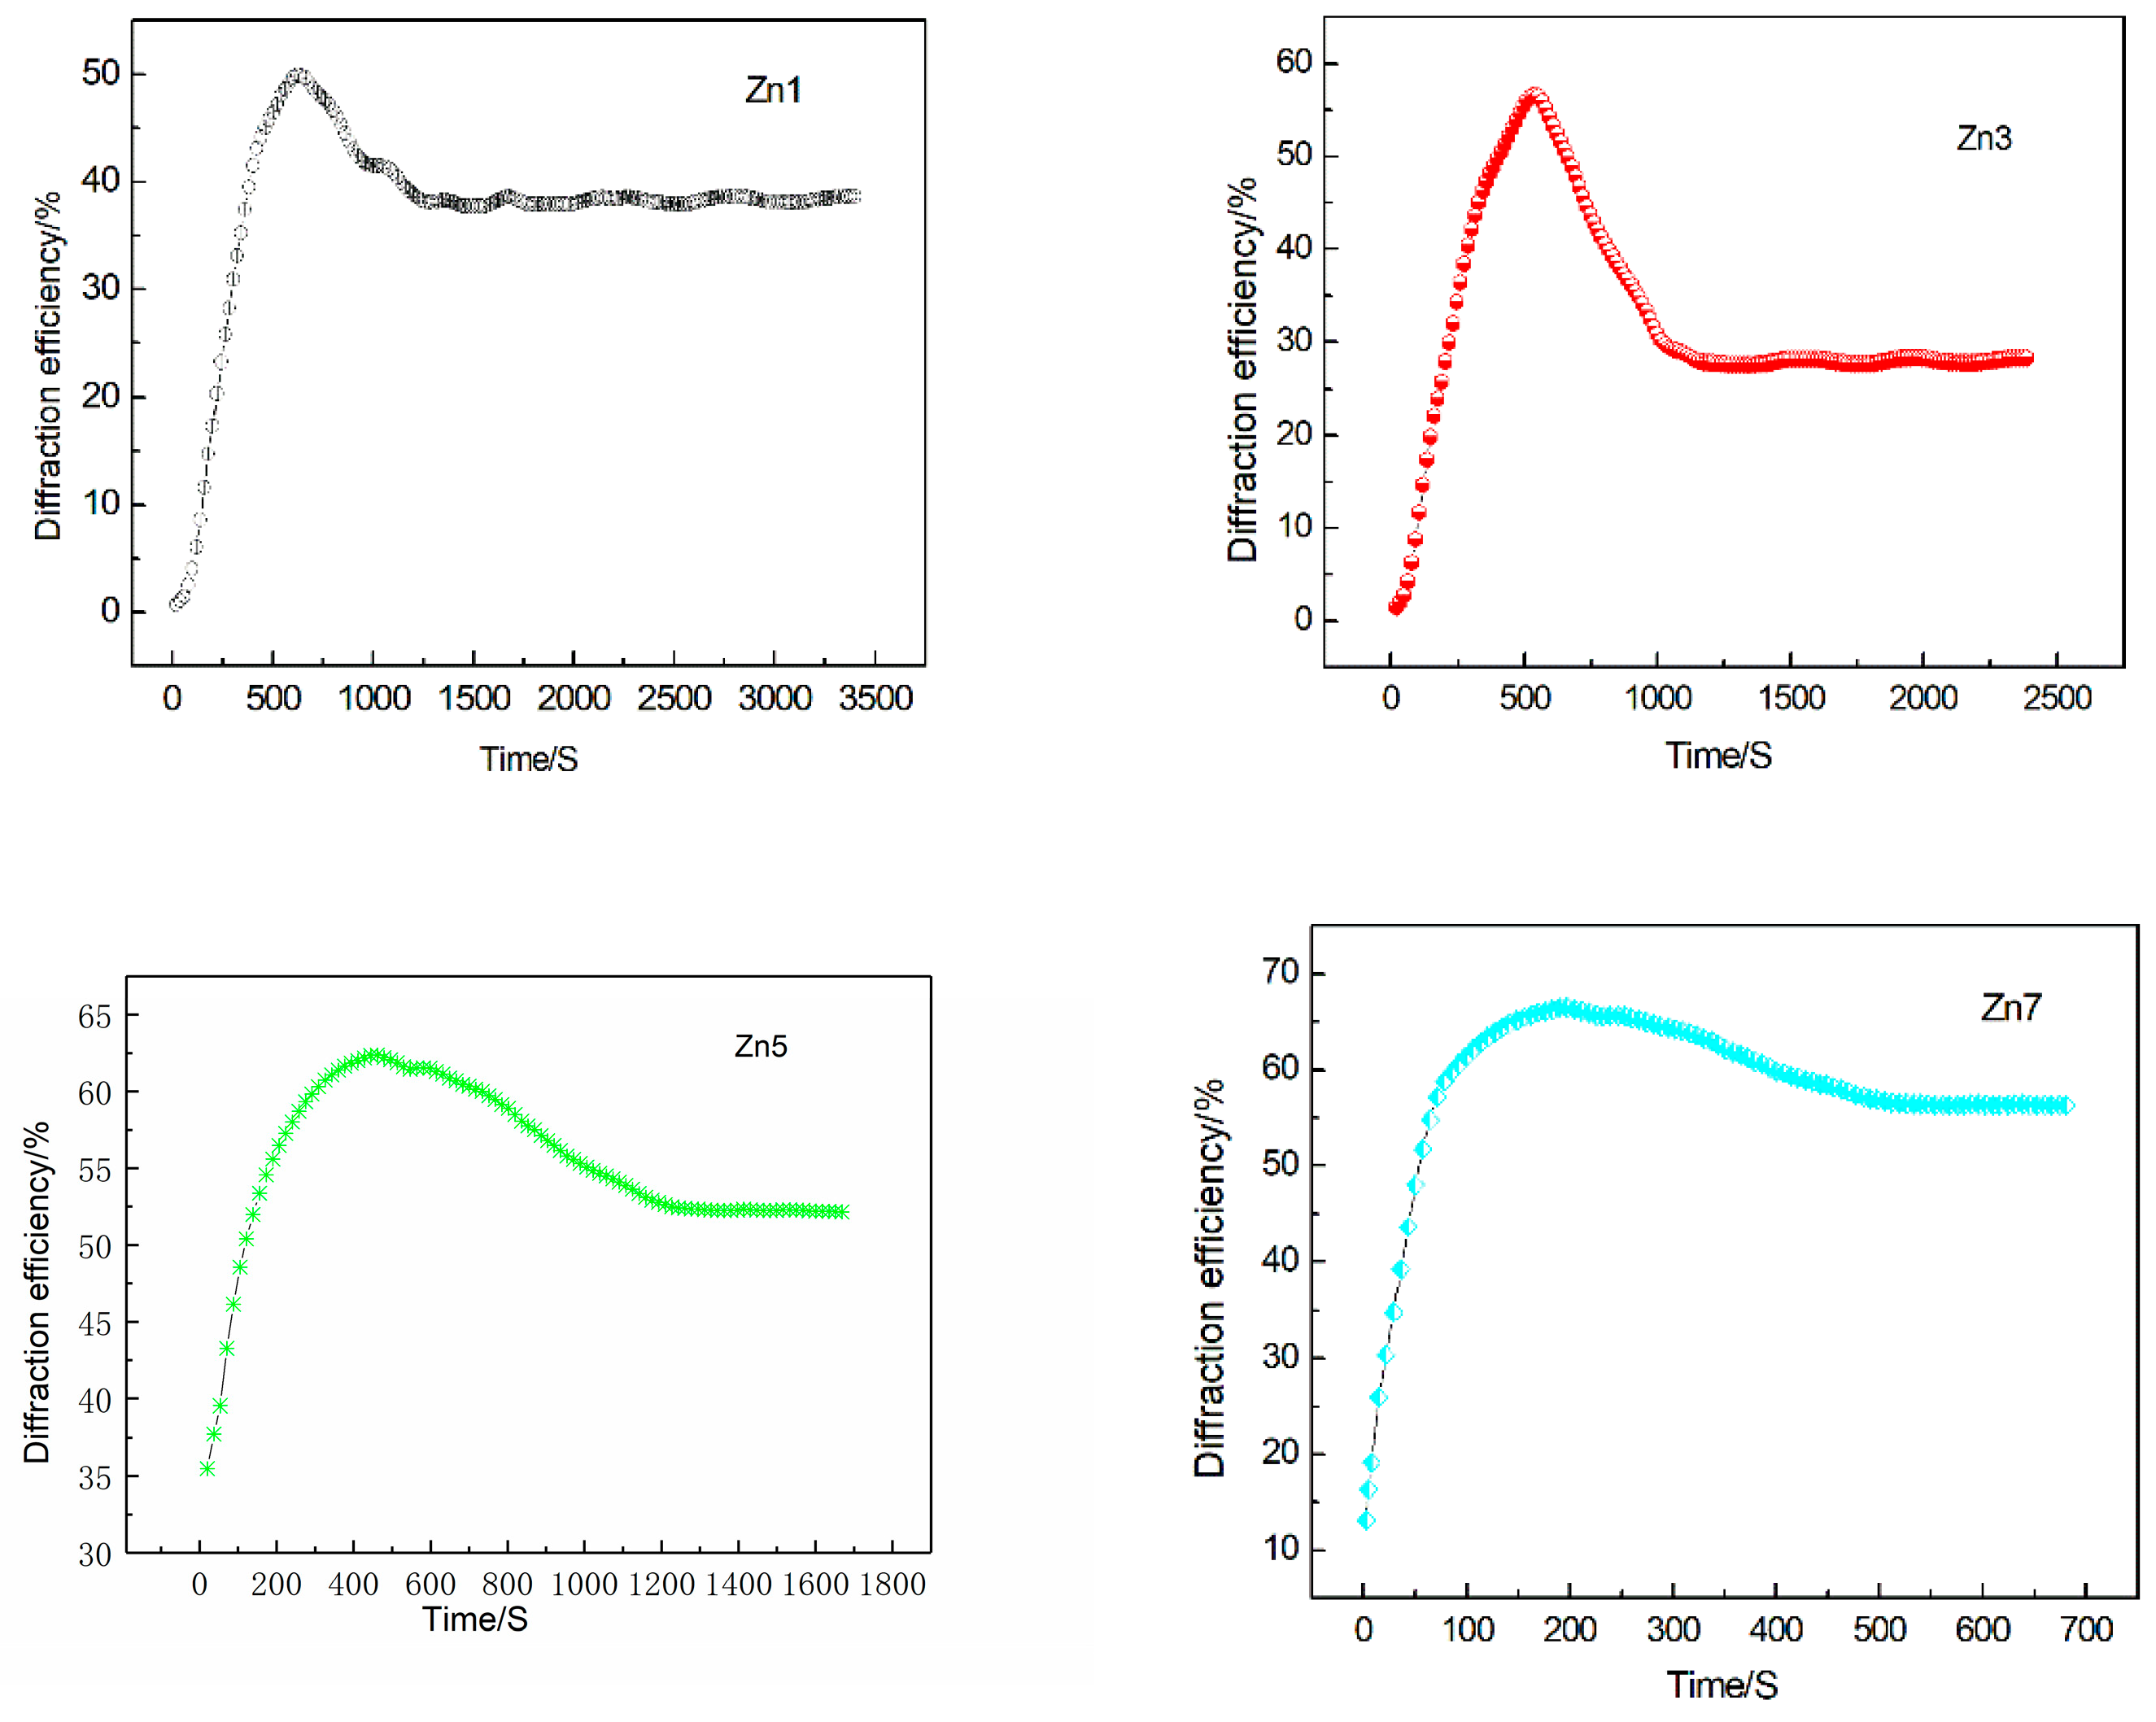
3.3. Two-Wavelength Coupling Experiment

In this experiment, variable-valence Fe3+ and Cu2+ ions were incorporated into the crystal lattice as photorefractive centers. Specifically, Fe2⁺ and Cu⁺ acted as donor levels, while Fe3+ and Cu2+ ions served as acceptor levels. These two ions play a crucial role as the sensitive centers for photorefraction and significantly influence the photorefractive properties of the crystal, thereby having a substantial impact on its holographic storage performance.
The Zn2+ ion remains in a stable univalent state within the crystal, thereby abstaining from participating in both the charge transport and grating formation processes. The carrier transport model of Zn:Cu:Fe:LiNbO3 crystal is illustrated in Figure 6, where the conduction band edge is represented by the 4d orbital of the Nb5+ ion, and the valence band edge is represented by the 2p orbital of the O2− ion. The iron exists as Fe3+ and Fe2+ ions, serving as shallow central levels, while the copper exists as Cu2+ and Cu+ ions, acting as deep central levels. The deep-level carriers of the Cu+ and Fe2+ ions are excited through energy absorption under illumination conditions, thereby complementing each other by facilitating energy transfer and modifying the ionization cross-section as well as capturing the cross-section. The enhancement in the photorefractive properties can be attributed to the utilization of double photorefractive ions in LiNbO3 crystals. The Fe3+ and Cu2+ ions undergo electron acquisition to form Fe2+ and Cu+ ions, thereby initiating a continuous release of electrons. Subsequently, these released electrons are captured by migrating Fe3+ and Cu2+ ions, thus completing the transportation process.
The process can be represented as follows:
Fe2+ + hv → Fe3+ + e
Fe3+ + e → Fe2+
Cu+ + hv → Cu2+ + e
Cu2+ + e → Cu+
The presence of doped Zn2+ ions directly influences the occupancy of ions and the types of defects in Zn:Cu:Fe:LiNbO3 crystals, subsequently leading to changes in their internal structure and defect type, which in turn affect the photoconductivity of the crystal and consequently its photorefractive effect.
Figure 7 illustrates the readout curves of the nonvolatile two-wavelength holographic recording. Table 2 presents the holographic storage parameters of Zn:Cu:Fe:LiNbO3 crystals, which were determined through a two-wavelength coupling experiment. It is evident that the diffraction efficiency of the crystal exhibits a gradual increase as the concentration of Zn2+ ions rises.
When the doping concentration of Zn2+ ions is below 7 mol%, they preferentially replace the N b L i 4 + in the lattice, which reduces the intrinsic defect concentration and then increases the crystal conductivity. The writing time τw can be expressed as follows [41]:
τ w ε ε 0 4 π σ p h
where ε represents the dielectric constant; its specific value is 2.8 × 10⁻¹¹ and does not change due to doping ions. ε0 is the dielectric constant in free space, and its specific value is 8.9 × 10⁻¹².
The writing time τw exhibits a negative correlation with the photoconductance σph. As the concentration of Zn2+ ions increases, the defect concentration of N b L i 4 + decreases, thereby enhancing the photoconductivity σph of the crystal and reducing the writing time τw. Consequently, this promotes the photorefractive effect of the crystal. The complete replacement of N b L i 4 + by Zn2+ ions occurs when the concentration of Zn2+ ions reaches 7 mol %. The Zn2+ ions begin to occupy the regular Li site and form a new defect group, denoted as Z n L i + . Consequently, there is continuous decreases in the concentrations of N b L i 4 + and V L i , while the photoconductance σph exhibits a consistent increase. As a result, the writing time τw continues to decrease.
The infrared absorption spectra results indicate that when the concentration of Zn2+ ions increases to 7 mol%, Fe3+ and Cu2+ ions start to occupy the Nb sites in the normal lattice, thereby forming defect structures F e N b 2 and C u N b 3 . In contrast, Zn2+ ions solely occupy the Li sites, leading to the formation of the defect structure Z n L i + . The same result was also observed in the light-induced scattering experiment. When the concentration of Zn2+ ions was increased to 7 mol%, self-compensating defect clusters of F e N b 2 C u N b 3 5 Z n L i + were formed, leading to a significant enhancement in the photoconductance and ultimately resulting in a higher exposure energy. This suggests that elevating the concentration of Zn2+ ions facilitates the incorporation of Fe3+ and Cu2+ ions into the lattice structure. Consequently, as the concentration of Zn2+ ions increases, the concentrations of Fe3+ and Cu2+ ions acting as photorefractive centers also rise, thereby enhancing the saturation diffraction efficiency ηs.
The saturation diffraction efficiency ηs of the Zn:Cu:Fe:LiNbO3 crystal can be achieved more rapidly with an increasing influx of Fe3+/2+ and Cu2+/+ ions into the lattice, thereby minimizing the time required for reaching ηs when the concentration of Zn2+ ions reaches 7 mol%. The dynamic range M/# and sensitivity S of the crystal are directly proportional to the saturation diffraction rate ηs and inversely proportional to the writing time τw; thus, enhancing the concentration of doped ions can optimize both the dynamic range M/# and sensitivity S. The saturation refractive index modulation Δns is proportional to the concentration of the electron acceptor. The concentrations of Fe3+ and Cu2+ ions into the crystal gradually increase, the cross-section of the captured electrons becomes larger with the increase in the concentration of electron acceptors, and the saturation refractive index modulation Δns gradually increases. The photoconductivity σph is positively correlated with the concentration of Zn2+ ions, so the photoconductivity σph also steadily increases.
The results revealed a significant enhancement in the holographic storage parameters with increasing Zn2+ ion doping concentration. Notably, the writing time constant (τw) for sample Zn7 decreased to 196.4 s, a substantial reduction compared to the 603.9 s observed for sample Zn1. Furthermore, sample Zn7 exhibited a maximum sensitivity (S) of 1.04, approximately four times higher than that of sample Zn1 (0.29). The dynamic range (M/#) of sample Zn7 also increased significantly, reaching 9.81, which was markedly higher than the 0.92 recorded for sample Zn1. Additionally, the saturation diffraction efficiency (ηs) of Zn7 reached 66.7%, representing a 16.5% improvement over the 50.2% achieved by Zn1. In summary, the holographic storage performance of the crystal improved significantly with higher Zn2+ ion doping concentrations. Specifically, when the Zn2+ ion doping concentration reached 7 mol%, the Zn:Cu:Fe:LiNbO3 crystal demonstrated exceptional holographic storage performance, making it a highly promising material for such applications.

4. Conclusions

In summary, the Czochralski method was employed to grow Cu:Fe:LiNbO3 crystals doped with varying concentrations of Zn2+ ions. Infrared spectroscopy revealed that when the Zn2+ ion doping concentration reached 7 mol%, Fe3+ and Cu2+ ions occupied Nb sites in the lattice, leading to the formation of defect structures F e N b 2 and C u N b 3 . The incorporation of Zn2+ ions significantly enhanced the exposure energy of the crystals. Notably, sample Zn7 emerged as the optimal material for mitigating light-induced scattering effects, exhibiting an Er value of 786.55 J/cm2, approximately 416 times higher than that of Zn1. The two-wavelength coupling experiments demonstrated that the holographic storage properties improved with increasing Zn2+ ion concentration. Among the tested samples, Zn7 exhibited the shortest response time (196.4 s) and the highest values for key performance metrics: a dynamic range (M/#) of 9.81, a saturation diffraction efficiency (ηs) of 66.7%, and a sensitivity (S) of 1.04. These parameters are critical for advancing volume holographic data storage technologies. Overall, these findings underscore the potential of Zn:Cu:Fe:LiNbO3 crystal, particularly at a Zn2+ ion doping concentration of 7 mol%, as a high-performance material for holographic storage applications. These advancements could pave the way for more efficient, reliable, and high-capacity holographic storage systems, addressing the growing demand for advanced data storage solutions in the era of big data and beyond.

Author Contributions

Conceptualization, Z.Y. and L.D.; methodology, L.D.; software, S.Y.; validation, Z.Y., Z.J. and L.D.; formal analysis, Z.Y.; investigation, Z.Y.; resources, Z.Y.; data curation, Z.Y.; writing—original draft preparation, Z.Y.; writing—review and editing, Z.Y.; visualization, Z.Y.; supervision, L.D. and L.W.; project administration, L.D. All authors have read and agreed to the published version of the manuscript.

Funding

This work was supported by the Open Project Funds for the Key Laboratory of Space Photoelectric Detection and Perception (Nanjing University of Aeronautics and Astronautics) under grant number NJ2020021-9; the Natural Science Fund of Heilongjiang Province of China under grant number LH2020E085; and Opening Project of State Key Laboratory of Crystal Material (Shandong University) under grant number KF1906.

Institutional Review Board Statement

Not applicable.

Informed Consent Statement

Not applicable.

Data Availability Statement

Correspondence and requests for materials should be addressed to Zhehua Yan and Li Dai. The data that support the findings of this study are available upon reasonable request from the authors.

Conflicts of Interest

The authors declare no conflicts of interest.

References

  1. Xu, L.; Chen, G. Optimization of blue photorefractive properties and exponential gain of photorefraction in Sc-doped Ru:Fe:LiNbO3 crystals. Crystals 2022, 12, 1059. [Google Scholar] [CrossRef]
  2. Heanue, J.F.; Bashaw, M.C.; Hesselink, L. Volume holographic storage and retrieval of digital data. Science 1994, 265, 749–752. [Google Scholar] [CrossRef]
  3. Adibi, A.; Buse, K.; Psaltis, D. Theoretical analysis of two-step holographic recording with high-intensity pulses. Phys. Rev. A 2001, 63, 023813. [Google Scholar] [CrossRef]
  4. McMillen, D.K.; Hudson, T.D.; Wagner, J.; Singleton, J. Holographic recording in specially doped lithium niobate crystals. Opt. Express 1998, 2, 491–502. [Google Scholar] [CrossRef]
  5. Buse, K.; Jermann, F.; Krätzig, E. Infrared holographic recording in LiNbO3:Fe and LiNbO3:Cu. In European Materials Research Society Symposia Proceedings; Elsevier: Amsterdam, The Netherlands, 1995; Volume 48, pp. 237–240. [Google Scholar]
  6. Yang, Y.; Adibi, A.; Berben, D.; Buse, K.; Psaltis, D. The role of Mn in photorefractive LiNbO3. In Photorefractive Effects, Materials and Devices, Proceedings; Optica Publishing Group: Delavan, WI, USA, 2001; Volume 62, pp. 101–106. [Google Scholar]
  7. Hatano, H.H.; Yamaji, T.Y.; Tanaka, S.T.; Furukawa, Y.F.; Kitamura, K.K. Investigation of the oxidation state of Fe in stoichiometric Fe:LiNbO3 for digital holographic recording. Jpn. J. Appl. Phys. 1999, 38, 1820. [Google Scholar] [CrossRef]
  8. Wan, Y.; Tao, S.; Wang, D.; Yuan, W.; Liu, G.; Ding, X.; Jiang, Z.; Liu, C. Holographic disk data storage at a high areal density of 33.7 bits/µm2. Proc. SPIE—Int. Soc. Opt. Eng. 2003, 5069, 294–299. [Google Scholar]
  9. Liao, Y.; Guo, Y.; Cao, L.; Ma, X.; He, Q.; Jin, G. Experiment on parallel correlated recognition of 2030 human faces based on speckle modulation. Opt. Express 2004, 12, 4047–4052. [Google Scholar] [CrossRef]
  10. Sebasti&án-Vicente, C.; Zamboni, R.; Garc&ía-Cabañes, A.; Carrascosa, M. Photovoltaic Charge Lithography on Passive Dielectric Substrates Using Fe:LiNbO3 Stamps. Adv. Electron. Mater. 2025, 11, 2400327. [Google Scholar]
  11. Li, X.; Qu, D.; Wang, W.; Zhao, X.; Zhang, L.; Meng, X. Improved nonvolatile holographic storage sensitivity of near-stoichiometric LiNbO3:Fe:Mn crystals. Chin. Opt. Lett. 2012, 10, 56–59. [Google Scholar]
  12. Fu, Y. Research on Optical Holographic Storage Properties in In:Fe:Cu:LiNbO3 Crystals. Semicond. Optoelectron. 2012, 33, 83–86. [Google Scholar]
  13. Shen, Y.; Zhang, G.Q.; Yu, W.B.; Guo, Z.Z.; Zhao, Y.Q. Theoretical Studies On Nonvolatile Holographic Recording for LiNbO3:Cu:Ce Crystal. Opt. Laser Eng. 2014, 54, 73–78. [Google Scholar] [CrossRef]
  14. Sun, T.; Dai, L.; Xu, C.; Qian, Z.; Li, D.; Lin, J.; Wang, R.; Xu, Y. Enhancement of nonvolatile holographic storage properties in In:Ce:Mn:LiNbO3 Crystal by [Li]/[Nb] Ratios. J. Mol. Struct. 2013, 1053, 1–4. [Google Scholar] [CrossRef]
  15. Badalyan, A.; Hovsepyan, R.; Mantashyan, P.; Mekhitaryan, V.; Drampyan, R. Nondestructive Readout of Holograms Recorded by Bessel Beam Technique in LiNbO3:Fe and LiNbO3:Fe:Cu Crystals. Eur. Phys. J. D 2014, 68, 82. [Google Scholar] [CrossRef]
  16. Li, X.; Xu, D.; Geng, A.; Chen, X.; Li, B.; Jiang, Z.; Liu, S. Oscillation of nonvolatile holographic recording in LiNbO3:Fe:Cu crystals. Optik 2013, 124, 4397–4399. [Google Scholar] [CrossRef]
  17. Pankratov, V.; Millers, D.; Grigorjeva, L.; Matkovskii, A.O.; Potera, P.; Pracka, I.; Łukasiewicz, T. The role of Fe and Cu dopants in electron–hole trapping and relaxation process in congruent LiNbO3. Opt. Mater. 2003, 22, 257–262. [Google Scholar] [CrossRef]
  18. Sun, X.; Luo, S.; Wang, J.; Jiang, Y.; Shi, H. Improvement of blue photorefractive properties in In-doped LiNbO3:Fe:Cu crystals. J. Phys. D Appl. Phys. 2009, 42, 115413. [Google Scholar] [CrossRef]
  19. Zhang, X.; Liang, G.; Xu, Z. Defect structure and holographic storage properties of LiNbO3:Zr:Fe:Cu crystals with various Li/Nb ratios. Opt. Mater. 2019, 96, 109318. [Google Scholar] [CrossRef]
  20. Dai, L.; Wang, H.; Lai, N.; Zhang, L. Effect of [Li]/[Nb] ratios on doping concentration and defect structure of Mg:Fe:Cu:LiNbO3 crystals. Mod. Phys. Lett. B 2023, 37, 2350164. [Google Scholar] [CrossRef]
  21. Dai, L.; Han, X.; Shao, Y.; Liu, C.; Wang, L. Hf4+ Ion Concentration Dependence of Holographic Storage Properties in Hf:Fe:Cu:LiNbO3 Crystals. Cryst. Res. Technol. 2019, 54, 1800193. [Google Scholar] [CrossRef]
  22. Dai, L.; Han, X.; Shao, Y.; Wang, L.; Liu, C.; Xu, Y. Spectra (UV-Visible, IR transmission) of Sc3+, Fe3+ and Cu2+ tri-doped LiNbO3 crystals with various [Li]/[Nb] ratios. Mod. Phys. Lett. B 2018, 32, 1850328. [Google Scholar] [CrossRef]
  23. Qian, Y.; Wang, R.; Xing, L.; Xu, Y.; Yang, C.; Liu, X. Influence of Zn2+ ions concentration on the optical properties of Zn/Er:LiNbO3 crystals. Cryst. Res. Technol. 2011, 46, 1137–1142. [Google Scholar] [CrossRef]
  24. Zheng, W.; Zhang, N.; Zhao, L.; Xu, Y. Growth and photorefractive properties of near-stoichiometric Zn:Fe:LiNbO3 crystal. Mater. Chem. Phys. 2004, 84, 7–9. [Google Scholar] [CrossRef]
  25. Sidorov, N.V.; Teplyakova, N.A.; Bobreva, L.A.; Palatnikov, M.N. Optical properties and defects of double doped crystals LiNbO3:Mg (5.05):Fe (0.009) and LiNbO3:Zn (4.34):Fe (0.02)(mol%). J. Struct. Chem. 2019, 60, 1765–1772. [Google Scholar] [CrossRef]
  26. Herreros, B.; Lifante, G. LiNbO3 optical waveguides by Zn diffusion from vapor phase. Appl. Phys. Lett. 1995, 66, 1449–1451. [Google Scholar] [CrossRef]
  27. Yan, Z.; Dai, L.; Yang, S.; Ji, Z. Influence of the Zn2+ concentration on the defect structure and optical properties in Zn:Fe:Cu:LiNbO3 crystals. AIP Adv. 2025, 15, 015121. [Google Scholar] [CrossRef]
  28. Hong, T.; Yin, J.Y.; Nie, S.P.; Xie, M.Y. Applications of infrared spectroscopy in polysaccharide structural analysis: Progress, challenge and perspective. Food Chem. X 2021, 12, 100168. [Google Scholar] [CrossRef]
  29. Smith, R.G.; Fraser, D.B.; Denton, R.T.; Rich, T.C. Correlation of Reduction in Optically Induced Refractive-Index Inhomogeneity with OH Content in LiTaO3 and LiNbO3. J. Appl. Phys. 1968, 39, 4600–4602. [Google Scholar] [CrossRef]
  30. Xu, C.; Yang, C.; Dai, L.; Sun, L.; Xu, Y.; Cao, L. Influence of Li and Nb ratios on the defect structure and exposure energy in LiNbO3:Fe:Mn:Zr crystals. J. Alloys Comp. 2011, 509, 4167–4170. [Google Scholar] [CrossRef]
  31. Xu, C.; Yang, C.; Zhu, C.; Sun, T.; Wang, R.; Xu, Y. Improved nonvolatile holographic storage properties in Zr:Ru:Fe:LiNbO3 crystal by blue light recording. Mater. Lett. 2012, 67, 320–322. [Google Scholar] [CrossRef]
  32. Rahman, M.R.; Riscob, B.; Bhatt, R.; Bhaumik, I.; Ganesamoorthy, S.; Vijayan, N.; Bhagavannarayana, G.; Karnal, A.K.; Nair, L. Investigations on crystalline perfection, Raman spectra and optical characteristics of transition metal (Ru) co-doped Mg:LiNbO3 single crystals. ACS Omega 2021, 6, 10807–10815. [Google Scholar] [CrossRef]
  33. Kang, B. Measurement of space-charge field in doped LiNbO3 single crystals. J. Electroceram. 2013, 30, 2–5. [Google Scholar] [CrossRef]
  34. Bienvenu, M.P.; Woodbury, D.; Rabson, T.A. Hologram decay in LiNbO3:Fe with a time varying conductivity. J. Appl. Phys. 1980, 51, 4245–4247. [Google Scholar] [CrossRef]
  35. Liu, F.; Kong, Y.; Ge, X.; Liu, H.; Liu, S.; Chen, S.; Xu, J. Improved sensitivity of nonvolatile holographic storage in triply doped LiNbO3:Zr,Cu,Ce. Opt. Express 2010, 18, 6333–6339. [Google Scholar] [CrossRef]
  36. Zhou, Z.; Wang, B.; Lin, S.; Li, Y.; Wang, K. Defect structure and nonvolatile hologram storage properties in Hf:Fe:Mn:LiNbO3 crystals. Optik 2011, 122, 1179–1182. [Google Scholar] [CrossRef]
  37. Tokko, O.V.; Kadetova, A.V.; Prusskii, A.I.; Smirnov, M.V.; Palatnikov, M.N.; Sidorov, N.V. Structure and Luminescent Properties of Double-Doped LiNbO3:Zn:Mg Crystals. Phys. Status Solidi A 2024, 221, 2300796. [Google Scholar] [CrossRef]
  38. Liu, J.; Zhang, W.; Zhang, G. Defect chemistry analysis of the defect structure in Mg-doped LiNbO3 crystals. Phys. Stat. Sol. A 1996, 156, 285–291. [Google Scholar] [CrossRef]
  39. Li, Y.Y.; Chen, H.L.; Chen, G.J.; Kuo, C.L.; Hsieh, P.H.; Hwang, W.S. Investigation of the defect structure of congruent and Fe-doped LiNbO3 powders synthesized by the combustion method. Materials 2017, 10, 380. [Google Scholar] [CrossRef]
  40. Xu, L.; Xu, Y.; Chen, G. Defect structure and upconversion luminescence properties of LiNbO3 highly doped congruent In:Yb:Ho:LiNbO3 crystals. Crystals 2022, 12, 710. [Google Scholar] [CrossRef]
  41. Valley, G.C.; Klein, M.B. Optimal properties of photorefractive materials for optical data processing. Proc. SPIE Int. Soc. Optic. Eng. 1983, 22, 704–711. [Google Scholar] [CrossRef]
Figure 1. Experimental setup of light-induced scattering measurement.
Applsci 15 04129 g001
Figure 2. Nonvolatile two-wavelength experiment device.
Applsci 15 04129 g002
Figure 3. Infrared transmittance spectra of Zn:Cu:Fe:LiNbO3 crystals.
Applsci 15 04129 g003
Figure 4. Exposure time dependence on the transmitted intensity of Zn:Cu:Fe:LiNbO3 crystals.
Applsci 15 04129 g004
Figure 5. Exposure time dependence of square root of the scattering ratio of Zn:Cu:Fe:LiNbO3 crystals.
Applsci 15 04129 g005
Figure 6. The model of carrier transport in double photorefractive centers.
Applsci 15 04129 g006
Figure 7. Time dependence of diffraction efficiency during two-wavelength holographic recording for samples.
Applsci 15 04129 g007
Table 1. Light-induced scattering parameters of Zn:Cu:Fe:LiNbO3 crystals, illumination light intensity (I), effective incident intensity (Ieff), exposure time (τ), and total exposure energy (Er).
Crystalst (s)I (mW/cm2)Ieff (mW/cm2)Er (J/cm2)
Zn122.8496.7682.71.89
Zn3498.06670.41573285.37
Zn5785.37699.78598.1469.71
Zn7931.69987.71844.2786.55
Table 2. Experiment results of holographic storage properties of Zn:Cu:Fe:LiNbO3 crystal.
Sampleτw (s)τe (s)ηs (%)S (cm/J)M/#Δns (×10−5)σph (×10−12 cm/ΩW)
Zn1603.9782.450.20.290.924.600.41
Zn3528.11108.657.30.361.594.920.47
Zn5483.51390.962.80.412.285.150.51
Zn7196.42358.266.71.049.815.301.26
Disclaimer/Publisher’s Note: The statements, opinions and data contained in all publications are solely those of the individual author(s) and contributor(s) and not of MDPI and/or the editor(s). MDPI and/or the editor(s) disclaim responsibility for any injury to people or property resulting from any ideas, methods, instructions or products referred to in the content.

