Article

A Methodology for Situation Assessing of Space-Based Information Networks

1
School of Computer Science and Engineering, Northeastern University, Shenyang 110169, China
2
Neusoft Research, Shenyang 110179, China
3
CS&S Information System Engineering Co., Ltd., Beijing 102200, China
*
Authors to whom correspondence should be addressed.
Appl. Sci. 2025, 15(8), 4127; https://doi.org/10.3390/app15084127
Submission received: 6 March 2025 / Revised: 3 April 2025 / Accepted: 7 April 2025 / Published: 9 April 2025

Abstract

:

Featured Application

This paper proposes a cloud-edge collaboration method to assess the operational situation of space-based information networks. This method can improve the assessment accuracy rate and achieves better performance on average completion time.

Abstract

This paper proposes a cloud-edge collaborative method for operational situation assessment to ensure the efficient and reliable operation of space-based information networks. By analyzing time-varying network topology characteristics, we establish a 14-dimensional assessment factor system that can characterize the operational situation of space-based information networks. Considering the resource constraints of satellites, traditional on-orbit assessment methods often lead to high latency and excessive resource consumption. A cloud-edge collaborative situation assessment method is introduced to enhance assessment efficiency. The proposed method first applies principal component analysis for dimensionality reduction, followed by pre-labeling situational factor data using an improved K-means clustering algorithm. The on-orbit assessment of individual satellites is then performed using a particle swarm optimization-support vector machine algorithm. Finally, a fusion assessment of the space-based information networks is conducted at the ground cloud center, incorporating situation weighting factors. Experimental results demonstrate that the proposed cloud-edge collaborative method improves assessment accuracy by 13% compared to baseline methods, significantly reduces average completion time, and maintains stable performance in large-scale satellite constellations.

1. Introduction

In recent years, space-based information networks (SINs) have increasingly become prevalent in global communication systems due to their extensive coverage, low latency, high reliability, and strong resistance to electromagnetic interference [1,2,3]. At the same time, advancements in satellite communication technology have significantly propelled the deployment of Low Earth Orbit (LEO) satellite constellations, such as OneWeb, Kuiper, and Starlink, which currently lead the industry in operational scale [4,5]. These LEO constellations serve ground users (GUs) via inter-satellite and satellite-terrestrial links.
Assessing the operational situation of the SIN helps determine whether LEO constellations function as intended and meet design requirements.
Unlike terrestrial networks, SIN situational assessment faces numerous challenges due to limited resources, dynamic changes in network topology, and resource heterogeneity [6,7,8]:
(1) Satellite topology is highly dynamic, and SIN resources are constrained.
(2) There is a lack of characteristic factors to effectively characterize the operational situation of SIN.
(3) The efficiency of situational assessment for large-scale constellations remains poor.
This paper proposes a cloud-edge collaborative situational assessment method to overcome the above shortcomings. This method performs on-orbit assessments on individual satellites and conducts SIN fusion assessments at the ground cloud center. This approach can save system resources and network bandwidth, improve assessment accuracy, and reduce assessment time.
The main contributions of this paper are as follows:
(1) We propose an assessment model for individual satellite operational situations and develop a 14-dimensional situational assessment factor system based on the time-varying characteristics of SIN topology. Then, through principal component analysis (PCA), we identify the main influencing factors and construct a single-satellite assessment model using an improved K-means clustering algorithm and particle swarm optimization-support vector machine (PSO-SVM).
(2) We introduce a cloud-edge collaborative method to address the timeliness challenges of large-scale LEO constellation situational assessments. On-orbit assessment results from individual satellites are transmitted to the ground cloud center via the satellite-terrestrial link for fusion assessment. This method significantly reduces assessment latency while optimizing resource utilization.
(3) We completed the simulation and results analysis. The results show that the proposed method has better performance in terms of average completion time and assessment accuracy rate.
The rest of the paper is organized as follows: Section 2 summarizes the related work. Section 3 describes the system architecture and assessment factors. In Section 4, we introduce the assessment method based on cloud-edge collaboration. Section 5 presents the experimental setup and results analysis, and Section 6 concludes the entire work.

2. Related Work

Situational assessment plays an essential role in SIN. Some scholars have conducted research in this field. In [9], a system situational assessment and prediction model based on a fuzzy neural network is proposed to address the issue of low accuracy in communication effectiveness perception within satellite communication systems. The collected factors are submitted to the network system operation automation center through data cleansing and comprehensive analysis, enabling the monitoring and evaluation of the network system’s operation, tasks, station equipment, and system situation prediction. S. Lei et al. [10] study a collocation situation analysis model. Based on this model, they propose a pre-control method to analyze the situation of BeiDou GEO satellites, which minimizes the impact of orbit maintenance control on collocation constraint conditions. G.zhenwu et al. [11] propose a power grid operation situational assessment model based on fuzzy hierarchical analysis and the LSTM-attention mechanism. The accuracy and effectiveness of the model are validated through simulation cases. Han et al. [12] design a mapping relationship between neural network layers and explore the affiliation relationships among indicators at each level, as well as the association relationships between indicators. Based on these relationships, they propose a data-driven operational effectiveness evaluation method for SIN, PSO-BPNN, which combines particle swarm optimization (PSO) with a BP neural network.
In addition, Jiang et al. [13] propose a correlation-based LSTM multidimensional forecasting model to enhance the accuracy of satellite telemetry parameter predictions. By analyzing real satellite telemetry datasets and examining the correlations among telemetry parameters, the model combines strongly correlated parameters for simultaneous prediction, effectively reducing errors. Jou et al. [14] introduce a common framework, MAPAN, for performance assessment across different phases of satellite communication systems, including planned performance, actual performance, and predictive performance. Based on actual and predicted system performance, MAPAN continuously adjusts contractible and allocable resources to optimize the efficiency of satellite communications (SatCom). Wang et al. [15] propose a comprehensive key performance indicator (KPI) framework for mega-constellations based on LEO satellite networks. They develop a highly efficient constellation-wide performance evaluation methodology by leveraging the concept of interfering areas and hexagonal spherical cells. In [16], a comprehensive framework for evaluating the uplink performance of IoT-over-Satellite networks is proposed. The authors simulate satellite communication networks using this framework and identify key indicators that influence communication performance.
Most of the above studies have analyzed SIN assessment methods from different perspectives. However, these methods still suffer from poor real-time performance and low accuracy when applied to large-scale LEO constellations. In this paper, we propose a novel situational assessment method for SIN in large-scale LEO constellations based on cloud-edge collaboration, significantly improving both latency and accuracy rate.

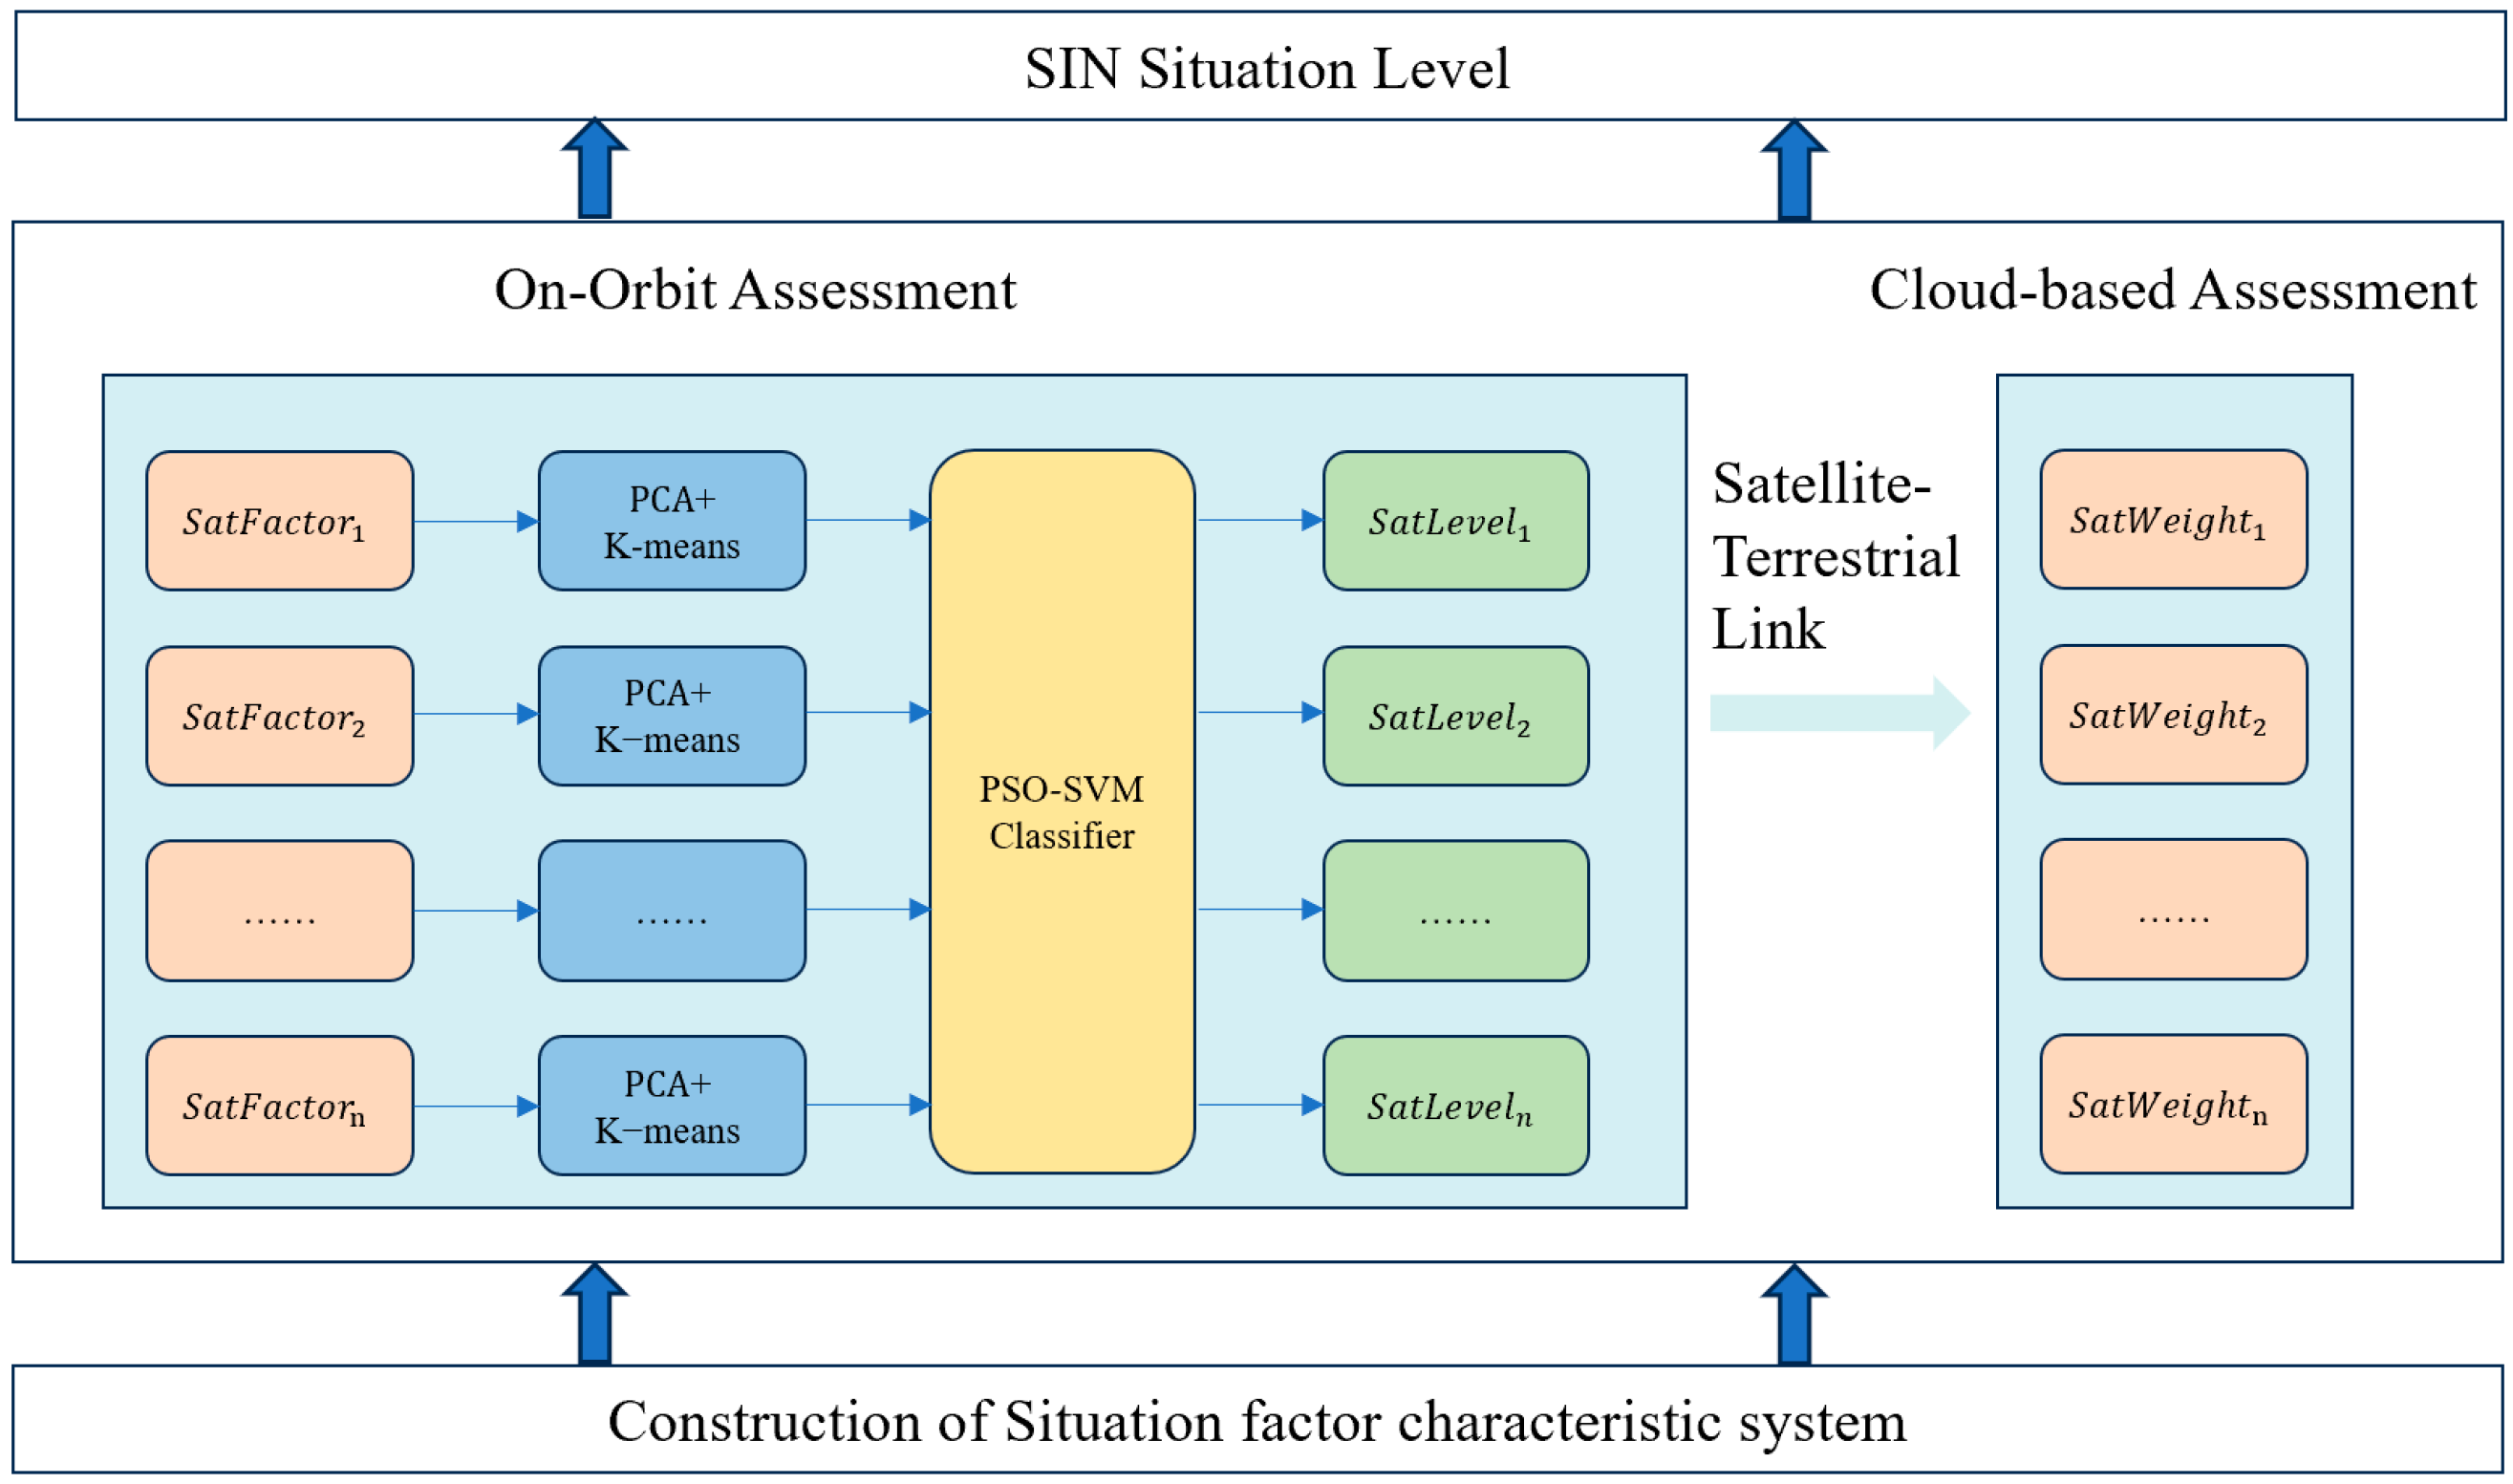
3. Architecture Design

3.1. System Architecture

In SIN, the satellite constellation consists of multiple LEO satellites, each providing communication and computation services to ground user terminals. The service response is delivered to the terminal via the satellite-terrestrial link. This paper proposes a novel SIN situational assessment method, as illustrated in Figure 1. The core concept of this method is to perform single-satellite on-orbit assessments using the assessment service deployed on each satellite while performing SIN fusion assessments at the ground cloud center. This approach achieves its objectives through collaboration between the cloud servers and satellite nodes.

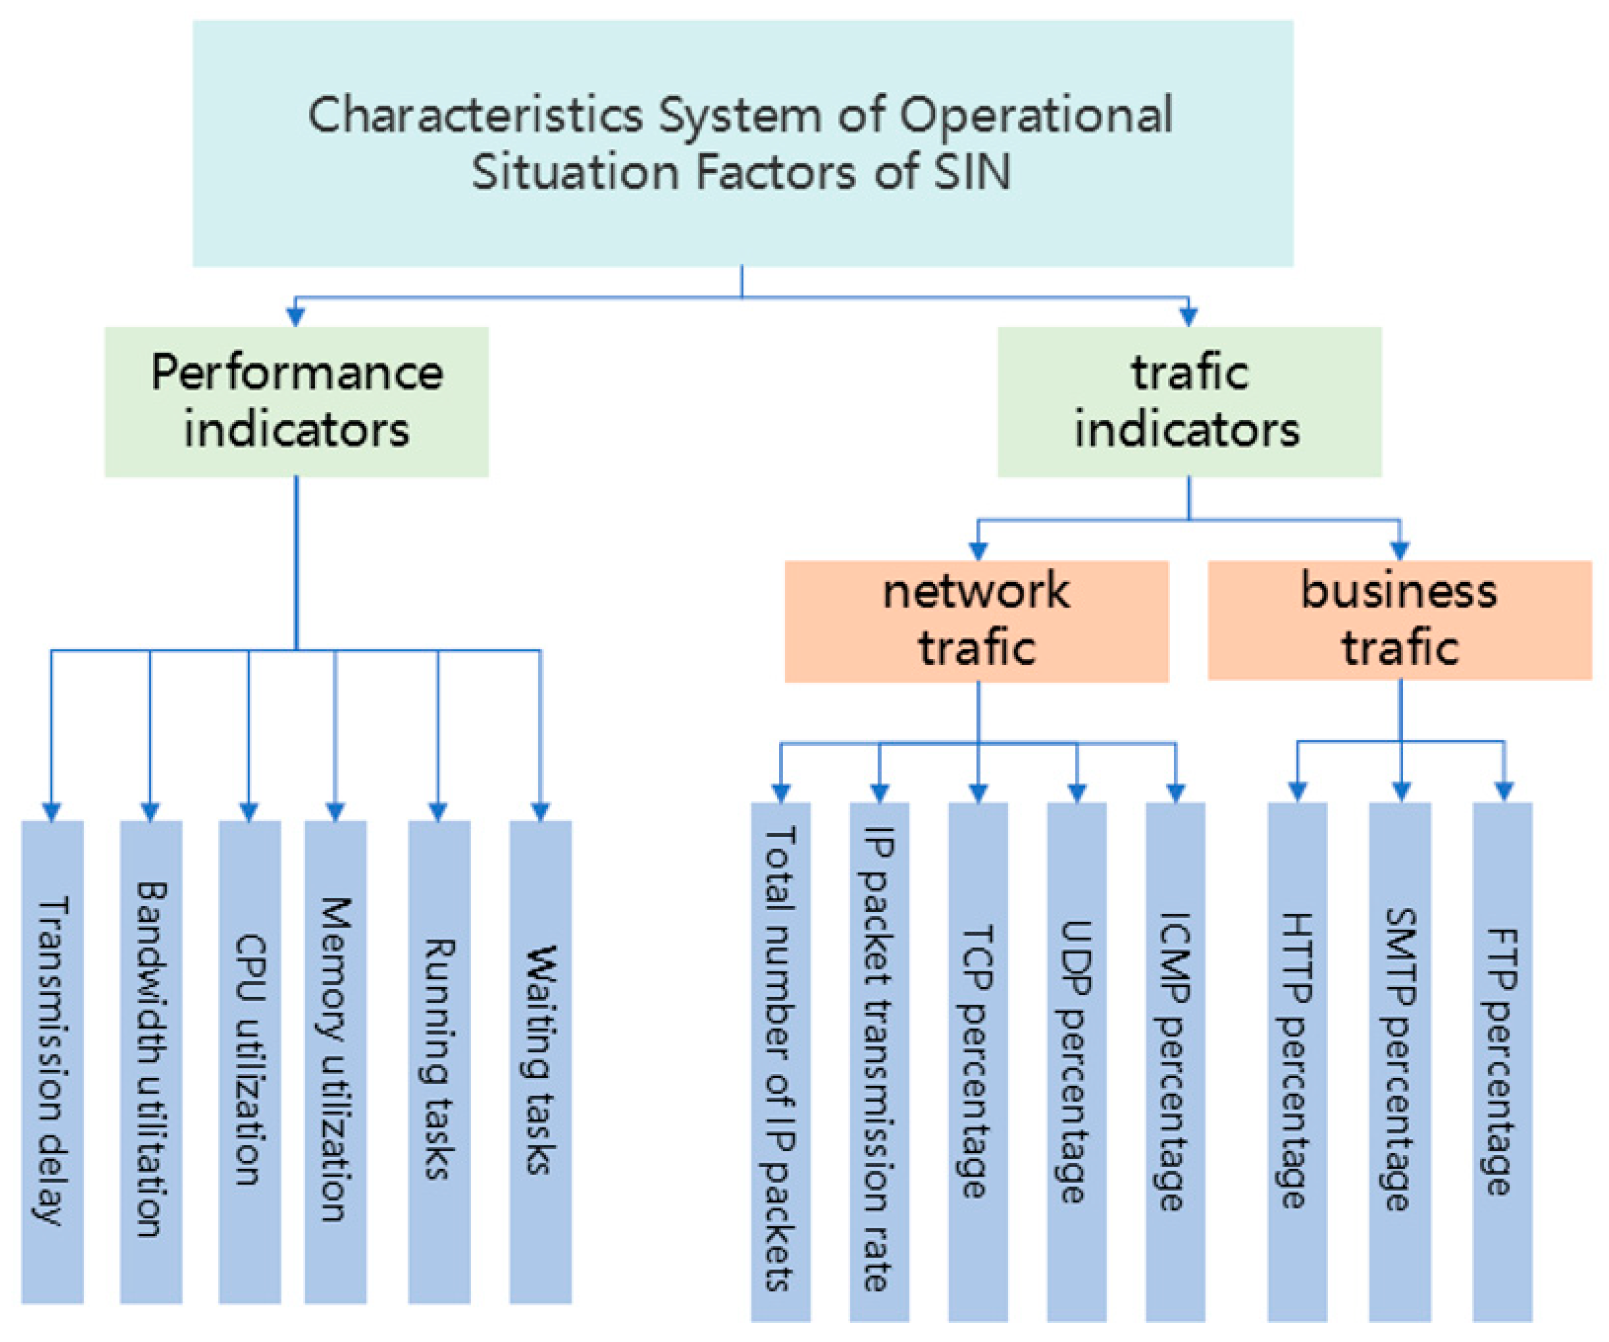
3.2. Assessment Factors

Establishing an effective situational assessment factor system is critical for accurate situational assessments. This paper presents a 14-dimensional factor system, as depicted in Figure 2, which encompasses network performance, network traffic, and service traffic indicators. Indicators such as CPU utilization can be directly obtained through system commands. While others, including bandwidth utilization, transmission delay, IP packet transmission rate, and traffic ratio, require additional processing for accurate assessment.
(1) Bandwidth utilization
Bandwidth utilization represents the percentage of the average data packet transmission rate per second relative to the theoretical maximum transmission rate of the network, reflecting the efficiency of data transmission within the network. It is expressed as L A R ; the formula is shown in Equation (1):
L A R = T B
where T represents the average data transfer rate of the network and B represents the maximum allowable data transfer rate of the network. Both transfer rates are measured in Mbps.
(2) transmission delay
The distance between any satellites can be represented by a matrix of N N as shown in Equation (2):
L = l 11 t l 1 N t l N 1 t l N N t
where L i j denotes the Euclidean distance between satellite i and satellite j   (unit: m) [17]. The signal transmission speed in the air is close to the speed of light, and the transmission delay is calculated as shown in Equation (3):
D = L c = d 11 t d 1 N t d N 1 t d N N t
where d i j   denotes the time consumed in transmitting data between satellite i and satellite j at the moment t, c denotes the speed of light (unit: m/s).
(3) The transmission rate of IP packets
The transmission rate of IP packets refers to the number of IP packets transmitted per time slice, and the metric is denoted by v i p , which can be expressed by Equation (4):
v i p = s u m p a c k e t t
where s u m p a c k e t denotes the total number of packets transmitted by the network during the measurement period t .
(4) Traffic ratio
The traffic ratio, denoted as acc, represents the proportion of protocol traffic to the total data traffic over a given period. The specific formula is shown in Equation (5):
a c c = s u m s u m
where s u m represents the total number of packets of a particular protocol over some time, and sum represents the total number of IP packets over the period.

4. Proposed Methodology

4.1. Improved K-Mean Pre-Labeling Algorithm Based on PCA Dimensionality Reduction

The increasing number of satellite nodes and types leads to varying feature factor weights across different satellites. To mitigate the impact of non-critical features on algorithm performance, we employ PCA to reduce the dimensionality of situational factor data, extract principal component features, and perform pre-labeled classification based on these reduced features. Additionally, traditional K-means clustering often relies on expert judgment to determine the K-value, which can reduce clustering accuracy. To address this, we propose an improved K-value selection strategy to enhance the algorithm’s precision and reliability.
(1) Dimensionality reduction using PCA
This paper employs PCA to reduce the dimensionality of situational factor vectors to enhance clustering efficiency [18]. The steps of the PCA algorithm are as follows:
Step 1: Raw indicators cannot be directly used for data analysis due to differing formats and units. These indicators are normalized using the maximum-minimum normalization algorithm to ensure consistency. This preprocessing step standardizes indicators such as IP packet transmission rate and transmission delay. The normalized situational factor feature data is denoted as X , as defined in Equation (6).
X = x 11 x 1 m x n 1 x n m = X 1 , X 2 , , X m
where n denotes there are n data vectors, and m denotes there are m situation factor features for each piece of data. X m denotes the m-th dimensional situation factor vector for all the data.
Step 2: The correlation coefficients for each dimension indicator in the situation factor dataset are calculated, and the correlation coefficient matrix A for X is shown in Equation (7):
A = 1 m X T X = r 11 r 1 m r n 1 r n m
where r i j represents the correlation coefficient between the i-th dimensional indicator and the j-th dimensional indicator.
Step 3: The standard eigenvectors of the correlation coefficient matrix A are calculated. The eigenvalues are represented as λ A = λ 1 , λ 2 , , λ m , where λ 1 > λ 2 > > λ m . The corresponding standard eigenvectors are denoted as α = ( α 1 , α 2 , , α m ) .
Step 4: The contribution degree of each standard eigenvector to the variance is calculated using Equation (8) and ranked in descending order:
a i = λ i k = 1 m λ k
where a i ( i = 1,2 , , m ) represents the variance contribution of the i-th eigenvector.
Step 5: The percentage ϕ of the cumulative variance contribution of the top p situational factors to the total variance is calculated based on the contribution ranking, as shown in Equation (9):
ϕ p = k = 1 p λ k k = 1 m λ k
The cumulative contribution rate is typically required to fall between 85% and 95%. When the cumulative contribution rate reaches 95%, it is considered that no significant information is lost, and = 95 % is selected.
Step 6: Identify the first p eigenvectors that meet the cumulative contribution threshold and combine them to form the transformation matrix T = ( α 1 , α 2 , , α p ) .
Step 7: After performing principal component feature extraction, the data vector for the situational factors is reduced to p-dimensional feature metrics, which can be expressed as Y = X T .
(2) Selection of the optimal K-value
The K-means algorithm is a centroid-based partitioning method and uses the centroid of a cluster, C i , to organize the cluster [19]. Assuming the situational assessment factors of SIN are represented as X = x i ,   i = 1,2 , , n , and the set of classification results is S j ,   j = 1,2 , , k . The optimization objective is formulated as follows:
m i n j = 1 k X S j X m j
where m j represents the expectation vector of the j-th class of situation factor vectors. It is specified that each factor can only be assigned to one cluster, i.e., j = 1 k x i j = 1 .
Traditional clustering algorithms require predefined K-values and initial cluster centers, which often rely on manual empirical classification and may lead to suboptimal results. This paper introduces a statistically driven approach to optimize K-value selection to address this limitation. The optimal K-value is selected based on the best clustering outcome by evaluating clustering performance across different K-values. The silhouette coefficient is employed as the evaluation metric, effectively combining measures of cohesion and separation. The optimal K-value corresponds to the clustering result with the highest silhouette coefficient, indicating strong separation and low cohesion within clusters [20].
Cohesion quantifies the local similarity of sample points within the same cluster, reflecting how tightly grouped the data points are. It is formally defined in Equation (11).
a i j = x i j x i k 2
where vector point x i j X i , X i is the i-th cluster in the current clustering, and x i k is a vector point in a different cluster X i , excluding those in x i j .
The degree of separation represents the global dissimilarity as shown in Equation (12):
b i j = x i j x k l 2
where vector point x i j X i , X i is the ith cluster in the current clustering, and x k l is a vector point in cluster X i except for those in cluster X i .
The silhouette coefficient, which combines cohesion and separation, is expressed in Equation (13):
S i j = b i j a i j max a i j , b i j
Furthermore, the silhouette coefficient can be expressed as shown in Equation (14):
s i j = 1 a i j b i j       , i f   a i j < b i j 0                   , i f   a i j = b i j b i j a i j 1          , i f   a i j > b i j
The optimal K-value is determined to be 4 through a combination of manual expertise and mathematical modeling. This corresponds to four node operational states: normal operation, light business, busy, and abnormal states.

4.2. PSO-SVM Model

Support Vector Machine (SVM) is a machine learning method in optimization theory, designed to classify data by identifying an optimal hyperplane that separates different classes. Fine-tuning the SVM model’s parameters is often necessary to maximize classification accuracy in practical applications. Research indicates that the radial basis function (RBF) kernel often delivers superior classification performance [21]. This paper introduces the use of Particle Swarm Optimization (PSO) to optimize the parameters of the RBF kernel in the SVM model for situational assessment.
The steps of the PSO-SVM algorithm are as follows:
Step 1: Initialization. Set the current iteration number to 1, the acceleration constants a 1 = a 2 = 2 , the maximum iteration number T m a x = 500 , and the particle population size m = 20. Generate m particle populations { x 1 , x 2 , , x m } along with their initial velocity values { v 1 , v 1 , , v m } . If the velocity of an individual particle exceeds the limit or the spatial threshold during the process, its position or velocity is set to half of the maximum threshold value.
Step 2: Evaluate the population. Load the sample vectors of situational factors after PCA dimensionality reduction. Substitute the corresponding kernel parameters of each particle into the fitness function, as shown in Equation (15), to calculate their fitness values sequentially and obtain the individual optimal solution.
F i t x i = i = 1 n ( 1 ) D x m 1 , x i 1 + i = 1 n ( 1 ) D x m 1 , x j 1 n 1 + n ( 1 ) D x m 1 , x m 1
where D x 1 , x 2 represents the distance between two sample points, which can be represented by the kernel function K x 1 , x 2 .
Step 3: Update the individual optimal solution. As particles move, compare the fitness of each kernel parameter with the individual optimal solution. If the current position of a particle yields better fitness than the previous optimal solution, the kernel function parameter represented by that particle is updated to the new individual optimal solution.
Step 4: Update the global optimal solution. Once the individual optimal solutions are updated, compare the fitness values of the current population’s optimal kernel parameters with the previous global optimal fitness values. If the current values are better, the global optimal solution is updated to the current position.
Step 5: Synchronize and update particle velocity and position. The velocity and position of all particles in the population are updated simultaneously according to Equation (16) [22].
v i d ( t + 1 ) = ω v i d ( t ) + a 1 r 1 p i d t x i d t + a 2 r 2 p g d t x i d t x i d t + 1 = x i d t + v i d ( t + 1 )
where v i d ( t ) represents the d-th dimensional velocity of the i-th particle in the feature space, and   x i d t denotes the d-th dimensional position coordinate of the i-th particle in the feature space.
Step 6: Repeat steps 2–5 until the algorithm converges or the number of iterations reaches the maximum limit T m a x . Once the iteration ends, output the optimal particle position coordinates x b e s t for the population.
Step 7: Use the output x b e s t from the PSO algorithm as the parameter for the SVM kernel function. Train the SVM model using the situational factor training data [23].
Step 8: Formulate the SVM as a quadratic programming problem to derive the support vector machine classification function, as shown in Equation (17). Use the trained SVM model to classify the situational factor vectors in the test set and calculate the classification accuracy.
f x = i = 1 N α i y i K x i , x + b
where x represents the input situational factor vector from the test set, and the output f(x) indicates the classification result of the SVM model, which corresponds to the current operational state of the satellite node being assessed based on the situational factor vector.

4.3. CECSA

In recent years, cloud-edge collaboration has been extensively applied in various domains, such as IoT, industrial Internet, power systems, and security monitoring [24,25,26]. However, research on situational assessment for SIN remains relatively limited. This paper proposes the Cloud-Edge Collaborative Situation Assessment (CECSA) method to address this gap and reduce satellite resource consumption while minimizing assessment latency. First, it collects operational situational factors from individual satellites. Then, PCA is applied for dimensionality reduction to extract key features. Next, an improved K-means clustering algorithm is used to pre-label the data. Subsequently, the PSO-SVM classification algorithm is employed to achieve real-time on-orbit situational assessment, determining the situational level for each satellite. This situational level is transmitted via a satellite-terrestrial link to the cloud center for SIN situational fusion assessment. By conducting fusion assessment in the resource-rich ground cloud center, CECSA enhances efficiency and reduces SIN resource consumption.
Due to the time-varying nature of SIN topology and the differences in tasks executed by each satellite node, the situational weight of each satellite within the network dynamically changes. A node situational weight factor is introduced during the SIN situational fusion assessment to accurately reflect each satellite’s actual impact within the network, as shown in Equation (18). This factor ensures that the assessment results more precisely represent the operational situation of the SIN.
P = V · X = v 1 , v 2 , , v n · x 1 , x 2 , , x n T
where X represents the operational situation levels of n nodes, which are the results of the single satellite’s on-orbit assessment. V denotes the weight factors of the nodes, reflecting the importance of the tasks deployed by each node. For node i, its weight factor v i is determined by its degree, betweenness, and clustering coefficient, as shown in Equation (19):
v i = α · d i + β · B i + γ · C i
d i , B i , and C i represent the degree, betweenness, and clustering coefficient of node i, respectively, while α ,   β , and γ are the weighting coefficients, with ( α + β   + γ = 1 ). The values of these coefficients can be adjusted based on the specific constellation type. In this paper, the coefficients are set as: α = 0.3 ,   β = 0.5 ,   γ = 0.2 .
The definitions of the three metrics are shown below:
(1) Degree d i
The degree refers to the number of edges in the network where node i is interconnected with other nodes, and this attribute reflects the dependency of the node on its neighboring nodes.
(2) Median B i
The median B i quantifies the importance of the satellite node in the network and is expressed in Equation (20).
B i = j , k N n j k i n j k
where n j k represents the total number of shortest paths for communication between satellite nodes j and k , and n j k ( i ) denotes the number of shortest paths in the set of shortest paths between satellite nodes j and k that pass through satellite node i.
(3) Clustering coefficient C i
The clustering coefficient measures the local aggregation of network nodes. Assuming that satellite node i has A i neighbor nodes, there can be at most A i ( A i 1 ) / 2 possible links between these neighbors. If only t i edges are present in the actual network, the clustering coefficient of the satellite node i is calculated as Equation (21):
C i = 2 t i A i A i 1

5. Experiment and Analysis

5.1. Metrics

This paper categorizes the SIN situation into four distinct levels to effectively describe the situational levels of SIN, as shown in Table 1.
The classification involved in situational assessment is a multi-classification problem. One-vs-rest (OVR) classification is a variation of multi-classification, typically used when the underlying algorithm is inherently binary [27]. The accuracy of the assessment is calculated using the formulas provided in Equations (22) and (23).
a c c i = T P i + T N i T P i + T N i + F P i + F N i
A C C = 1 4 i = 1 4 a c c i
In these equations, True Positive (TP) and True Negative (TN) metrics refer to the outcomes where a model predicts the sample class correctly. The False Positive (FP) metric calculates the percentage of incorrect positive predictions made when the class was negative, while the False Negative (FN) represents the number of incorrect negative predictions made when the true class is positive.

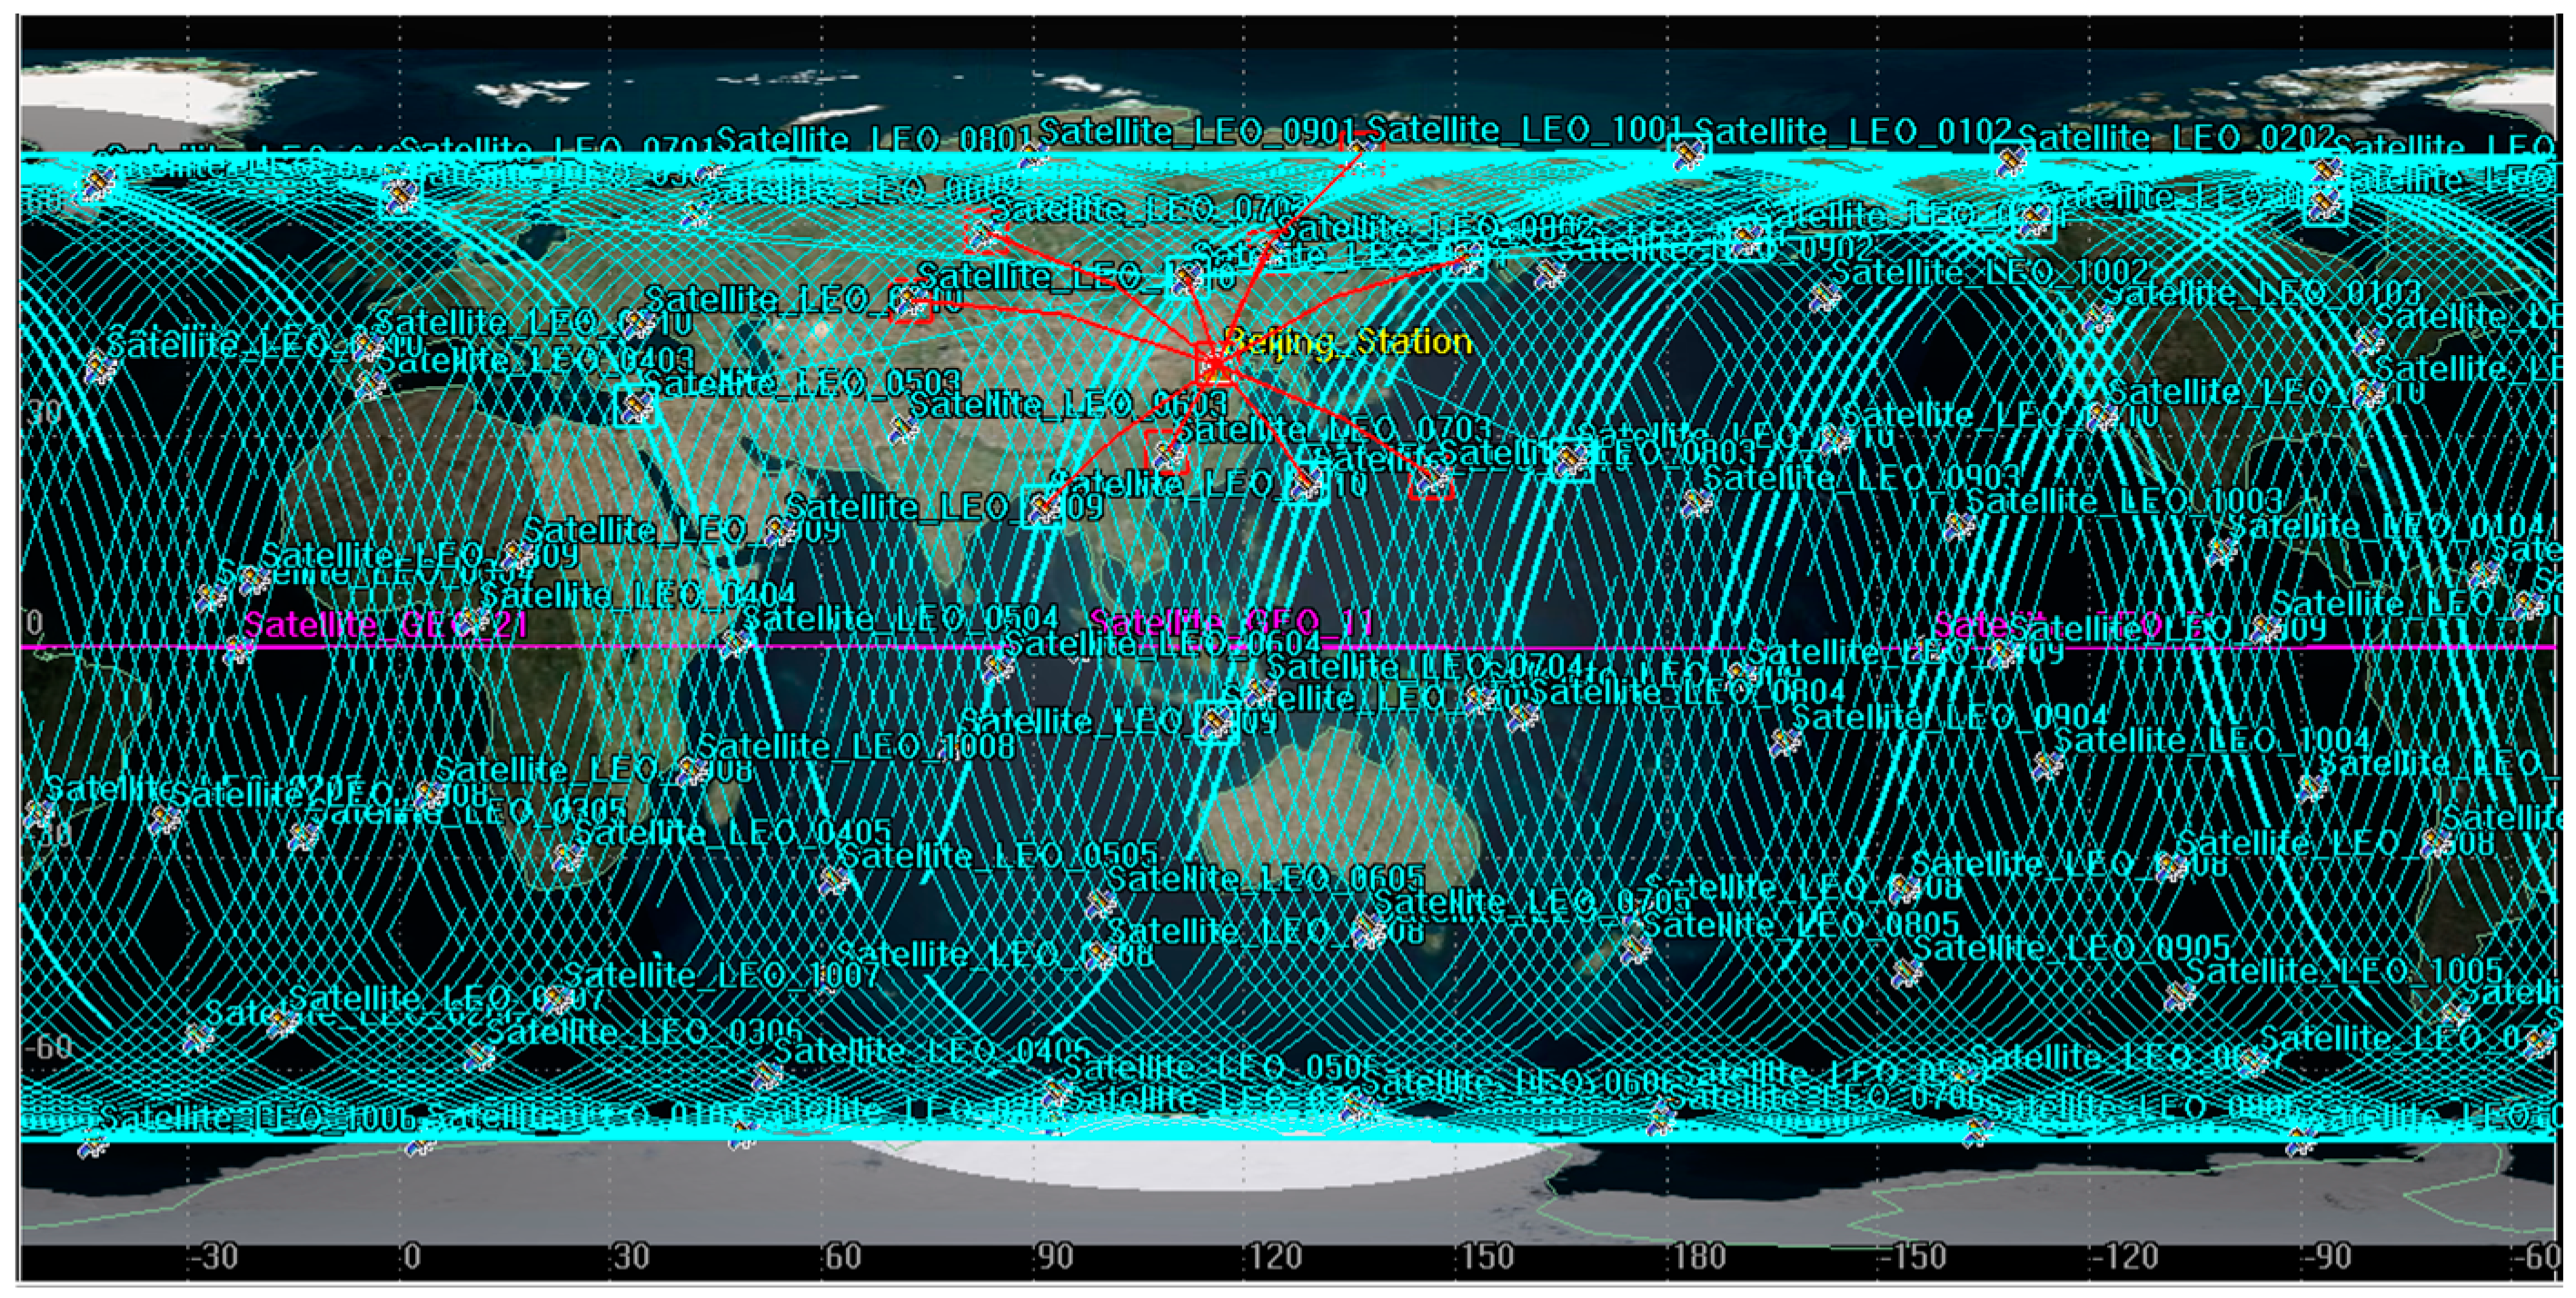
5.2. Experimental Settings

We established a SIN scenario using the Satellite Tool Kit (STK), consisting of 6 Geosynchronous satellites (GEOs), 1280 LEO satellites, 5 ground stations, and multiple ground terminals for sending tasks, as shown in Figure 3. Through STK, we can obtain situational factors of different periods and slice the satellite’s operating time into different time slices to get network topologies and location information. In this scenario, on-orbit assessments of individual satellites were performed directly on the satellites, while SIN fusion assessments were conducted at the ground cloud center.
By setting the number of terminals and task types, the dynamic variation of SIN load was simulated to ensure the stochasticity of the assessment factors proposed in this paper. Four types of tasks were randomly generated to be representative: computation, storage, communication, and sensing. The parameters in the experiment based on [28,29] are summarized in Table 2. To ensure the feasibility of the proposed method in practical applications, we set experimental parameters, including satellite orbit, number of satellites, inter-satellite links, ground station distribution, etc., according to real-world satellite constellations.

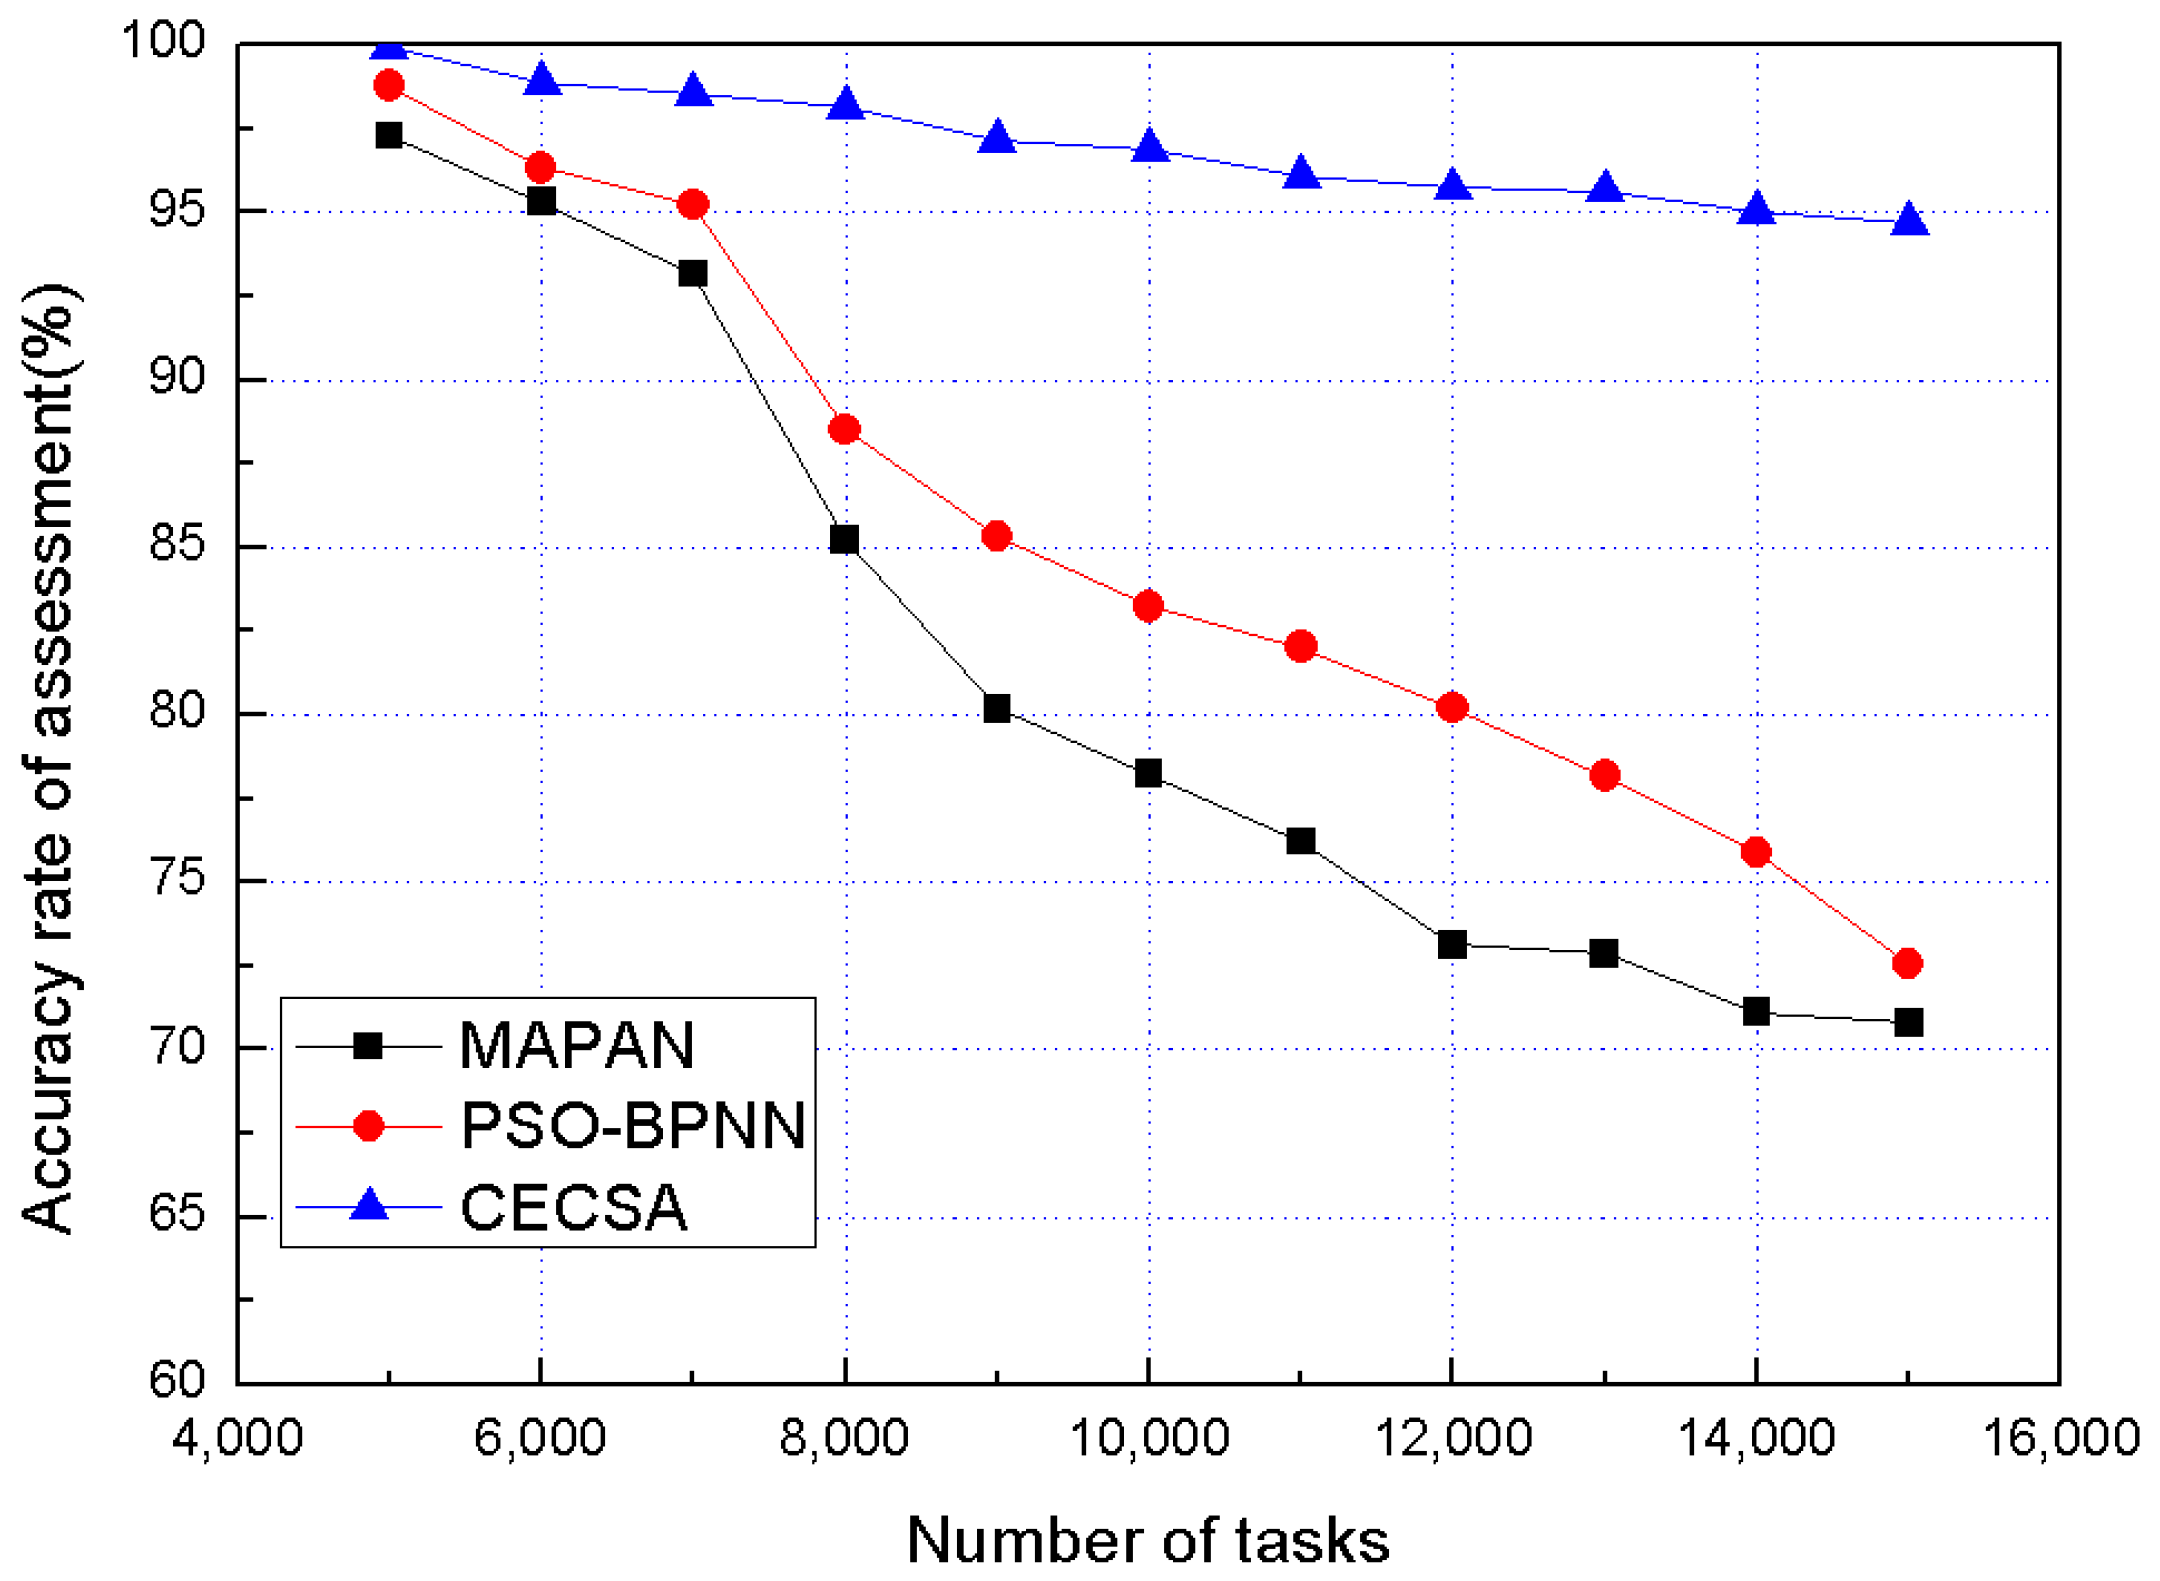
5.3. Result Analysis

To verify the effectiveness of the proposed method, we conducted a series of experiments comparing CECSA with baseline algorithms in terms of assessment accuracy and average completion time. A comparison was made between MAPAN [14] and PSO-BPNN [12], using varying numbers of tasks and satellites.
Figure 4 illustrates the impact of task numbers on the assessment accuracy of different methods. When the number of LEO satellites is fixed at 1280 and the number of tasks increases from 5000 to 15,000, the operational situation of the SIN becomes more complex. From the results, it is evident that the accuracy rate of CECSA will decrease as the number of tasks increases, but it can still reach over 95%. In contrast, the baseline algorithms (MAPAN and PSO-BPNN) achieve an accuracy of approximately 80% when the number of tasks reaches 8000, and this drops below 80% when the number of tasks reaches 12,000. This discrepancy arises because CECSA performs fusion assessments at the ground cloud center, avoiding the use of on-orbit resources. In contrast, the baseline algorithms consume a significant number of on-orbit resources, leading to assessment indicators that fail to accurately reflect the operational situation of the SIN.
Figure 5 shows a comparison of the average assessing completion time for different methods. Figure 5a compares the average assessment completion time for different methods as the number of tasks increases from 5000 to 15,000, with the number of LEO satellites fixed at 1280. The results show that the average completion time for all methods increases as the number of tasks grows. This is because a higher number of tasks leads to a greater proportion of satellite resources being allocated to processing user tasks, thereby reducing the efficiency of situational assessment algorithms. CECSA, however, demonstrates a significant advantage by leveraging PCA for dimensionality reduction, improved K-means clustering, and cloud-edge collaboration. These techniques reduce the feature space and enhance the performance of the assessment algorithms, resulting in a shorter average completion time compared to baseline algorithms. For instance, when the number of tasks reaches 15,000, CECSA completes the assessment in approximately 40 s, whereas the baseline methods require over 150 s.
Figure 5b illustrates the impact of the number of LEO satellites on algorithm performance when the number of tasks is fixed at 5000. The results indicate that when the number of LEO satellites is fewer than 1000, both CECSA and PSO-BPNN achieve an average completion time of less than 60 s, with CECSA requiring approximately 30 s. However, as the number of LEO satellites exceeds 1000, CECSA maintains relatively stable performance, whereas the completion time for baseline algorithms increases rapidly. This is because CECSA employs a cloud-edge collaborative approach, performing SIN fusion assessments at the ground cloud center, where computational resources are abundant. In contrast, the baseline methods conduct fusion assessments on-orbit, where limited satellite resources result in poor performance as the network scale increases.

6. Conclusions

This paper proposes a cloud-edge collaborative method for assessing the operational situation of SIN. Firstly, a 14-dimensional feature factor system, including performance and traffic indicators, was constructed based on the characteristics of SIN.
Feature dimensionality reduction was achieved using principal component analysis (PCA) to address the issue of high-dimensional data redundancy. An improved K-means algorithm was then utilized for pre-label classification of feature indicators, providing prior knowledge for subsequent situation-level classification. Secondly, a PSO-SVM model was designed to enable rapid on-orbit assessment of single satellite operational situations through adaptive parameter optimization. Finally, based on the cloud-edge collaborative architecture, the single satellite assessing results are transmitted to the ground cloud center for fusion assessing, generating the situation level of SIN while considering the constraints of on-orbit resources and the accuracy requirements of the assessment. To validate the effectiveness of the proposed method, we constructed a SIN simulation environment using STK, which consisted of GEOs, LEOs, and ground terminals. Experimental results demonstrated that, compared with traditional on-orbit fusion assessment methods, the proposed method improves the accuracy rate by 13% in high-concurrency scenarios, significantly reduces the average completion time, and maintains stable performance in large-scale satellite constellations.
In the future, we will focus on the operational situation prediction and task migration technologies for SIN. Specifically, we plan to utilize the LSTM network to predict the operational load of SIN based on historical and real-time data. Furthermore, we aim to develop task migration strategies for high-load edge nodes using reinforcement learning techniques. By integrating situation prediction with dynamic task scheduling, we strive to achieve load balancing within SIN, ensuring its healthy and efficient operation. These efforts will further enhance the robustness, scalability, and adaptability of SIN in complex and dynamic scenarios.

Author Contributions

S.X.: Conceptualization, methodology, software, validation, investigation, resources, writing—original draft, and writing—review and editing; J.L.: Conceptualization, methodology, writing—review and editing, supervision, project administration, and funding acquisition; J.T.: Methodology, software, validation, visualization, writing—original draft, and writing—review and editing; X.L.: Conceptualization, methodology, software, data curation, writing—original draft, and writing—review and editing; Z.L.: Conceptualization, methodology, formal analysis, resources, supervision, and writing—review and editing. All authors have read and agreed to the published version of the manuscript.

Funding

This research was funded by the National Natural Science Foundation of China, grant number 61701100; Shenyang Science and Technology Bureau Young and Middle-aged Talent Support Program (No. RC230142).

Institutional Review Board Statement

Not applicable.

Informed Consent Statement

Not applicable.

Data Availability Statement

The raw data supporting the conclusions of this article will be made available by the authors on request.

Acknowledgments

Thanks to the editor and reviewers for their comments of this article.

Conflicts of Interest

Sai Xu and Zhi Li were employed by the company Neusoft Research; Xiangjun Liu was employed by the company CS&S Information System Engineering Co., Ltd. The remaining authors declare that the research was conducted in the absence of any commercial or financial relationships that could be construed as a potential conflict of interest.

References

  1. Yang, H.; Liu, W.; Li, J.; Quek, T.Q.S. Space Information Network With Joint Virtual Network Function Deployment and Flow Routing Strategy with QoS Constraints. IEEE J. Sel. Areas Commun. 2023, 41, 1737–1756. [Google Scholar] [CrossRef]
  2. Sun, Y.; Peng, M.; Zhang, S.; Lin, G.; Zhang, P. Integrated Satellite-Terrestrial Networks: Architectures, Key Techniques, and Experimental Progress. IEEE Netw. 2022, 36, 191–198. [Google Scholar] [CrossRef]
  3. Pan, H.J.; Yao, H.P.; Mai, T.L.; Zhang, N.; Liu, Y. Scalable traffic control using programmable data planes in a space information network. IEEE Netw. 2021, 35, 35–41. [Google Scholar] [CrossRef]
  4. Chen, S.-J.; Wang, T.-Y.; Fang, C.-S.; Chiang, I.-W. Security Assessment of Low Earth Orbit (LEO) with Software-Defined Networking (SDN) Structure. In Proceedings of the 2023 IEEE 6th International Conference on Knowledge Innovation and Invention (ICKII), Sapporo, Japan, 11–13 August 2023; pp. 620–624. [Google Scholar] [CrossRef]
  5. Kassas, Z.M.; Kozhaya, S.; Kanj, H.; Saroufim, J.; Hayek, S.W.; Neinavaie, M.; Khairallah, N.; Khalife, J. Navigation with multiconstellation leo satellite signals of opportunity: Starlink, oneweb, orbcomm, and iridium. In Proceedings of the 2023 IEEE/ION Position, Location and Navigation Symposium (PLANS), Monterey, CA, USA, 24–27 April 2023; IEEE: New York, NY, USA; pp. 338–343. [Google Scholar]
  6. Li, D.R.; Shen, X. Research on the Development Strategy of Real-Time and Intelligent Space-Based Information Service System in China. Strateg. Study CAE 2020, 22, 138–143. [Google Scholar] [CrossRef]
  7. Mi, X.; Song, Y.; Yang, C.; Han, Z.; Yuen, C. MAGIC: Matching Game-Based Resource Allocation With Incomplete Information in Space Communication Network. IEEE Trans. Commun. 2024, 72, 3481–3494. [Google Scholar] [CrossRef]
  8. Seo, J.; Kim, Y.; Kim, D.; Jung, H. A Survey on Machine Learning for Space-Air-Ground Integrated Network: Key Technologies and Challenges. In Proceedings of the 2024 International Conference on Electronics, Information, and Communication (ICEIC), Taipei, Taiwan, 28–31 January 2024; pp. 1–3. [Google Scholar]
  9. Dong, Y. Research on Key Technology of Satellite Communication System Operation Control; Institute of Electronic Science and Technology, China Electronics Technology Group Corporation: Beijing, China, 2018. [Google Scholar]
  10. Lei, S.; Quanjun, L.; Hao, W.; Keqiang, X. Research on Collocation Situation Analysis and Control Optimization of the BeiDou GEO Satellites. In Proceedings of the 2023 IEEE 6th Information Technology, Networking, Electronic and Automation Control Conference (ITNEC), Chongqing, China, 24–26 February 2023; pp. 631–637. [Google Scholar]
  11. Gong, Z.; Zhuo, H. Research on cyberspace situational awareness. J. Softw. 2010, 21, 1605–1619. [Google Scholar]
  12. Han, C.; Xiong, W.; Jian, P. Data-driven Operational Effectiveness Evaluation of Space-based Information System. In Proceedings of the 2021 IEEE 5th Information Technology, Networking, Electronic and Automation Control Conference (ITNEC), Xi’an, China, 15–17 October 2021; pp. 1687–1692. [Google Scholar]
  13. Jiang, S.; Jiang, Y.; Zhou, Y.; Bi, R.; Zeng, J.; Luo, D.; Li, J. Enhancing Satellite Intelligent Prediction with Parameter Correlation and LSTM Multidimensional Forecasting. In Proceedings of the 2023 International Conference on Future Communications and Networks (FCN), Queenstown, New Zealand, 17–20 December 2023; pp. 1–6. [Google Scholar]
  14. Jou, B.T.; Haug, T.; Holmes, J.; Berthou, P.; Gautier, R. Performance assessment framework and concept of operations in live satellite communication systems. In Proceedings of the 40th International Communications Satellite Systems Conference (ICSSC 2023), Bradford, UK, 24–26 October 2023; pp. 188–194. [Google Scholar]
  15. Wang, Y.; Kong, C.; Meng, X.; Luo, H.; Li, K.-X.; Wang, J. Systematic Performance Evaluation Framework for LEO Mega-Constellation Satellite Networks. In Proceedings of the ICC 2024—IEEE International Conference on Communications, Denver, CO, USA, 9–13 June 2024; pp. 5616–5621. [Google Scholar] [CrossRef]
  16. Chan, C.C.; Al Homssi, B.; Al-Hourani, A. Performance Evaluation of Random Access Methods for IoT-over-Satellite. Remote Sens. 2022, 14, 4232. [Google Scholar] [CrossRef]
  17. Guo, Y.; Skouroumounis, C.; Chatzinotas, S.; Krikidis, I. On User Association in Large-Scale Heterogeneous LEO Satellite Network. IEEE Trans. Aerosp. Electron. Syst. 2024, 60, 5994–6010. [Google Scholar] [CrossRef]
  18. Wang, H.; Guo, L.; Lu, H.; Gao, J. Network Security Situation Assessment Based on PCA-IFOA-PNN. In Proceedings of the 2023 3rd International Conference on Electronic Information Engineering and Computer Communication (EIECC), Wuhan, China, 22–24 December 2023; pp. 423–429. [Google Scholar] [CrossRef]
  19. Han, J.; Kamber, M.; Pei, J. Data Mining: Concepts and Techniques, 3rd ed.; Morgan Kaufmann: Boston, MA, USA, 2011. [Google Scholar]
  20. Shin, H.; Lee, K.Y. Deep K-means Clustering Based on Graph Neural Networks: Leveraging Cohesion and Separation in Graph Nodes. In Proceedings of the 2024 IEEE International Conference on Big Data and Smart Computing (BigComp), Bangkok, Thailand, 18–21 February 2024; pp. 190–193. [Google Scholar]
  21. Zhou, J.; Yang, P.; Peng, P.; Khandelwal, M.; Qiu, Y. Performance evaluation of rockburst prediction based on PSO-SVM, HHO-SVM, and MFO-SVM hybrid models. Min. Metall. Explor. 2023, 40, 617–635. [Google Scholar] [CrossRef]
  22. Wang, D.; Tan, D.; Liu, L. Particle swarm optimization algorithm: An overview. Soft Comput. 2018, 22, 387–408. [Google Scholar] [CrossRef]
  23. Juneja, M.; Nagar, S.K. Particle swarm optimization algorithm and its parameters: A review. In Proceedings of the 2016 International Conference on Control, Computing, Communication and Materials (ICCCCM), Allahbad, India, 21–22 October 2016; IEEE: New York, NY, USA; pp. 1–5. [Google Scholar]
  24. Ding, C.; Zhou, A.; Liu, Y.; Chang, R.N.; Hsu, C.H.; Wang, S. A cloud-edge collaboration framework for cognitive service. IEEE Trans. Cloud Comput. 2020, 10, 1489–1499. [Google Scholar] [CrossRef]
  25. Sun, T.; Wang, Y.; Yang, G.; Xiong, R.; Yang, K.; Zhang, W. An Industrial Internet Cloud-Edge Collaborative Scheme and Evaluation System. In Proceedings of the 2024 3rd International Conference on Cloud Computing, Big Data Application and Software Engineering (CBASE), Hangzhou, China, 11–13 October 2024; pp. 691–697. [Google Scholar] [CrossRef]
  26. Liao, Y.; Gou, Y.; Liu, Z.; Zhang, J. Analysis and Design of Financial Wealth Management Platform Based on Cloud Edge Collaboration. In Proceedings of the 2024 3rd International Conference on Artificial Intelligence, Internet of Things and Cloud Computing Technology (AIoTC), Wuhan, China, 13–15 September 2024; pp. 165–168. [Google Scholar] [CrossRef]
  27. Hurbungs, V.; Bassoo, V.; Fowdur, T.P. A novel One-vs-Next approach for multiclass classification. In Proceedings of the 2024 IEEE Symposium on Computers and Communications (ISCC), Paris, France, 26–29 June 2024. [Google Scholar]
  28. Huang, J.; Xing, R.; Ma, X.; Zhou, A.; Wang, S. Profit-Aware Task Allocation in Satellite Computing. In Proceedings of the 2024 IEEE International Conference on Web Services (ICWS), Shenzhen, China, 7–13 July 2024; pp. 696–706. [Google Scholar] [CrossRef]
  29. Zhang, H.; Zhao, H.; Liu, R.; Kaushik, A.; Gao, X.; Xu, S. Collaborative Task Offloading Optimization for Satellite Mobile Edge Computing Using Multi-Agent Deep Reinforcement Learning. IEEE Trans. Veh. Technol. 2024, 73, 15483–15498. [Google Scholar] [CrossRef]
Figure 1. The Architecture of CECSA.
Applsci 15 04127 g001
Figure 2. Operational situation factor system.
Applsci 15 04127 g002
Figure 3. Space-based information network scenario.
Applsci 15 04127 g003
Figure 4. Accuracy rate of assessment for different numbers of tasks.
Applsci 15 04127 g004
Figure 5. Average assessment completion time for different methods.
Applsci 15 04127 g005
Table 1. Situation level of SIN.
LevelSituation ValueDescription
Level 10.75~1.0The system is in good condition and has sufficient resources
Level 20.5~0.75System load is too high
Level 30.25~0.5The system is malfunctioning
Level 40~0.25The system is down
Table 2. Simulation parameters.
ParametersValue (Range)
Number of tasks[5000, 15,000]
Data   size   of   task   T i  (MB)[1, 10]
Computational   size   of   task   T i  (Kcycles/bit)[1, 1.5]
time slot (s)5
Number of LEOs1280
Number of GEOs6
Number of ground stations5
Satellite computational capability (Gcycles/s)2
Satellite communication capability (Mbps)[3, 5]
Disclaimer/Publisher’s Note: The statements, opinions and data contained in all publications are solely those of the individual author(s) and contributor(s) and not of MDPI and/or the editor(s). MDPI and/or the editor(s) disclaim responsibility for any injury to people or property resulting from any ideas, methods, instructions or products referred to in the content.

