1. Introduction
The Space–Air–Ground Integrated Network, achieved through the deep integration of satellite, aerial, and terrestrial networks, possesses inherent advantages such as high throughput and robust recovery capabilities [
1]. Especially in remote areas, maritime coverage, and disaster response scenarios, despite the fact that terrestrial networks possess more resources to accomplish complex tasks, their limited coverage has rendered traditional terrestrial networks inadequate to satisfy the ever-increasing demand for data transmission [
2]. Consequently, the emergence of Space–Air–Ground Integrated Networks has achieved seamless global coverage, significantly enhancing the reliability and efficiency of communication systems. Within this integrated network, satellite networks serve as a pivotal component, offering a worldwide communication environment [
3] and becoming the cornerstone for realizing universal connectivity.
Research has indicated that in areas where terrestrial networks are inaccessible, leveraging satellites to provide internet services holds immense potential [
4]. Traditional satellite communication primarily relied on circuit switching methods; however, with the exponential growth of data volume, this approach has struggled to meet the demands for efficient and flexible data transmission. Onboard switching technology [
5] enables the agile processing and forwarding of data packets, thereby enhancing data transmission efficiency and flexibility. Furthermore, it supports the concurrent handling of diverse service types, making it an indispensable element within satellite networks.
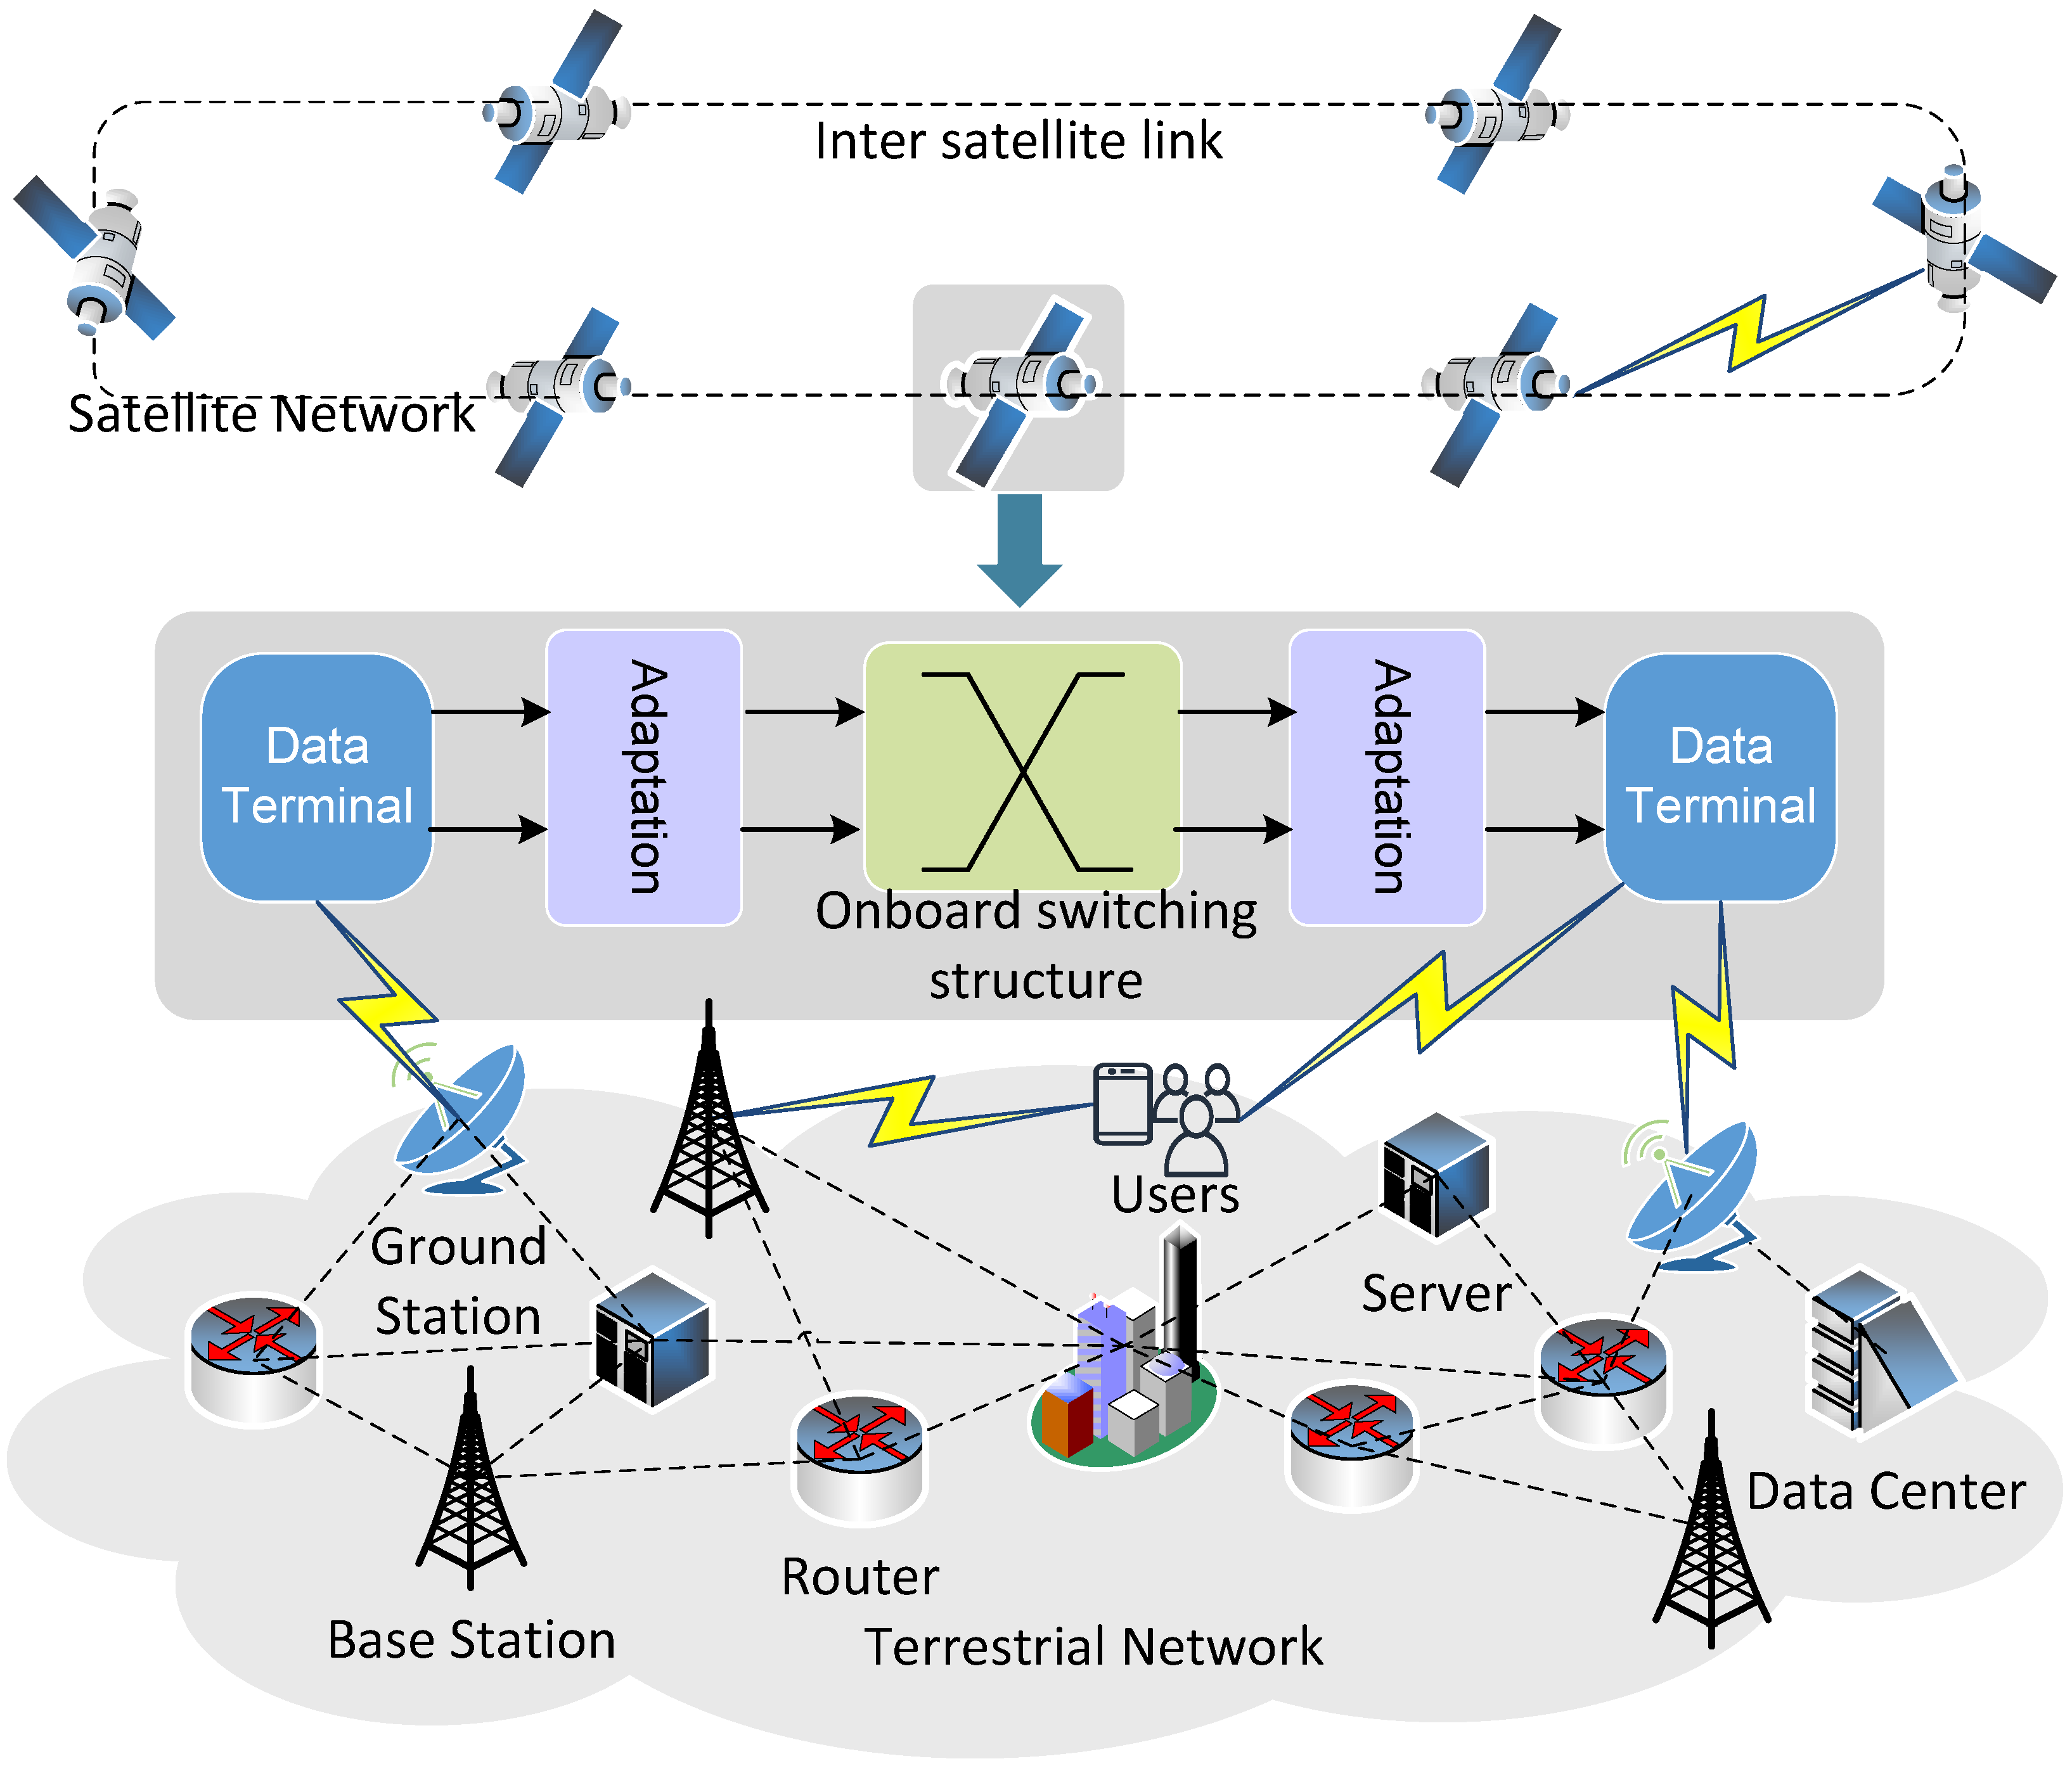
The satellite network realizes the data transmission process through the onboard exchange architecture, as shown in
Figure 1. In the process of data transmission, when the ground station or air platform needs to send data to other ground stations or air platforms, the data will first be sent to the satellite through the ground communication link or air communication link. After the satellite receives the data, the onboard processor will process the received data. The switching structure then selects the best transmission path based on the destination of the data and the current network state. This selection process needs to be based on complex routing algorithms and network protocols to ensure the efficiency and reliability of the data transmission. Once the transmission path is determined, the switching structure sends the data to the target satellite or ground station via interface equipment. In this process, data may be relayed and forwarded by multiple satellites, and finally, a trans-regional and trans-network transmission is realized, achieving the efficient and reliable transmission of data. In the onboard switching architecture, the performance of the switching fabric used to interconnect multiple input ports and output ports directly impacts the system’s metrics such as delay and packet loss rate [
6]. The switching structure is responsible for transferring packets from the ingress to the egress. The high-speed switching architecture uses fixed-length packets called cells. Incoming variable length packets are split into units at the input port and reassembled into packets at the output port [
7]. Therefore, it is of great significance to study the spaceborne switching structure with high throughput [
8].
The crossbar switching architecture [
9], known for its expandability and non-blocking characteristics in high-speed switching environments, has become the preferred solution for efficient data transmission [
10]. Crossbar switching structures are divided into two categories: unbuffered crossbar switching and internal buffer crossbar switching. Unbuffered crossbar switching, also known as Input Queuing (IQ) [
11] switching, uses a centralized scheduler to resolve packet contention at the input and output of the switch. In order to achieve a 100% throughput of IQ exchange, Maximum Weight Matching (MWM) [
12] and Maximum Size Matching (MSM) algorithms [
13,
14] have been introduced in previous studies. However, with the continuous improvement of the line rate, the scheduling strategies in IQ switches face severe challenges: either the design is too complex to be applied in practical deployment or the strategy is relatively simple, which makes it difficult to meet the urgent demand for high performance [
10]. As for the internal buffer crossbar switching structure, its design has a significant advantage in packet switching networks, and the core feature is that the buffer is placed in the crosspoints position. Compared with the traditional input queue maximum matching algorithm, the matching process of the internal buffer crossbar switching structure occurs at the crosspoint nodes between the incoming ports and the outgoing ports. A graph theory-based method or heuristic multi-iteration algorithm [
15] can be used to calculate the maximum match, but these algorithms require a specific calculation time and their complexity is at least
, which may become a performance bottleneck in high-speed data exchange.
The advantage of the scheduling algorithm of the internal buffer crossbar switching lies in its simplicity. For example, the scheduling algorithm based on the polling mechanism [
16] usually has a queue at the input end and at the crosspoints, which makes the input queuing scheduling process relatively simple. That is, when the target location is empty, the algorithm selects the next cell to be placed according to the predetermined polling mechanism and rotates the data items to be processed to this location in order once there is available space. The timing of data output is no longer dependent on the idle state of the target location but on the demand of the output queue. When data is needed in the output queue, it is extracted directly from that queue without checking any idle status in advance. This mechanism effectively separates the operation of data in and out and improves the throughput and response speed of the system. The complexity of this scheduling algorithm is
, and the algorithm does not need feedback validation. This means that its running time is independent of the number of queues, thus ensuring efficient data processing. In addition, scheduling algorithms such as strict priority and weighted polling can also be used. These algorithms are easy to implement and can flexibly cope with different traffic patterns and service requirements, which makes this structure have a wide application prospect in high-speed and large-capacity packet-switched networks.
However, one significant disadvantage of this structure is the way the crosspoint buffering mechanism is implemented. For example, the Combined Input Crosspoint Queuing (CICQ) architecture [
17] not only presents advantages but also has certain limitations. Since there are
discrete buffers at the crosspoints, the memory capacity of this architecture increases quadratically with the number of ports [
18], substantially increasing the implementation cost, especially for resource limited scenarios.
In satellite network scenarios, the hardware resources available for onboard switches are extremely limited, including interface bandwidth, hardware logic, and on-chip memory. For the FPGA-based implementations, commercial FPGA models with large capacities can be used in terrestrial environments. For example, the general-purpose Vertex XC7VX690T FPGA provides 693,120 logic cells and 10,888 Kb of on-chip memory, while the larger Vertex Ultrascale+ XCVU13P FPGA offers 3780 K logic cells and 455 Mb of memory. These large-capacity FPGAs offer abundant hardware resources for terrestrial network switch designs. In contrast, satellite networks must use radiation-tolerant space-grade FPGA models such as the Vertex XQR5VFX130, which only has 131,072 logic cells and 1580 Kb of on-chip memory—far fewer than their terrestrial counterparts. Additionally, onboard switches must address single-event upsets (SEUs) and multiple-event upsets (MEUs), often requiring dual-module or triple-module redundancy to ensure high reliability. These redundancy techniques consume additional hardware resources, further complicating the design of satellite switches under constrained conditions.
A scheme that multiplexes several input ports onto an internal bus [
19] can effectively reduce the complexity and storage space requirements of crosspoint buffering and improve the efficiency and scalability of the system. For a system with a large number of ports and limited storage space, this undoubtedly constitutes a very valuable optimization scheme. Yet, this scheme is not immune to the issue of Head-of-Line Blocking (HOL) [
20]. Specifically, the shared input–output bus among multiple ports, despite the high bus rate, may be constrained by one single output port rate. When multiple input ports occupy the same output bus going to the same output port, it will cause data to accumulate at the crosspoints. This congestion not only affects ports directly involved in conflicts but also indirectly impacts other ports that are not in direct conflict with the congested output port. Even if these ports are not overloaded, the inability to forward data through the crossbar architecture can compromise the system’s Quality of Service (QoS) [
21]. To address this issue, this paper proposes a crosspoint-buffered switching structure with internal backpressure (BP), primarily designed to reduce memory consumption and effectively alleviate internal congestion issues caused by buffer overload in a resource-constrained onboard environment.
The main contributions of this paper are as follows:
(1) We introduce a crosspoint-buffered switching architecture with port multiplexing that reduces resource consumption in resource-constrained scenarios like satellite switches.
(2) To address the queuing blocking problem caused by port multiplexing, we propose a backpressure (BP)-based traffic control method for the first time. At the same time, we further develop four BP mechanisms with different traffic control granularities and conduct comparative simulation analysis.
(3) The proposed BP mechanisms are simulated under multiple traffic scenarios, and the influence of different traffic parameters on network performance is considered. The simulation results show that the BP mechanism can significantly reduce the packet loss rate and improve the throughput rate compared to the case where no BP is applied. Among different BP mechanisms, we demonstrate that the BP load balance strategy has the best performance.
The main contents of this paper are as follows:
Section 2 summarizes the related work.
Section 3 describes the overall design of the internal BP structure. In
Section 4, the traffic model is introduced and analyzed. In
Section 5, the simulation results of the actual simulation experiments are analyzed in detail.
Section 6 concludes the paper.
2. Related Works
Due to the limited resources onboard, it is difficult to use complex switching architecture such as the three-stage Clos network [
22]. Therefore, a single-stage switching network [
23] is the preferred architecture for onboard switching. Single-level crossbar switching networks are mainly divided into shared memory (SM) [
24], the IQ switching network, the output queuing (OQ) switching network and the Crosspoint Queueing (CQ) [
25] switching network.
The SM structure uses a single memory to store data from all input ports. Its memory is shared by all ports, which maximizes memory utilization [
26]. However, in each time slot, since memory must accommodate
N concurrent write accesses and
N concurrent read accesses, where
N is the number of ports. This will lead to a gradual increase in the bandwidth of the switching structure and will therefore limit the size of the switch.
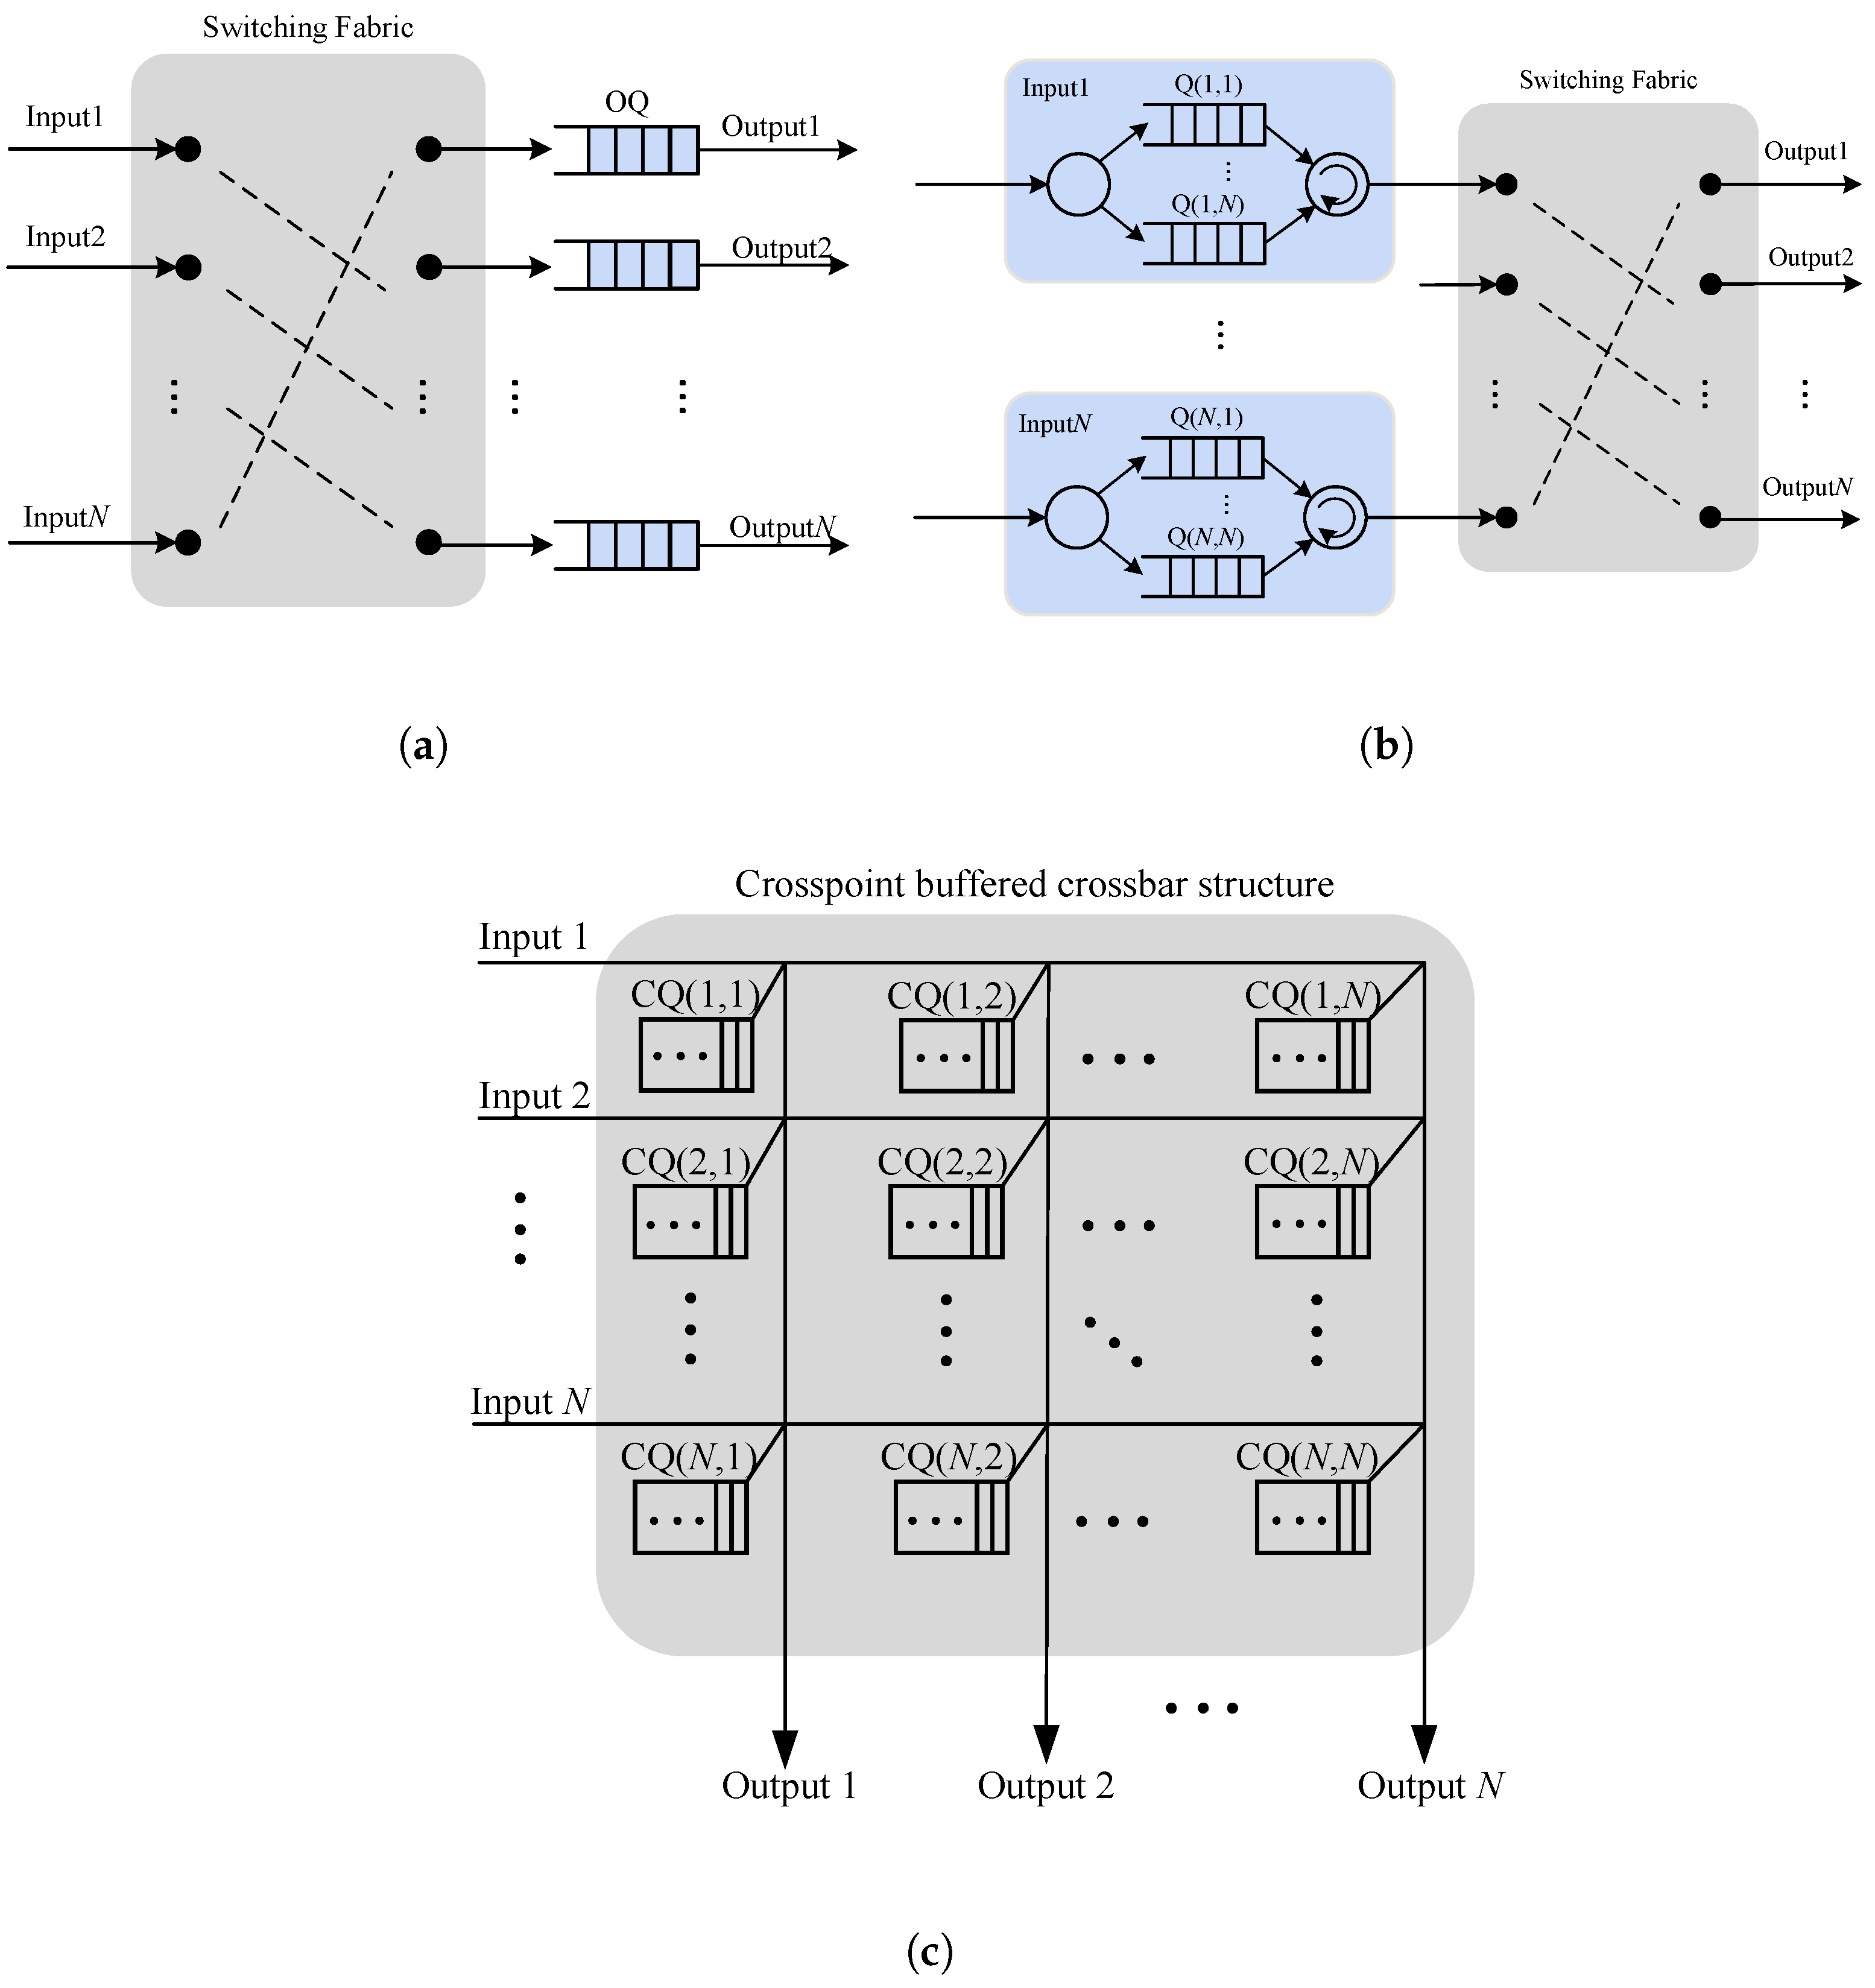
In the output queued switching network, due to its simple control, good throughput, delay and QoS performance guarantee, it has been widely paid attention to, and a lot of research results have been achieved [
23], as seen in
Figure 2a. However, the output queued switched network requires the forwarding rate of the switched network and the access rate of the output buffer to be
times the line speed of the interface (
N is the number of input ports in the switched network). And the development speed of the buffer access speed is much lower than the development speed of the router switching capacity and port rate, which is one of the biggest bottlenecks in the development of the switching network to attain high speed and large capacity. Therefore, it is impossible to use the output queued switching network in the high speed and large-capacity routing switching equipment, so the input queued switching network becomes the only choice.
In order to overcome HOL problems caused by First-In-First-Out (FIFO) [
27,
28,
29] Queuing, a Virtual Output Queuing (VOQ) [
30] mechanism is proposed in the input queuing network. As shown in
Figure 2b, VOQ means that each input port of the switching network divides the queuing buffer of cells into
N sub-queues corresponding to
N output ports of the switching network, and cells queue in the corresponding VOQ according to their destination ports.
The crosspoint-buffered crossbar structure [
31] is characterized by setting a specific number of buffers at each crossover switch position, as shown in
Figure 2c. The current research on this structure mainly focuses on the switching network of CICQ. On the basis of IQ, CICQ adds a small amount of buffer to the cross node of the switching network to queue the group, and the input side organizes the queue by VOQ to eliminate the HOL problem. Because the number of crosspoint buffers is closely related to the hardware implementation process of the switching network, the current buffer capacity should not be too large.
One study [
32] proposed a load balancing architecture based on CQ switch to overcome the problem of the unsatisfactory performance of the CQ switch in the case of non-uniform traffic. In this structure, the load balancing phase is placed before the CQ phase. The input port in the second stage of load balancing converts the incoming non-uniform traffic into nearly uniform traffic and uses flow-based queues in each crosspoint buffer. The simulation results show that the proposed switch can achieve a similar delay performance to the OQ switch and much better throughput than a simple CQ switch under non-uniform traffic. It also achieves the same packet loss rate as CQ switches, while using only 65% of the buffer size of CQ switches.
Another study [
33] proposed a scheduling algorithm based on the CQ switch to achieve a flow-based performance guarantee. Each intersection accelerates two buffers and one buffer. When there is no crosspoint blocking, only simple distributed input and output scheduling is required. Otherwise, a special emergency matching program is required to ensure the on-time delivery of the intersection blocking unit. The results show that using the proposed algorithm, the CQ switch can provide a flow-based performance guarantee by simulating the push-in first-out output queue switch.
In [
34], CQ switches with a buffer size greater than one and a labor-saving random scheduling algorithm are studied under uniform Bernoulli traffic. By modeling and quantifying the effect of the crosspoint buffer state on switch performance, a new method is proposed to calculate the throughput and latency of CQ switches of a given switch size, input load and buffer size. Compared with the existing models, the calculation results of the proposed model are more simple and accurate and can provide theoretical guidance for the design of high-speed switching networks.
In [
35], the authors present a new approximation for the throughput calculation of CQ switches with buffers only at the crosspoints in the case of uniform traffic and derive very simple formulas suitable for matrix computations. The results show that the method is very close to a large number of simulation results, especially for large switches and long buffers.
The authors of [
36] study a combined-input crosspoint buffered packet switch (CIXB) that performs arbitration based on round-robin selection and employs virtual output queues (VOQs) at the input. The results show that CIXB switches can achieve 100% throughput under uniform traffic and high performance under non-uniform traffic.
Another study [
37] proposes a partially buffered crosspoint (PBC) switching architecture, in which each output maintains a small number of independent internal buffers. The purpose is to design a PBC switch that has the performance of a buffer bar and a cost that is comparable to that of a non-buffer bar. At the same time, a round-robin scheduling algorithm for PBC architecture is proposed. The simulation results show that when the number of input ports is
N and eight buffers are used for each fabric column, the performance of the buffer bar is similar to that of the buffer bar with
N buffered crossbars for each fabric output.
The authors of [
38] propose two CQ switch-based 100% throughput scheduling algorithms without acceleration, called SQUISH and SQUID, and demonstrate that both schemes can achieve 100% throughput at any allowed Bernoulli traffic with the required minimum crosspoint buffer size as small as a single-cell buffer. The simulation results show that the delay performance is comparable to that of OQ switches.
4. Traffic Module
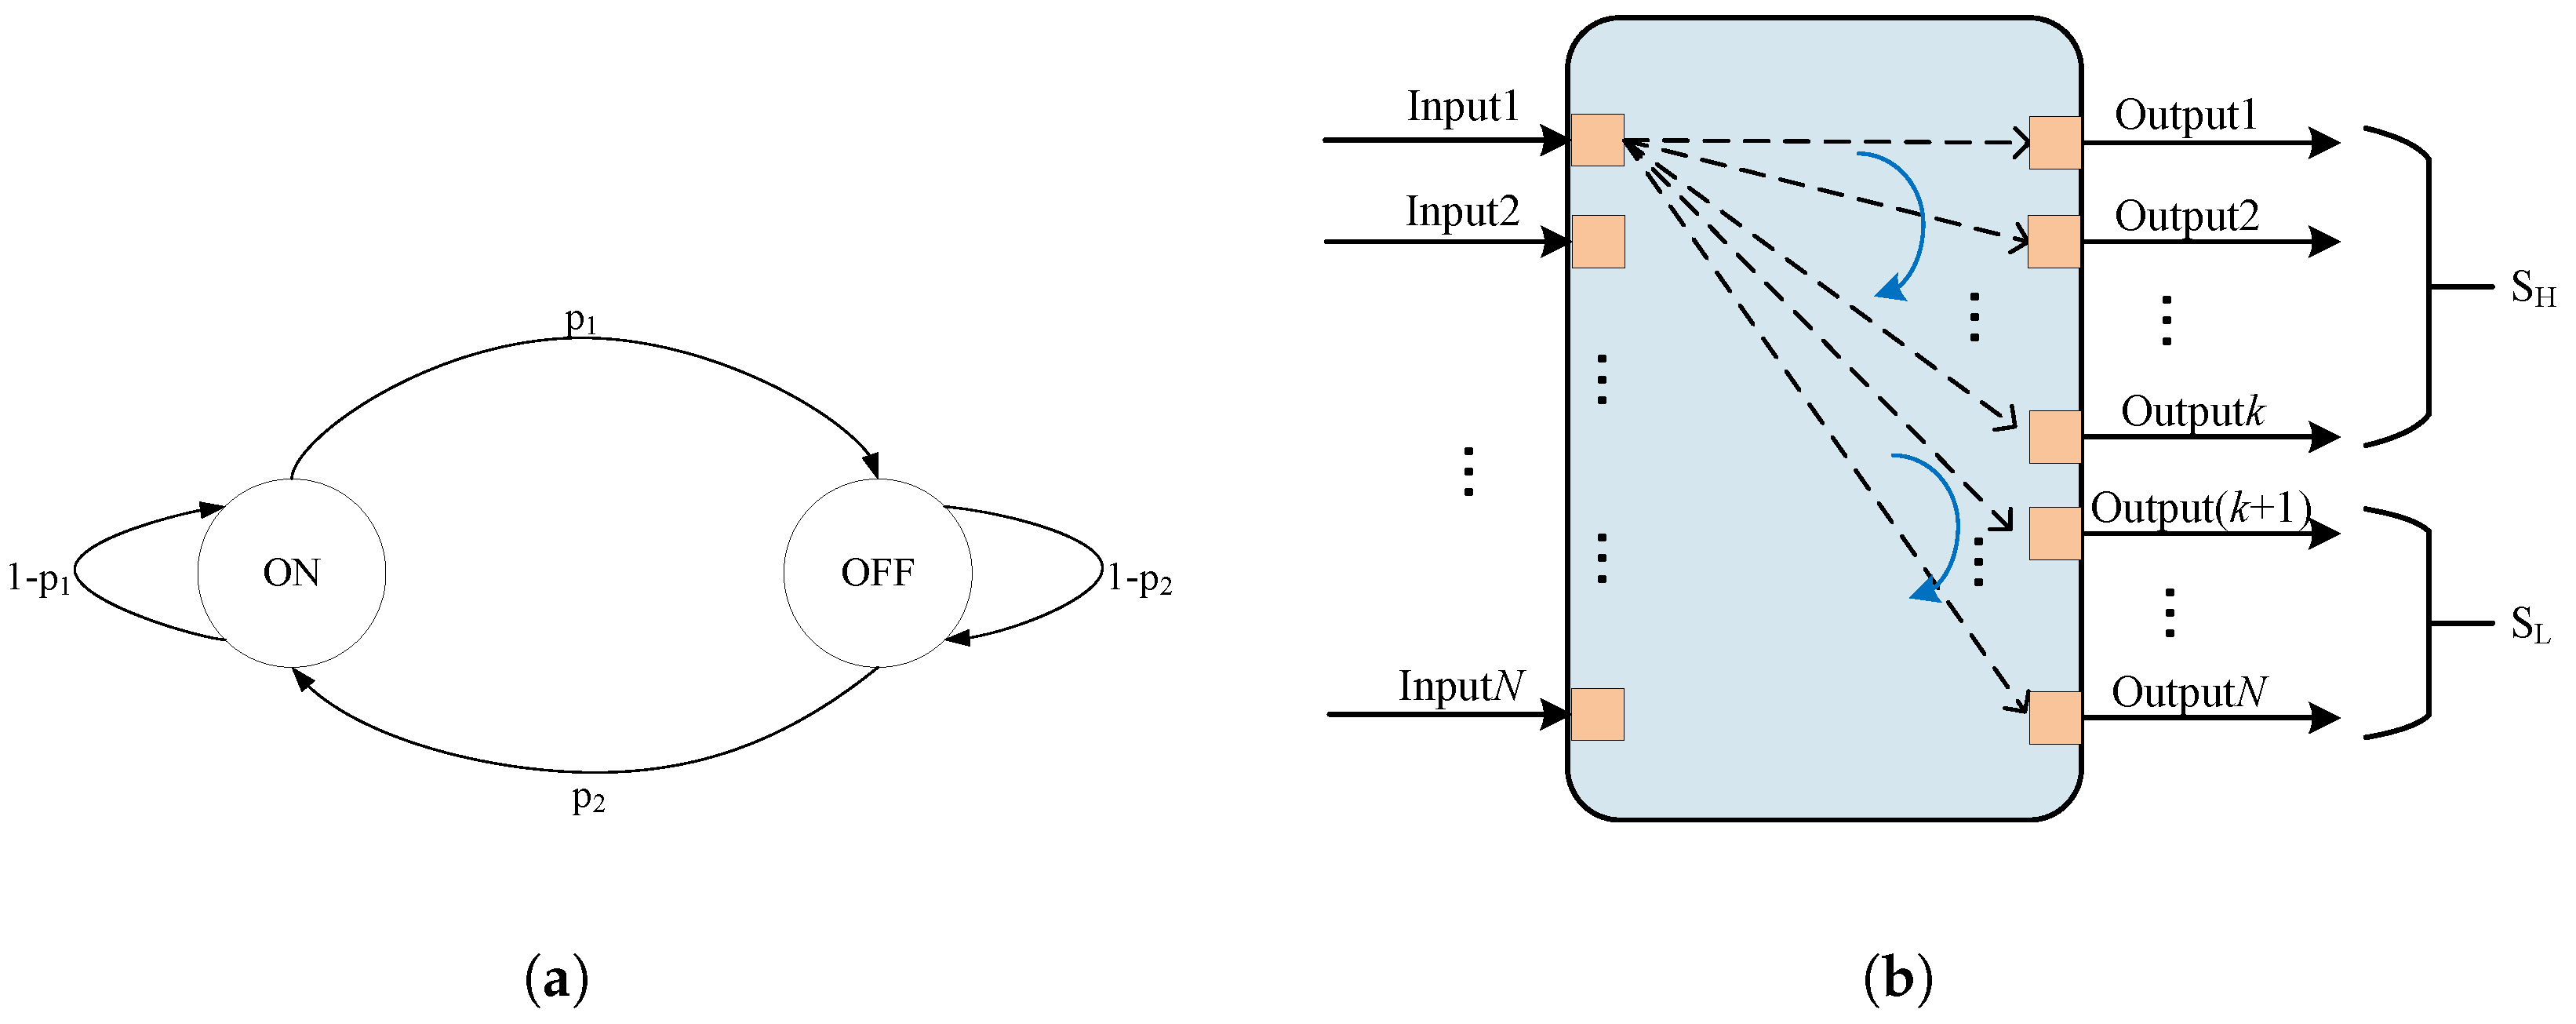
Firstly, to simulate traffic arrival at each port, the ON–OFF model [
41] is employed for traffic generation. During the ON state, the system continuously sends a high volume of data packets, resulting in distinct traffic peaks. Conversely, in the OFF state, data are not sent. In this context, the average duration of the ON state is discerned, referred to as the burst length.
The lengths of the ON and OFF periods in the ON–OFF model follow a periodic geometric distribution, resulting in the following:
In this context,
represents the probability of terminating a burst in each time slot, while
represents the probability of initiating a new burst. Assuming the average probability of a data packet arriving at a given time slot is denoted by
, we can derive the following:
Based on the global equilibrium equation, we derive the following:
From Equations (1) to (3) above, the duration of the OFF cycle can be derived as follows:
Secondly, in order to simulate the traffic distribution from input to output, the non-uniform traffic distribution model [
42] is used. Let
denote the traffic load from port
i to port
j, which can be formulated as follows:
where
represents the set of high-load ports and
represents the set of low-load ports.
is employed as the imbalance factor, ranging from 0 to 1.
When
equals 0, the traffic is uniformly distributed across all ports. As
gradually increases, the traffic begins to concentrate towards the hot ports, indicating a more uneven distribution. When
reaches 1, all traffic is directed to the hot ports [
43]. It can be observed that for any given
i, we have the following:
In the aforementioned equation,
denotes the number of hot ports, with
N being the total number of ports. In the simulations, the value of
is taken as half of the total number of ports. Among them,
Figure 5a shows the state transition diagram of the ON–OFF model, and
Figure 5b shows the non-uniform traffic distribution model diagram.
5. Simulation and Evaluation
In this section, we evaluate the performance of different BP mechanisms using software simulations. We utilize a switch with a multiplexing factor 4. Each link runs at 1000 Mbps speed. The ON–OFF module and non-uniform traffic generators are employed and all the generated packets have a fixed length. Each simulation is performed by time slots. The emulator we use is a self-developed simulation software based on C++ language, which simulates the switching model based on discrete event-driven simulation. The development environment is Visual Studio 2019, using the Windows10 x64-bit operating system, and the CPU is 12th Gen Intel(R) Core(TM) i5-12400 2.50 GHz, with 32 GB memory.
In addition, we employ a stochastic scenario to simulate the randomness and non-uniformity of switch port traffic, where hot ports (i.e., ports with concentrated traffic) are randomly distributed. This means that at different times or scenarios, traffic may be concentrated on different input or output ports. This randomness can truly reflect the uncertainty of traffic distribution caused by many factors (such as user activities, network congestion, etc.) in the actual network environment, so as to evaluate the load and performance of the switch port more comprehensively. In contrast, a deterministic scenario simulates the determinism and non-uniformity of switch port traffic. In this model, the hot port is fixed; that is, the traffic is always concentrated on a specific input or output port. This certainty reflects the regularity of traffic in some specific scenarios; for example, in some network topology or application scenarios, some ports always carry higher traffic due to specific service requirements or configurations. Through the simulation of the deterministic non-uniformly distributed traffic model, we can simulate the distribution of this fixed traffic, so as to evaluate the load and performance of the switch port more accurately. By simulating different network traffic scenarios, the influence of different BP schemes on system performance is compared.
5.1. Deterministic Scenario
In the deterministic scenario, we use the ON–OFF model to simulate the burst traffic of overloaded ports and Bernoulli i.i.d arrival to simulate the traffic of non-overloaded ports. The positions of overloaded ports are fixed and the number of overload ports is eight.
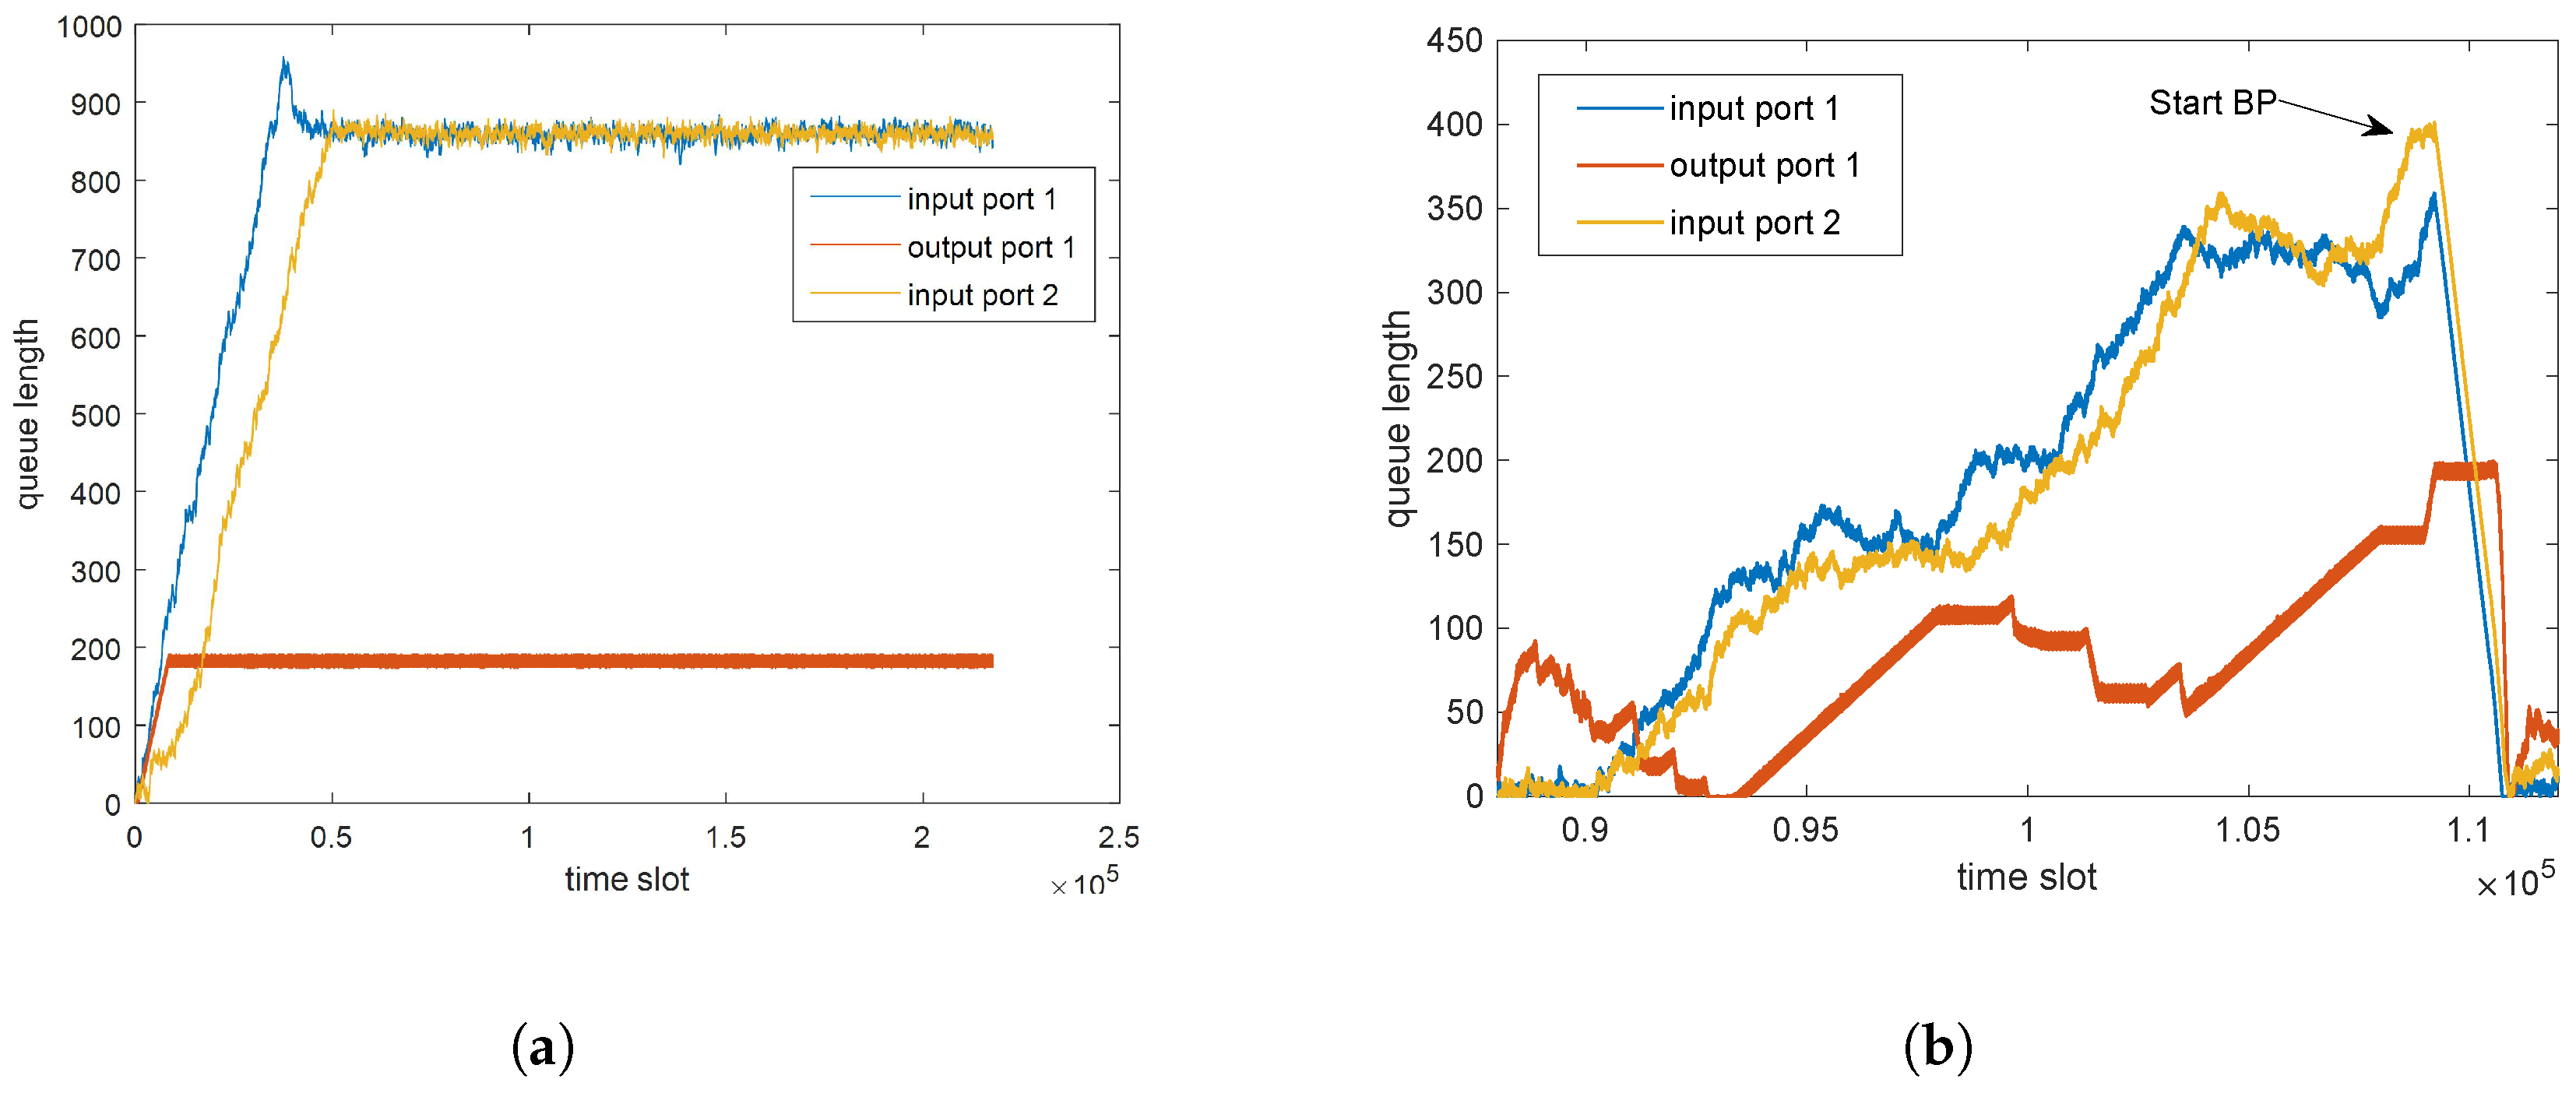
First, to illustrate how the BP mechanism works, let us analyze the evolution of the queue length. In this simulation, input port 1 is the overload port and input port 2 is the non-overload port. Input port 1 and input port 2 are in the same SIM and therefore require the output to be forwarded through the same CQ. As shown in
Figure 6a, input port 1 is an overloaded port, and the queue length increases rapidly and reaches a stable state, indicating that the queue is full. However, due to the aforementioned HOL phenomenon, input port 2, a non-overloaded port, experiences an unexpected surge in its queue length, leading to an overloaded state.
Figure 6b delves into the impact of implementing BP mechanisms on queue lengths. Prior to the adoption of BP, it is evident that the accumulation of data processing pressure was gradual and significant. Subsequent to introducing the BP mechanism, a notable reduction is observed in the number of data buffers at both input and output ports. This underscores the effectiveness of the BP mechanism in alleviating the pressure within the data traffic.
Next, the effects of on switching network performance under different BP mechanisms are analyzed. In this simulation, we use an ON–OFF model to simulate burst traffic, where the average length of the on state is 1200 and the average length of the off state is 800. The ranges from 0.4 to 0.5, indicating that the degree of the traffic imbalance is of a moderate value.
We consider the case without BP as a comparison, which is denoted as no-BP. When analyzing the influence of imbalance factor
on system performance under different BP mechanisms, we first analyze the influence of
on packet delay under different BP mechanisms. It can be found that under the
traffic model, with the increase in
, the packet delay shows an increasing trend. As shown in
Figure 7a, according to the simulation results, the packet delay of BP load balance, BP fine and BP load detection mechanisms is only increased by about 3.1–4.1% compared to the no-BP structure.
Secondly, we analyze the influence of
on the packet loss rate under different BP mechanisms.
Figure 7b shows that an increase in imbalance factor
will lead to an increase in the packet loss rate.
However, after the introduction of the BP mechanism, especially for the BP load balance mechanism, the packet loss rate is significantly reduced compared to that of the no-BP mechanism. Under the deterministic scenario, when reaches 0.5, compared with no-BP, the packet loss rate corresponding to the added BP load balance is reduced by 12%, which shows the best effect when dealing with non-uniformity traffic. The performance of BP fine and BP load detection is similar, and the packet loss rate is about 4.1% and 8.2% lower than that of the no-BP scheme, respectively.
Finally, we analyze the effects of
on throughput under different BP mechanisms. In
Figure 7c, it can be found that under the deterministic scenario, with an increase in
, the overall throughput of the system will show a downward trend. When evaluating the effects of different BP mechanisms, the BP load balance mechanism shows better performance in dealing with a non-uniform traffic distribution; that is, when
is 0.5, its corresponding throughput rate can reach about 79.8%. The throughput of the BP fine and BP load detection mechanism is 78.1% and 78.9%, respectively. Compared with other mechanisms, the BP load balance mechanism can maintain a higher throughput rate.
5.2. Stochastic Scenario
In the stochastic scenario, each output port has two types of traffic: background traffic and burst traffic. We use Bernoulli i.i.d arrival to simulate background traffic and the ON–OFF model to simulate burst traffic. The background traffic is evenly distributed across each output port. The burst traffic is concentrated in traffic hot ports. The locations of hot ports are randomly distributed, with an average number of eight.
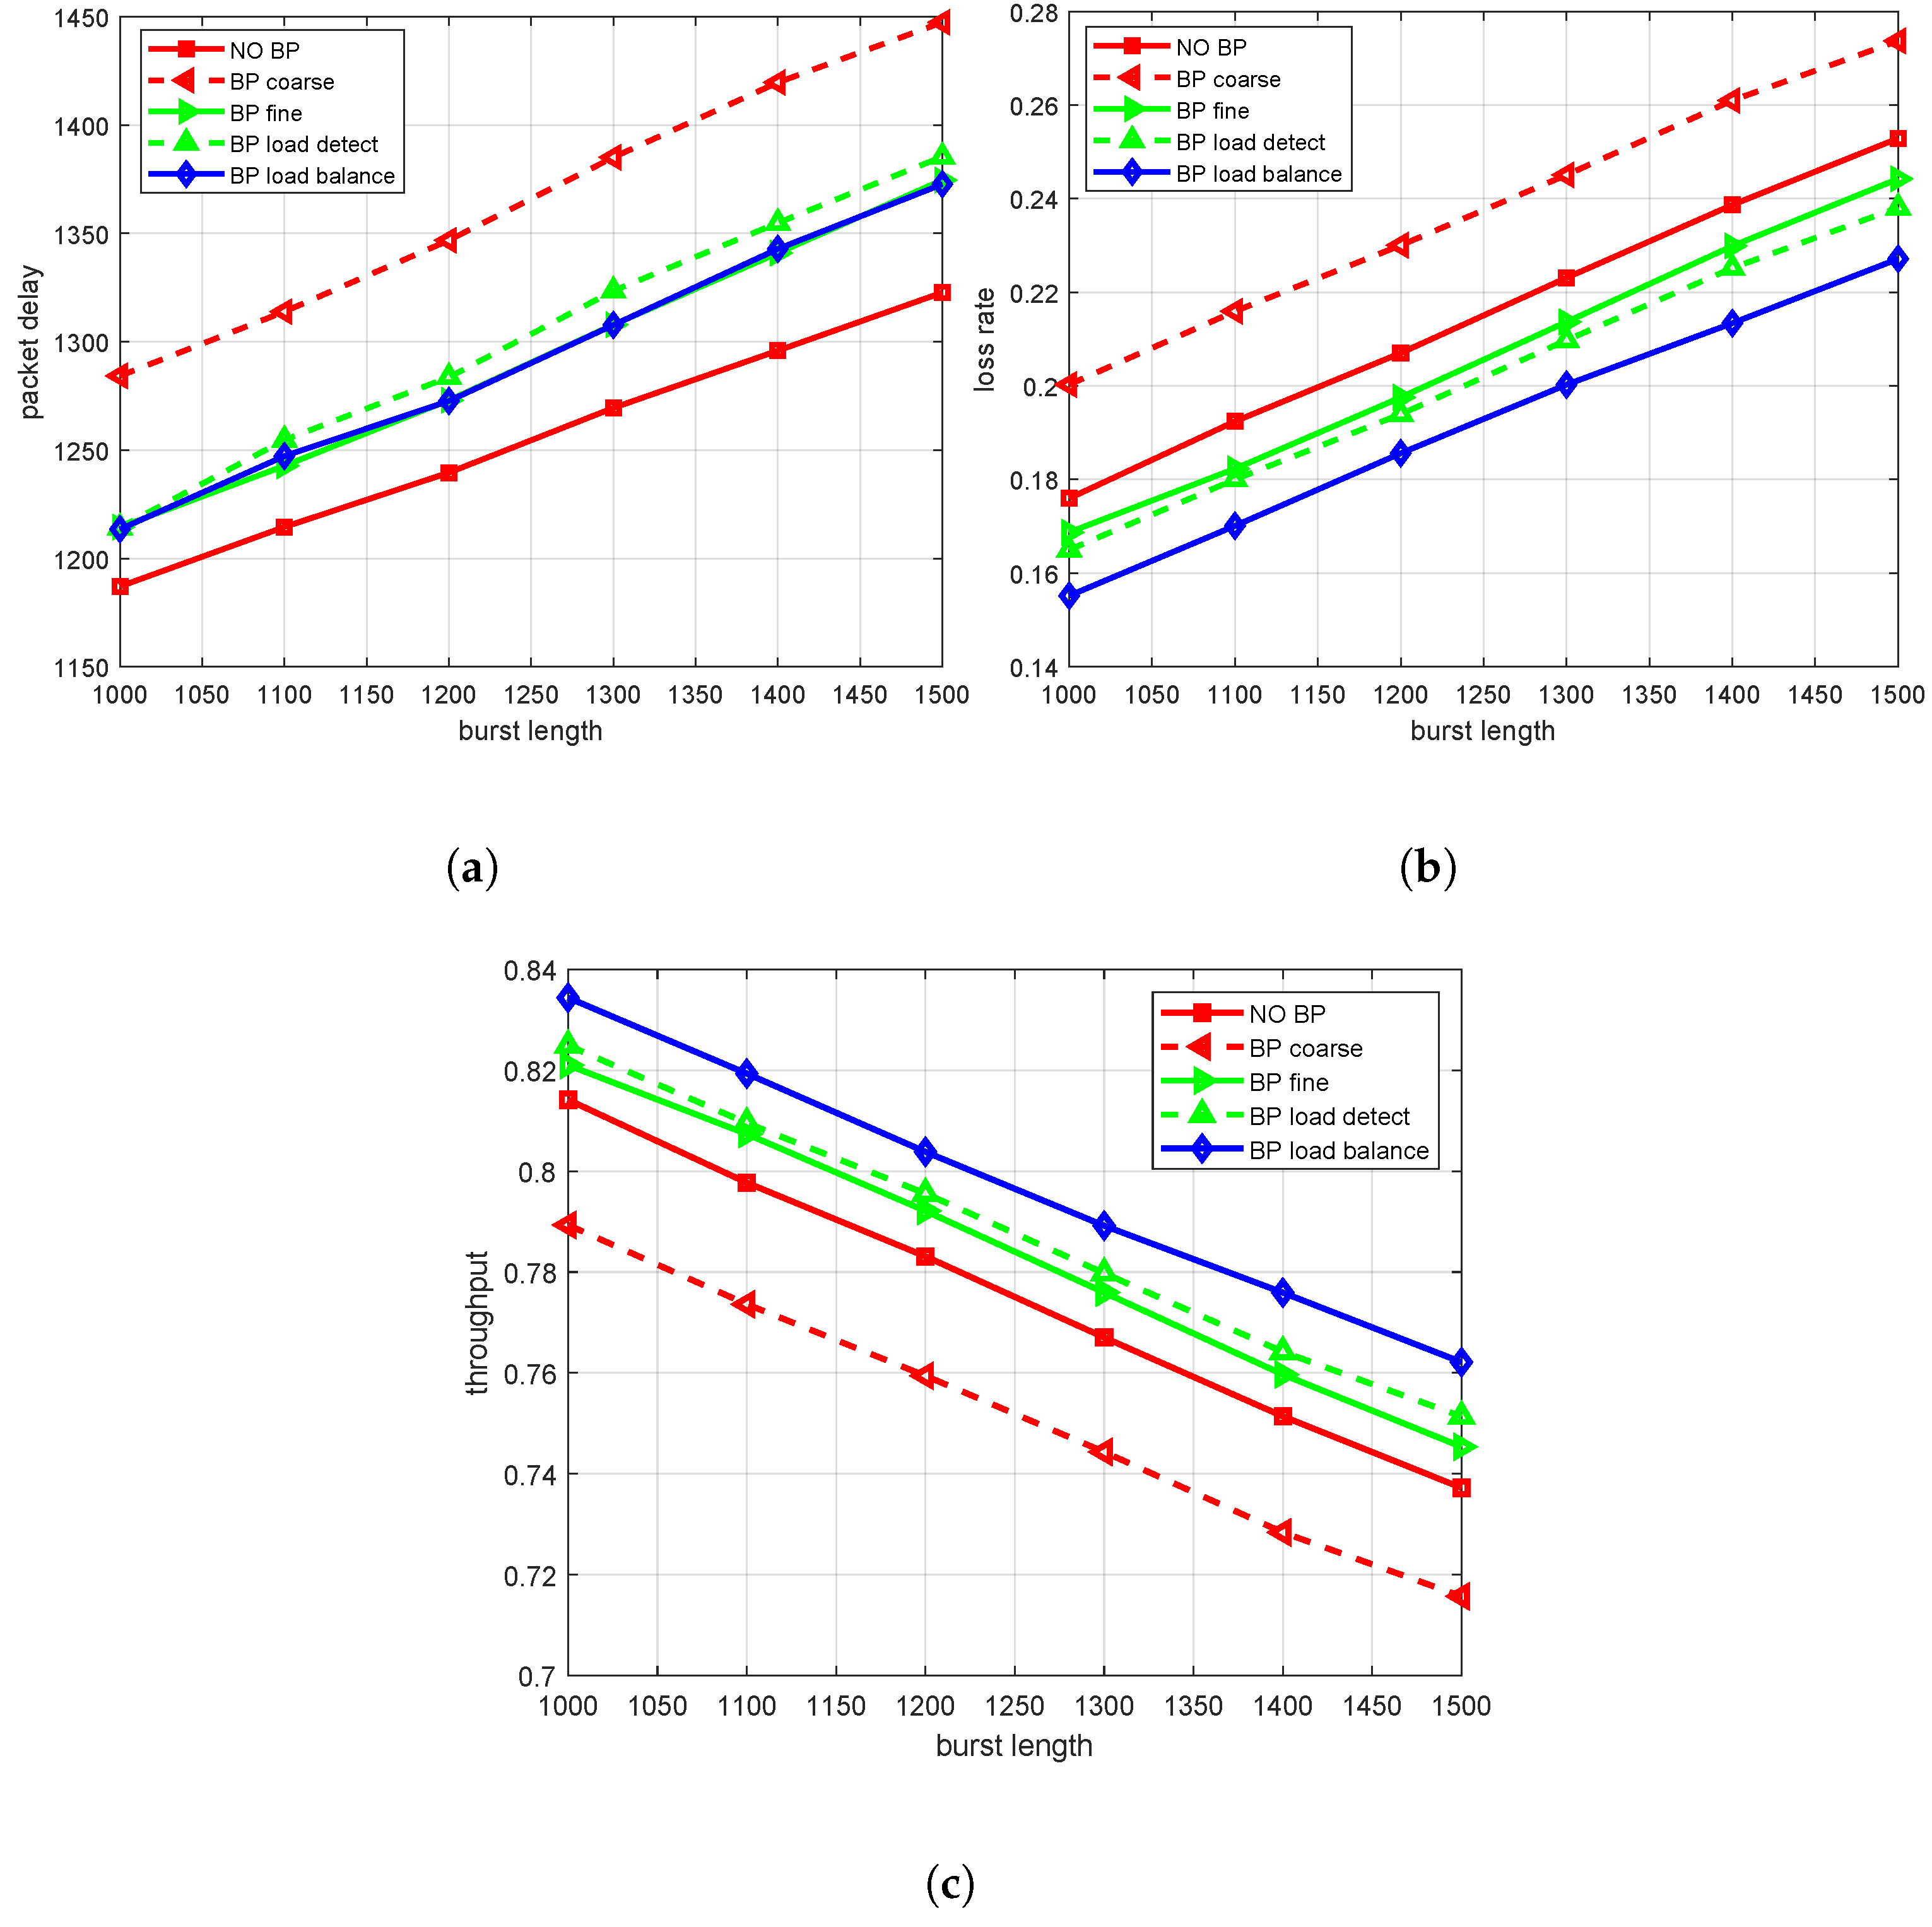
First, the effect of burst length on performance in the ON–OFF model is analyzed. In this experiment, the average length of our fixed off state is 800 time slots. We consider the case without BP as a comparison, which is denoted as no-BP. In
Figure 8a, it can be found that the packet delay gradually increases with an increase in burst length, and the packet delay under different BP mechanisms is slightly higher than that under no-BP schemes. This is because the balance adjustment process after the addition of the BP mechanism is not instantaneous but requires a certain amount of time and computing resources. During the BP mechanism, the upstream data processing node may pause or slow down the transmission of data, waiting for the downstream processing node to have sufficient capacity to process the new data. This can lead to an increase in the amount of time packets waiting in the processing queue, which increases packet delay. In addition, the BP mechanism may also trigger a series of chain reactions. When a node triggers BP, its upstream nodes may also be affected, resulting in a decrease in the rate of the entire data processing process. In this case, packet delays can accumulate throughout the process, making the final delay more noticeable. Therefore, the BP mechanism should be designed with the packet delay as small as possible. The results show that when the burst length reaches 1500, the packet delay of BP load balance and BP fine is similar, only increasing by 3.7%.
Secondly, we analyze the effect of burst length on the packet loss rate under different BP mechanisms. As shown in
Figure 8b, the packet loss rate increases with the increase in burst length. This is because when the buffer is about to be fully loaded, the BP mechanism can adjust the upstream send rate in time, in fact, to provide more processing time for the downstream processing node, so as to avoid packet loss caused by buffer overflow. The actual results show that under the same burst length, the BP load balance mechanism has the lowest packet loss rate. When the burst length reaches 1500, the packet loss rate is reduced by about 12% compared to the scheme without BP. The packet loss rates of BP fine and BP load detection were reduced by 2.8% and 5.8%, respectively.
Finally, we analyze the effect of burst length on throughput under different BP schemes. As shown in
Figure 8c, the higher the burst length, the lower the throughput of the system.
This is because the high burst length means that there is a large amount of data in a short time, resulting in the fact that the processing unit cannot process data in a timely manner, thus reducing the overall processing capacity of the system. When comparing different mechanisms, we can see that the performance of the BP load balance mechanism is the best, and the throughput rate can reach more than 76% when the burst length is 1500.
This mechanism can deal with burst data better and maintain high throughput through its effective load balancing strategy. In contrast, the no-BP mechanism slightly underperformed. Because the BP mechanism is not implemented, the system cannot effectively control the rate of data traffic in the face of a high burst length, which leads to the overload of processing cells, thus affecting the throughput.
In summary, the relationship between packet delay, the packet loss rate and the throughput rate and the degree of burst reveals the performance differences in different mechanisms in dealing with burst data. Among them, the BP load balance mechanism can effectively improve the throughput of the switching network and reduce the packet loss caused by traffic congestion. The overall performance of BP fine and BP load detection is similar.
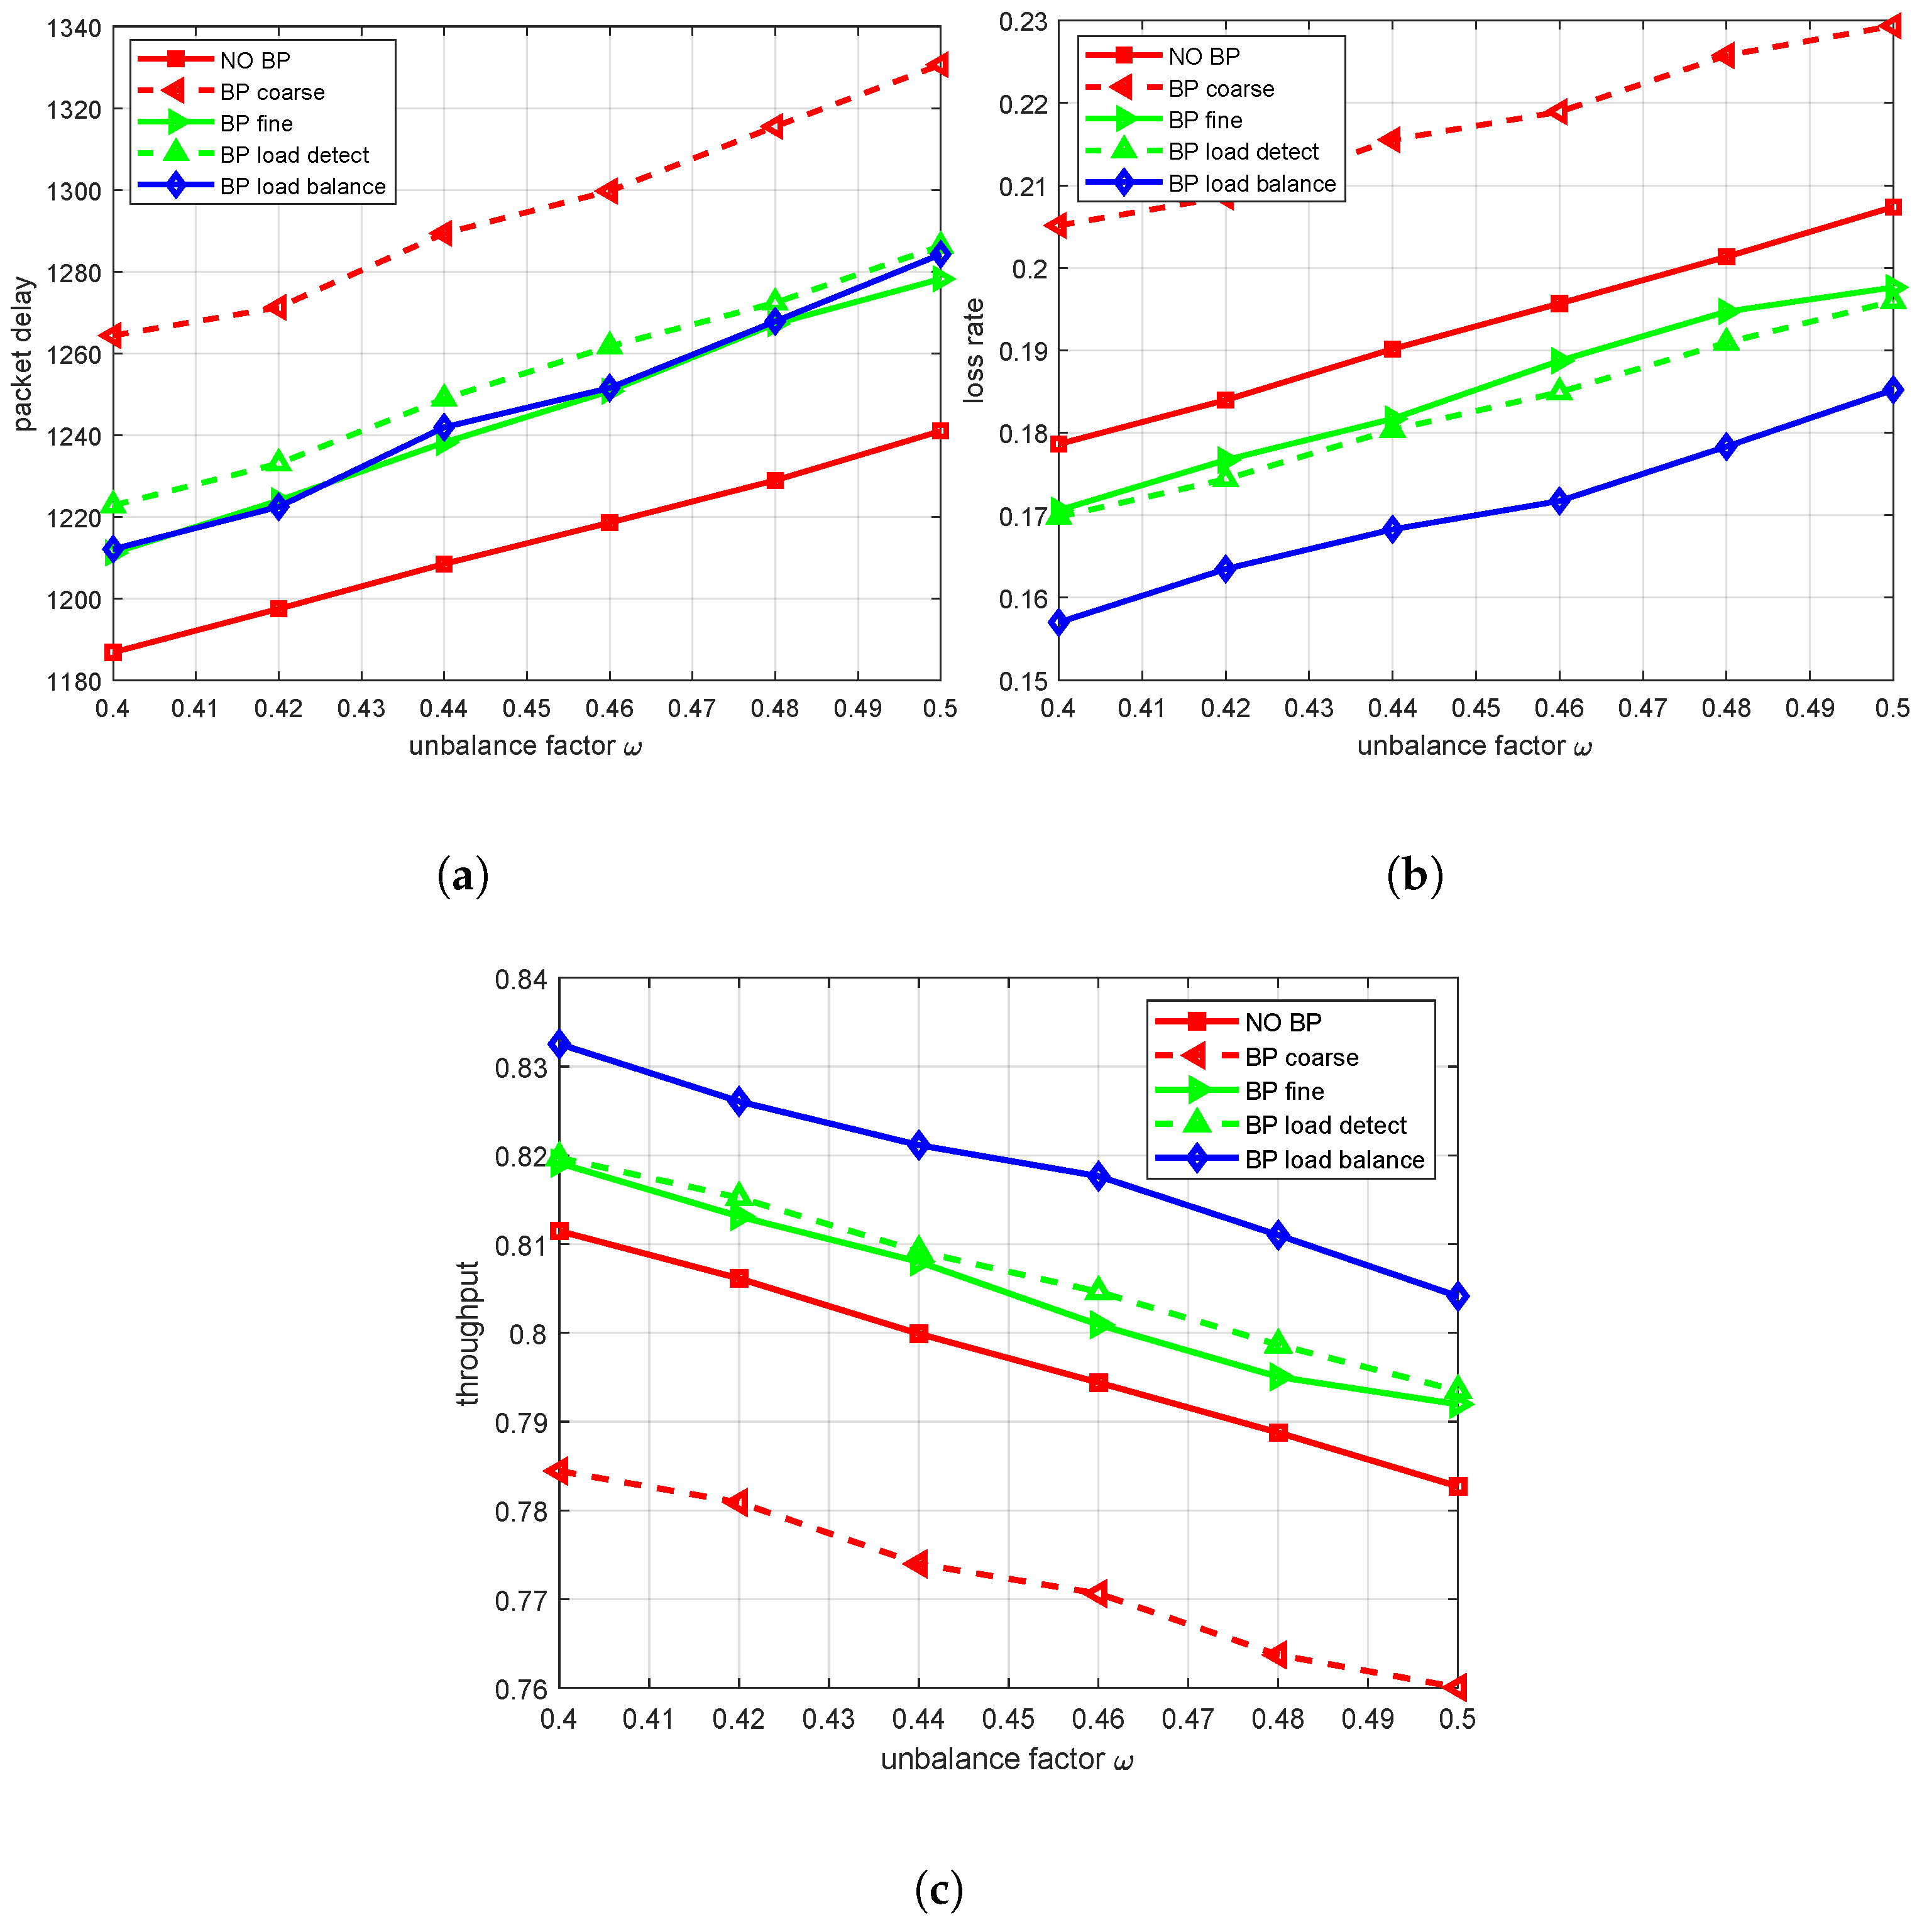
Then, the influence of unbalance factor
on system performance is analyzed. In this experiment, the length of the ON state is 1200 and the length of the OFF state is 800. We first analyze the effects of
on packet delay under different BP mechanisms. With the increase in
, packet delay and the packet loss rate also show an increasing trend. As shown in
Figure 9a, it can be found that in the case of the stochastic scenario, when the imbalance factor
increases, some nodes or links may become congestion points due to the aggravation of the non-uniformity of the traffic distribution, resulting in a longer transmission time of data packets in the network. However, it is worth noting that when the BP mechanism is introduced, the added BP strategy may temporarily slow down the sending speed of some streams when adjusting the system speed, so as to avoid traffic congestion and increase the overall packet delay compared to the no-BP mechanism. Among various BP mechanisms, BP load balance, BP fine and BP load detection mechanisms show lower packet delays, and compared to the no-BP structure, the packet delay is only increased by about 3.2–3.6%. This is because these three strategies can effectively balance the load in the system, avoid the excessive congestion of some nodes or links, and thus reduce the waiting time of packets.
Secondly, we analyze the influence of
on the packet loss rate under different BP mechanisms.
Figure 9b shows that an increase in imbalance factor
will lead to an increase in the packet loss rate. In the case of a high
value, its congestion and overload will be more serious, and packets are more likely to be dropped during transmission. However, after the introduction of the BP mechanism, especially for the BP load balance mechanism, the packet loss rate is significantly reduced compared to that of the no-BP mechanism.
Under the stochastic scenario, when reaches 0.5, the packet loss rate corresponding to the added BP load balance is reduced by 11.9% compared with no-BP. The performance of BP fine and BP load detection is similar. Under the stochastic scenario, the packet loss rate is reduced by about 4% and 5%, respectively, compared to the no-BP scheme.
Finally, we analyze the effects of
on throughput under different BP mechanisms.
Figure 9c illustrates that an increase in the value of
indicates an increase in the non-uniform traffic distribution; that is, some nodes or links are overloaded while others are relatively idle. By observing the actual simulation data, it can be found that under both deterministic and stochastic scenarios, the overall throughput rate of the system will show a downward trend with an increase in
. This is because the non-uniform traffic distribution will cause some key nodes or links to become bottlenecks, limiting the processing capacity of the entire system. When evaluating the effect of different BP mechanisms, the BP load balance mechanism shows good performance in dealing with non-uniform traffic distribution; that is, when
is 0.5, its corresponding throughput rate can reach more than 80%. The performance of the BP fine and BP load detection mechanism is similar. Compared with other mechanisms, the BP load balance mechanism can better deal with the non-uniformity of traffic distribution, so as to maintain a high throughput rate. On the other hand, if no BP strategy is employed, the system may exhibit poor performance in the face of non-uniformity traffic. Notably, BP coarse, which blocks all traffic on the output bus where the overloaded queue resides, yields a worse packet loss performance than even the no-BP scenario due to its indiscriminate nature.
5.3. Comparison of Different Queue Management Mechanisms
Ultimately, a comparative analysis is conducted to evaluate the performance of different queue management mechanisms. In this simulation experiment, several queue management schemes are set up, including fully shared buffering, static threshold management (ST) [
44], dynamic threshold management (DT) [
45,
46], and a no-BP approach. Notably, DT assigns a dynamically adjustable threshold value to each output queue, where this threshold is proportional to the remaining space in the buffer region of each OAM, as delineated by the following formula:
In this formula,
signifies the threshold value, and
is the dynamic threshold parameter, indicating that the buffer threshold is proportional to the remaining space in the shared buffer. According to [
47], an appropriate value of
is 1 for most cases. Therefore, this parameter is also set to 1 in our simulations.
represents the buffer size of a specific OAM, and
denotes the aggregate queue length. In scenarios involving no-BP, since no output queue configuration exists in each OAM, it needs no output queue management considerations.
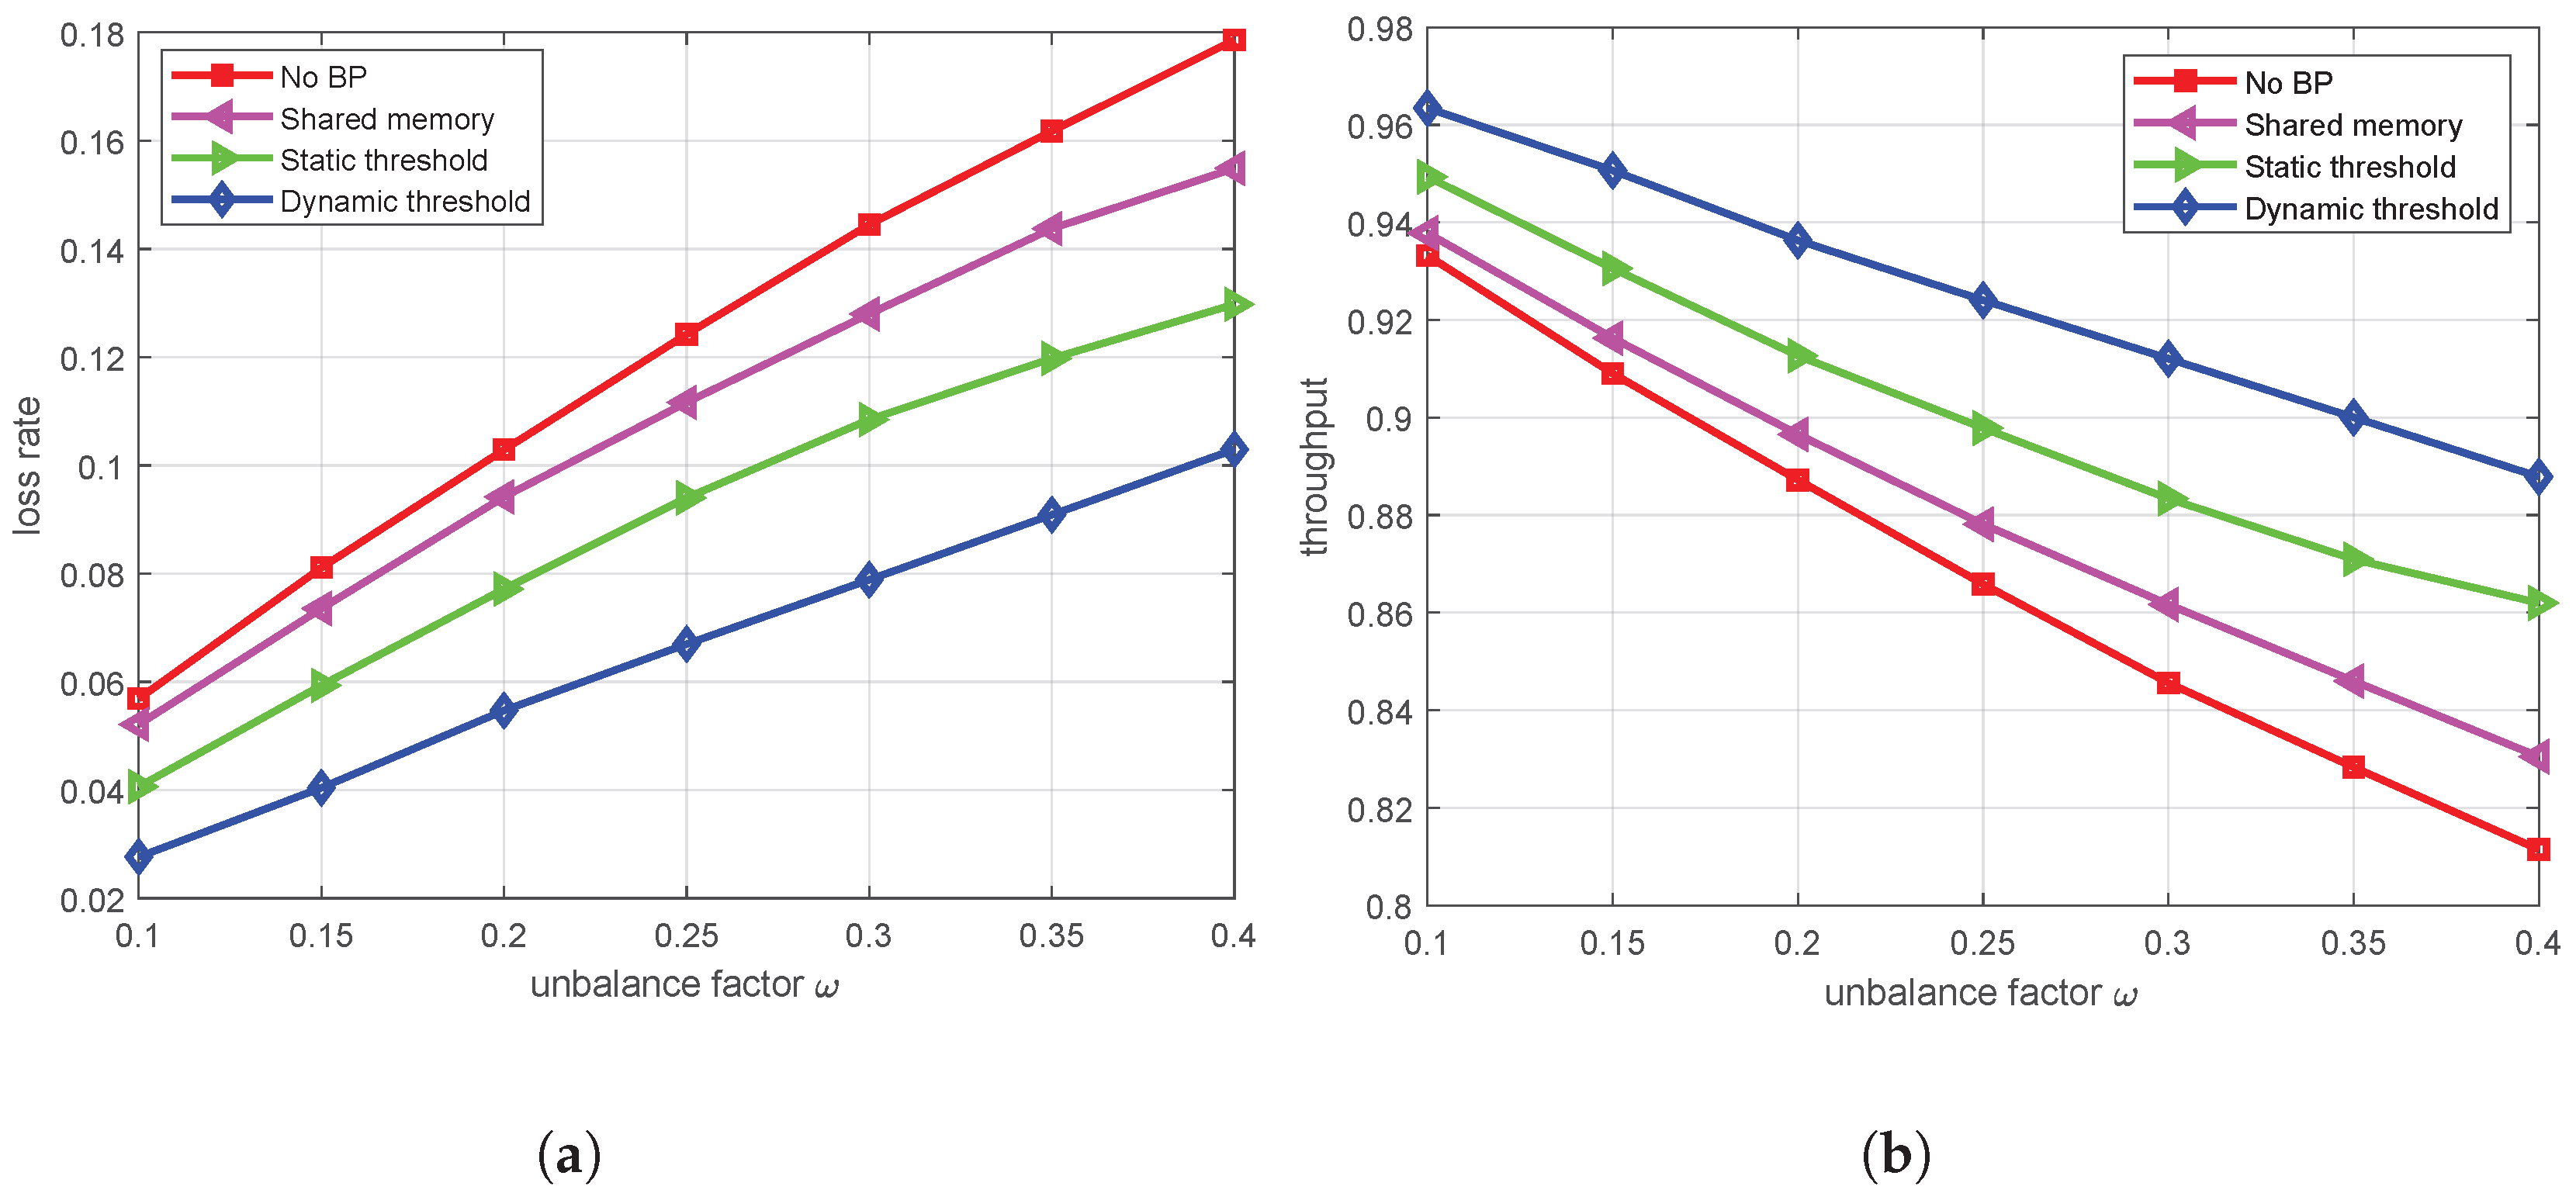
Illustrated in
Figure 10a,b, under disparate queue management methodologies, the simulation results indicate that an increase in
corresponds to increased challenges in buffer management for the system. In contrast, the BP load balance mechanism proposed in this paper, predicated on a dynamic threshold management strategy, demonstrates a superior capacity to govern queue resources through real-time threshold modulation, thus significantly reducing the packet loss rate and achieving high throughput. The findings indicate that, under the dynamic threshold strategy at an
of 0.4, the packet loss rate hovers at approximately 10%, marking a substantial reduction of 44% relative to the strategy of no-BP. At the same time, throughput will reach 89%, which is a 9% performance improvement compared to other BP mechanisms.


