Article

City Diagnosis as a Strategic Component in Preparing Urban Areas for Climate Change: Insights from the ‘City with Climate’ Project

by
Katarzyna Samborska-Goik
,
Marta Pogrzeba
*,
Joachim Bronder
,
Patrycja Obłój
and
Magdalena Głogowska
Institute for Ecology of Industrial Areas, 40-844 Katowice, Poland
*
Author to whom correspondence should be addressed.
Appl. Sci. 2025, 15(8), 4092; https://doi.org/10.3390/app15084092
Submission received: 18 February 2025 / Revised: 3 April 2025 / Accepted: 5 April 2025 / Published: 8 April 2025
(This article belongs to the Special Issue Ecosystems and Landscape Ecology)

Abstract

:

Featured Application

This study focuses on a concise methodology for diagnosing urban areas to identify bottlenecks in water management and pinpoint intervention sites for enhancing retention through nature-based solutions or infrastructural projects.

Abstract

The aim of this study is to present a methodology for diagnosing cities in terms of hydrological and meteorological threats, with the goal of improving water management and helping cities adapt to changing conditions. Urbanisation is expected to progress unevenly across countries and cities, influenced by factors such as climatic conditions, economic disparities, and governance structures. Consequently, urban landscapes should strive for a balanced approach that integrates safety and risk management, commercial spaces, emotional well-being, and the promotion of biodiversity. Cities play a pivotal role in addressing climate change, as they account for a significant share of global energy consumption and greenhouse gas emissions. In Poland, numerous national and international projects are being implemented to help cities mitigate the impacts of climate change. Among these, the City with Climate project aimed to enhance residents’ quality of life while facilitating a pro-climate transition for cities. A holistic and multifaceted approach was adopted, incorporating the analysis of historical flood events based on archival documents and rescue service reports, detailed GIS data such as soil sealing, non-drained basins, NDVI, NDBI, and a multi-criteria analysis targeting hydrological and water management factors to develop effective solutions for urban retention challenges. The main findings indicate that: (1) combining insightful analyses using well-established methods provides a robust foundation for informed decision-making by city authorities; (2) overlaying information layers, such as local flooding interventions, non-drained areas, drainage networks, and soil sealing, helps identify areas requiring large-scale, technical, or nature-based solutions; and (3) regardless of city size, there is a concerning trend of increasing impervious surfaces replacing green areas, alongside urban sprawl altering land use in flood-prone regions, including mountainous, forested, and floodplain areas that should be protected. These findings illustrate that employing a structured project methodology alongside a comprehensive approach can significantly contribute to urban landscape planning, addressing the challenges of climate change while enhancing urban biodiversity through blue and green infrastructure.

1. Introduction

By 2050, the global population is projected to reach 9.7 billion, with nearly 70% residing in urban areas. This demographic shift will be particularly pronounced in African and Asian cities, where an estimated 2.2 billion people are expected to join urban populations. By 2025, half of all cities are anticipated to be predominantly urban in terms of land use [1,2]. Consequently, the future will inevitably depend on sustainable urban development [3]. However, the process of urbanisation will remain uneven across countries and cities due to various factors, including climatic conditions [4,5,6]. On the one hand, megacities with strong economies, centres of education, business services, and technological advancements will continue to attract residents, offering pathways from poverty to prosperity [7]. Additionally, urban areas are seen not only as places of residence but also as hubs for cultural enrichment and well-being [8]. On the other hand, some large cities contend with challenges arising from post-industrialisation, poverty, depopulation, and urban sprawl [9,10]. Nonetheless, the urban decline may be reversed, as suburban areas retain connections to the city, or as residents choose to return to urban cores due to revitalisation efforts and gentrification [11,12].
Not only are urban areas in megacities (cities with at least 10 million residents [13]) or megalopolises (clusters of interconnected and co-developed cities [14]) experiencing rapid growth, but smaller cities and micropolitan areas worldwide are also seeing population increases and shifts in land use patterns [15]. This trend is driven by factors such as relocation or voluntary migration, as exemplified during events like the COVID-19 pandemic [16,17,18,19]. Population growth and land use changes in these areas are facilitated by factors including favourable land prices, well-developed social infrastructure, urban renewal initiatives, improved security, and individual motivations.
Ensuring the safety and well-being of current and future residents is paramount, particularly in smaller cities and regional areas that may have limited access to governmental or external funding for infrastructure development [20,21,22]. To meet these challenges, it is essential to address past planning oversights, upgrade outdated infrastructure, and incorporate future projections into land development practices. These practices must integrate ecosystem services (ES) assessments to enhance decision-making and support the development of more sustainable, environmentally friendly, and climate-resilient landscapes by providing tools and methods and resolving real-life problems [23,24]. A comprehensive ecosystem assessment framework, such as Mapping and Assessment of Ecosystems and their Services (MAES), can equip policymakers and planners with essential tools for designing adaptive strategies that balance socio-economic development with ecological integrity, fostering long-term resilience to environmental change [25,26]. These assessments should encompass detailed GIS analyses, drivers of change, ecological services themselves, and land-use planning [27]. Furthermore, planning must account for the inevitable changes in ecological goods and services driven by climate change. As ecosystems shift, human activities will adapt accordingly, leading to changes in the location of agriculture, recreation, housing, and manufacturing, alongside the implementation of adaptation measures [28]. In the end, MAES supply and demand analyses can be utilised to identify problematic areas requiring intervention. These insights can support the deployment of nature-based solutions to enhance ecosystem resilience and sustainability [24,29].
City authorities, urban planners, and policymakers must create spaces that support emotional well-being and relaxation, providing residents with a sense of refuge [30,31] Neighbourhoods in cities have a profound impact on health and well-being [32,33]. Key considerations for well-designed urban spaces include street connectivity, mixed land use, and access to amenities and services, including places of worship. Additionally, reducing crime, noise, litter, and poor lighting is crucial in fostering safe and liveable urban environments. Consequently, urban land development should strive to achieve a balanced approach encompassing safety and risk management, functional commercial areas, as well as aesthetics, and emotional wellness, as noted by Garnett [34].
Climate change significantly impacts daily life and profoundly influences the hydrological cycle [35,36], including surface water and groundwater systems [37,38,39], posing significant challenges to human resilience [40,41]. These changes necessitate responses through advanced technologies and innovative approaches [42]. Adaptation to climate change has become a critical focus for scientists, practitioners, and policymakers, spurring the development of guidelines and strategies to address impacts at all levels, from individual households to entire cities [43,44,45,46,47]. Climate change undoubtedly alters precipitation patterns, with global average precipitation increasing by approximately 2 mm per decade [48]. The magnitude of extreme precipitation events has also risen, with both wet and dry regions experiencing significant increases in heavy rainfall over recent decades [49]. Furthermore, projections indicate that rarer, more extreme daily rainfall events will become even more frequent due to the atmosphere’s increased capacity to hold moisture as temperatures rise [50,51]. These increasingly frequent and intense rainfall events are a key driver of flash floods. These phenomena in Europe present persistent challenges, posing significant hazards, particularly in mountainous and upland regions. Between 1998 and 2004, over 100 flood events were recorded, leading to significant loss of life and economic damages estimated at EUR 25 billion [52]. Further research by Kundzewicz et al. [53] indicates an upward trend in the frequency of major floods, alongside considerable annual and decadal variability. The European Academies Science Advisory Council (EASAC) also identified global trends in natural disasters from 1980 to 2016, using data from Munich Re’s NatCatSERVICE (NCS), one of the world’s largest databases, comprising over 40,000 entries [54]. Analysis reveals a sharp increase in hydrological events (floods and mass movements) compared to geophysical, meteorological, and climatic events, with occurrences quadrupling and, in some years, even increasing by over 500% [55].
The process of urbanisation has brought about significant changes to the landscape, including an increase in impervious surfaces, hardscapes, and diverse pollution sources as well. These alterations contribute to intensified and irregular runoff patterns as a hydrological response to more frequent and intense rainfall events, as well as increased water contamination [56,57]. Recognising these challenges, many countries are enacting new legislation and policies aimed at fostering more thoughtful stormwater management practices. This shift entails viewing surface runoff not merely as wastewater but as a valuable water resource suitable for non-potable and potable uses [58,59]. Consequently, numerous urban authorities are under pressure to not only regulate the volume and quality of surface runoff but also to implement pre-treatment processes for stormwater before its discharge into water bodies [60]. In this context, the integration of green and blue environmental solutions, akin to acupuncture, in the contamination removal process has become imperative.
Undoubtedly, the world is grappling with climate disruptions and uncertainties in various regions, leading to both economic and human losses, migration, and health challenges. It is essential not to overlook the impact of climate change and urbanisation on mental health, as deteriorating psychological conditions can have profound consequences. Extreme weather events, in particular, can significantly affect well-being, triggering high levels of stress, feelings of peril, and health issues. These impacts are particularly pronounced in urban areas [61,62]. Despite the numerous efforts to prevent and alleviate the repercussions of climate change on urban infrastructure, there remains a gap in addressing how to support residents in coping with the mental health challenges that heighten their vulnerability [63].
Cities play a crucial role in addressing climate change, as they account for a significant portion of global energy consumption and greenhouse gas emissions, with 60% to 80% of energy usage and 75% of CO2 emissions originating from urban areas worldwide [64], cities have been proactive in monitoring emissions and enacting plans to minimise their environmental impact, often integrating sustainable development principles into their urban planning strategies [65]. However, it is imperative to highlight a concerning finding from a report by CDP [66], revealing that only 16% of cities are currently planning green spaces to mitigate climate change and promote biodiversity. Moreover, a mere 14% of cities have established crisis-management strategies, including early warning systems and evacuation protocols. The statistics mentioned underscore the critical need to ramp up efforts in bolstering green infrastructure and enhancing emergency preparedness in cities. Furthermore, positioning cities as pivotal partners for governments in advancing global climate objectives is crucial. Various initiatives, such as the UN Environment Assembly, are instrumental in addressing this imperative. Moreover, organisations like the Coalition for High Ambition Multi-Level Partnerships (CHAMP) are dedicated to fostering close collaboration between governments and cities, states, regions, and other subnational entities in climate action strategies. Additionally, groups like the C40 Cities Climate Leadership Group and the Global Covenant of Mayors play essential roles in supporting cities worldwide in their climate initiatives and sustainability efforts.
In Poland, where the City with Climate project was conducted numerous national and international projects are being undertaken to help cities mitigate the impacts of climate change. Among these initiatives is the development of manuals to guide cities in adapting to climate challenges, offering valuable frameworks for preparing municipal adaptation plans [67,68]. This study focuses on the outcomes of the City with Climate project, which ran from 2020 to 2023. The project aimed to improve the quality of life for residents while supporting cities in their pro-climate transition. Its impact was assessed across five key areas: air quality, urban green spaces, zero-emission transport, energy transition, and urban retention. For each area, a two-stage analysis was conducted that included a detailed diagnosis as part of a strategic consulting process, along with the development of road maps to guide the transition toward climate resilience and urban neutrality. This study focuses on a methodology for diagnosing urban areas to identify challenges in rainwater management and pinpoint intervention sites, such as local undrained depressions, to improve retention through nature-based solutions or infrastructural projects. The objectives of this study are as follows: to develop a methodology for identifying the most vulnerable areas within cities concerning flooding and urban retention; to test this methodology in collaboration with city authorities and stakeholders across different cities; to ensure easy reproducibility through the use of free data and open-source tools; and to present the results as a foundation for further actions, such as the planning of nature-based solutions or the reinforcement or modernisation of existing flood protection infrastructure.
Consequently, this paper specifically elaborates on the diagnosis of urban retention. A holistic and multifaceted approach was employed, integrating historical flood events, detailed GIS data, and multi-criteria analysis. The findings demonstrate that applying a structured project methodology alongside a comprehensive approach can significantly contribute to urban landscape planning, addressing the challenges of climate change while enhancing urban biodiversity through blue and green infrastructure. Moreover, a well-prepared diagnosis serves as a solid foundation for follow-up projects aimed at mitigating adverse impacts. By targeting specific areas and issues, these measures are likely to yield more substantial and focused benefits for cities and their residents.

2. Methods

The initial phase of the city analysis involved gathering archival data on past flooding and extreme hydrological events. Access to a wealth of archival data and scientific sources provided ample information on historical floods resulting from intense rainfall, snowmelt, or riverbank overflow. Given the cyclical nature of certain hydrological events that recur every few decades or centuries and short memory of residents, this data shed sometimes new light on flood-prone areas and the severity of flooding. Furthermore, current data on street and building flooding were collected, drawing from interventions by fire-fighting services. This dataset included the date of the event along with precise coordinates. The effectiveness of this initial phase of analysis may vary, as the availability of archival data on historical flooding and precise coordinates of local flood events is often limited or inconsistent.
The spatial analysis involved localizing non-drained urban basins based on the digital elevation model, flooding prone areas based on the non-drained basins and maps of risk flooding, localisation of impervious and green areas. The following parameters has been also calculated: Landsat Normalised Difference Vegetation Index (NDVI) indicator, ratio of green areas to area of the city, retention potential factor based on green areas, Normalised Difference Built-Up Index (NDBI) in urban areas.
The spatial analysis of the non-drained areas was conducted based on the 5 m resolution digital elevation model. The flood-prone areas were delineated by identifying regions that are not intersected by any natural or artificial drainage systems capable of facilitating water runoff. Limitations of this method include the fact that the digital elevation model (DEM) represents a specific point in time. In areas where dynamic land movement occurs, such as subsidence or ongoing urban development, the DEM may contain inaccuracies. Moreover, urban environments often feature engineered water retention systems or temporary storage areas that may not be captured in the DEM but can still influence surface runoff. Additionally, this method does not account for key hydrological parameters such as soil permeability and infiltration capacity. The inherent errors and resolution limitations of the DEM itself must also be considered.
Additionally, spatial analyses were conducted using data from the Informatic System of National Protection (ISOK), accessible via the information platform. This dataset includes flood risk assessments for events with return periods of 10 and 100 years, respectively. Impervious areas were identified based on the Imperviousness Density 2018 dataset (Raster 10 m and 100 m), downloaded from the Copernicus Land Monitoring Service. Furthermore, the average soil sealing and the intensity of soil sealing were calculated. The main limitation of these methods is data accuracy. Soil sealing data is derived from a dataset prepared for 2018, yet this parameter changes dynamically due to urbanisation and land-use alterations. Additionally, flood risk assessments depend on multiple models and scenario-based simulations, which may introduce uncertainties. The resolution and temporal relevance of these datasets, as well as potential errors in underlying hydrological and climatic assumptions, can further affect the reliability of the analysis.
The primary indicator for the city, in the context of mitigating the effects of severe climate change, is the ratio of green areas to the total city area. The green components used to calculate this index are derived from the following classes of objects within the land cover (LC) category: forested and wooded areas, shrub vegetation, permanent crops, and grass vegetation. This is expressed by the following equation:
g r e e n   a r e a   r e s o u r c e   i n d e x = g r e e n   a r e a s a r e a   o f   t h e   c i t y     100   [ % ] .
The next indicator offers insights into the proportion of green spaces within the urban area. It leverages spectral (remote sensing) data to identify these green areas by analysing a satellite image (Sentinel-2) through a normalised differential vegetation index (NDVI). The indicator is calculated based on the following equation:
g r e e n   a r e a s   i n   t h e   u r b a n   a r e a s = s u m   o f   g r e e n   a r e a s   b a s e d   o n   N D V I u r b a n   a r e a s   o f   t h e   c i t y     100   [ % ] ,
N D V I = N I R R E D N I R + R E D ,
where NIR is canal 8 of the satellite image from Sentinel-2, RED is canal 2 of the satellite image from Sentinel-2. The index calculation involves identifying green areas within the city using Sentinel-2 satellite images and applying the NDVI index with a threshold value of 0.2, which means that all areas covered by vegetation within the city are considered, encompassing sparse greenery such as shrubs and meadows, as well as dense greenery, which includes forests. Whilst the total anthropogenic area in the city is extracted from Corine Land Cover (CLC) data. Anthropogenic areas expressed by CLC code are: 111—dense urban fabric, 112—dispersed urban fabric, 121—industrial and commercial areas, 122—transport areas, 123—ports, 124—airports, 131—open-pit mining sites, 132—dumps and heaps, 133—construction sites, 141—urban green spaces, and 142—sports and recreational areas. The indicator is derived as the average from three satellite images taken during the summer months (June, July, August).
The retention potential factor based on green areas is calculated as:
b i o l o g i c a l l y   a c t i v e   i n d e x = s u m   o f   b i o l o g i c a l l y   a c t i v e   a r e a s a r e a   o f   t h e   c i t y     100   [ % ] ,
The indicator offers insights into the extent of biologically active land that has the natural capacity for retention within the city boundaries. The sum of biologically active areas is determined by combining the following types of land use: surface water, forested and wooded areas, shrub vegetation, permanent crops, grass vegetation, and agricultural crops.
Finally, the indicator for impervious areas is determined based on satellite images (Sentinel-2), with the Normalised Difference Built-Up Index (NDBI) calculated from an equation:
N D B I = S W I R 1 N I R S W I R 1 + N I R     100   [ % ]
where SWIR1 is a shortwave-infrared band 1 and NIR is a near infrared band. This indicator, i.e., NDBI can be compared to the urban areas.
The limitations of the methods used for assessing these indicators arise primarily from the resolution and temporal constraints of satellite data. The spatial resolution of Sentinel-2 imagery may not capture small, narrow, or fragmented green spaces, such as street trees, small urban parks, or green strips along roads. Additionally, the temporal resolution is restricted to the summer months (June, July, and August), which may not fully represent vegetation dynamics throughout the year. Increasing occurrences of drought during summer months can lead to vegetation stress, altering NDVI values and causing certain green areas to appear dormant or less extensive than they actually are. Moreover, vegetation located on vertical surfaces, such as green walls, rooftop gardens, and facade plantings, is often overlooked in traditional satellite-based assessments. Furthermore, the classification of urban green spaces relies on predefined thresholds (e.g., NDVI ≥ 0.2), which may not be universally applicable across different climatic regions or vegetation types. Seasonal variations in vegetation phenology, soil moisture content, and local environmental conditions further influence classification accuracy.
One of the outputs of the City with Climate project, was a ranking of the city’s sub-areas/districts according to their vulnerability to climate change and thus the need for urgent adaptation and prevention measures. The ranking is based on a multi-criteria analysis. Performing a multi-criteria analysis for the assessment of the spatial units of a city, in terms of their vulnerability to hydrological risks, requires the following steps:
  • Division of the city area into spatial units;
  • Selection of assessment criteria;
  • Collection of data for the calculation of criterion values;
  • Selection of weights for individual criteria;
  • Calculation of criterion values and their normalised values;
  • Calculating the products of the normalised criterion values and the weights of a criterion;
  • Calculating the sum of the products and performing the ranking of the spatial units;
  • Drawing up a table and map composition.
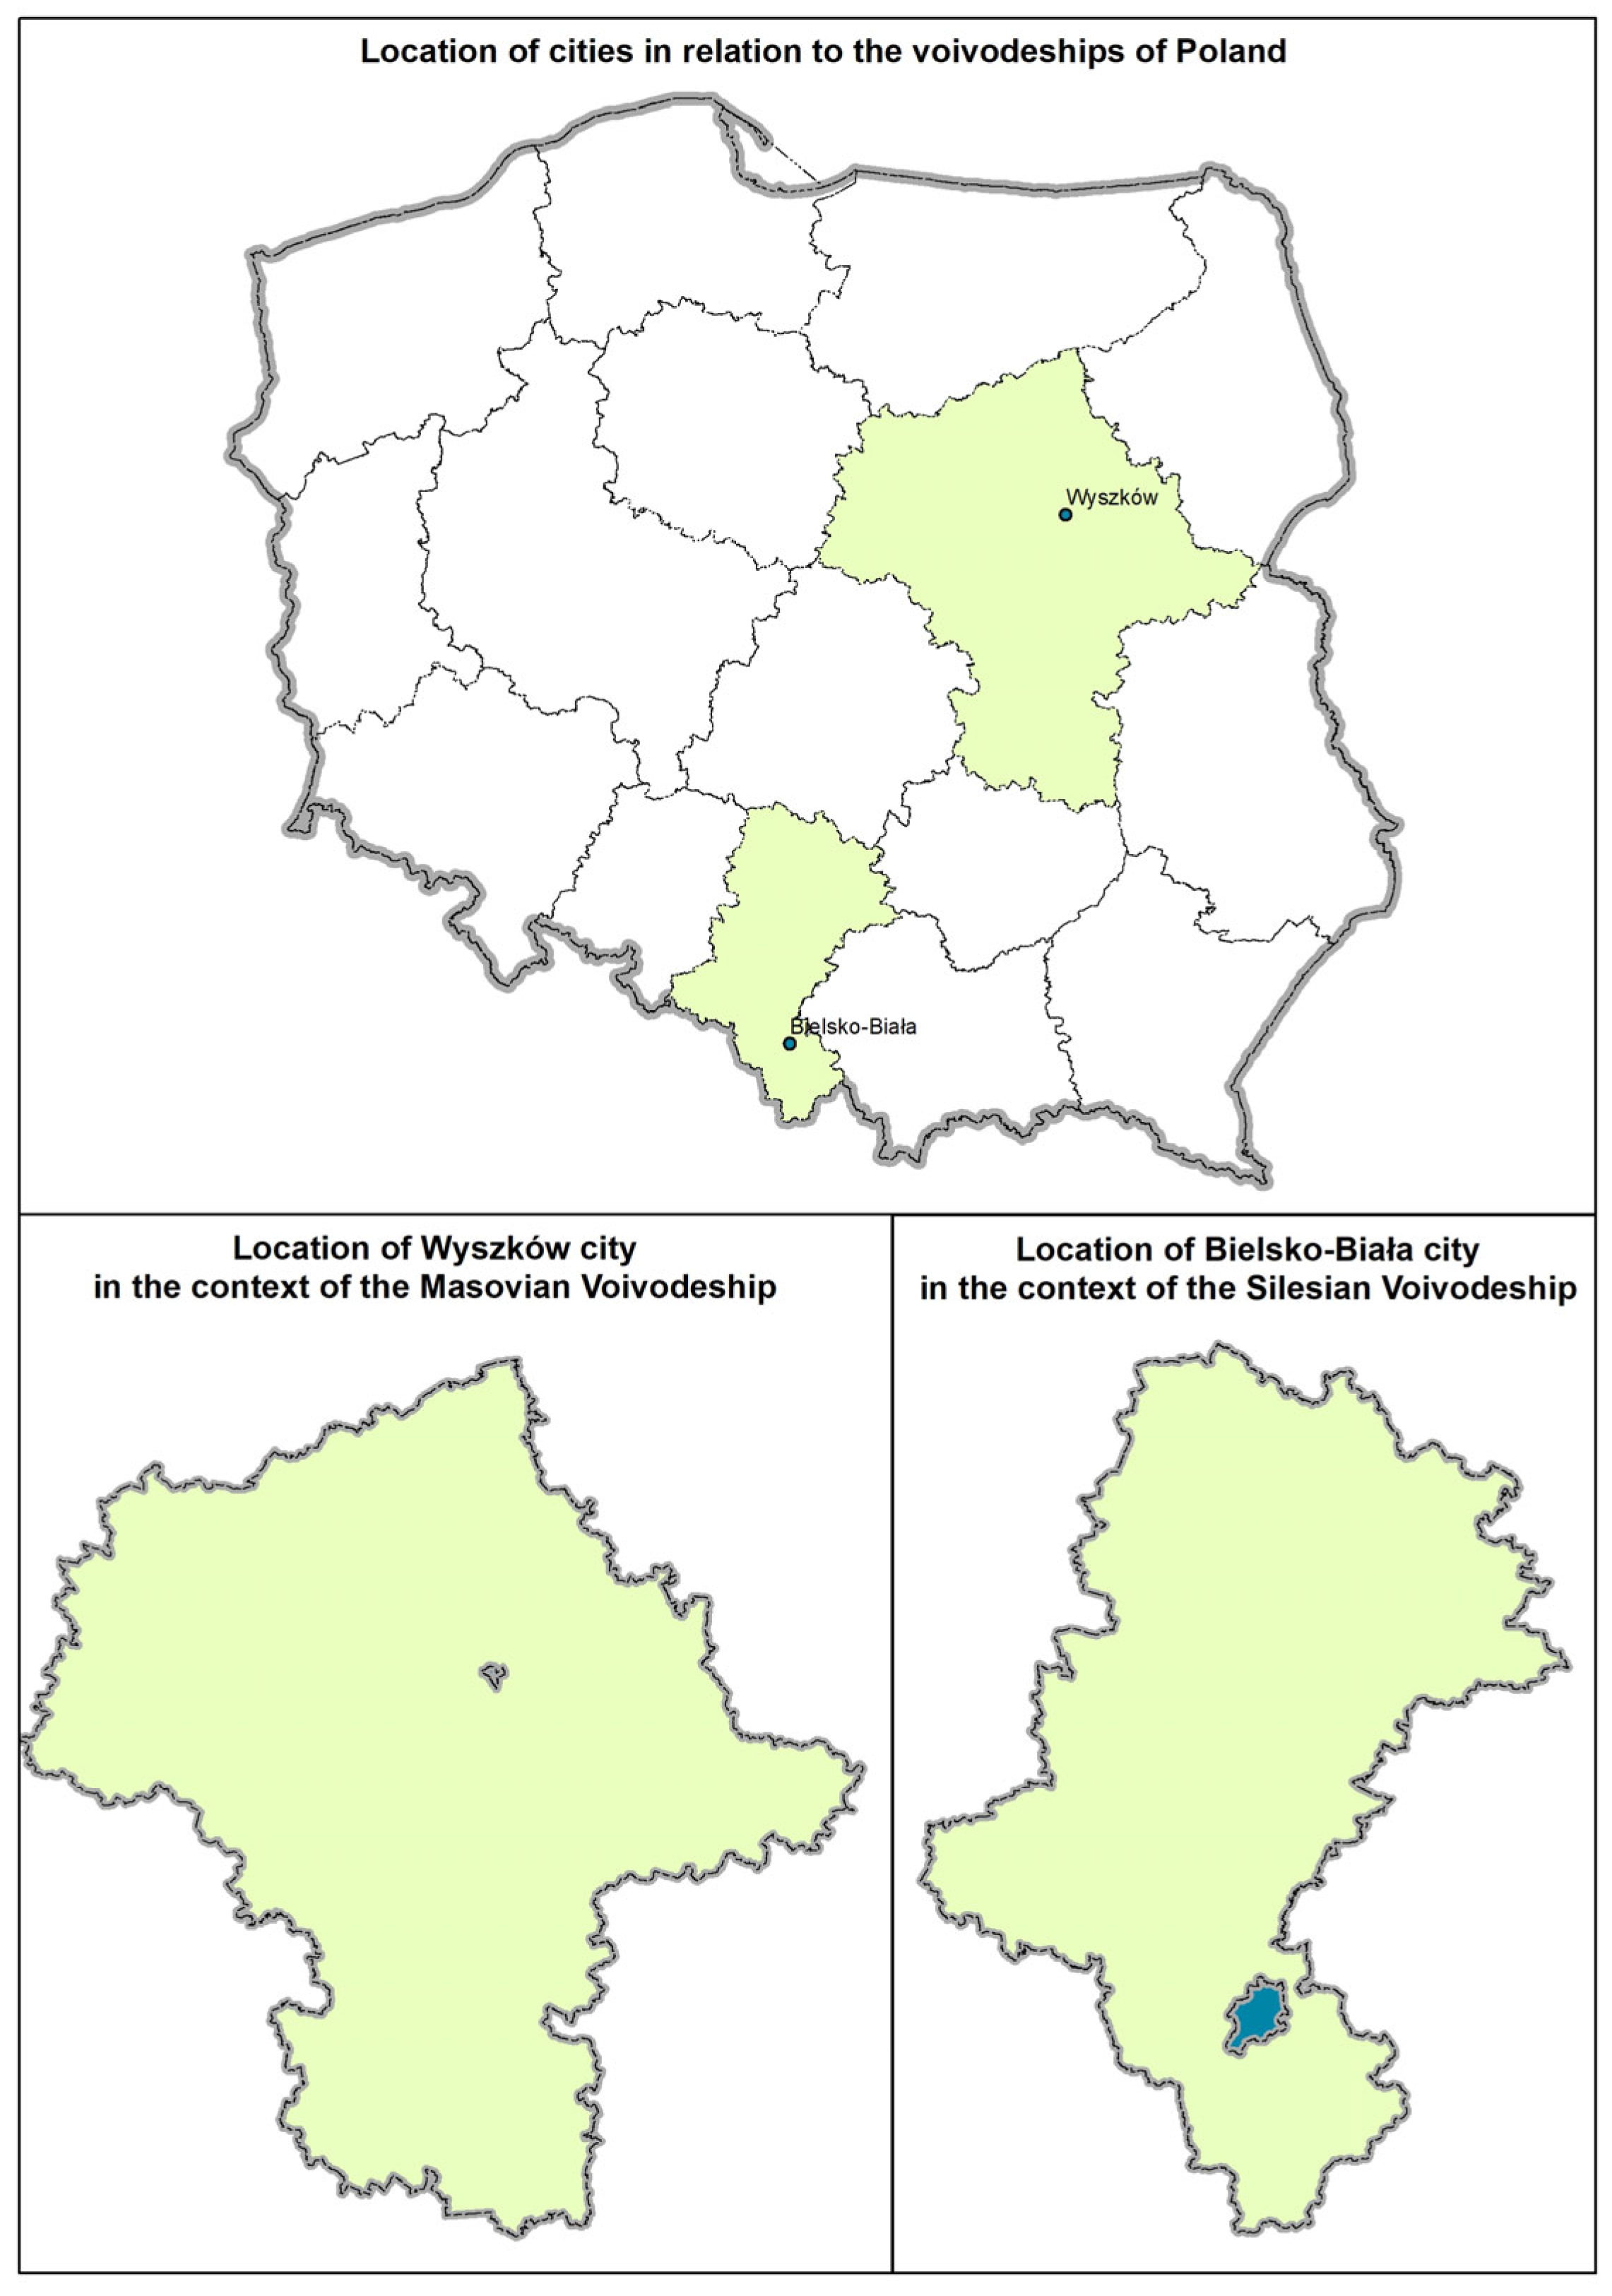
In Table 1, the criteria taken into account for a multicriteria analysis focusing on hydrological threats have been included. The choice of criteria was based on expert knowledge of the most important factors affecting urban water runoff and retention within the city, as well as the availability of data. Some data, such as digital maps of combined or rainwater networks, were not accessible for certain cities. Additionally, parameters obtained during the project, such as the average runoff value, were considered in the selection process.
The main advantages of the adapted multi-criteria method lie in its site-specific nature and flexibility. Experts and stakeholders can determine the most relevant parameters influencing urban water management based on local conditions, ensuring that the analysis is tailored to the unique hydrological and environmental challenges of each city. This method effectively integrates diverse spatial datasets, including historical flood records, GIS-based environmental indicators, and urban infrastructure data, to provide a comprehensive assessment. Ultimately, it identifies the most vulnerable areas where immediate action is required or where changes in land use are inevitable. By combining expert knowledge with data-driven insights, the approach supports informed decision-making, prioritising interventions that enhance urban resilience and sustainable water management. However, the choice of criteria significantly influences the ranking of vulnerability. If key factors such as soil permeability, drainage infrastructure, or socio-economic resilience are omitted, the analysis may provide an incomplete picture. Conversely, including too many criteria can introduce redundancy and dilute the impact of critical factors. Additionally, assigning weights to criteria is a process based on expert or stakeholder judgment, making the analysis inherently subjective. Different stakeholders may prioritise certain factors over others, leading to variations in the assessment outcomes.
Critical to the multi-criteria analysis was the estimation of the weight of the criterion, which was averaged based on the judgement of the water group experts. It is essential to highlight that the data utilised for the analyses were freely available. The spatial vector data were sourced from the Polish geoportal, encompassing information on land cover (land use), buildings, river and stream networks, boundaries of cadastral districts, city boundaries, and statistical district boundaries. The flood hazard and flood risk data were acquired from the Informatic System of National Protection. Information on local floods was gathered from municipalities based on firefighting service interventions. The digital elevation model raster data were sourced from the Polish National Geoportal. Additionally, raster data sources included satellite images from Landsat 8 (USGS) and Sentinel-2 (ESA), as well as Imperviousness Density 2018 accessible through the Copernicus Europe Eyes On Earth platform. Apart from raster and vector spatial data, basic statistical data such as population figures were obtained from the local database of Polish statistics. Figure 1 presents a simplified diagram illustrating the approach to diagnosing urban areas for climate change adaptation, with a particular focus on the city’s hydrological regime and conditions. The upper part includes analyses of archival and modelled flood data (caused by rainfall and riverbank overflow), GIS studies, and multi-criteria analysis. The lower part outlines the activities undertaken within the framework of these analyses, as detailed in the methodology section.

3. Study Area

This study pertains to two Polish cities: Bielsko-Biała, located in southern Poland, and Wyszków, located in central Poland (Figure 2). Both cities differ in terms of size, population density, and hydrography. However, the authorities of both regions are committed to transforming their cities into more resilient and green areas. They are aware of environmental issues and the need for adaptation, although they lacked the data necessary to make informed decisions on where and what kind of actions are most needed.

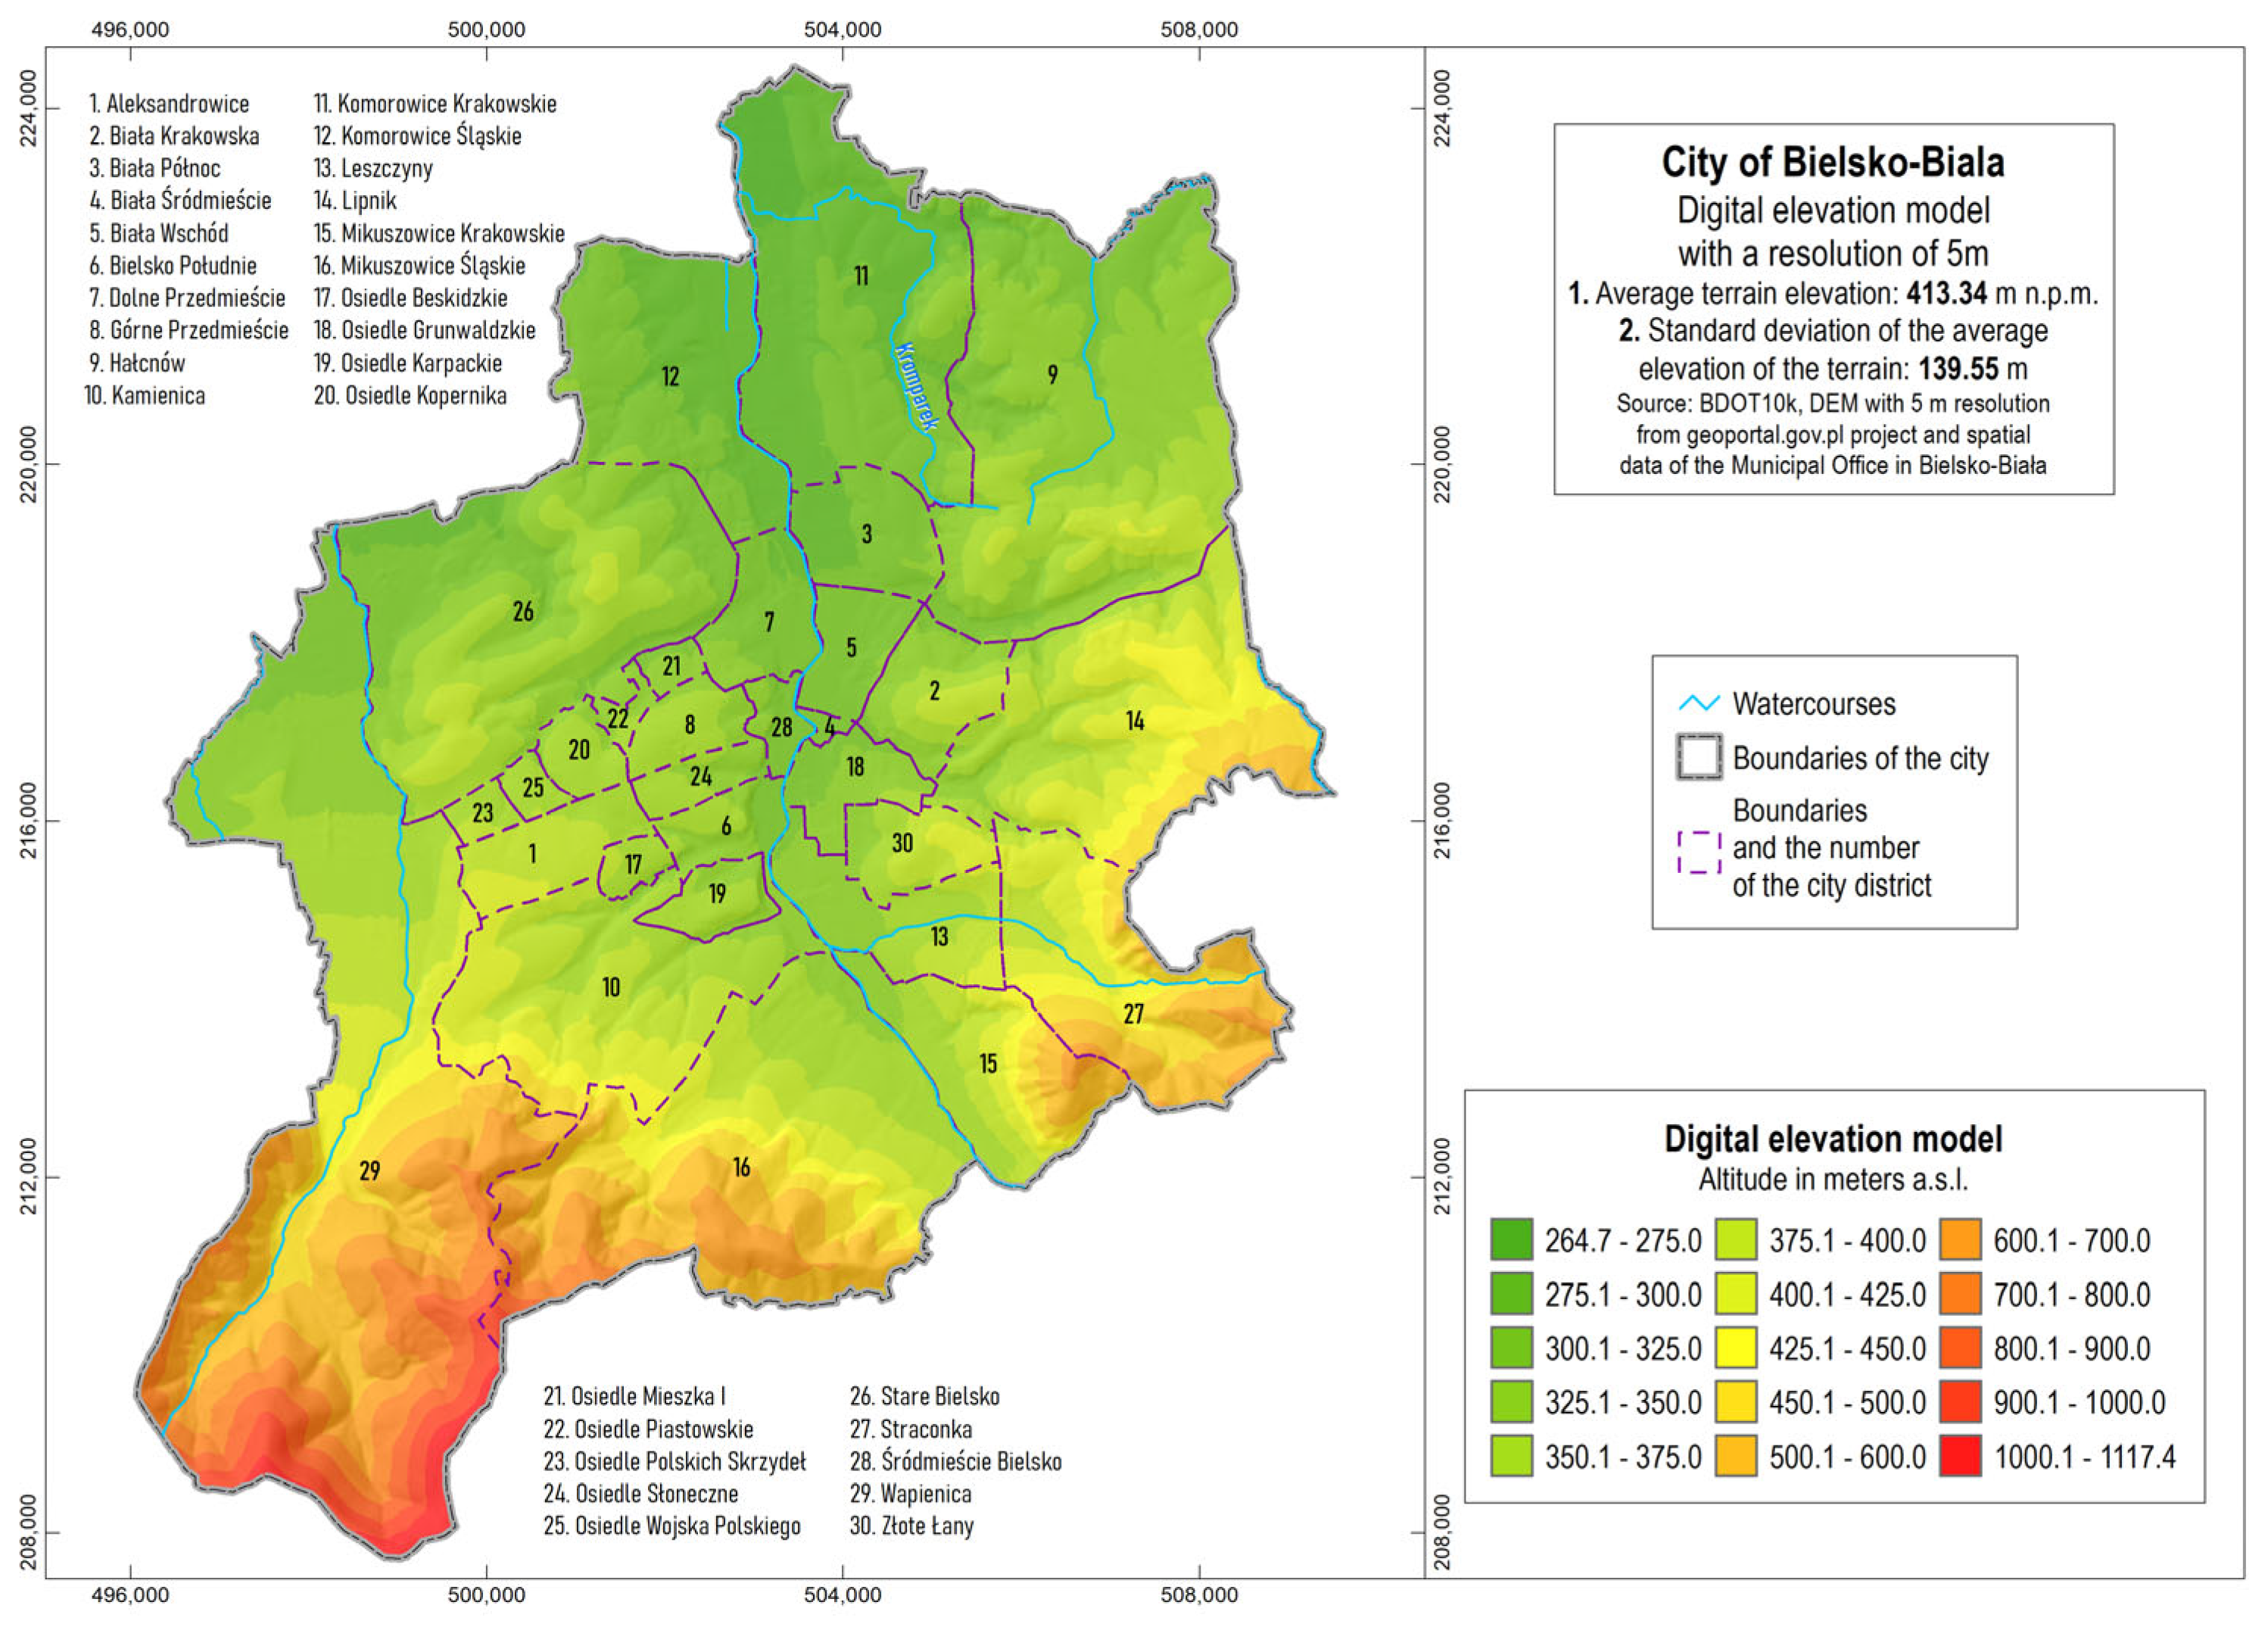
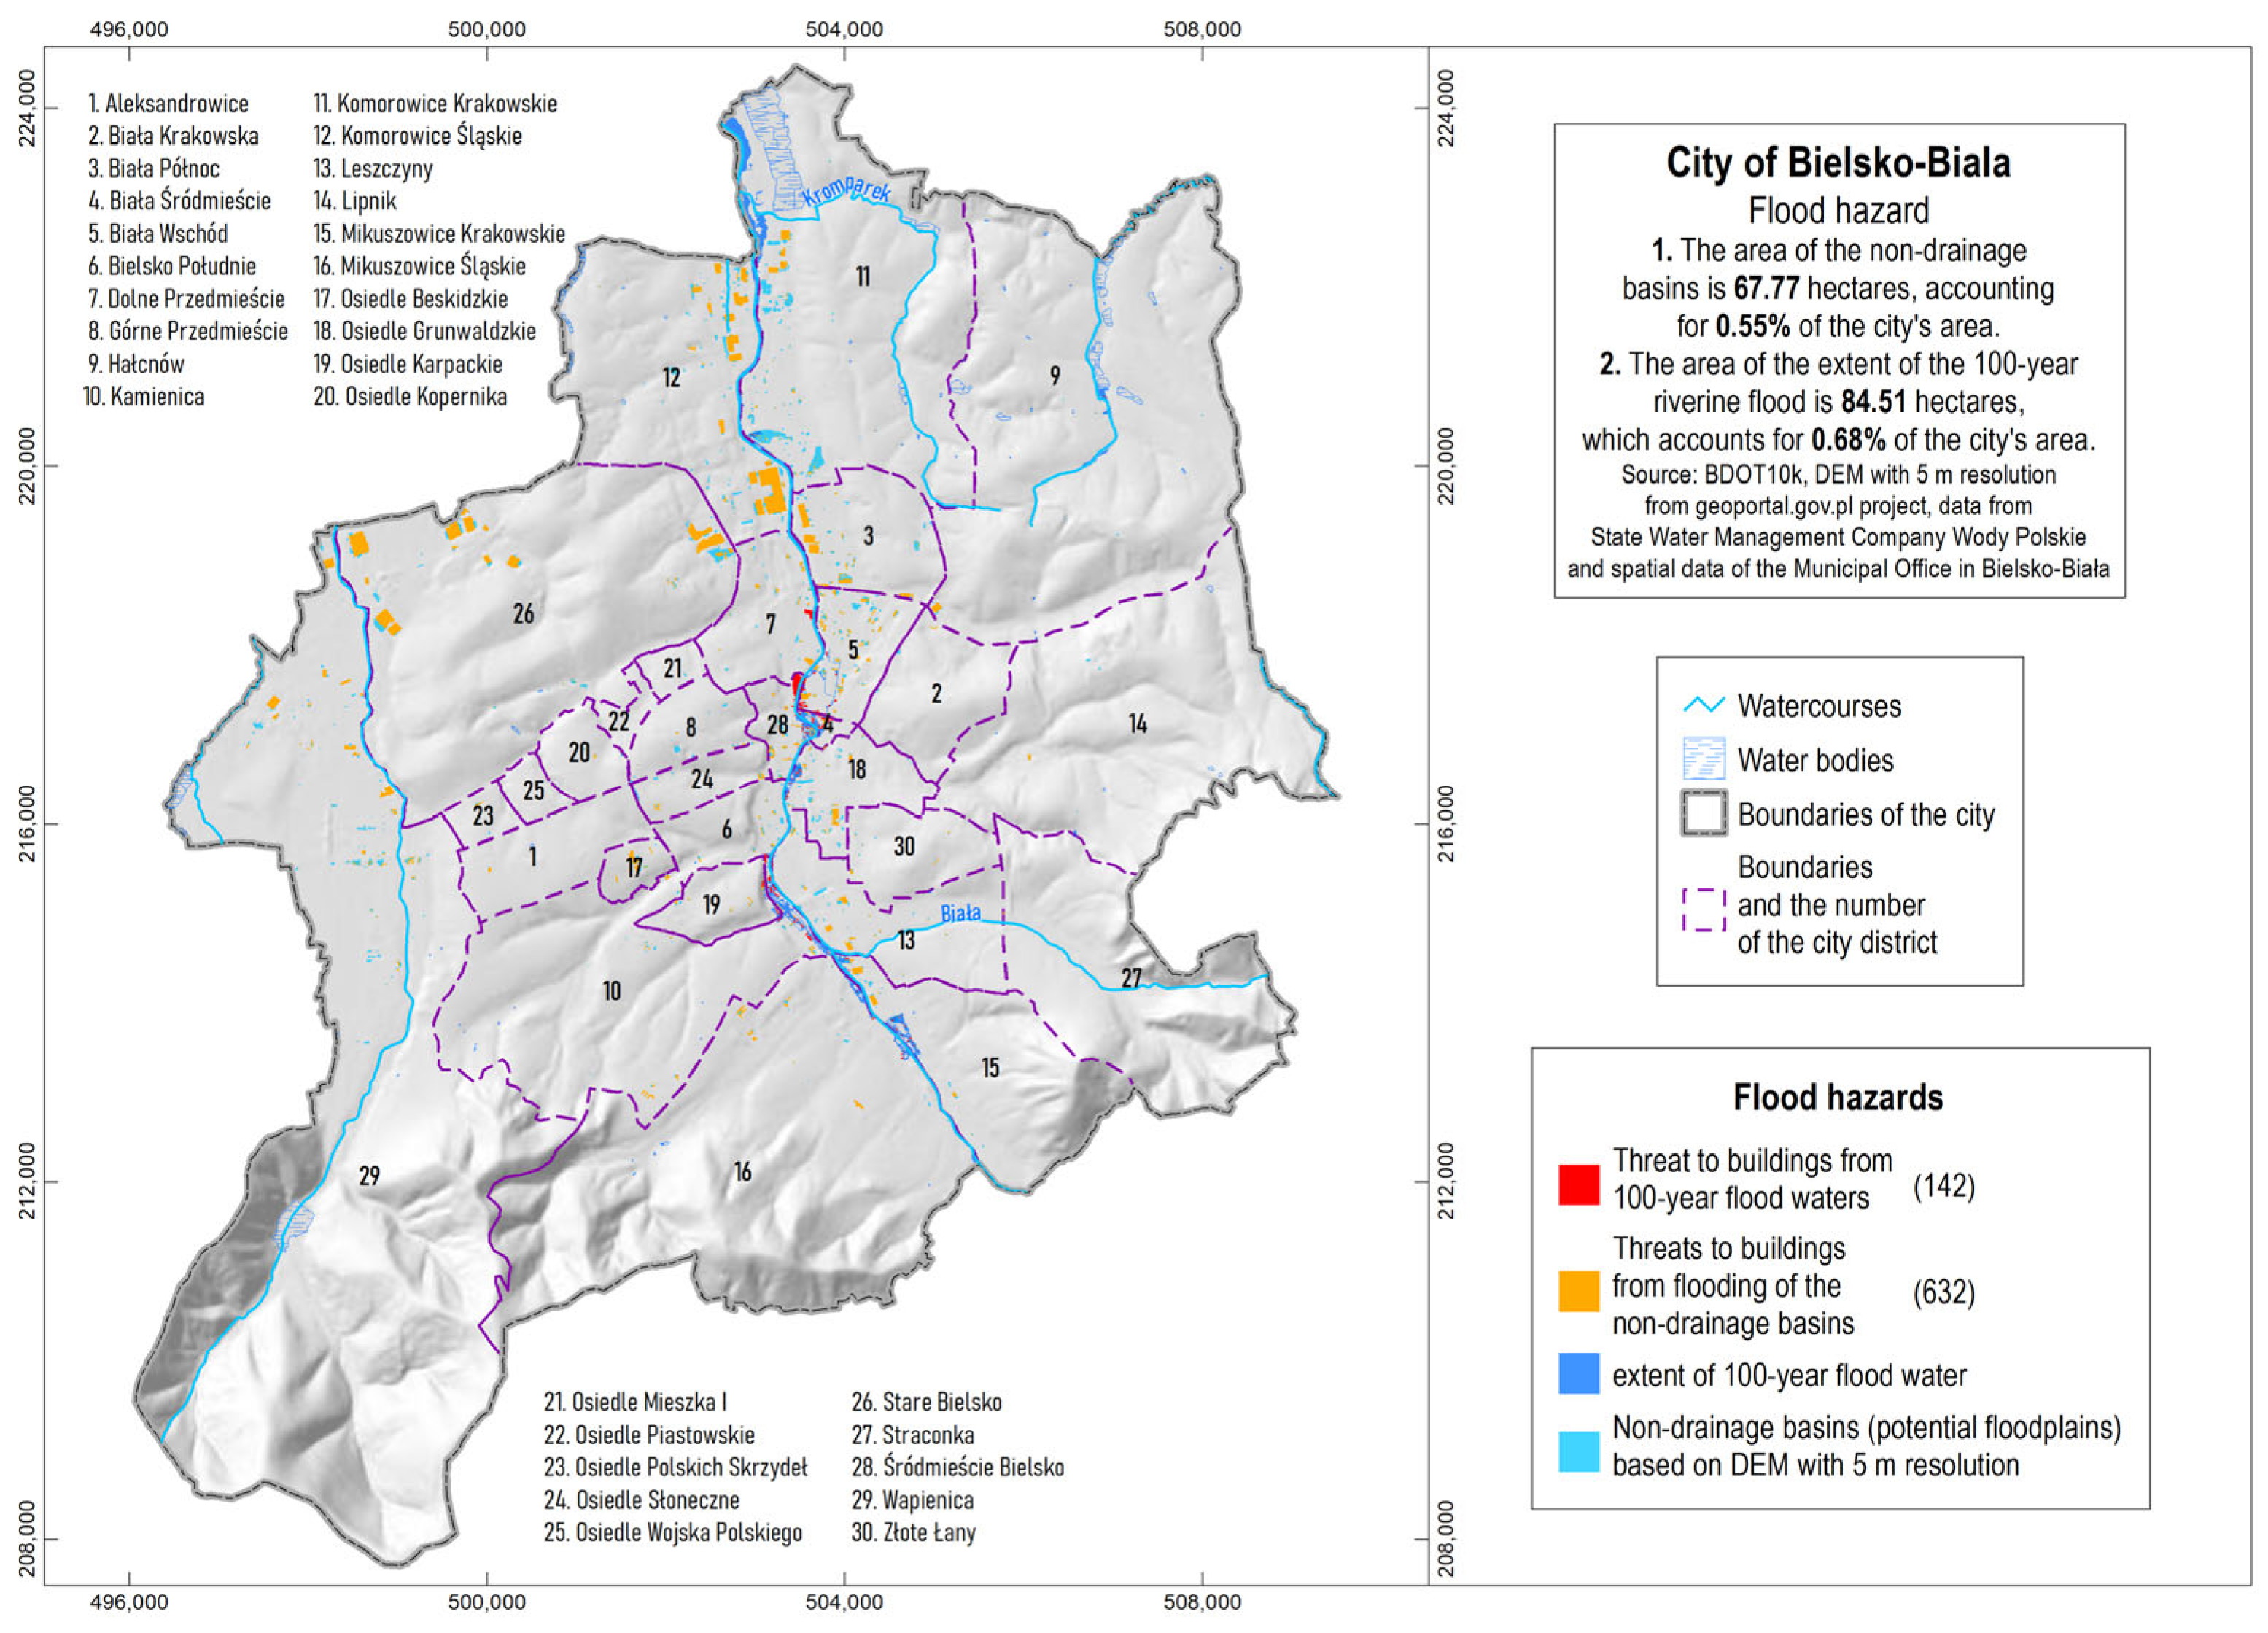
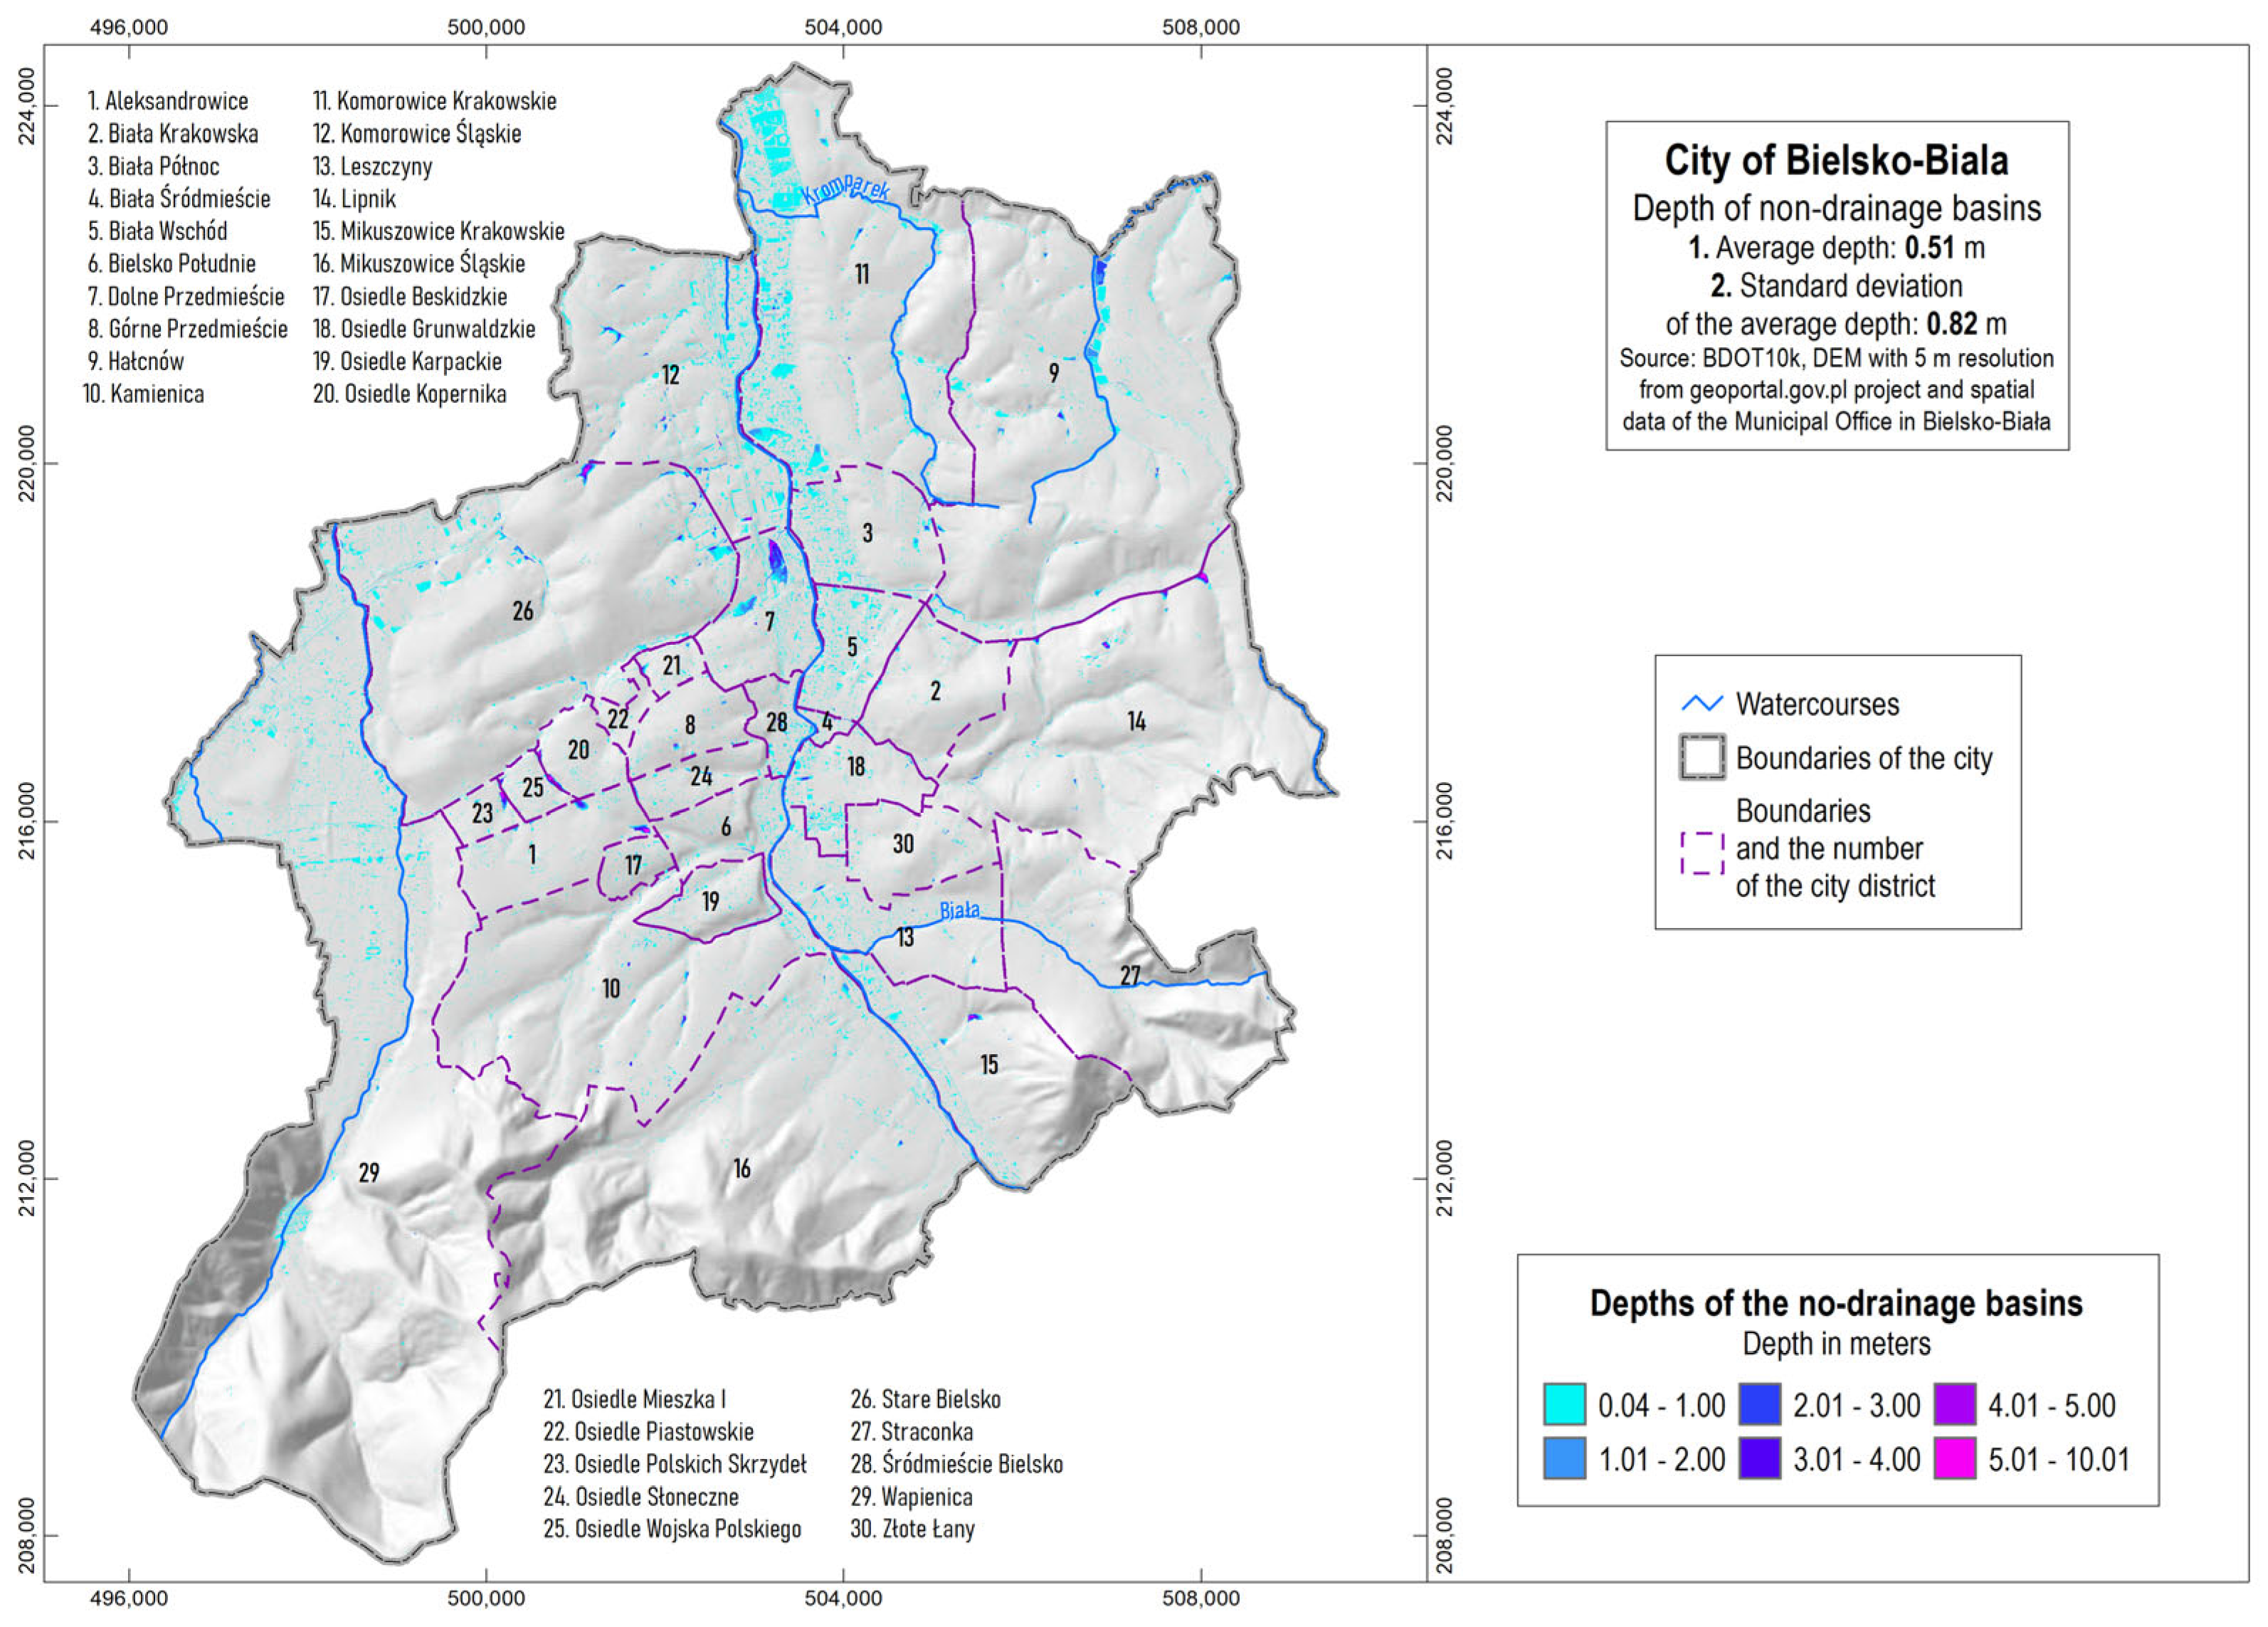
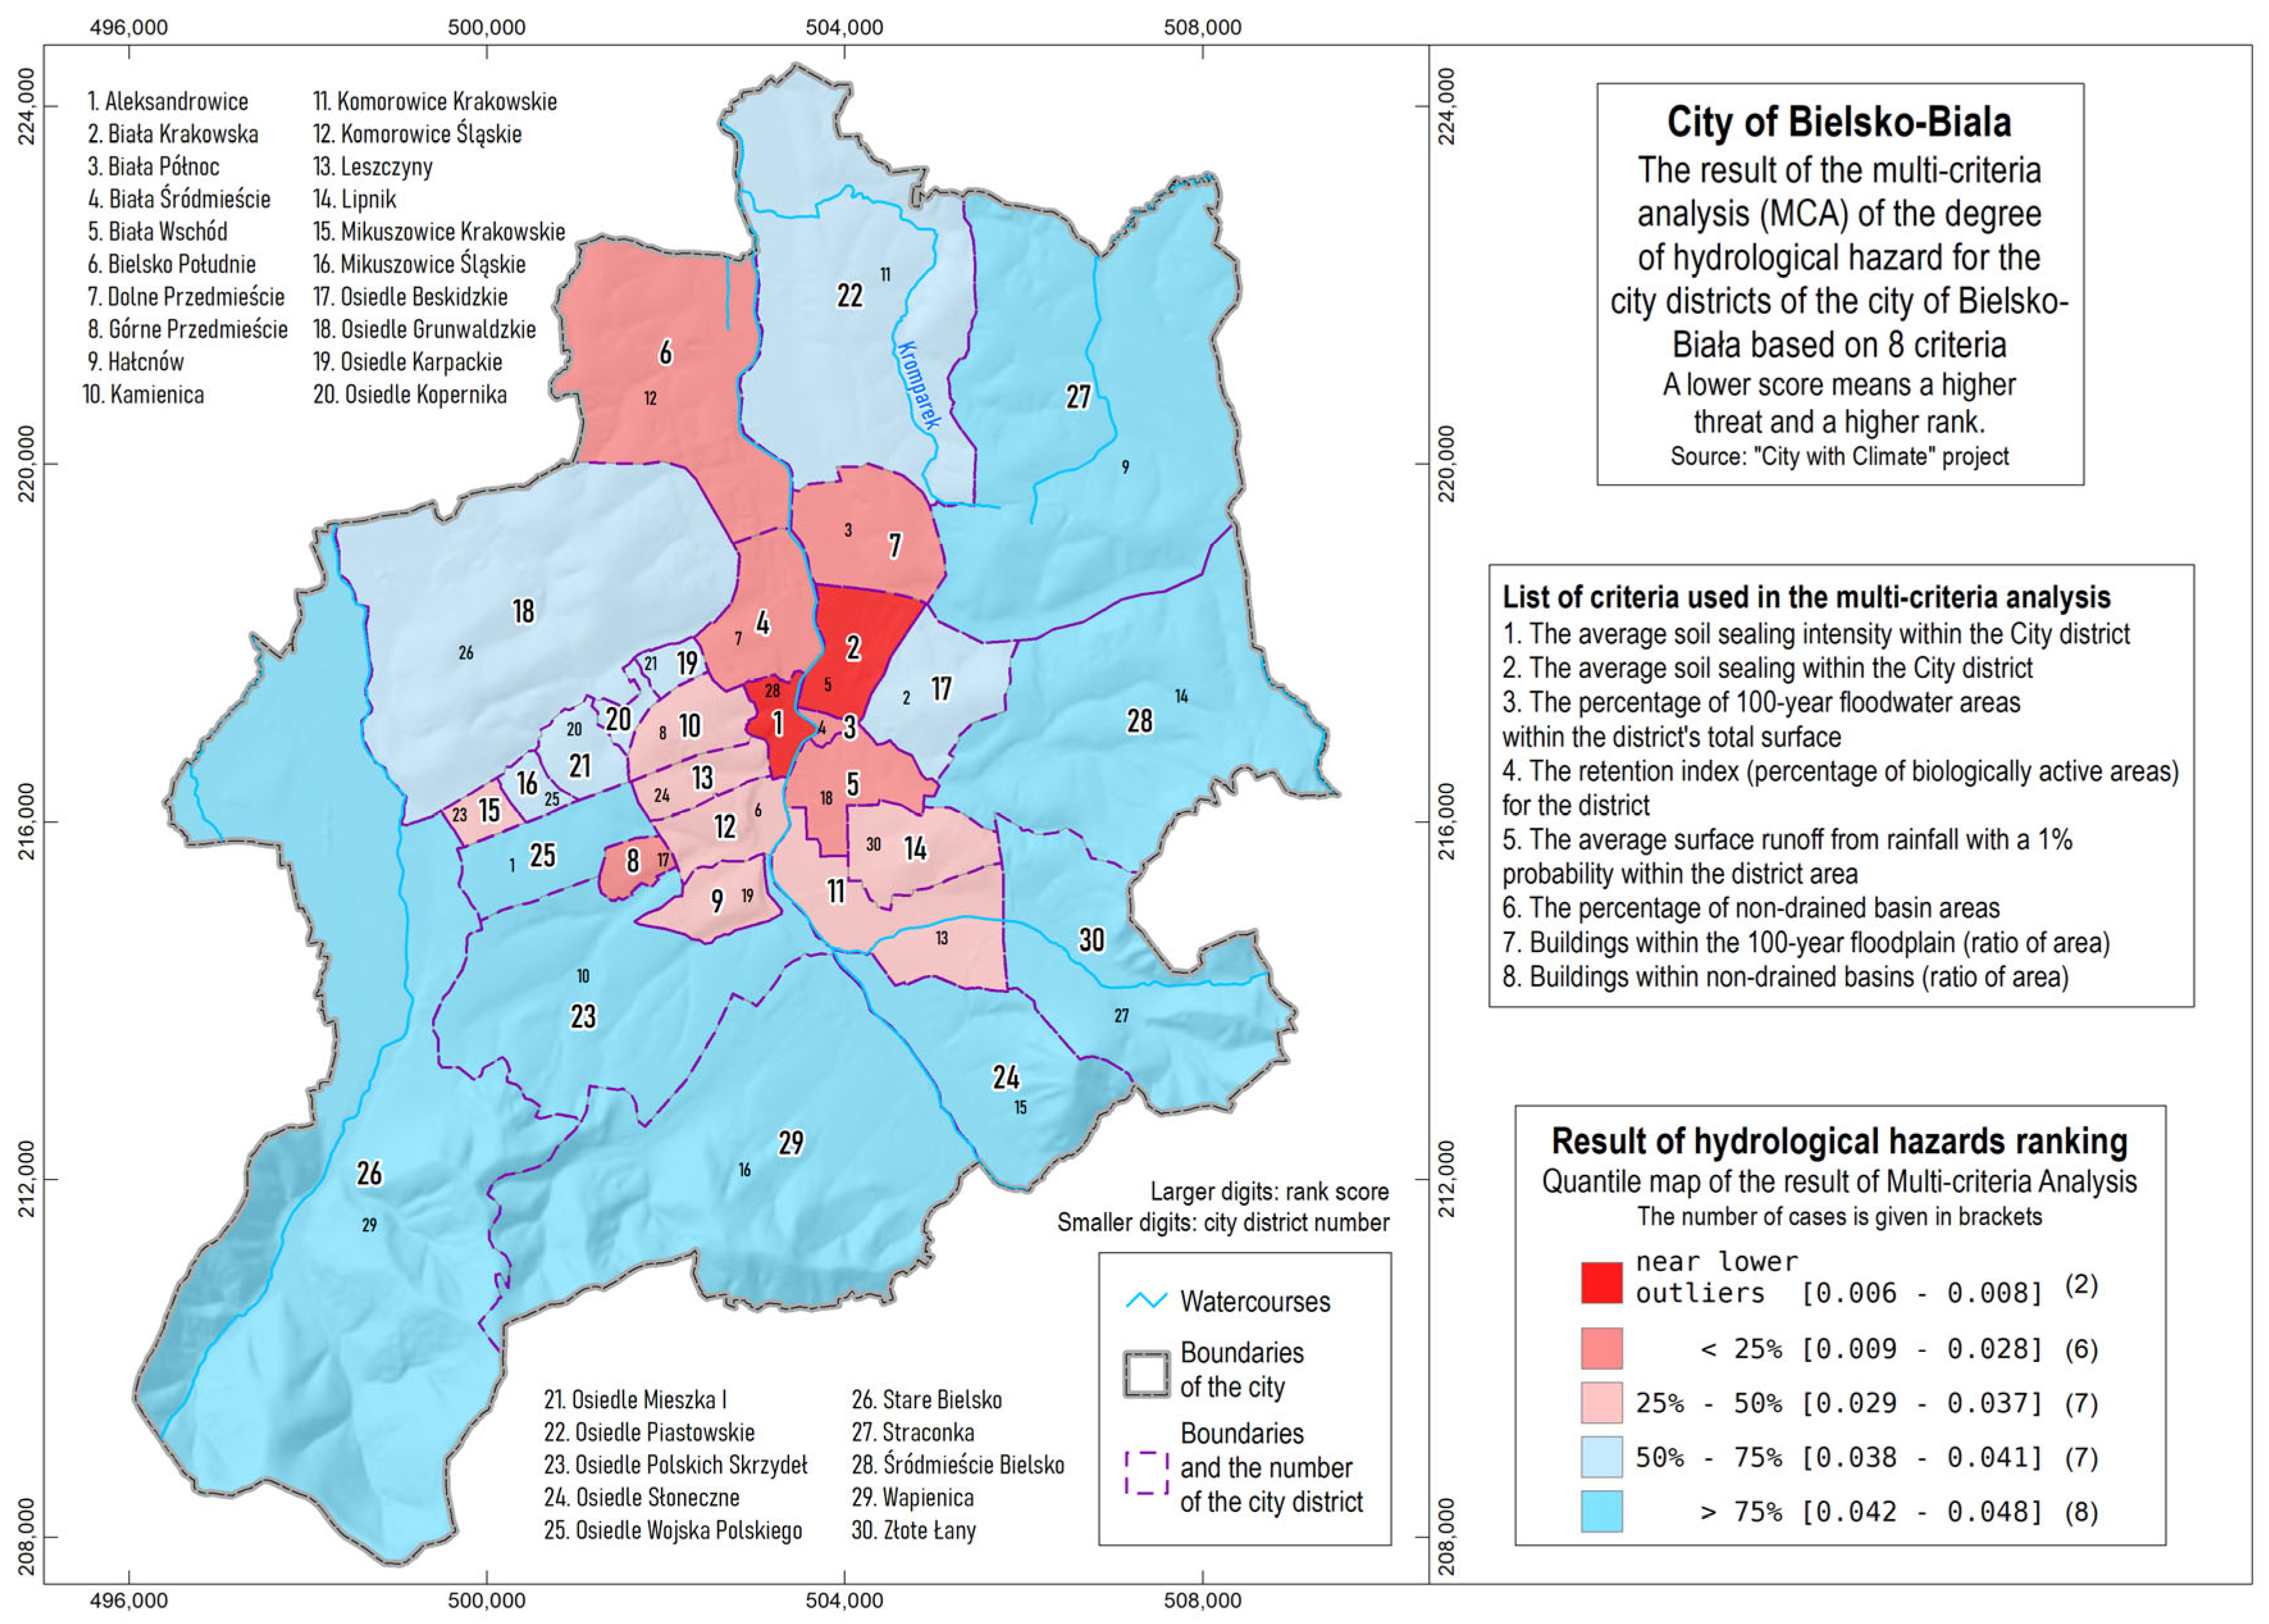
3.1. Bielsko-Biała City
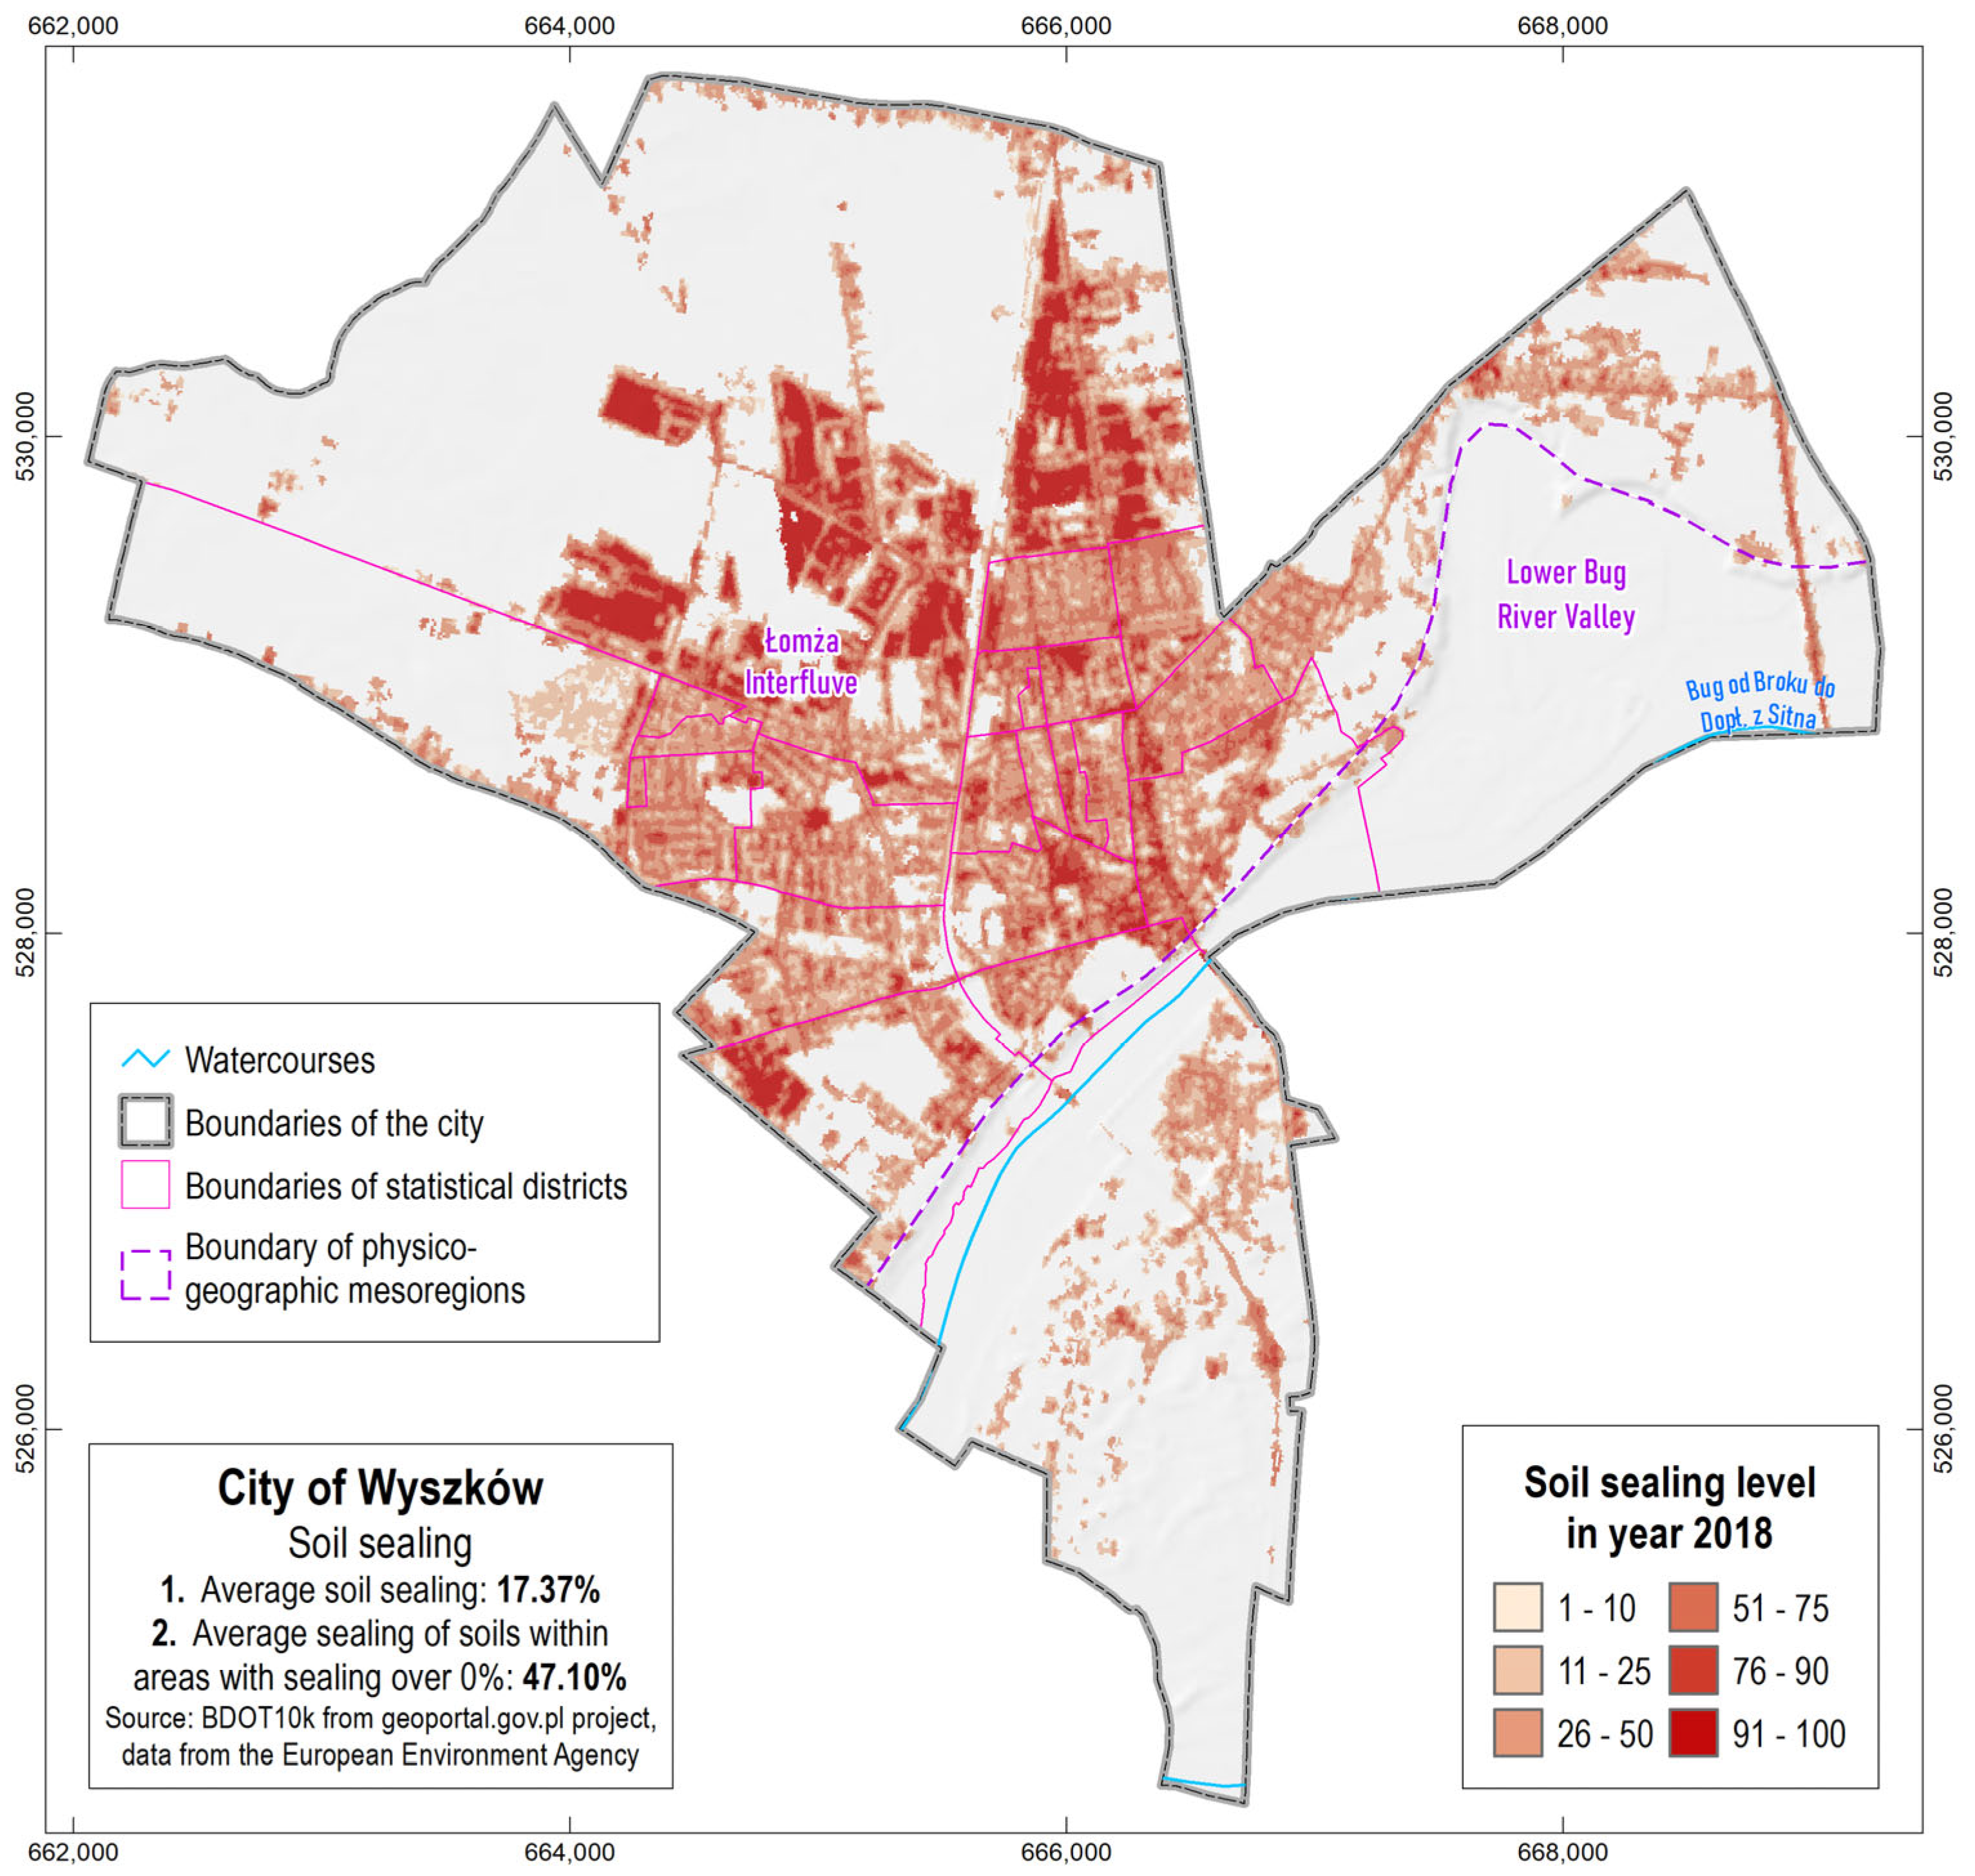
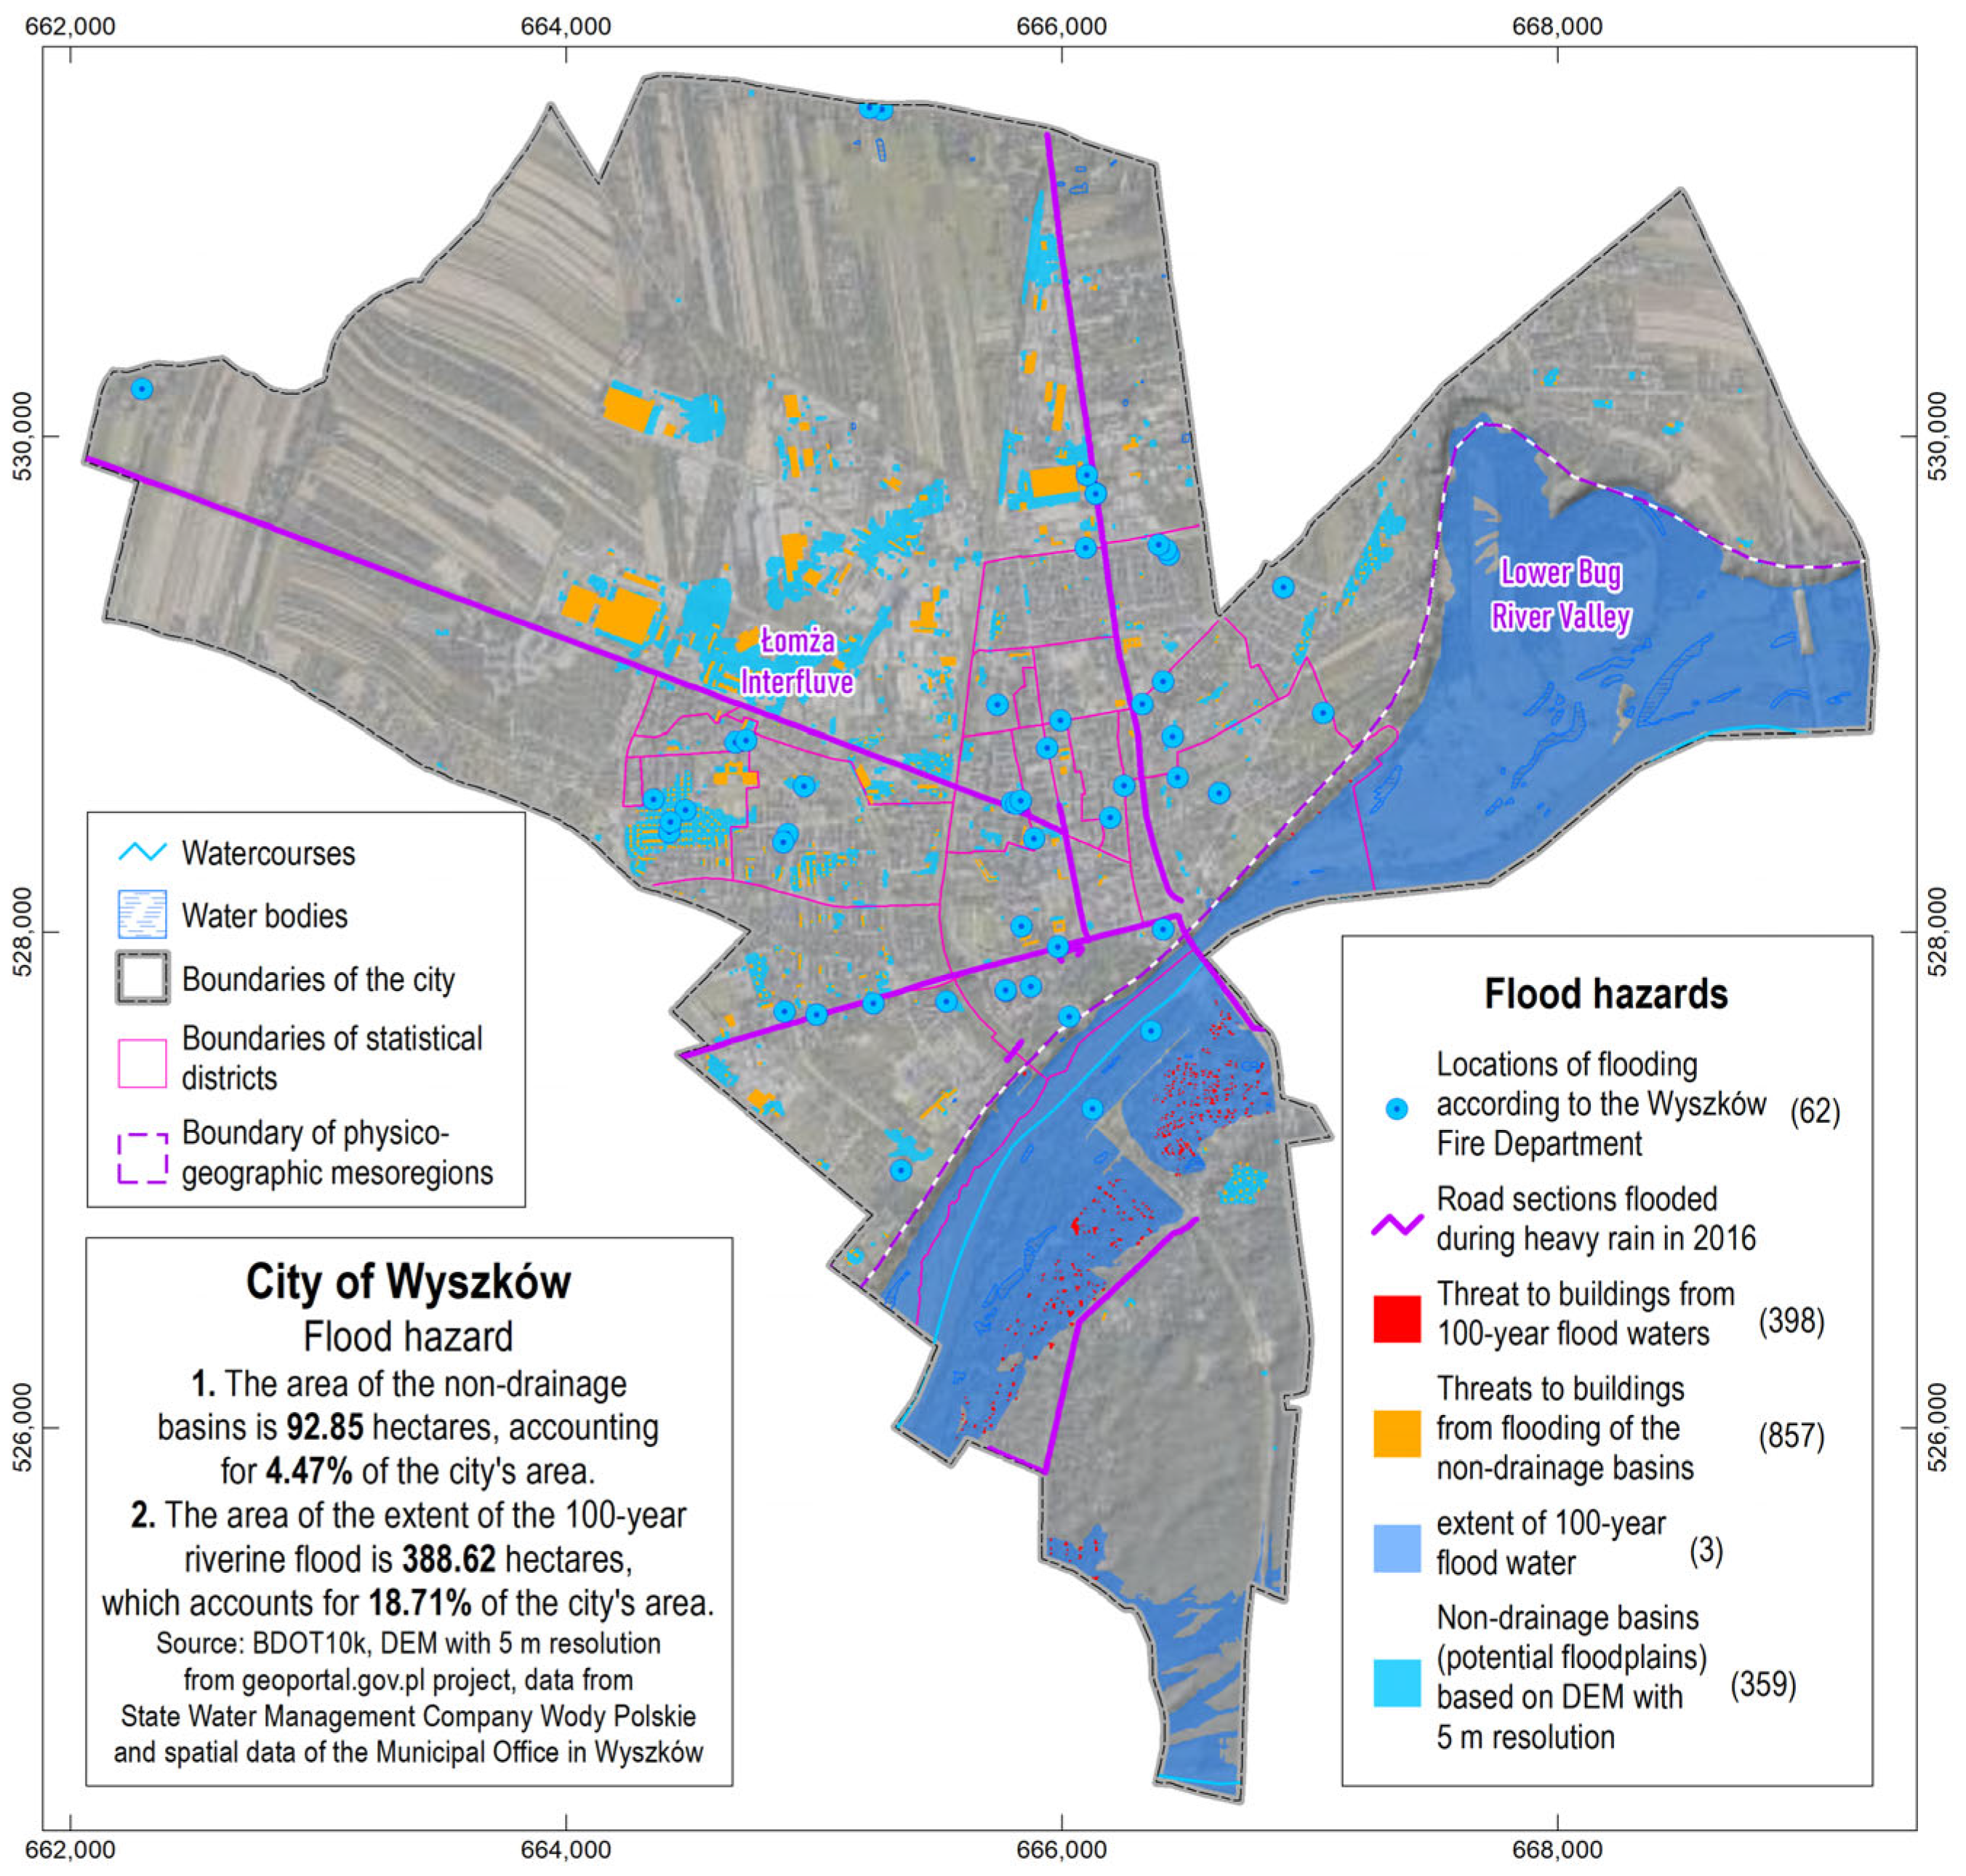
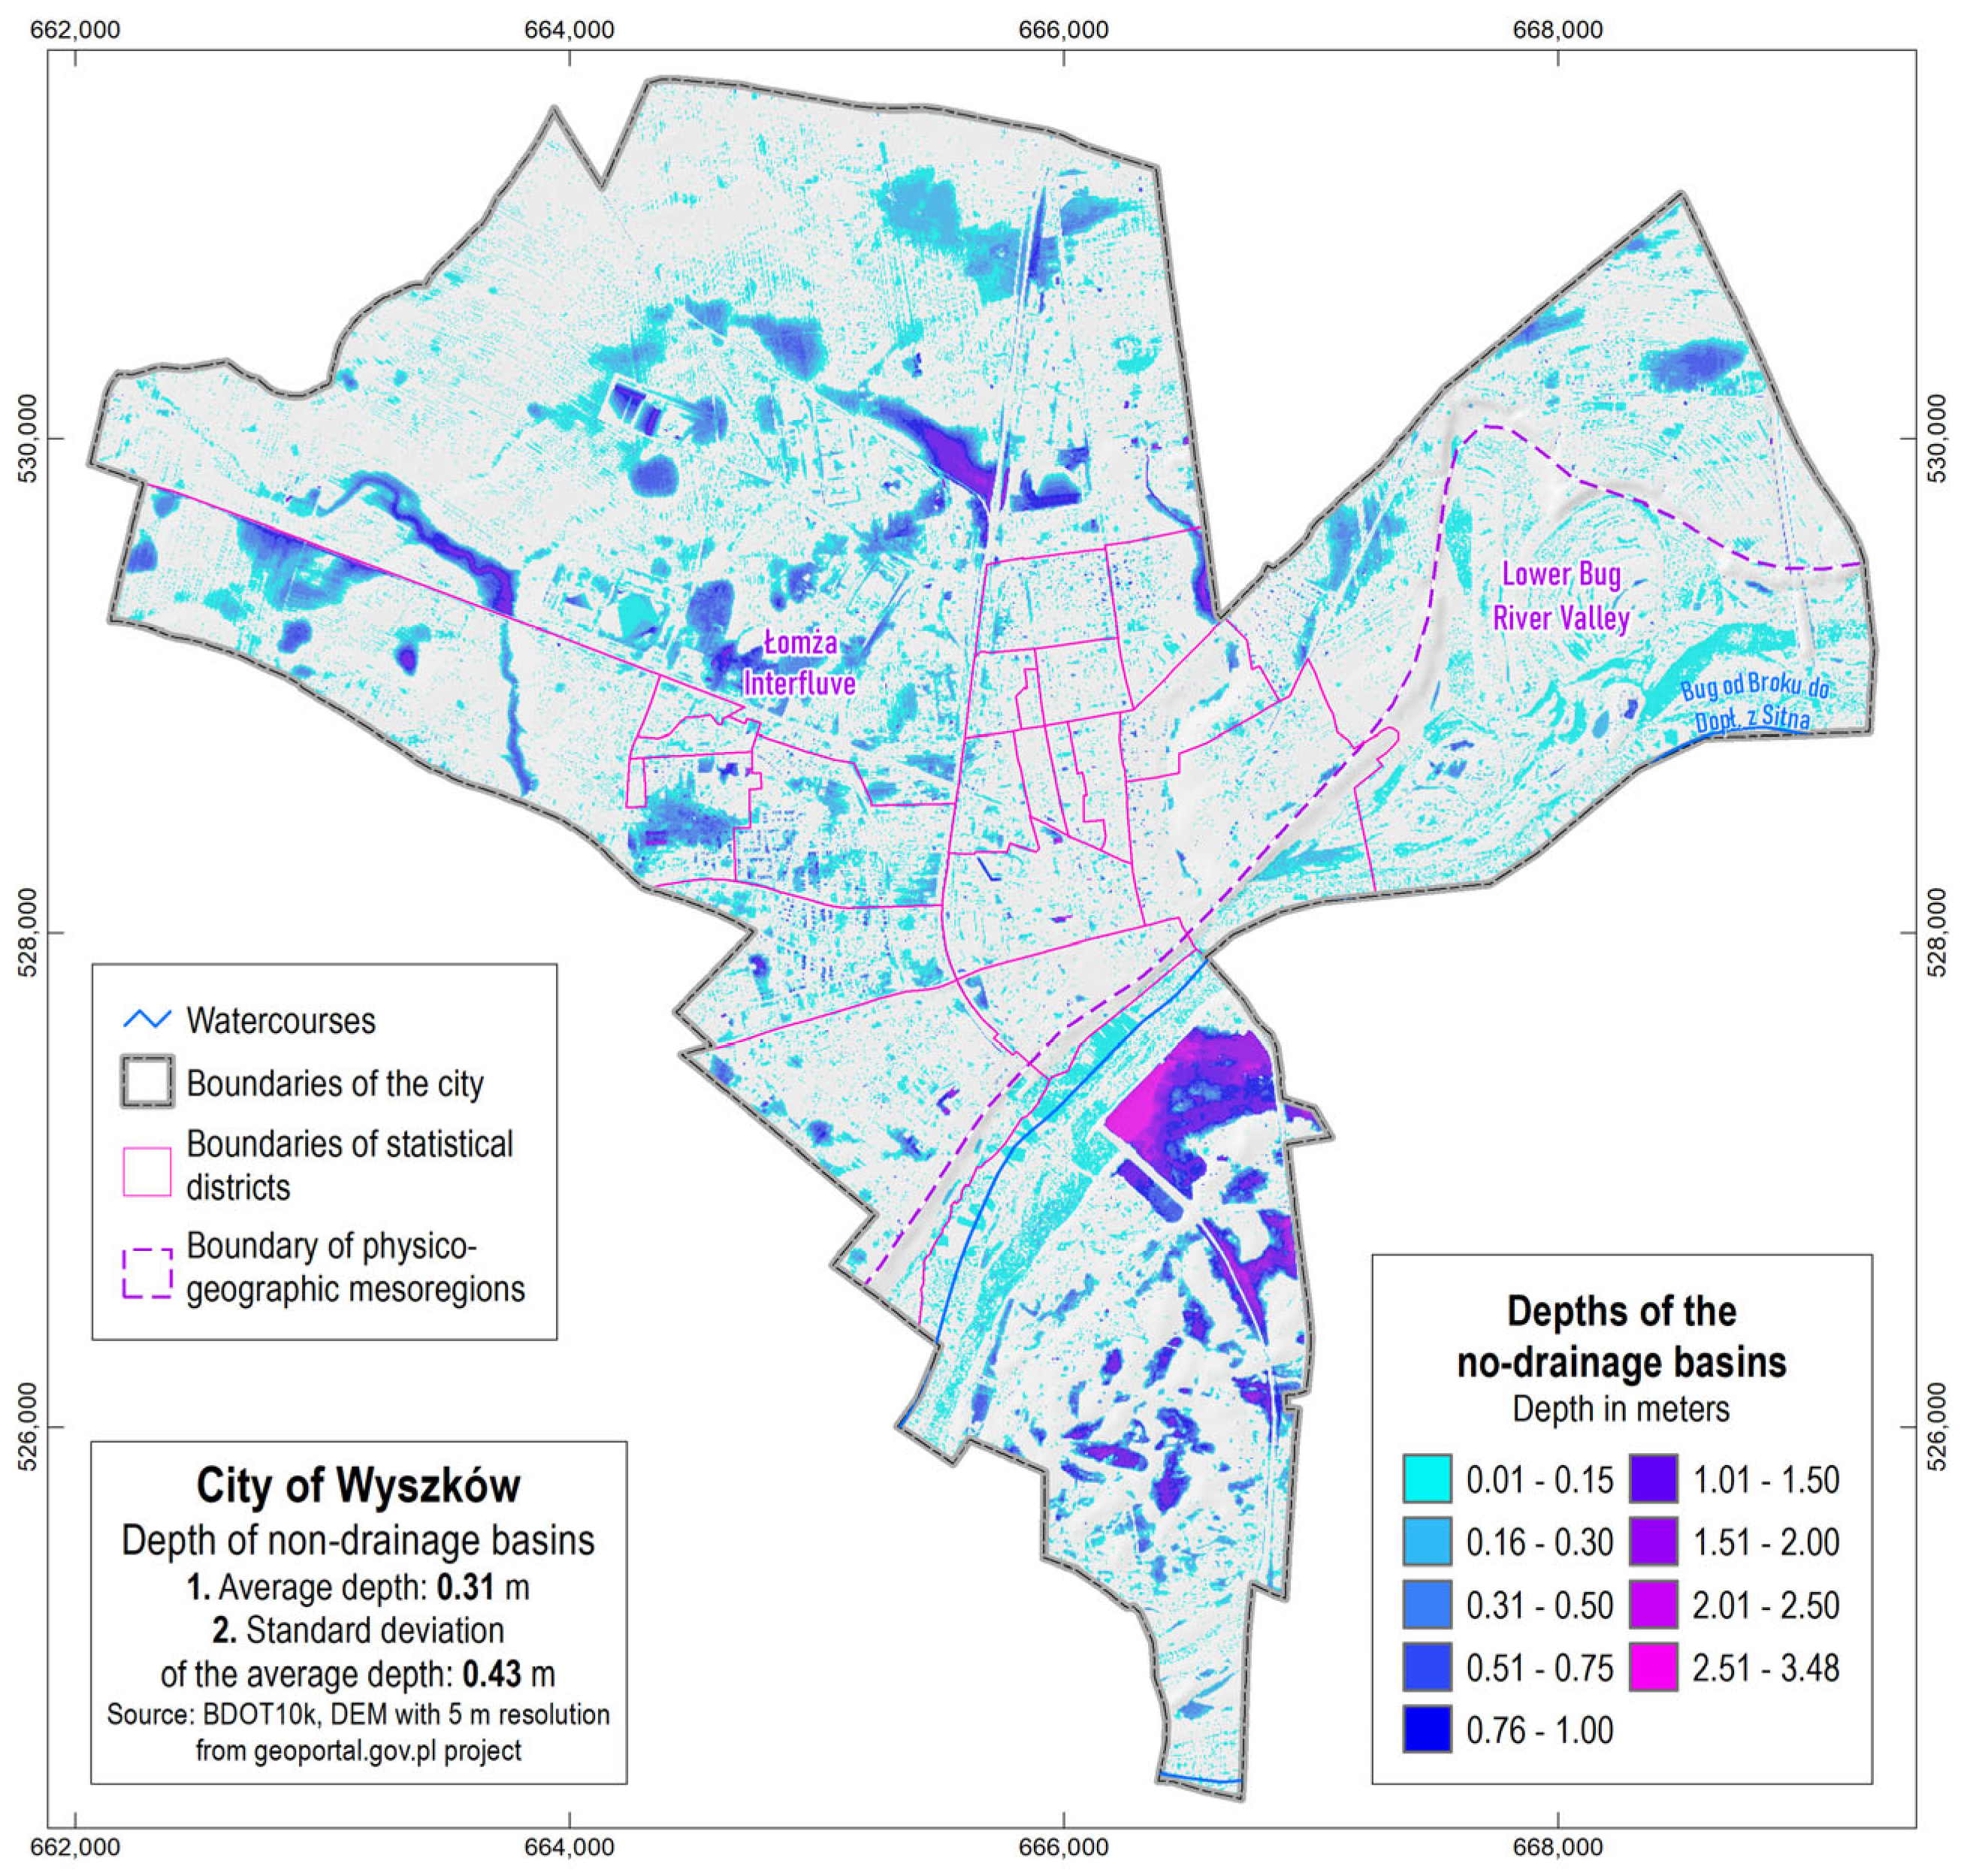
Bielsko-Biała spans an area of 125 km2 and is situated in southern Poland within the Silesian Voivodeship. According to estimates from the Central Statistical Office, the population in 2023 was 165,766 citizens, exhibiting a slightly decreasing trend of approximately −0.33% per year since the start of the 2000s. The city’s landscape is predominantly upland and hills. The mountainous terrain restricts urban expansion to the south, with elevation differences reaching over 800 m (from Klimczok at 1117 m above sea level to the Biała River valley at 262 m above sea level) (Figure 3). There are four major rivers, while most of the city lies within the catchment area of the Biała River. Additionally, the city is interspersed with numerous smaller surface watercourses, including seasonal streams that appear during spring thaws. The immediate vicinity of the mountain range, which stretches along almost the entire southern border of the country, offers a favourable microclimate and an attractive location for tourism and recreation. Green areas cover more than half of the city of Bielsko-Biała, with a green area stock ratio of 53%. According to data from the Central Statistical Office (2021), the area of forest land within the city of Bielsko-Biała is 3179.9 ha, which translates into a forest cover of 24.9% (the national average is 29.6%). The city is a multifunctional hub, recognised for its economic vitality, cultural richness, and scenic landscapes. The city’s current socio-economic development builds upon its centuries-old traditions in manufacturing and commerce. Its growth is facilitated by a substantial and receptive consumer market, a business environment, and a strategic location at the crossroads of major rail and road networks [69]. The spatial structure of Bielsko-Biała reflects its unique location on expansive hills with varying levels of urbanisation, interspersed with streams. This structure follows a band-concentric pattern and is bisected by the Biała River, which historically served as the boundary between the two cities: Bielsko and Biała [70]. In the XIX century, the spatial structure was rearranged due to a comprehensive urban regulation plan. The plan outlined the direction for the city’s spatial development in the 20th century, envisaging significant changes in both the spatial layout (e.g., the separation of building zones) and transport infrastructure (e.g., the construction of ring roads and the ‘straightening of curves’). Currently, the city is divided into 30 districts (Figure 3), which serve as auxiliary units of the municipality. These settlements vary significantly in both area and population density. The highest population densities are found in districts located in the central parts of the agglomeration, while the lowest densities are observed in settlements situated in the southern areas of the city. In general, the residential and commercial zones extend along both sides of the Biała River. The city is currently being affected by a process of suburbanisation. One reason for this is the situation in the residential property market. The increase in demand for residential units and houses led to an increase in demand by developers and individual investors for residential land. This situation caused a surge in land prices in large cities, including Bielsko-Biała, which prompted many investors to look for cheaper land outside the city or on its outskirts [71].

3.2. Wyszków City

The landscape of Wyszków is characterised by moraine uplands on the right bank of the Bug River, which ascends to an average height of 100–120 m above sea level and descends steeply with an erosional edge towards the river (Figure 4). This edge has a relative height of 5 to 12 m, with gradients reaching up to 75%. Consequently, the Lower Bug River Valley within the study area displays notable asymmetry. The valley spans an average width of approximately 5 km, of which around 80% lies on the left bank. The left-bank section transitions smoothly into a flat terrain, with its boundary indistinctly marked by eolian deposits.
The Bug River and its left-bank tributaries, the Liwiec and the Fiszor, drain most of the city. A small portion in the northwestern part of the commune is part of the Narew catchment area. The Bug River, flowing in a natural channel, exhibits significant variability in its riverbed width, depth, and current. Beyond the main channel, the river is shallow, with numerous shoals and shallows. This natural variability, combined with the municipality’s location in the Bug River Valley, renders the area prone to flooding, including snowmelt and blockage-induced floods [72].
According to the Central Statistical Office, the population of Wyszków in 2023 was 26,198 inhabitants. Between 2002 and 2023, the city’s population decreased by approximately 2.0%. City Wyszków has a notable ratio of green spaces, accounting for 49.78% of its area. According to the Central Statistical Office (2021), forested land within the Wyszków region covers 4938 hectares, resulting in a forest cover of 29.5%, slightly below the national average of 29.6%. In the past, Wyszków was an important trading post at the crossroads of a land and water route used to transport timber to Gdansk. Its dynamic development came at the end of the 19th century with the construction of the railway and the development of industry. The issue of establishing a cohesive spatial order is particularly pronounced in the town of Wyszków. Key challenges include the absence of a distinct town centre, the presence of scattered and chaotic development along the main streets, a lack of well-designed public spaces, and the town’s orientation away from the river, which limits its integration with this natural feature. These factors collectively hinder the functional and harmonious organisation of urban space. In response, the municipality is undertaking measures aimed at improving the quality of the urban environment, with a focus on addressing these spatial deficiencies.
Economic, environmental, and social analyses, alongside demographic projections, indicate that in the next 30 years, the share of non-agricultural residential development is expected to rise from the current 50% to approximately 75%. This expansion will primarily involve new residential developments, particularly single-family housing. Additionally, the development of new areas for production and services is anticipated to support this growth.

4. Results

Firstly, both cities were analysed in terms of historical flood events. Numerous sources, dating back to the early 20th century, indicate that both areas have experienced flash floods and riverbank overflows caused by prolonged and heavy rainfall. Additionally, Wyszków, due to its location within a meandering river valley, is periodically affected by floods resulting from ice blockages that obstruct the river’s flow. Recent data from emergency responses to urban flooding caused by heavy rainfall have provided valuable insights into flood-prone areas, highlighting specific locations and occurrences of interventions concerning critical infrastructure and residential zones.
The average soil sealing within urban zones is 38.6% in Bielsko-Biała and 47.1% in Wyszków (Figure 5 and Figure 6), while the total area of sealed soil accounts for 35.8% and 36.9%, respectively. The map illustrating the spatial distribution of impervious surfaces highlights an ongoing suburbanisation process, with land development expanding towards the outskirts. This expansion has resulted in a notable increase in impervious surfaces, even in areas that were previously uninhabited, such as uphill and forested regions in the southern part of Bielsko-Biała. In Wyszków, the highest levels of imperviousness are observed in the northern part of the city, where industrial and service facilities, including large-scale halls, are concentrated. Furthermore, residential areas are noticeably sprawling towards the riverbanks, exacerbating the risk of flooding in these zones. This trend underscores the necessity of strategic urban planning to address the challenges posed by increasing imperviousness and associated hydrological risks.
The flood hazard in Bielsko-Biała, resulting from riverbank overflow during extreme precipitation events with a 1-in-100-year return period, is illustrated in Figure 7. This is accompanied by an analysis of the depth of non-drained urban basins, presented in Figure 8. Comparable data are provided for Wyszków in Figure 9 and Figure 10, respectively. In addition, for Wyszków, spatial data on intervention sites related to local flooding events, as recorded by the Firefighter Department, are also incorporated to enhance the assessment of flood-prone areas. This representation highlights both the areas within the city susceptible to flash flooding and the regions near riverbanks vulnerable to river flooding. In Bielsko-Biała, the areas prone to river flooding cover approximately 0.84 km2 and are primarily concentrated near the Biała River. The non-drained urban basins in Bielsko-Biała encompass an area of approximately 0.67 km2, with buildings located within these basins facing significant flooding risks during heavy rainfall due to water accumulation in urban depressions. In comparison, the city of Wyszków appears to face greater flooding risks, both from flash flooding and water accumulation in local depressions, which span an area of 0.93 km2, as well as from river flooding. The area threatened by river flooding in Wyszków extends over 3.88 km2, underscoring considerable vulnerability to hydrological risks. A detailed analysis of non-drained urban basins, areas prone to river flooding, and intervention points identified by local firefighters provides precise locations where action is required. These measures may include small-scale nature-based solutions or more advanced technical infrastructure designed to mitigate river flooding and its associated impacts, depending on the areas at risk and the depth of potential flooding within the basins.
Green areas occupy more than half of the city of Bielsko-Biała, with the green area resource index amounting to 53% (Figure 11a). Additionally, the percentage of biologically active index exceeds 60%. According to data from the Central Statistical Office for year 2021, the forested land area in Bielsko-Biała is 3179.9 hectares, translating to a forest cover of 24.9%, compared to the national average of 29.6%. In case of the Wyszków City green areas occupy over 60% and account for nearly half of the city’s area. The green area resource index for the city stands at 49.78% (Figure 12a). The percentage of biologically active index within the city (Figure 5) exceeds 68.15%. According to statistical data from 2021, the forested land area in Wyszków totals 4938 hectares, corresponding to a forest cover of 29.5%, which is close to the national average of 29.6%.
Based on a spectral (remote sensing) index that identifies green areas using satellite imagery (Sentinel-2) the Normalised Difference Vegetation Index (NDVI) was compared against anthropogenic areas of the city. This index includes all green spaces, encompassing both lush greenery and low-quality vegetation. The mapped visualization of the index provides information on the distribution of green areas within the anthropogenic zones of the city—areas where the majority of the population lives and works—as well as the fragmentation of individual green patches (Figure 11b and Figure 12b). Furthermore, a comparison of green and anthropogenic areas offers quantitative insights into the availability of greenery in the urbanised parts of the city. In the Bielsko-Biała City, this index is around 79% while in the Wyszków City, green areas within the urbanised areas identified through satellite imagery account for approximately 66%. An analysis of the distribution of green areas based on satellite data reveals a lack of vegetation in the northern parts of the city near service, industrial, and warehouse buildings.
After selecting the spatial units for evaluation, choosing the criteria, calculating the criterion values, and normalising them, the preliminary output of the multi-criteria analysis is a set of weights assigned to each criterion. For the city of Bielsko-Biała, the following criteria were available, with the corresponding weights assigned (Table 2).
The first relevant product of the MCA analysis is a tabular ranking of districts based on the sums of standardised products of criterion values and criterion weights. This ranking can also be visualised to illustrate the vulnerability of districts to hydrological threats (Figure 13), where the deepest blue colour indicates that these districts are more prone to flooding, taking into account the criteria adapted from Table 2.
As in the case of Bielsko-Biała City, appropriate criteria were selected for the city of Wyszków (Table 3), to which the expert team assigned weight values.
In case of Wyszków city, the highest weights were given to criteria relating to actual flood events (the area of flooded roads within the statistical district and the number of points of local flooding within the statistical district) as well as criteria relating to the impermeability of the ground (the average soil sealing intensity within the statistical district). The lowest weights were assigned to criteria calculated on the basis of model data.
Analysing the quantile map of MCA scores for Wyszków we observe that lower scores (higher hydrological risk) pertain to statistical districts located on Łomża Interfluve in comparison to districts located on Lower Bug River Valley (Figure 14). This is the result of assigning the highest weight to the criterion of local floods (criterion no 10) and the fact that 97% of local floods occurred on Łomża Interfluve. It also appears that the result of the multi-criteria analysis for statistical region number 600880 (rank 2) is underestimated. Due to the presence of about 400 buildings in the 100-year floodplain in this region, the rank and thus hydrological risk should be higher.

5. Discussion

Water resource management in cities, in the context of climate change, faces numerous challenges. Infrastructure and hydraulic structures that have been in use for a long time are deteriorating [73,74]. Meanwhile, increasing anthropogenic pressure, which leads to surface sealing and the removal of trees, meadows, and wetlands, is significantly altering the hydrological cycle in urban areas [75,76]. Until recently, the primary objective of urban water management was the rapid drainage of stormwater from developed areas [77]. However, in light of increasing droughts and the growing deficit of high-quality water [78,79], the management of stormwater and the implementation of blue-green infrastructure, which mitigates risks and supports climate change adaptation, have become essential [80,81]. Several factors influence resilience to flood and, consequently, urban water retention, including the volume of atmospheric precipitation, temperature, and exposure to solar radiation, terrain topography, degree of urbanisation such as soil sealing, vegetation cover, hydrographic network, including distance to rivers and density of watercourses, and soil type, particularly permeability.
Each factor has been thoroughly addressed within the framework of this study. The projection of future precipitation has been adapted from the Klimada 2.0 project, which aimed to assess changes in temperature and precipitation up to 2100, with particular emphasis on 2050, using global and regional climate trends based on emission pathways and model projections (e.g., IPCC and CMIP6) [82]. Undoubtedly, the likelihood of heavy rainfall is increasing as a result of climate change. Precipitation intensity is projected to rise in accordance with increasing atmospheric moisture content, which is expected to increase by approximately 7% per degree of temperature rise, as described by the Clausius-Clapeyron (C-C) relation [83]. It has also been demonstrated that extreme daily rainfall intensity and/or frequency has increased across most continents [84], and recent evidence suggests a link between heatwave cycles and short-duration extreme rainfall events driven by convection [85]. Moreover, the combination of these extreme phenomena, particularly the occurrence of heatwaves followed by short-duration extreme rainfall, is more likely to result in highly destructive and deadly events, such as flash floods [86]. Therefore, the assessment of how cities should adapt to climate change should address both the increased volume of runoff and the locations where excess water accumulates, as well as the potential sites for small retention measures or blue–green infrastructure installations, which help mitigate both urban heat island effects and runoff.
Numerous researchers have examined the impact of increased imperviousness in urbanised areas on the likelihood of flash flooding, finding that peak runoff flow may increase by up to 300% as a result of changes in land use and soil sealing [87,88,89]. Consequently, urbanisation and urban sprawl–with the associated increase in flood risk—also arise from hydrological alterations induced by impervious surfaces [90,91]. In the present study, both cities exhibit average imperviousness levels ranging from 40% to nearly 50%. However, city centres and service and logistics districts are almost entirely impervious/sealed, thereby substantially reducing the potential for natural water retention and altering runoff characteristics. This hazardous phenomenon—the expansion of impervious, urbanised areas into zones adjacent to riverbanks that are susceptible to flooding during overflow events—significantly escalates the overall flood risk. Consequently, one of the recommendations for both cities is to incorporate pervious surfaces wherever feasible (for example, in car parks, parks, and pavements), as well as to introduce gaps and implement nature-based solutions in the form of urban acupuncture [92] in the most sealed districts.
Increasing urban greenery is an effective approach to reducing both the extent of impervious surfaces and the associated runoff, thereby forming a key component of strategies to mitigate flood risk. For instance, trees can reduce the amount of rainfall that reaches the soil through interception at the canopy level, which in turn reduces the peak flow of runoff. Various studies have shown that this reduction can range from 9% to as much as 70% [93,94,95,96,97,98], depending on the intensity of the rainfall. Trees and tree pits create gaps in sealed surfaces and provide urban sites where rainwater can percolate and infiltrate into deeper soil layers, thereby reducing surface runoff. For instance, experimental studies conducted in Manchester, UK, on three small trees demonstrated a 62% reduction in runoff [86]. Similarly high results were obtained when comparing infiltration in urban areas with and without trees, i.e., infiltration in green areas was circa 60% higher [99]. Other green solutions can also significantly reduce runoff; for instance, green roofs may achieve an efficiency of 30% to 86% and can reduce peak flow by up to 93% [100]. Meanwhile, shrub–grass vegetation, when increasing to 70% coverage, has been shown to decrease average runoff by 37% [95]. Therefore, it is imperative for urban areas to both preserve existing vegetation—particularly high-quality parks, urban forests, and gardens—and integrate nature-based solutions in regions predominantly covered by impervious surfaces. Both cities were evaluated in terms of their green space distribution, which is critical for hydrological assessments. Although the overall proportion of green areas is relatively high, averaging approximately 50%, a detailed analysis indicates that green space is markedly limited in city centres, residential areas, and zones with concentrated commercial and logistics activities. Consequently, these areas should be prioritised for future interventions, including the strategic planting of vegetation and trees. Moreover, the project emphasised that in the peripheral areas of both cities, protected green spaces—such as those along meandering riverbanks and extensive forested regions in mountainous areas—serve as natural buffers against flooding, given that both cities have experienced severe floods over the past century.
The GIS analysis was also used to delineate local depressions that do not drain directly, which could potentially damage adjacent buildings and areas during flash flooding. For instance, the extraction of such GIS information is the first step in modeling short-term flash floods [101] and can also serve as a cost-effective alternative to more complex modeling approaches [102]. In both cities, several local depressions have been identified that can accumulate water during heavy rainfall. Therefore, it is recommended that these areas be given careful consideration in future urban planning, with a view toward redeveloping them into green–blue infrastructure solutions.
Eventually, the multi-criteria approach (MCA), integrated with GIS data [103], was adapted to identify districts or areas within cities that are vulnerable to flooding—whether due to heavy rainfall or riverbank overflow. This combined method has been extensively used in environmental studies to produce detailed flood risk maps [104,105], as well as hazard, vulnerability, and exposure maps [104,106]. In the study, both cities were analysed using MCA, which highlighted specific areas that are particularly susceptible to hydrological threats and potential flooding. This approach offers land-use planners a powerful tool for making informed decisions when designing new construction projects, ensuring that developments are both resilient and sustainable.
To summarise, the detailed analysis contributing to the diagnosis of the city in terms of urban retention and hydrological risk should include:
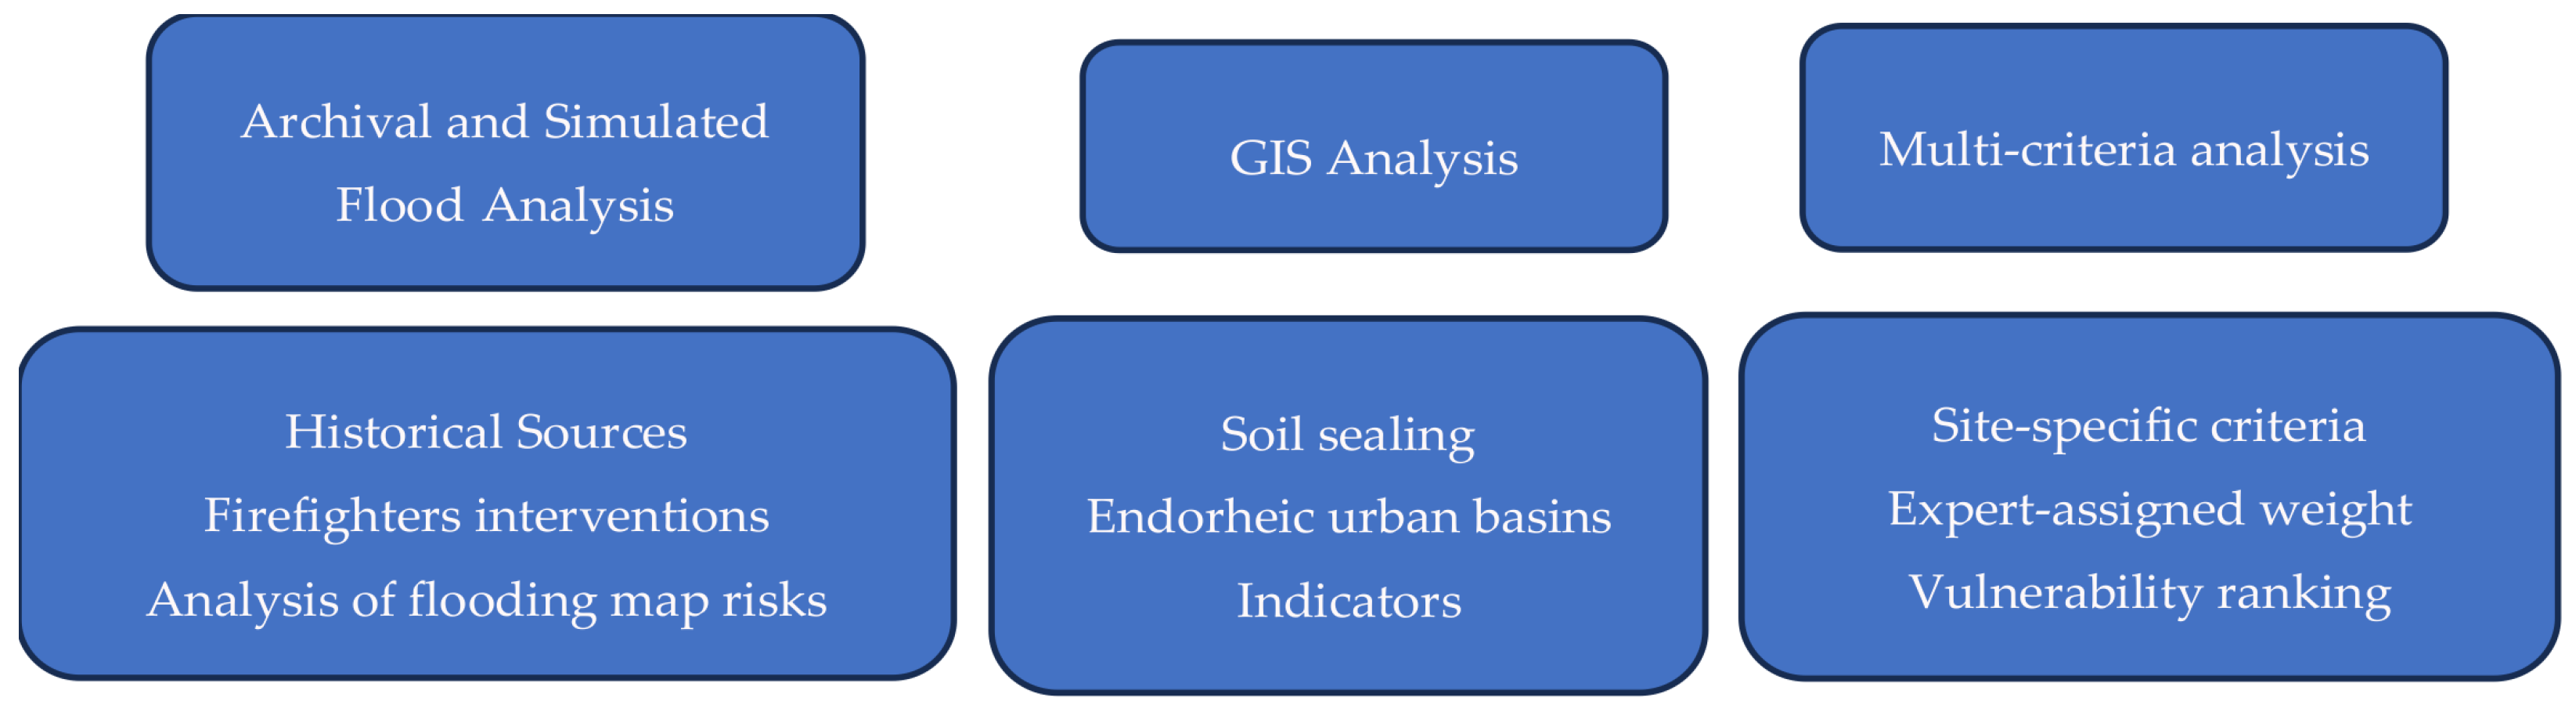
  • Analysis of archival data regarding past severe floods and local flooding, including the extent or coordinates of events if available;
  • Analysis of the modelled extent of flooding based on risk scenario maps;
  • Assessment of soil sealing and depression areas that are not naturally drained or connected to the rainwater drainage system;
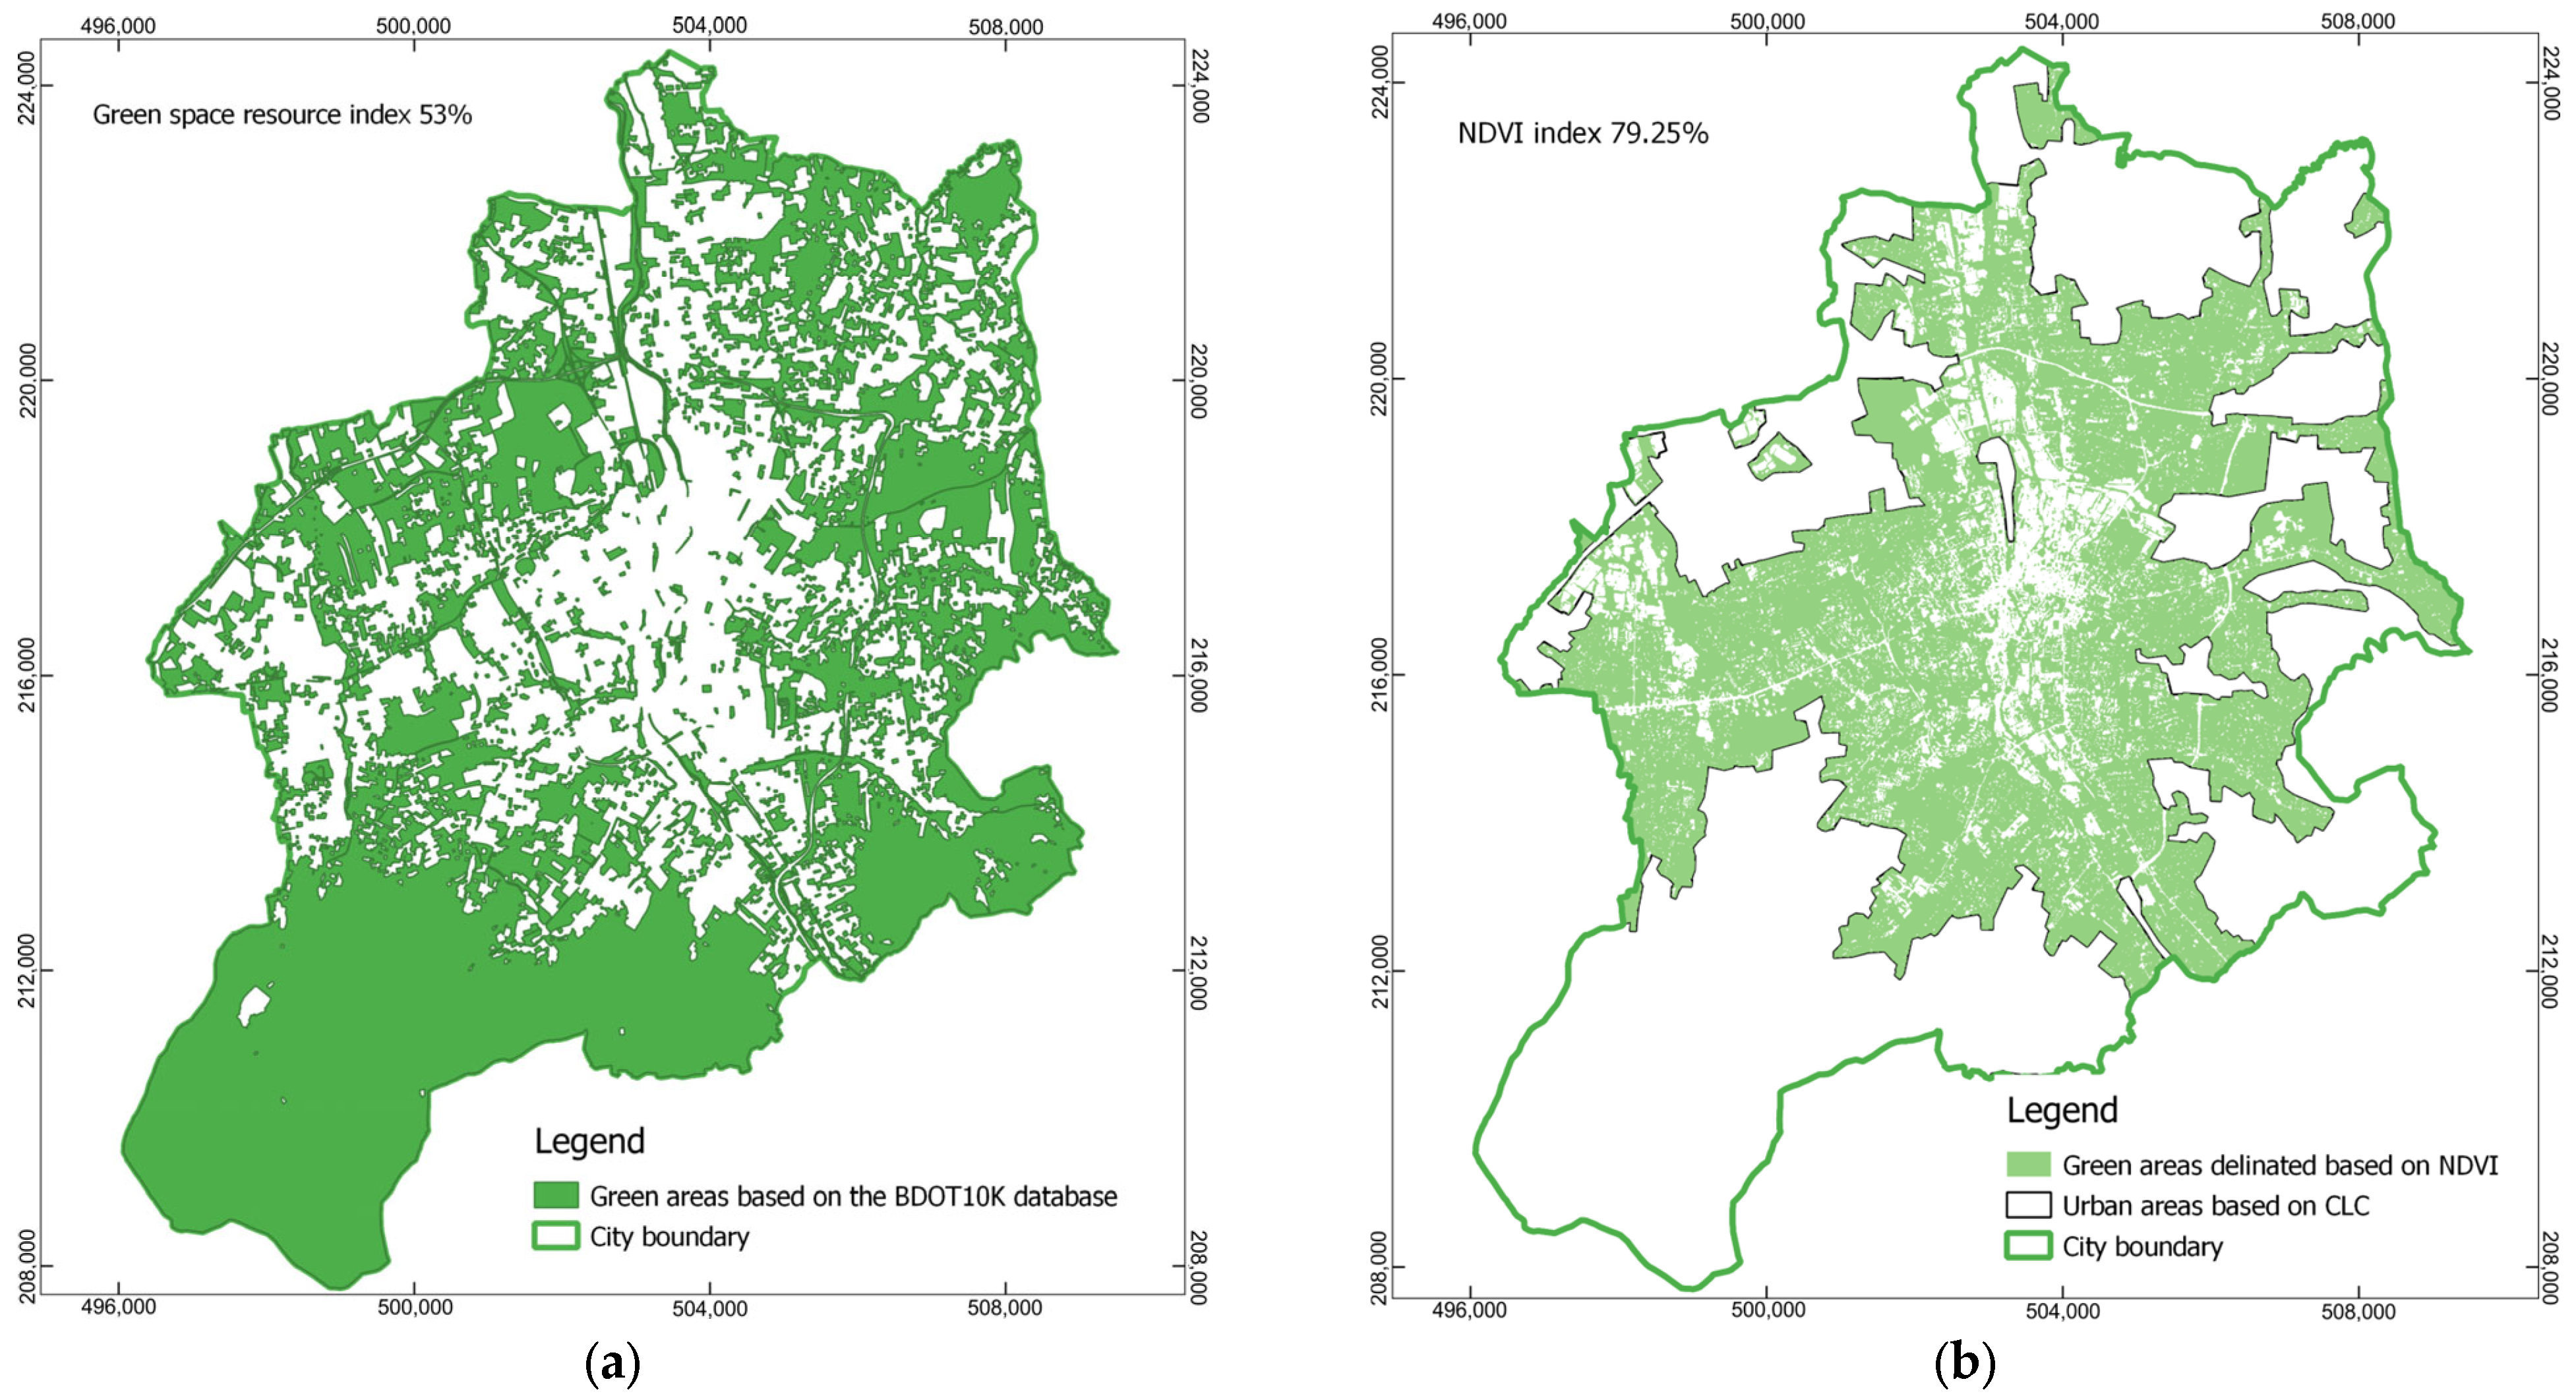
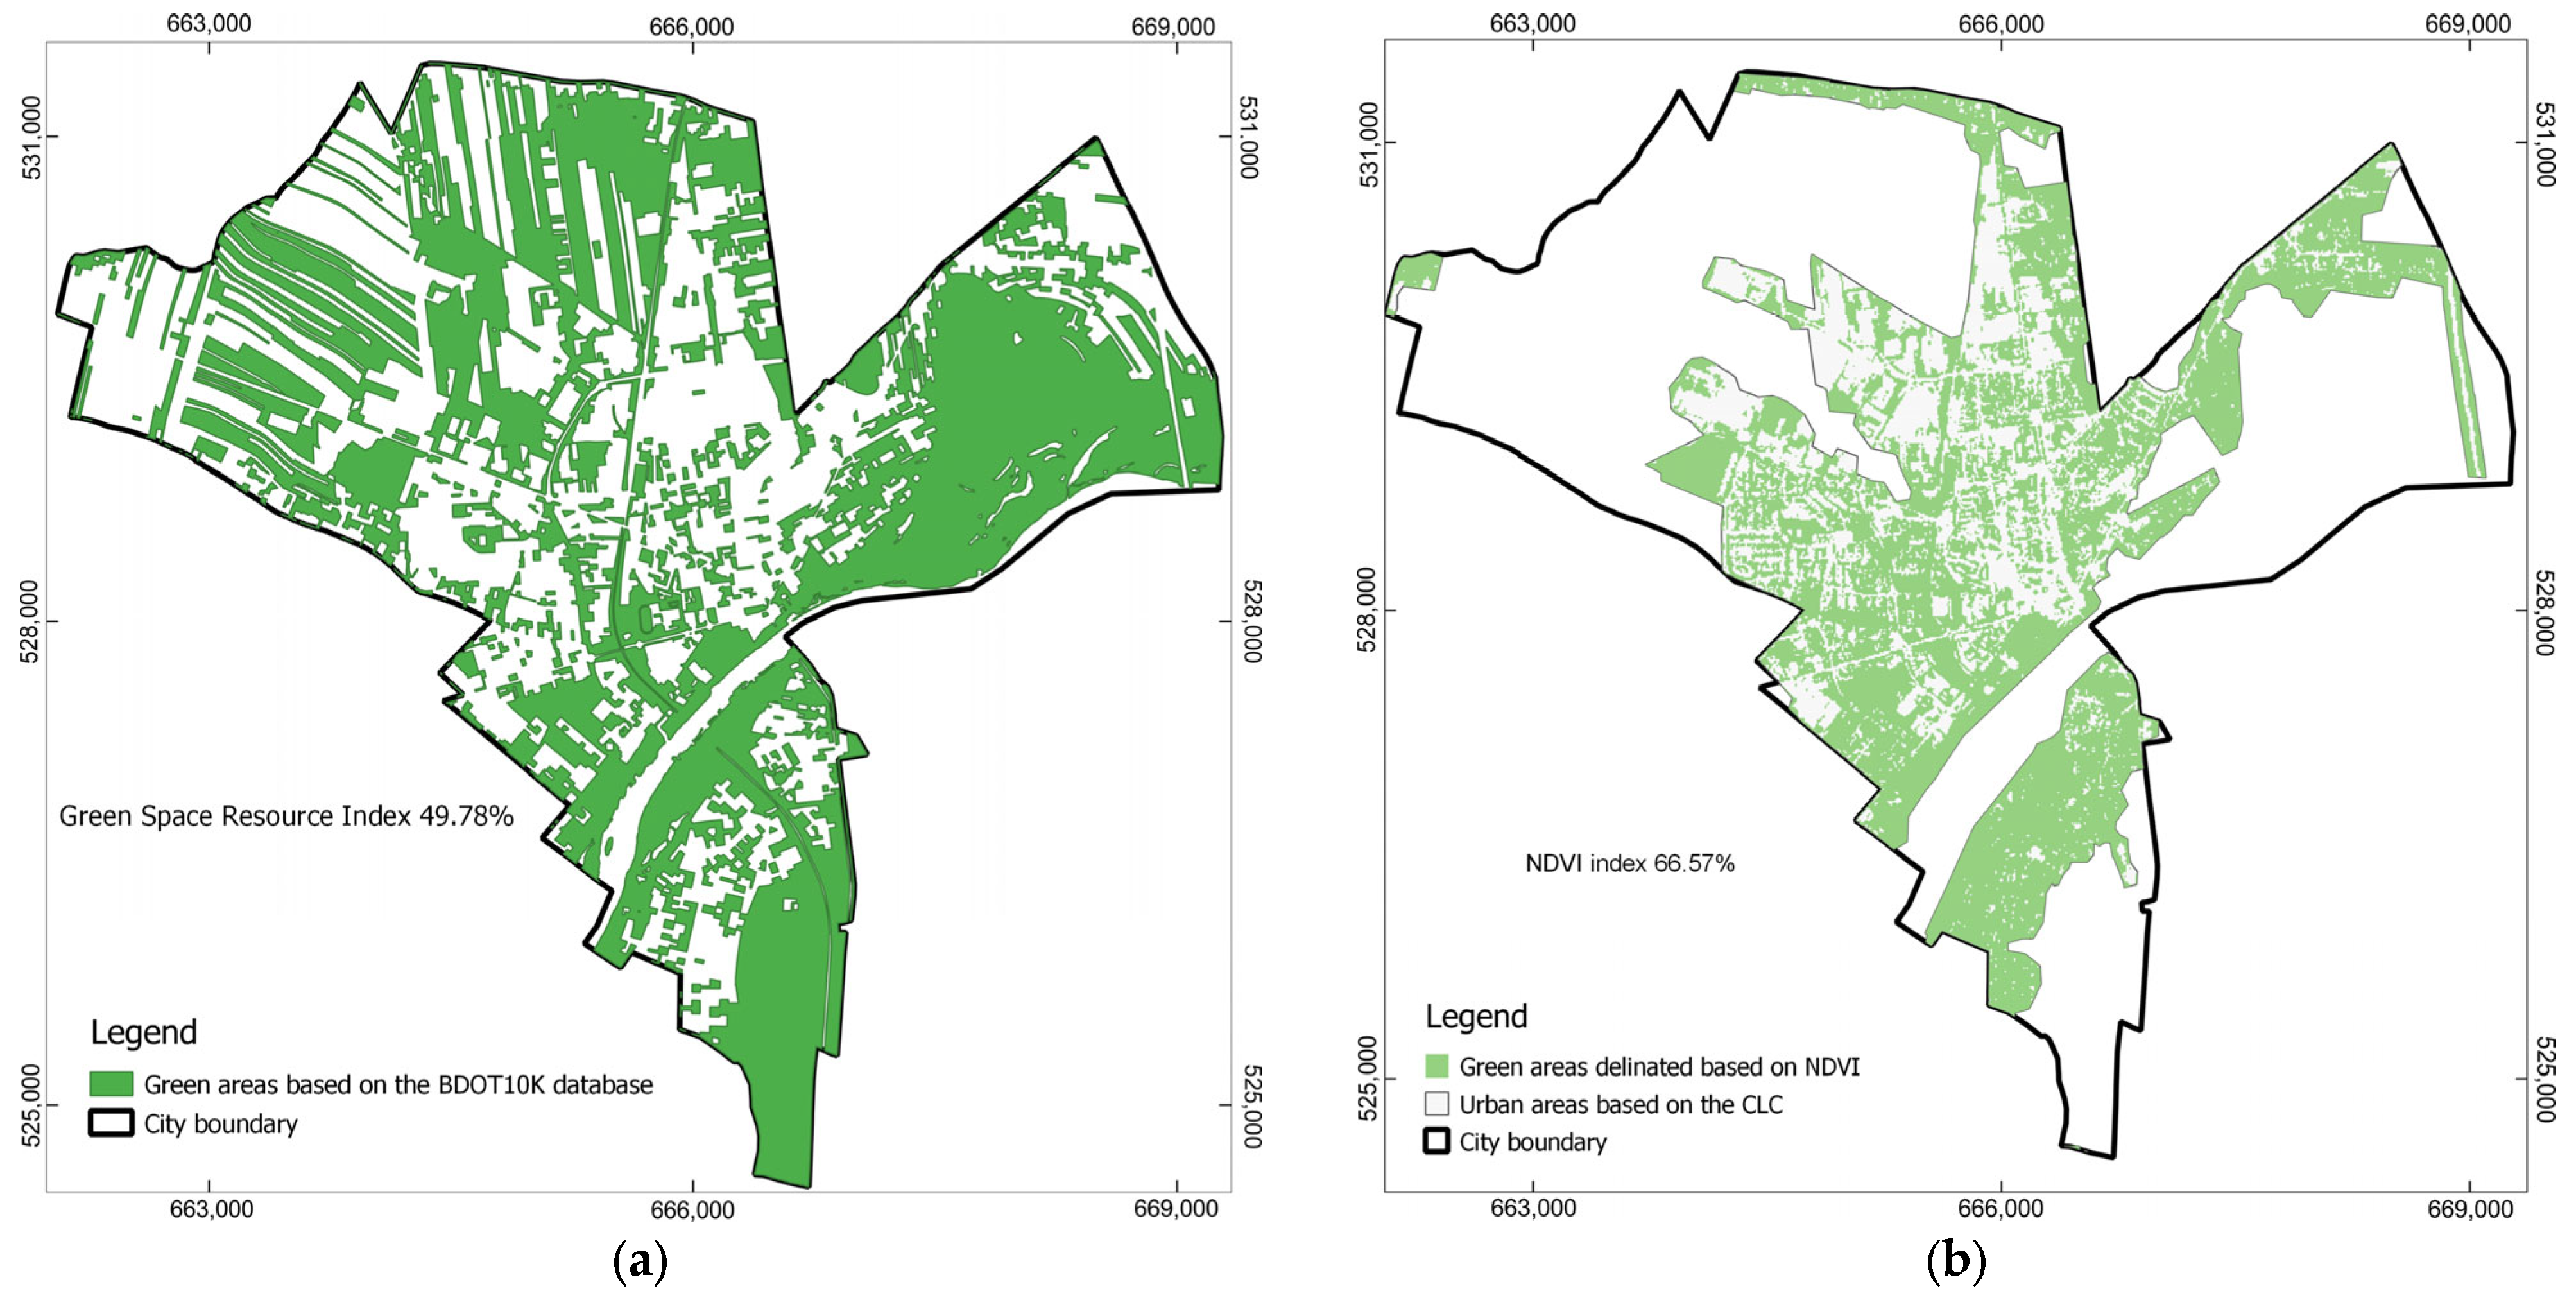
  • Evaluation of several GIS-calculated and satellite-based indicators, such as NDVI, NDBI, green area resource index, and biologically active index;
  • Multi-criteria analysis.
The presented methodology was implemented in several cities with varying landscapes, populations, sizes, and hydrography, either as part of the City with Climate project or adaptation plans. It helped policymakers identify the most vulnerable areas of the cities in relation to the urban water cycle, pinpointing locations for interventions aimed at modernising grey infrastructure or implementing blue–green infrastructure.

6. Conclusions

This study aimed to present a holistic approach to diagnosing a city’s vulnerability in the context of climate change. The comprehensive methodology helped policymakers identify key issues and plan further environmental projects, whether technical interventions or nature-based solutions. Additionally, it emphasised the urgent need to protect existing green spaces, which, even when dispersed, contribute to urban water retention and provide flood protection, particularly in mountainous regions. Although the methodology integrates well-established GIS analyses and widely applied multi-criteria analysis, it has not previously been used as part of a citywide diagnosis specifically designed to counteract climate change. Moreover, it is based on freely available data and developed using open-source tools, making it accessible and practical for stakeholders. The methodology is currently being applied by the authors in the development of city adaptation plans and has the potential to be incorporated into future rainwater management plans, which serve as strategic documents for urban planning.
Although the study focused on two cities with distinct topography, hydrography, and demographics, the methodology is city-oriented and has been tested in several other cities with varying landscapes and population densities. The approach has yielded promising results, which have been utilised by city authorities to inform further projects.
Both cities examined in this study shared common challenges related to urbanisation and climate adaptation. In both cases, urban expansion—particularly soil sealing—significantly increased the risk of flooding. Additionally, the spread of urban areas into suburban regions, including mountainous, forested areas, and floodplains, should serve as a warning for local authorities. The methodology developed in this study provides a valuable tool for land-use planners by clearly identifying areas at risk from extreme meteorological events, ensuring that new investments are planned with caution. It serves as a foundation for further planning efforts, whether as part of climate change adaptation strategies or urban water management frameworks, particularly when integrated with sewer network data. This study also highlights the importance of collaboration between stakeholders and experts in integrating data and applying results effectively to implement nature-based solutions within urban water management. The findings emphasise the need for a holistic approach to land-use management, balancing urban development with environmental protection to enhance resilience to climate change.
Future work will focus on further developing GIS analyses. For instance, the current soil sealing assessment relies on data updated every three years, which may not adequately capture short-term trends in land-use changes and the expansion of impervious surfaces. Therefore, there is a need to develop a method for more frequent soil sealing assessments. Moreover, the current analysis of non-drained depressions is static and does not incorporate hydrological models of runoff, which is a critical component of the urban water cycle, particularly in relation to flash flooding.

Author Contributions

Conceptualisation, K.S.-G.; methodology, K.S.-G., J.B. and M.G.; software, J.B. and K.S.-G.; validation, K.S.-G. and J.B.; formal analysis, K.S.-G.; investigation, K.S.-G. and J.B.; resources, K.S.-G.; data curation, J.B. and M.G.; writing—original draft preparation, K.S.-G.; writing—review and editing, K.S.-G., M.P. and P.O.; visualisation, J.B. and K.S.-G.; supervision, M.P.; project administration, M.G.; funding acquisition, M.P. and M.G. All authors have read and agreed to the published version of the manuscript.

Funding

The study was funded under the “Cities with Climate 2.0” project by the National Fund for Environmental Protection and Water Management, commissioned by the Ministry of Climate and Environment.

Data Availability Statement

All data are available upon request.

Conflicts of Interest

The authors declare no conflicts of interest.

Abbreviations

EASACEureopean Academies Science Advisory Council
NCSNatCatSERVICE
CDPCarbon Disclosure Project
CHAMPCoalition for High Ambition Multi-Level Partnerships
NDVINormalised Difference Vegetation Index
NDBINormalised Difference Built-Up Index
ISOKInformatic System of National Protection
LCLand Cover
USGSUnited States Geological Survey
ESAEuropean Space Agency
MCAMulti-Criteria Analysis
IPCCIntergovernmental Panel on Climate Change
CMIPP6Coupled Model Intercomparison Project Phase 6

References

  1. Kötter, T. Risks and opportunities of urbanisation and megacities. In Proceedings of the FIG Working Week, Athens, Greece, 22–27 May 2004. [Google Scholar]
  2. UNHABITAT Envisaging the Future of Cities, World Cities Report. 2022. Available online: https://unhabitat.org/world-cities-report-2022-envisaging-the-future-of-cities (accessed on 19 December 2024).
  3. Caprotti, F. Future cities: Moving from technical to human needs. Palgrave Commun. 2018, 4, 35. [Google Scholar] [CrossRef]
  4. Smith, N. Uneven Development: Nature, Capital, and the Production of Space; University of Georgia Press: Athens, GA USA, 2010; 344p. [Google Scholar]
  5. Lees, L.; Shin, H.B.; Morales, E.L. (Eds.) Global Gentrifications: Uneven Development and Displacement; Policy Press: Chicago, IL, USA, 2015; 468p. [Google Scholar]
  6. Sun, L.; Chen, J.; Li, Q.; Huang, D. Dramatic uneven urbanization of large cities throughout the world in recent decades. Nat. Commun. 2020, 11, 5366. [Google Scholar] [CrossRef] [PubMed]
  7. Ades, A.F.; Glaeser, E.L. Trade and circuses: Explaining urban giants. Q. J. Econ. 1995, 110, 195–227. [Google Scholar] [CrossRef]
  8. Florida, R.L. The Great Reset: How the Post-Crash Economy Will Change the Way We Live and Work; Harper Collins Publ.: New York, NY, USA, 2011; 225p. [Google Scholar]
  9. He, S.Y.; Lee, J.; Zhou, T.; Wu, D. Shrinking cities and resource-based economy: The economic restructuring in China’s mining cities. Cities 2017, 60, 75–83. [Google Scholar] [CrossRef]
  10. Dieleman, F.; Wegener, M. Compact city and urban sprawl. Built Environ. 2004, 30, 308–323. [Google Scholar] [CrossRef]
  11. Shaw, K. Gentrification: What it is, why it is, and what can be done about it. Geogr. Compass 2008, 2, 1697–1728. [Google Scholar] [CrossRef]
  12. Carter, D.K. (Ed.) Remaking Post-Industrial Cities: Lessons from North America and Europe; Routledge: New York, NY, USA, 2016; 249p. [Google Scholar]
  13. Daniels, P.W. Urban challenges: The formal and informal economies in mega-cities. Cities 2004, 21, 501–511. [Google Scholar] [CrossRef]
  14. Lang, R.; Knox, P.K. The new metropolis: Rethinking megalopolis. Reg. Stud. 2009, 43, 789–802. [Google Scholar] [CrossRef]
  15. Zhang, X.Q. The trends, promises and challenges of urbanisation in the world. Habitat Int. 2016, 54, 241–252. [Google Scholar] [CrossRef]
  16. Shackleton, C.M.; Blair, A.; De Lacy, P.; Kaoma, H.; Mugwagwa, N.; Dalu, M.T.; Walton, W. How important is green infrastructure in small and medium-sized towns? Lessons from South Africa. Landsc. Urban Plan. 2018, 180, 273–281. [Google Scholar] [CrossRef]
  17. Gros-Balthazard, M.; Talandier, M. Cooperation, proximity, and social innovation: Three ingredients for industrial medium-sized towns’ renewal? Urban Sci. 2020, 4, 15. [Google Scholar] [CrossRef]
  18. Browne, S.; Lintern, A.; Jamali, B.; Leitão, J.P.; Bach, P.M. Stormwater management impacts of small urbanising towns: The necessity of investigating the ‘devil in the detail’. Sci. Total Environ. 2021, 757, 143835. [Google Scholar] [CrossRef] [PubMed]
  19. Ramani, A.; Bloom, N. The Donut Effect of COVID-19 on Cities (No. w28876); National Bureau of Economic Research: Cambridge MA, USA, 2021; Available online: https://www.nber.org/system/files/working_papers/w28876/w28876.pdf (accessed on 7 January 2025).
  20. Lord, V.B.; Kuhns, J.B.; Friday, P.C. Small city community policing and citizen satisfaction. Polic. Int. J. Police Strateg. Manag. 2009, 32, 574–594. [Google Scholar] [CrossRef]
  21. Anderson, M.W. The new minimal cities. Yale Law J. 2013, 123, 1118–1227. [Google Scholar]
  22. Tran, T.-N.-D.; Lakshmi, V. Enhancing human resilience against climate change: Assessment of hydroclimatic extremes and sea level rise impacts on the Eastern Shore of Virginia, United States. Sci. Total Environ. 2024, 947, 174289. [Google Scholar] [CrossRef]
  23. Longato, D.; Cortinovis, C.; Albert, C.; Geneletti, D. Practical applications of ecosystem services in spatial planning: Lessons learned from a systematic literature review. Environ. Sci. Policy 2021, 119, 72–84. [Google Scholar] [CrossRef]
  24. Longato, D.; Cortinovis, C.; Balzan, M.; Geneletti, D. A method to prioritize and allocate nature-based solutions in urban areas based on ecosystem service demand. Landsc. Urban Plan. 2023, 235, 104743. [Google Scholar] [CrossRef]
  25. Goldenberg, R.; Kalantari, Z.; Cvetkovic, V.; Mörtberg, U.; Deal, B.; Destouni, G. Distinction, quantification and mapping of potential and realized supply-demand of flow-dependent ecosystem services. Sci. Total Environ. 2017, 593, 599–609. [Google Scholar] [CrossRef]
  26. Feurer, M.; Rueff, H.; Celio, E.; Heinimann, A.; Blaser, J.; Htun, A.M.; Zaehringer, J.G. Regional scale mapping of ecosystem services supply, demand, flow and mismatches in Southern Myanmar. Ecosyst. Serv. 2021, 52, 101363. [Google Scholar] [CrossRef]
  27. Córdoba Hernández, R.; Camerin, F. Assessment of ecological capacity for urban planning and improving resilience in the European framework: An approach based on the Spanish case. Cuad. Investig. Geográfica 2023, 49, 119–142. [Google Scholar] [CrossRef]
  28. Boyd, J. Ecosystem Services and Climate Adaptation; Resources for the Future: Washington, DC, USA, 2010; Issue Brief 10–16; Available online: http://sa.indiaenvironmentportal.org.in/files/ecosystem%20services%20and%20climate%20adaptation.pdf (accessed on 24 March 2025).
  29. Bagstad, K.J.; Semmens, D.J.; Waage, S.; Winthrop, R. A comparative assessment of decision-support tools for ecosystem services quantification and valuation. Ecosyst. Serv. 2013, 5, 27–39. [Google Scholar] [CrossRef]
  30. Corburn, J. Toward the Healthy City: People, Places, and the Politics of Urban Planning; Mit Press: Cambridge, MA, USA, 2009; 296p. [Google Scholar]
  31. Duc, T.V.M.; Ngan, L.T.K. Smart cities, healthy citizens: Integrating urban public health in urban planning. Rev. Contemp. Bus. Anal 2022, 5, 28–44. [Google Scholar]
  32. Dannenberg, A.L.; Jackson, R.J.; Frumkin, H.; Schieber, R.A.; Pratt, M.; Kochtitzky, C.; Tilson, H.H. The impact of community design and land-use choices on public health: A scientific research agenda. Am. J. Public Health 2003, 93, 1500–1508. [Google Scholar] [CrossRef] [PubMed]
  33. Ige-Elegbede, J.; Pilkington, P.; Orme, J.; Williams, B.; Prestwood, E.; Black, D.; Carmichael, L. Designing healthier neighbourhoods: A systematic review of the impact of the neighbourhood design on health and wellbeing. Cities Health 2022, 6, 1004–1019. [Google Scholar] [CrossRef]
  34. Garnett, N.S. Save the cities, stop the suburbs? Yale Law J. 2006, 116, 598. [Google Scholar] [CrossRef]
  35. Kundzewicz, Z.W. Climate change impacts on the hydrological cycle. Ecohydrol. Hydrobiol. 2008, 8, 195–203. [Google Scholar] [CrossRef]
  36. Allan, R.P.; Barlow, M.; Byrne, M.P.; Cherchi, A.; Douville, H.; Fowler, H.J.; Gan, T.Y.; Pendergrass, A.G.; Rosenfeld, D.; Swann, A.L.S.; et al. Advances in understanding large-scale responses of the water cycle to climate change. Ann. N. Y. Acad. Sci. 2020, 1472, 49–75. [Google Scholar] [CrossRef]
  37. Delpla, I.; Jung, A.V.; Baures, E.; Clement, M.; Thomas, O. Impacts of climate change on surface water quality in relation to drinking water production. Environ. Int. 2009, 35, 1225–1233. [Google Scholar] [CrossRef]
  38. Green, T.R.; Taniguchi, M.; Kooi, H.; Gurdak, J.J.; Allen, D.M.; Hiscock, K.M.; Treidel, H.; Aureli, A. Beneath the surface of global change: Impacts of climate change on groundwater. J. Hydrol. 2011, 405, 532–560. [Google Scholar] [CrossRef]
  39. Pokhrel, Y.; Felfelani, F.; Satoh, Y.; Boulange, J.; Burek, P.; Gädeke, A.; Gerten, D.; Gosling, S.N.; Grillakis, M.; Gudmundsson, L.; et al. Global terrestrial water storage and drought severity under climate change. Nat. Clim. Change 2021, 11, 226–233. [Google Scholar] [CrossRef]
  40. Fan, Y.; Shi, X.; Li, X.; Feng, X. Livelihood resilience of vulnerable groups in the face of climate change: A systematic review and meta-analysis. Environ. Dev. 2022, 44, 100777. [Google Scholar]
  41. Pallubinsky, H.; Kramer, R.P.; van Marken Lichtenbelt, W.D. Establishing resilience in times of climate change—A perspective on humans and buildings. Clim. Change 2023, 176, 135. [Google Scholar] [CrossRef]
  42. EEA Climate Change and Water Adaptation Issues. EEA Briefing. 2007/NO.1. 2007. Available online: https://www.eea.europa.eu/en/analysis/publications/briefing_2007_1 (accessed on 7 January 2025).
  43. Aguiar, F.C.; Bentz, J.; Silva, J.M.; Fonseca, A.L.; Swart, R.; Santos, F.D.; Penha-Lopes, G. Adaptation to climate change at local level in Europe: An overview. Environ. Sci. Policy 2018, 86, 38–63. [Google Scholar]
  44. Fazey, I.; Carmen, E.; Chapin, F.S., III; Ross, H.; Rao-Williams, J.; Lyon, C.; Connon, I.L.C.; Searle, B.A.; Knox, K. Community resilience for a 1.5 C world. Curr. Opin. Environ. Sustain. 2018, 31, 30–40. [Google Scholar]
  45. Glogowska, M.; Bronder, J. Adaptation plans to climate change–range and quality of input data. Econ. Environ. 2019, 68, 99–113. [Google Scholar]
  46. Abbass, K.; Qasim, M.Z.; Song, H.; Murshed, M.; Mahmood, H.; Younis, I. A review of the global climate change impacts, adaptation, and sustainable mitigation measures. Environ. Sci. Pollut. Res. 2022, 29, 42539–42559. [Google Scholar] [CrossRef]
  47. Banaszak, K.; Gajda, M.; Hobot, A.; Mazur, M.; Renc, A. Nature-Climate Indicators for Sustainable Urban Development. A Guide for Cities; Polish Ministry of Climate and Environment: Warszawa, Poland, 2022; 31p. (In Polish) [Google Scholar]
  48. Hartmann, D.L.; Tank, A.M.K.; Rusticucci, M.; Alexander, L.V.; Brönnimann, S.; Charabi, Y.A.R.; Dentener, F.J.; Dlugokencky, E.J.; Easterling, D.R.; Kaplan, A.; et al. Observations: Atmosphere and surface. In Climate Change 2013 the Physical Science Basis: Working Group I Contribution to the Fifth Assessment Report of the Intergovernmental Panel on Climate Change; Stocker, T.F., Qin, D., Plattner, D.K., Tignor, M.M.B., Allen, S.K., Boschung, J., Nauels, A., Xia, Y., Bex, V., Midgley, P.M., Eds.; Cambridge University Press: Cambridge, UK, 2013; pp. 159–254. [Google Scholar]
  49. Donat, M.G.; Lowry, A.L.; Alexander, L.V.; O’Gorman, P.A.; Maher, N. More extreme precipitation in the world’s dry and wet regions. Nat. Clim. Change 2016, 6, 508–513. [Google Scholar]
  50. Pendergrass, A.G. What precipitation is extreme? Science 2018, 360, 1072–1073. [Google Scholar]
  51. Myhre, G.; Alterskjær, K.; Stjern, C.W.; Hodnebrog, Ø.; Marelle, L.; Samset, B.H.; Sillmann, J.; Schaller, N.; Fischer, E.; Schulz, M. Frequency of extreme precipitation increases extensively with event rareness under global warming. Sci. Rep. 2019, 9, 16063. [Google Scholar]
  52. Ashley, R.; Garvin, S.; Pasche, E.; Vassilopoulos, A.; Zevenbergen, C. (Eds.) Advances in Urban Flood Management; Taylor & Francis Group: London, UK, 2007; 498p. [Google Scholar]
  53. Kundzewicz, Z.W.; Pińskwar, I.; Brakenridge, G.R. Changes in river flood hazard in Europe: A review. Hydrol. Res. 2018, 49, 294–302. [Google Scholar]
  54. Kron, W.; Eichner, J.; Kundzewicz, Z.W. Reduction of flood risk in Europe–Reflections from a reinsurance perspective. J. Hydrol. 2019, 576, 197–209. [Google Scholar] [CrossRef]
  55. Kundzewicz, Z.W.; Su, B.; Wang, Y.; Wang, G.; Wang, G.; Huang, J.; Jiang, T. Flood risk in a range of spatial perspectives–from global to local scales. Nat. Hazards Earth Syst. Sci. 2019, 19, 1319–1328. [Google Scholar] [CrossRef]
  56. McGrane, S.J. Impacts of urbanisation on hydrological and water quality dynamics, and urban water management: A review. Hydrol. Sci. J. 2016, 61, 2295–2311. [Google Scholar] [CrossRef]
  57. Xu, C.; Rahman, M.; Haase, D.; Wu, Y.; Su, M.; Pauleit, S. Surface runoff in urban areas: The role of residential cover and urban growth form. J. Clean. Prod. 2020, 262, 121421. [Google Scholar] [CrossRef]
  58. Lye, D.J. Rooftop runoff as a source of contamination: A review. Sci. Total Environ. 2009, 407, 5429–5434. [Google Scholar] [CrossRef]
  59. García-Ávila, F.; Guanoquiza-Suárez, M.; Guzmán-Galarza, J.; Cabello-Torres, R.; Valdiviezo-Gonzales, L. Rainwater harvesting and storage systems for domestic supply: An overview of research for water scarcity management in rural areas. Results Eng. 2023, 18, 101153. [Google Scholar] [CrossRef]
  60. Kati, V.; Jari, N. Bottom-up thinking—Identifying socio-cultural values of ecosystem services in local blue–green infrastructure planning in Helsinki, Finland. Land Use Policy 2016, 50, 537–547. [Google Scholar] [CrossRef]
  61. Ventriglio, A.; Torales, J.; Castaldelli-Maia, J.M.; De Berardis, D.; Bhugra, D. Urbanization and emerging mental health issues. CNS Spectr. 2021, 26, 43–50. [Google Scholar] [CrossRef]
  62. Cianconi, P.; Hanife, B.; Hirsch, D.; Janiri, L. Is climate change affecting mental health of urban populations? Curr. Opin. Psychiatry 2023, 36, 213–218. [Google Scholar] [CrossRef]
  63. Morrissey, S.A.; Reser, J.P. Natural disasters, climate change and mental health considerations for rural Australia. Aust. J. Rural Health 2007, 15, 120–125. [Google Scholar] [CrossRef]
  64. Available online: https://impact.economist.com/sustainability/net-zero-and-energy/how-to-amplify-the-role-of-cities-in-climate-action (accessed on 8 January 2025).
  65. Available online: https://impact.economist.com/sustainability/resilience-and-adaptation/cities-are-the-missing-piece-for-countries-to-address-climate-change (accessed on 8 January 2025).
  66. CDP. CITIES ON THE ROUTE TO 2030 Building a Zero Emissions, Resilient Planet for All; CDP: London UK, 2021; 30p, Available online: https://cdn.cdp.net/cdp-production/cms/reports/documents/000/005/759/original/CDP_Cities_on_the_Route_to_2030.pdf?1621329680 (accessed on 8 January 2025).
  67. Institute for Ecology of Industrial Areas. Adaptation Handbook for Cities. Guidelines for Preparing a Municipal Climate Change Adaptation Plan; Ministry of the Environment: Warszawa, Poland, 2015. (In Polish) [Google Scholar]
  68. Klimada 2.0. Adaptation Manual for Cities, Update 2023. In Guidelines for the Preparation of a Municipal Climate Change Adaptation Plan; Klimada 2.0; Institute of Environmental Protection: Warszawa, Poland. Available online: https://klimada2.ios.gov.pl/wp-content/uploads/2023/09/Podrecznik-adaptacji-dla-miast_aktualizacja-2023_compressed.pdf (accessed on 8 January 2025).
  69. Eco-Precision. Environmental Protection Programme for the City of Bielsko—Biała Until 2025 with an Outlook to 2029; Eco-Precision: Bielsko Biała, Poland, 2022; 541p, Available online: https://bielsko-biala.pl/sites/default/files/inline-files/XLIV_1014_2022_OSE.Kopia%20%281%29.pdf (accessed on 9 January 2025).
  70. Kisiel, P.S. Politics of Space in Prussian and Austrian-Hungarian Cities. Verlag Herder-Institut: Marburg, Deutschland, 2018; 228p. [Google Scholar]
  71. Cyran, R. Proces suburbanizacji na przykładzie miasta Bielsko-Biała i wybranych gmin powiatu bielskiego. Stud. Ekon. 2016, 279, 204–213. (In Polish) [Google Scholar]
  72. GARD Environmental Protection Programme for the Municipality of Wyszków for the Years 2015–2018 with an Outlook Until 2022. Wyszków, 2022; 171p. Available online: https://bip.wyszkow.pl/pliki/inne_dokumenty/ochrona_srodowiska/inf_srodowisko/2015/pos_2015.pdf (accessed on 9 January 2025).
  73. Kristvik, E.; Muthanna, T.M.; Alfredsen, K. Assessment of future water availability under climate change, considering scenarios for population growth and ageing infrastructure. J. Water Clim. Change 2019, 10, 1–12. [Google Scholar]
  74. Perera, D.; Smakhtin, V.; Williams, S.; North, T.; Curry, A. Ageing Water Storage Infrastructure: An Emerging Global Risk; UNU-INWEH Report Series; United Nations University Institute for Water; Environment and Health: Hamilton, ON, Canada, 2021; Volume 11, p. 25. [Google Scholar]
  75. Perini, L.; Colantoni, A.; Renzi, G.; Salvati, L. Urban sprawl, soil sealing and impacts on local climate. In Urban Expansion, Land Cover and Soil Ecosystem Services; Gardi, C., Ed.; Routledge: London, UK, 2017; pp. 193–203. [Google Scholar]
  76. Wang, K.; Onodera, S.I.; Saito, M.; Shimizu, Y. Long-term variations in water balance by increase in percent imperviousness of urban regions. J. Hydrol. 2021, 602, 126767. [Google Scholar] [CrossRef]
  77. Holman-Dodds, J.K.; Bradley, A.A.; Potter, K.W. Evaluation of hydrologic benefits of infiltration based urban storm water management 1. JAWRA J. Am. Water Resour. Assoc. 2003, 39, 205–215. [Google Scholar]
  78. Stein, U.; Özerol, G.; Tröltzsch, J.; Landgrebe, R.; Szendrenyi, A.; Vidaurre, R. European drought and water scarcity policies. In Governance for Drought Resilience: Land and Water Drought Management in Europe; Bressers, H., Bressers, N., Larrue, C., Eds.; SpringerOpen: Cham, Switzerland, 2016; pp. 17–43. [Google Scholar]
  79. Seckler, D.; Barker, R.; Amarasinghe, U. Water scarcity in the twenty-first century. Int. J. Water Resour. Dev. 1999, 15, 29–42. [Google Scholar]
  80. Chapman, C.; Hall, J.W. Designing green infrastructure and sustainable drainage systems in urban development to achieve multiple ecosystem benefits. Sustain. Cities Soc. 2022, 85, 104078. [Google Scholar]
  81. Kaur, R.; Gupta, K. Blue-Green Infrastructure (BGI) network in urban areas for sustainable storm water management: A geospatial approach. City Environ. Interact. 2022, 16, 100087. [Google Scholar] [CrossRef]
  82. Klimada 2.0 Project Site. Available online: https://klimada2.ios.gov.pl/pokaz-publikacje/ (accessed on 23 January 2025).
  83. Trenberth, K.E.; Dai, A.; Rasmussen, R.M.; Parsons, D.B. The changing character of precipitation. Bull. Am. Meteorol. Soc. 2003, 84, 1205–1218. [Google Scholar]
  84. Alexander, L.V.; Zhang, X.; Peterson, T.C.; Caesar, J.; Gleason, B.; Klein Tank, A.M.G.; Haylock, M.; Collins, D.; Trewin, B.; Rahimzadeh, F.; et al. Global observed changes in daily climate extremes of temperature and precipitation. J. Geophys. Res. Atmos. 2006, 111, D05109. [Google Scholar]
  85. You, J.; Wang, S. Higher probability of occurrence of hotter and shorter heat waves followed by heavy rainfall. Geophys. Res. Lett. 2021, 48, e2021GL094831. [Google Scholar] [CrossRef]
  86. Zhang, W.; Villarini, G. Deadly compound heat stress-flooding hazard across the Central United States. Geophys. Res. Lett. 2020, 47, e2020GL089185. [Google Scholar] [CrossRef]
  87. Nirupama, N.; Simonovic, S.P. Increase of flood risk due to urbanisation: A Canadian example. Nat. Hazards 2007, 40, 25–41. [Google Scholar] [CrossRef]
  88. Valtanen, M.; Sillanpää, N.; Setälä, H. Effects of land use intensity on stormwater runoff and its temporal occurrence in cold climates. Hydrol. Process. 2014, 28, 2639–2650. [Google Scholar] [CrossRef]
  89. Eimers, M.C.; McDonald, E.C. Hydrologic changes resulting from urban cover in seasonally snow-covered catchments. Hydrol. Process. 2015, 29, 1280–1288. [Google Scholar] [CrossRef]
  90. Moltz, H.L.; Palmer, J.B.; Smith, Z.M. Streamflow alteration from impervious cover: Are all watersheds created equal? JAWRA J. Am. Water Resour. Assoc. 2018, 54, 1222–1238. [Google Scholar] [CrossRef]
  91. Hodgkins, G.A.; Dudley, R.W.; Archfield, S.A.; Renard, B. Effects of climate, regulation, and urbanization on historical flood trends in the United States. J. Hydrol. 2019, 573, 697–709. [Google Scholar] [CrossRef]
  92. Bell, S.; Mishra, H.S.; Elliott, L.R.; Shellock, R.; Vassiljev, P.; Porter, M.; Sydenham, Z.; White, M.P. Urban blue acupuncture: A protocol for evaluating a complex landscape design intervention to improve health and wellbeing in a coastal community. Sustainability 2020, 12, 4084. [Google Scholar] [CrossRef]
  93. Inkiläinen, E.N.; McHale, M.R.; Blank, G.B.; James, A.L.; Nikinmaa, E. The role of the residential urban forest in regulating throughfall: A case study in Raleigh, North Carolina, USA. Landsc. Urban Plan. 2013, 119, 91–103. [Google Scholar] [CrossRef]
  94. Guevara-Escobar, A.; González-Sosa, E.; Véliz-Chávez, C.; Ventura-Ramos, E.; Ramos-Salinas, M. Rainfall interception and distribution patterns of gross precipitation around an isolated Ficus benjamina tree in an urban area. J. Hydrol. 2007, 333, 532–541. [Google Scholar] [CrossRef]
  95. Armson, D.; Stringer, P.; Ennos, A.R. The effect of street trees and amenity grass on urban surface water runoff in Manchester, UK. Urban For. Urban Green. 2013, 12, 282–286. [Google Scholar] [CrossRef]
  96. Anys, M.; Weiler, M. Rainfall interception by urban trees: Event characteristics and tree morphological traits. Hydrol. Process. 2024, 38, e15146. [Google Scholar] [CrossRef]
  97. Smets, V.; Wirion, C.; Bauwens, W.; Hermy, M.; Somers, B.; Verbeiren, B. The importance of city trees for reducing net rainfall: Comparing measurements and simulations. Hydrol. Earth Syst. Sci. 2019, 23, 3865–3884. [Google Scholar] [CrossRef]
  98. Howard, M.; Hathaway, J.M.; Tirpak, R.A.; Lisenbee, W.A.; Sims, S. Quantifying urban tree canopy interception in the southeastern United States. Urban For. Urban Green. 2022, 77, 127741. [Google Scholar] [CrossRef]
  99. Bartens, J.; Day, S.D.; Harris, J.R.; Dove, J.E.; Wynn, T.M. Can urban tree roots improve infiltration through compacted subsoils for stormwater management? J. Environ. Qual. 2008, 37, 2048–2057. [Google Scholar] [CrossRef]
  100. Li, Y.; Babcock, R.W., Jr. Green roof hydrologic performance and modeling: A review. Water Sci. Technol. 2014, 69, 727–738. [Google Scholar]
  101. Safaei-Moghadam, A.; Tarboton, D.; Minsker, B. Estimating the likelihood of roadway pluvial flood based on crowdsourced traffic data and depression-based DEM analysis. Nat. Hazards Earth Syst. Sci. 2023, 23, 1–19. [Google Scholar] [CrossRef]
  102. Huang, H.; Chen, X.; Wang, X.; Wang, X.; Liu, L. A depression-based index to represent topographic control in urban pluvial flooding. Water 2019, 11, 2115. [Google Scholar] [CrossRef]
  103. Malczewski, J. GIS-based multicriteria decision analysis: A survey of the literature. Int. J. Geogr. Inf. Sci. 2006, 20, 703–726. [Google Scholar] [CrossRef]
  104. Rincón, D.; Khan, U.T.; Armenakis, C. Flood risk mapping using GIS and multi-criteria analysis: A greater Toronto area case study. Geosciences 2018, 8, 275. [Google Scholar] [CrossRef]
  105. Danumah, J.H.; Odai, S.N.; Saley, B.M.; Szarzynski, J.; Thiel, M.; Kwaku, A.; Kouame, K.F.; Akpa, L.Y. Flood risk assessment and mapping in Abidjan district using multi-criteria analysis (AHP) model and geoinformation techniques, (cote d’ivoire). Geoenvironmental Disasters 2016, 3, 10. [Google Scholar] [CrossRef]
  106. Hadipour, V.; Vafaie, F.; Deilami, K. Coastal flooding risk assessment using a GIS-based spatial multi-criteria decision analysis approach. Water 2020, 12, 2379. [Google Scholar] [CrossRef]
Figure 1. A diagnostic approach tailored to specific urban conditions, with a particular emphasis on hydrological issues.
Applsci 15 04092 g001
Figure 2. A localisation map of the two cities under investigation.
Applsci 15 04092 g002
Figure 3. The elevation map of Bielsko-Biała City, divided into districts.
Applsci 15 04092 g003
Figure 4. The elevation map of Wyszków City, divided into the city’s parts.
Applsci 15 04092 g004
Figure 5. The spatial distribution of soil sealing in Bielsko-Biała City.
Applsci 15 04092 g005
Figure 6. The spatial distribution of soil sealing in Wyszków City.
Applsci 15 04092 g006
Figure 7. Flooding threats in Bielsko-Biała City include risks from non-drained urban basins as well as overflow from riverbanks.
Applsci 15 04092 g007
Figure 8. The localisation and depth analysis of potential non-drained urban basins in Bielsko-Biała City.
Applsci 15 04092 g008
Figure 9. Flooding threats in Wyszków City include risks from non-drained urban basins as well as overflow from riverbanks.
Applsci 15 04092 g009
Figure 10. The localisation and depth analysis of potential non-drained urban basins in Wyszków City.
Applsci 15 04092 g010
Figure 11. The map of green areas in Bielsko-Biała City consists of: (a) forests, shrubs, trees, and permanent crops based on the BDOT10K database, according to Equation (1); and (b) urban green areas derived from the NDVI index, according to Equation (2).
Applsci 15 04092 g011
Figure 12. The map of green areas in Wyszków City consists of: (a) forests, shrubs, trees, and permanent crops based on the BDOT10K database, according to Equation (1); and (b) urban green areas derived from the NDVI index, according to Equation (2).
Applsci 15 04092 g012
Figure 13. The ranking of Bielsko-Biała City districts according to hydrological hazards, as determined by the MCA analysis.
Applsci 15 04092 g013
Figure 14. The ranking of Wyszków City districts according to hydrological hazards, as determined by the MCA analysis.
Applsci 15 04092 g014
Table 1. Criteria for multi-criteria analysis of flood risks.
IDCriterionUnit
1Average intensity of soil sealing on spatial unit for instance city district[%]
2Average soil sealing[%]
3Percentage of areas that were affected by 100-year flooding[%]
4Area of buildings in the range of 100-year flood[m2]
5Retention potential factor (biologically active areas) [%]
6Average run-off resulting from 1% chance rainfall [mm]
7Percentage of areas covered by non-drained areas [%]
8Percentage of areas covered by buildings adjacent to non-drained areas [%]
9Area of streets prone to flooding [m2]
10Area covered by local flooding [m2]
11Length of flooded streets [m]
12Number of local floods on spatial unit for instance city district [-]
13Number of manholes on spatial unit for instance city district[-]
14Length the drainage network pipes [m]
Table 2. Criteria for multi-criteria analysis of flood risks in Bielsko-Biała City.
IDCriterionWeight
1The average soil sealing intensity within the City district0.2968
2The average soil sealing within the City district0.1502
3The percentage of 100-year floodwater areas within the district’s total surface0.1352
4The retention index (percentage of biologically active areas) for the district0.0967
5The average surface runoff from rainfall with a 1% probability within the district area0.0477
6The percentage of non-drained basin areas0.1282
7Buildings within the 100-year floodplain (ratio of area)0.0465
8Buildings within non-drained basins (ratio of area)0.0987
Table 3. Criteria for multi-criteria analysis of flood risks in Wyszków City.
IDCriterionWeight
1The average soil sealing intensity within the statistical district0.1655
2The average soil sealing within the statistical district0.0938
3The percentage of 100-year floodwater areas within the statistical district’s total surface0.0854
4The retention index (percentage of biologically active areas) for the statistical district0.0670
5The average surface runoff from rainfall with a 1% probability within the statistical district area0.0406
6The percentage of non-drained basin areas within the statistical district0.0773
7Buildings within the 100-year floodplain (ratio of area)0.0347
8Buildings within non-drained basins (ratio of area)0.0597
9The area of flooded roads within statistical district0.1785
10The number of points of local flooding within statistical districts0.1975
Disclaimer/Publisher’s Note: The statements, opinions and data contained in all publications are solely those of the individual author(s) and contributor(s) and not of MDPI and/or the editor(s). MDPI and/or the editor(s) disclaim responsibility for any injury to people or property resulting from any ideas, methods, instructions or products referred to in the content.

