
System Dynamics Simulation of Policy Synergy Effects: How Tradable Green Certificates and Carbon Emission Trading Shape Electricity Market Sustainability

Abstract
1. Introduction
2. Interaction Between TGC and CET in China
3. Materials and Methods
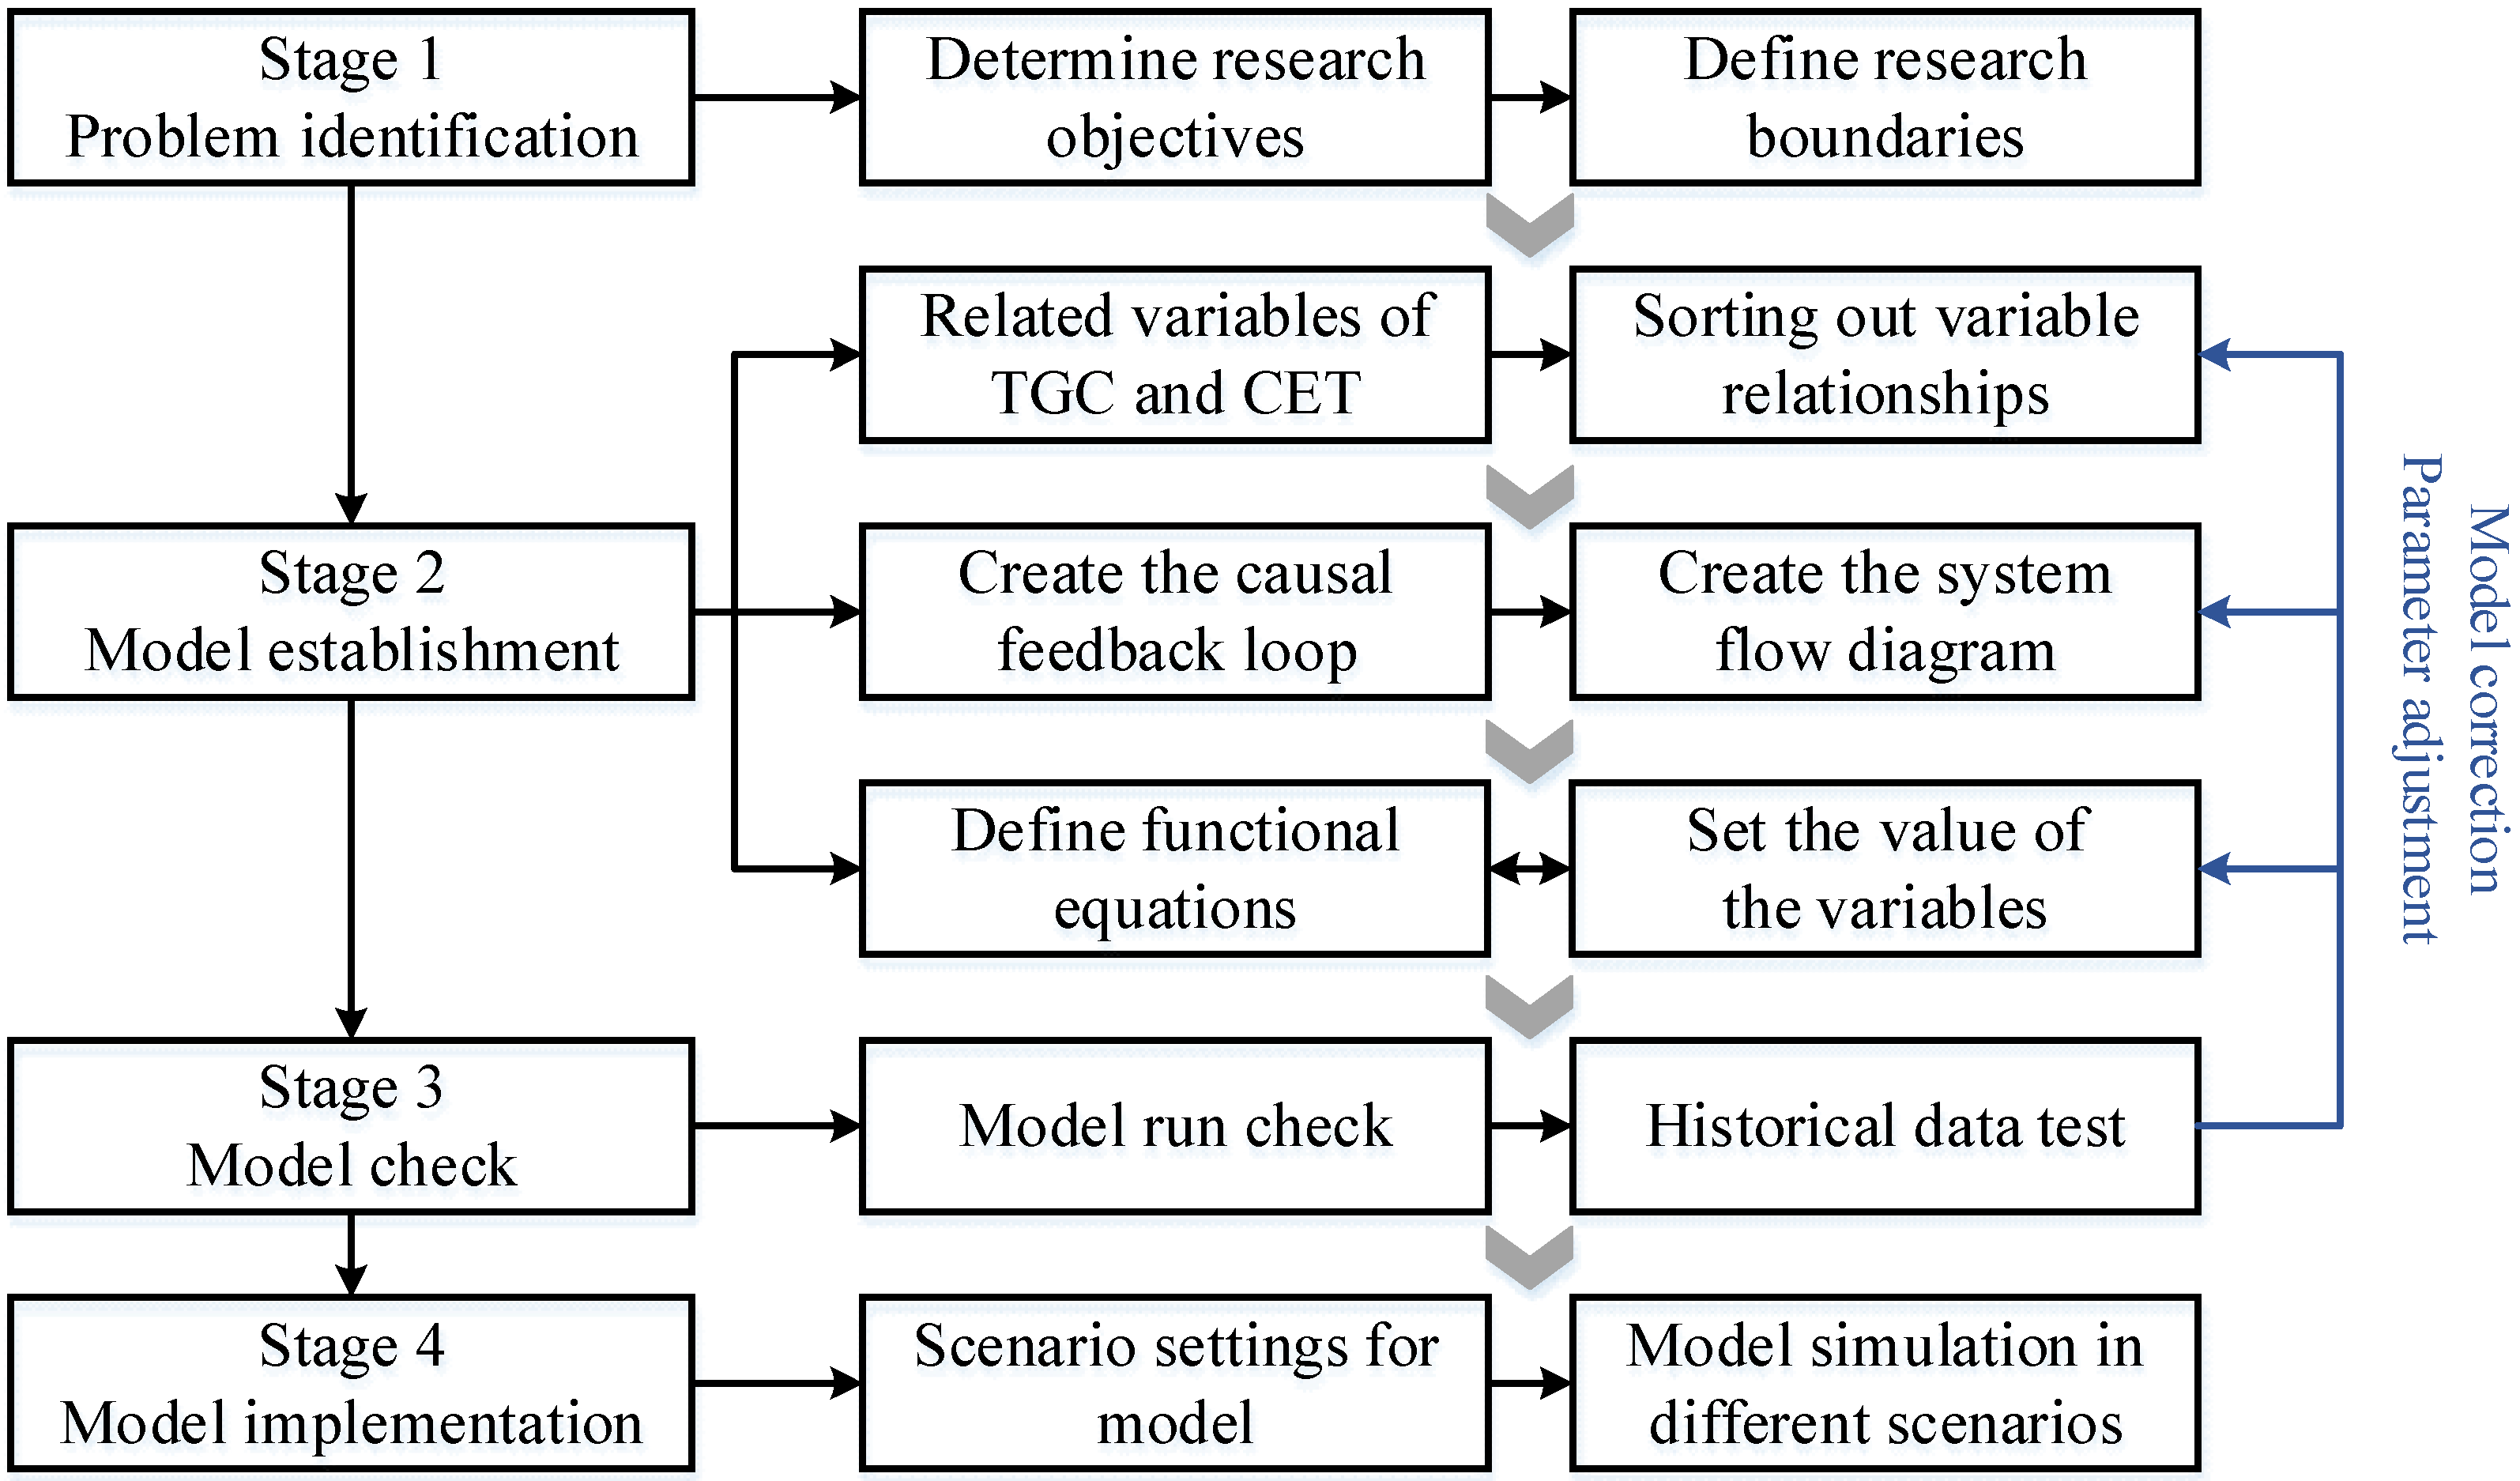
3.1. Research Design
3.2. Model Analysis
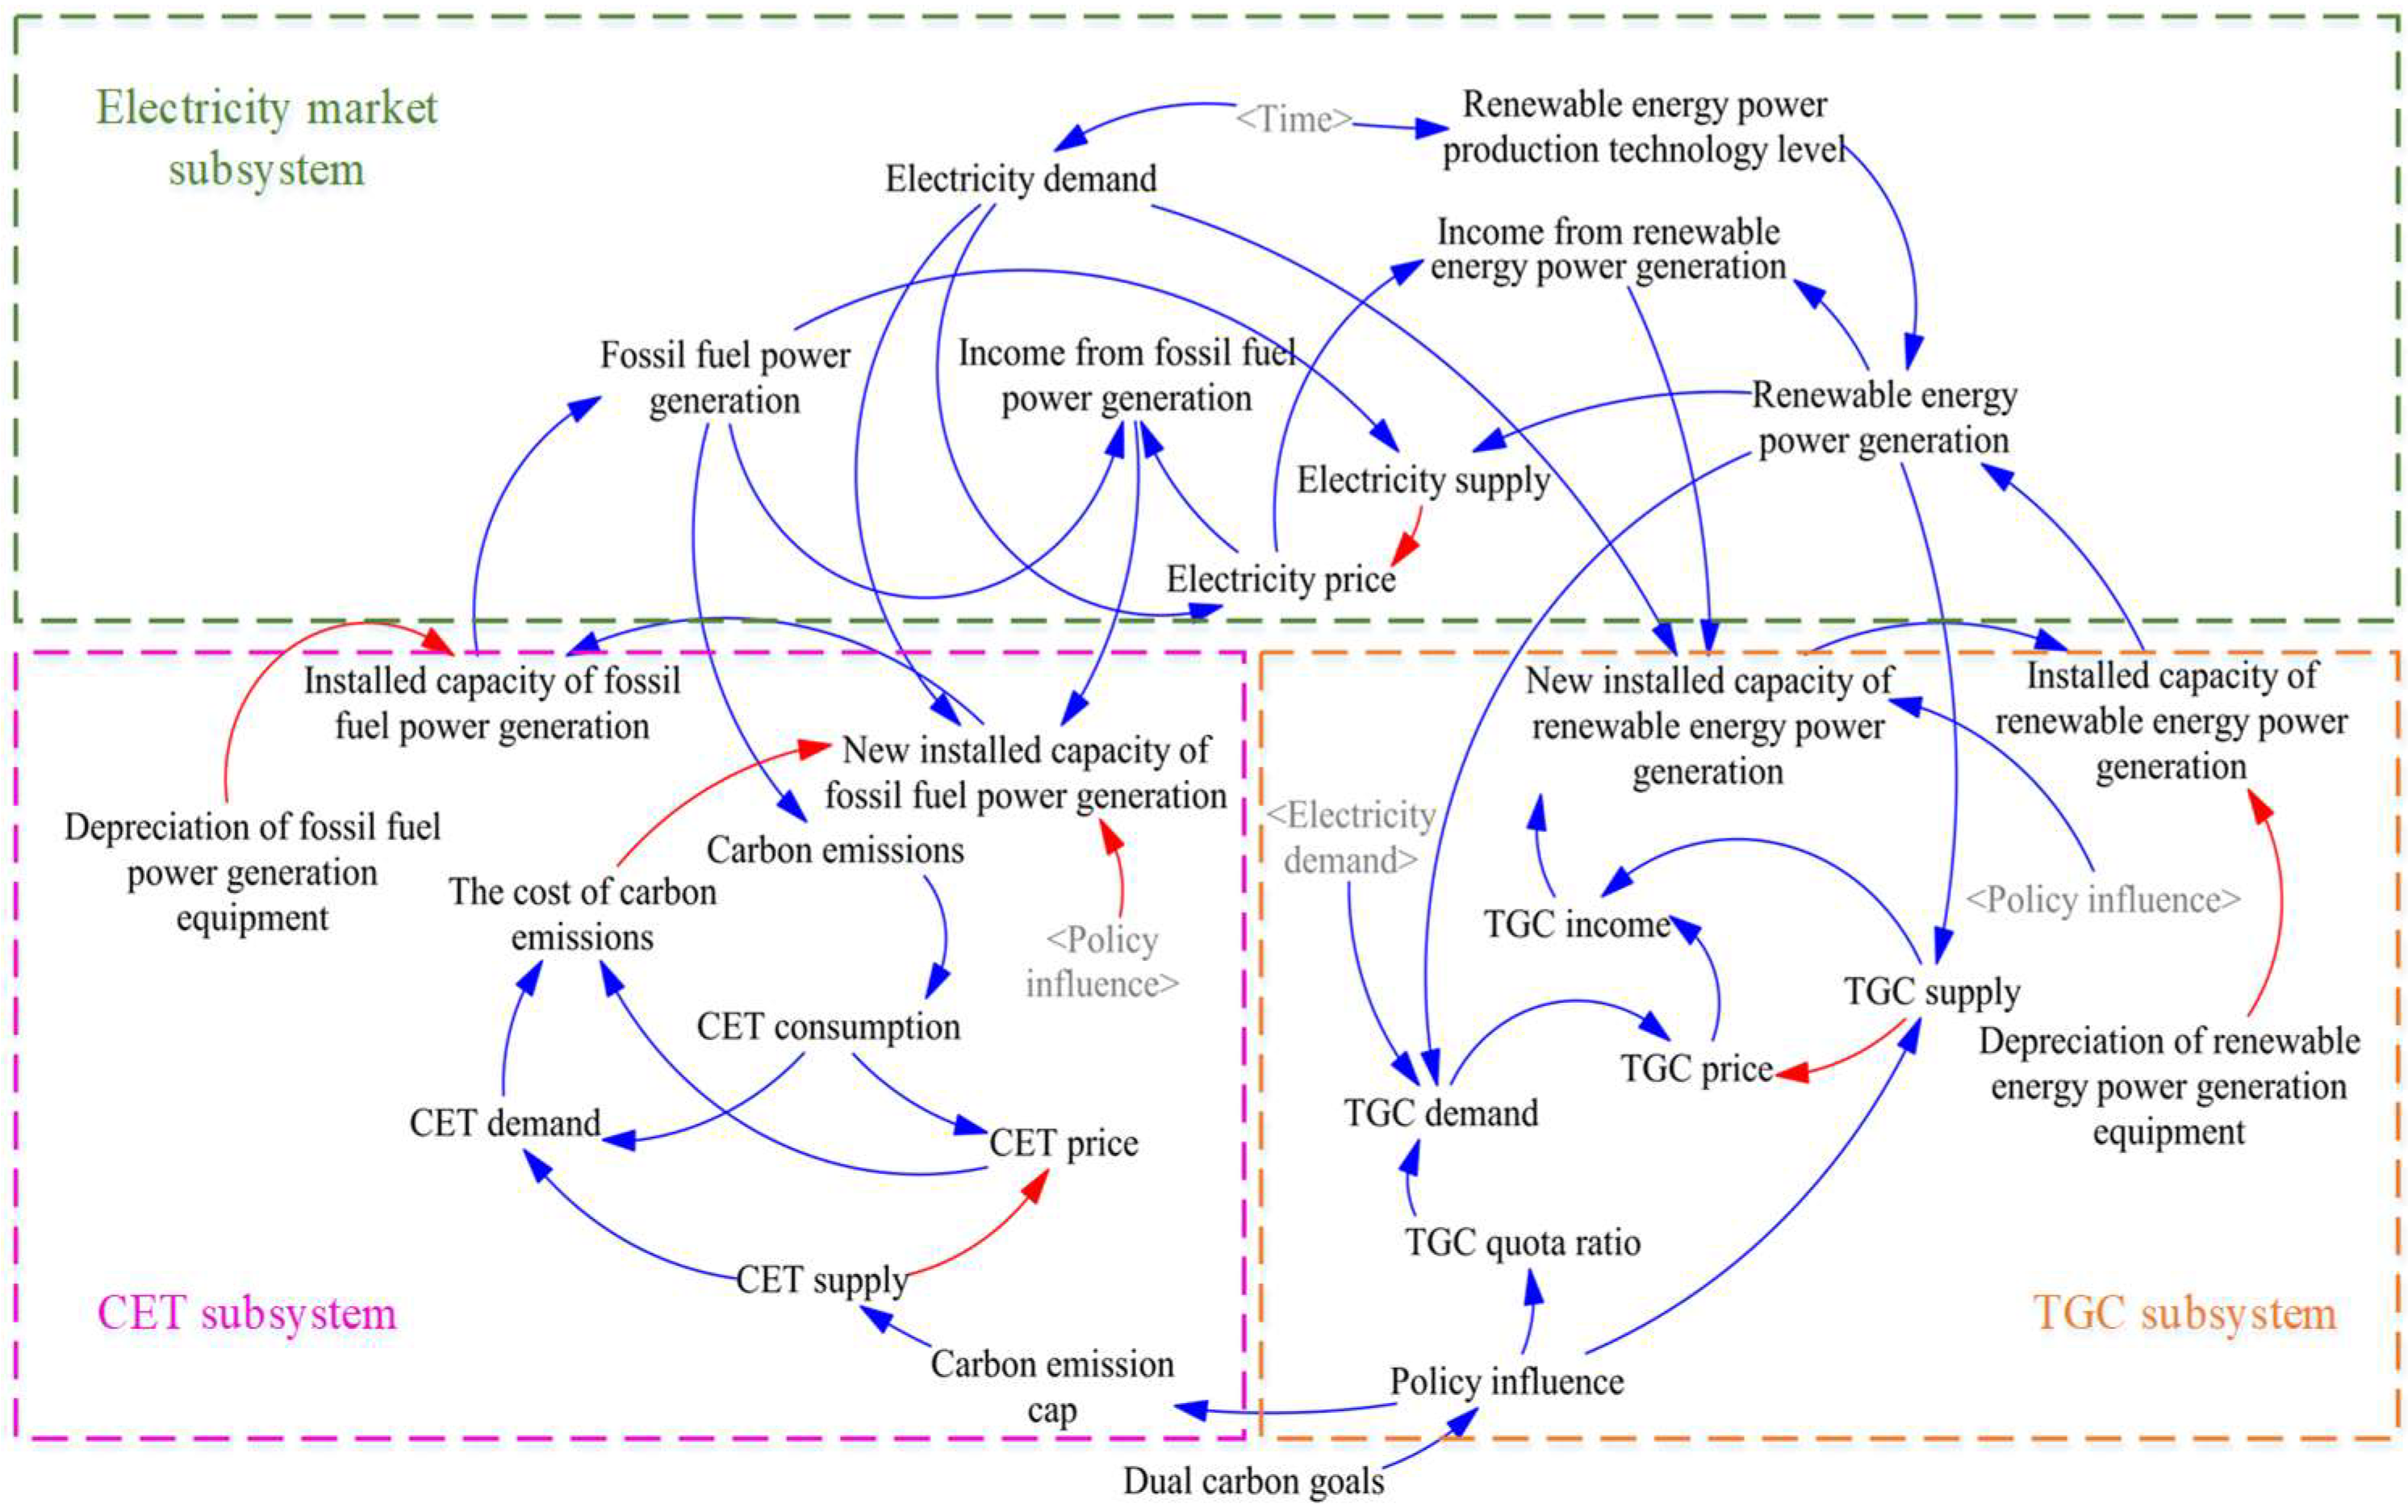
3.2.1. Causal Feedback Loop
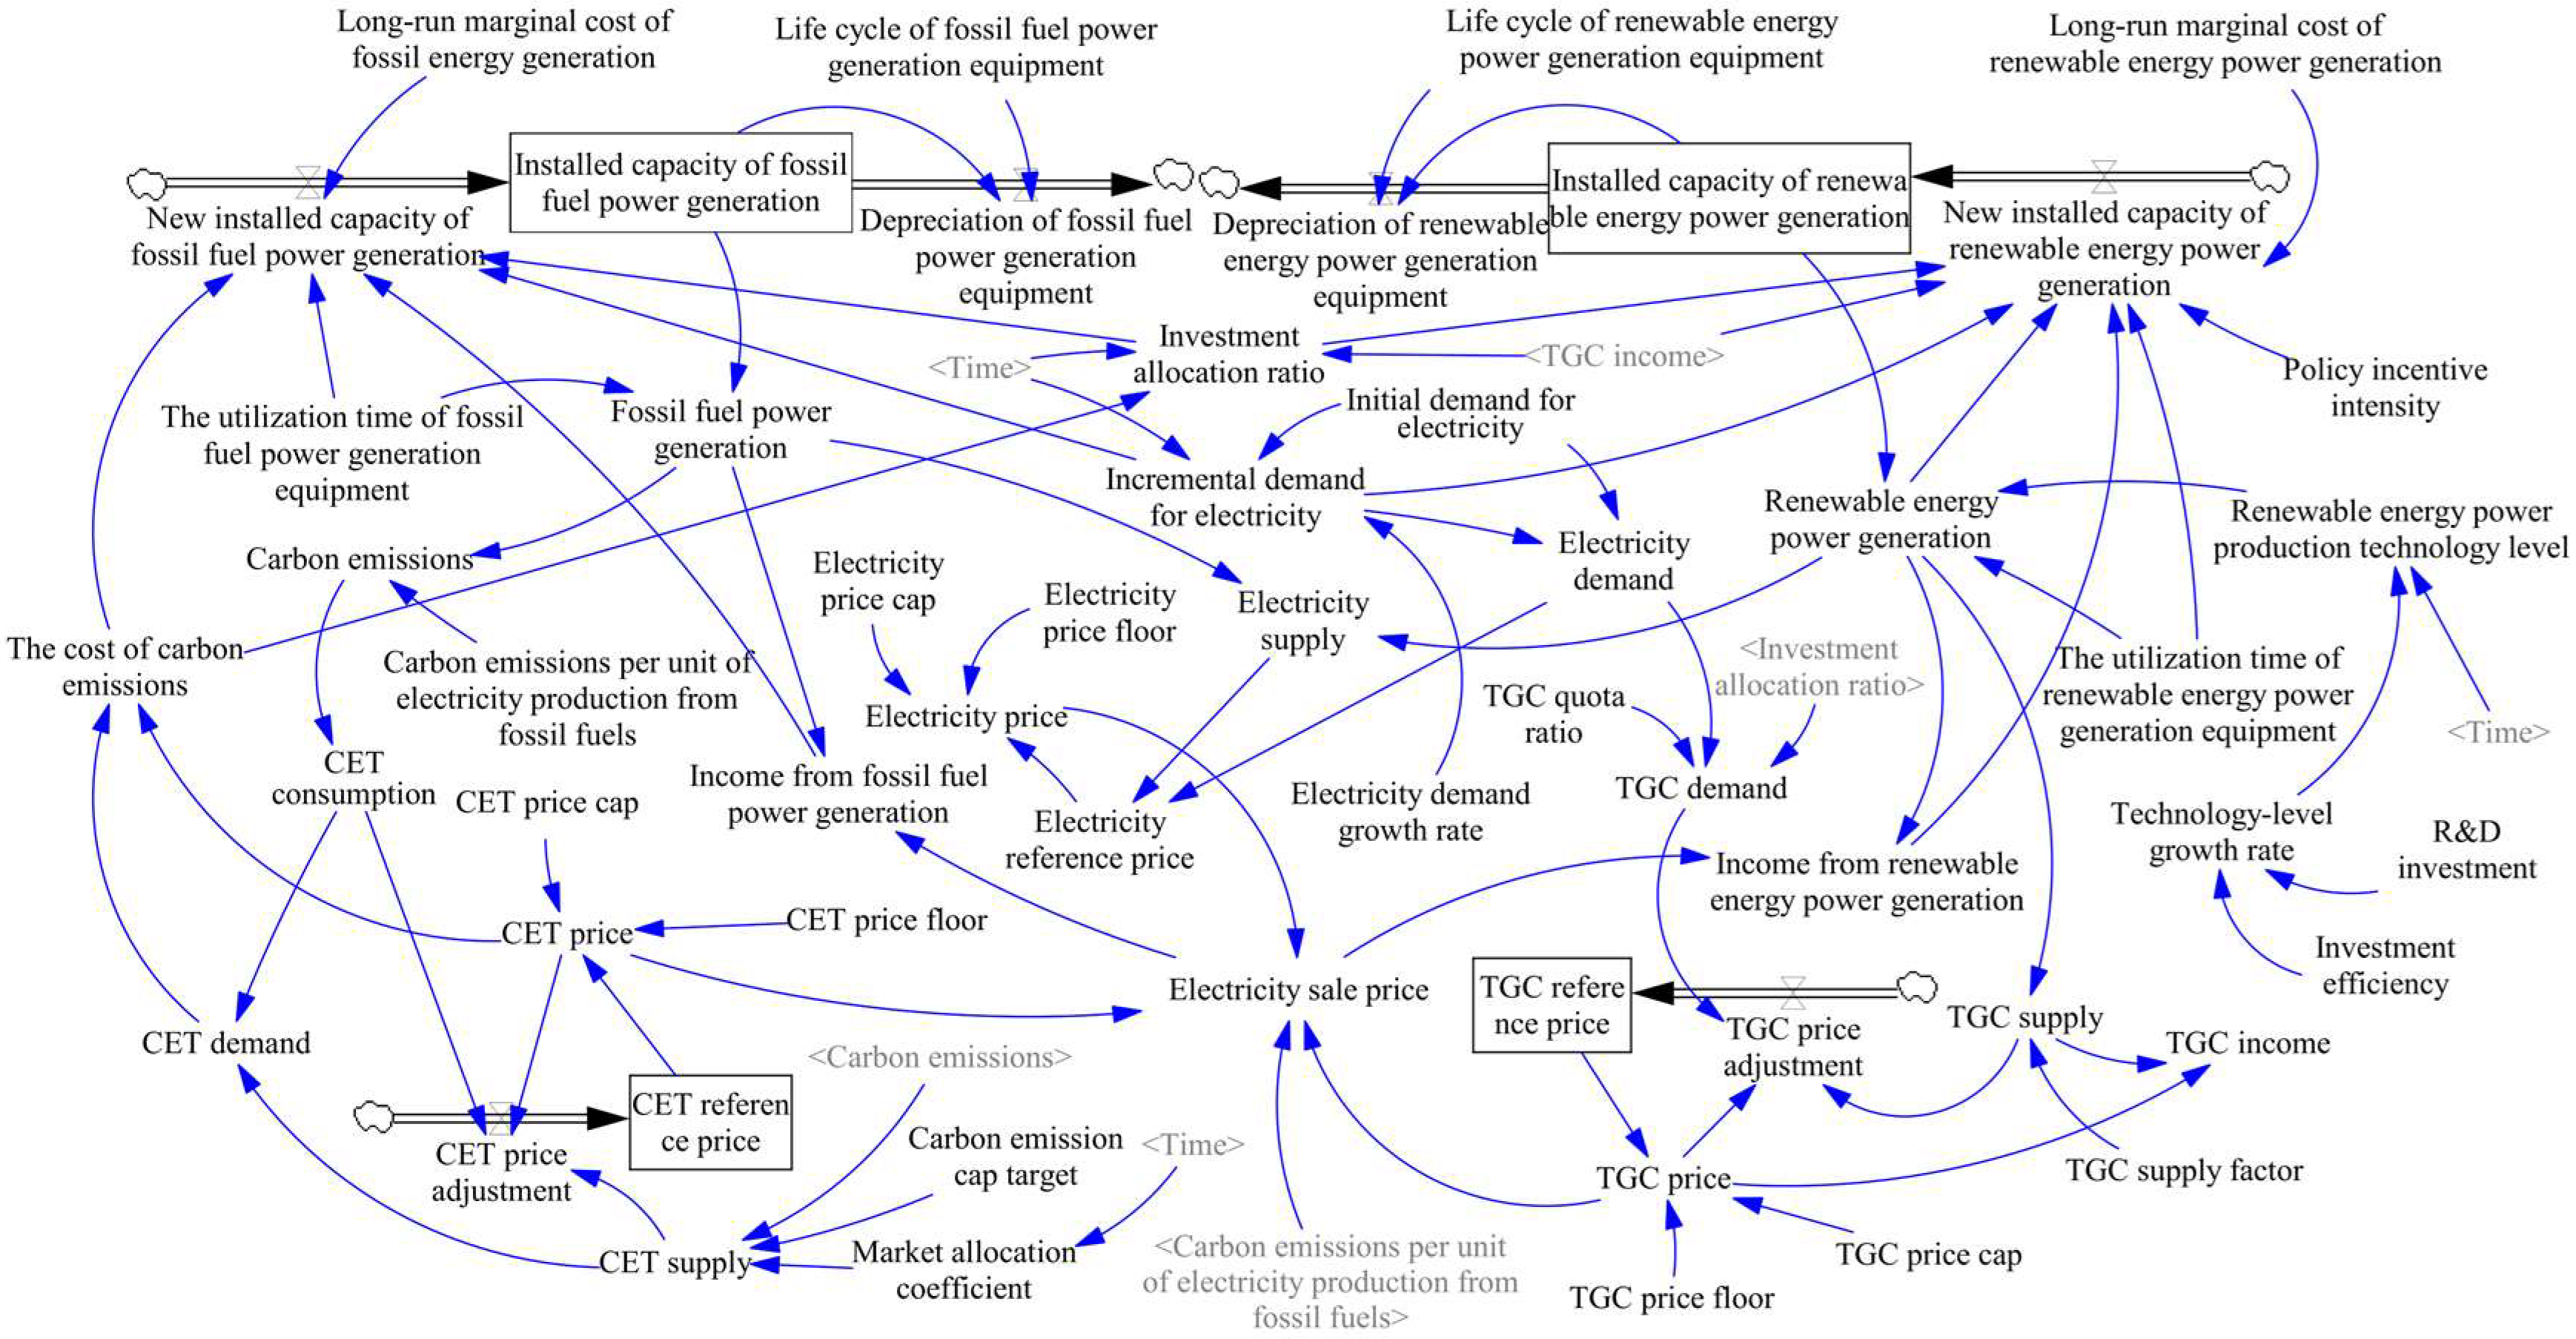
3.2.2. System Flow Diagram
3.3. Data and Variables
3.4. Model Validation
4. Results
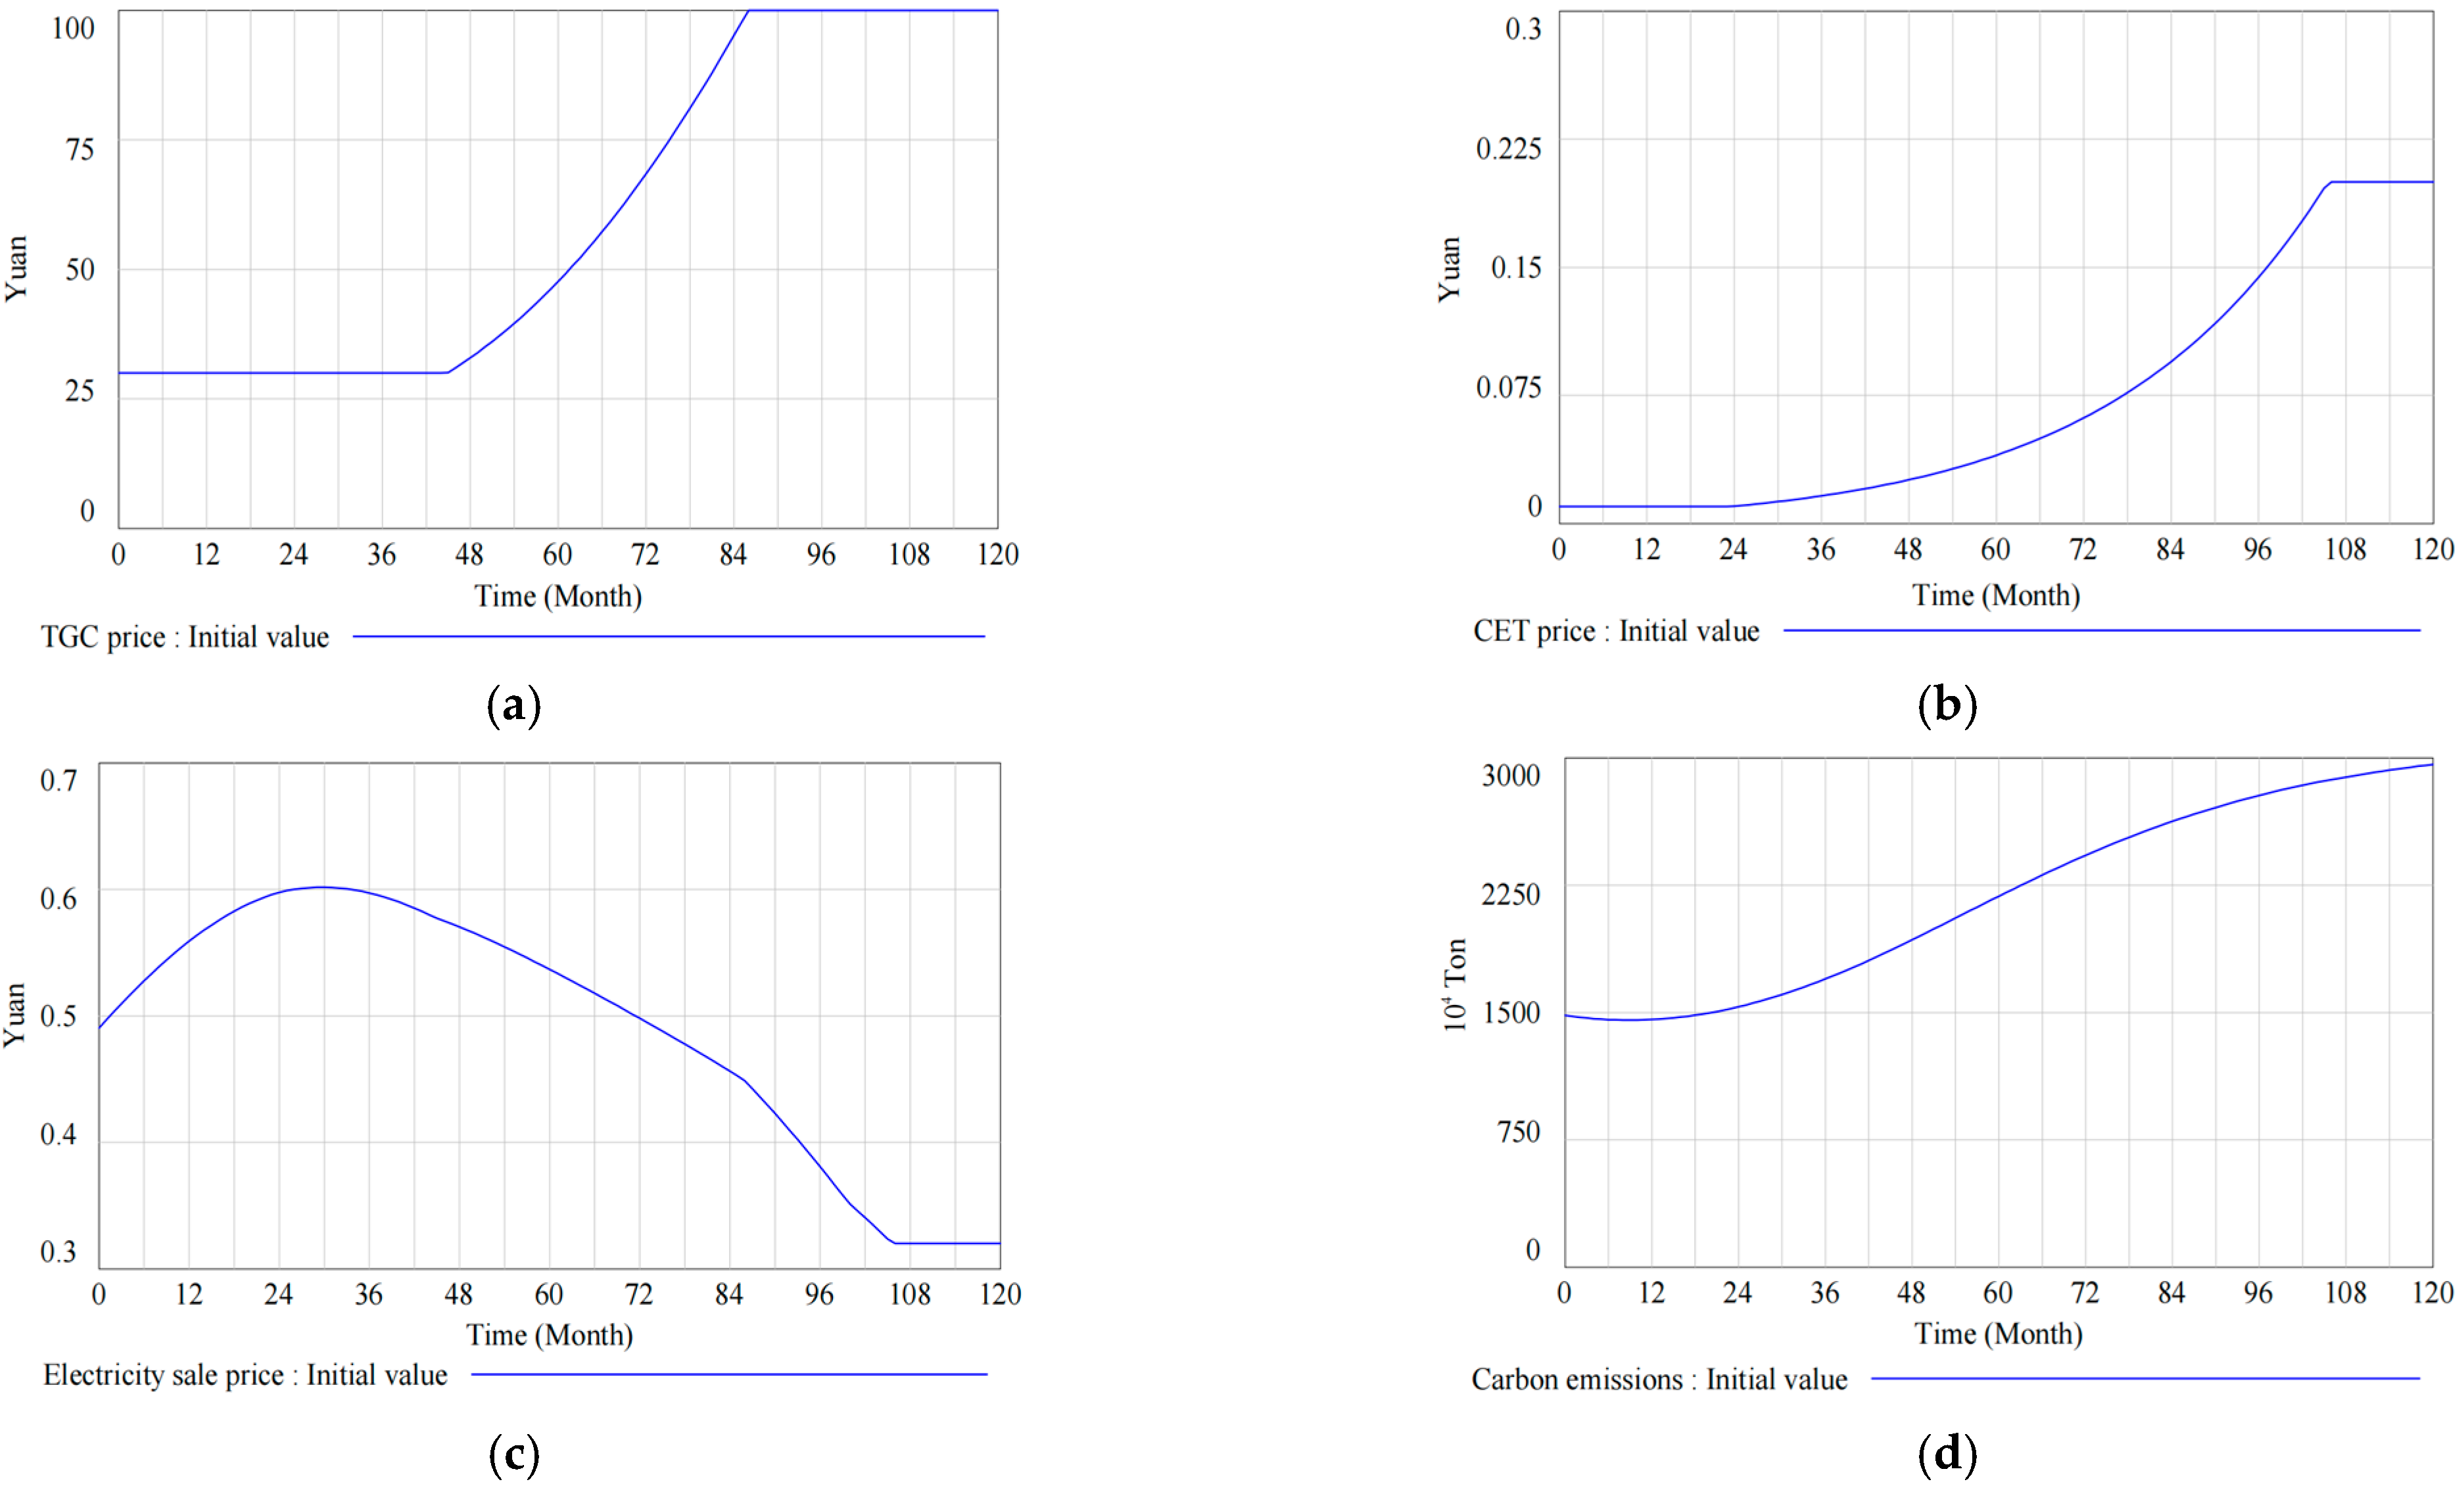
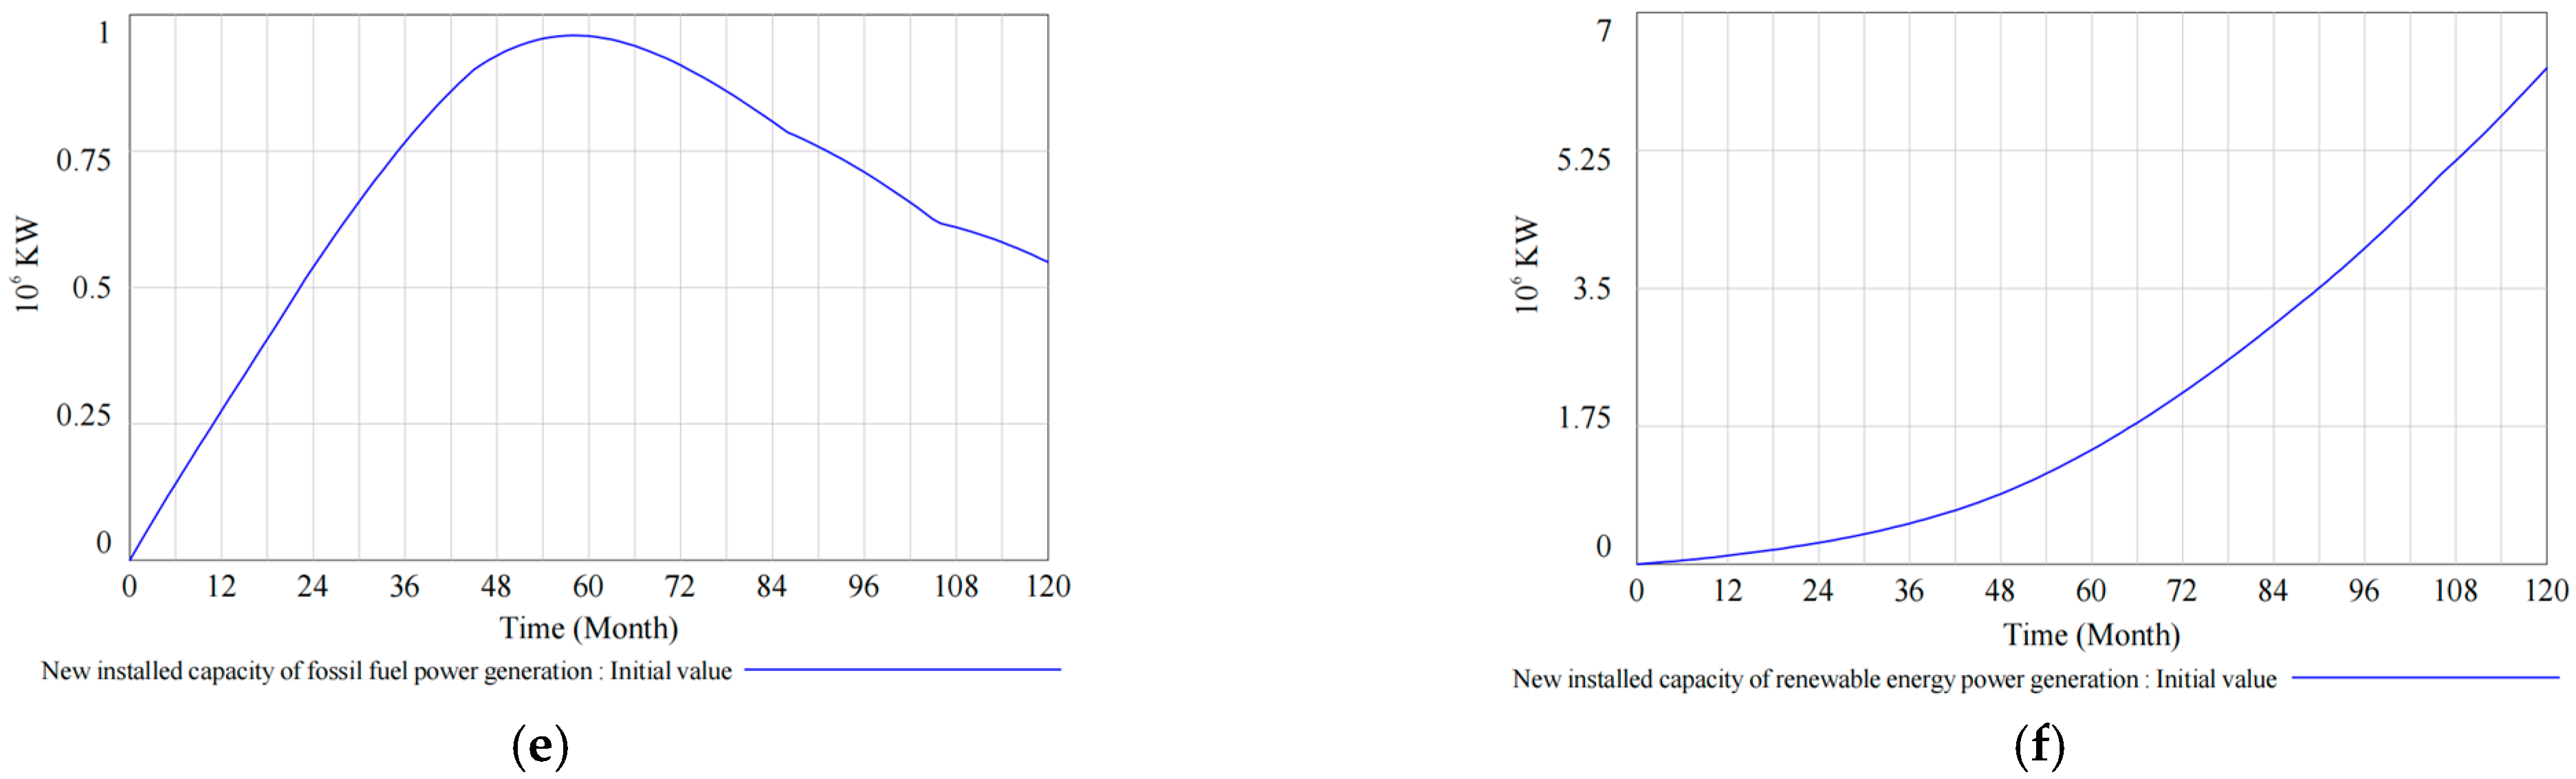
4.1. Initial Simulation Analysis
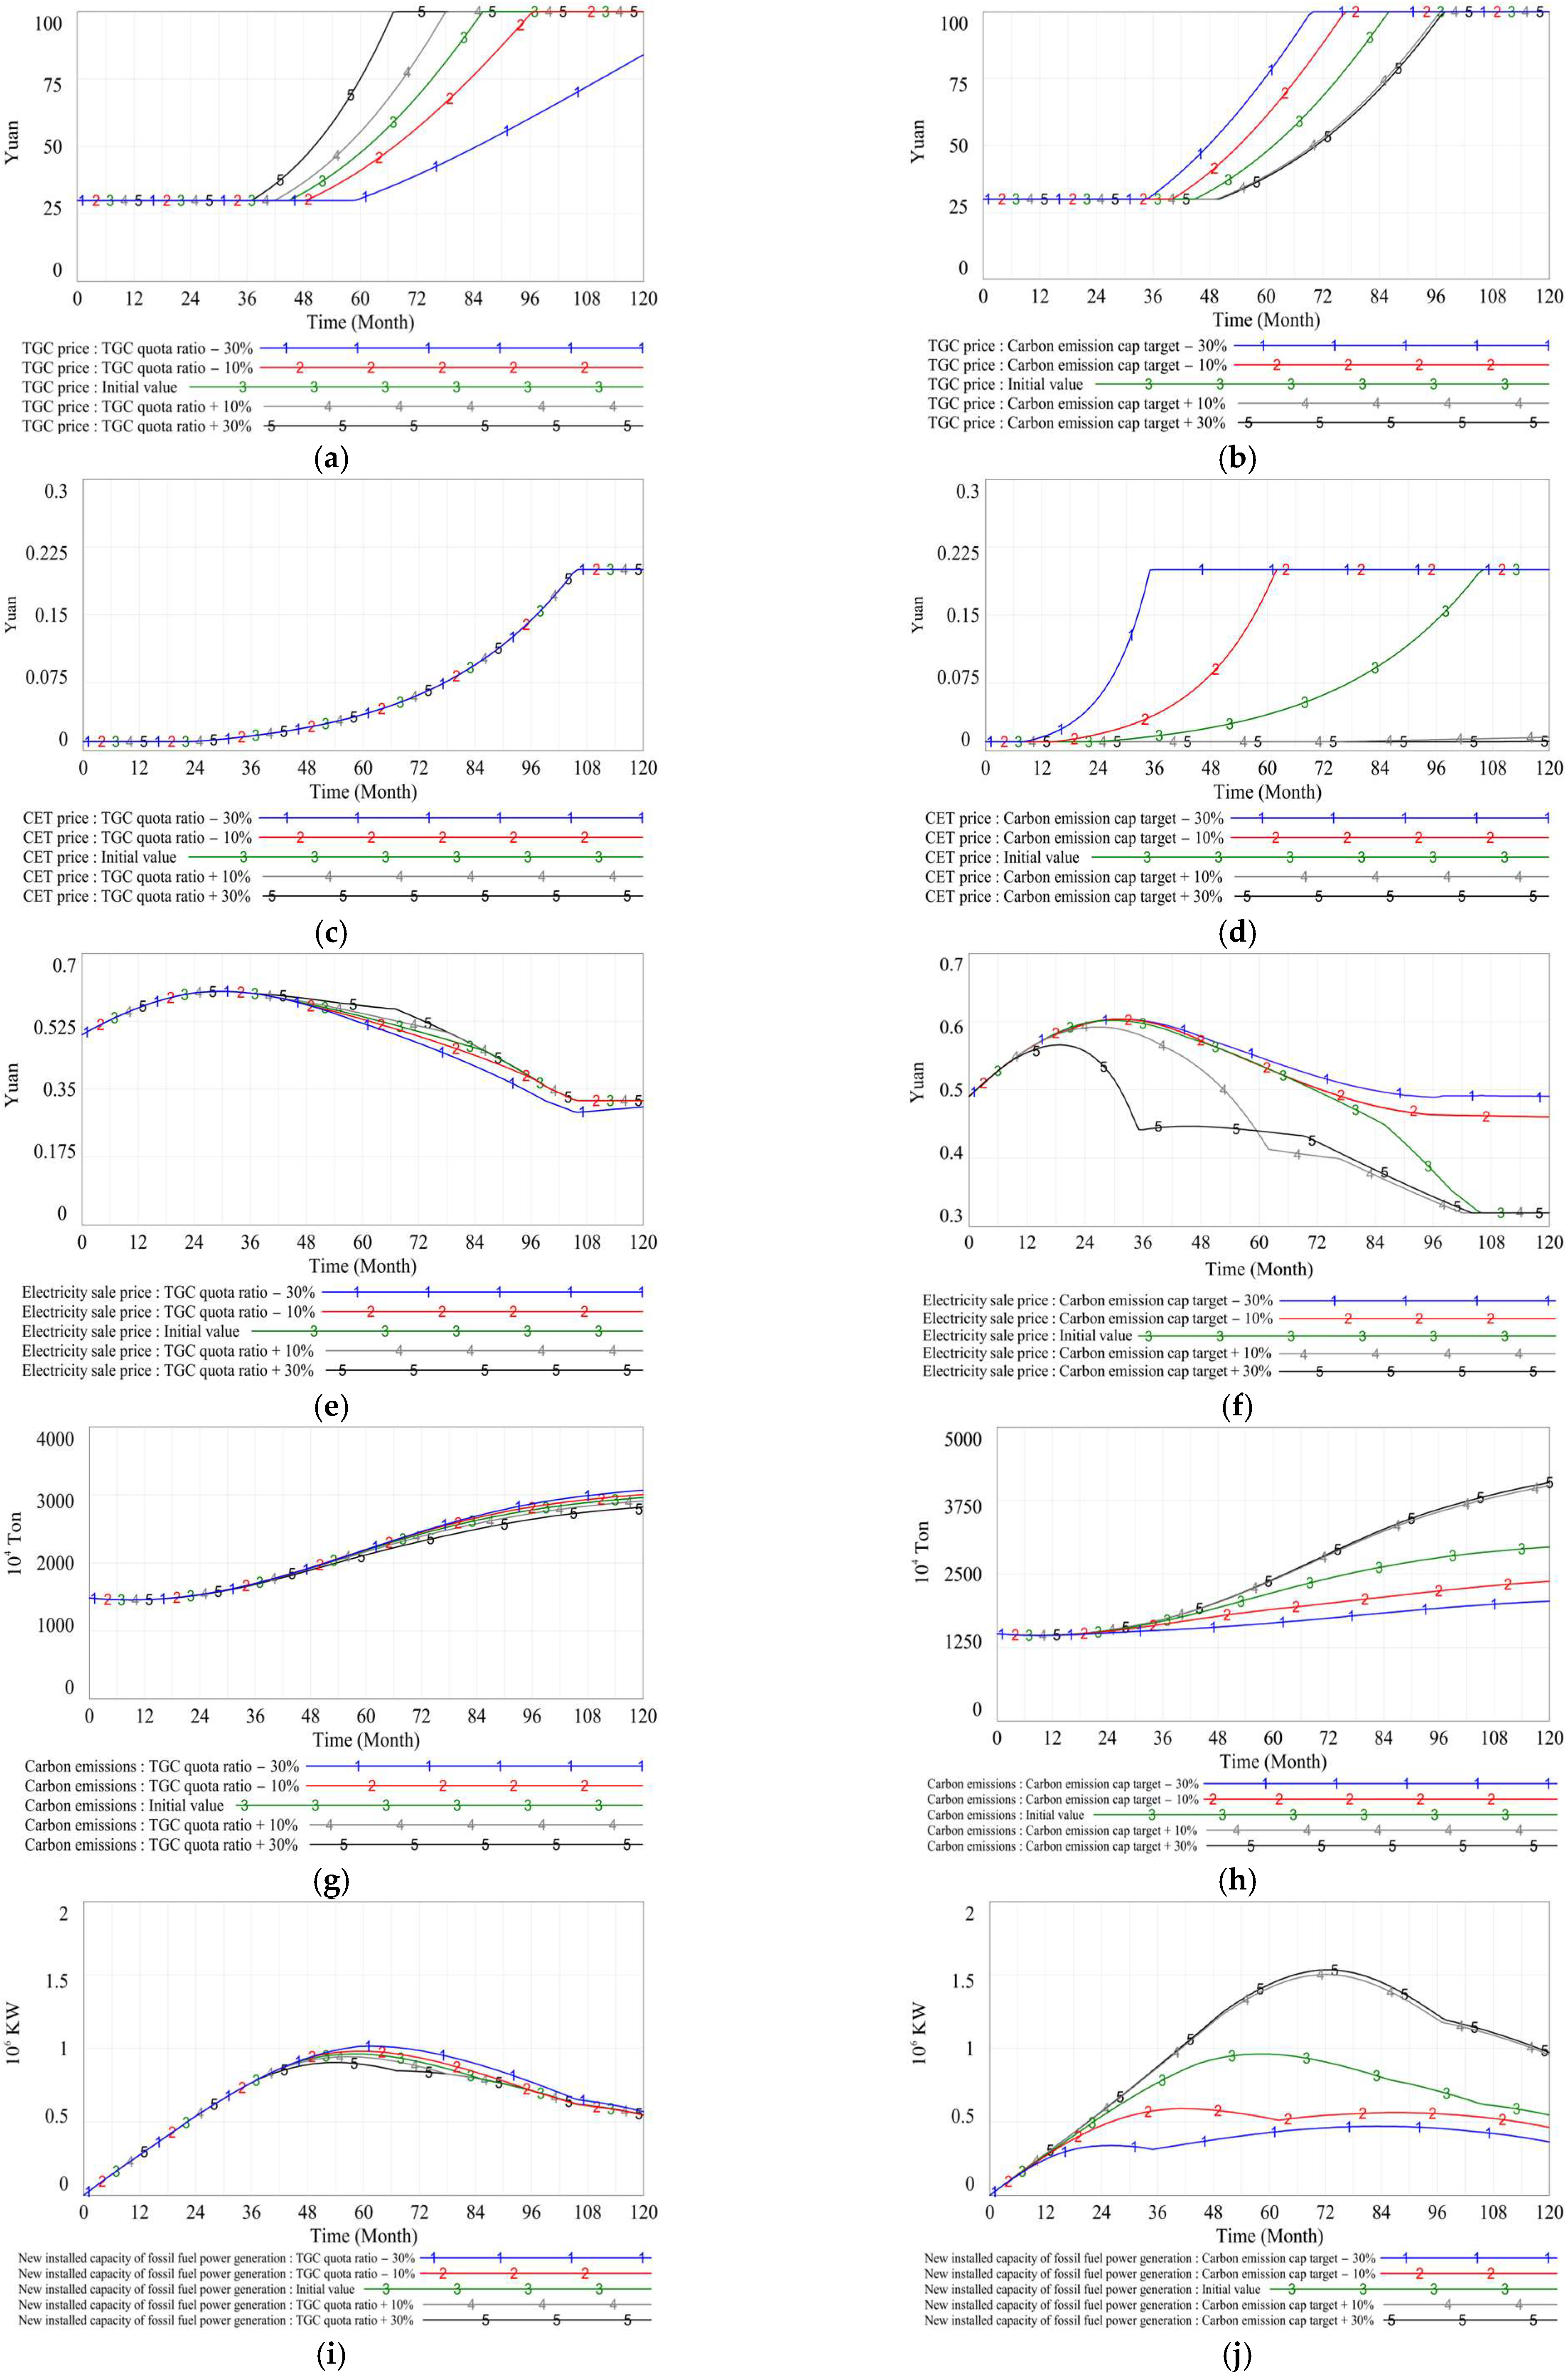
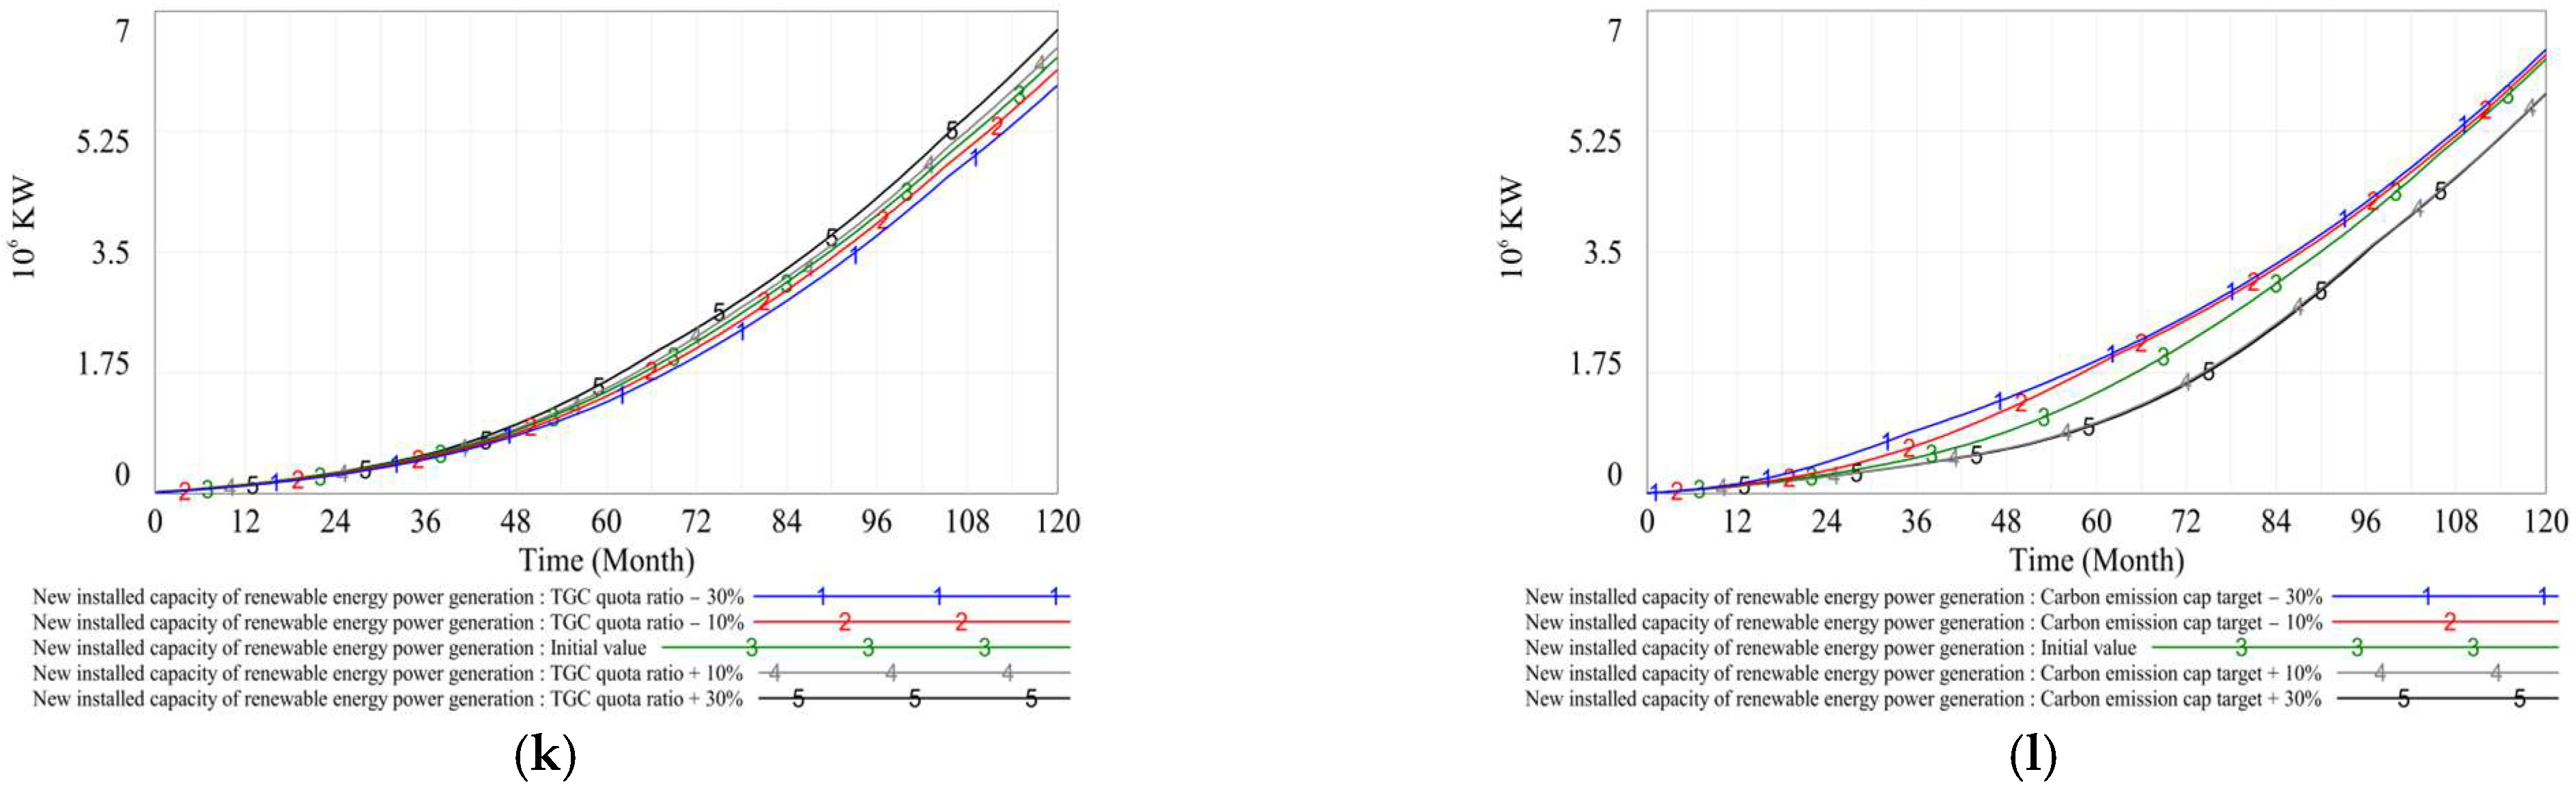
4.2. Sensitivity Analysis
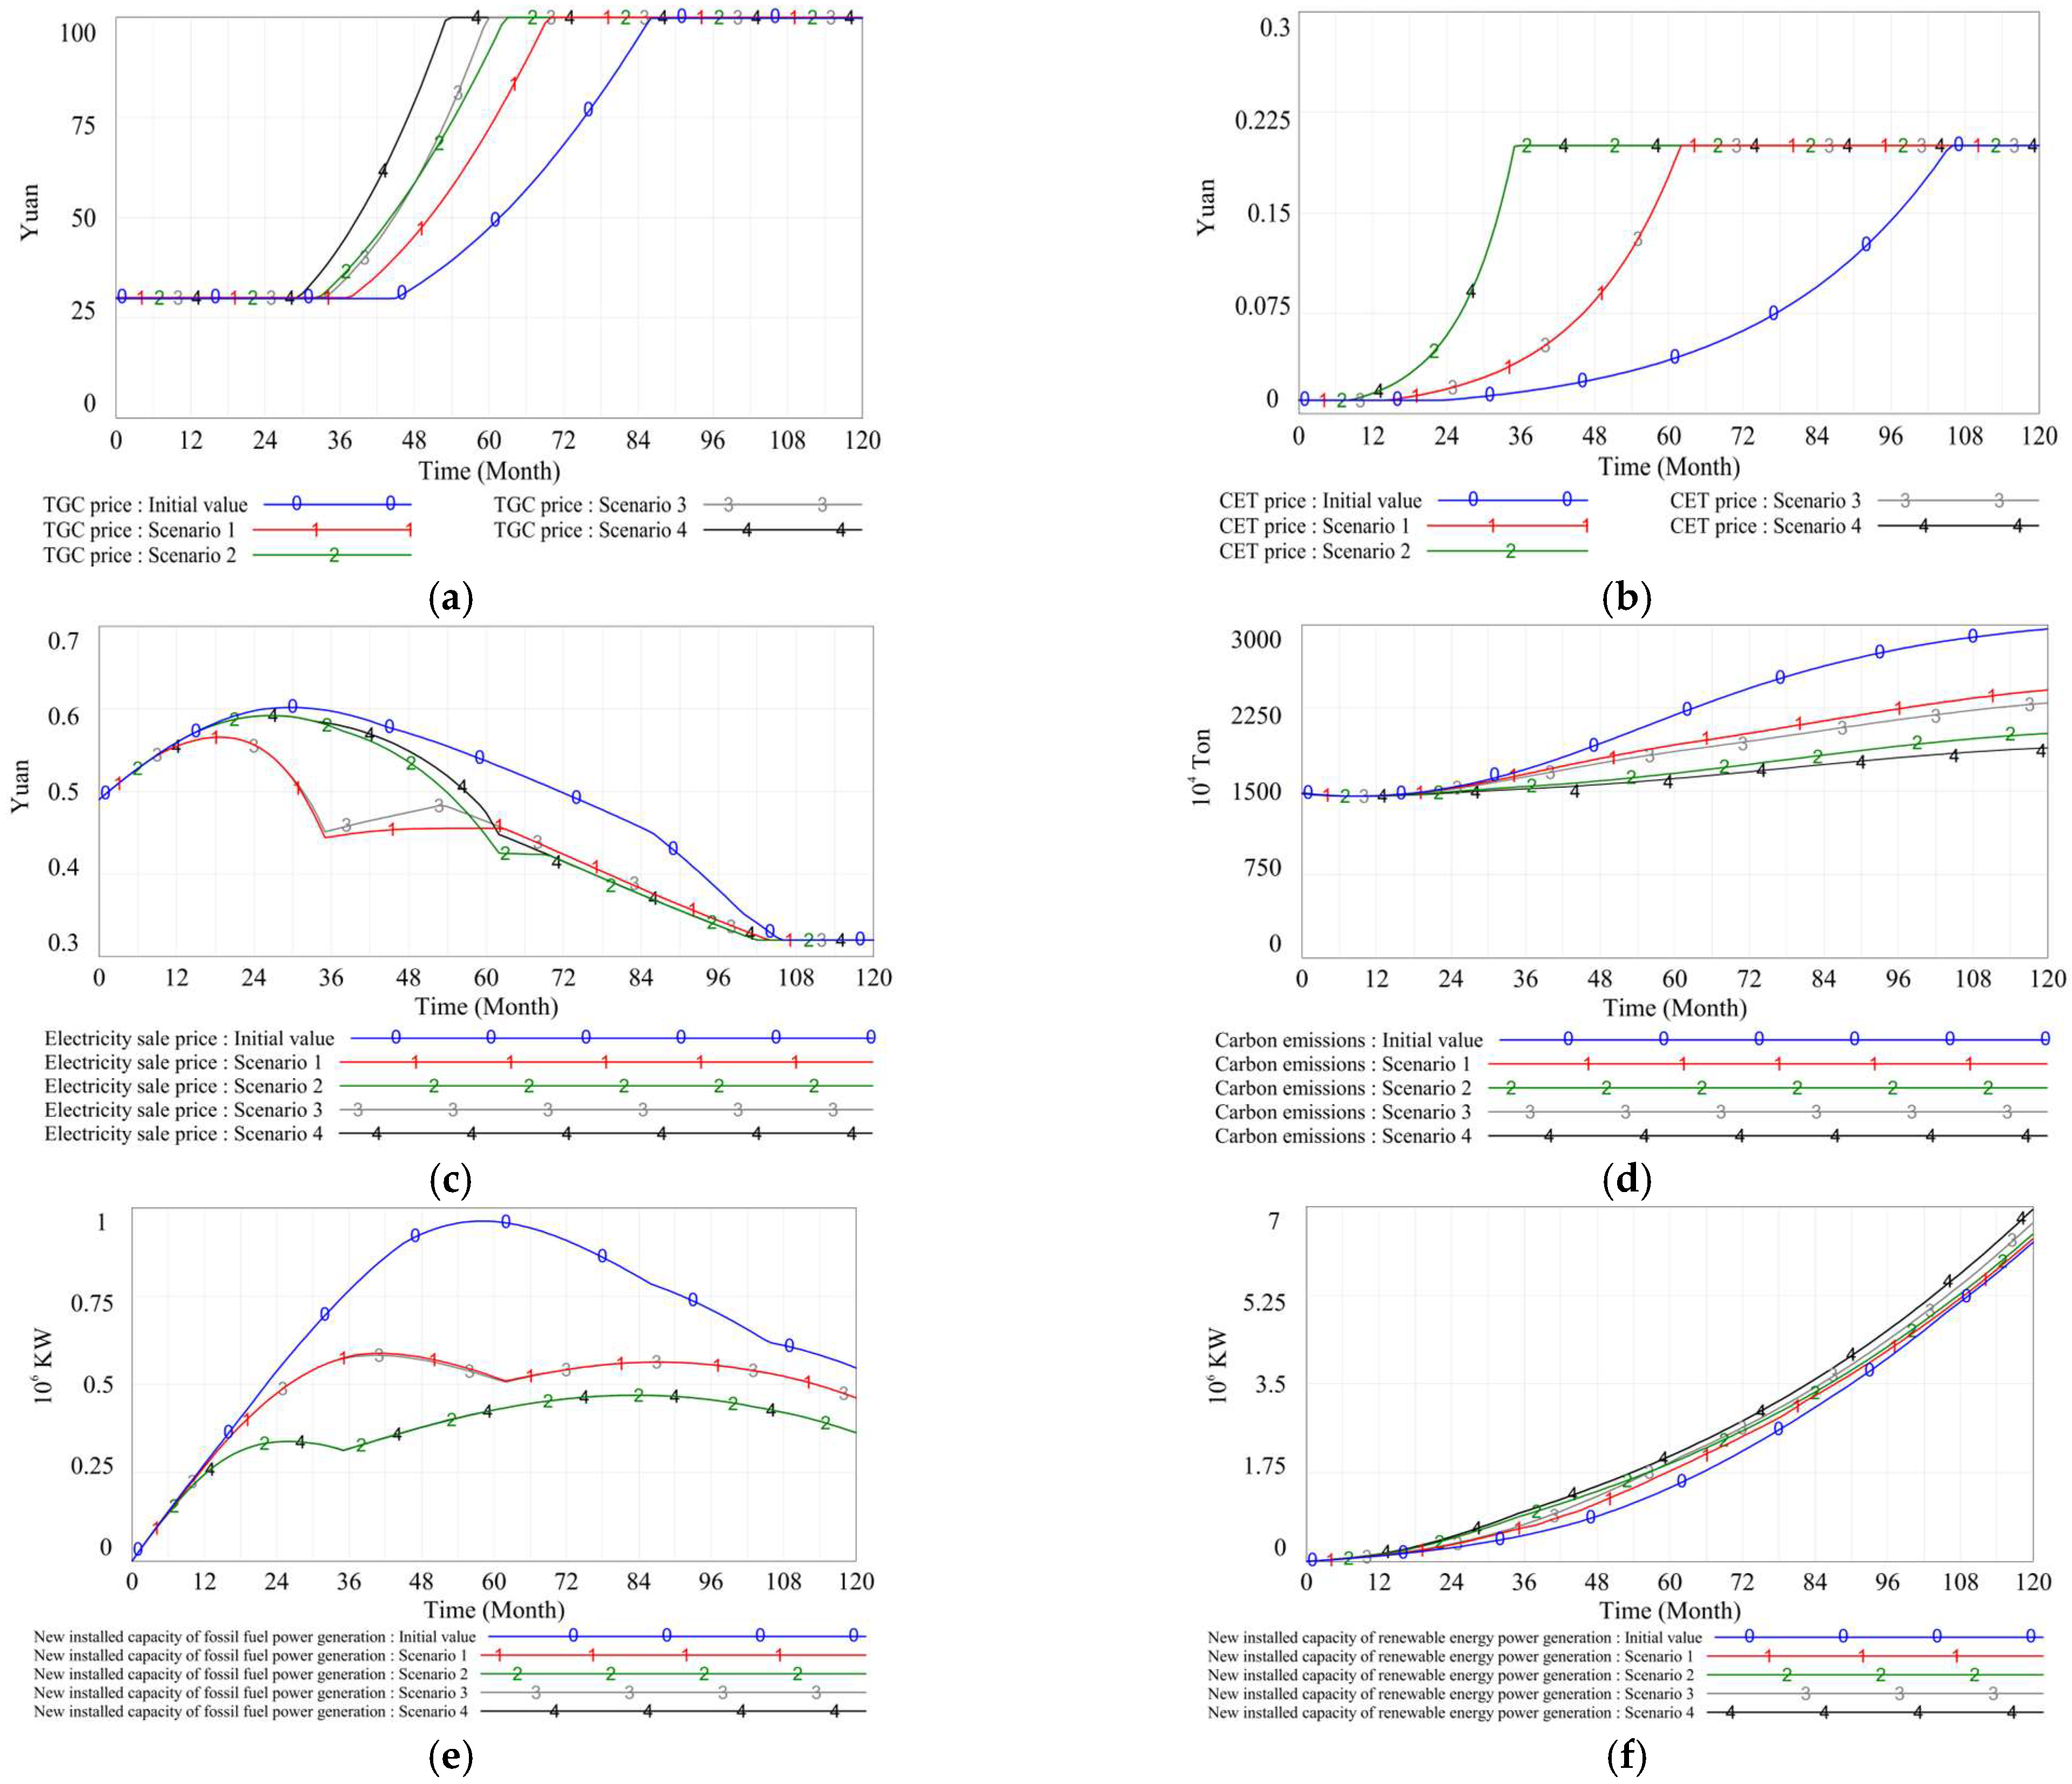
4.3. Comprehensive Simulation Analysis
5. Discussion
5.1. Results Analysis
5.1.1. The Result Analysis of TGC Price
5.1.2. The Result Analysis of CET Price
5.1.3. The Result Analysis of Electricity Sale Price
5.1.4. The Result Analysis of Carbon Emissions
5.1.5. The Result Analysis of New Installed Capacity of Fossil Fuel Power Generation
5.1.6. The Result Analysis of New Installed Capacity of Renewable Energy Power Generation
5.2. Policy Recommendations
5.2.1. TGC Policy Recommendations
5.2.2. CET Policy Recommendations
5.2.3. Policy Synergy Recommendations
6. Conclusions
6.1. Implications
6.2. Limitations and Further Directions
Author Contributions
Funding
Institutional Review Board Statement
Informed Consent Statement
Data Availability Statement
Conflicts of Interest
Abbreviations
| TGC | Tradable green certificate |
| CET | Carbon emission trading |
| SD | System dynamics |
References
- IEA CO2 Emissions in 2023. 2024. Available online: https://www.iea.org/reports/co2-emissions-in-2023 (accessed on 2 October 2024).
- Yu, X.Y.; Dong, Z.J.; Zhou, D.Q.; Sang, X.Z.; Chang, C.T.; Huang, X.H. Integration of tradable green certificates trading and carbon emissions trading: How will Chinese power industry do? J. Clean. Prod. 2021, 279, 123485. [Google Scholar] [CrossRef]
- Chen, C.; Zhu, Y.; Zeng, X.T.; Huang, G.H.; Li, Y.P. Analyzing the carbon mitigation potential of tradable green certificates based on a TGC-FFSRO model: A case study in the Beijing-Tianjin-Hebei region, China. Sci. Total Environ. 2018, 630, 469–486. [Google Scholar] [CrossRef] [PubMed]
- Hayek, F.A. The Use of Knowledge in Society. In Modern Understandings of Liberty and Property; Routledge: London, UK, 2013; pp. 27–38. [Google Scholar]
- Currier, K.M. Some Implications of Investment Cost Reduction Policies in Energy Markets Employing Green Certificate Systems. Environ. Resour. Econ. 2015, 60, 317–323. [Google Scholar] [CrossRef]
- Wang, L.; Li, K. Research on renewable energy consumption and emission reduction in power market based on bi-level decision making in China. Energy 2022, 260, 12. [Google Scholar] [CrossRef]
- Zhou, Y.; Jia, X.F.; Zhao, X.G.; Wang, H.; Huang, J.L. The impact of the heterogeneity of market participants on China’s green certificate trading: A collective action perspective. J. Environ. Manag. 2024, 370, 122878. [Google Scholar] [CrossRef]
- Zeng, L.J.; Wang, J.F.; Zhao, L.J. An inter-provincial tradable green certificate futures trading model under renewable portfolio standard policy. Energy 2022, 257, 124772. [Google Scholar] [CrossRef]
- Hustveit, M.; Frogner, J.S.; Fleten, S.E. Tradable green certificates for renewable support: The role of expectations and uncertainty. Energy 2017, 141, 1717–1727. [Google Scholar] [CrossRef]
- Bergek, A.; Jacobsson, S. Are tradable green certificates a cost-efficient policy driving technical change or a rent-generating machine? Lessons from Sweden 2003–2008. Energy Policy 2010, 38, 1255–1271. [Google Scholar] [CrossRef]
- Ghaffari, M.; Hafezalkotob, A. Evaluating different scenarios for Tradable Green Certificates by game theory approaches. J. Ind. Eng. Int. 2018, 15, 513–527. [Google Scholar]
- Wu, Y.X.; Sun, M. Multi-oligarch dynamic game model for regional power market with renewable portfolio standard policies. Appl. Math. Model. 2022, 107, 591–620. [Google Scholar] [CrossRef]
- Huang, Y.S.; Hu, J.J.; Yang, Y.Q.; Yang, L.; Liu, S.J. A Low-Carbon Generation Expansion Planning Model Considering Carbon Trading and Green Certificate Transaction Mechanisms. Pol. J. Environ. Stud. 2020, 29, 1169–1183. [Google Scholar] [CrossRef]
- Huang, G.R.; Chen, Z.; Shang, N.; Hu, X.Y.; Wang, C.; Wen, H.; Liu, Z.L. Do Tradable Green Certificates Promote Regional Carbon Emissions Reduction for Sustainable Development? Evidence from China. Sustainability 2024, 16, 7335. [Google Scholar] [CrossRef]
- Bjorn, A.; Lloyd, S.M.; Brander, M.; Matthews, H.D. Renewable energy certificates threaten the integrity of corporate science-based targets. Nat. Clim. Change 2022, 12, 539–546. [Google Scholar] [CrossRef]
- Brander, M.; Gillenwater, M.; Ascui, F. Creative accounting: A critical perspective on the market-based method for reporting purchased electricity (scope 2) emissions. Energy Policy 2018, 112, 29–33. [Google Scholar] [CrossRef]
- Li, L.; Dong, J.; Song, Y. Impact and Acting Path of Carbon Emission Trading on Carbon Emission Intensity of Construction Land: Evidence from Pilot Areas in China. Sustainability 2020, 12, 7843. [Google Scholar] [CrossRef]
- Guo, X.P.; Zhang, X.Y.; Zhang, X.P. Incentive-oriented power-carbon emissions trading-tradable green certificate integrated market mechanisms using multi-agent deep reinforcement learning. Appl. Energy 2024, 357, 122458. [Google Scholar] [CrossRef]
- Kosnik, L.R. Cap-and-trade versus carbon taxes: Which market mechanism gets the most attention? Clim. Change 2018, 151, 605–618. [Google Scholar] [CrossRef]
- Zakeri, A.; Dehghanian, F.; Fahimnia, B.; Sarkis, J. Carbon pricing versus emissions trading: A supply chain planning perspective. Int. J. Prod. Econ. 2015, 164, 197–205. [Google Scholar] [CrossRef]
- Weng, Q.Q.; Xu, H. A review of China’s carbon trading market. Renew. Sustain. Energy Rev. 2018, 91, 613–619. [Google Scholar] [CrossRef]
- Feng, T.T.; Yang, Y.S.; Yang, Y.H. What will happen to the power supply structure and CO2 emissions reduction when TGC meets CET in the electricity market in China? Renew. Sustain. Energy Rev. 2018, 92, 121–132. [Google Scholar] [CrossRef]
- Zhang, J.; Wang, Z.; Tang, L.; Yu, L. The simulation of carbon emission trading system in Beijing-Tianjin-Hebei region: An analysis based on system dynamics. Chin. J. Manag. Sci. 2016, 24, 1–8. [Google Scholar]
- Zhao, X.X.; Zhang, Y.Z.; Liang, J.; Li, Y.B.; Jia, R.D.; Wang, L. The Sustainable Development of the Economic-Energy-Environment (3E) System under the Carbon Trading (CT) Mechanism: A Chinese Case. Sustainability 2018, 10, 98. [Google Scholar] [CrossRef]
- Shi, J.; Cai, H.; Tang, L.; Yu, L. Impacts of carbon emission trading on China: Based on CGE model. Chin. J. Manag. Sci. 2015, 11, 801–806. [Google Scholar]
- Känzig, D.R. The Unequal Economic Consequences of Carbon Pricing; National Bureau of Economic Research: Cambridge, MA, USA, 2023. [Google Scholar]
- Chang, X.; Wu, Z.Y.; Wang, J.T.; Zhang, X.Y.; Zhou, M.; Yu, T.; Wang, Y.Y. The coupling effect of carbon emission trading and tradable green certificates under electricity marketization in China. Renew. Sustain. Energy Rev. 2023, 187, 113750. [Google Scholar] [CrossRef]
- Maldet, M.; Revheim, F.H.; Schwabeneder, D.; Lettner, G.; del Granado, P.C.; Saif, A.; Loeschenbrand, M.; Khadem, S. Trends in local electricity market design: Regulatory barriers and the role of tariffs. J. Clean. Prod. 2022, 358, 131805. [Google Scholar] [CrossRef]
- Feng, T.T.; Li, R.; Zhang, H.M.; Gong, X.L.; Yang, Y.S. Induction mechanism and optimization of tradable green certificates and carbon emission trading acting on electricity market in China. Resour. Conserv. Recycl. 2021, 169, 105487. [Google Scholar] [CrossRef]
- Guo, Z.X.; Shen, J.R.; Li, L.H. Identifying the implementation effect of technology transfer policy using system dynamics: A case study in Liaoning, China. J. Technol. Transf. 2024, 49, 660–688. [Google Scholar] [CrossRef]
- Zhang, X.Y.; Guo, X.P.; Zhang, X.P. Mutual conversion mechanisms for environmental interest products to jointly enhance synergistic effect between power, CET and TGC markets in China. Energy Econ. 2024, 131, 107311. [Google Scholar] [CrossRef]
- Liu, D.; Jiang, Y.; Peng, C.; Jian, J.H.; Zheng, J. Can green certificates substitute for renewable electricity subsidies? A Chinese experience. Renew. Energy 2024, 222, 119861. [Google Scholar] [CrossRef]
- He, Q.S.; Wang, J.S.; Shi, R.J.; He, Y.F.; Wu, M.Q. Enhancing renewable energy certificate transactions through reinforcement learning and smart contracts integration. Sci. Rep. 2024, 14, 10838, Erratum in Sci. Rep. 2025, 15, 5376. [Google Scholar] [CrossRef]
- Zhang, X.Y.; Guo, X.P.; Zhang, X.P. Assessing the policy synergy among power, carbon emissions trading and tradable green certificate market mechanisms on strategic GENCOs in China. Energy 2023, 278, 127833. [Google Scholar] [CrossRef]
- Chu, J.F.; Shao, C.F.; Emrouznejad, A.; Wu, J.; Yuan, Z. Performance evaluation of organizations considering economic incentives for emission reduction: A carbon emission permit trading approach. Energy Econ. 2021, 101, 105398. [Google Scholar] [CrossRef]
- Ciarreta, A.; Espinosa, M.P.; Pizarro-Irizar, C. Optimal regulation of renewable energy: A comparison of Feed-in Tariffs and Tradable Green Certificates in the Spanish electricity system. Energy Econ. 2017, 67, 387–399. [Google Scholar] [CrossRef]
- Yan, S.Z.; Wang, W.Q.; Li, X.Z.; Lv, H.P.; Fan, T.Y.; Aikepaer, S. Stochastic optimal scheduling strategy of cross-regional carbon emissions trading and green certificate trading market based on Stackelberg game. Renew. Energy 2023, 219, 119268. [Google Scholar] [CrossRef]
- Yu, X.Y.; Ge, S.X.; Zhou, D.Q.; Wang, Q.W.; Chang, C.T.; Sang, X.Z. Whether feed-in tariff can be effectively replaced or not? An integrated analysis of renewable portfolio standards and green certificate trading. Energy 2022, 245, 123241. [Google Scholar] [CrossRef]
- Tamás, M.M.; Shrestha, S.O.B.; Zhou, H.Z. Feed-in tariff and tradable green certificate in oligopoly. Energy Policy 2010, 38, 4040–4047. [Google Scholar] [CrossRef]
- Andersson, J.J. Carbon Taxes and CO2 Emissions: Sweden as a Case Study. Am. Econ. J.-Econ. Policy 2019, 11, 1–30. [Google Scholar] [CrossRef]
- Best, R.; Burke, P.J.; Jotzo, F. Carbon Pricing Efficacy: Cross-Country Evidence. Environ. Resour. Econ. 2020, 77, 69–94. [Google Scholar] [CrossRef]
- Ohlendorf, N.; Flachsland, C.; Nemet, G.F.; Steckel, J.C. Carbon price floors and low-carbon investment: A survey of German firms. Energy Policy 2022, 169, 113187. [Google Scholar] [CrossRef]
- Ma, W.T.; Yuan, H.P.; Hao, J.L. A bibliometric visual analysis of the system dynamics approach for construction and demolition waste management. Clean. Waste Syst. 2022, 1, 10. [Google Scholar] [CrossRef]
- Li, L.H.; Shi, J.; Liu, H.; Zhang, R.Y.; Guo, C.B. Simulation of Carbon Emission Reduction in Power Construction Projects Using System Dynamics: A Chinese Empirical Study. Buildings 2023, 13, 3117. [Google Scholar] [CrossRef]
- Aumann, C.A. A methodology for developing simulation models of complex systems. Ecol. Model. 2007, 202, 385–396. [Google Scholar] [CrossRef]
- Wen, J.X.; Jia, R.; Gao, X.; Cao, G.; Dang, J.; Li, W.; Li, P.H. Competitive Equilibrium Analysis of Power Generation Transaction Subjects Considering Tradable Green Certificates. Processes 2023, 11, 3008. [Google Scholar] [CrossRef]
- Teng, M.M.; Lv, K.F.; Han, C.F.; Liu, P.H. A tripartite stochastic evolutionary game for trading strategies under renewable portfolio standards in China’s electric power industry. Renew. Energy 2025, 240, 122193. [Google Scholar] [CrossRef]
- Shi, B.B.; Li, N.; Gao, Q.; Li, G.Q. Market incentives, carbon quota allocation and carbon emission reduction: Evidence from China’s carbon trading pilot policy. J. Environ. Manag. 2022, 319, 115650. [Google Scholar] [CrossRef] [PubMed]
- Ma, T.N.; Peng, L.L.; Wu, G.; Wei, Y.C.; Zou, X. Research on Multi-Scale Electricity-Carbon-Green Certificate Market Coupling Trading Based on System Dynamics. Processes 2025, 13, 109. [Google Scholar] [CrossRef]
- Zhang, Y.N.; Wu, G.Q.; Zhang, B. Costs and CO2 emissions of technological transformation in China’s power industry: The impact of market regulation and assistive technologies. Struct. Change Econ. Dyn. 2025, 73, 211–222. [Google Scholar] [CrossRef]
- Yang, J.; Liu, C.L.; Liu, X. Do carbon emissions trading pilots effectively reduce CO2 emissions? County-level evidence from eastern China. Int. J. Technol. Manag. 2024, 95, 156–172. [Google Scholar] [CrossRef]
- Song, X.H.; Wang, P. Effectiveness of carbon emissions trading and renewable energy portfolio standards in the Chinese provincial and coupled electricity markets. Util. Policy 2023, 84, 101622. [Google Scholar] [CrossRef]
- Zhao, X.G.; Hu, S.R.; Wang, H.; Chen, H.W.; Zhang, W.B.; Lu, W.J. Energy, economic, and environmental impacts of electricity market-oriented reform and the carbon emissions trading: A recursive dynamic CGE model in China. Energy 2024, 298, 131416. [Google Scholar] [CrossRef]
- Teng, M.M.; Lv, K.F.; Han, C.F.; Liu, P.H. Trading behavior strategy of power plants and the grid under renewable portfolio standards in China: A tripartite evolutionary game analysis. Energy 2023, 284, 128398. [Google Scholar] [CrossRef]


| Category | Number | Variables | Initial Value and Function Relation | Unit |
|---|---|---|---|---|
| State variable | 1 | Installed capacity of fossil fuel power generation | INTEG (New installed capacity of fossil fuel power generation − Depreciation of fossil fuel power generation equipment, Original value) | 108 KW |
| 2 | Installed capacity of renewable energy power generation | INTEG (New installed capacity of renewable energy power generation − Depreciation of renewable energy power generation equipment, Original value) | 108 KW | |
| 3 | CET reference price | INTEG (CET price adjustment, Original value) | yuan/kg | |
| 4 | TGC reference price | INTEG (TGC price adjustment, Original value) | yuan/piece | |
| Rate variable | 5 | New installed capacity of fossil fuel power generation | ((Incremental demand for electricity/The utilization time of fossil fuel power generation equipment) × (1 − Investment allocation ratio)) × (Income from fossil fuel power generation/(Income from fossil fuel power generation + The cost of carbon emissions)) × 0.15 × (“Long—run marginal cost of fossil energy generation”) | 108 KW |
| 6 | Depreciation of fossil fuel power generation equipment | Installed capacity of fossil fuel power generation/Life cycle of fossil fuel power generation equipment | 108 KW | |
| 7 | New installed capacity of renewable energy power generation | ((Incremental demand for electricity/The utilization time of renewable energy power generation equipment) × Investment allocation ratio) × ((Income from renewable energy power generation + TGC income + Renewable energy power generation × Policy incentive intensity)/Income from renewable energy power generation) × 0.1 × (“Long—run marginal cost of renewable energy power generation”) | 108 KW | |
| 8 | Depreciation of renewable energy power generation equipment | Installed capacity of renewable energy power generation/Life cycle of renewable energy power generation equipment | 108 KW | |
| 9 | CET price adjustment | CET price × ((CET consumption − CET supply)/CET consumption) × 0.3 | yuan/kg | |
| 10 | TGC price adjustment | TGC price × ((TGC demand)/TGC supply) × 0.06 | yuan/piece | |
| Auxiliary variable | 11 | Life cycle of fossil fuel power generation equipment | 240 | Month |
| 12 | Life cycle of renewable energy power generation equipment | 300 | Month | |
| 13 | Long—run marginal cost of fossil energy generation | 0.32 | yuan/KWh | |
| 14 | Long—run marginal cost of renewable energy power generation | 0.40 | yuan/KWh | |
| 15 | Policy incentive intensity | 0.02 | yuan/KWh | |
| 16 | Investment allocation ratio | (100 × TGC income + the cost of carbon emissions)/(1 + 100 × TGC income + the cost of carbon emissions) × ((1 × EXP (0.01 × Time))/(1 + 1 × EXP (0.01 × Time))) × ((EXP (Time × 0.1) − 0.9)/(EXP (Time × 0.1) + 0.9)) + 0.2 | % | |
| 17 | The utilization time of fossil fuel power generation equipment | 350 | Hour | |
| 18 | Fossil fuel power generation | The utilization time of fossil fuel power generation equipment × installed capacity of fossil fuel power generation | 108 KWh | |
| 19 | Carbon emissions per unit of electricity production from fossil fuels | 9 | Ton/104 KWh | |
| 20 | Carbon emissions | Carbon emissions per unit of electricity production from fossil fuels × Fossil fuel power generation | 104 ton | |
| 21 | The cost of carbon emissions | MAX (CET demand × CET price × 0.1, 0) | 108 yuan | |
| 22 | CET consumption | Carbon emissions | 104 ton | |
| 23 | CET demand | CET consumption − CET supply | 104 ton | |
| 24 | CET supply | Market allocation coefficient × Carbon emission cap target × Carbon emissions | 104 ton | |
| 25 | Carbon emission cap target | 0.75 | Unitless | |
| 26 | Market allocation coefficient | 0.95 + (0.05 × (1 − EXP (−0.01 × Time))) | Unitless | |
| 27 | CET price cap | 0.2 | yuan/kg | |
| 28 | CET price floor | 0.01 | yuan/kg | |
| 29 | CET price | MIN (MAX (CET price floor, CET reference price), CET price cap) | yuan/kg | |
| 30 | Income from fossil fuel power generation | Fossil fuel power generation × Electricity sale price | 108 yuan | |
| 31 | Electricity price cap | 0.6 | yuan/KWh | |
| 32 | Electricity price floor | 0.4 | yuan/KWh | |
| 33 | Electricity reference price | electricity demand/Electricity supply × 0.5 | yuan/KWh | |
| 34 | Electricity price | MIN (MAX (Electricity price floor, Electricity reference price), Electricity price cap) | yuan/KWh | |
| 35 | Electricity demand growth rate | 1 | % | |
| 36 | Initial demand for electricity | 221.60 | 108 KWh | |
| 37 | Incremental demand for electricity | Initial demand for electricity × (1 + electricity demand growth rate) ^ Time − Initial demand for electricity | 108 KWh | |
| 38 | Electricity demand | Incremental demand for electricity + Initial demand for electricity | 108 KWh | |
| 39 | Electricity supply | Fossil fuel power generation + renewable energy power generation | 108 KWh | |
| 40 | Electricity sale price | Electricity price + TGC price/1000 − CET price × (Carbon emissions per unit of electricity production from fossil fuels/10) | yuan/KWh | |
| 41 | The utilization time of renewable energy power generation equipment | 300 | Hour | |
| 42 | Renewable energy power production technology level | MIN (SMOOTH (1 − “Technology—level growth rate” ^ Time, 120), 1) | unitless | |
| 43 | Renewable energy power generation | The utilization time of renewable energy power generation equipment × installed capacity of renewable energy power generation + installed capacity of renewable energy power generation × renewable energy power production technology level | 108 KWh | |
| 44 | Income from renewable energy power generation | Electricity sale price × Renewable energy power generation | 108 yuan | |
| 45 | Technology—level growth rate | “R&D investment” × Investment efficiency | % | |
| 46 | R&D investment | 862 | 108 yuan | |
| 47 | Investment efficiency | 1 | % | |
| 48 | TGC quota ratio | 30 | % | |
| 49 | TGC demand | TGC quota ratio × investment allocation ratio × electricity demand × 10/1000 | A piece of certificate | |
| 50 | TGC price cap | 100 | yuan/piece | |
| 51 | TGC price floor | 30 | yuan/piece | |
| 52 | TGC price | MIN (MAX (TGC price floor, TGC reference price), TGC price cap) | yuan/piece | |
| 53 | TGC supply | Renewable energy power generation × TGC supply factor × 10 | Piece | |
| 54 | TGC supply factor | 0.001 | unitless | |
| 55 | TGC income | TGC price × TGC supply/10,000 | 108 yuan | |
| 56 | Time | The simulation time ranges from 1 to 120 | Month |
| Year | Simulation Value (108 KWh) | Actual Value (108 KWh) | Error (%) |
|---|---|---|---|
| 2020 | 2691.7 | 2520.1 | 6.38% |
| 2021 | 2745.8 | 2673.7 | 2.63% |
| 2022 | 2726.1 | 2659.2 | 2.45% |
| Variables | Change Stage | Time | Sample Size | Mean Value | Standard Deviation | Confidence Interval (95%) |
|---|---|---|---|---|---|---|
| TGC price | Stationary phase | 0–44 | 45 | 30 | 0 | [30, 30] |
| Fluctuating stage | 45–85 | 41 | 67.34 | 12.58 | [64.81, 70.87] | |
| Stationary phase | 86–120 | 35 | 100 | 0 | [100, 100] | |
| CET price | Stationary phase | 0–24 | 25 | 0.01 | 0 | [0.01, 0.01] |
| Fluctuating stage | 25–105 | 81 | 0.065 | 0.005 | [0.054, 0.076] | |
| Stationary phase | 106–120 | 15 | 0.2 | 0 | [0.2, 0.2] | |
| Electricity sale price | Fluctuating stage | 0–105 | 106 | 0.555 | 0.034 | [0.548, 0.562] |
| Stationary phase | 106–120 | 15 | 0.32 | 0 | [0.32, 0.32] |
| Scenario | Scenario 1 | Scenario 2 | Scenario 3 | Scenario 4 |
|---|---|---|---|---|
| TGC quota ratio | +10% | +10% | +30% | +30% |
| Carbon emission cap target | −10% | −30% | −10% | −30% |
Disclaimer/Publisher’s Note: The statements, opinions and data contained in all publications are solely those of the individual author(s) and contributor(s) and not of MDPI and/or the editor(s). MDPI and/or the editor(s) disclaim responsibility for any injury to people or property resulting from any ideas, methods, instructions or products referred to in the content. |
© 2025 by the authors. Licensee MDPI, Basel, Switzerland. This article is an open access article distributed under the terms and conditions of the Creative Commons Attribution (CC BY) license (https://creativecommons.org/licenses/by/4.0/).
Share and Cite
Li, L.; Song, K.; Xu, W.; Jiang, X.; Guo, C. System Dynamics Simulation of Policy Synergy Effects: How Tradable Green Certificates and Carbon Emission Trading Shape Electricity Market Sustainability. Appl. Sci. 2025, 15, 4086. https://doi.org/10.3390/app15084086
Li L, Song K, Xu W, Jiang X, Guo C. System Dynamics Simulation of Policy Synergy Effects: How Tradable Green Certificates and Carbon Emission Trading Shape Electricity Market Sustainability. Applied Sciences. 2025; 15(8):4086. https://doi.org/10.3390/app15084086
Chicago/Turabian StyleLi, Lihong, Kun Song, Weimao Xu, Xue Jiang, and Chunbing Guo. 2025. "System Dynamics Simulation of Policy Synergy Effects: How Tradable Green Certificates and Carbon Emission Trading Shape Electricity Market Sustainability" Applied Sciences 15, no. 8: 4086. https://doi.org/10.3390/app15084086
APA StyleLi, L., Song, K., Xu, W., Jiang, X., & Guo, C. (2025). System Dynamics Simulation of Policy Synergy Effects: How Tradable Green Certificates and Carbon Emission Trading Shape Electricity Market Sustainability. Applied Sciences, 15(8), 4086. https://doi.org/10.3390/app15084086