Article

System Dynamics Simulation of Policy Synergy Effects: How Tradable Green Certificates and Carbon Emission Trading Shape Electricity Market Sustainability

1
School of Management, Shenyang Jianzhu University, Shenyang 110168, China
2
State Grid Liaoning Electric Power Company Limited Economic Research Institute, Shenyang 110015, China
3
School of Civil Engineering, Shenyang Jianzhu University, Shenyang 110168, China
*
Author to whom correspondence should be addressed.
Appl. Sci. 2025, 15(8), 4086; https://doi.org/10.3390/app15084086
Submission received: 12 March 2025 / Revised: 31 March 2025 / Accepted: 7 April 2025 / Published: 8 April 2025

Abstract

:
With the rapid growth of global energy demand, the fossil fuel-dominated electric power industry has led to serious environmental problems. Tradable green certificates (TGC) and carbon emission trading (CET) have become key mechanisms for promoting sustainable development of the electricity market by serving as market-oriented policy tools. To deeply analyze the impact of TGC and CET on the sustainable development of China’s electricity market and provide a scientific basis for policymakers. This study uses system dynamics (SD) methods to construct a policy synergy analysis framework for TGC and CET. It explores the impact mechanism of dual policy incentives on the sustainable development of the electricity market. Firstly, the current application status of TGC and CET in China was reviewed. Based on the literature analysis, identify key factors that affect the sustainable development of the electricity market. Then, by deconstructing the interaction between TGC policy and CET policy, an SD model was established that includes multidimensional feedback such as policy, technology, funding, and market, and the dynamic functional relationships in the SD model were quantified. Finally, Vensim PLE software 7.3.2 was used to simulate the evolution of sustainable development in the electricity market under different policy scenarios. The research results indicate that (1) the adjustment of the TGC quota ratio can change the supply and demand mechanism to form a price leverage effect, effectively stimulate the growth of renewable energy generation capacity, and accelerate the low-carbon transformation of power enterprises; and (2) the CET market changes the cost structure of power generation through carbon price signals. When the carbon emission cap target tightens, CET prices quickly rise, leading to a significant trend of carbon reduction in the electricity market; (3) the application of policy combinations can significantly promote the sustainable development of the electricity market, but the unreasonable setting of policy parameters can trigger market risks. Therefore, policy design should focus on flexibility and implement appropriate policy combinations at different stages of electricity market development to promote green transformation while ensuring smooth market operation. This study innovatively reveals the synergistic effect of TGC and CET in the sustainable development of the electricity market from a systems theory perspective. The research results provide a scientific basis for decision-makers to formulate policy adjustment plans and have essential reference value for achieving the dual goals of energy structure transformation and electricity market stability.

1. Introduction

With rapid economic growth and significant improvement in living standards, global energy demand has shown an astonishing growth trend in recent years. Due to factors such as cost and technology, fossil fuels still dominate the current world energy system. However, this energy structure has also led to increasingly serious environmental problems. In 2023, global energy-related carbon emissions will increase by 1.1%, reaching a record high of 37.4 billion tons, of which coal carbon emissions will contribute more than 65% of the growth [1]. The large-scale utilization of fossil fuels has exacerbated climate change and the greenhouse effect, becoming a significant challenge to human society’s survival and sustainable development. Most countries have proposed carbon reduction targets to address global climate change and accelerated the low-carbon transformation of their energy structure. However, the huge funds required for the large-scale construction of renewable energy generation facilities will significantly increase the government’s financial burden and may trigger abnormal fluctuations in electricity prices. In this context, Tradable Green Certificate (TGC) and carbon emission trading (CET), as typical market-oriented policy tools, have received widespread attention and promotion from the international community [2,3]. The price mechanism is the most effective tool for transmitting information in the market, which can quickly convey changes in supply and demand and guide market entities to optimize resource allocation [4]. However, the environmental costs of carbon emissions are difficult to reflect in market prices, and the environmental benefits of renewable energy have not been converted into market benefits. Such market biases make it difficult to trigger effective, sustainable transformation. Therefore, the core role of TGC and CET is to enable market entities to adjust their decisions under cost constraints by constructing a green electricity value mechanism and carbon price signals. The mechanism not only promotes independent carbon reduction by power companies but also drives the transition of the energy system towards a clean and low-carbon direction, achieving the goal of improving the sustainability of the electricity market at lower social costs.
TGC is an electronic credential used to prove that a certain amount of electricity comes from renewable energy generation. When a power generation company produces a certain amount of green electricity, it can obtain the corresponding amount of TGC [5]. TGC can be traded independently of electricity in the market, creating additional sources of income for renewable energy generation companies and increasing their economic competitiveness through market-oriented means [6]. With the increasingly severe climate problem, the TGC policy has put forward new requirements for traditional fossil fuel power generation companies and electricity retailers, stipulating that they must purchase a certain proportion of TGC to fulfill their clean energy quota obligations [7]. This policy not only effectively incentivizes the development and application of renewable energy but also promotes the transformation of the power structure towards low-carbon, providing a solid guarantee for the green and sustainable development of the energy system [8]. Existing research indicates that TGC provides additional economic incentives for renewable energy generation companies through market-oriented means and is an important policy tool for reducing the cost of renewable energy generation and supporting the development of the renewable energy industry [9,10,11]. The implementation of TGC has significantly enhanced the attractiveness of investment in the renewable energy market, promoted the sustained growth of installed capacity for renewable energy generation, and facilitated the transition of electricity production from fossil fuels to renewable energy [3,12,13]. In addition, applying TGC has a significant effect on carbon reduction. Through the calculation of historical data, it was found that there is a positive correlation between the activity level of the TGC market and carbon emissions reduction. When the TGC trading volume increases by 1%, carbon emissions can be reduced by approximately 0.8% to 1.3% [14]. This result highlights the significant importance of TGC in promoting the long-term sustainable development of the electricity market at the economic level. However, the use of TGC also has certain limitations, as some companies report carbon emissions reductions by purchasing TGC and exaggerate the effectiveness of its widespread use in reducing carbon emissions [15,16].
CET refers to the mechanism of market-based buying and selling of carbon emission quotas among emission entities under the premise of setting a carbon emission cap [17]. CET uses market price signals to guide enterprises in purchasing or selling carbon emission rights based on their needs, achieving overall emission reduction goals at the lowest cost [18]. CET has the dual advantages of cost savings and reduction of carbon emissions. It has been welcomed by developed countries and received attention from the academic community. In the past 20 years, the United States has paid more attention to CET policies than other energy-saving and carbon-reduction policies [19]. Australia also attaches great importance to CET policies and explains that they can improve performance by reducing carbon emissions and lowering costs [20]. Scholars have conducted extensive research on the effectiveness of CET, proving that CET policies have demonstrated their advantages in different pilot cities [21,22]. Carbon emissions reduction can be improved by reducing the total quota of CET and increasing its trading price [23,24]. However, the large-scale implementation of CET to reduce carbon emissions may trigger a series of negative economic impacts [25]. In the European Union, the increase in CET prices has led to issues such as rising consumer prices and rising unemployment rates [26]. Therefore, it is crucial to explore the optimal policy design for CET. With the increasing demand for carbon reduction in society, academia and policymakers are paying more and more attention to the interactive relationship between TGC and CET, exploring sustainability under the synergistic effect of the two. On the one hand, TGC increases the proportion of renewable energy generation through price signals, thereby reducing the unit carbon emission intensity of the electricity market. On the other hand, CET imposes economic constraints on enterprises by limiting their total carbon emissions, guiding them to optimize their energy structure and promote the low-carbon transformation of the entire society. The combination of TGC and CET can compensate for shortcomings in implementing a single policy, promote low-carbon transformation in the energy sector, and help alleviate fiscal pressure, effectively helping developing countries achieve their carbon reduction goals [2,27].
As the world’s largest carbon emitter, China’s total carbon emissions in 2023 ranked first in the world, reaching 12.6 billion tons, an increase of 4.7% [1]. China’s power industry accounts for over 40% of carbon emissions [27,28]. To accelerate the sustainable development of the electricity market, the Chinese government established a TGC pilot in 2017 and proposed a trading mechanism for TGC in 2021, launching the CET market nationwide. Considering the relatively short implementation time of TGC and CET, their role and effectiveness in the sustainable development of China’s electricity market are still unclear. Most existing research is based on the mature experience of other countries and has not yet delved into the impact mechanism and behavioral evolution path of TGC and CET on the sustainable development of the electricity market. The effectiveness of guiding China’s current situation is limited. In addition, the practical effects of TGC and CET are not simply a linear superposition but are influenced by various factors such as market supply and demand, policy design, and technological progress [29]. Current research mainly evaluates the combination effect of TGC and CET from an investment perspective without considering the dynamic impact of top-level design on the interaction between TGC and CET [18]. To better utilize TGC and CET in China and promote the sustainable development of the Chinese electricity market, it is of great academic and practical significance to conduct research based on the current situation and actual data of the Chinese electricity market and to deeply explore the optimal policy design for TGC and CET.
To fill the research gap, this study analyzes the dynamic impact of TGC and CET on the sustainable development of China’s electricity market from the policy design perspective. Extensive research and practice have proven that system dynamics (SD) methods have significant advantages in studying causal relationships and dynamic behavior in complex systems, especially for analyzing complex problems involving multiple variables and multi-path interactions [2,30]. Therefore, based on SD analysis of the dynamic interaction between TGC and CET, this study establishes an impact system on the sustainable development of the electricity market under the influence of TGC and CET [31]. By simulating the impact of TGC and CET policy adjustments on the supply-and-demand relationship of the TGC market, CET market, and electricity market, as well as how supply-and-demand changes drive price fluctuations and affect the behavioral decisions of electricity market entities, this study systematically reveals how TGC and CET promote the sustainable development of the electricity market. The leading solutions and innovations of this study include (1) analyzing the complex interactive relationship between TGC and CET, identifying key factors that affect the sustainable development of the electricity market; (2) constructing an SD model for the sustainable development of the electricity market based on the influence of TGC and CET, and exploring how TGC and CET jointly affect the carbon reduction behavior of power enterprises through price signals and policy incentives; and (3) exploring the impact of different policy parameters on the sustainability of China’s electricity market in a long-term dynamic process and providing a reference for government decision-making.
The remainder of this paper is organized as follows: Section 2 analyzes the interaction between TGC and CET in China. Section 3 describes the research methods and introduces the SD modeling process. Section 4 simulates and analyzes the dynamic impact of different TGC and CET policy scenarios on the sustainable development of the electricity market. Section 5 discusses the research results. Finally, this study is summarized in Section 6.

2. Interaction Between TGC and CET in China

Currently, China has vigorously promoted the coordinated application of TGC and CET policies, which affects the operation mode of renewable energy enterprises and traditional thermal power enterprises, thus accelerating the transformation and upgrading of the energy industry toward the green and low-carbon direction [22]. TGC is based on renewable energy generation and is issued by the government or third-party organizations. In China, every 1000 KWh of clean energy electricity produced corresponds to one TGC [32]. Electric power companies or social electricity users can fulfill their clean energy consumption obligations by purchasing TGC. In the market, the TGC price is determined by supply and demand. Its main function is to enhance the economy of clean energy generation, promote the marketization of clean energy, and reduce dependence on government financial subsidies [33]. CET gradually reduces enterprises’ total carbon emissions through a combination of quota allocation and market trading [34]. The government allocates specific carbon emission quotas to enterprises based on industry benchmarks or historical emissions. Enterprises can reduce emissions through technological improvements or purchase carbon emission quotas through the market.
TGC and CET convey signals of clean energy development and carbon reduction pressure to power companies from different perspectives. Although their goals and targets have their own focuses, their scope of action intersects. Under the incentive of TGC, renewable energy generation enterprises increase investment in renewable energy generation equipment or purchase a certain amount of TGC, thereby promoting the utilization of renewable energy and promoting the sustainable development of the electricity market [27]. CET forces power production enterprises to improve energy efficiency and processes or invest in low-carbon technologies by making their carbon emission costs explicit to achieve emission reduction targets [35]. The interactive relationship between these two mechanisms is shown in Figure 1. On the one hand, TGC has promoted the development of clean energy generation technology by incentivizing the production of green electricity [36]. On the other hand, CET has put forward precise emission reduction requirements for power generation enterprises, reducing the carbon emissions of traditional power generation enterprises [37]. Both have jointly promoted the sustainable development of the electricity market, but inconsistent market performance may also lead to competition and disharmony. When the TGC price is high, companies invest in renewable energy generation projects to fulfill their consumption obligations [38]. However, when the TGC price is too low, companies are more willing to rely on the CET market to reduce compliance costs by reducing carbon emissions, which decreases market demand for TGC and weakens its incentive effect [39]. When the CET market price is high, companies will promote applying low-carbon technologies to reduce carbon emissions and increase their attention to renewable energy power technology [40,41]. When the CET market price is low, companies prioritize relying on CET to fulfill their obligations, reduce investment in renewable energy power technologies, and ignore the market demand for TGC [42]. The CET market is closely related to the TGC market, and companies need to flexibly adjust their strategies based on the price signals of the two policies to balance costs and policy requirements. The interaction of TGC and CET provides enterprises with diversified emission reduction methods, which helps to achieve overall emission reduction goals and enhance market adaptability and sustainability. However, power production enterprises must choose between two policies due to limited funds and resources. Therefore, strengthening policy coordination, clarifying the market target division between TGC and CET, avoiding policy overlap and causing excessive burden on enterprises, and ensuring the maximum interactive effect of the incentive effects of the two policies are crucial for the sustainable development of the electricity market.

3. Materials and Methods

3.1. Research Design

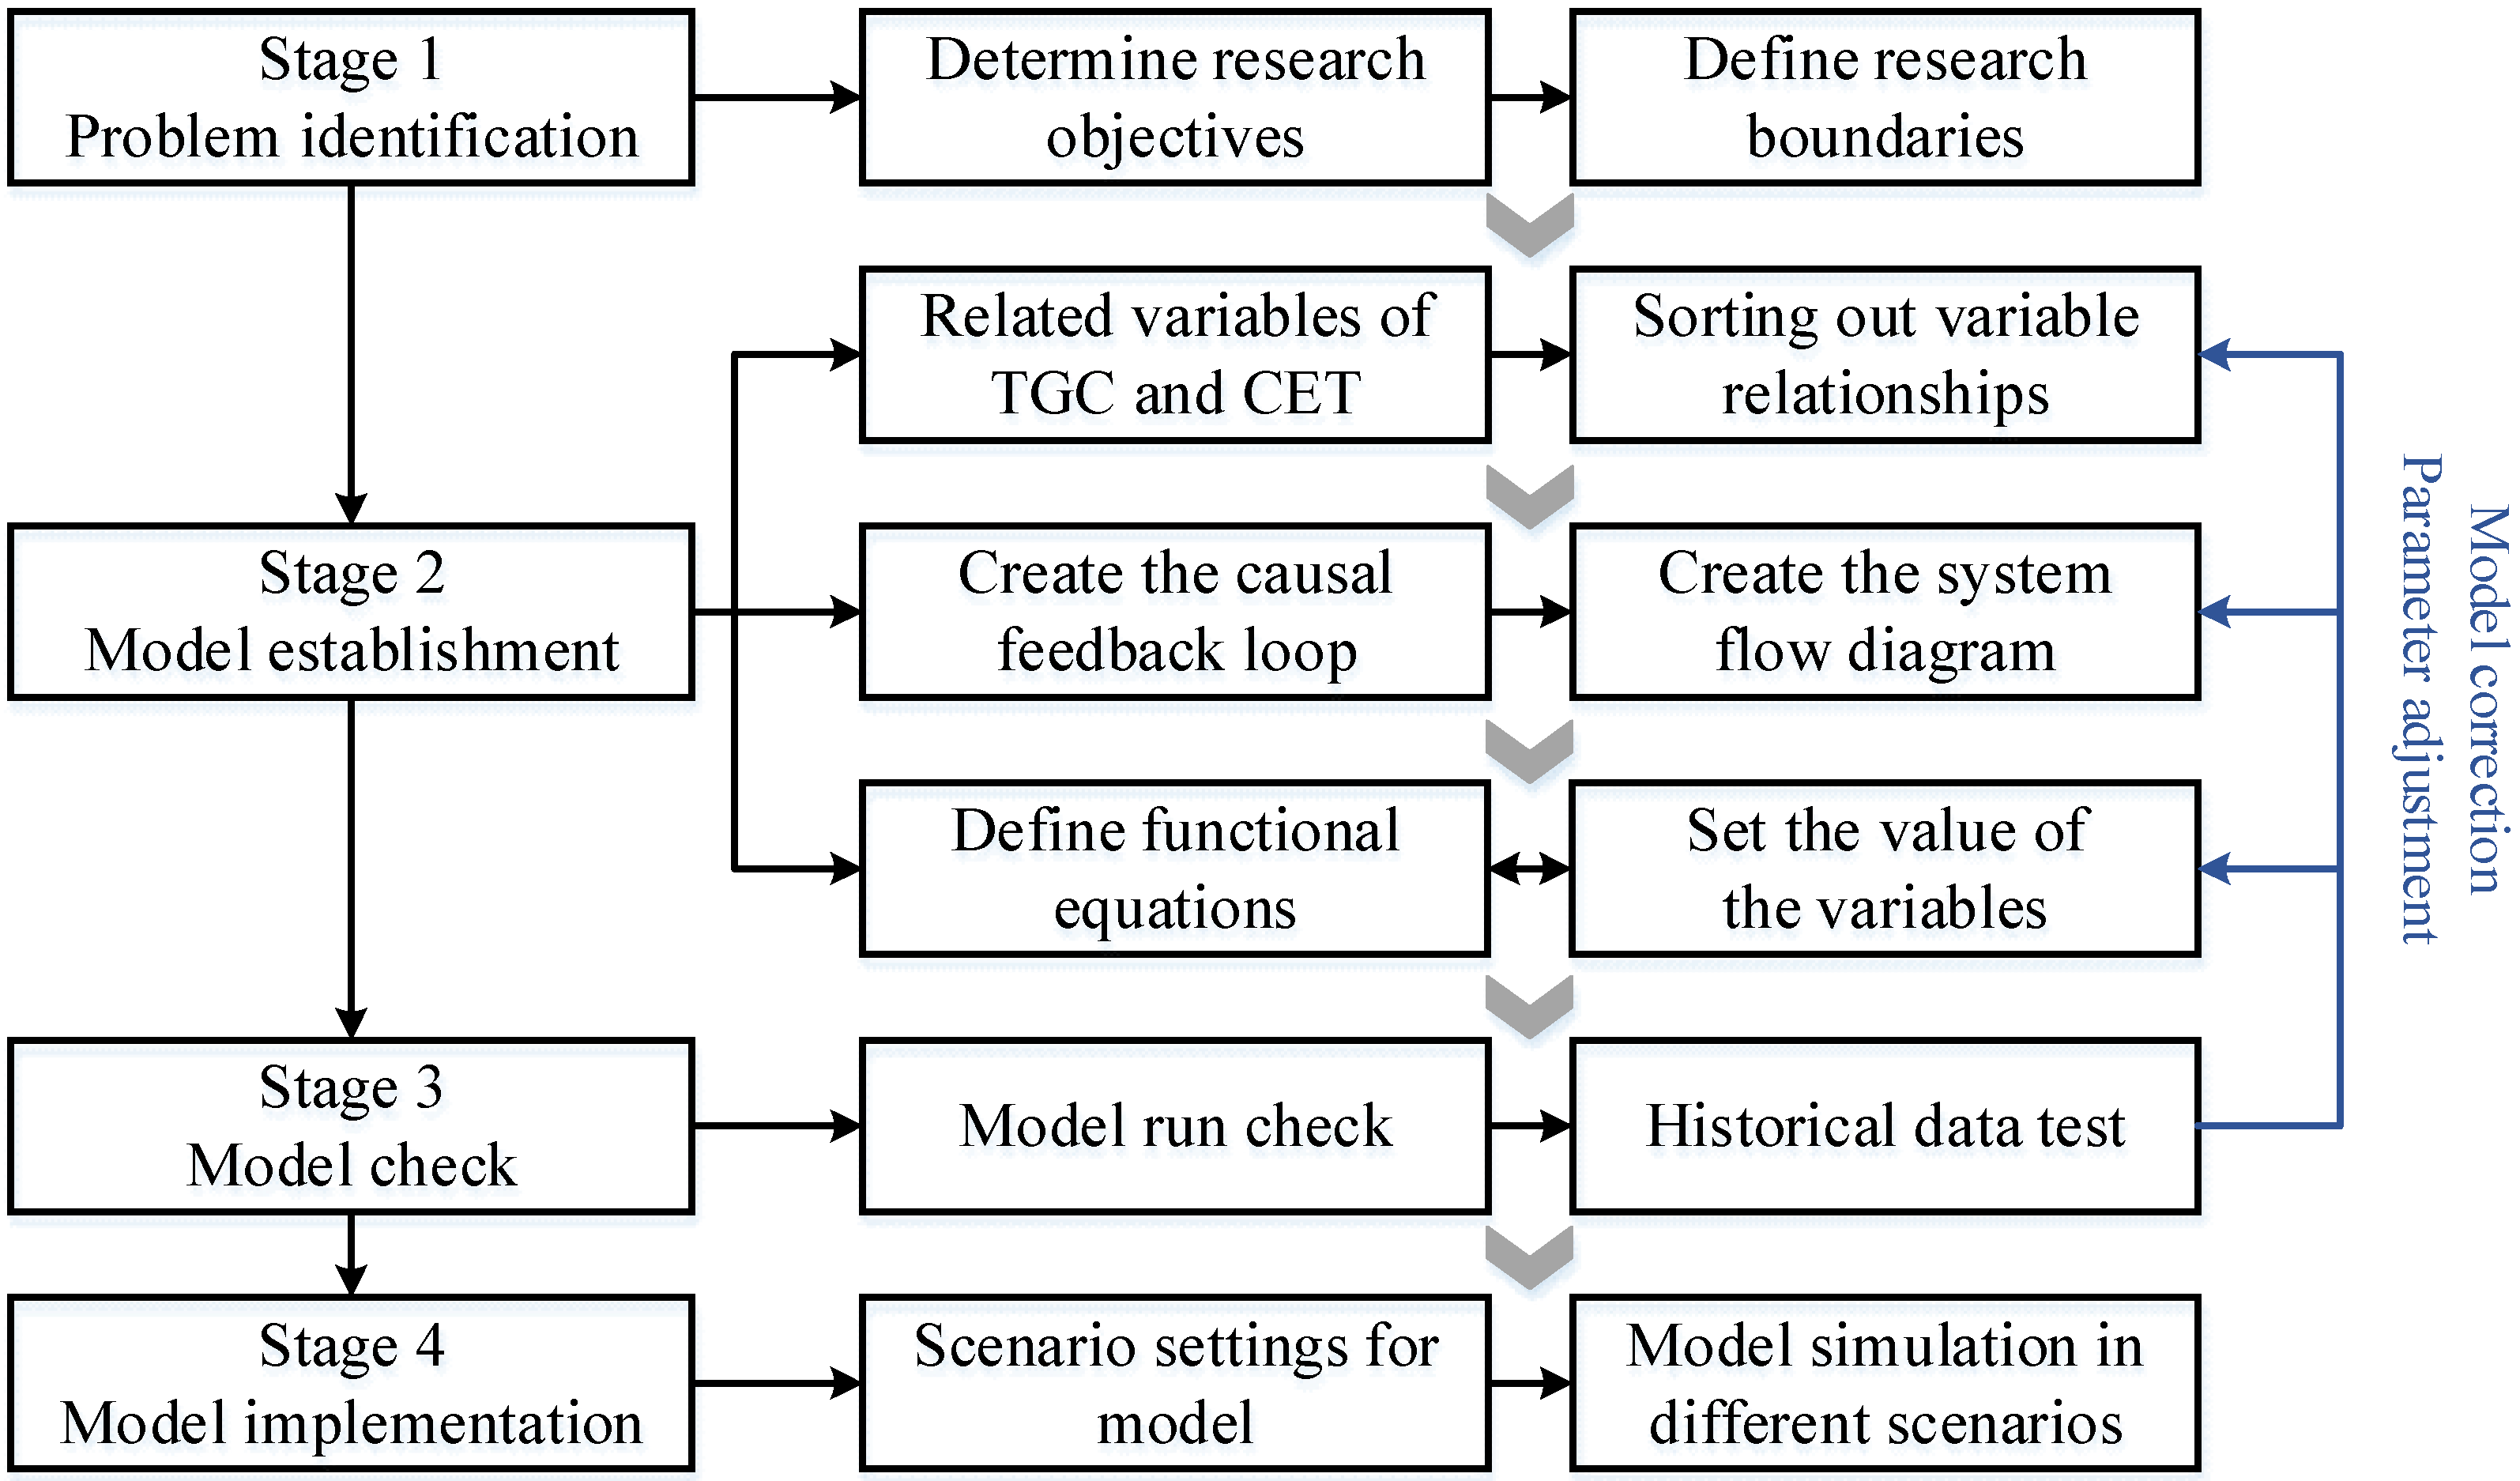
This study adopts a mixed research method to analyze the impact of TGC and CET on the electricity market’s sustainable development, which is divided into three stages, as shown in Figure 2. Firstly, through an extensive literature review, identify the research question and key influencing factors in the study and define the research boundary. Secondly, a credible causal feedback loop and system flow diagram are obtained using literature and data analysis to establish and verify an SD model. Finally, system simulation and sensitivity analysis will be conducted, the analysis results will be discussed, and the conclusion of this study will be drawn.
This study is based on system theory to establish an SD model of the impact of TGC and CET on the sustainable development of the electricity market from four aspects: problem identification, model establishment, model verification, and model implementation [43]. Figure 3 shows the steps of applying SD for modeling. Firstly, based on the research objectives, the SD model’s system boundary and the study’s basic assumptions were determined, which are the prerequisites for the system’s operation. Next, through a literature review, system variables related to TGC and CET research are identified and combined with an analysis of actual situations to construct causal feedback loops and system flow diagrams between variables. The quantitative relationship between influencing factors was determined through the variable assignment and the establishment of functional equations. Then, Vensim PLE software 7.3.2 will be used to check whether the model’s structure is reasonable and to perform validity tests on the model based on historical data. Based on the inspection results, the model will be revised until the error of the simulation results is controlled within 10% to ensure that the model’s credibility can be used to reflect actual problems. A sensitivity analysis will be conducted after the model reaches a confidence level. Finally, this study’s theoretical and practical significance was proposed based on the simulation results.

3.2. Model Analysis

3.2.1. Causal Feedback Loop

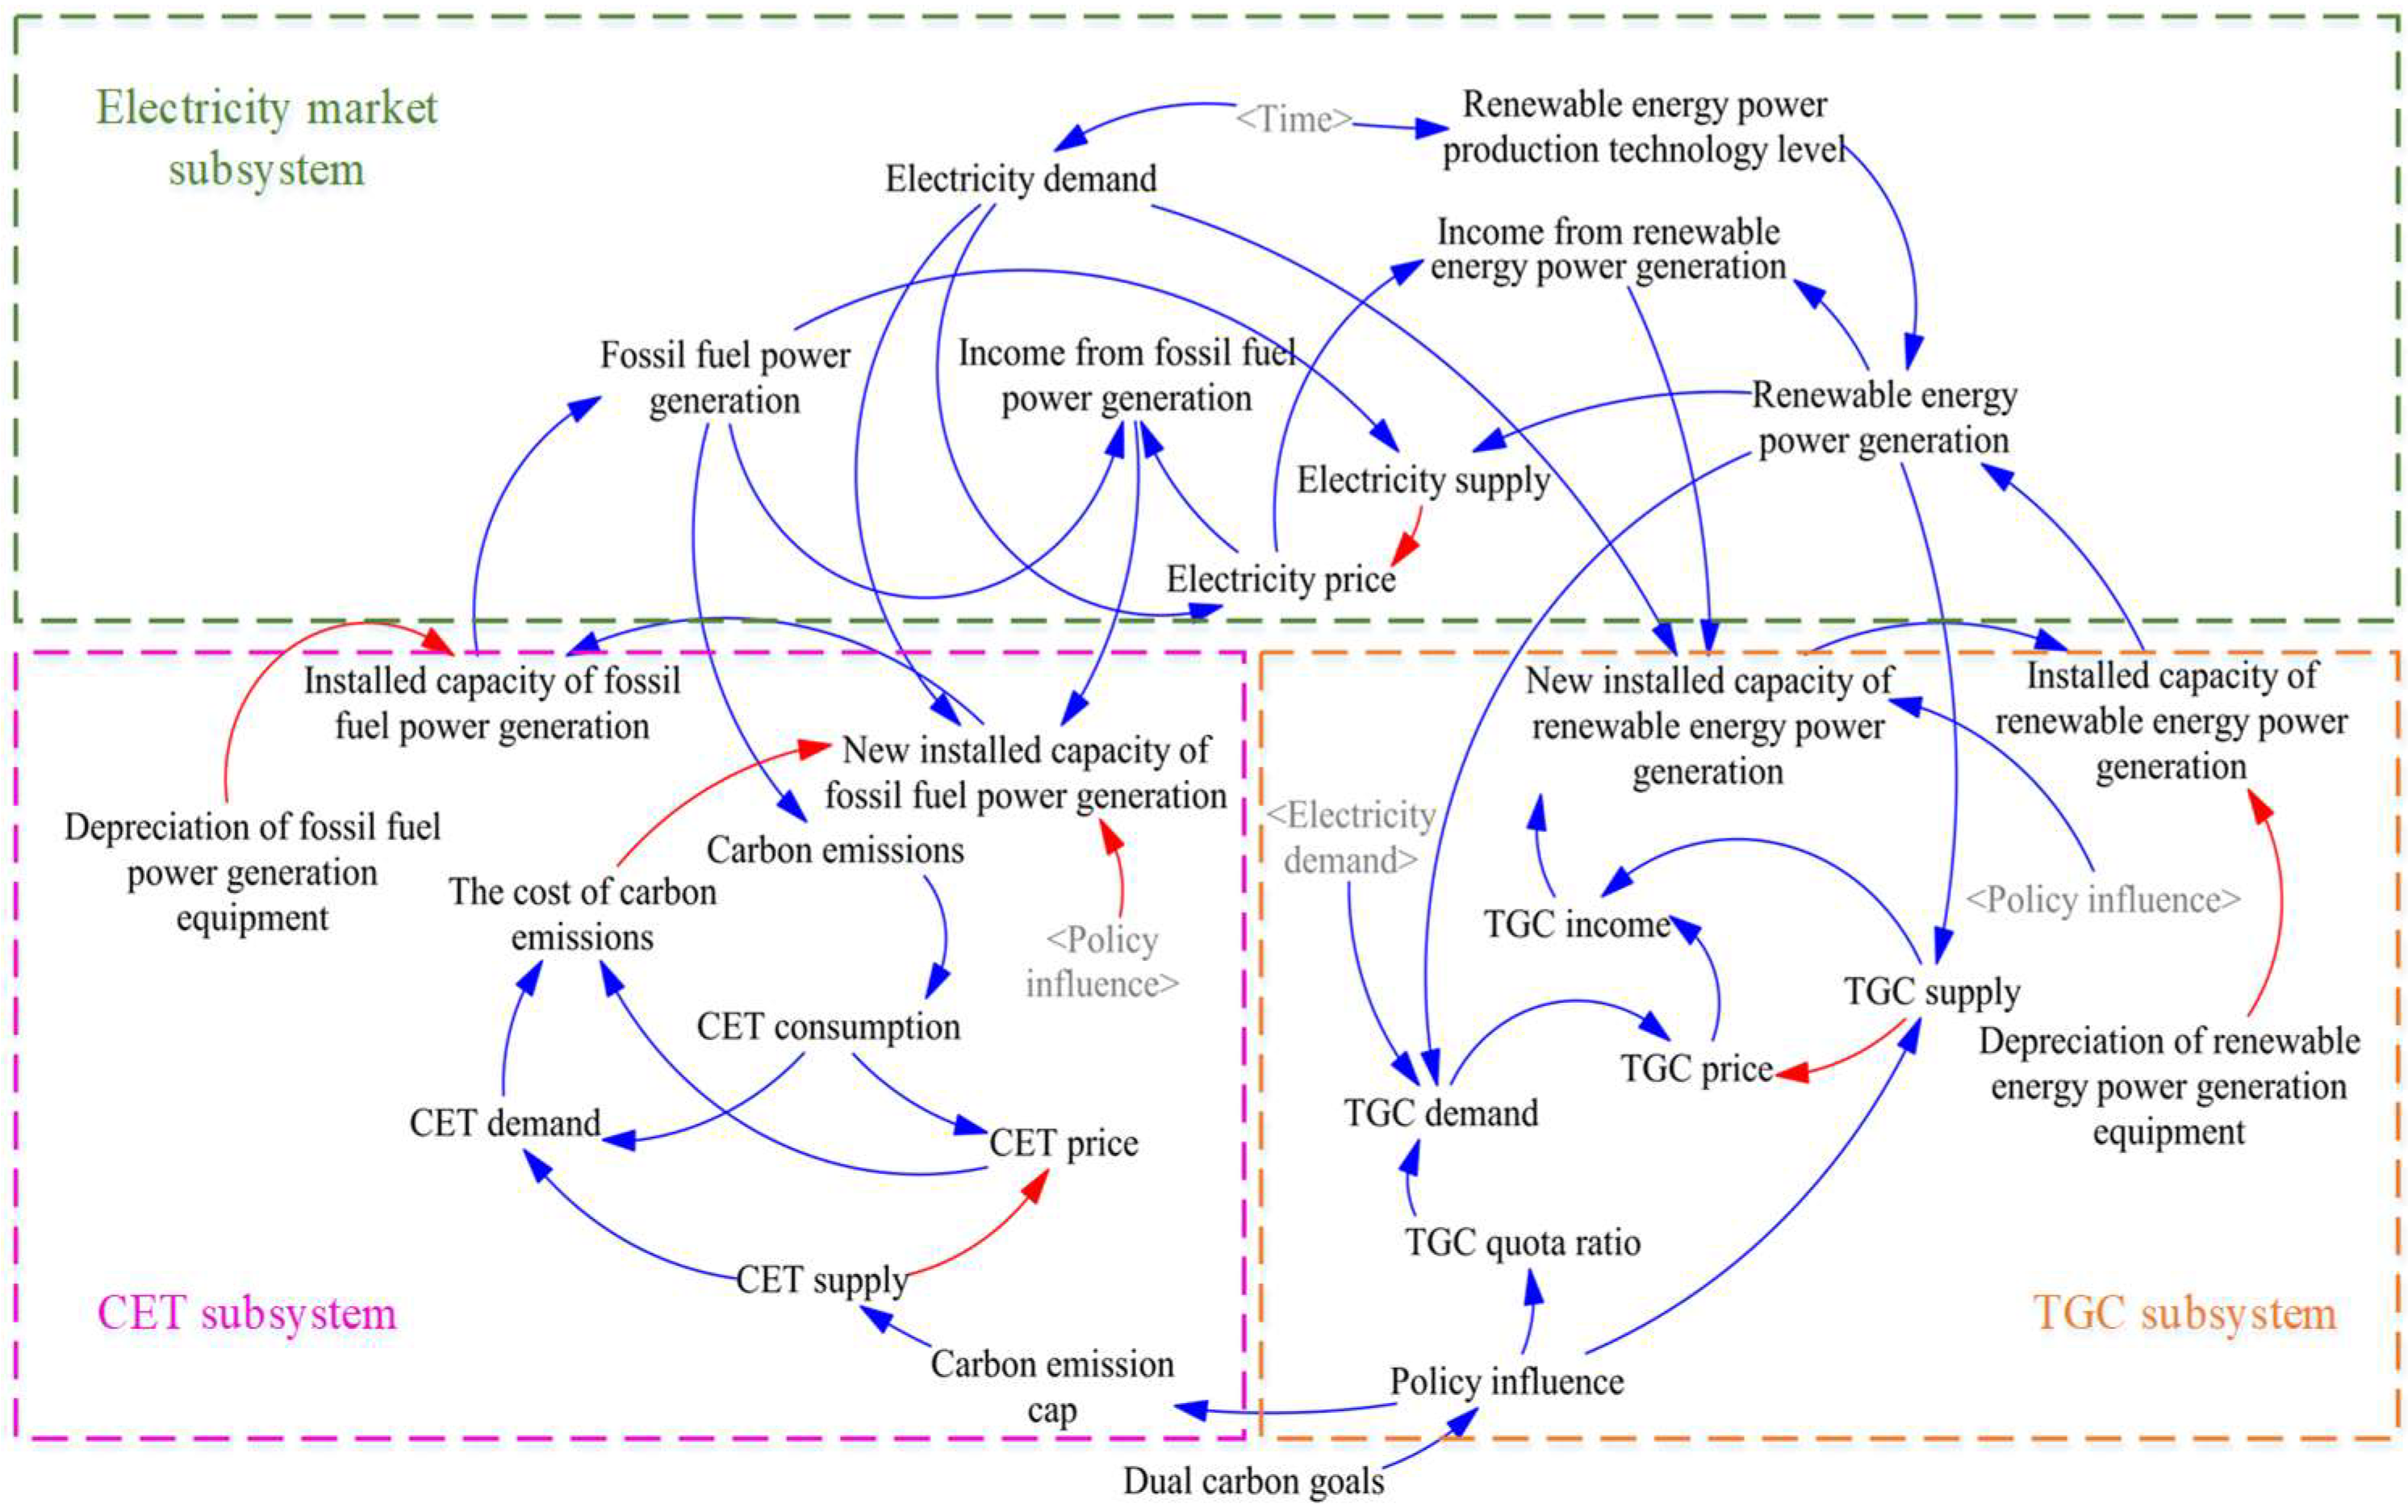
This study is based on the mutual influence mechanism between TGC and CET, analyzing their comprehensive impact on the sustainable development level of the electricity market under their joint action. A causal feedback loop between TGC and CET is established, which includes three subsystems: (1) electricity market subsystem: electricity supply, electricity demand, electricity prices, etc.; (2) CET subsystem: CET consumption, CET demand, carbon emissions, etc.; (3) TGC subsystem: TGC quota ratio, TGC demand, TGC supply, TGC income, etc. Figure 4 shows the causal feedback loop. The blue line represents the positive feedback loop, which promotes the pointed variable. List a positive feedback loop: when the government increases the TGC quota ratio, the TGC demand increases with the increase in the TGC quota ratio, promoting an increase in TGC price and TGC income. This leads to electricity enterprises being willing to invest in renewable energy generation equipment, facilitating the supply of green electricity, decreasing traditional fossil energy generation, and ultimately promoting the reduction of carbon emissions. The red line represents a negative feedback loop that exerts a suppressive effect on the variable being pointed to.

3.2.2. System Flow Diagram

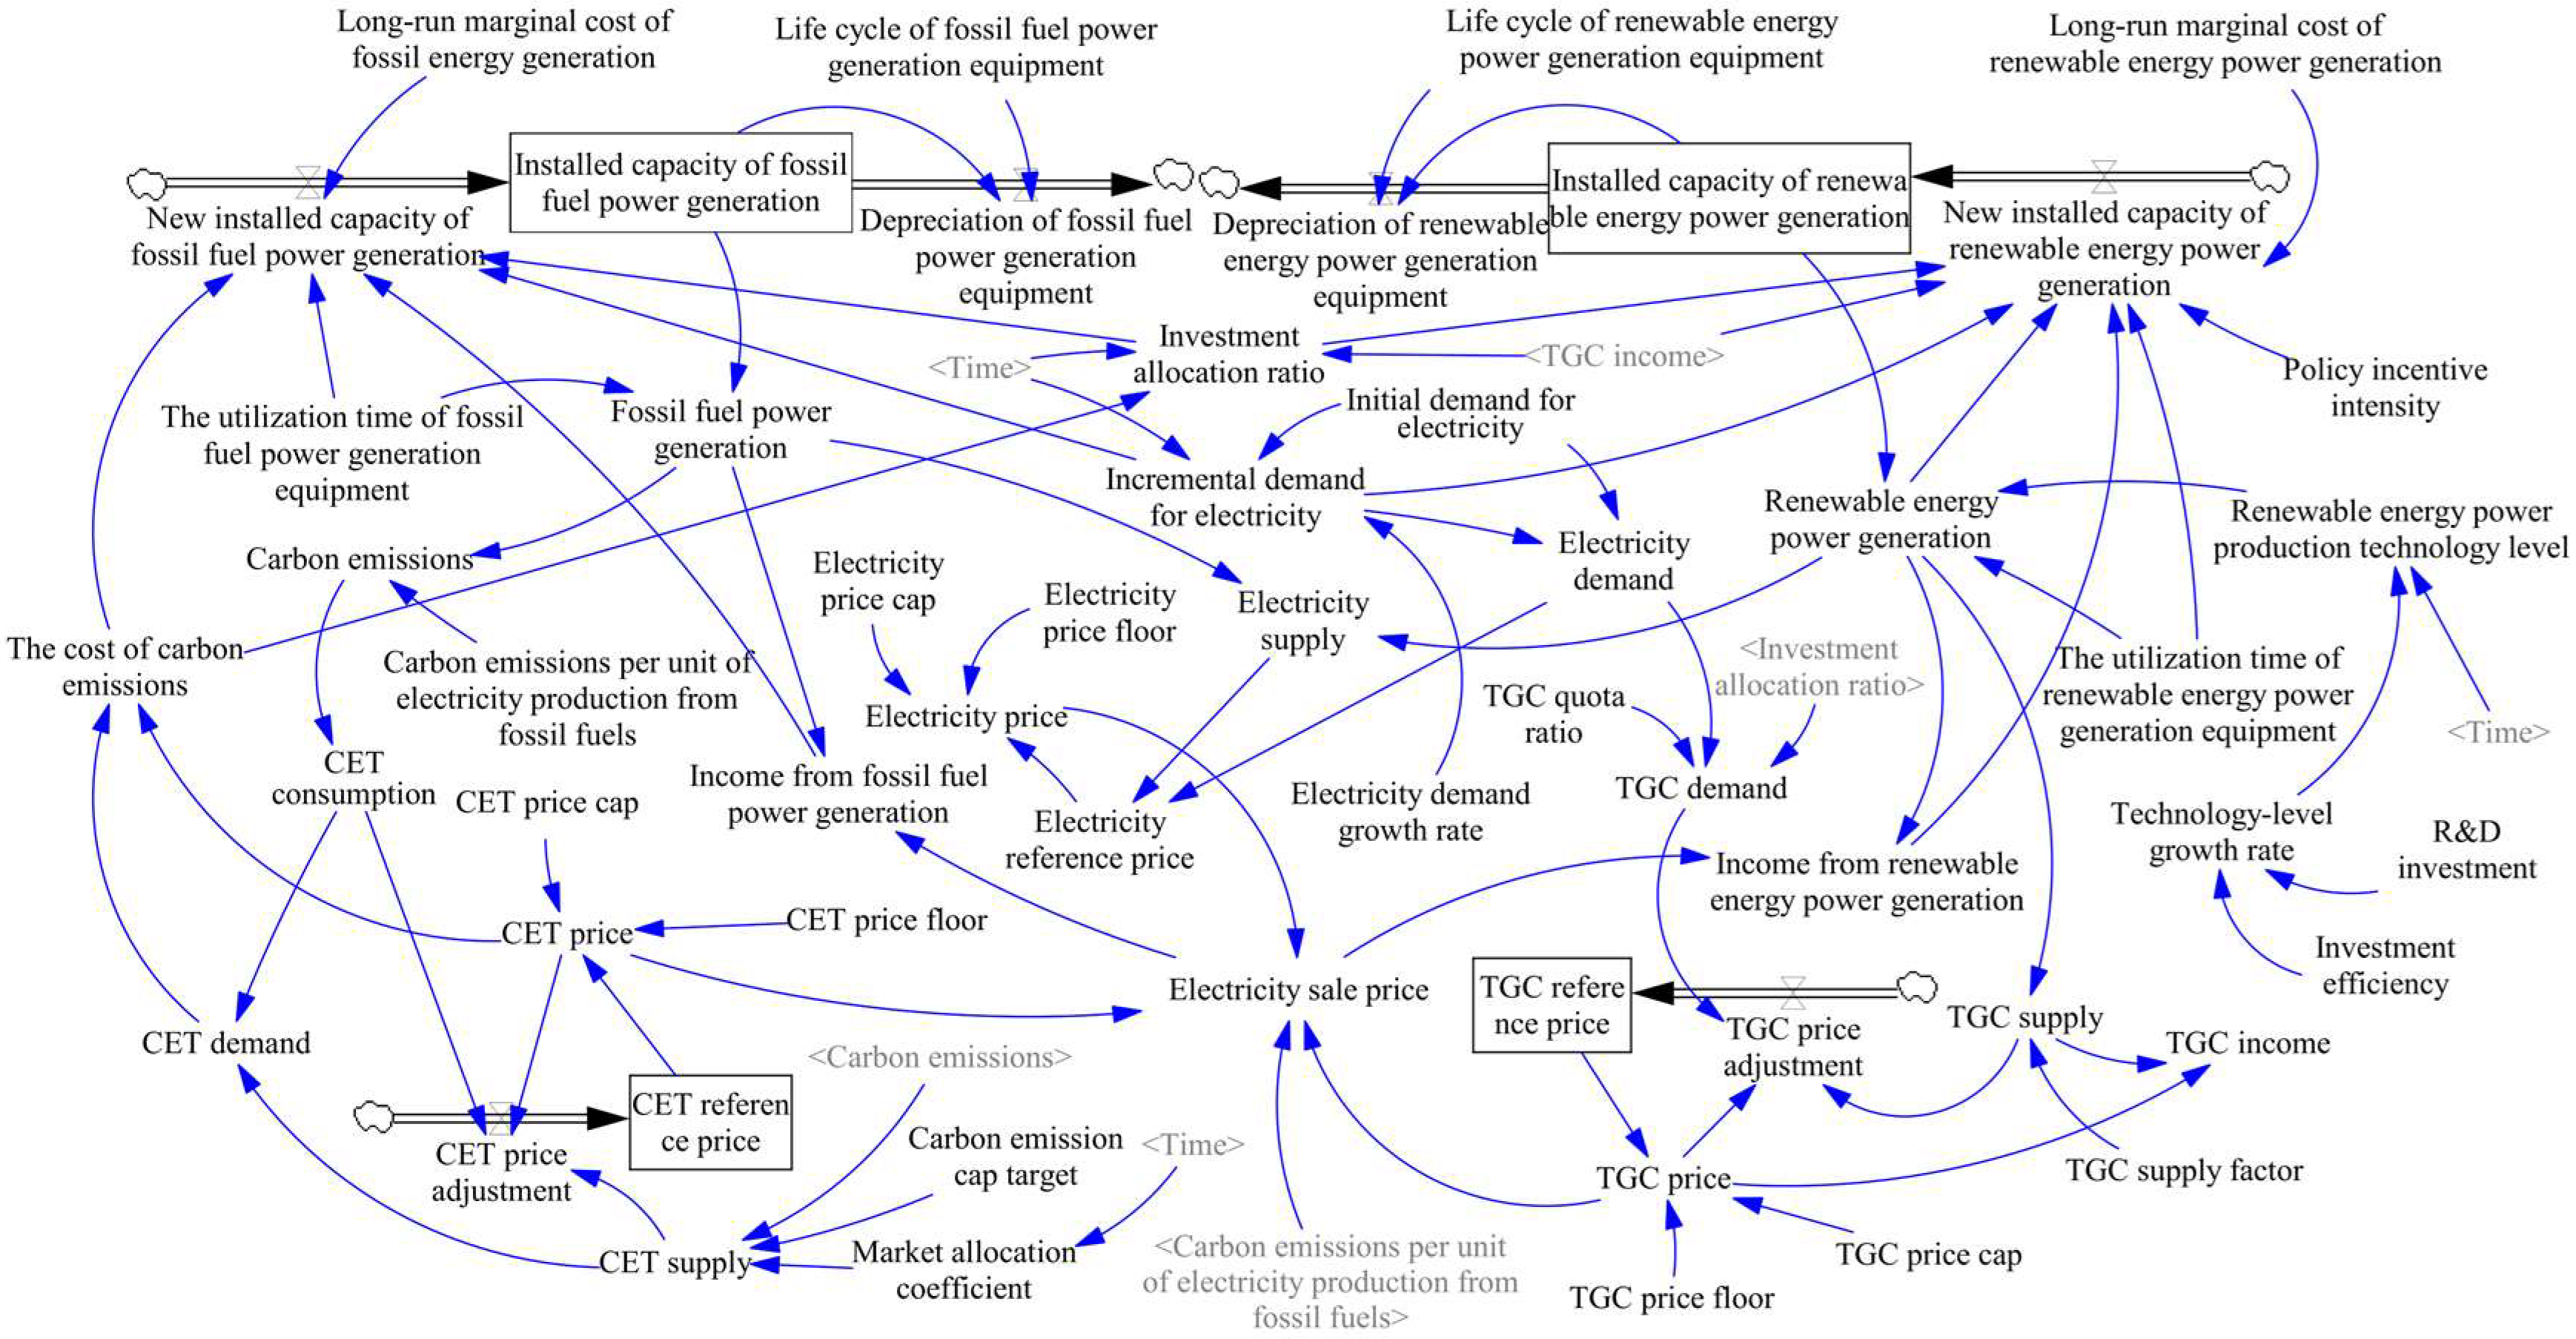
The causal feedback loop is a qualitative description of the correlation between TGC and CET and their impact path on the sustainable development of the electricity market, aiming to reveal the interaction between the two and their dynamic impact on the system. The system flow diagram is a further extension of the causal feedback loop, which quantifies the dynamic relationship between TGC, CET, and the electricity market and combines actual data to visually present the system’s dynamic behavior and operating mechanism. When constructing the system flow diagram, this study thoroughly considered the following principles: (1) operability of system simulation, ensuring clear system structure and controllable model complexity; (2) logic ensures that the logic between variables is rigorous and in line with reality; and (3) for the availability of data, priority should be given to selecting variables with actual observations or data that can be estimated. Based on this, this study constructed a system flow diagram for the sustainable development of the electricity market under the joint influence of TGC and CET, as shown in Figure 5. The system flow diagram comprises 56 variables, including 4 states, 6 rates, and 46 auxiliary variables.

3.3. Data and Variables

Liaoning Province is a traditional energy-heavy industry base in China, and fossil fuels still dominate its energy structure. Fossil fuels such as coal and oil account for a large proportion of energy consumption in Liaoning Province. However, with the gradual increase of national carbon reduction targets, Liaoning Province is accelerating the application and development of renewable energy, presenting typical characteristics of energy structure transformation. This background makes Liaoning Province an ideal area for studying the practical application of TGC and CET policies in the transformation of the power industry, and the energy transformation practice in Liaoning Province provides valuable cases for research. Secondly, Liaoning Province is facing significant pressure in carbon reduction. Although Liaoning Province’s total carbon emissions are not exceptionally high compared to some other provinces, its carbon emissions far exceed the national carbon emission quota and rank third in the country [44]. This situation makes it more urgent for Liaoning Province to promote green and low-carbon development and accelerate the transformation of the energy structure. Choosing Liaoning Province as a case study can deeply explore how to effectively reduce carbon emissions through market mechanisms and promote the sustainable development of the power industry. In addition, Liaoning Province has experience in the construction of TGC and CET markets, and the relevant policy system and regulatory mechanism are relatively complete. This provides a relatively mature practical background for this study, which can support empirical analysis based on TGC and CET policies. Finally, as an old industrial base in Northeast China, Liaoning Province has a highly representative economy and industrial structure nationwide. The industrial system of the province covers multiple fields, such as heavy industry, traditional manufacturing, and emerging industries. Therefore, its experience and challenges in promoting low-carbon transformation have substantial reference value for policy formulation and implementation in other similar regions. The case study of Liaoning Province can provide policy references for different areas of similar economic development stages and industrial structures and has high theoretical and practical significance.
This study mainly defines the functional equations between variables and assigns values to variables based on expert experience, historical data, and previous research. (1) Literature analysis: This study first extensively and systematically reviewed relevant literature on TGC and CET policies, with a focus on analyzing previous research findings and their derivation of variable relationships. Such as the function equation of the newly installed capacity of fossil fuel power generation, the function equation of the deduction of renewable energy power generation equipment, and the initial assignment of TGC price cap, etc. In addition, empirical parameters from previous studies, such as the CET price cap and CET price floor, were also referenced. These literature provides a theoretical framework for model construction and empirical support for parameter setting in equations. (2) Expert interview method: To ensure that the variable relationships and parameter settings are consistent with the actual situation, this study conducted semi-structured interviews with 9 experts who have been engaged in TGC- and CET-related research and industry management for a long time and collected adequate first-hand data. The interviewed experts include 5 university scholars, 2 government officials involved in formulating TGC and CET policies, and 2 senior employees from power companies. The main content of the interview includes confirmation of variable names, discussion and establishment of functional relationships between variables, discussion of the implementation of TGC and CET policies, and discussion and determination of influencing factors such as the adjustment mechanism of TGC prices and CET prices. Through expert interviews, this study obtained important information on the interrelationships between variables and established equations for each variable in the system flow diagram, such as the investment allocation ratio, the functional equations for TGC price and CET price adjustment, etc. The interview results not only provided more accurate quantitative data for the research but also helped to deepen the understanding of the challenges and complexities in the implementation process of TGC and CET, providing a practical and valuable reference for the parameter assignment of the model. (3) Historical data analysis: To enhance the realism and accuracy of the model, this study fully considers the power structure adjustment situation in Liaoning Province in recent years and utilizes actual historical data, including key data such as the initial values of the installed capacity of renewable energy power generation, the long run marginal cost of fossil energy generation, and the TGC supply factor. These historical data provide strong support for parameter assignment, ensuring the reliability of the model analysis results. The data for this study were sourced from statistical publications such as the China Statistical Yearbook and the Liaoning Provincial Statistical Yearbook. This study sets the spatial boundary of the system to Liaoning Province, the time boundary to 1–120 months, and the simulation steps to 1 month. The detailed information on the data and variables in the system flow diagram is shown in Table 1.
To ensure the credibility of the model and the smooth development of empirical research, the following basic assumptions are proposed:
Assumption 1.
The effect of force majeure is not considered during the operation of the system;
Assumption 2.
The supply and demand relations of the Liaoning power market subsystem, TGC subsystem, and CET subsystem accord with the principle of free competition. The decision-making of market entities aims to maximize economic benefits;
Assumption 3.
The technological level of power enterprises (such as power generation efficiency, carbon emission reduction technology, etc.) maintains a predetermined change trend during the research period without significant technological breakthroughs or innovations.

3.4. Model Validation

Firstly, verify the SD model’s system boundary. After removing a variable from the system flow diagram, analyze whether the path where the variable is located can still run normally. Then, check each other variable in the model one by one to ensure the rationality of the model system boundary [45].
Then, the “Check Model” function in Vensim PLE software 7.3.2 was used to inspect the model comprehensively. The results showed that all variables had been assigned values and had consistent dimensions. The functional equations between each variable had been correctly constructed, ensuring the model structure and logic’s effectiveness and laying the foundation for subsequent simulation analysis.
Finally, historical data verification will be conducted to check whether the model’s simulation results match the actual situation. The results will be compared with historical data, simulation errors will be reduced by adjusting variable parameters reasonably, and the authenticity and effectiveness of the simulation results will be ensured. It is generally believed that if the error rate is within ±10%, the model is effective and can be used for simulation analysis [30]. Considering that the electricity supply is involved in many impact paths in the system and the historical data of the electricity supply is easily accessible, it has been updated to 2022. Therefore, comparing the electricity supply values simulated by the system with the data from 2020 to 2022 in the Liaoning Statistical Yearbook, as shown in Table 2, the error rates are all less than ±10%, indicating that the system dynamics model is authentic and can truly reflect the actual operating status of the impact of TGC and CET on the sustainable development of the power market.

4. Results

The TGC quota ratio and carbon emission cap target are specific manifestations of TGC and CET policies. Therefore, in the study of the impact of TGC and CET on the sustainable development of the electricity market, the TGC quota ratio and carbon emission cap target are used as input variables for SD model simulation. The analysis of sustainable development results is carried out from three aspects: economic, environmental, and market. Among them, economic analysis is represented by the TGC price, CET price, and electricity sale price in the system; environmental analysis is reflected by carbon emissions; and market analysis is represented by new installed capacity of fossil fuel power generation and new installed capacity of renewable energy power generation.

4.1. Initial Simulation Analysis

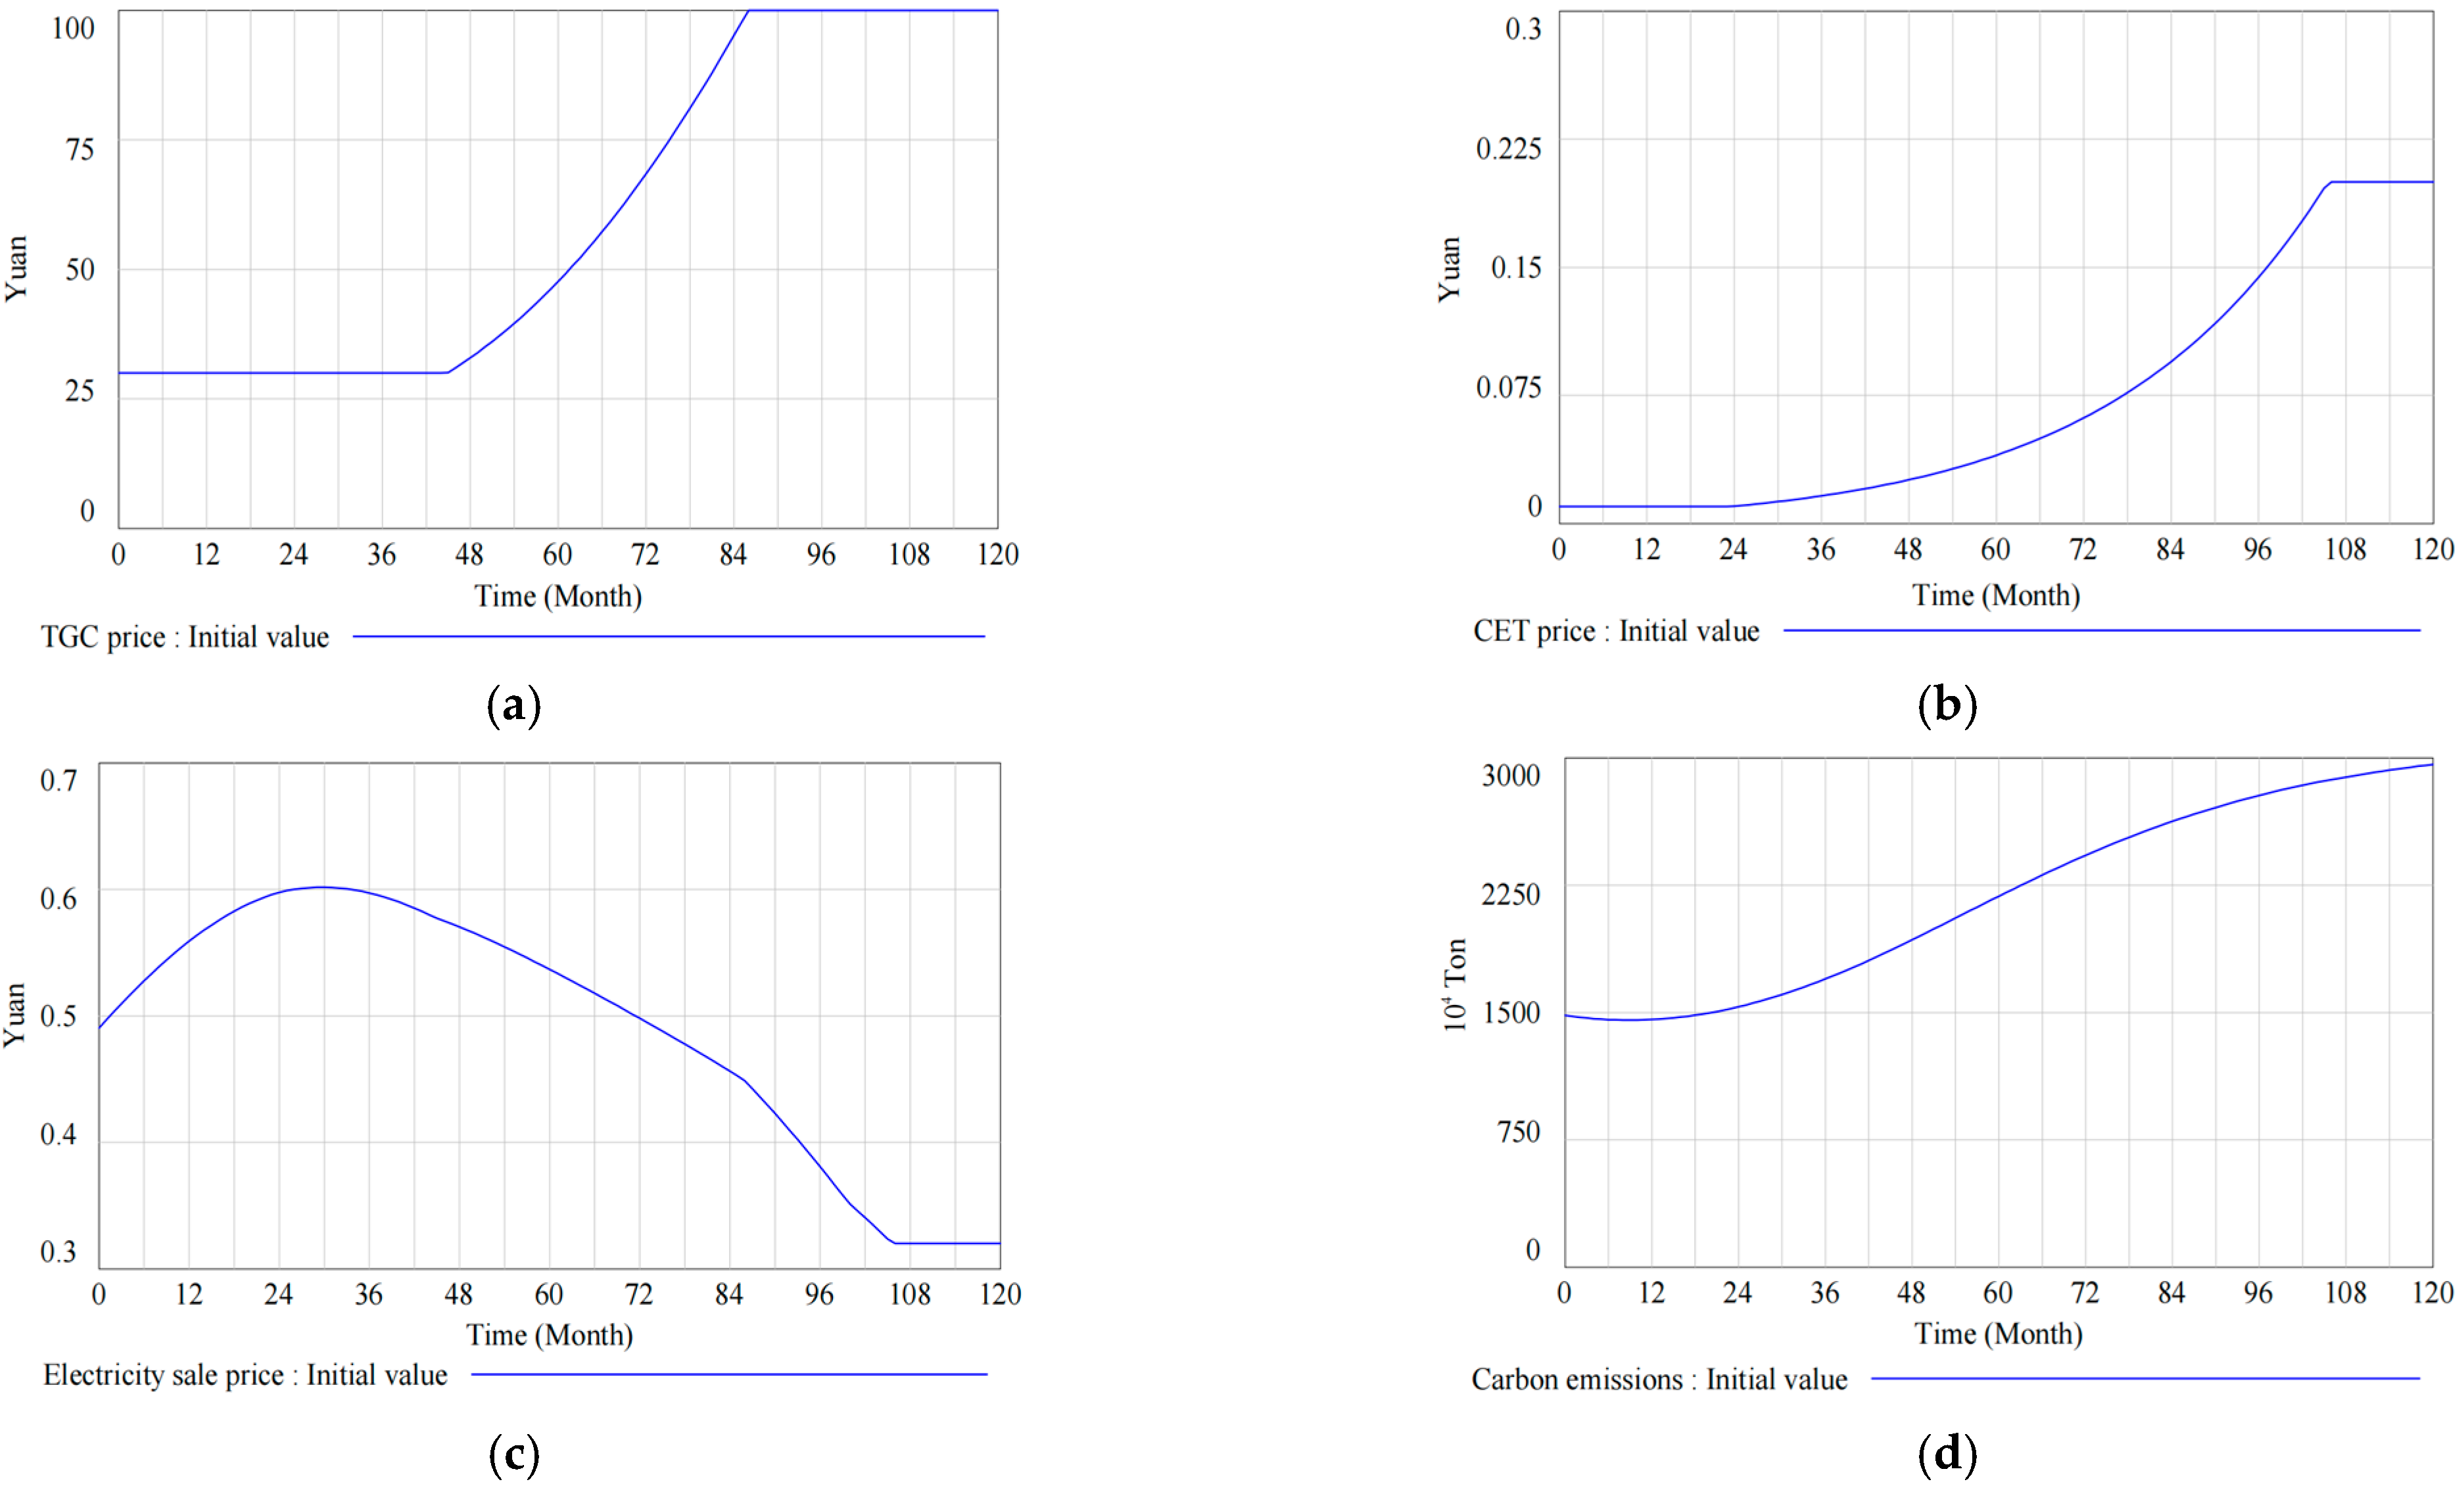
The initial simulation results are shown in Figure 6. Both supply and demand factors influence the TGC price. The TGC price remained stable at 30 yuan/sheet for 45 months in the initial stage. With the continuous increase in renewable electricity capacity installed, the TGC demand rapidly rises, leading to a sharp increase in TGC prices to 100 yuan/sheet. The CET price is influenced by both supply and consumption, showing a gentle upward trend and ultimately stabilizing at around 0.2 yuan/kg. The electricity sale price shows a trend of first rising and then falling. In the initial stage, due to the increasing demand for electricity in Liaoning Province and the shortage of renewable generation equipment, the electricity sale price gradually increased from 0.49 yuan/KWh to 0.6 yuan/KWh. However, with the increase in installed capacity of renewable energy power generation and the popularization and application of power generation technology, the cost of electricity production gradually decreases, and the electricity sale price begins to fall, ultimately stabilizing at 0.32 yuan/KWh. To ensure the rigor of the research results on key price indicators, error analysis is conducted by calculating the confidence intervals of TGC price, CET price, and sales electricity price simulation data. This study will estimate the confidence intervals of three indicators separately from the stationary and fluctuating stages to avoid mixing the statistical characteristics of different stages. The calculation results are shown in Table 3. Calculating the 95% confidence interval helps better understand the optimal numerical ranges for TGC price, CET price, and electricity sale price.
The carbon emissions initially showed an upward trend, mainly due to fossil fuels still being the primary source of power generation. However, as the proportion of clean energy applications increases, the trend of carbon emissions growth gradually slows down and stabilizes at the end of the research period. The analysis of installed power generation capacity shows that due to technological and cost constraints, renewable energy generation equipment cannot completely replace fossil fuel generation equipment in the short term. Therefore, the new installed capacity of fossil fuel power generation continued to show a stable upward trend from 0 to 60 months. However, with the development, application, and popularization of renewable energy generation technology, the new installed capacity of fossil fuel power generation began to decline significantly between 60 and 120 months. Meanwhile, driven by policy incentives and economic development, the new installed capacity of renewable energy power generation has shown a sustained and stable growth trend.

4.2. Sensitivity Analysis

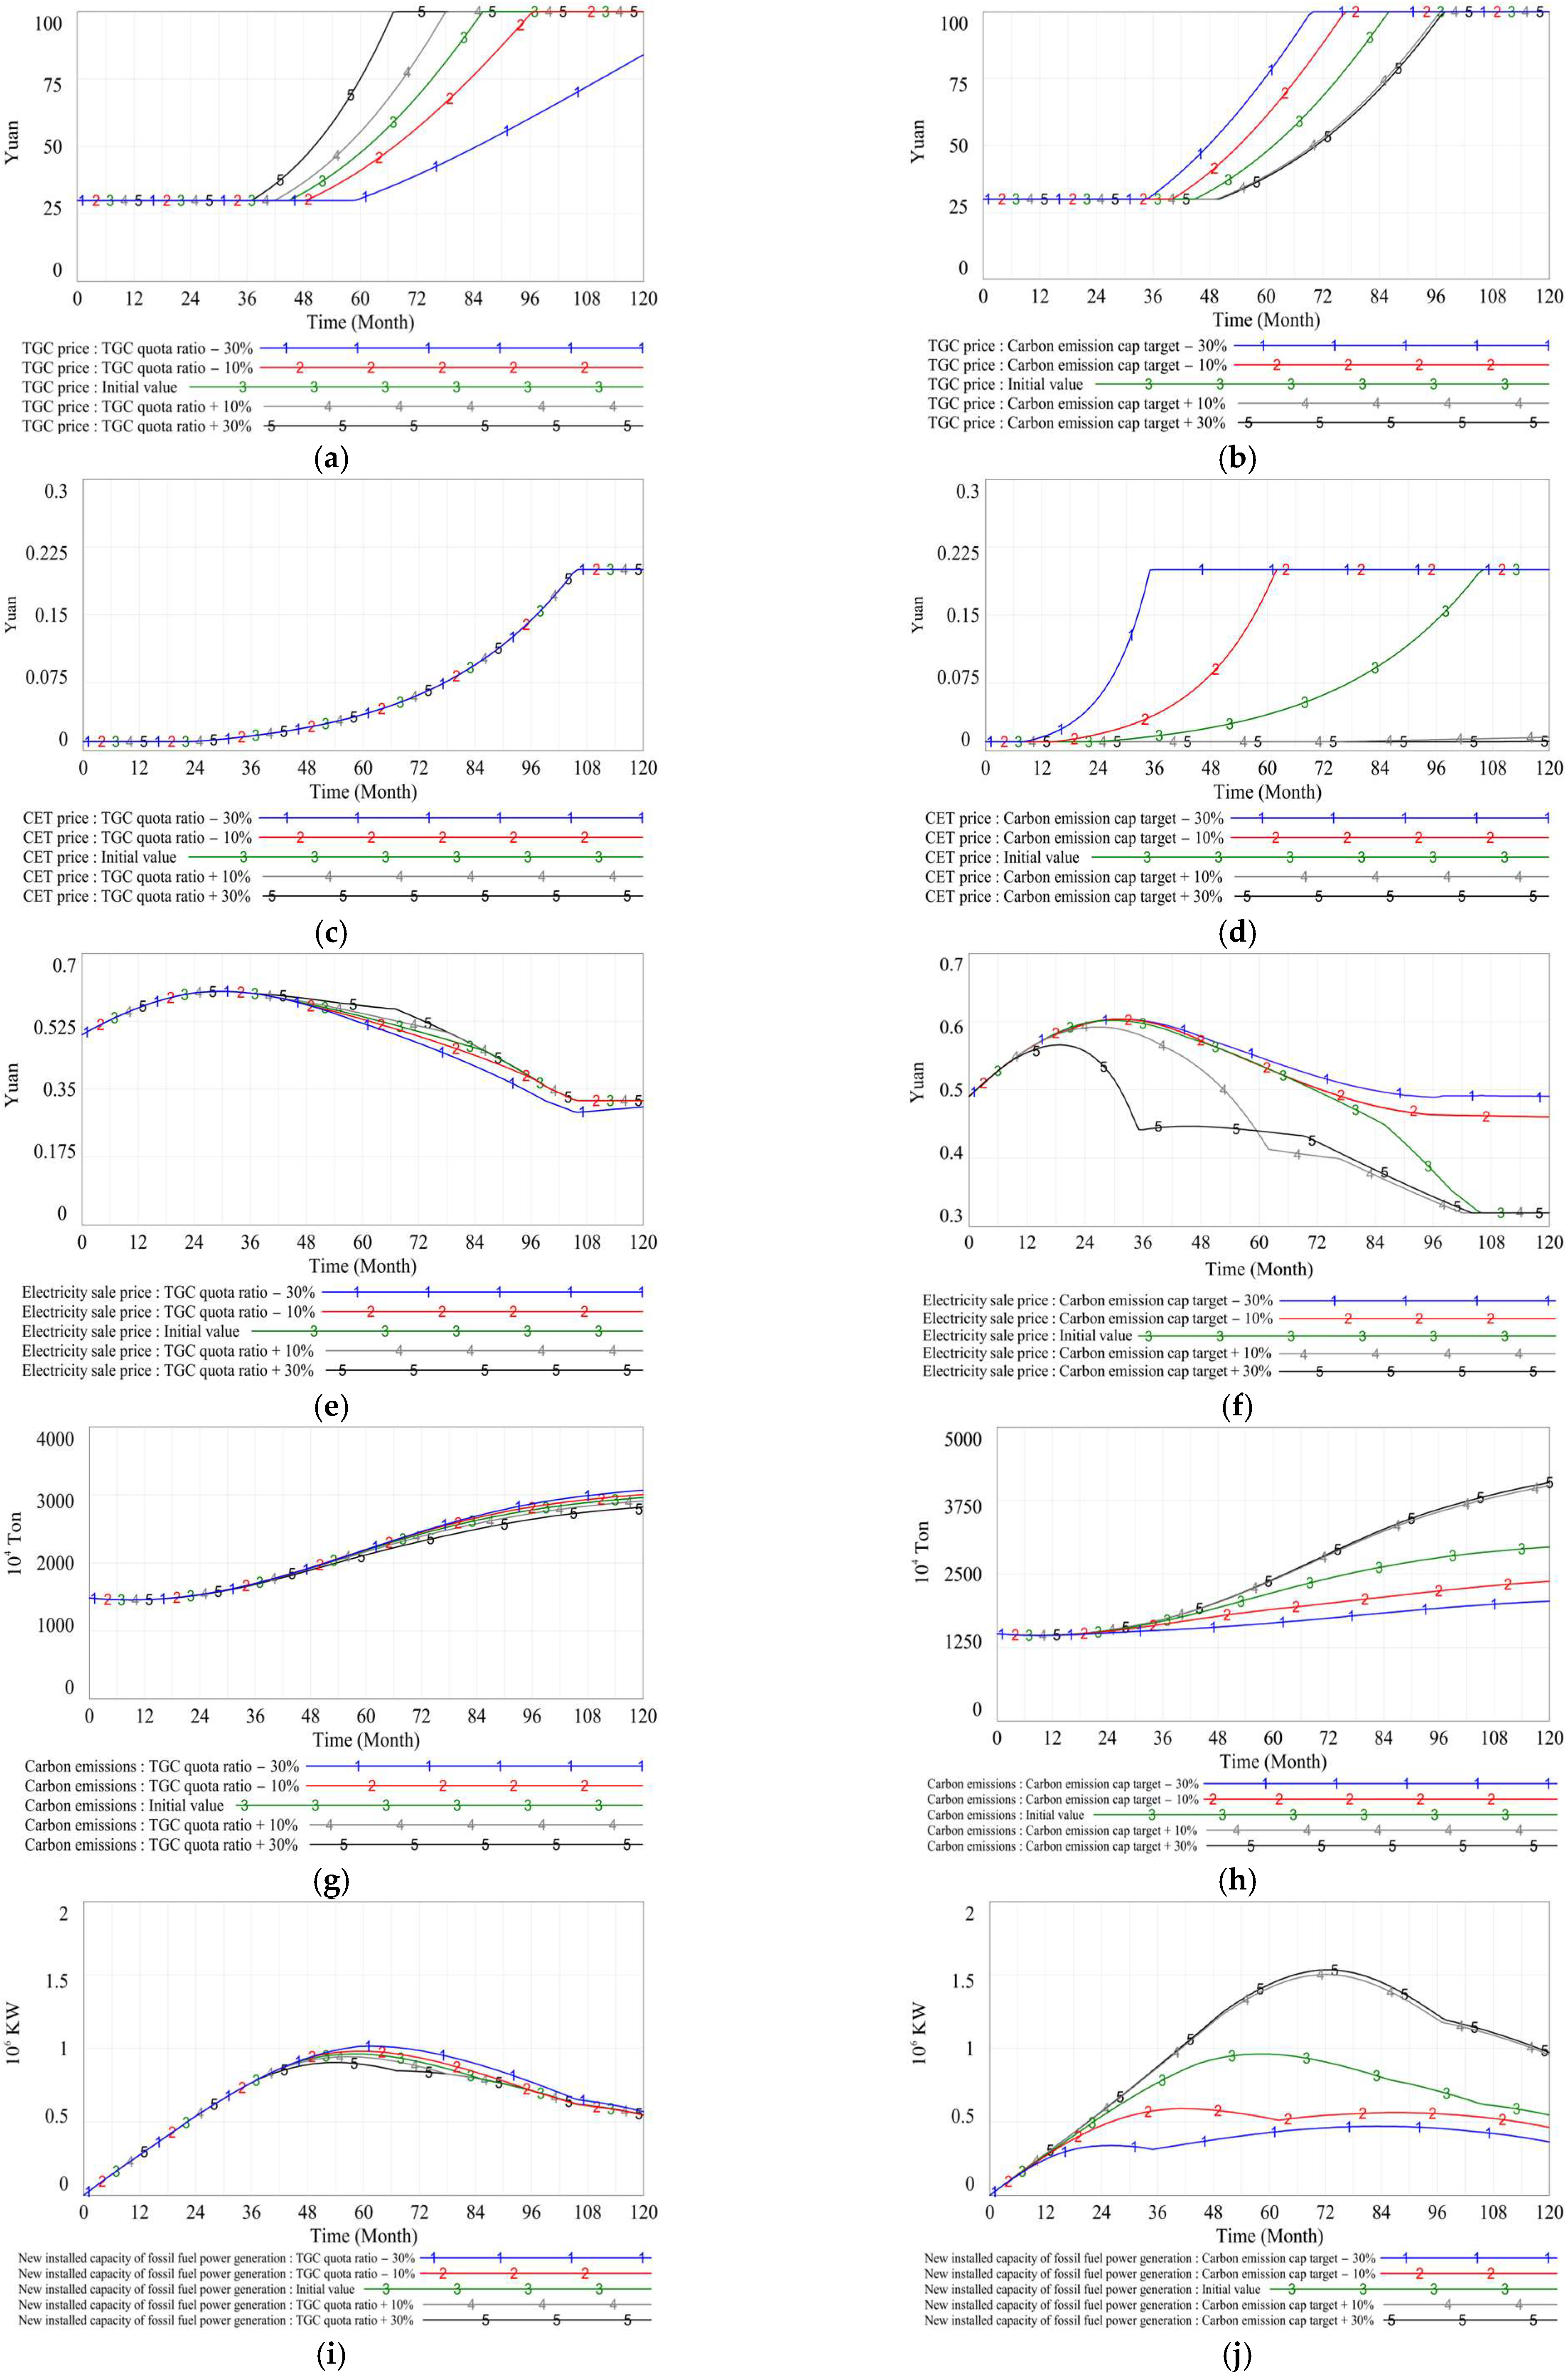
To clarify the impact trends of the TGC quota ratio and carbon emission cap target on relevant factors under policy adjustments, this study adjusted the initial values of the TGC quota ratio and carbon emission cap target by reducing them by 30%, reducing them by 10%, increasing them by 10%, and increasing them by 30%, respectively. Analyze the impact of changes in policy incentives on variables such as TGC price, CET price, electricity sale price, carbon emissions, new installed capacity of fossil fuel power generation, and new installed capacity of renewable energy power generation. The simulation results of sensitivity analysis are shown in Figure 7.
Figure 7a–f are sensitivity analyses of the economic situation. Firstly, regarding the impact of TGC price, there is a significant positive correlation between the TGC quota ratio and the TGC price. The higher the TGC quota ratio, the faster the growth rate of the TGC price. The rise in TGC prices may indicate an increase in the marginal cost of clean energy. This will prompt power companies to increase investment in renewable energy projects to meet quota requirements and reduce future purchasing costs. The carbon emission cap target has a negative regulatory effect on TGC price, and as the carbon emission cap target decreases, the growth rate of TGC price accelerates. It is worth noting that when the carbon emission cap target increases by 10% or 30%, the difference in the impact on TGC price is not significant. The impact of changes in the TGC quota ratio on the CET price is not significant. The adjustment of the carbon emission cap target has a significant negative effect on CET price, especially when it decreases. Specifically, when the carbon emission cap targets are reduced by 30% and 10%, respectively, CET prices show a significant increase, and the growth rate accelerates significantly. This change will affect the decision-making process for the use of CET, stimulating high-carbon emission enterprises to invest in renewable energy projects to promote carbon emission reduction. When the carbon emission cap target increases by 10%, the CET price increases slowly. When the carbon emission cap target increases by 30%, there is no upward trend in CET price. An excessively high carbon emission cap target may lead to a weakening of carbon market price signals, reducing the incentive for electric power enterprises to reduce emissions. At first, the adjustment of the TGC quota ratio had a limited impact on the electricity sale price. With the development of renewable energy generation technology, the TGC quota ratio is starting to have a slight impact on the electricity sale price. However, only when the TGC quota ratio decreases by 30% will it significantly affect the electricity sales price and promote further decline in the electricity sales price. In contrast, the impact of the carbon emission cap target on electricity sale prices is more significant. When the carbon emission cap target is raised, electricity sale prices significantly fluctuate and rapidly decline. Tightening the carbon emission cap target will increase the cost of emission reduction for enterprises, leading to a gradual slowdown in the downward trend, ultimately maintaining at around 0.5 yuan/KWh. This change has prompted power enterprises to increase investment in renewable energy projects to reduce carbon emission costs and maintain profitability. The impact of the TGC quota ratio and carbon emission cap target on carbon emissions is shown in Figure 7g,h. Carbon emissions decrease as the TGC quota ratio increases, and the higher the TGC quota ratio, the more significant the carbon reduction effect. When the TGC quota ratio rises by 30%, carbon emissions show a significant downward trend. The increase in the TGC quota ratio drives power enterprises to optimize their energy structure and invest more in the renewable energy sector. The carbon emission cap target has a positive impact on carbon emissions. When the carbon emission cap target is reduced by 10%, carbon emissions significantly decrease. When the carbon emission cap target is reduced by 30%, carbon emissions will further show a significant downward trend. When the carbon emission cap target increases by 10%, carbon emissions will significantly increase and grow rapidly, but when it is increased again to 30%, there is no sustained growth effect. Strict carbon emission cap targets encourage companies to reduce carbon emissions, which helps promote the development of low-carbon projects in the electricity market. Figure 7i,j demonstrate the impact of changes in TGC quota ratio and carbon emission cap target on the new installed capacity of fossil fuel power generation. In the case of a decrease in the TGC quota ratio, the newly installed capacity of fossil fuel power generation increases, but the effect of the increase is relatively small. On the contrary, the carbon emission cap target has a significant impact on the new installed capacity of fossil fuel power generation. When the carbon emission cap target decreases by 10%, the newly installed capacity of fossil fuel power generation shows a significant downward trend; when it is further reduced by 30%, the new installed capacity of fossil fuel power generation continues to decline. When the carbon emission cap target increases by 10%, the newly installed capacity of fossil fuel power generation significantly increases; however, no significant changes were observed when it was increased by 30%. The impact of the TGC quota ratio and carbon emission cap target on new installed capacity of renewable energy power generation is shown in Figure 7k,l. The change in TGC quota ratio has a positive impact on the new installed capacity of renewable energy power generation. When the TGC quota ratio increases by 10%, the new installed capacity of renewable energy power generation increases accordingly. When the TGC quota ratio rises by 30%, the growth effect of the newly installed capacity of renewable energy power generation further increases. The impact of carbon emission cap targets on new installed capacity of renewable energy power generation shows irregular changes. When the carbon emission cap target was reduced by 10% or 30%, no significant effect was observed. When the carbon emission cap target increases by 10%, the newly installed capacity of renewable energy power generation significantly decreases; however, when it was increased by 30% again, there was no further change. Increasing the TGC quota ratio has increased the demand for clean energy in the electricity market, encouraged enterprises to transition to green electricity, and promoted investment in renewable energy projects. The adjustment of carbon emission cap targets has guided the decision-making of power companies to a greater extent. Strict carbon emission targets encourage companies to increase investment in renewable energy projects. In contrast, loose emission caps may reduce the motivation for the development of renewable energy projects and increase the electricity market’s dependence on fossil fuels.

4.3. Comprehensive Simulation Analysis

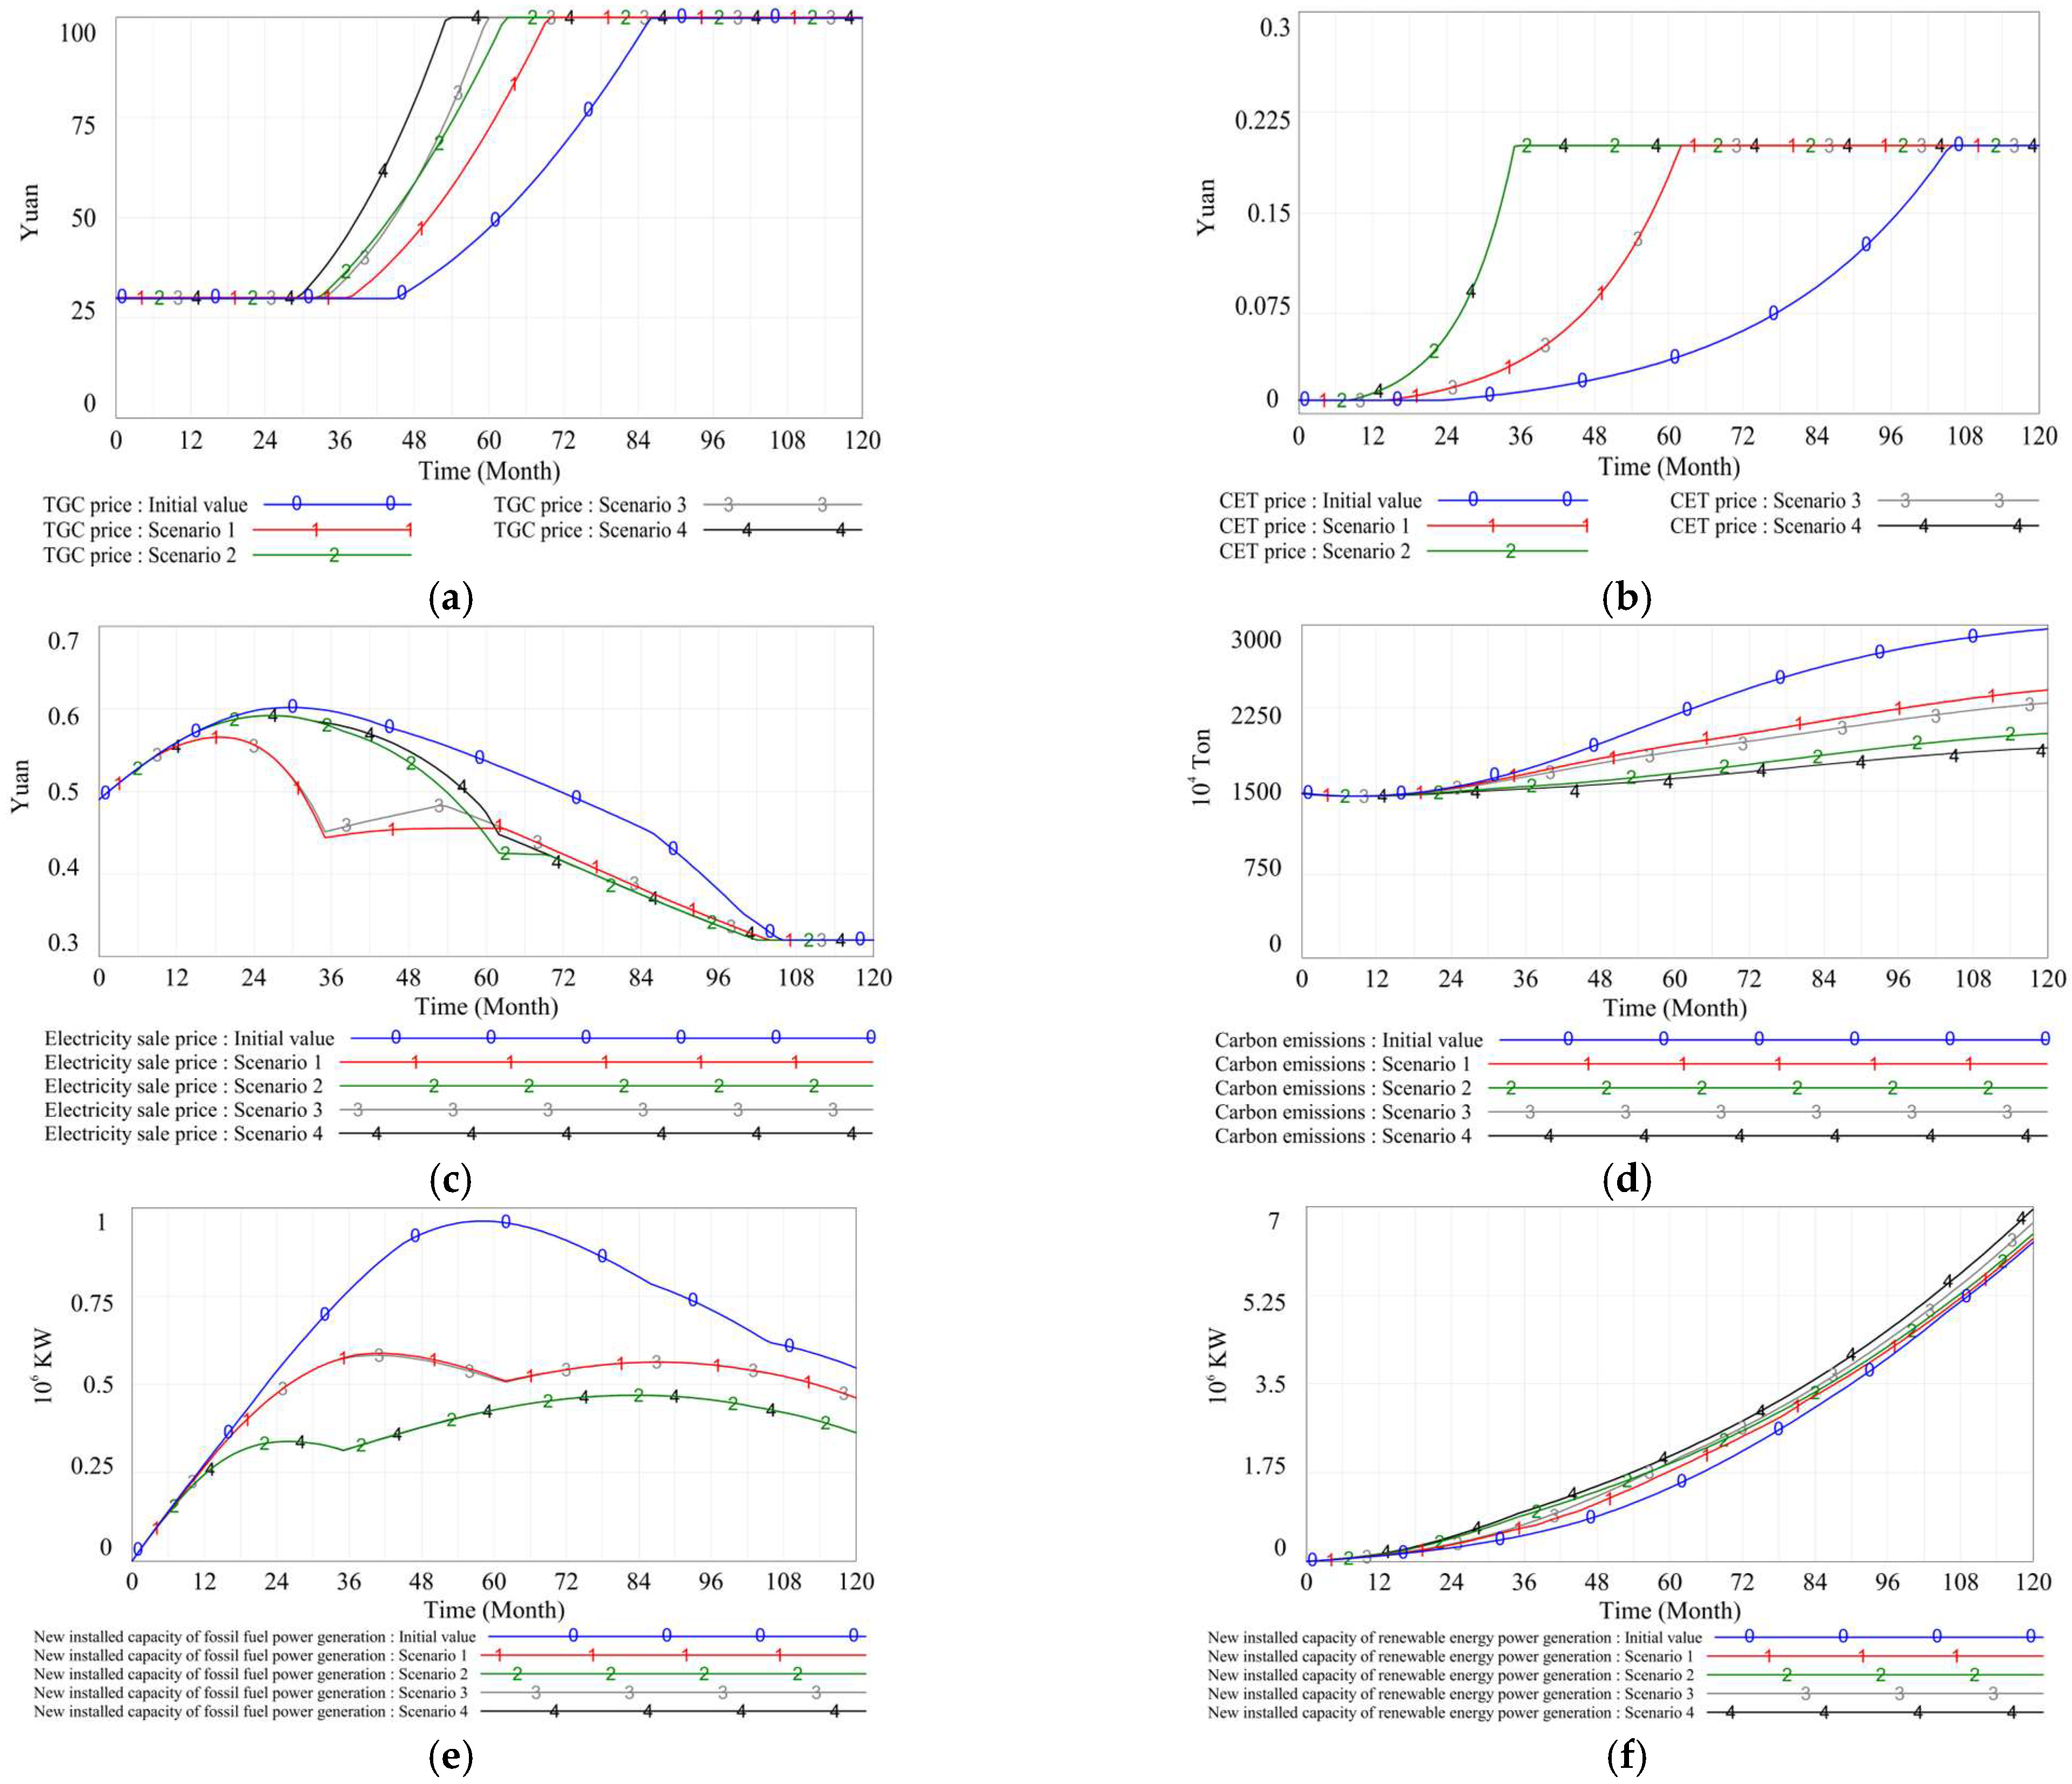
Based on the above research results, a comprehensive simulation analysis is conducted to consider the impact of jointly adjusting the TGC quota ratio and carbon emission cap target on the sustainable development of the electricity market. When the TGC quota ratio increases by 10% or 30% and the carbon emission cap target decreases by 10% or 30%, it has a positive impact on the sustainable development of the electricity market. Therefore, this study sets four scenario control schemes for comprehensive simulation, as shown in Table 4. The comprehensive simulation results are shown in Figure 8.
The comprehensive simulation design has a significant impact on TGC price, which can quickly increase TGC price. The order of effects is Scenario 4 > Scenario 3 > Scenario 2 > Scenario 1 > Initial value. In the early stage, Scenario 2 had a more significant impact on increasing TGC prices. In contrast, in the later stage, Scenario 3 had a more pronounced promotion effect on TGC, far exceeding the impact of Scenario 2. When the level of renewable energy generation is low, the TGC price is more significantly affected by the carbon emission cap target. When renewable energy generation reaches a particular scale, the TGC price is more considerably affected by the TGC quota ratio. Due to the small impact of the TGC quota ratio on the CET price, in the comprehensive simulation, the CET price is still mainly affected by changes in the carbon emission cap target. The simulation results are basically consistent with Figure 8b. The electricity sale price shows irregular fluctuations due to the influence of the comprehensive simulation scenario settings. It is mainly affected by Scenario 1 and Scenario 3 in the early stage, which show a relatively significant price reduction. With the development of renewable energy and the reduction of electricity production costs, all four scenarios have promoted a sustained decrease in the electricity sale price, ultimately maintaining it at around 0.3 yuan/KWh. The comprehensive simulation design significantly affects carbon emissions, with the order of impact being Scenario 4 > Scenario 2 > Scenario 3 > Scenario 1 > Initial value. Significantly adjusting the carbon emission cap target can significantly reduce carbon emissions, and the combination of TGC quota ratio and carbon emission cap target has a better effect on reducing carbon emissions. The newly installed capacity of fossil fuel power generation is mainly affected by the carbon emission cap target. Therefore, the order of the impact of comprehensive simulation design on the new installed capacity of fossil fuel power generation is Scenario 4 > Scenario 2 > Scenario 3 > Scenario 1 > Initial value. The ranking of the impact of comprehensive simulation design on new installed capacity of renewable energy power generation is Scenario 4 > Scenario 3 > Scenario 2 > Scenario 1 > Initial value. Although the impact of Scenario 2 was higher than that of Scenario 3 in the early stage, with the continuous development of renewable energy generation, the impact of Scenario 3 in the later stage is very significant. The final results show that Scenarios 4 and 3 have a significant improvement effect on the new installed capacity of renewable energy power generation. In contrast, Scenarios 2 and 1 have a small effect on promoting the development of renewable energy generation.

5. Discussion

5.1. Results Analysis

5.1.1. The Result Analysis of TGC Price

The TGC price reflects the market demand for renewable energy generation, and its fluctuations are significantly correlated with the TGC quota ratio and carbon emission cap target. When the TGC quota ratio increases, the growth rate of TGC prices accelerates. This result conforms to the basic law of market supply and demand: in the context of increasing demand for renewable energy, increasing the TGC quota ratio means an increase in demand for green certificates in the market, thereby driving up TGC prices [46]. On the contrary, reducing the TGC quota ratio will lead to a slowdown or stabilization of TGC price growth. Therefore, when designing the TGC quota ratio, policymakers need to fully consider the actual demand and supply capacity of the electricity market for TGC and avoid excessively loose or tight TGC quota ratios that may cause instability in TGC price [47]. The instability of TGC prices will lead to increased uncertainty in investment in the renewable energy market. This will affect the construction progress of new projects and potentially weaken the profitability of renewable energy enterprises, thereby affecting the stability of the electricity market and the achievement of carbon reduction targets. The carbon emission cap target is another crucial factor affecting TGC price. When the carbon emission cap target decreases, the growth rate of TGC price accelerates. This indicates that the tightening of carbon emission cap targets has forced the power industry to reduce its carbon emissions or rely more on TGC to fulfill emission constraints, thereby increasing demand in the TGC market. With the relaxation of the carbon emission cap target, companies are more inclined to enter the CET market and reduce their purchases of TGC, resulting in a slow growth rate of TGC price [27]. The fluctuation of TGC prices is not only a reflection of supply and demand but also closely related to the carbon emission cap target. Therefore, in policy design, policymakers need to pay attention to the supply-demand matching and price dynamics of the TGC and CET markets and flexibly adjust the TGC quota ratio in combination with the carbon emission cap target to ensure the coordinated development of the TGC and CET markets.

5.1.2. The Result Analysis of CET Price

When CET prices are high, enterprises face more significant carbon cost pressure and may meet compliance requirements by developing renewable energy projects or relying more on TGC. However, when CET prices are low, it will slow down power enterprises’ investment in renewable energy projects. CET price is highly sensitive; significantly, when the carbon emission cap target is tightened, the growth rate of CET price substantially accelerates. Reducing the carbon emission cap target reduces the amount of carbon emissions that can be traded in the market, leading to increased CET prices. On the contrary, the relaxation of carbon emission cap targets leads to a slowdown or even a decrease in the growth rate of CET prices [48]. This indicates that the CET market responds quickly and firmly to carbon emission cap target changes. The TGC quota ratio has no significant direct impact on the change in CET price, reflecting the differences in policy transmission mechanisms between the TGC and CET markets. The TGC market relies more on the supply and demand of renewable energy, while the CET market is mainly regulated directly by the carbon emission cap target. Therefore, in policy design, it is necessary to promptly adjust the carbon emission cap target based on market reactions to maintain market stability and efficiency. It is essential to ensure that the frameworks of TGC policy and CET policy complement each other and do not interfere with each other.

5.1.3. The Result Analysis of Electricity Sale Price

In addition to the supply-demand relationship, the electricity sale price is directly affected by CET and TGC prices, and its changing trends deeply reflect the complexity of the electricity market. The impact of TGC price on electricity sale price is mainly reflected in the continuous expansion of the market share of new energy generation. With the growth of renewable energy installed capacity, the adjustment of the TGC quota ratio directly affects the TGC price, thereby changing the cost structure of power enterprises and further promoting fluctuations in electricity sale price. CET price has a more significant impact on electricity sale price. The research shows that with the tightening of the carbon emission cap target, the CET price rises, pushing the electricity sale price to increase first, then slowly fall, and finally stabilize at 0.5 yuan/KWh. As strict carbon cap targets push up CET prices, the cost of carbon compliance for power enterprises increases accordingly, which in turn increases the cost of electricity production. This cost pressure has limited further declines in electricity sale price during the study period, preventing them from reaching a very economical price. With the development of clean energy, electricity production costs are gradually decreasing, ultimately stabilizing electricity sales prices. However, due to the transmission mechanism of carbon trading prices and the upfront investment in power generation facilities, even if the cost of renewable energy generation technology decreases, the electricity sale price cannot reach a low level in the short term. When the carbon emission cap target increases, the electricity sale price continues to decline, attributed to the dual effect of relaxing carbon emission constraints. On the one hand, the pressure on power companies to reduce carbon dioxide decreases, and they are unwilling to invest in the construction of renewable energy generation equipment. On the other hand, by leveraging the marginal cost advantage of traditional power generation equipment, the short-term electricity production cost is effectively reduced [49]. The adjustment of carbon emission cap targets directly affects the cost structure of electricity production, affecting the electricity sales price. Therefore, when setting carbon emission cap targets, policymakers need to comprehensively consider the cost structure of the electricity market (such as the number of power generation equipment, investment costs for renewable energy generation capacity, and operating years of power generation equipment) and price fluctuations to ensure the feasibility of policies and market stability.

5.1.4. The Result Analysis of Carbon Emissions

Carbon emissions are directly affected by TGC price and CET price, reflecting the environmental benefits of energy production methods. With the increase in the TGC quota ratio, the price of TGC has risen. Driven by economic benefits, power enterprises have increased their investment and application in renewable energy generation projects, significantly reducing the carbon emissions generated by fossil fuel power generation [14,50]. When the TGC quota ratio increases by 30%, the reduction in carbon emissions becomes more pronounced. Significantly increasing the TGC quota ratio may face supply and demand pressures in the short term. However, in the long run, it can lay a solid foundation for achieving carbon reduction goals. CET price fluctuations have a more direct impact on carbon emissions. As a binding policy, when the carbon emission cap target is reduced by 30%, the CET price rapidly increases. Under immense economic pressure, enterprises are forced to take emission reduction measures, resulting in a significant decrease in carbon emissions in the electricity market [51]. On the contrary, when the carbon emission cap target is relaxed, the CET price remains stable, and power enterprises have no economic pressure to invest in renewable energy projects, leading to an increase in carbon emissions. Carbon emission cap targets affect the effectiveness of carbon reduction through carbon price signals [52]. Therefore, policy design should find a balance between the two, improving the economic and environmental benefits of the electricity market through economic regulation and market supervision.

5.1.5. The Result Analysis of New Installed Capacity of Fossil Fuel Power Generation

The change in new installed capacity of fossil fuel power generation is an important indicator reflecting the structure of electricity production. With the continuous promotion of renewable energy, the newly added installed capacity of fossil fuel power generation shows a trend of first increasing and then decreasing. The impact of the TGC quota ratio on the new installed capacity of fossil fuel power generation is relatively small. Although the increase in TGC quota ratio can promote the rapid development of renewable energy and reduce the demand for fossil fuels, the investment cost of fossil fuel power generation installation is relatively low, and the technological maturity is high, making its expansion more susceptible to market demand and other factors. Therefore, the increase in the TGC quota ratio did not significantly reduce the installed capacity of fossil fuel power generation. The impact of carbon emission cap targets on the new installed capacity of fossil fuel power generation is more significant. When the carbon emission cap target is tightened, the newly added installed capacity of fossil fuel power generation is significantly reduced, reflecting that the strictness of carbon emission control can effectively limit the further expansion of fossil energy applications [53]. The role of carbon emission cap targets in regulating the energy market structure is more direct and consequential. To further promote energy transition, policies can accelerate the withdrawal of fossil fuels by strengthening the strictness of carbon emission cap targets in the market’s absence of entirely popularized renewable energy.

5.1.6. The Result Analysis of New Installed Capacity of Renewable Energy Power Generation

The newly installed capacity of renewable energy generation is one of the essential indicators to measure the success of the electricity market transformation. With the increase of the TGC quota ratio and the tightening of the carbon emission cap target, the new installed capacity of renewable energy generation shows a significant growth trend [54]. The higher the TGC quota ratio, the faster the growth rate of installed capacity for renewable energy generation [2]. The TGC market has a strong incentive effect on renewable energy development, and a high TGC quota ratio encourages electricity companies to increase investment in renewable energy projects [50]. The increase in the TGC quota ratio directly promotes the rapid growth of renewable energy applications, creating favorable conditions for the sustainability of the electricity market. The tightening of the carbon emission cap target will promote an increase in the installed capacity of renewable energy generation, but the effect is not significant enough. Its impact on electricity production methods is more reflected in guiding enterprises to reduce carbon emissions. The TGC quota ratio, as a direct market incentive tool, can more efficiently promote the rapid development of renewable energy, while adjusting carbon emission cap targets is more suitable as a long-term guiding policy. Therefore, it is necessary to promote the growth of renewable energy generation capacity by increasing the TGC quota ratio, combining it with the appropriate reduction of carbon emission cap targets, and eliminating high carbon emission electricity production methods.

5.2. Policy Recommendations

5.2.1. TGC Policy Recommendations

Firstly, the TGC quota ratio should be increased to promote the application of renewable energy. To avoid excessive fluctuations in the electricity market, the TGC quota ratio should be increased gradually. It is recommended that the TGC quota ratio be steadily increased over the next five years, with an annual increase of 5–10%, to ensure the adaptability of the market and the planning stability of power companies. This gradual adjustment can prevent excessive TGC price fluctuations and help alleviate short-term cost pressures for power companies in the context of rapid market price changes, avoiding significant economic burdens due to high TGC prices. Then, the government needs to establish a market monitoring mechanism to evaluate the supply and demand situation of the TGC market regularly, significantly as the proportion of renewable energy applications gradually increases. If there is an oversupply in the TGC market or market prices experience severe fluctuations, timely adjustments to the TGC quota ratio should be considered to prevent the excess TGC quota ratio from affecting investments in renewable energy projects. Finally, it is necessary to enhance the flexibility of the TGC quota ratio. It is recommended that differentiated TGC quota ratios be adopted based on the economic development level, energy structure, and renewable energy resources of different regions. The TGC quota ratio can be appropriately increased in areas with abundant renewable energy resources. In contrast, in regions with relatively scarce resources, the TGC quota ratio growth rate can be slowed down. This can better motivate regions to actively develop green energy based on their resource endowments, actively avoiding unnecessary market imbalances caused by mandatory and unified quota ratios. This suggestion also applies to other countries and regions. In countries with abundant renewable energy resources, such as Australia, a higher proportion of TGC quota ratio can effectively promote renewable energy development. In countries with high dependence on fossil fuels, such as India, the TGC policy can serve as a transitional mechanism to encourage energy structure adjustment and reduce market shocks smoothly.

5.2.2. CET Policy Recommendations

Adjusting the carbon emission cap target will affect carbon emissions and price fluctuations in the electricity market. It is recommended that the carbon emission cap target be gradually tightened based on the price situation in the electricity market, combined with the progress of carbon reduction at each stage, green technology innovation, and the development of renewable energy industries. In the early stages, the carbon emission cap target should be set as a loose emission reduction target to maintain CET prices at a low level and alleviate the cost pressure of emission reduction for power companies. In the later stage, as the renewable energy market matures and TGC price, CET price, and electricity sale price remain stable and low, the carbon emission cap target can gradually become stricter, promoting deeper emission reduction levels. The strictness of carbon emission targets directly affects the power industry’s transformation speed, especially transitioning from fossil fuels to renewable energy. Therefore, while strengthening the carbon emission cap target, it is necessary to introduce supporting incentive policies, such as tax incentives, green credit support, etc., to help the traditional fossil energy industry gradually transition to low-carbon or zero-carbon emission green industries. This can ensure the effectiveness of the carbon emission cap target and reduce the economic pressure during the transformation process of the power industry. In addition, the government can adjust policies in a timely manner by regularly assessing the impact of the carbon emission cap target on TGC price, CET price, and electricity sale price, avoiding adverse fluctuations in electricity market prices caused by rapid policy adjustments.

5.2.3. Policy Synergy Recommendations

The combined effect of the TGC quota ratio and carbon emission cap target has a significant positive impact on the sustainable development of the electricity market. Based on the comprehensive simulation results, propose collaborative improvement suggestions for policies. Policymakers should prioritize adopting adaptive adjustment strategies at different stages of development. In the early stages of development, minor adjustments to the TGC quota ratio and carbon emission cap target (Scenario 1) can help steadily promote the transformation of the electricity market. In the accelerated emission reduction stage of the electricity market, the policy design of scenario 2 is most appropriate, as it continuously promotes efficient carbon reduction by significantly tightening the carbon emission cap target, which helps to address the urgent pressure of carbon reduction. Scenario 3 is applicable to the stage of promoting the development of renewable energy by adopting a higher TGC quota ratio to encourage power companies to invest in renewable energy and guide the electricity market to develop renewable energy vigorously. When renewable energy projects in the electricity market reach a particular scale, policies should adopt more aggressive measures (Scenario 4), both significantly increasing the TGC quota ratio and considerably reducing the carbon emission cap target, accelerating the long-term sustainable development of the electricity market through high-intensity dual policy pressure [49]. In addition, policy adjustments should focus on maximizing the synergy between the two. In various scenarios, adjusting the carbon emission cap target has a significant effect on reducing carbon emissions. In contrast, the TGC quota ratio has a more substantial impact on increasing the installed capacity of renewable energy generation. Therefore, policy design should ensure the linkage and synergy between the TGC quota ratio and the carbon emission cap target so that they work in the same direction and avoid policy conflicts or mutual inhibition. It should be noted that these policy adjustments may bring risks. Firstly, the rapid adjustment of the TGC quota ratio may lead to insufficient market supply, pushing up TGC prices and increasing the burden on power companies, especially small energy producers. The high compliance costs may weaken their market competitiveness. Secondly, strict carbon emission cap targets may lead to short-term fluctuations in electricity prices, affecting enterprises’ operating costs and profitability. The impact is significant, especially for energy-intensive enterprises and small and medium-sized enterprises, which may lead to asset depreciation and even layoffs. Therefore, policy design should also thoroughly consider its impact on the market, enterprises, and the overall economy. The government should establish an efficient cross-departmental policy coordination mechanism to ensure collaboration among multiple departments such as energy, environmental protection, finance, and technology; promote the effective implementation of TGC and CET policies; and reduce obstacles in the execution process. To ensure a smooth transition of the market after policy adjustments, it is necessary to establish a buffer period in the early stages of implementation and set up a “Green Development Fund” to support the transformation and upgrading of traditional power enterprises, steadily promoting the sustainable development of the power industry.

6. Conclusions

This study mainly addresses the knowledge gap in three steps and conducts an in-depth analysis of how TGC and CET affect the sustainable development of the electricity market. Firstly, by reviewing the application of TGC and CET in China, the complex interactive relationship between TGC and CET was specifically analyzed, and the impact mechanism between TGC, CET, and the electricity market was proposed. Secondly, based on the literature analysis, identify the key factors that affect the sustainable development of the electricity market through TGC and CET, establish a causal feedback loop and system flow diagram of the impact of TGC and CET on the sustainable development of the electricity market, and analyze how TGC and CET jointly affect carbon reduction behavior in the electricity market through price signals and policy incentives. On this basis, the relationship equations between variables in the system flow diagram will be established, and historical data from Liaoning Province will be used as an example to test the effectiveness of the SD model. Ensure that the simulation results can be used to predict the sustainable development level of the electricity market in Liaoning Province. Finally, Vensim PLE software 7.3.2 was used to explore the impact of different policy parameters on the sustainable development capacity of the electricity market and the decision-making of power enterprises in long-term dynamic processes.
The research results indicate that TGC and CET play key roles in the sustainable development of the electricity market in Liaoning Province. The increase in the TGC quota ratio promotes the rise in demand in the TGC market, which can effectively mobilize the green investment enthusiasm of power enterprises, promote technological progress and large-scale application in the field of renewable energy, and contribute to the development of renewable energy generation in the electricity market. The tightening of the carbon emission cap target has directly driven up the price of CET, forcing power companies to take more proactive emission reduction measures, thereby reducing the total amount of carbon emissions. The carbon emission cap target, as a binding policy, has a profound impact on market structure, and its strictness is crucial for promoting the transition of the power industry to clean energy. The synergistic incentive effect of the TGC quota ratio and carbon emission cap target has played a key role in promoting the sustainable development of the electricity market. However, in the process of policy implementation, if the adjustment range of both is too extensive or too sharp, it may lead to intensified market price fluctuations and affect market stability. Therefore, policy design should pay more attention to flexibility and gradualness, and appropriate policy combinations should be implemented at different stages of the development of the electricity market to ensure the smooth operation of the market while promoting green transformation.

6.1. Implications

TGC and CET play an essential role in promoting the sustainable development of the electricity market. An in-depth exploration of the optimal policy design for TGC and CET provides essential theoretical and practical references for policymakers and academia. Firstly, for policymakers, this study constructed a scientifically complete SD model to systematically analyze the dynamic impact of TGC and CET policy adjustments on the sustainable development of the electricity market. The research results reveal the mechanism of different policy combinations on the development of renewable energy, electricity sale price, carbon emissions reduction, etc., and propose the optimal policy combination strategy for TGC and CET through sensitivity analysis. The research conclusion can provide a scientific basis for the government to formulate TGC quota ratios and set carbon emission cap targets, ensuring that TGC and CET policies can promote renewable energy development while maintaining the electricity market’s stability. Secondly, for the academic community, this study systematically explores for the first time the interaction between TGC and CET policies and reveals the dynamic evolution mechanism of the sustainability of the electricity market over time. Compared with previous studies that mainly focused on single policies or static analysis, this study constructs a complete dynamic system of the impact of TGC and CET on the sustainable development of the electricity market by quantifying the functional relationship between influencing factors, providing a new perspective for the study of the synergistic effect of TGC and CET policies. In addition, the analytical framework of this study is based on an extensive literature review and has high universality and substantial promotional value. This model applies to provide theoretical references for other regions or countries that formulate TGC and CET policies. At the same time, it can also provide scientific tools for governments, research institutions, and enterprises to evaluate the impact of different policy options on the sustainable development of the electricity market. Therefore, this study deepens the understanding of the impact mechanism of TGC and CET policies and provides practical guidance and suggestions for policy optimization. Through SD model simulation, the theoretical and practical exploration of TGC and CET policy optimization has been promoted, providing new research ideas and policy inspirations for the sustainable development of the global electricity market.

6.2. Limitations and Further Directions

This study has two main limitations. (1) When constructing the SD model, some data were complex to collect, so system variables that were difficult to quantify, such as the CET volume and profit margin of buyers and sellers, were excluded. This may result in a slight deviation in the SD model’s simulation accuracy, but it does not affect the overall evolution trend of the system. In subsequent research, scientific and professional methods will be sought to quantify and incorporate these indicators into the system, making the study more comprehensive. (2) The next step will relax research hypotheses and analyze the impact of unexpected external factors (such as major technological breakthroughs, market shocks, and policy adjustments) on the system. By setting different technological development paths and market change scenarios to evaluate their impact on TGC and CET, we aim to enhance the explanatory power of research on complex real-world situations.

Author Contributions

Conceptualization, L.L. and K.S.; methodology, W.X.; software, C.G.; validation, L.L., K.S. and C.G.; formal analysis, X.J.; investigation, L.L.; resources, K.S.; data curation, L.L.; writing—original draft preparation, L.L. and W.X.; writing—review and editing, K.S.; supervision, X.J.; project administration, K.S.; funding acquisition, L.L. All authors have read and agreed to the published version of the manuscript.

Funding

This research was funded by State Grid Liaoning Electric Power Company Limited Economic Research Institute, grant number SGTYHT/23-JS-004.

Institutional Review Board Statement

Not applicable.

Informed Consent Statement

Not applicable.

Data Availability Statement

Data for this study are available upon request to the corresponding author.

Conflicts of Interest

Authors Kun Song, Weimao Xu, and Xue Jiang were employed by the company State Grid Liaoning Electric Power Company Limited Economic Research Institute. The remaining authors declare that the research was conducted in the absence of any commercial or financial relationships that could be construed as a potential conflict of interest.

Abbreviations

The following abbreviations are used in this manuscript:
TGCTradable green certificate
CETCarbon emission trading
SDSystem dynamics

References

  1. IEA CO2 Emissions in 2023. 2024. Available online: https://www.iea.org/reports/co2-emissions-in-2023 (accessed on 2 October 2024).
  2. Yu, X.Y.; Dong, Z.J.; Zhou, D.Q.; Sang, X.Z.; Chang, C.T.; Huang, X.H. Integration of tradable green certificates trading and carbon emissions trading: How will Chinese power industry do? J. Clean. Prod. 2021, 279, 123485. [Google Scholar] [CrossRef]
  3. Chen, C.; Zhu, Y.; Zeng, X.T.; Huang, G.H.; Li, Y.P. Analyzing the carbon mitigation potential of tradable green certificates based on a TGC-FFSRO model: A case study in the Beijing-Tianjin-Hebei region, China. Sci. Total Environ. 2018, 630, 469–486. [Google Scholar] [CrossRef] [PubMed]
  4. Hayek, F.A. The Use of Knowledge in Society. In Modern Understandings of Liberty and Property; Routledge: London, UK, 2013; pp. 27–38. [Google Scholar]
  5. Currier, K.M. Some Implications of Investment Cost Reduction Policies in Energy Markets Employing Green Certificate Systems. Environ. Resour. Econ. 2015, 60, 317–323. [Google Scholar] [CrossRef]
  6. Wang, L.; Li, K. Research on renewable energy consumption and emission reduction in power market based on bi-level decision making in China. Energy 2022, 260, 12. [Google Scholar] [CrossRef]
  7. Zhou, Y.; Jia, X.F.; Zhao, X.G.; Wang, H.; Huang, J.L. The impact of the heterogeneity of market participants on China’s green certificate trading: A collective action perspective. J. Environ. Manag. 2024, 370, 122878. [Google Scholar] [CrossRef]
  8. Zeng, L.J.; Wang, J.F.; Zhao, L.J. An inter-provincial tradable green certificate futures trading model under renewable portfolio standard policy. Energy 2022, 257, 124772. [Google Scholar] [CrossRef]
  9. Hustveit, M.; Frogner, J.S.; Fleten, S.E. Tradable green certificates for renewable support: The role of expectations and uncertainty. Energy 2017, 141, 1717–1727. [Google Scholar] [CrossRef]
  10. Bergek, A.; Jacobsson, S. Are tradable green certificates a cost-efficient policy driving technical change or a rent-generating machine? Lessons from Sweden 2003–2008. Energy Policy 2010, 38, 1255–1271. [Google Scholar] [CrossRef]
  11. Ghaffari, M.; Hafezalkotob, A. Evaluating different scenarios for Tradable Green Certificates by game theory approaches. J. Ind. Eng. Int. 2018, 15, 513–527. [Google Scholar]
  12. Wu, Y.X.; Sun, M. Multi-oligarch dynamic game model for regional power market with renewable portfolio standard policies. Appl. Math. Model. 2022, 107, 591–620. [Google Scholar] [CrossRef]
  13. Huang, Y.S.; Hu, J.J.; Yang, Y.Q.; Yang, L.; Liu, S.J. A Low-Carbon Generation Expansion Planning Model Considering Carbon Trading and Green Certificate Transaction Mechanisms. Pol. J. Environ. Stud. 2020, 29, 1169–1183. [Google Scholar] [CrossRef]
  14. Huang, G.R.; Chen, Z.; Shang, N.; Hu, X.Y.; Wang, C.; Wen, H.; Liu, Z.L. Do Tradable Green Certificates Promote Regional Carbon Emissions Reduction for Sustainable Development? Evidence from China. Sustainability 2024, 16, 7335. [Google Scholar] [CrossRef]
  15. Bjorn, A.; Lloyd, S.M.; Brander, M.; Matthews, H.D. Renewable energy certificates threaten the integrity of corporate science-based targets. Nat. Clim. Change 2022, 12, 539–546. [Google Scholar] [CrossRef]
  16. Brander, M.; Gillenwater, M.; Ascui, F. Creative accounting: A critical perspective on the market-based method for reporting purchased electricity (scope 2) emissions. Energy Policy 2018, 112, 29–33. [Google Scholar] [CrossRef]
  17. Li, L.; Dong, J.; Song, Y. Impact and Acting Path of Carbon Emission Trading on Carbon Emission Intensity of Construction Land: Evidence from Pilot Areas in China. Sustainability 2020, 12, 7843. [Google Scholar] [CrossRef]
  18. Guo, X.P.; Zhang, X.Y.; Zhang, X.P. Incentive-oriented power-carbon emissions trading-tradable green certificate integrated market mechanisms using multi-agent deep reinforcement learning. Appl. Energy 2024, 357, 122458. [Google Scholar] [CrossRef]
  19. Kosnik, L.R. Cap-and-trade versus carbon taxes: Which market mechanism gets the most attention? Clim. Change 2018, 151, 605–618. [Google Scholar] [CrossRef]
  20. Zakeri, A.; Dehghanian, F.; Fahimnia, B.; Sarkis, J. Carbon pricing versus emissions trading: A supply chain planning perspective. Int. J. Prod. Econ. 2015, 164, 197–205. [Google Scholar] [CrossRef]
  21. Weng, Q.Q.; Xu, H. A review of China’s carbon trading market. Renew. Sustain. Energy Rev. 2018, 91, 613–619. [Google Scholar] [CrossRef]
  22. Feng, T.T.; Yang, Y.S.; Yang, Y.H. What will happen to the power supply structure and CO2 emissions reduction when TGC meets CET in the electricity market in China? Renew. Sustain. Energy Rev. 2018, 92, 121–132. [Google Scholar] [CrossRef]
  23. Zhang, J.; Wang, Z.; Tang, L.; Yu, L. The simulation of carbon emission trading system in Beijing-Tianjin-Hebei region: An analysis based on system dynamics. Chin. J. Manag. Sci. 2016, 24, 1–8. [Google Scholar]
  24. Zhao, X.X.; Zhang, Y.Z.; Liang, J.; Li, Y.B.; Jia, R.D.; Wang, L. The Sustainable Development of the Economic-Energy-Environment (3E) System under the Carbon Trading (CT) Mechanism: A Chinese Case. Sustainability 2018, 10, 98. [Google Scholar] [CrossRef]
  25. Shi, J.; Cai, H.; Tang, L.; Yu, L. Impacts of carbon emission trading on China: Based on CGE model. Chin. J. Manag. Sci. 2015, 11, 801–806. [Google Scholar]
  26. Känzig, D.R. The Unequal Economic Consequences of Carbon Pricing; National Bureau of Economic Research: Cambridge, MA, USA, 2023. [Google Scholar]
  27. Chang, X.; Wu, Z.Y.; Wang, J.T.; Zhang, X.Y.; Zhou, M.; Yu, T.; Wang, Y.Y. The coupling effect of carbon emission trading and tradable green certificates under electricity marketization in China. Renew. Sustain. Energy Rev. 2023, 187, 113750. [Google Scholar] [CrossRef]
  28. Maldet, M.; Revheim, F.H.; Schwabeneder, D.; Lettner, G.; del Granado, P.C.; Saif, A.; Loeschenbrand, M.; Khadem, S. Trends in local electricity market design: Regulatory barriers and the role of tariffs. J. Clean. Prod. 2022, 358, 131805. [Google Scholar] [CrossRef]
  29. Feng, T.T.; Li, R.; Zhang, H.M.; Gong, X.L.; Yang, Y.S. Induction mechanism and optimization of tradable green certificates and carbon emission trading acting on electricity market in China. Resour. Conserv. Recycl. 2021, 169, 105487. [Google Scholar] [CrossRef]
  30. Guo, Z.X.; Shen, J.R.; Li, L.H. Identifying the implementation effect of technology transfer policy using system dynamics: A case study in Liaoning, China. J. Technol. Transf. 2024, 49, 660–688. [Google Scholar] [CrossRef]
  31. Zhang, X.Y.; Guo, X.P.; Zhang, X.P. Mutual conversion mechanisms for environmental interest products to jointly enhance synergistic effect between power, CET and TGC markets in China. Energy Econ. 2024, 131, 107311. [Google Scholar] [CrossRef]
  32. Liu, D.; Jiang, Y.; Peng, C.; Jian, J.H.; Zheng, J. Can green certificates substitute for renewable electricity subsidies? A Chinese experience. Renew. Energy 2024, 222, 119861. [Google Scholar] [CrossRef]
  33. He, Q.S.; Wang, J.S.; Shi, R.J.; He, Y.F.; Wu, M.Q. Enhancing renewable energy certificate transactions through reinforcement learning and smart contracts integration. Sci. Rep. 2024, 14, 10838, Erratum in Sci. Rep. 2025, 15, 5376. [Google Scholar] [CrossRef]
  34. Zhang, X.Y.; Guo, X.P.; Zhang, X.P. Assessing the policy synergy among power, carbon emissions trading and tradable green certificate market mechanisms on strategic GENCOs in China. Energy 2023, 278, 127833. [Google Scholar] [CrossRef]
  35. Chu, J.F.; Shao, C.F.; Emrouznejad, A.; Wu, J.; Yuan, Z. Performance evaluation of organizations considering economic incentives for emission reduction: A carbon emission permit trading approach. Energy Econ. 2021, 101, 105398. [Google Scholar] [CrossRef]
  36. Ciarreta, A.; Espinosa, M.P.; Pizarro-Irizar, C. Optimal regulation of renewable energy: A comparison of Feed-in Tariffs and Tradable Green Certificates in the Spanish electricity system. Energy Econ. 2017, 67, 387–399. [Google Scholar] [CrossRef]
  37. Yan, S.Z.; Wang, W.Q.; Li, X.Z.; Lv, H.P.; Fan, T.Y.; Aikepaer, S. Stochastic optimal scheduling strategy of cross-regional carbon emissions trading and green certificate trading market based on Stackelberg game. Renew. Energy 2023, 219, 119268. [Google Scholar] [CrossRef]
  38. Yu, X.Y.; Ge, S.X.; Zhou, D.Q.; Wang, Q.W.; Chang, C.T.; Sang, X.Z. Whether feed-in tariff can be effectively replaced or not? An integrated analysis of renewable portfolio standards and green certificate trading. Energy 2022, 245, 123241. [Google Scholar] [CrossRef]
  39. Tamás, M.M.; Shrestha, S.O.B.; Zhou, H.Z. Feed-in tariff and tradable green certificate in oligopoly. Energy Policy 2010, 38, 4040–4047. [Google Scholar] [CrossRef]
  40. Andersson, J.J. Carbon Taxes and CO2 Emissions: Sweden as a Case Study. Am. Econ. J.-Econ. Policy 2019, 11, 1–30. [Google Scholar] [CrossRef]
  41. Best, R.; Burke, P.J.; Jotzo, F. Carbon Pricing Efficacy: Cross-Country Evidence. Environ. Resour. Econ. 2020, 77, 69–94. [Google Scholar] [CrossRef]
  42. Ohlendorf, N.; Flachsland, C.; Nemet, G.F.; Steckel, J.C. Carbon price floors and low-carbon investment: A survey of German firms. Energy Policy 2022, 169, 113187. [Google Scholar] [CrossRef]
  43. Ma, W.T.; Yuan, H.P.; Hao, J.L. A bibliometric visual analysis of the system dynamics approach for construction and demolition waste management. Clean. Waste Syst. 2022, 1, 10. [Google Scholar] [CrossRef]
  44. Li, L.H.; Shi, J.; Liu, H.; Zhang, R.Y.; Guo, C.B. Simulation of Carbon Emission Reduction in Power Construction Projects Using System Dynamics: A Chinese Empirical Study. Buildings 2023, 13, 3117. [Google Scholar] [CrossRef]
  45. Aumann, C.A. A methodology for developing simulation models of complex systems. Ecol. Model. 2007, 202, 385–396. [Google Scholar] [CrossRef]
  46. Wen, J.X.; Jia, R.; Gao, X.; Cao, G.; Dang, J.; Li, W.; Li, P.H. Competitive Equilibrium Analysis of Power Generation Transaction Subjects Considering Tradable Green Certificates. Processes 2023, 11, 3008. [Google Scholar] [CrossRef]
  47. Teng, M.M.; Lv, K.F.; Han, C.F.; Liu, P.H. A tripartite stochastic evolutionary game for trading strategies under renewable portfolio standards in China’s electric power industry. Renew. Energy 2025, 240, 122193. [Google Scholar] [CrossRef]
  48. Shi, B.B.; Li, N.; Gao, Q.; Li, G.Q. Market incentives, carbon quota allocation and carbon emission reduction: Evidence from China’s carbon trading pilot policy. J. Environ. Manag. 2022, 319, 115650. [Google Scholar] [CrossRef] [PubMed]
  49. Ma, T.N.; Peng, L.L.; Wu, G.; Wei, Y.C.; Zou, X. Research on Multi-Scale Electricity-Carbon-Green Certificate Market Coupling Trading Based on System Dynamics. Processes 2025, 13, 109. [Google Scholar] [CrossRef]
  50. Zhang, Y.N.; Wu, G.Q.; Zhang, B. Costs and CO2 emissions of technological transformation in China’s power industry: The impact of market regulation and assistive technologies. Struct. Change Econ. Dyn. 2025, 73, 211–222. [Google Scholar] [CrossRef]
  51. Yang, J.; Liu, C.L.; Liu, X. Do carbon emissions trading pilots effectively reduce CO2 emissions? County-level evidence from eastern China. Int. J. Technol. Manag. 2024, 95, 156–172. [Google Scholar] [CrossRef]
  52. Song, X.H.; Wang, P. Effectiveness of carbon emissions trading and renewable energy portfolio standards in the Chinese provincial and coupled electricity markets. Util. Policy 2023, 84, 101622. [Google Scholar] [CrossRef]
  53. Zhao, X.G.; Hu, S.R.; Wang, H.; Chen, H.W.; Zhang, W.B.; Lu, W.J. Energy, economic, and environmental impacts of electricity market-oriented reform and the carbon emissions trading: A recursive dynamic CGE model in China. Energy 2024, 298, 131416. [Google Scholar] [CrossRef]
  54. Teng, M.M.; Lv, K.F.; Han, C.F.; Liu, P.H. Trading behavior strategy of power plants and the grid under renewable portfolio standards in China: A tripartite evolutionary game analysis. Energy 2023, 284, 128398. [Google Scholar] [CrossRef]
Figure 1. Interaction between TGC and CET.
Applsci 15 04086 g001
Figure 2. Research flowchart.
Applsci 15 04086 g002
Figure 3. The framework for establishing and applying SD models.
Applsci 15 04086 g003
Figure 4. A causal feedback loop of TGC and CET on the sustainable development of the electricity market.
Applsci 15 04086 g004
Figure 5. System flow of TGC and CET on the sustainable development of the electricity market.
Applsci 15 04086 g005
Figure 6. Initial simulation result analysis diagrams. (a) TGC price, (b) CET price, (c) Electricity sale price, (d) Carbon emissions, (e) New installed capacity of fossil fuel power generation, (f) New installed capacity of renewable energy power generation.
Applsci 15 04086 g006aApplsci 15 04086 g006b
Figure 7. Sensitivity simulation results analysis diagrams. (a) Simulation results of TGC price under the influence of TGC quota ratio, (b) Simulation results of TGC price under the influence of carbon emission cap target, (c) Simulation results of CET price under the influence of TGC quota ratio, (d) Simulation results of CET price under the influence of carbon emission cap target, (e) Simulation results of electricity sale price under the influence of TGC quota ratio, (f) Simulation results of electricity sale price under the influence of carbon emission cap target, (g) Simulation results of carbon emissions under the influence of TGC quota ratio, (h) Simulation results of carbon emissions under the influence of carbon emission cap target, (i) Simulation results of new installed capacity of fossil fuel power generation under the influence of TGC quota ratio, (j) Simulation results of new installed capacity of fossil fuel power generation under the influence of carbon emission cap target, (k) Simulation results of new installed capacity of renewable energy power generation under the influence of TGC quota ratio, (l) Simulation results of new installed capacity of renewable energy power generation under the influence of carbon emission cap target.
Applsci 15 04086 g007aApplsci 15 04086 g007b
Figure 8. Policy comprehensive simulation results analysis diagrams. (a) Simulation results of TGC price, (b) Simulation results of CET price, (c) Simulation results of electricity sale price, (d) Simulation results of carbon emissions, (e) Simulation results of new installed capacity of fossil fuel power generation, (f) Simulation results of new installed capacity of renewable energy power generation.
Applsci 15 04086 g008
Table 1. Variable settings and their functional equations.
CategoryNumberVariablesInitial Value and Function RelationUnit
State variable1Installed capacity of fossil fuel power generationINTEG (New installed capacity of fossil fuel power generation − Depreciation of fossil fuel power generation equipment, Original value)108 KW
2Installed capacity of renewable energy power generationINTEG (New installed capacity of renewable energy power generation − Depreciation of renewable energy power generation equipment, Original value)108 KW
3CET reference priceINTEG (CET price adjustment, Original value)yuan/kg
4TGC reference priceINTEG (TGC price adjustment, Original value)yuan/piece
Rate variable5New installed capacity of fossil fuel power generation((Incremental demand for electricity/The utilization time of fossil fuel power generation equipment) × (1 − Investment allocation ratio)) × (Income from fossil fuel power generation/(Income from fossil fuel power generation + The cost of carbon emissions)) × 0.15 × (“Long—run marginal cost of fossil energy generation”)108 KW
6Depreciation of fossil fuel power generation equipmentInstalled capacity of fossil fuel power generation/Life cycle of fossil fuel power generation equipment108 KW
7New installed capacity of renewable energy power generation((Incremental demand for electricity/The utilization time of renewable energy power generation equipment) × Investment allocation ratio) × ((Income from renewable energy power generation + TGC income + Renewable energy power generation × Policy incentive intensity)/Income from renewable energy power generation) × 0.1 × (“Long—run marginal cost of renewable energy power generation”)108 KW
8Depreciation of renewable energy power generation equipmentInstalled capacity of renewable energy power generation/Life cycle of renewable energy power generation equipment108 KW
9CET price adjustmentCET price × ((CET consumption − CET supply)/CET consumption) × 0.3yuan/kg
10TGC price adjustmentTGC price × ((TGC demand)/TGC supply) × 0.06yuan/piece
Auxiliary variable11Life cycle of fossil fuel power generation equipment240Month
12Life cycle of renewable energy power generation equipment300Month
13Long—run marginal cost of fossil energy generation0.32yuan/KWh
14Long—run marginal cost of renewable energy power generation0.40yuan/KWh
15Policy incentive intensity0.02yuan/KWh
16Investment allocation ratio(100 × TGC income + the cost of carbon emissions)/(1 + 100 × TGC income + the cost of carbon emissions) × ((1 × EXP (0.01 × Time))/(1 + 1 × EXP (0.01 × Time))) × ((EXP (Time × 0.1) − 0.9)/(EXP (Time × 0.1) + 0.9)) + 0.2%
17The utilization time of fossil fuel power generation equipment350Hour
18Fossil fuel power generationThe utilization time of fossil fuel power generation equipment × installed capacity of fossil fuel power generation108 KWh
19Carbon emissions per unit of electricity production from fossil fuels9Ton/104 KWh
20Carbon emissionsCarbon emissions per unit of electricity production from fossil fuels × Fossil fuel power generation104 ton
21The cost of carbon emissionsMAX (CET demand × CET price × 0.1, 0)108 yuan
22CET consumptionCarbon emissions104 ton
23CET demandCET consumption − CET supply104 ton
24CET supplyMarket allocation coefficient × Carbon emission cap target × Carbon emissions104 ton
25Carbon emission cap target0.75Unitless
26Market allocation coefficient0.95 + (0.05 × (1 − EXP (−0.01 × Time)))Unitless
27CET price cap0.2yuan/kg
28CET price floor0.01yuan/kg
29CET priceMIN (MAX (CET price floor, CET reference price), CET price cap)yuan/kg
30Income from fossil fuel power generationFossil fuel power generation × Electricity sale price108 yuan
31Electricity price cap0.6yuan/KWh
32Electricity price floor0.4yuan/KWh
33Electricity reference priceelectricity demand/Electricity supply × 0.5yuan/KWh
34Electricity priceMIN (MAX (Electricity price floor, Electricity reference price), Electricity price cap)yuan/KWh
35Electricity demand growth rate1%
36Initial demand for electricity221.60108 KWh
37Incremental demand for electricityInitial demand for electricity × (1 + electricity demand growth rate) ^ Time − Initial demand for electricity108 KWh
38Electricity demandIncremental demand for electricity + Initial demand for electricity108 KWh
39Electricity supplyFossil fuel power generation + renewable energy power generation108 KWh
40Electricity sale priceElectricity price + TGC price/1000 − CET price × (Carbon emissions per unit of electricity production from fossil fuels/10)yuan/KWh
41The utilization time of renewable energy power generation equipment300Hour
42Renewable energy power production technology levelMIN (SMOOTH (1 − “Technology—level growth rate” ^ Time, 120), 1)unitless
43Renewable energy power generationThe utilization time of renewable energy power generation equipment × installed capacity of renewable energy power generation + installed capacity of renewable energy power generation × renewable energy power production technology level108 KWh
44Income from renewable energy power generationElectricity sale price × Renewable energy power generation108 yuan
45Technology—level growth rate“R&D investment” × Investment efficiency%
46R&D investment862108 yuan
47Investment efficiency1%
48TGC quota ratio30%
49TGC demandTGC quota ratio × investment allocation ratio × electricity demand × 10/1000A piece of certificate
50TGC price cap100yuan/piece
51TGC price floor30yuan/piece
52TGC priceMIN (MAX (TGC price floor, TGC reference price), TGC price cap)yuan/piece
53TGC supplyRenewable energy power generation × TGC supply factor × 10Piece
54TGC supply factor0.001unitless
55TGC incomeTGC price × TGC supply/10,000108 yuan
56TimeThe simulation time ranges from 1 to 120Month
Note: The symbol “^” is used in mathematics to represent the power operation and is usually used when the upper Angle notation cannot be used to represent the power.
Table 2. Comparison of simulated values with actual values.
YearSimulation Value (108 KWh)Actual Value (108 KWh)Error (%)
20202691.72520.16.38%
20212745.82673.72.63%
20222726.12659.22.45%
Table 3. Confidence intervals for the key price indicators.
VariablesChange StageTimeSample SizeMean ValueStandard DeviationConfidence Interval (95%)
TGC priceStationary phase0–4445300[30, 30]
Fluctuating stage45–854167.3412.58[64.81, 70.87]
Stationary phase86–120351000[100, 100]
CET priceStationary phase0–24250.010[0.01, 0.01]
Fluctuating stage25–105810.0650.005[0.054, 0.076]
Stationary phase106–120150.20[0.2, 0.2]
Electricity sale priceFluctuating stage0–1051060.5550.034[0.548, 0.562]
Stationary phase106–120150.320[0.32, 0.32]
Table 4. The setting of a comprehensive simulation scheme.
ScenarioScenario 1Scenario 2Scenario 3Scenario 4
TGC quota ratio+10%+10%+30%+30%
Carbon emission cap target−10%−30%−10%−30%
Disclaimer/Publisher’s Note: The statements, opinions and data contained in all publications are solely those of the individual author(s) and contributor(s) and not of MDPI and/or the editor(s). MDPI and/or the editor(s) disclaim responsibility for any injury to people or property resulting from any ideas, methods, instructions or products referred to in the content.