1. Research Background and Significance
According to the Annual Report on Cardiovascular Health and Disease in China (2021), the number of people suffering from cardiovascular disease in China is currently about 330 million, accounting for 45% of all deaths from diseases in the year; thus, cardiovascular disease has become a major public health problem. The initial symptom of cardiovascular disease is atherosclerosis, which is located at the site of narrowing or bifurcation of blood vessels. Hemodynamic studies based on blood fluid characteristics have become an important research direction in the field of atherosclerosis research. However, the non-Newtonian fluid properties of blood and the elastic deformation characteristics of vessel walls make blood flow properties difficult to experimentally determine in the laboratory. With the development of computer science and the advancement of medical image processing technology, computational fluid dynamics (CFD) simulation has gradually developed into an important research method for hemodynamics.
The method of mathematical modeling and numerical simulation is an important supplement to the development of medical science. This approach can yield many results that are difficult to obtain clinically. Many clinical trials cannot be conducted due to the limitations of experimental conditions and patients’ personal wishes, which result in a lack of data support in the treatment process. The numerical simulation method can obtain the blood flow characteristic data quickly and predict the lesion location accurately. This is of great significance for the early prevention of disease. This work is interdisciplinary and involves the fields of mathematics, biomedical engineering, and clinical medicine. This paper focuses on the study of atherosclerosis, and the research method can be extended to the prevention and diagnosis of cardiovascular disease, cerebrovascular disease, and other vascular diseases.
Gijsen et al. [
1] built a 3D model of the vascular bifurcation site by multiple modeling approaches, which were then simulated numerically. The numerical calculation results of the 3D model based on multilayer spiral angiography were highly accurate and saved computing resources. Deplan and Siouffi [
2] verified the validity of both methods by performing experimental and numerical simulations of different shapes of pulsatile flow in a stenotic vessel model to determine the time evolution of wall shear stress downstream from the stenosis and also proposed a polynomial method based on experimental velocity values to determine the time evolution of wall shear stress. Back et al. [
3] derived numerical solutions for fluid transport properties in narrow arteries under rigid vessel walls, assuming that the blood is a Newtonian fluid. Nematollahi et al. [
4] proposed an optimization algorithm for the surface mesh of the model to make the optimized surface mesh more suitable for later numerical calculations after modeling the medical imaging data of 3D bifurcated vessels. By creating a three-dimensional model for a multilevel dendritic-bifurcated coronary artery system and performing numerical simulations, Mpairaktaris et al. [
5] found that blood reflux at the site of arterial bifurcation leads to arterial lesions. By studying the angular geometry of bifurcated vessels, Fazli et al. [
6] found that the fluid properties of blood are determined by the morphology of bifurcated vessels. Liu and Qiao [
7] performed hemodynamic numerical simulations for site-specific vascular structures; studied blood flow by linking the ascending aorta, aortic arch, and descending aorta; and reflected the actual flow of blood in curved arteries more objectively. Ma et al. [
8] established a geometric model of bifurcated arterial vessels and performed a numerical analysis of intravascular flow field to obtain the relationships among the optimal thrombus-forming location with branch vessel diameter, blood flow velocity, and bifurcation angle. Jiang et al. [
9] developed a human arterial vascular network model by controlling equations of viscous fluid dynamics, calculated the individualized parameters of the arterial vascular network model of the subject from the measured blood pressure waveforms at the beginning and end of the radial artery, and derived the ascending aorta–radial artery transfer function. This method provided a new method for pressure measurement.
In conclusion, numerical simulation of intravascular blood flow characteristics based on CFD can directly reflect special flow states, such as vortex and secondary flow, in the vicinity of lesion tissues [
10,
11,
12,
13]. It can rapidly obtain physical characteristics, such as flow velocity, pressure, and shear stress of blood flow [
14,
15,
16]. It can quantitatively describe the relationship between vascular lesions and blood fluid characteristics, which has great practical importance for the screening, diagnosis, and prevention of vascular diseases [
17,
18,
19,
20,
21]. Current research on hemodynamics has made some achievements, but many research results are not the same, with some even showing large differences [
22,
23,
24,
25,
26,
27,
28]. In this paper, mathematical models of single and bifurcated vessels under atheromatous lesion conditions are established, and the vessels are geometrically reconstructed with the use of CT imaging data. Considering the elasticity of blood vessels, the physical properties of blood, and the interaction between the two, a numerical simulation method of fluid–structure interactions is adopted to investigate the effects of vessel structure on blood flow characteristics and the effects of the fluid properties of blood on arterial lesions. A comparative study is performed to explore the mechanism of action between blood flow characteristics and structural changes in blood vessels in the lesion. The vascular stenosis and bifurcation sites prone to lesions are numerically simulated. By studying the changes in blood pressure and shear stress, the relationship between lesions and blood flow characteristics is analyzed. The results of numerical simulation are compared with actual cases to verify the correctness of the mathematical model and boundary conditions. Next, the same method is used to model a three-dimensional reconstruction of the vascular images of healthy people. By analyzing blood flow characteristics, doctors can predict whether a person will develop atherosclerosis. A comprehensive analysis of related similar studies is carried out. The combination of medical imaging and computer numerical simulation can provide a new diagnostic method based on hemodynamics and clinical trials, which can be used to develop hemodynamic detectors for atherosclerosis.
2. Mathematical Modeling
2.1. Three-Dimensional Reconstruction of Medical Images
In this paper, medical image reconstruction technology was adopted to obtain real blood vessel models. Blood flow conditions in real blood vessels were simulated and restored and the pathogenesis of blood vessels prone to atherosclerosis was analyzed by taking the intravascular blood pressure and blood flow obtained by phase contrast magnetic resonance imaging (PC-MRI) as the boundary conditions.
The 3D reconstruction process of the mathematical model was performed as follows. The 2D-image DICOM file of CT tomography was imported into the image processing software Mimics Medical (Version No. 20.0). According to differences in the grayscale thresholds of different tissues, the target vessels were filtered and isolated using threshold segmentation and regional growth functions to obtain the 3D model. Then, the reconstructed model was imported into the 3D forward engineering software, 3-Matic, for smoothing and optimization of the inlet and outlet cross-sections to obtain a computational model of the fluid domain (blood). The fluid domain model was imported into the Geometry module of ANSYS software (Version No. 19.0) for constructing the vessel wall. A complete vessel model was then obtained. Finally, the vascular model was imported into the CFD software (ANSYS 19.0) for fluid–structure interaction calculation, and the calculated results were analyzed for hemodynamics, as shown in
Figure 1a.
The cases were selected by intercepting a carotid artery with a length of 40 mm and a normal portion with a diameter of approximately 5 mm at one of the most atherosclerotic sites, which were reconstructed in three dimensions. The vessel stenosis rate of the narrowest part in the continuous flatten atheromatous plaque of the lesioned vessels was 40%, and the vessel stenosis rate of the narrowest part in the protruding atheromatous plaque of the lesioned vessels was 70%, as shown in
Figure 1b.
2.2. Three-Dimensional Fluid–Structure Interactions
The blood vessel wall has elastic deformation in the process of blood flow, so it is more accurate to simulate the hemodynamic characteristics in the artery with elastic model. The arbitrary Lagrange–Euler method adopted in this paper overcomes the shortcomings of the single Lagrangian or single Euler method in solving the problem, and is an effective method to realize the coupling calculation of the blood fluid phase and solid wall phase in a moving grid.
Blood flow in the human vasculature is a classic flow–structure interaction problem. Along with heart beats, blood interacts with blood vessel walls at the junction. Therefore, compatible coordination relationships need to be satisfied in the respective control equations for fluids and solids.
The blood flow inside blood vessels follows the law of conservation of momentum and conservation of mass. Before the numerical simulation of the blood flow problem, a reasonable flow model based on mathematical expressions should be established to describe the movement of blood. The basic equations of liquid–solid two-phase flow are established by averaging the conservation equations of each phase.
The mass conservation equation of liquid phase and solid phase is:
For the liquid phase, the mass conservation equation of the liquid phase is:
For the solid phase, the mass conservation equation of solid phase is:
where
is the liquid phase volume fraction,
is the solid phase volume fraction,
is the liquid density,
is the solid density,
is the liquid velocity vector, and
is the solid velocity vector.
The motion of the fluid phase can be described by the continuity equation and N-S equation as follows:
For the liquid phase, the momentum conservation equation of the liquid phase is:
For the solid phase, the momentum conservation equation of solid phase is:
where
is the blood pressure,
ρ is the blood density,
is the kinematic viscosity,
is the force of solid phase to liquid phase, and
is the force of liquid phase to solid phase.
The arterial vascular wall is composed of three layers, namely, the inner, middle, and outer membranes, which are featured by a complex structure and nonlinear elasticity. The nonuniformity and anisotropy of the tube wall created difficulties for the study. In previous studies, the vast majority of scholars regarded the vessel wall as a uniformly isotropic linear elastomer. The results have shown that this assumption is reliable in a small deformation range. Therefore, in this paper, the vessel wall was assumed to be an isotropic elastic material, and its law of motion can be described by the momentum equation:
where
ρs is the density of the vessel wall,
xs is the displacement of the vessel wall,
is the dynamic viscosity,
fs is the volume force of the vessel wall, and
σs is the Cauchy stress tensor of the vessel wall, which was calculated as follows:
λs and
μs are Lamé parameters and can be calculated from Young’s modulus
E and Poisson’s ratio
υs of the vessel wall, as follows:
2.3. Discrete Method of Governing Equations
There is elastic deformation in the blood vessel wall during blood flow, so using an elastic model to simulate the hemodynamic characteristics in the artery can more closely replicate the actual data. In the arbitrary Lagrange–Euler method, the computational grid can move in any form in space, that is, it can move independently of the physical and spatial coordinate systems. In this way, the moving interface of the object can be accurately described and the reasonable shape of the element can be maintained by specifying the appropriate mesh-motion form. The arbitrary Lagrange–Euler method adopted here overcomes the shortcomings of the single Lagrangian or single Euler method in solving the problem, and is an effective method to realize the coupling calculation of the blood fluid phase and solid wall phase in a moving grid.
The equation of motion of a viscous incompressible fluid is written as follows:
The standard index notation is used here, where the subscript represents the tensor or vector component, the nonrepeating subscript of the same physical quantity represents the partial derivative, and the repeating subscript represents the sum: i, j = 1, 2, 3. For example, , j = 1, 2, 3 represents the velocity of the fluid in different directions and , j = 1, 2, 3 represents the velocity of the moving area in different directions.
Using the discrete scheme of forward difference for the time term in Equation (10), it can be obtained:
The Poisson equation of pressure can be obtained by taking the divergence of both sides of the equation and introducing the continuity equation:
According to the obtained pressure field, the velocity field distribution can be obtained by substitution:
The crucial feature in fluid–structure coupling between the blood and the blood vessel wall is to realize data transfer at the coupling interface, which requires the following conditions to be met between the corresponding particles of blood and the blood vessel wall at the boundary of the coupling domain.
The velocity continuity condition is satisfied: ; the condition of force continuity is satisfied: ; and the displacement continuity condition is satisfied: .
2.4. Mathematical Calculation and Setting the Boundary Conditions
In this paper, the numerical simulation of a single healthy blood vessel, a single diseased blood vessel, and a diseased bifurcated blood vessel based on geometric reconstruction of CT image are carried out. The setting of boundary conditions is explained as follows by selecting a single blood vessel model.
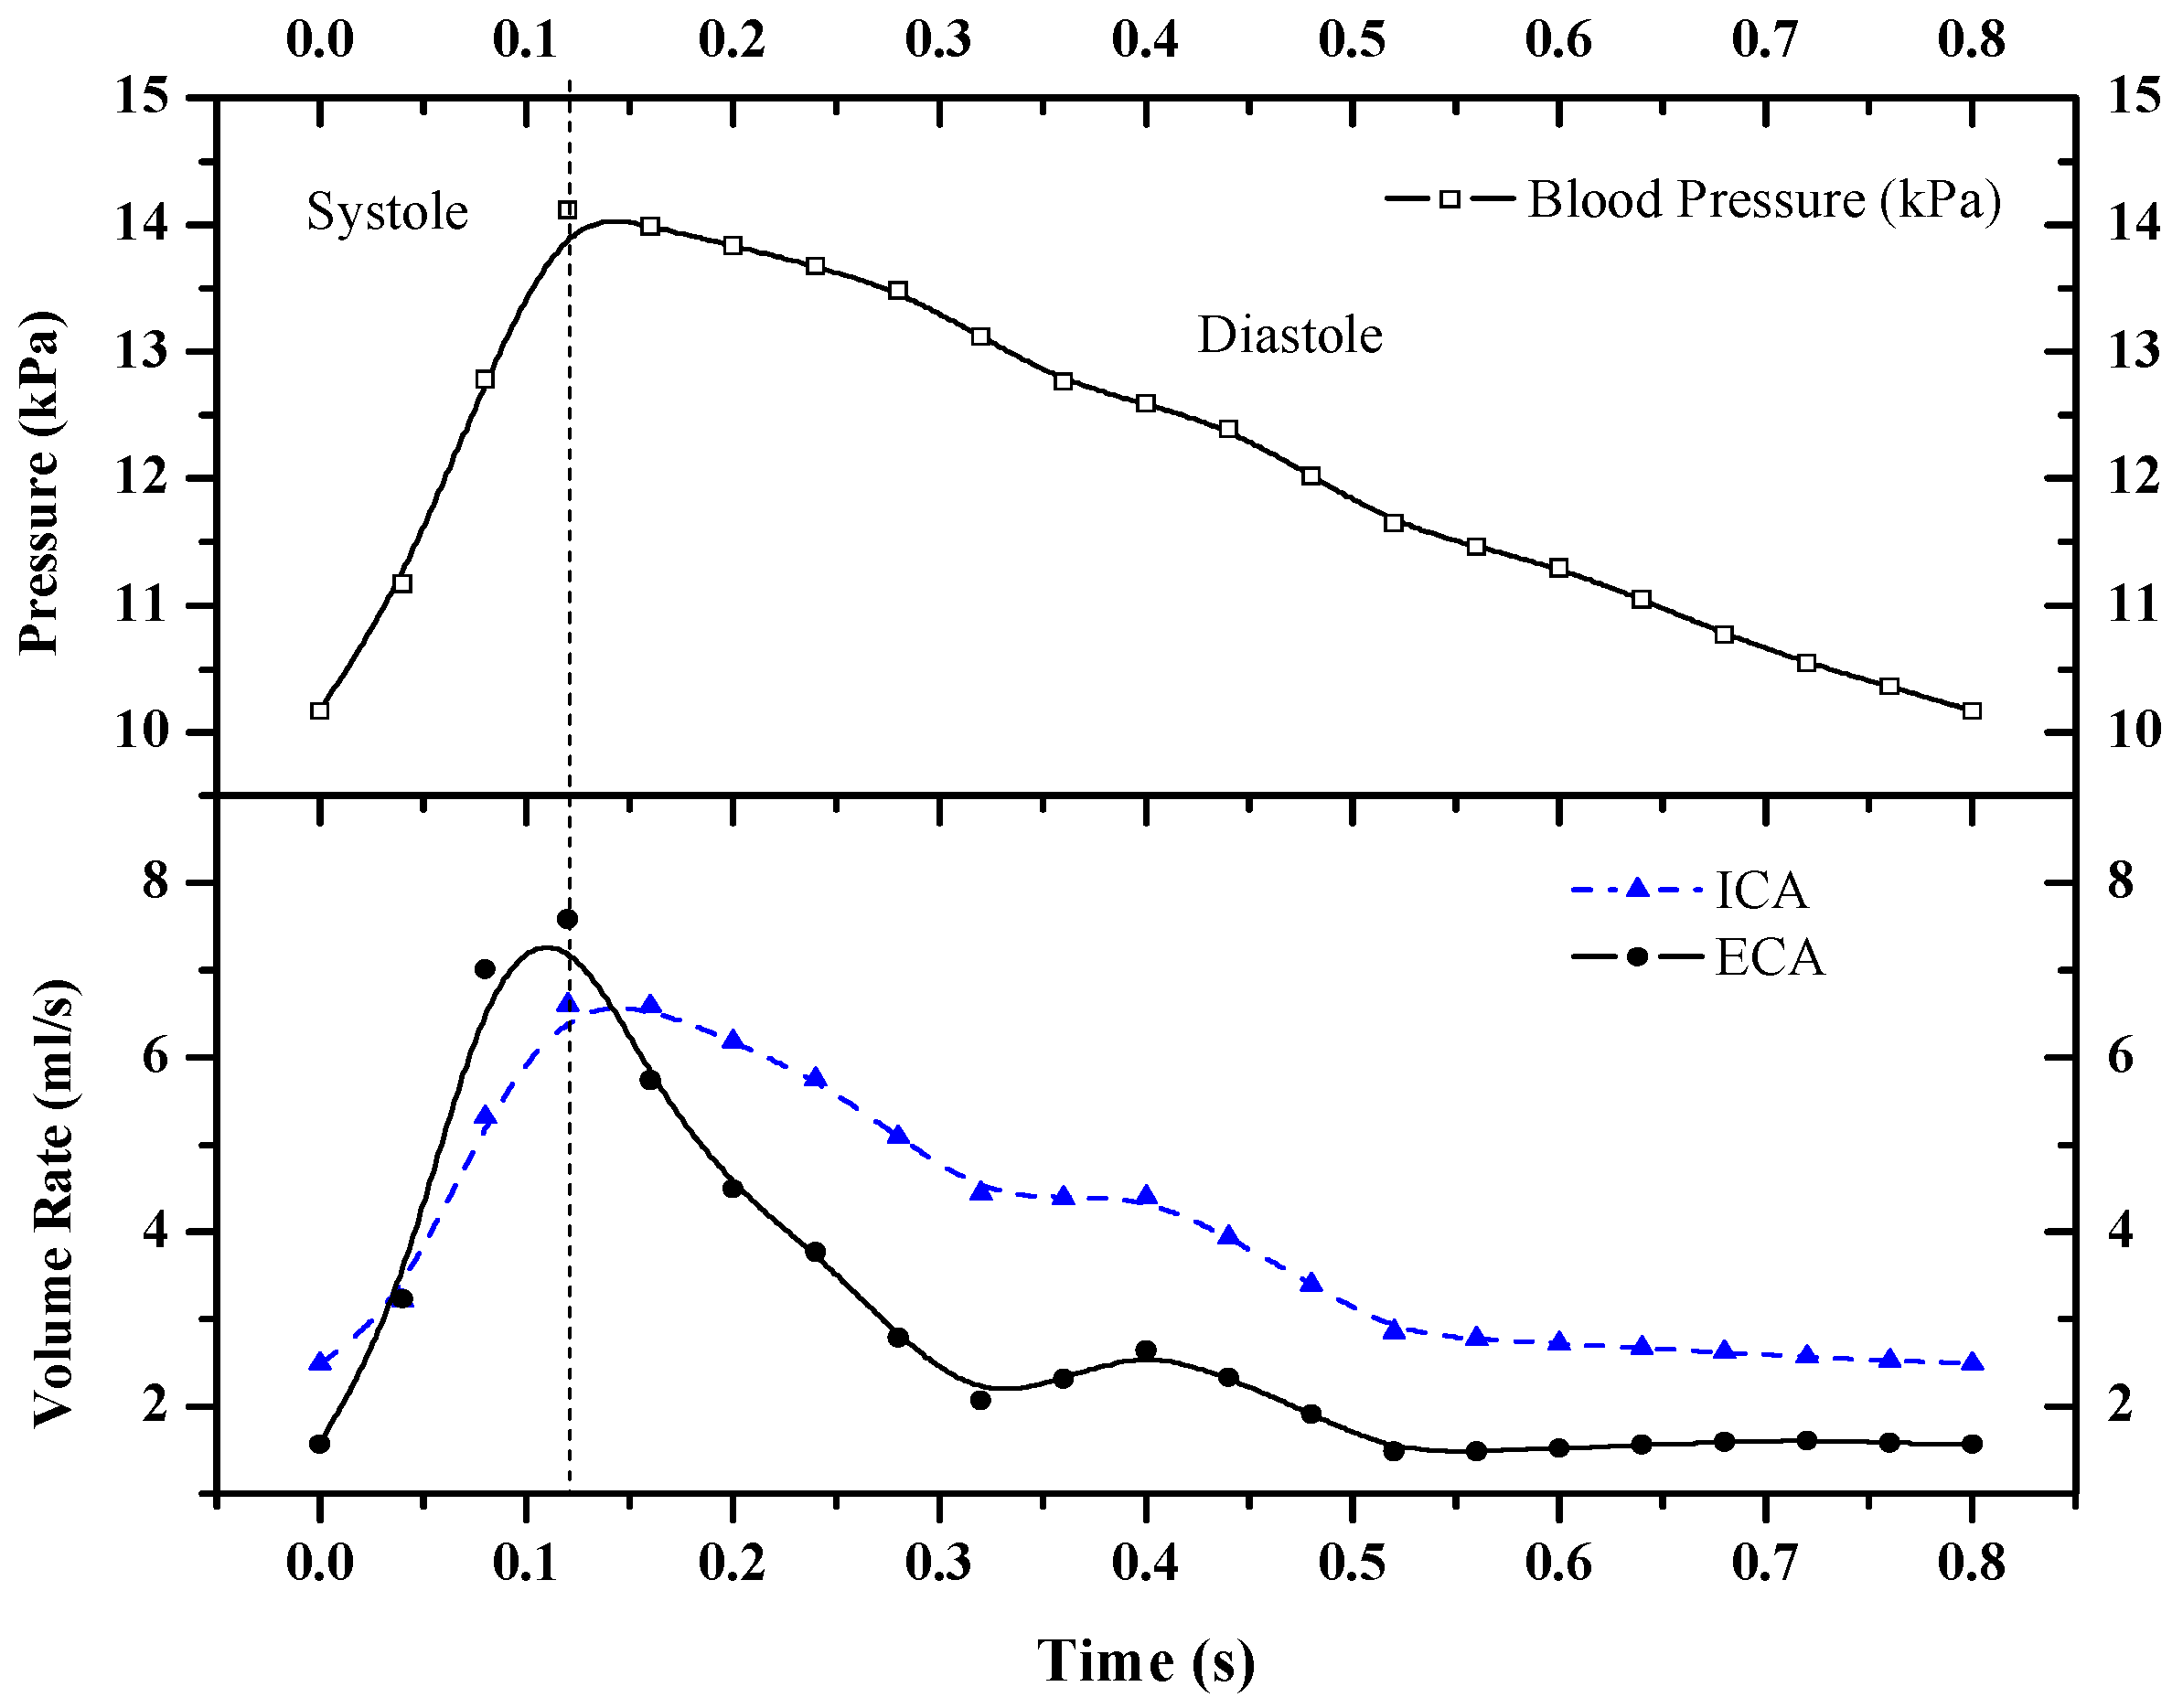
The intravascular blood pressure and blood flow obtained by PC-MRI were set as the boundary conditions. The heart rate (HR) was set to 75 beats per minute (i.e., one cardiac cycle of 0.8 s). The pressure variation in the common carotid artery and the blood flow in the internal and external carotid arteries over time during a single cardiac cycle are shown in
Figure 2.
A tetrahedral mesh was used in the numerical simulation. The model boundary layer had a large shear rate; hence, a three-layer boundary mesh setting was taken at the boundary layer near the wall to ensure accurate calculation results. Blood was regarded as an incompressible Newtonian fluid. The blood density was 1060 kg/m3, the dynamic viscosity was 0.0035 kg/(m∙s), and the initial velocity of blood flow was 0.5 m/s. Considering the elastic deformation of the vessel wall in the calculation, E was set to 5 × 10⁻⁵ Pa, and υs was 0.45. The time step was set to 0.05 s to ensure simulation accuracy. The blood pressure inputs at the vascular inlet in the calculation were all sinusoidal pulsating pressure signals from 0 kPa to 1.2 kPa, and one cardiac cycle was set to 0.8 s.
2.5. Verification of Model Correctness
Figure 3 shows the flow distribution in the blood vessels at different times during a cardiac cycle. The overall distribution of the blood flow field in the lumen was relatively uniform, and the flow rate varied with the blood pressure input signal. The intravascular blood flow rate tended to increase linearly during the systolic period (0–0.15 s) and decrease slowly during the diastolic period (0.15–0.8 s). The average blood flow rate in the vessel could be calculated based on the flow rate and cross-sectional area of the vessel in the boundary conditions. A comparison of this flow rate with the simulation results showed that the results were in general agreement.
The simulation results were compared and analyzed with a sample of existing data from a hospital. The total sample consisted of 62 cases, including 38 males and 24 females with a mean age of 50 ± 5 years. All data were statistically analyzed by SPSS software (Version No. 20.0), and the results are shown as mean (
) ± sample standard deviation (
S). The comparison results in
Table 1 display that for the same-gender sample, the simulated junction error of mean arterial pressure (MAP) was the smallest (−0.61% and +1.19%, respectively) and the error of the pre-ejection period (PEP) was the largest among five indicators (HR, cardiac output [CO], PEP, left ventricular ejection time [LVET], and MAP). For the samples of different genders, the overall error for the female group was larger than that for the male group, and the item with the smallest error in the female group was LVET at −2.78%. Comprehensively, the errors between the simulated and detected values fell within ±10%, indicating that the numerical simulation results using the model and boundary conditions specified in this paper were usable.
3. Calculation Results and Analysis
3.1. Effect of a Single Intravascular Atherosclerosis Lesion on Blood Flow Velocity
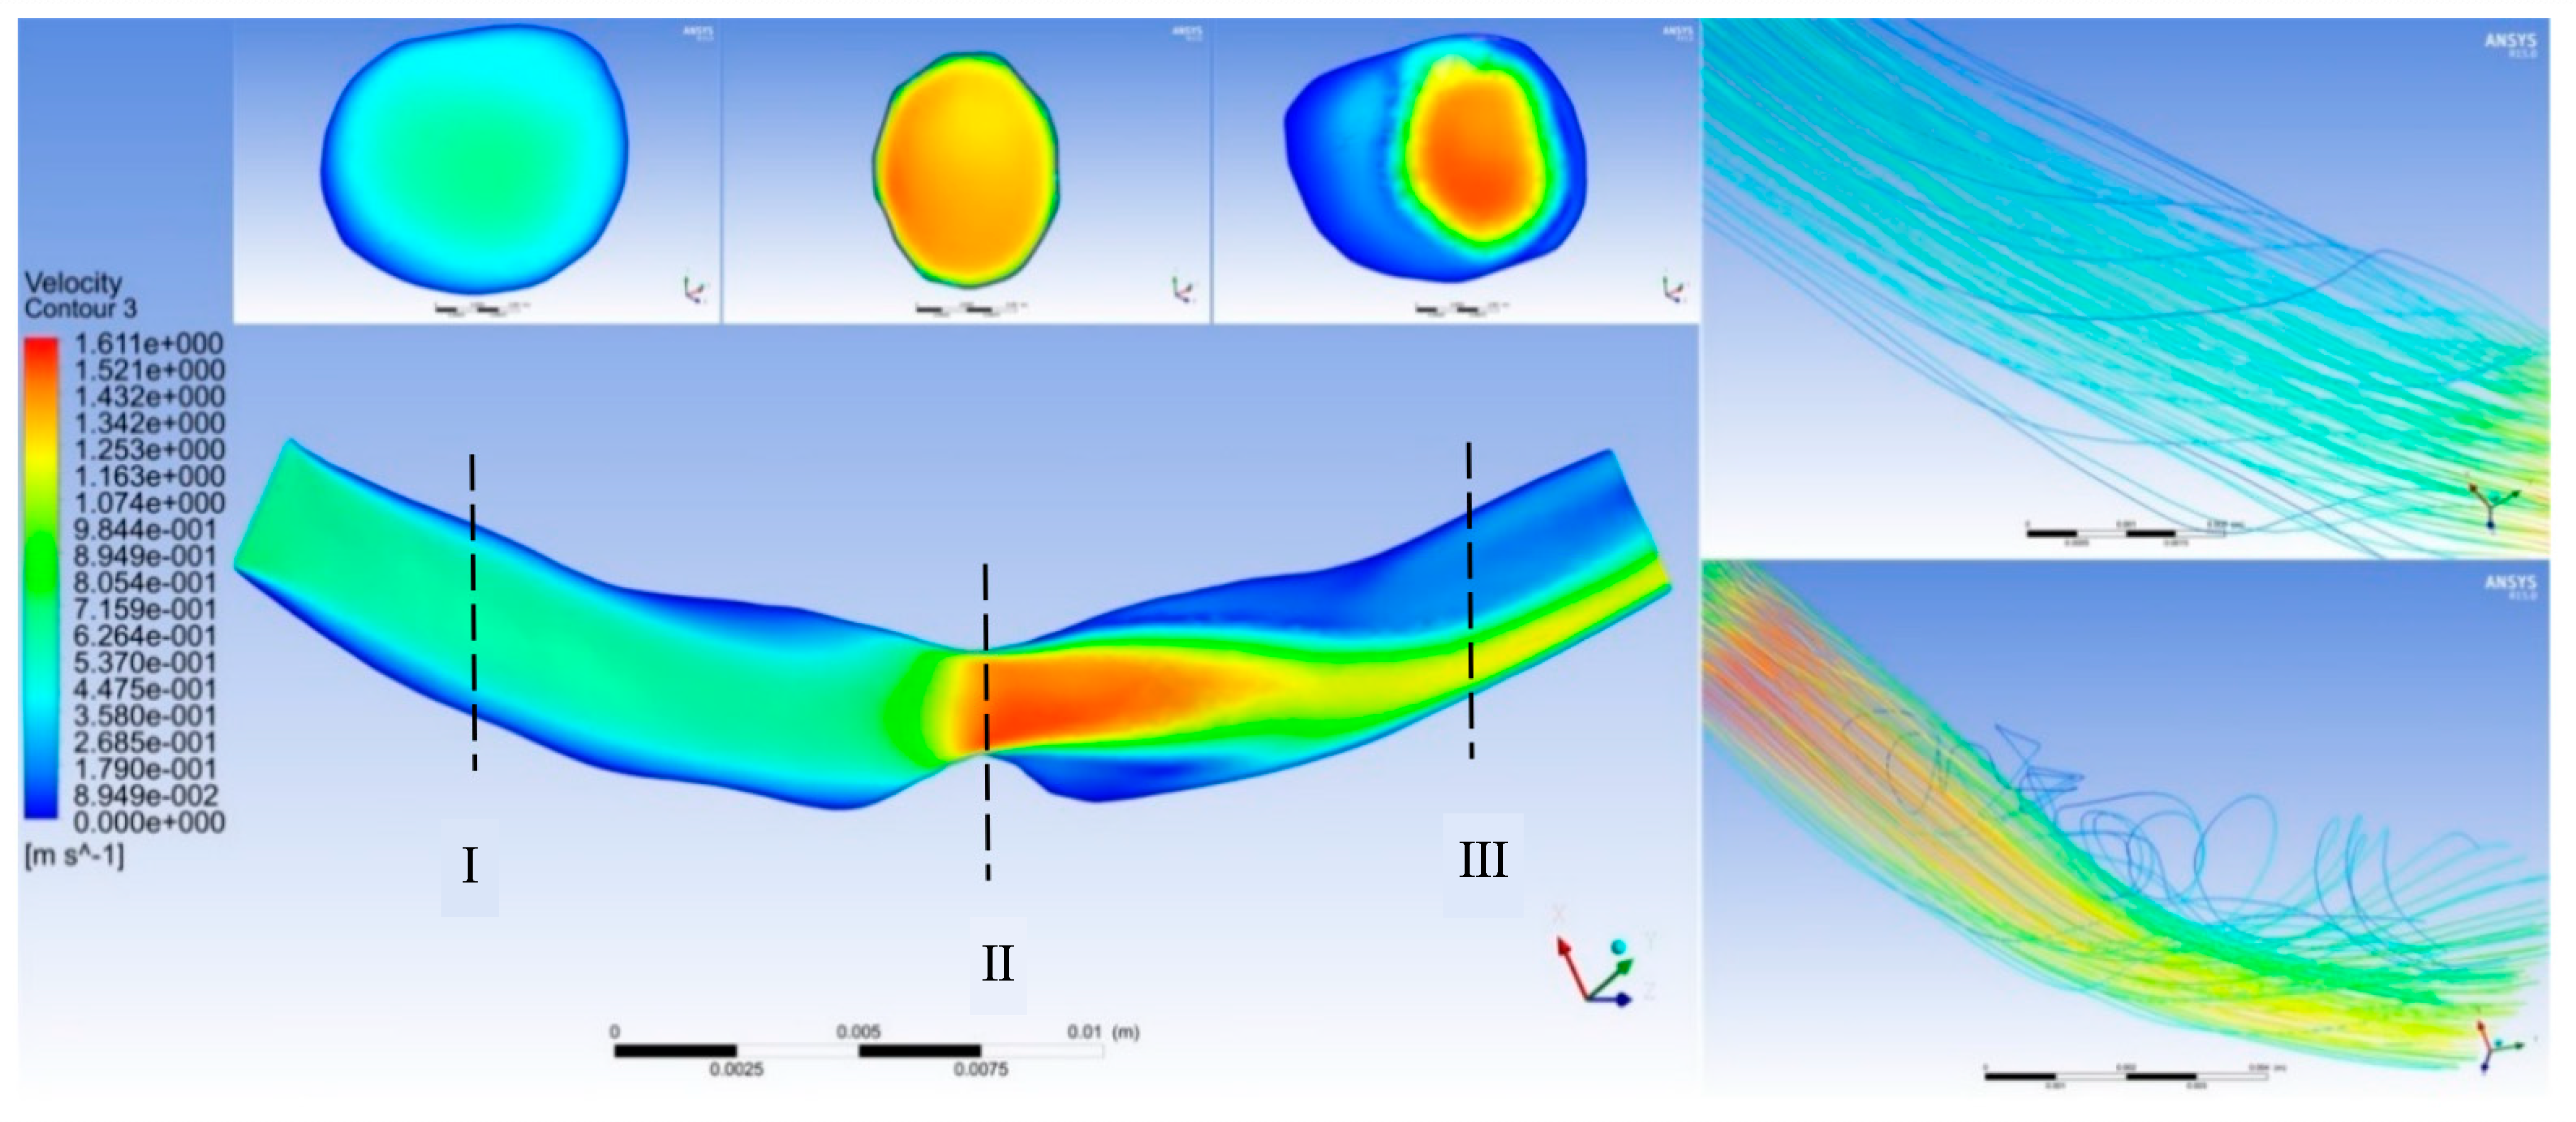
Figure 4 shows the effect of point-protruding atherosclerosis lesion tissue on blood flow rate. A comparison of the velocity distribution in the axial cross-section at various moments during a cardiac cycle showed that the blood flow velocity upstream from the lesion tissue varied largely with the pulsatile blood pressure input signal, producing only a small area of low flow velocity near the proximal end of the connection to the lesion tissue. Substantial changes in flow velocity distribution were observed at the lesioned tissue and downstream from the lesioned tissue at the distal end.
Cross-section I shows the proximal blood flow velocity distribution. The blood flow velocity upstream from the protruding lesion tissue was almost independent of the lesion site, with no obvious flow separation zones and no areas of greater velocity within the entire vascular cross-section. Cross-section II displays that at the protruding lesioned tissue, blood could not form a fully developed flow in the abruptly narrowed vessel, resulting in a thin boundary layer on the vessel wall, a rapid increase in the luminal radial velocity from zero velocity at the wall to the main stream velocity, and an overall flow distribution characterized by a very high flow velocity. The flow velocity at the distal end of the lesion in cross-section III showed a clear separation between the high and low flow velocity regions. The blood flow velocity at the medial wall of the arc was abruptly decreased, creating a distinct secondary flow region with high pressure and low velocity. The flow line shown in
Figure 3 indicates that the protruding lesion plaque triggered blood reflux, which occurred throughout the cardiac cycle. The return flow and reflux area were small in the early part of the cardiac cycle (0–0.15 s), whereas the reflux phenomenon increased remarkably in the second half of the cardiac cycle (0.15–0.8 s).
The simulation results of a single atherosclerotic vessel indicated that the medial arc at the distal end of the stenosis site of the lesioned vessel showed a high flow velocity region in the middle of the lumen and a low flow velocity region near the medial wall of the lumen. Greater stenosis resulted in a lower flow velocity in the region of secondary flow caused by the vessel and a greater the difference in flow velocity at the peak and trough of the cardiac cycle. A comparison of the simulation results of vessels with point-protruded plaques and narrow plaques showed that the low-flow region caused by narrow plaques was larger in length but smaller in volume and was located at the stenosis site and the distal end; the low-flow region caused by the point-protruded plaques was shorter in length but larger in volume and was mostly found at the distal end.
Figure 5 shows the variation in the resistance ratio with the degree of stenosis. In
Figure 5a, with the increase in the degree of stenosis
k, the resistance ratio
increased rapidly. In the case of a certain stenosis, when
became larger, the resistance ratio increased accordingly. For example, when
,
, the resistance ratio
, when
,
, the resistance ratio
. This meant that the effect of stenosis was correspondingly smaller when considering the resistance of a longer straight vessel. With the increase in the ratio of the length of stenosis to the total length of blood vessels
, the resistance ratio increased, and when
, the resistance ratio was the largest. When
, the resistance increased by 10.5% compared to healthy blood vessels. As shown in
Figure 5b, when
, the degree of stricture did not affect the resistance ratio. It can be seen that in the case of
, the resistance ratio increased rapidly as the stricture became more serious.
3.2. Effect of a Single Intravascular Atherosclerosis Lesion on Wall Shear Stress
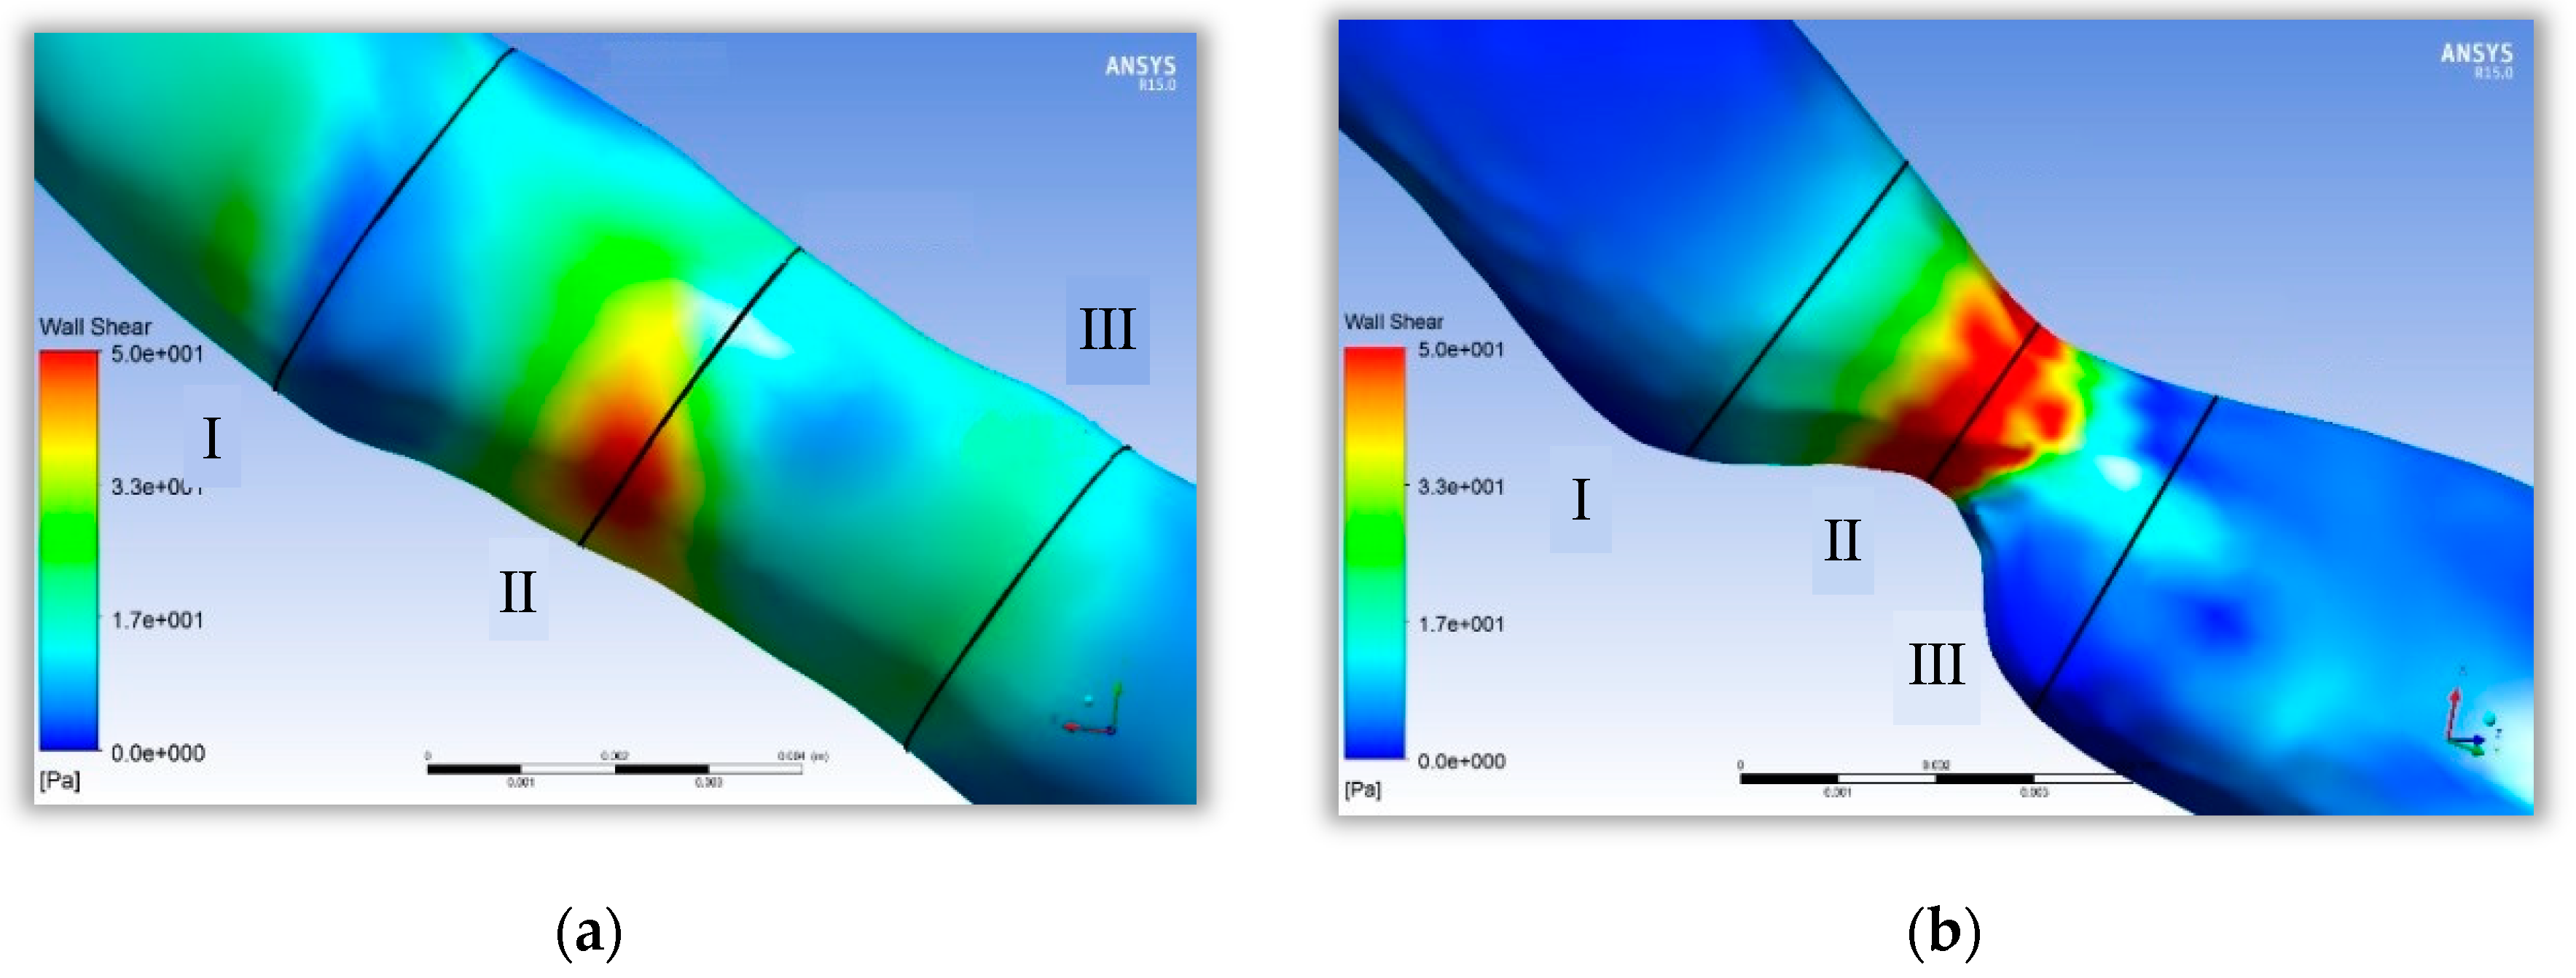
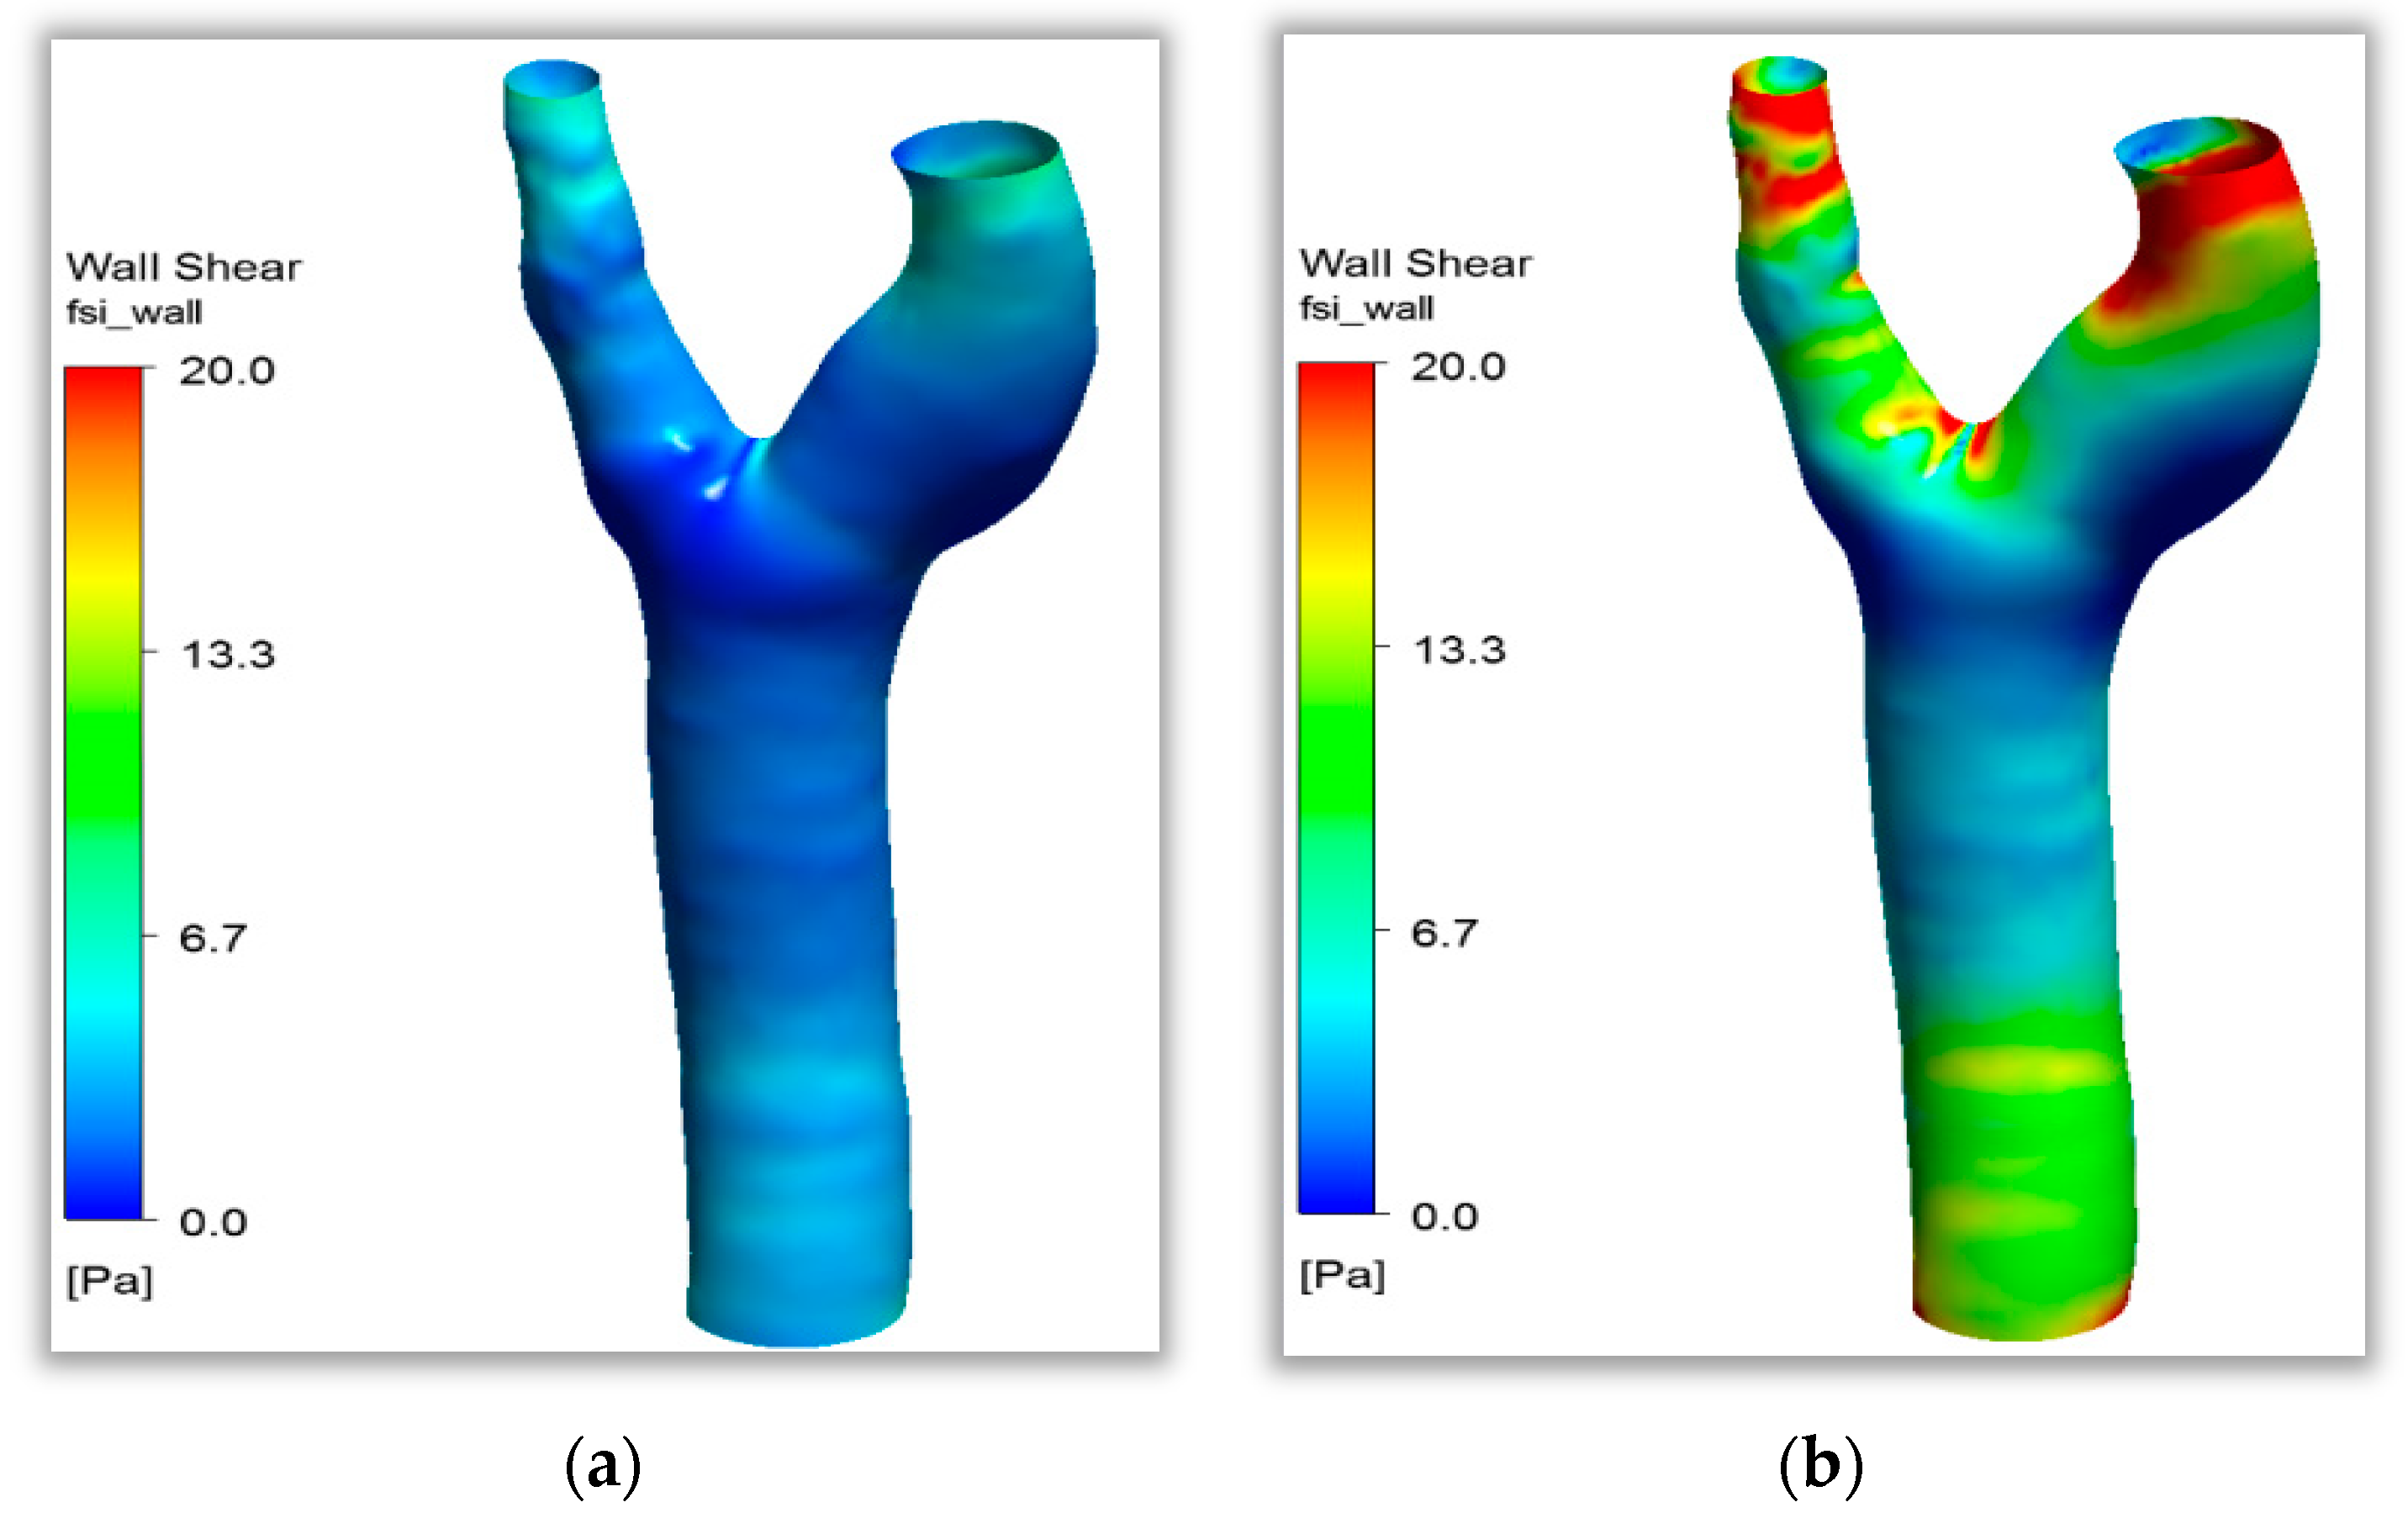
The shear stress distribution at the stenosis site of the healthy vessel and the stenosis site of a 70% lesion were compared, as shown in
Figure 6. In
Figure 6a, although lower shear stress values can be found in the proximal and distal portions of the healthy vessel stenosis sites, the overall shear stress distribution was less different, and the high shear stress region was not obvious at the stenosis site. However, in
Figure 6b, the lesioned vessel was changed sharply in shear stress. The shear stress was very low at the proximal and distal ends of the stenosis and increased sharply at the stenosis. From the perspective of qualitative analysis, fluid conditions suitable for atheromatous tissue proliferation appeared at the proximal and distal ends of the lesioned vessel.
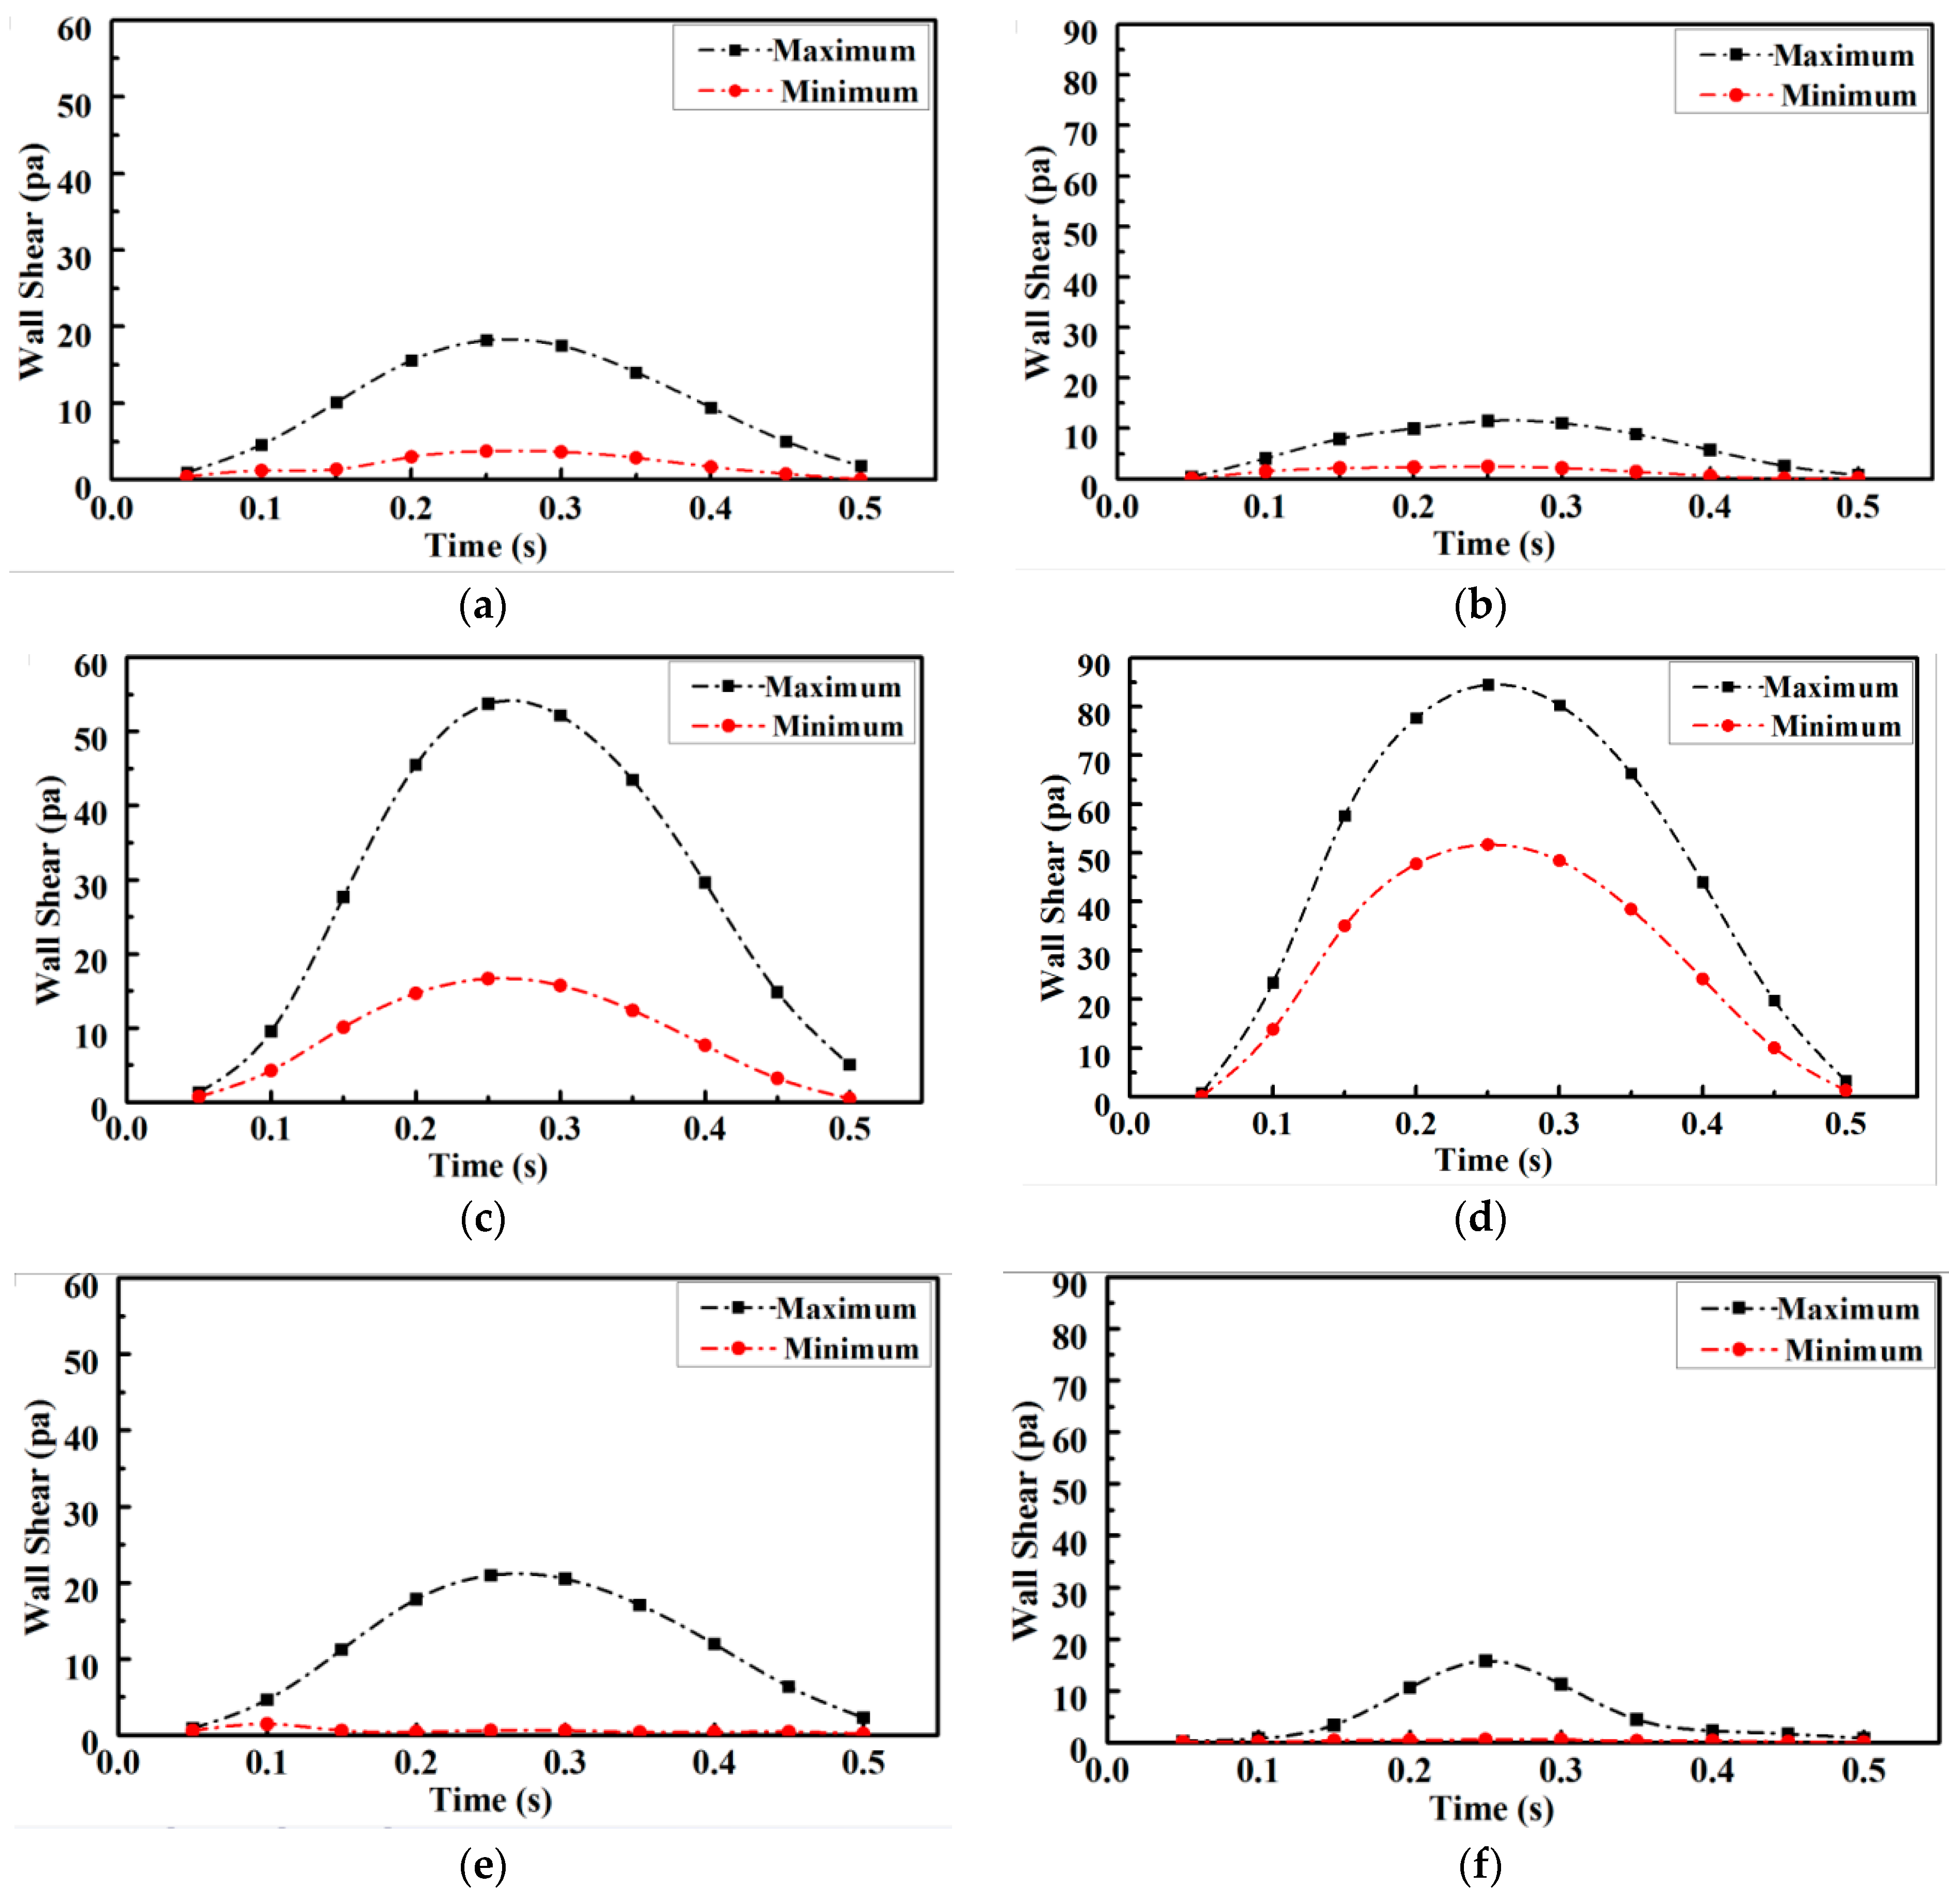
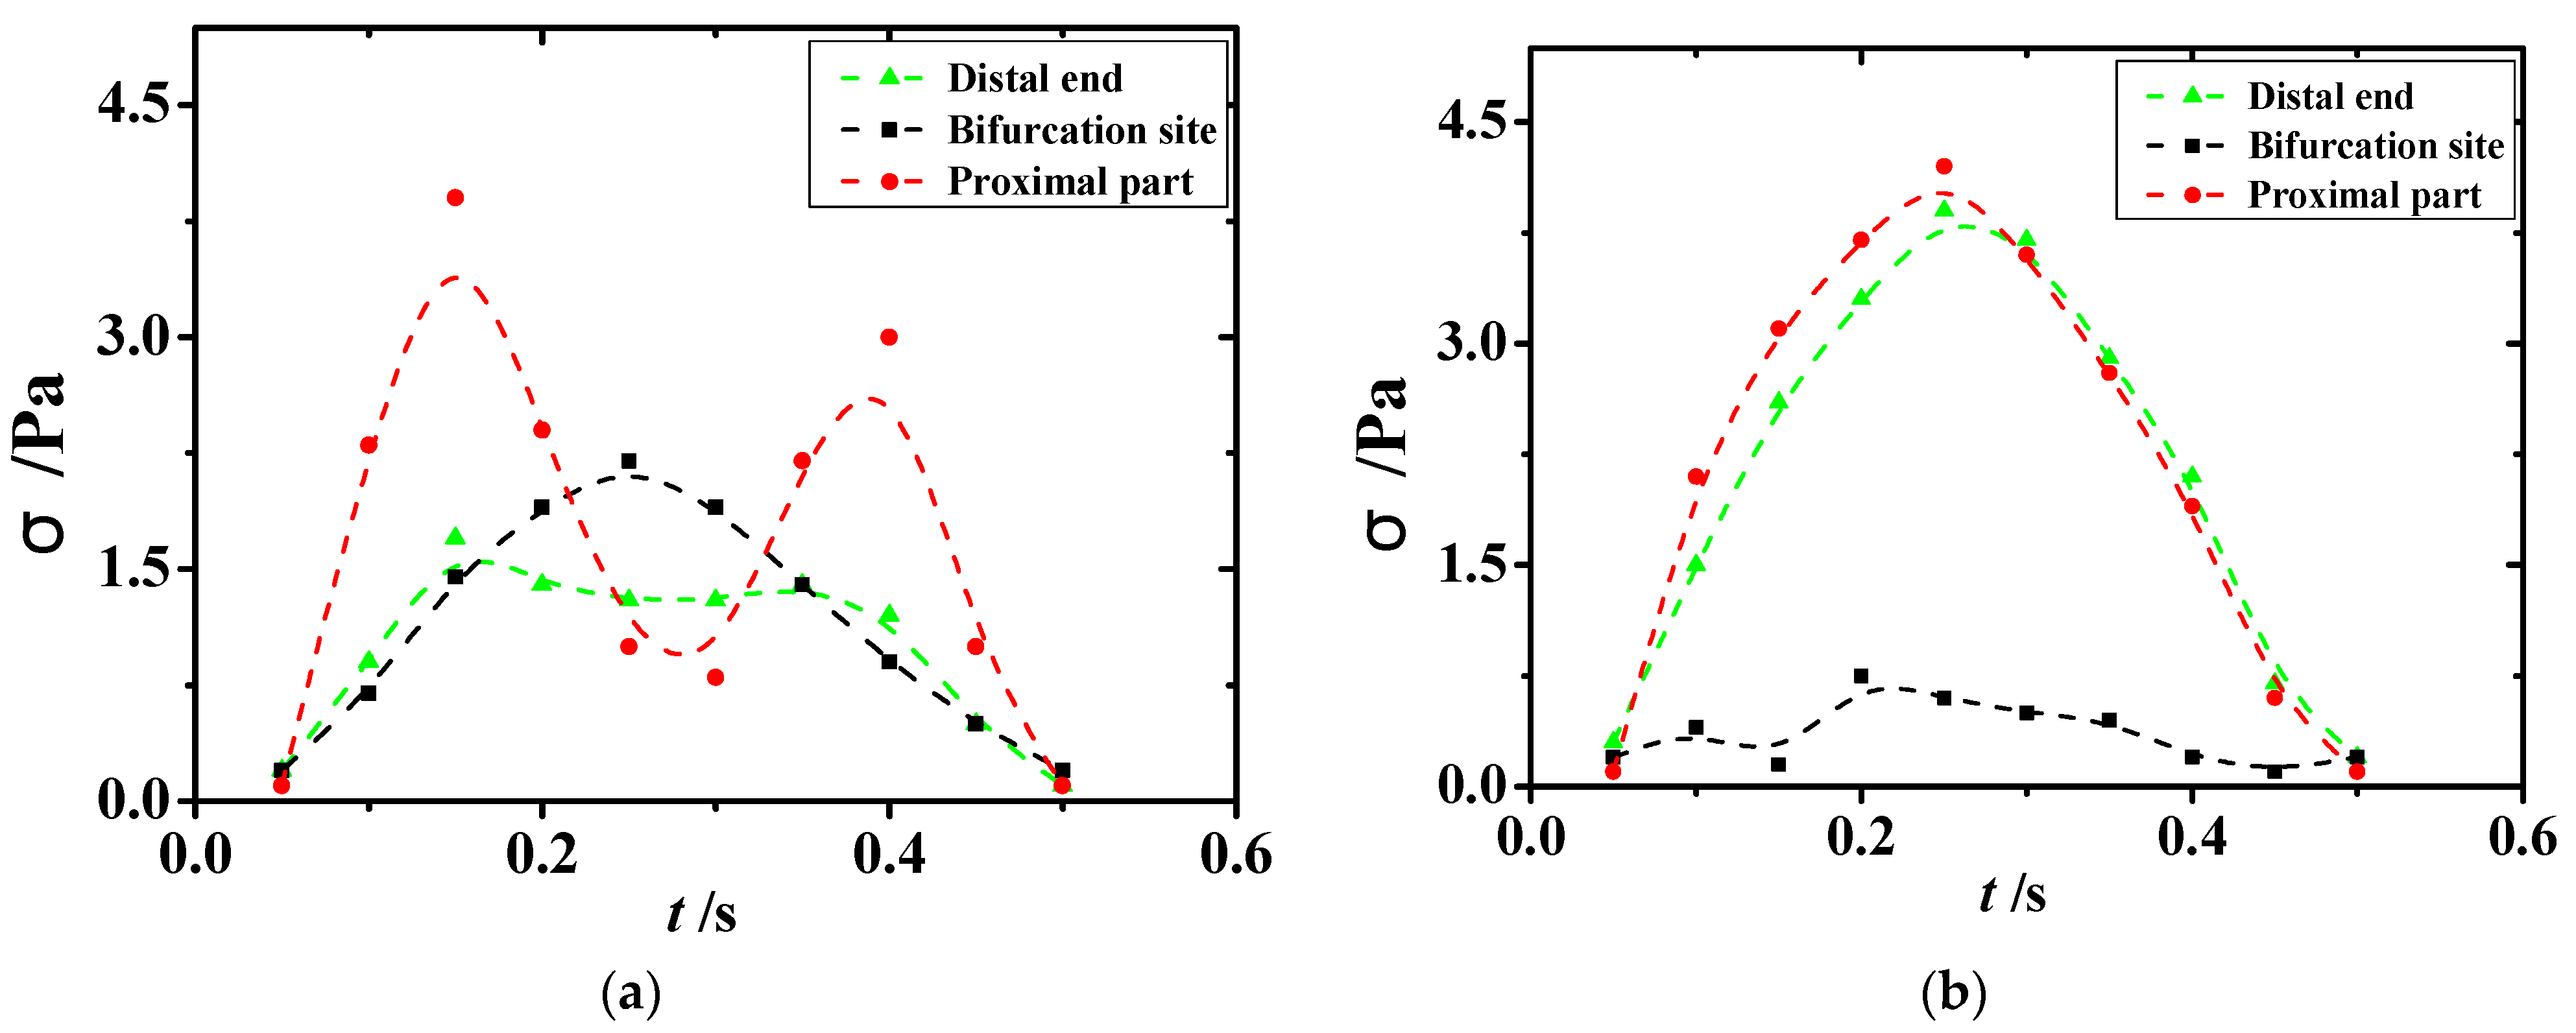
The variation in shear stress extremes at the proximal and distal ends of the arterial stenosis site during one cardiac cycle is shown in
Figure 7. Quantitative analysis revealed that compared with those of the healthy vessel, the extreme values of shear stress increased by 50% and the minimal values of shear stress increased by 100% compared with the normal values at the stenosis site of the lesioned vessel, as shown in
Figure 7c and
Figure 7d, respectively. The extreme values of proximal shear stress in the lesioned vessel were more than 30% lower than the normal value, as shown in
Figure 7a,b. The extreme values of distal shear stress in the lesioned vessel were more than 50% lower than the normal value, as shown in
Figure 7e,f. Therefore, a fluid environment suitable for atheromatous plaque proliferation was more likely to occur at the distal end of the stenosis. The atheromatous plaque tissue was more likely to be dislodged and a downstream arterial infarction was also more likely to occur because of the increased shear stress and pressure on the lesion site.
3.3. Analysis of Lesion-Susceptible Artery Bifurcation Sites
Clinical studies found that carotid bifurcation vessels are areas with a high incidence of atherosclerosis. The simulation results of shear stress distribution in a healthy carotid bifurcation vessel during one cardiac cycle are shown in
Figure 8. The figure shows that shear stress varied with the input pulse signal and was uniformly distributed at the beginning of the cardiac cycle (
t = 0–0.15 s) at below 5 Pa. Shear stress rose rapidly when the signal reached the peak at
t = 0.15 s, and shear stress further increased to the maximum after the peak. The sites with the maximum tangential stress on the vessel wall surface below 10 Pa at this moment accounted for 70%. A flow separation zone with lower flow velocity and shear stress levels than other sites was observed on both sides of the carotid bifurcation site. The fluid characteristics in this zone did not change substantially throughout the cardiac cycle, which was suitable for the attachment of inflammatory features to the vessel wall. The fluid environment had focal properties. Combined with clinical studies, this study found that both sides of the carotid artery were indeed atherosclerosis-prone areas. Acute cerebrovascular diseases, such as stroke, are highly likely to happen when atheromatous plaque is dislodged in this area, as shown in
Figure 8. The numerical simulation results in this paper agree well with this research [
29]. The wall shear stress value of healthy blood vessels is not less than 0.5 Pa, and there is no growth environment for pathogenic features.
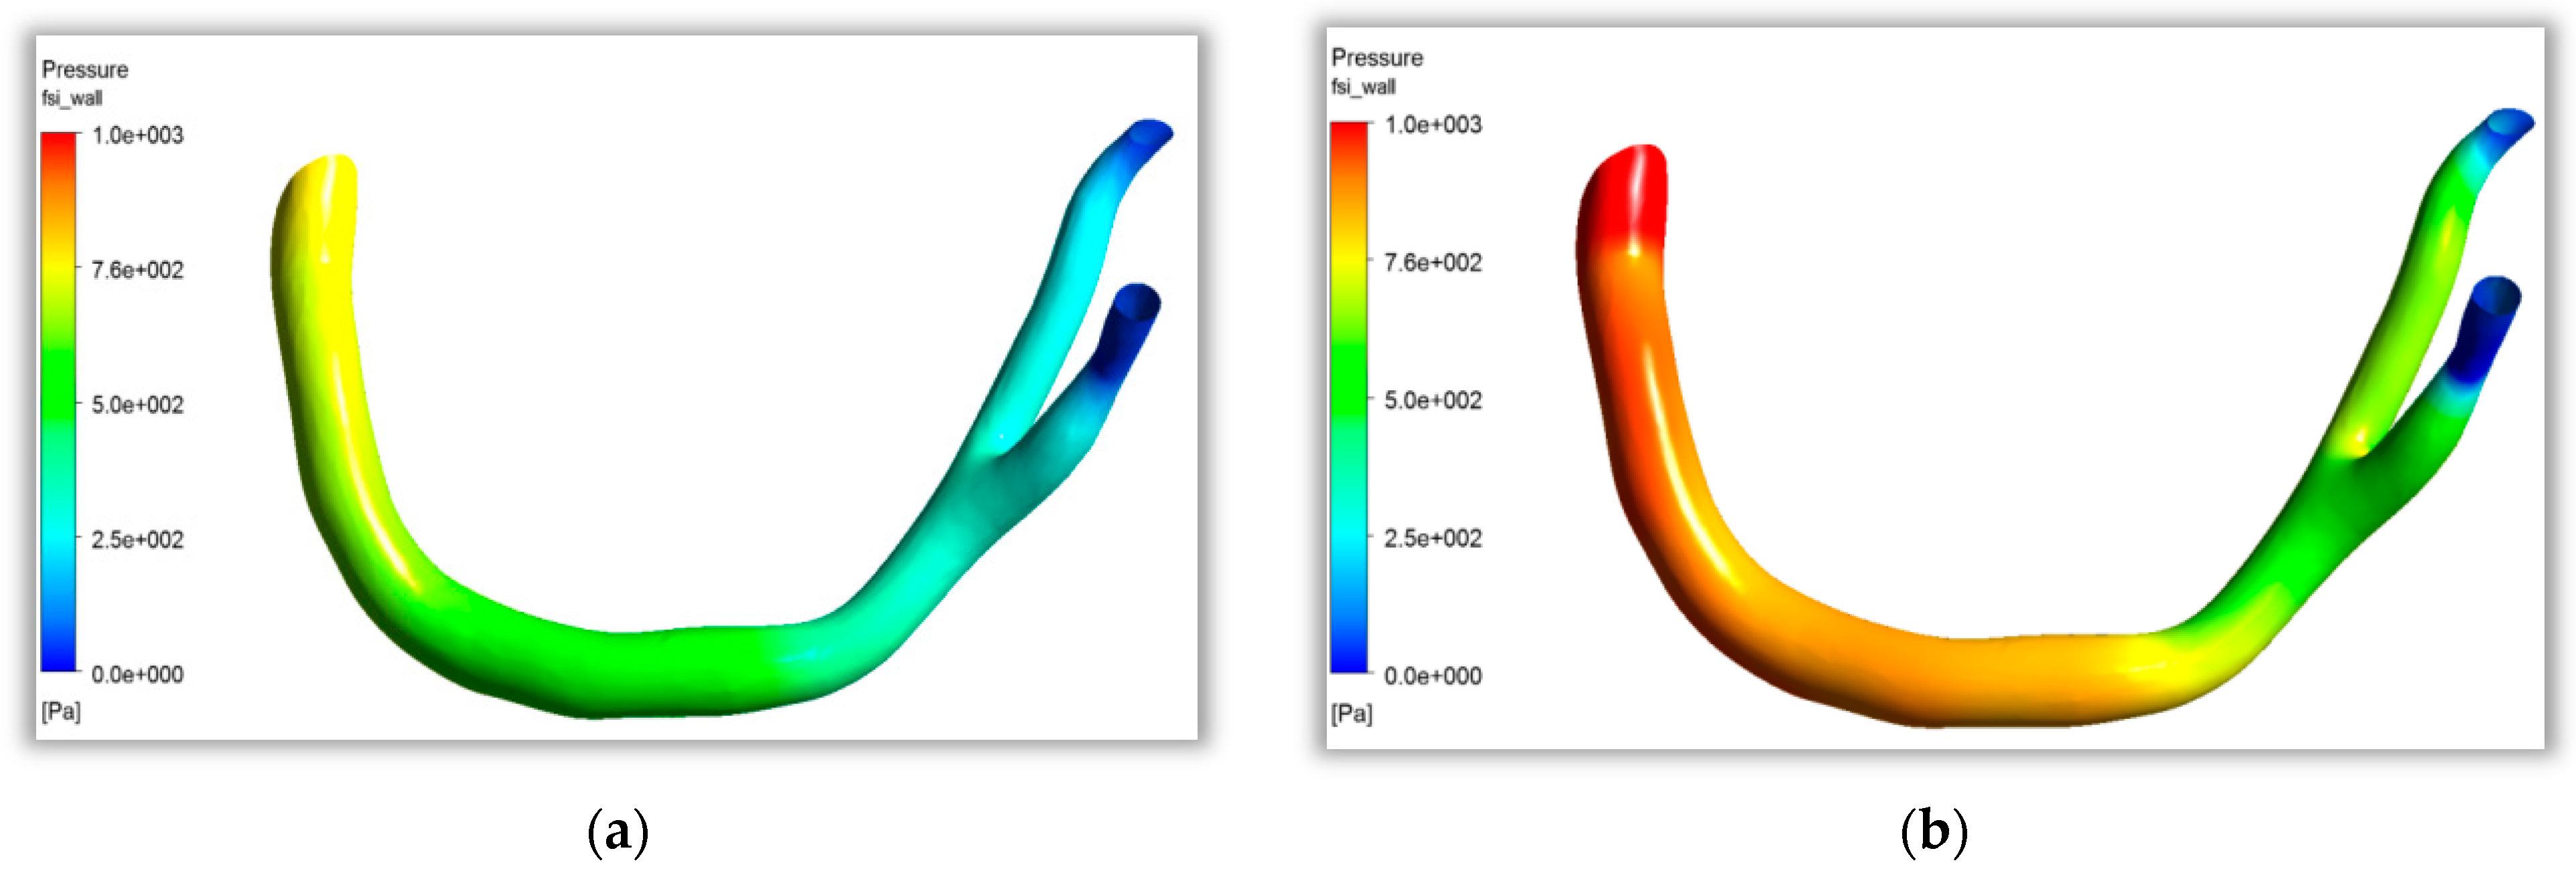
As shown in
Figure 9a, at t = 0.15 s, the heart was in the stage of contraction. The blood pressure in the coronary artery decreased gradually along the direction of blood flow from the aorta to the two branches. At this point, blood flow was in the initial stage of cardiac contraction, and the pressure difference between the inlet and outlet was small. As shown in
Figure 9b, at t = 0.3 s, when cardiac contraction was completed, the wall pressure in the stagnation area at the bifurcation of the coronary artery was significantly higher than that in the nearby aorta and branch artery. A relatively obvious low pressure area appeared in the branch artery, which would enrich atherosclerotic particles in this area, and then affect vascular endothelial tissue lesions. The curved and bifurcated parts of the coronary artery with large curvature easily formed flow separation, and the fluid characteristics of low flow velocity and low shear stress formed the focal features of atherosclerosis.
3.4. Feedback Mechanisms of Lesion Processes on Flow Properties
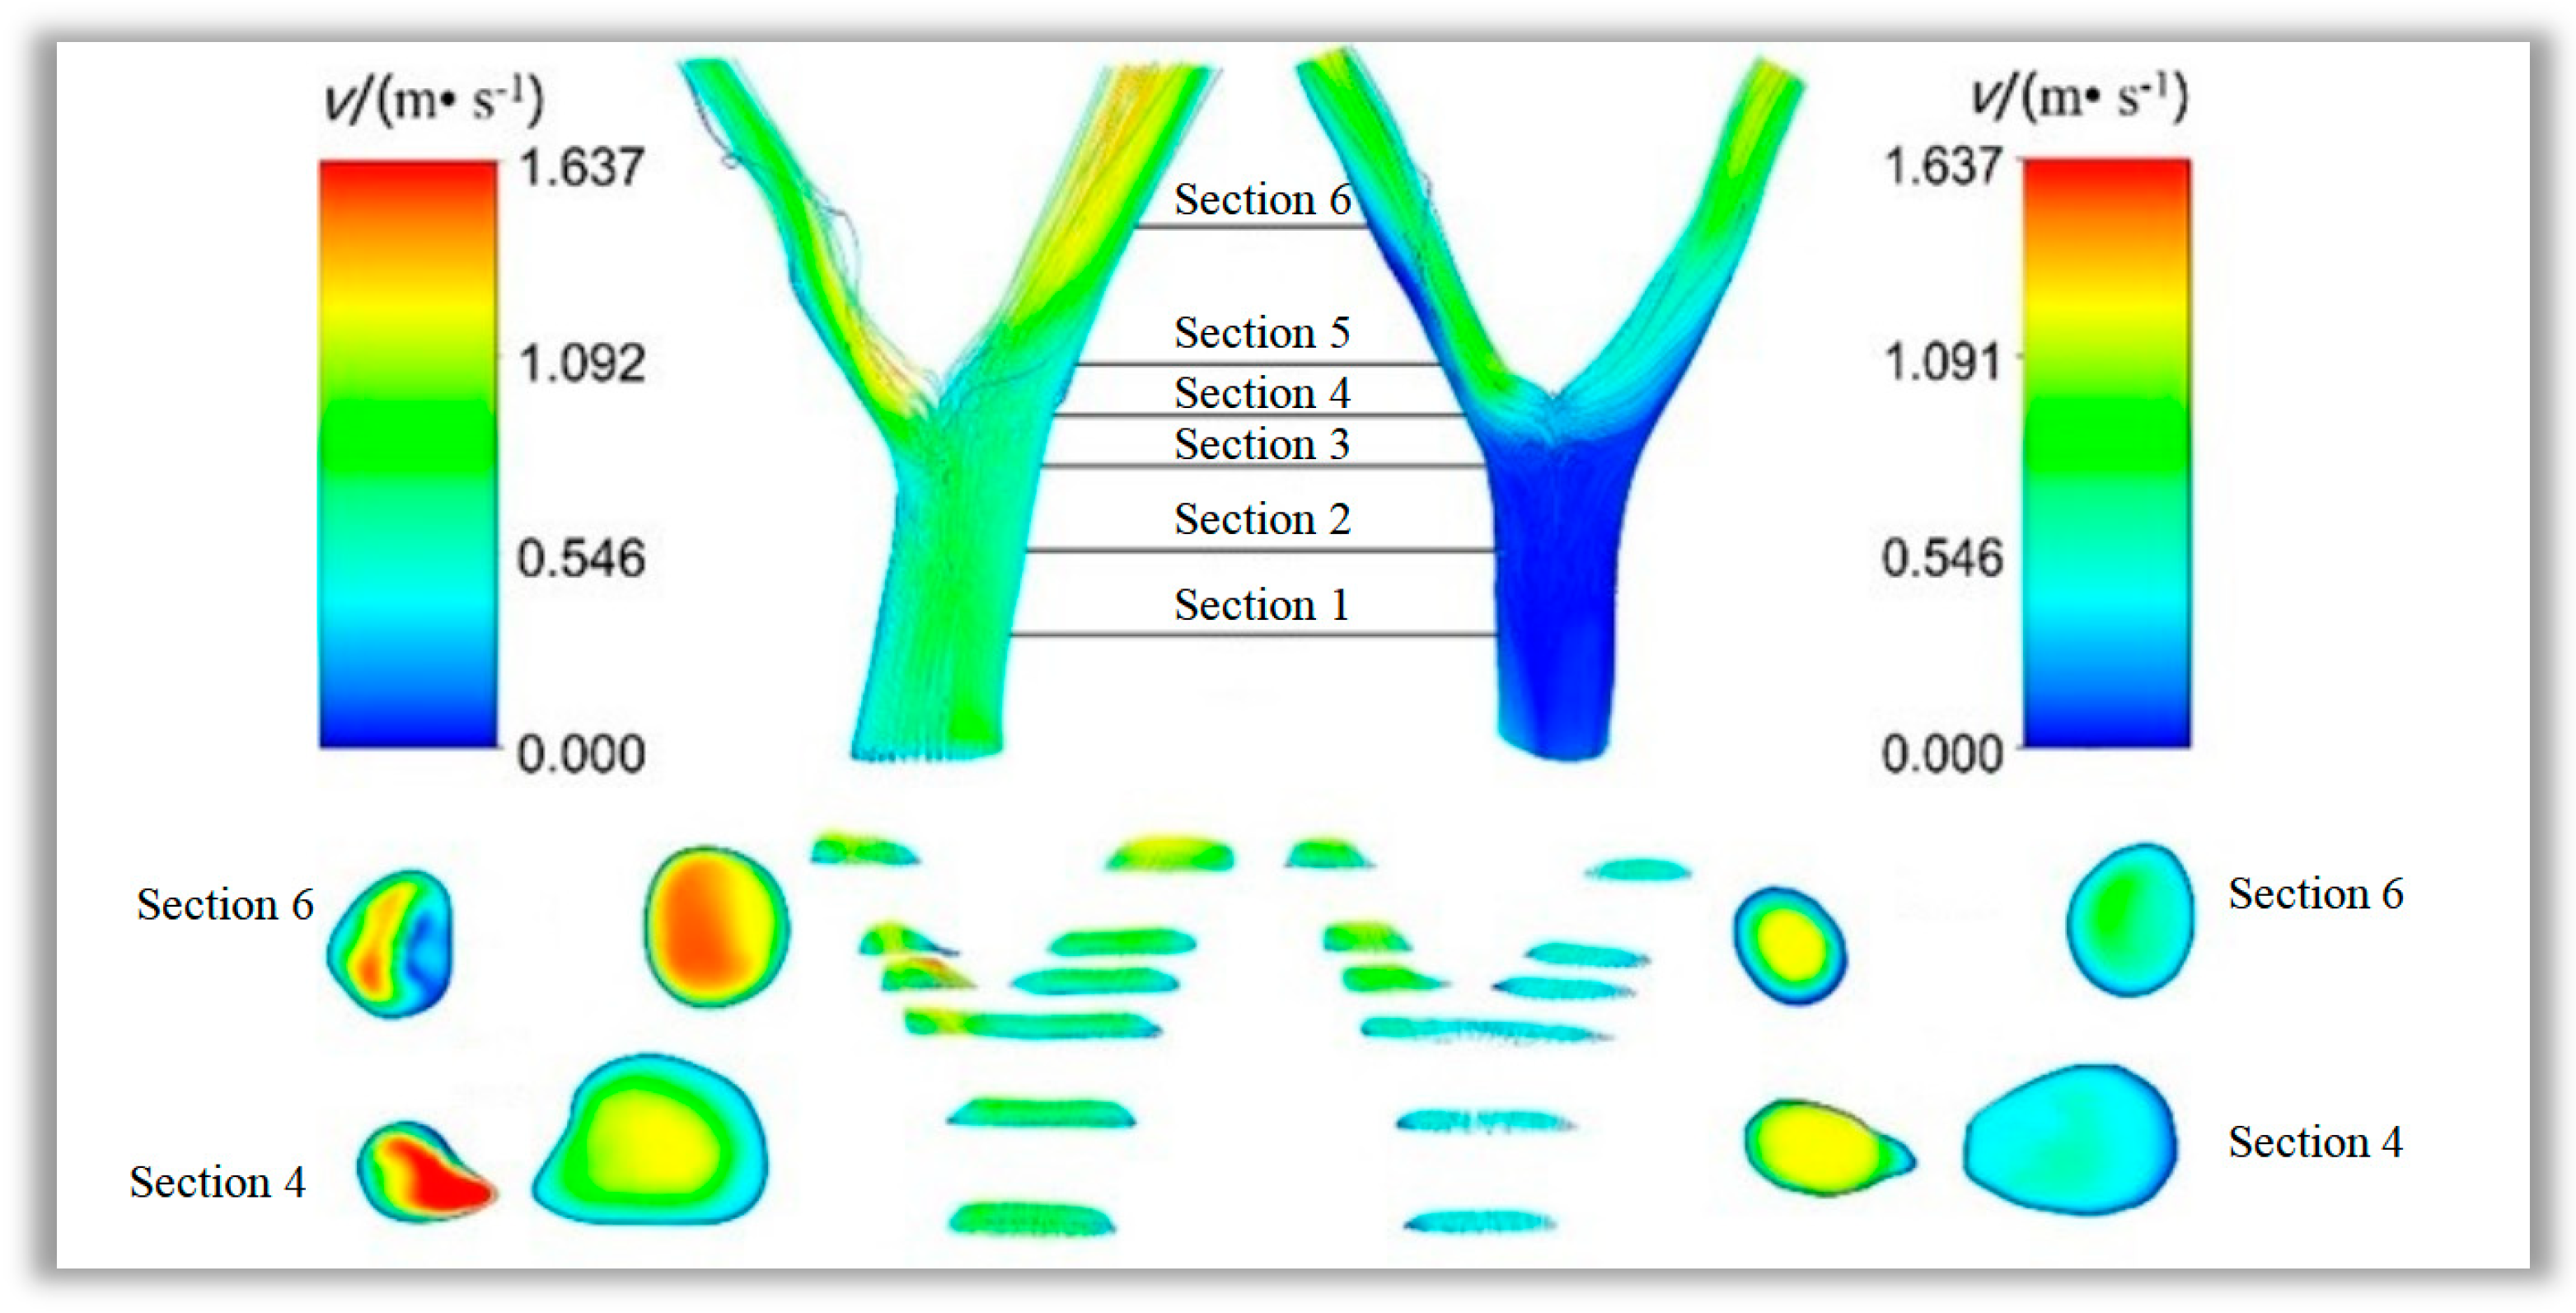
The condition can be predicted by simulating flow characteristics to study the feedback mechanism of the lesion formation process on blood flow characteristics. In this paper, six cross-sections were sampled at the same locations on the lesioned and healthy vessels. The flow velocity distributions in the vessels at
t = 0.25 s were observed and shown in
Figure 10. The overall flow velocity in the lesioned vessel was greater than that in the healthy vessel, and substantial flow disturbances were seen in the left branch vessel at the site of lesion stenosis. Blood flow separation was found at this site, whereas no considerable flow separation was found in the healthy vessel. A comparison of cross-section 4 and branch vessel cross-section 6 showed that the flow velocity in the healthy vessels did not change remarkably after flowing through the bifurcation site. However, flow velocity was increased substantially in the lesioned vessel as the blood flowed through the lesion site, whereas an area with low flow velocity was created after the lesion site. This result suggested that the lesion tissue leads to areas of secondary flow with very low blood flow rates in the branch vessels of the lesion.
As displayed in
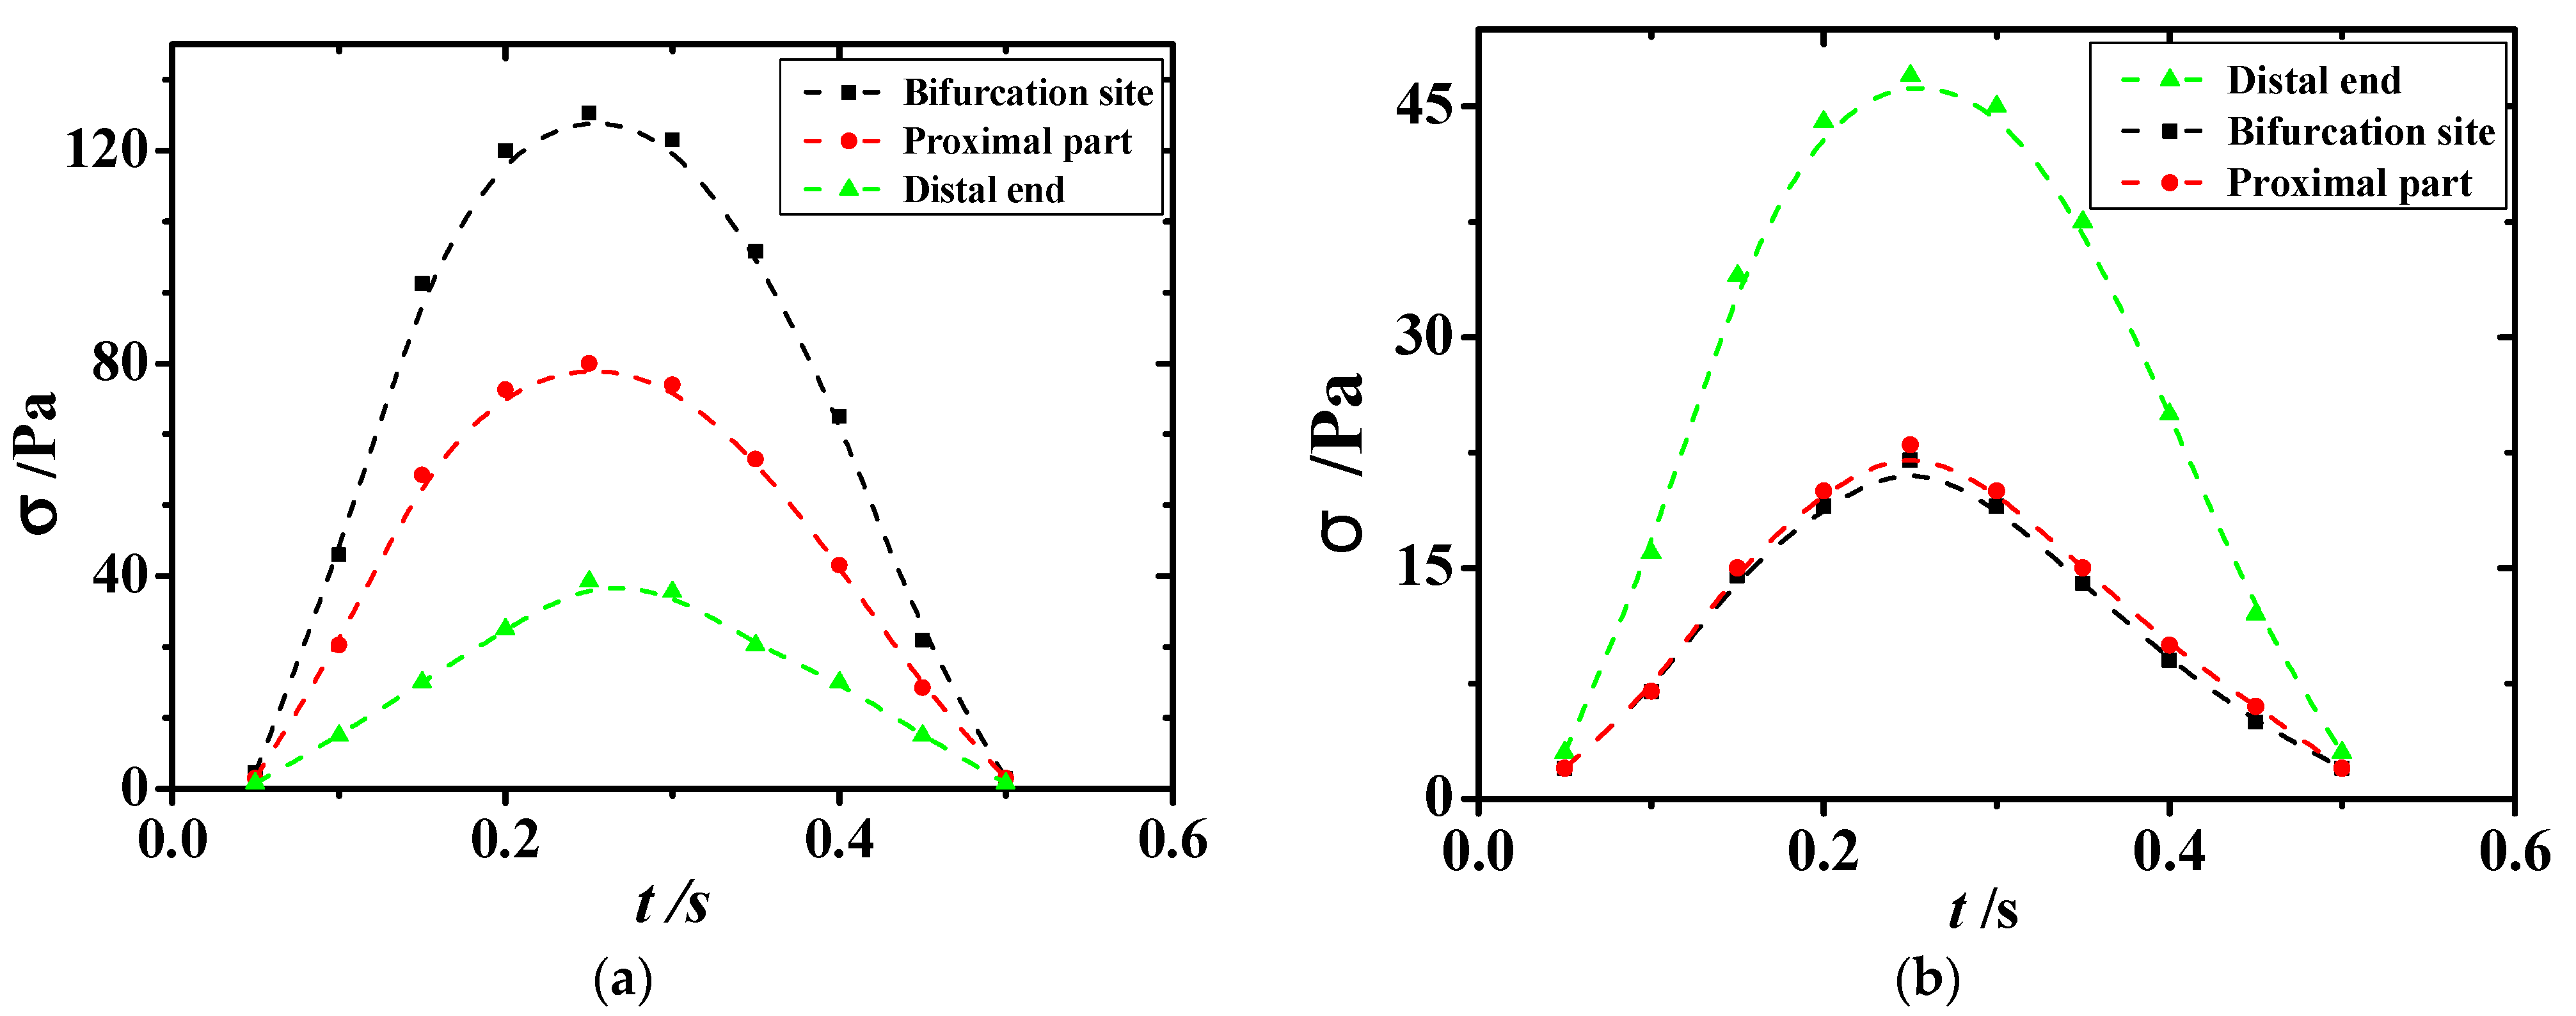
Figure 11, sections 3, 4, and 5, which were at the bifurcation site in the vessel, were the regions where the extreme values of shear stress appeared. Section 3 was the proximal end section, section 4 was the section at the bifurcation, and section 5 was the distal end section. Variations in shear stress at the extreme point with time are shown in
Figure 11 and
Figure 12. The extreme values of shear stress at the proximal and distal ends of the healthy vessel bifurcation site were almost equal, as shown in
Figure 11b. However, in the diseased vessel, the maximum shear stress at the proximal end was much greater than that at the distal end, with a difference of more than 80 Pa, as shown in
Figure 11a.
A comparison of the changes in the minimal values of shear stress in the lesioned and healthy vessels in
Figure 12 showed that regions with lower and oscillating shear stress were seen at the bifurcation site and the distal end of the diseased vessel. This phenomenon suggested that the shear stress environment in the vicinity of the atheromatous tissue further accelerated the rate of vascular lesions after the development of atherosclerosis. In addition, shear stress with repeated shocks to the vessel wall can lead to the dislodgement of atheromatous plaque, which can then lead to major diseases, such as heart attack, brain attack, and pulmonary embolism. As presented in
Figure 12, the shear stress in healthy vessels was uniformly distributed with small and slight changes in extreme values; in lesioned vessels, the equivalent force on the vessel wall was increased substantially and showed a repeated oscillation trend, which can directly lead to the aggravation of the patient’s existing condition.
3.5. Effect of Lipid Concentration Distribution on Atherosclerosis
The root cause of atherosclerotic lesions was the excessive accumulation of lipids in the blood vessel walls. The accumulation of lipids in blood vessel walls was directly related to the distribution of lipid concentrations in blood. The distribution of lipid concentration in blood was not always uniform, but had a certain regularity, which showed important significance to explain the focus selectivity of atherosclerosis.
Unlike wall osmosis, the distribution of particles in the main stream of blood vessels was not uniform. The annular concentration vacuum region appeared near the external wall of the carotid artery. There was a high concentration area near the vacuum area; this phenomenon was especially significant when the flow was large. Under the condition of maximum mass flow, a high concentration ring area was approximately formed near the bifurcation wall. A region of low particle concentration formed on the surface of the inner bend, while the particle concentration near the outer surface of the bend was relatively high. This was because particles were deflected by centripetal force during the movement of the bend. From the perspective of particle concentration distribution, it was not conducive to the accumulation of lipid particles on the inner wall of curved blood vessels, which had a certain hindering effect on the formation of atherosclerotic plaques. Especially when the flow became larger, a higher concentration ring area would be formed near the wall surface. There was no significant difference between the high concentration area in the bend and the outer wall. Near the inner wall, the concentration gradually decreased, and there was a low concentration area. The particles began to move away from the inner wall of the bend and aggregated toward the outer wall. At low flow velocity, the concentration near the inner wall was significantly lower, and at high flow velocity, the low concentration area decreased, but the high concentration ring area still existed.
3.6. Relationship Between Dynamic Features and Atherosclerotic Pathogenesis
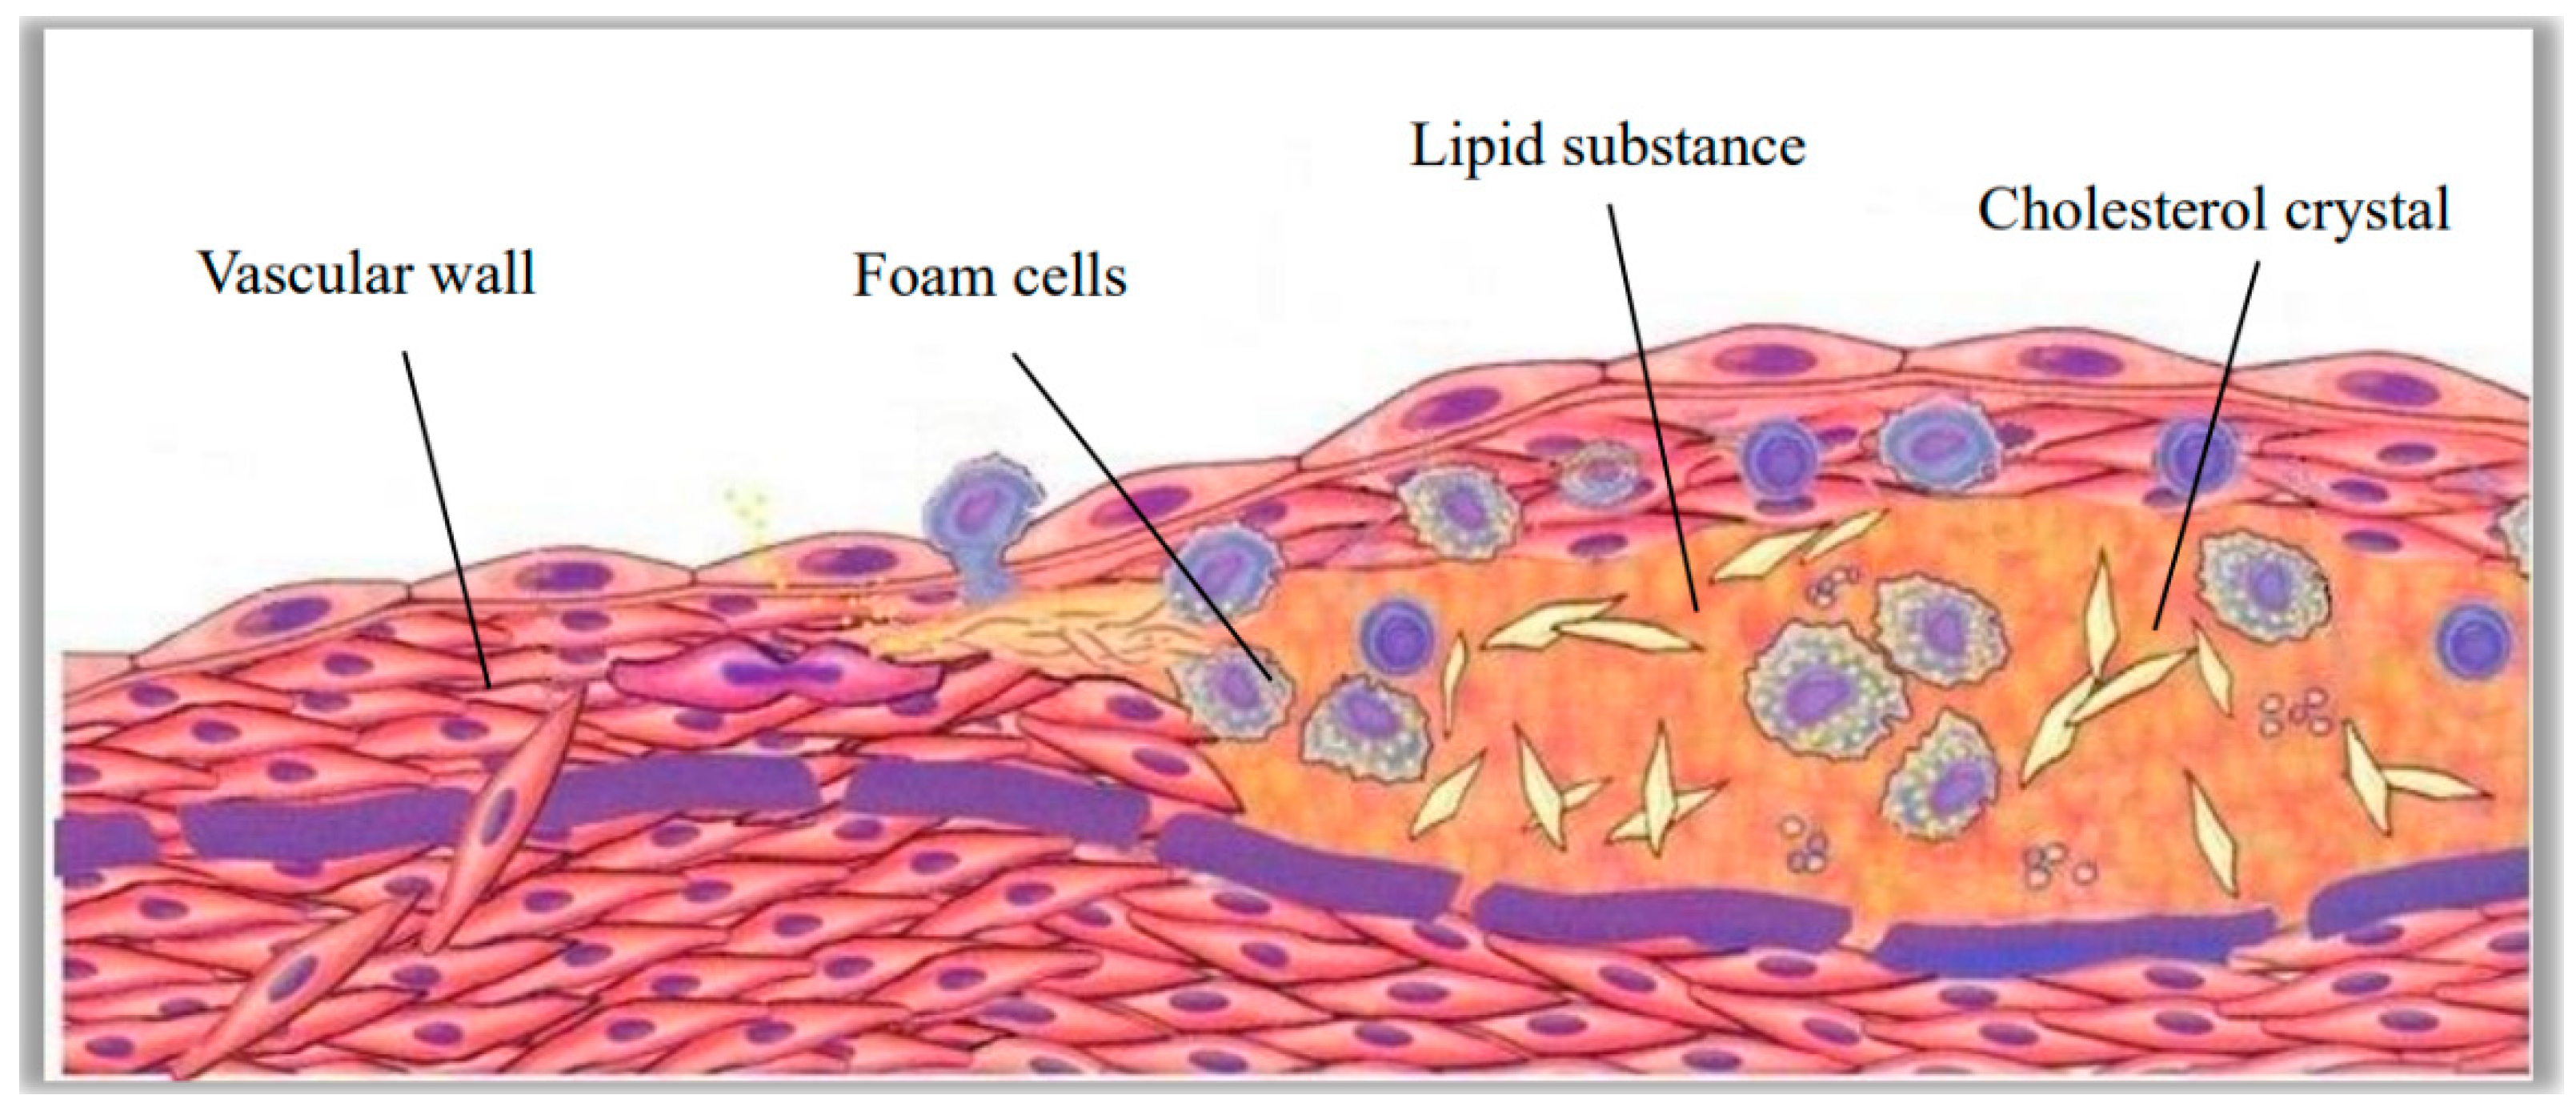
The pathogenesis of atherosclerosis was complex. The local pathological features were sustained vascular endothelial tissue damage, fat accumulation, and protein crystallizatio. In the course of development, accompanied by the formation of lipid chylous plaques, thrombus could occur in severe lesions, as shown in
Figure 13. Hemodynamic characteristics played an important indicative role in atherosclerotic lesions. Atherosclerotic arteries had a low flow rate, low shear stress, and a locally hypertensive, turbulent fluid environment. Vascular endothelial tissue could dynamically respond to changes in shear stress and affect the release of bioactive mediators through the mechanical transduction of transmembrane proteins in endothelial cells. All of these processes affected the structure and function of endothelial cells, changed the surrounding cellular environment, and induced atherosclerosis. Prolonged exposure to low shear stress in healthy arteries resulted in uneven arrangement of endothelial cells, broken cell connections, and infiltration of lipids and inflammatory mediators into endothelial cells. Sustained low shear stress reduced the concentration of vasodilators and antioxidants, thereby failing to activate the protective mechanisms of endothelial tissue and ultimately leading to atherosclerotic lesions. Low shear stress could also increase the expression of cell adhesion molecules, growth factors, vasoconstrictor oxidizing substances, proteolytic enzymes, and acute inflammatory mediators, which further aggravate the development of atherosclerosis.
4. Future Perspectives
The combination of hemodynamic analysis and pathological study not only provides an in-depth study of the mechanism of arterial lesions, but also provides a theoretical basis for the accurate prediction and treatment of vascular diseases. In the following research, the mathematical model will be improved on the basis of comparing the simulation results with the medical images based on big data.
Since there is currently no mature technology to directly observe and measure the details of blood flow characteristics in human arteries, this paper assumes that blood is an incompressible Newtonian fluid and the blood vessel wall is an impenetrable rigid tube wall. Compared with blood flow in actual blood vessels, the study results are only approximate theoretical results of blood flow processes. In future studies, the mathematical model should be optimized by comparing a large number of case sample data with the numerical simulation results, so that the simulation results can be more consistent with the existent cases.
The research reported in this paper has certain application value. The following two shortcomings, however, were also found in the study. First, the computer numerical simulation area is derived from the three-dimensional reconstruction of medical images. The acquisition and segmentation of medical images bring unavoidable errors. This affects the accuracy of the prediction results. Second, in computer numerical simulation, blood is assumed to be a single-phase Newtonian fluid, and the blood vessel wall is assumed to be a rigid body without deformation or a completely elastic body with uniform deformation. Both of these assumptions greatly simplify the actual situation, and also cause deviations between the calculated results and the actual situation.
5. Conclusions
The numerical simulation of blood flow in blood vessels is a combination of biomedical engineering, fluid mechanics, and computer science. This research can help visualize the physical mechanisms of blood flow, predict and evaluate the occurrence and development of cardiovascular diseases, and guide clinical treatment and surgical procedures.
A region with high flow velocity in the middle of the lumen and a region with low flow velocity in the secondary flow near the medial wall of the lumen could be found at the distal end of the stenosis in a single lesioned vessel; the flow rate was between 0.09 m/s and 0.15 m/s. Lower blood flow rates and overall shear stress levels in the region induce changes in fluid properties that were more suitable for lesion development. The shear stress here was all less than 20 Pa, which was 35–45% lower than the shear stress in normal blood vessels. Greater stenosis resulted in a lower flow velocity in the region of secondary flow caused by the vessel and a greater difference in flow velocity at the peak and trough of the cardiac cycle; the difference between the maximum and minimum values was greater than 1.5 m/s.
The bifurcation structure of the vessel posed a remarkable effect on the rheological properties of blood flow. The shear stress at the proximal and distal ends of normal blood vessels was about 20 Pa, while that at the proximal and distal ends of diseased blood vessels was about 80 Pa and 30 Pa, respectively. The shear stress in the downstream area of the fork was less than 10 Pa. Very low shear stress was produced at the bifurcation site, creating a focal area of atherosclerosis. When a lesion occurred at the bifurcation site, a more pronounced mechanical environment with very low and oscillating tangential stresses was produced at the distal end. At this time, the shear stress at the distal end was between 1.3 Pa and 1.6 Pa. In comparison, at the lesion structure, blood pressure at the proximal end of the bifurcation site was considerably greater than that at the distal end, creating conditions for the detachment of the atheromatous lesion tissue, because of the greater shear stress experienced by the atheromatous tissue. The proximal blood flow rate was higher than 1.0 m/s, which was more than 30% higher than the normal blood vessel flow rate.
Low shear stress and high pressure difference were the main factors for atherosclerosis. The pressure difference between the two sides of the stenosis was greater than 900 Pa, compared with 150 Pa at the same distance in the healthy blood vessels. In the lesioned vessels, dramatic oscillatory changes could be produced by wall shear stress, and a remarkable increase in local blood pressure differential within the vessel was observed. Such phenomena were clearly different from the flow characteristics of healthy vessels. The difference in pressure between healthy and diseased blood vessels was very significant. Therefore, through the feedback mechanism of lesions on blood flow characteristics, numerical simulation of blood flow characteristics could be used to achieve the prediction and follow-up of atherosclerosis.
Blood flow parameters such as blood pressure and shear stress were obtained by numerical simulation. The simulation results were compared with a large sample of patient data to establish associations between these parameters and lesions. This approach was not limited to the prediction and diagnosis of atherosclerosis. It could also be used for prediction and diagnosis of other vascular diseases. Mathematical models could be built to accurately predict various vascular diseases by obtaining enough cases as samples to train mathematical models and boundary conditions. This would help doctors make accurate diagnoses and treatment plans quickly.
There were only few artery samples performed in this study. The sample size may not be enough to cover all cases. The coronary arterial wall was assumed as a rigid material to neglect deformations of the arterial wall initiating by heart pulsation, which deviates from the actual situation. The velocity inlet and pressure outlet settings also need to be verified by a large number of samples. In future studies, we will continue to increase the sample size of patients with coronary artery stenosis by age and sex to provide more accurate reference results.
Author Contributions
Conceptualization, L.G. and Y.L.; methodology, L.G.; software, Y.L.; validation, L.G.; data curation, Y.L.; writing—original draft preparation, Y.L.; writing—review and editing, L.G.; supervision, S.Z.; project administration, S.Z.; funding acquisition, L.G. All authors have read and agreed to the published version of the manuscript.
Funding
This research was funded by [2023 Natural Science Foundation of Hunan Province] grant number [2023JJ50452], [Key Laboratory of Intelligent Control Technology for Wuling-Mountain Ecological Agriculture in Hunan Province] grant number [ZNKZN2021-06].
Institutional Review Board Statement
Ethical approval not applicable.
Data Availability Statement
The data that supports the findings of this study are available within the article.
Conflicts of Interest
We declare that we have no financial and personal relationships with other people or organizations that can inappropriately influence our work; there is no professional or other personal interest of any nature or kind in any product, service, and/or company that could be construed as influencing the position presented in, or the review of the manuscript.
References
- Gijsen, F.J.; Schuurbiers, J.C.; van de Giessen, A.G.; Schaap, M.; van der Steen, A.F.; Wentzel, J.J. 3D reconstruction techniques of human coronary bifurcations for shear stress computations. J. Biomech. 2014, 47, 39–43. [Google Scholar] [CrossRef] [PubMed]
- Deplano, V.; Siouffi, M. Experimental and numerical study of pulsatile flows through stenosis: Wall shear stress analysis. J. Biomech. 1999, 32, 1081–1090. [Google Scholar] [CrossRef] [PubMed]
- Back, L.D.; Radbill, J.R.; Crawford, D.W. Analysis of pulsatile, viscous blood flow through diseased coronary arteries of man. J. Biomech. 1977, 10, 339–353. [Google Scholar] [CrossRef] [PubMed]
- Nematollahi, A.; Shirani, E.; Mirzaee, I.; Sadeghi, M. Numerical simulation of LDL particles mass transport in human carotid artery under steady state conditions. Sci. Iran. 2012, 19, 519–524. [Google Scholar] [CrossRef]
- Mpairaktaris, D.G.; Soulis, J.V.; Giannoglou, G. Unsteady LDL transport through patient-specific multi-layer left coronary artery. Int. J. Clin. Cardiol. Res. 2018, 2, 39–49. [Google Scholar]
- Fazli, S.; Shirani, E.; Sadeghi, M. Numerical simulation of LDL mass transfer in a common carotid artery under pulsatile flows. J. Biomech. 2011, 44, 68–76. [Google Scholar] [CrossRef]
- Liu, Y.J.; Qiao, A.K.; Zhu, H.W. Haemodynamics simulation of carotid artery bifurcation. Chin. J. Comput. Mech. 2004, 21, 475–480. [Google Scholar]
- Ma, R.Y.; Liu, Z.M.; Zhang, T. Influence on thrombus formation by blood flow in T-bifurcation of artery. J. Med. Biomech. 2009, 24, 102–108. [Google Scholar]
- Ji, F.; Wu, J.; Zhang, W.; Liu, B.; Sun, Y.; Ji, L.; Zhang, Z.; Jiang, S.; Wang, F. Modeling human vascular networks and estimation of central aortic pressure. Sci. Sin. Inf. 2013, 43, 964–981. [Google Scholar] [CrossRef][Green Version]
- Brown, A.J.; Teng, Z.; Evans, P.C.; Gillard, J.H.; Samady, H.; Bennett, M.R. Role of biomechanical forces in the natural history of coronary atherosclerosis. Nat. Rev. Cardiol. 2016, 13, 210–220. [Google Scholar] [CrossRef]
- Gharahi, H.; Zambrano, B.A.; Zhu, D.C.; DeMarco, J.K.; Baek, S. Computational fluid dynamic simulation of human carotid artery bifurcation based on anatomy and volumetric blood flow rate measured with magnetic resonance imaging. Int. J. Adv. Eng. Sci. Appl. Math. 2016, 8, 46–60. [Google Scholar] [CrossRef] [PubMed]
- Alimohammadi, M.; Pichardo-Almarza, C.; Agu, O.; Díaz-Zuccarini, V. Development of a patient-specific multi-scale model to understand atherosclerosis and calcification locations: Comparison with in vivo data in an aortic dissection. Front. Physiol. 2016, 7, 238. [Google Scholar] [CrossRef] [PubMed]
- Figueroa, C.A.; Vignon-Clementel, I.E.; Jansen, K.E.; Hughes, T.J.; Taylor, C.A. A coupled momentum method for modeling blood flow in three-dimensional deformable arteries. Comput. Methods Appl. Mech. Eng. 2015, 195, 5685–5706. [Google Scholar] [CrossRef]
- De Nisco, G.; Zhang, P.; Calò, K.; Liu, X.; Ponzini, R.; Bignardi, C.; Rizzo, G.; Deng, X.; Gallo, D.; Morbiducci, U. What is needed to make low-density lipoprotein transport in human aorta computational models suitable to explore links to atherosclerosis? Impact of initial and inflow boundary conditions. J. Biomech. 2018, 68, 33–42. [Google Scholar] [CrossRef]
- Santra, S.; Mandal, D.K.; Chakrabarti, S. Effect of pulsatile blood flow on LDL transport in arterial layers. Prog. Comput. Fluid Dyn. 2018, 18, 177–187. [Google Scholar] [CrossRef]
- Chen, J.; Gutmark, E.; Mylavarapu, G.; Backeljauw, P.F.; Gutmark-Little, I. Numerical investigation of mass transport through patient-specific deformed aortae. J. Biomech. 2014, 47, 544–552. [Google Scholar] [CrossRef]
- Kim, S.; Giddens, D.P. Mass transport of low density lipoprotein in reconstructed hemodynamic environments of human carotid arteries: The role of volume and solute flux through the endothelium. J. Biomech. Eng. 2015, 137, 041007. [Google Scholar] [CrossRef]
- Lei, Y.; Chen, M.; Xiong, G.; Chen, J. Low density lipoprotein and non-newtonian oscillating flow biomechanical parameters for normal human aorta. Cardiol. Res. 2016, 7, 66–79. [Google Scholar]
- Lei, Y.; Chen, M.; Xiong, G.L.; Chen, J. Influence of virtual intervention and blood rheology on mass transfer through thoracic aortic aneurysm. J. Biomech. 2015, 48, 3312–3322. [Google Scholar] [CrossRef]
- Lowe, G.D.O.; Lee, A.J.; Rumley, A.; Price, J.F.; Fowkes, F.G.R. Blood viscosity and risk of cardiovascular events: The Edinburgh Artery Study. Br. J. Haematol. 2015, 96, 168–173. [Google Scholar] [CrossRef]
- Prasad, A.; Clopton, P.; Ayers, C.; Khera, A.; De Lemos, J.A.; Witztum, J.L.; Tsimikas, S. Relationship of autoantibodies to MDA-LDL and APOB-immune complexes to sex, ethnicity, subclinical Atherosclerosis, and cardiovascular Events. Arterioscler. Thromb. Vasc. Biol. 2017, 37, 1213–1221. [Google Scholar] [CrossRef] [PubMed]
- Ding, Z.; Liu, S.; Sun, C.; Chen, Z.; Fan, Y.; Deng, X.; Wang, X.; Mehta, J.L. Concentration polarization of ox-LDL activates autophagy and apoptosis via regulating LOX-1 expression. Sci. Rep. 2013, 3, 2091. [Google Scholar] [CrossRef] [PubMed]
- Vázquez, F.J.; Grande-Ratti, M.F.; Zapiola, M.E.; Giunta, D.; Posadas-Martinez, M.L. Hospitalization for venous thromboembolic disease management: A 10 years Registry in Buenos Aires, Argentina. J. Thromb. Thrombolysis 2021, 52, 1187–1194. [Google Scholar] [CrossRef] [PubMed]
- Ong, C.W.; Wee, I.; Syn, N.; Ng, S.; Leo, H.L.; Richards, A.M.; Choong, A.M. Computational Fluid Dynamics Modeling of Hemodynamic Parameters in the Human Diseased Aorta: A Systematic Review. Ann. Vasc. Surg. 2020, 63, 336–381. [Google Scholar] [CrossRef]
- Chaudhary, R.; Sharma, T.; Tantry, U.S.; Asgar, J.A.; Kundan, P.; Duhan, S.; Gill, H.; Singh, A.; Alasadi, Y.; Gurbel, P.A.; et al. Serial assessment of thrombogenicity and hemodynamics in patients with type II diabetes in a clinical research unit: Evidence for circadian variations in clot formation. J. Thromb. Thrombolysis 2022, 54, 393–400. [Google Scholar] [CrossRef]
- Girfoglio, M.; Ballarin, F.; Infantino, G.; Nicoló, F.; Montalto, A.; Rozza, G.; Scrofani, R.; Comisso, M.; Musumeci, F. Non-intrusive PODI-ROM for patient-specific aortic blood flow in presence of a LVAD device. Med. Eng. Phys. 2022, 107, 103849. [Google Scholar] [CrossRef]
- Benčević, M.; Galić, I.; Habijan, M.; Pižurica, A. Recent Progress in Epicardial and Pericardial Adipose Tissue Segmentation and Quantification Based on Deep Learning: A Systematic Review. Appl. Sci. 2022, 12, 5217. [Google Scholar] [CrossRef]
- Moneke, I.; Ogutur, E.D.; Kalbhenn, J.; Hettich, I.; Passlick, B.; Jungraithmayr, W.; Senbaklavaci, O. Independent risk factors for an increased incidence of thromboembolism after lung transplantation. J. Thromb. Thrombolysis 2023, 55, 252–262. [Google Scholar] [CrossRef]
- Chen, B.-S.; Wu, R.-C.; Liu, P.-H. Restenosis Investigation of Two-Stent Placement in the Artery Bifurcation with Different Stenting Techniques Using Computational Fluid Dynamics Analysis. Appl. Sci. 2023, 13, 4694. [Google Scholar] [CrossRef]
Figure 1.
Carotid artery medical imaging and 3D imaging. (a) CT image. (b) Angiographic stereoscopic imaging.
Figure 1.
Carotid artery medical imaging and 3D imaging. (a) CT image. (b) Angiographic stereoscopic imaging.
Figure 2.
Carotid artery blood pressure and blood flow boundary condition settings.
Figure 2.
Carotid artery blood pressure and blood flow boundary condition settings.
Figure 3.
Distribution of blood flow lines in a single vessel during a cardiac cycle.
Figure 3.
Distribution of blood flow lines in a single vessel during a cardiac cycle.
Figure 4.
Influence of protruded plaques on the secondary flows in different cross sections.
Figure 4.
Influence of protruded plaques on the secondary flows in different cross sections.
Figure 5.
The change of resistance ratio with the degree of stenosis. (a) Healthy blood vessel. (b) Diseased vessel.
Figure 5.
The change of resistance ratio with the degree of stenosis. (a) Healthy blood vessel. (b) Diseased vessel.
Figure 6.
Shear stress distribution between the stenosis sites in the healthy and lesioned vessels. (a) Distribution of shear stress at 0.3 s in the stenosis site of the healthy vessel. (b) Distribution of shear stress at 0.3 s in the stenosis site of the lesioned vessel.
Figure 6.
Shear stress distribution between the stenosis sites in the healthy and lesioned vessels. (a) Distribution of shear stress at 0.3 s in the stenosis site of the healthy vessel. (b) Distribution of shear stress at 0.3 s in the stenosis site of the lesioned vessel.
Figure 7.
Shear stress variations in stenosis sites of healthy and lesioned vessels. (a) Shear stress extremes at the proximal end of healthy vessels. (b) Shear stress extremes at the proximal end of lesioned vessels. (c) Shear stress extremes at the stenosis site of the healthy vessels. (d) Shear stress extremes at the stenosis site of the lesioned vessels. (e) Shear stress extremes at the distal end of healthy vessels. (f) Shear stress extremes at the distal end of lesioned vessels.
Figure 8.
Distribution of shear stress in healthy carotid bifurcation vessels. (a) Distribution of shear stress at t = 0.15 s. (b) Distribution of shear stress at t = 0.30 s.
Figure 8.
Distribution of shear stress in healthy carotid bifurcation vessels. (a) Distribution of shear stress at t = 0.15 s. (b) Distribution of shear stress at t = 0.30 s.
Figure 9.
Distribution of pressure in healthy bifurcated coronary vessels. (a) Distribution of pressure at t = 0.15 s. (b) Distribution of pressure at t = 0.30 s.
Figure 9.
Distribution of pressure in healthy bifurcated coronary vessels. (a) Distribution of pressure at t = 0.15 s. (b) Distribution of pressure at t = 0.30 s.
Figure 10.
Comparison of blood flow rates in lesioned and healthy vessels.
Figure 10.
Comparison of blood flow rates in lesioned and healthy vessels.
Figure 11.
Diagram of maximum shear stress in diseased and healthy blood vessels. (a) Shear stress in sections 3, 4, and 5 of the diseased vessels. (b) Shear stress in sections 3, 4, and 5 of healthy blood vessels.
Figure 11.
Diagram of maximum shear stress in diseased and healthy blood vessels. (a) Shear stress in sections 3, 4, and 5 of the diseased vessels. (b) Shear stress in sections 3, 4, and 5 of healthy blood vessels.
Figure 12.
Diagram of minimum shear stress in diseased and healthy blood vessels. (a) Shear stress in sections 3, 4, and 5 of the diseased vessels. (b) Shear stress in sections 3, 4, and 5 of healthy blood vessels.
Figure 12.
Diagram of minimum shear stress in diseased and healthy blood vessels. (a) Shear stress in sections 3, 4, and 5 of the diseased vessels. (b) Shear stress in sections 3, 4, and 5 of healthy blood vessels.
Figure 13.
The process of tissue formation in atherosclerotic lesions.
Figure 13.
The process of tissue formation in atherosclerotic lesions.
Table 1.
Comparison of simulated results and measured data.
Table 1.
Comparison of simulated results and measured data.
| Item | Reference Value | Male (38 Cases) | Female (24 Cases) |
|---|
| Detected Value | Simulation Value | Error | Detected Value | Simulation Value | Error |
|---|
| Heart rate (HR) | 60–100 B/min | 69.38 ± 7.49 | 75 | +8.10% | 68.63 ± 8.06 | 75 | +9.28% |
| Cardiac output (CO) per minute | 4–9 L/min | 5.35 ± 0.87 | 4.93 | −7.85% | 4.53 ± 0.98 | 4.93 | +8.83% |
| Pre-ejection period (PEP) | 0.05–0.12 s | 0.10 ± 0.02 | 0.11 | +10% | 0.10 ± 0.02 | 0.11 | +10% |
| Left ventricular ejection time (LVET) | 0.24–0.40 s | 0.33 ± 0.04 | 0.35 | +6.11% | 0.36 ± 0.04 | 0.35 | −2.78% |
| Mean artery pressure (MAP) | <114 mmHg | 91.67 ± 10.61 | 91.12 | −0.61% | 90.04 ± 11.00 | 91.12 | +1.19% |
| Disclaimer/Publisher’s Note: The statements, opinions and data contained in all publications are solely those of the individual author(s) and contributor(s) and not of MDPI and/or the editor(s). MDPI and/or the editor(s) disclaim responsibility for any injury to people or property resulting from any ideas, methods, instructions or products referred to in the content. |
© 2025 by the authors. Licensee MDPI, Basel, Switzerland. This article is an open access article distributed under the terms and conditions of the Creative Commons Attribution (CC BY) license (https://creativecommons.org/licenses/by/4.0/).

