
Time Series Analysis of Mining-Induced Subsidence Using Small Baseline Subset Interferometric Synthetic Aperture Radar (Wanli Mining Area, Inner Mongolia, China)


Abstract
1. Introduction
2. Materials
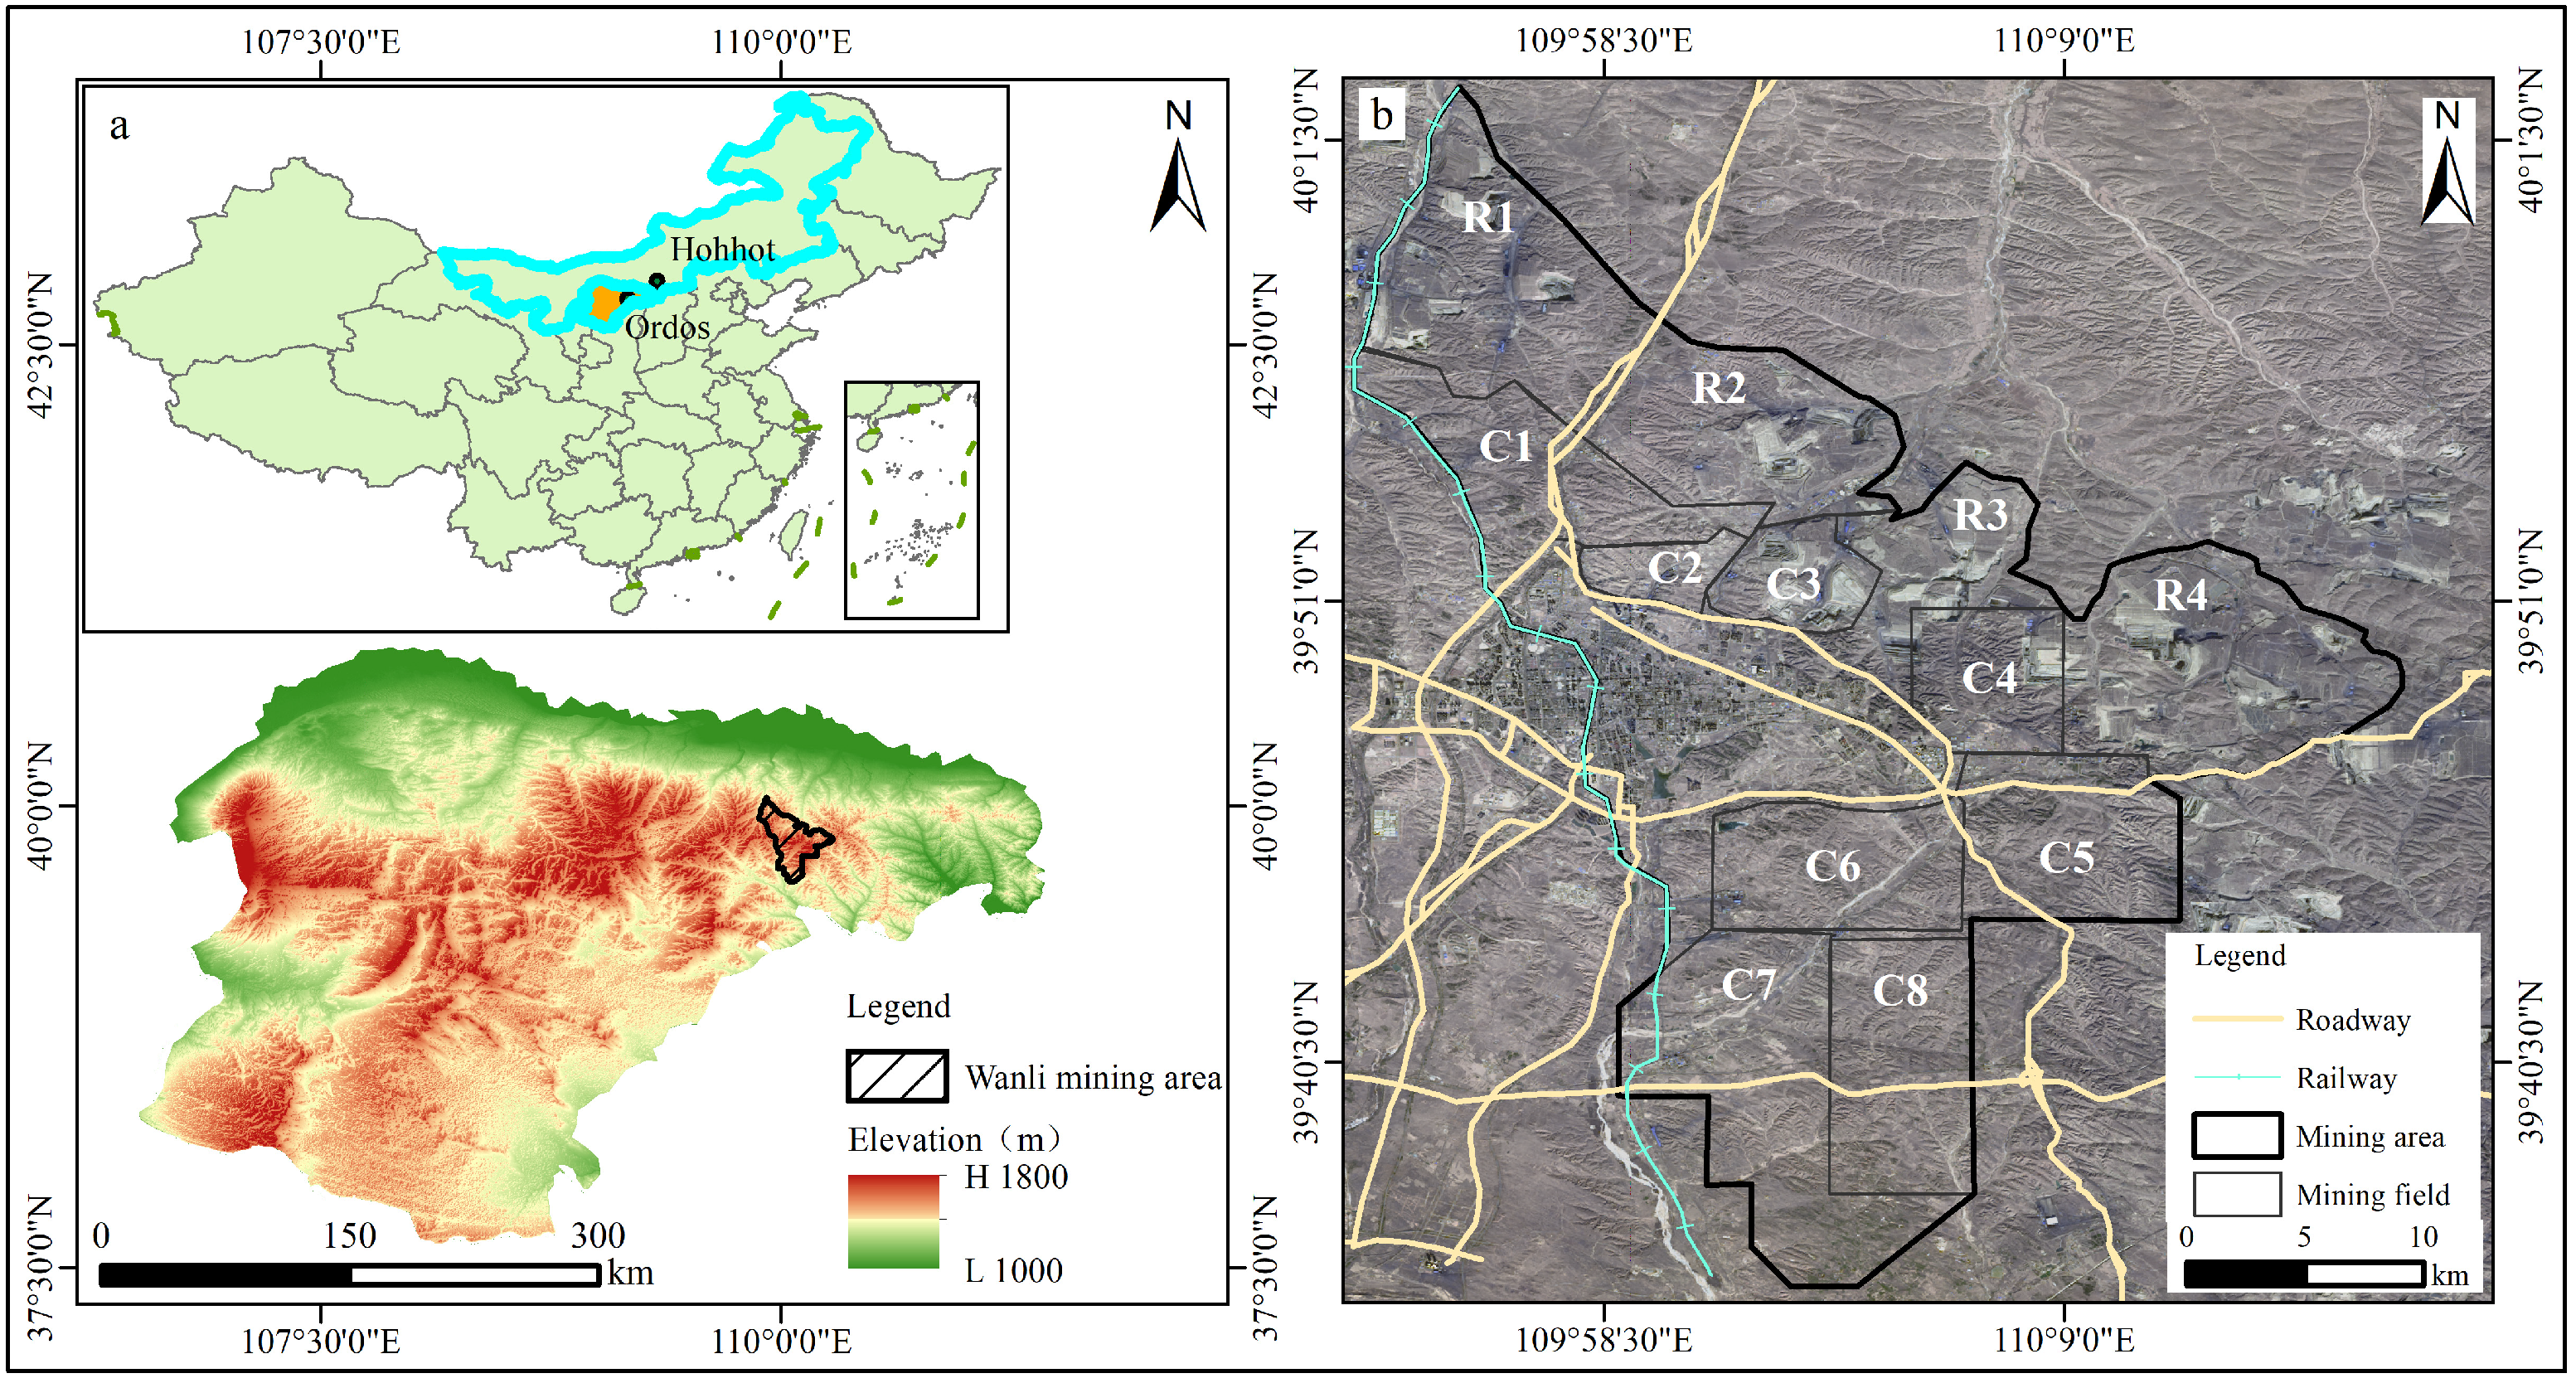
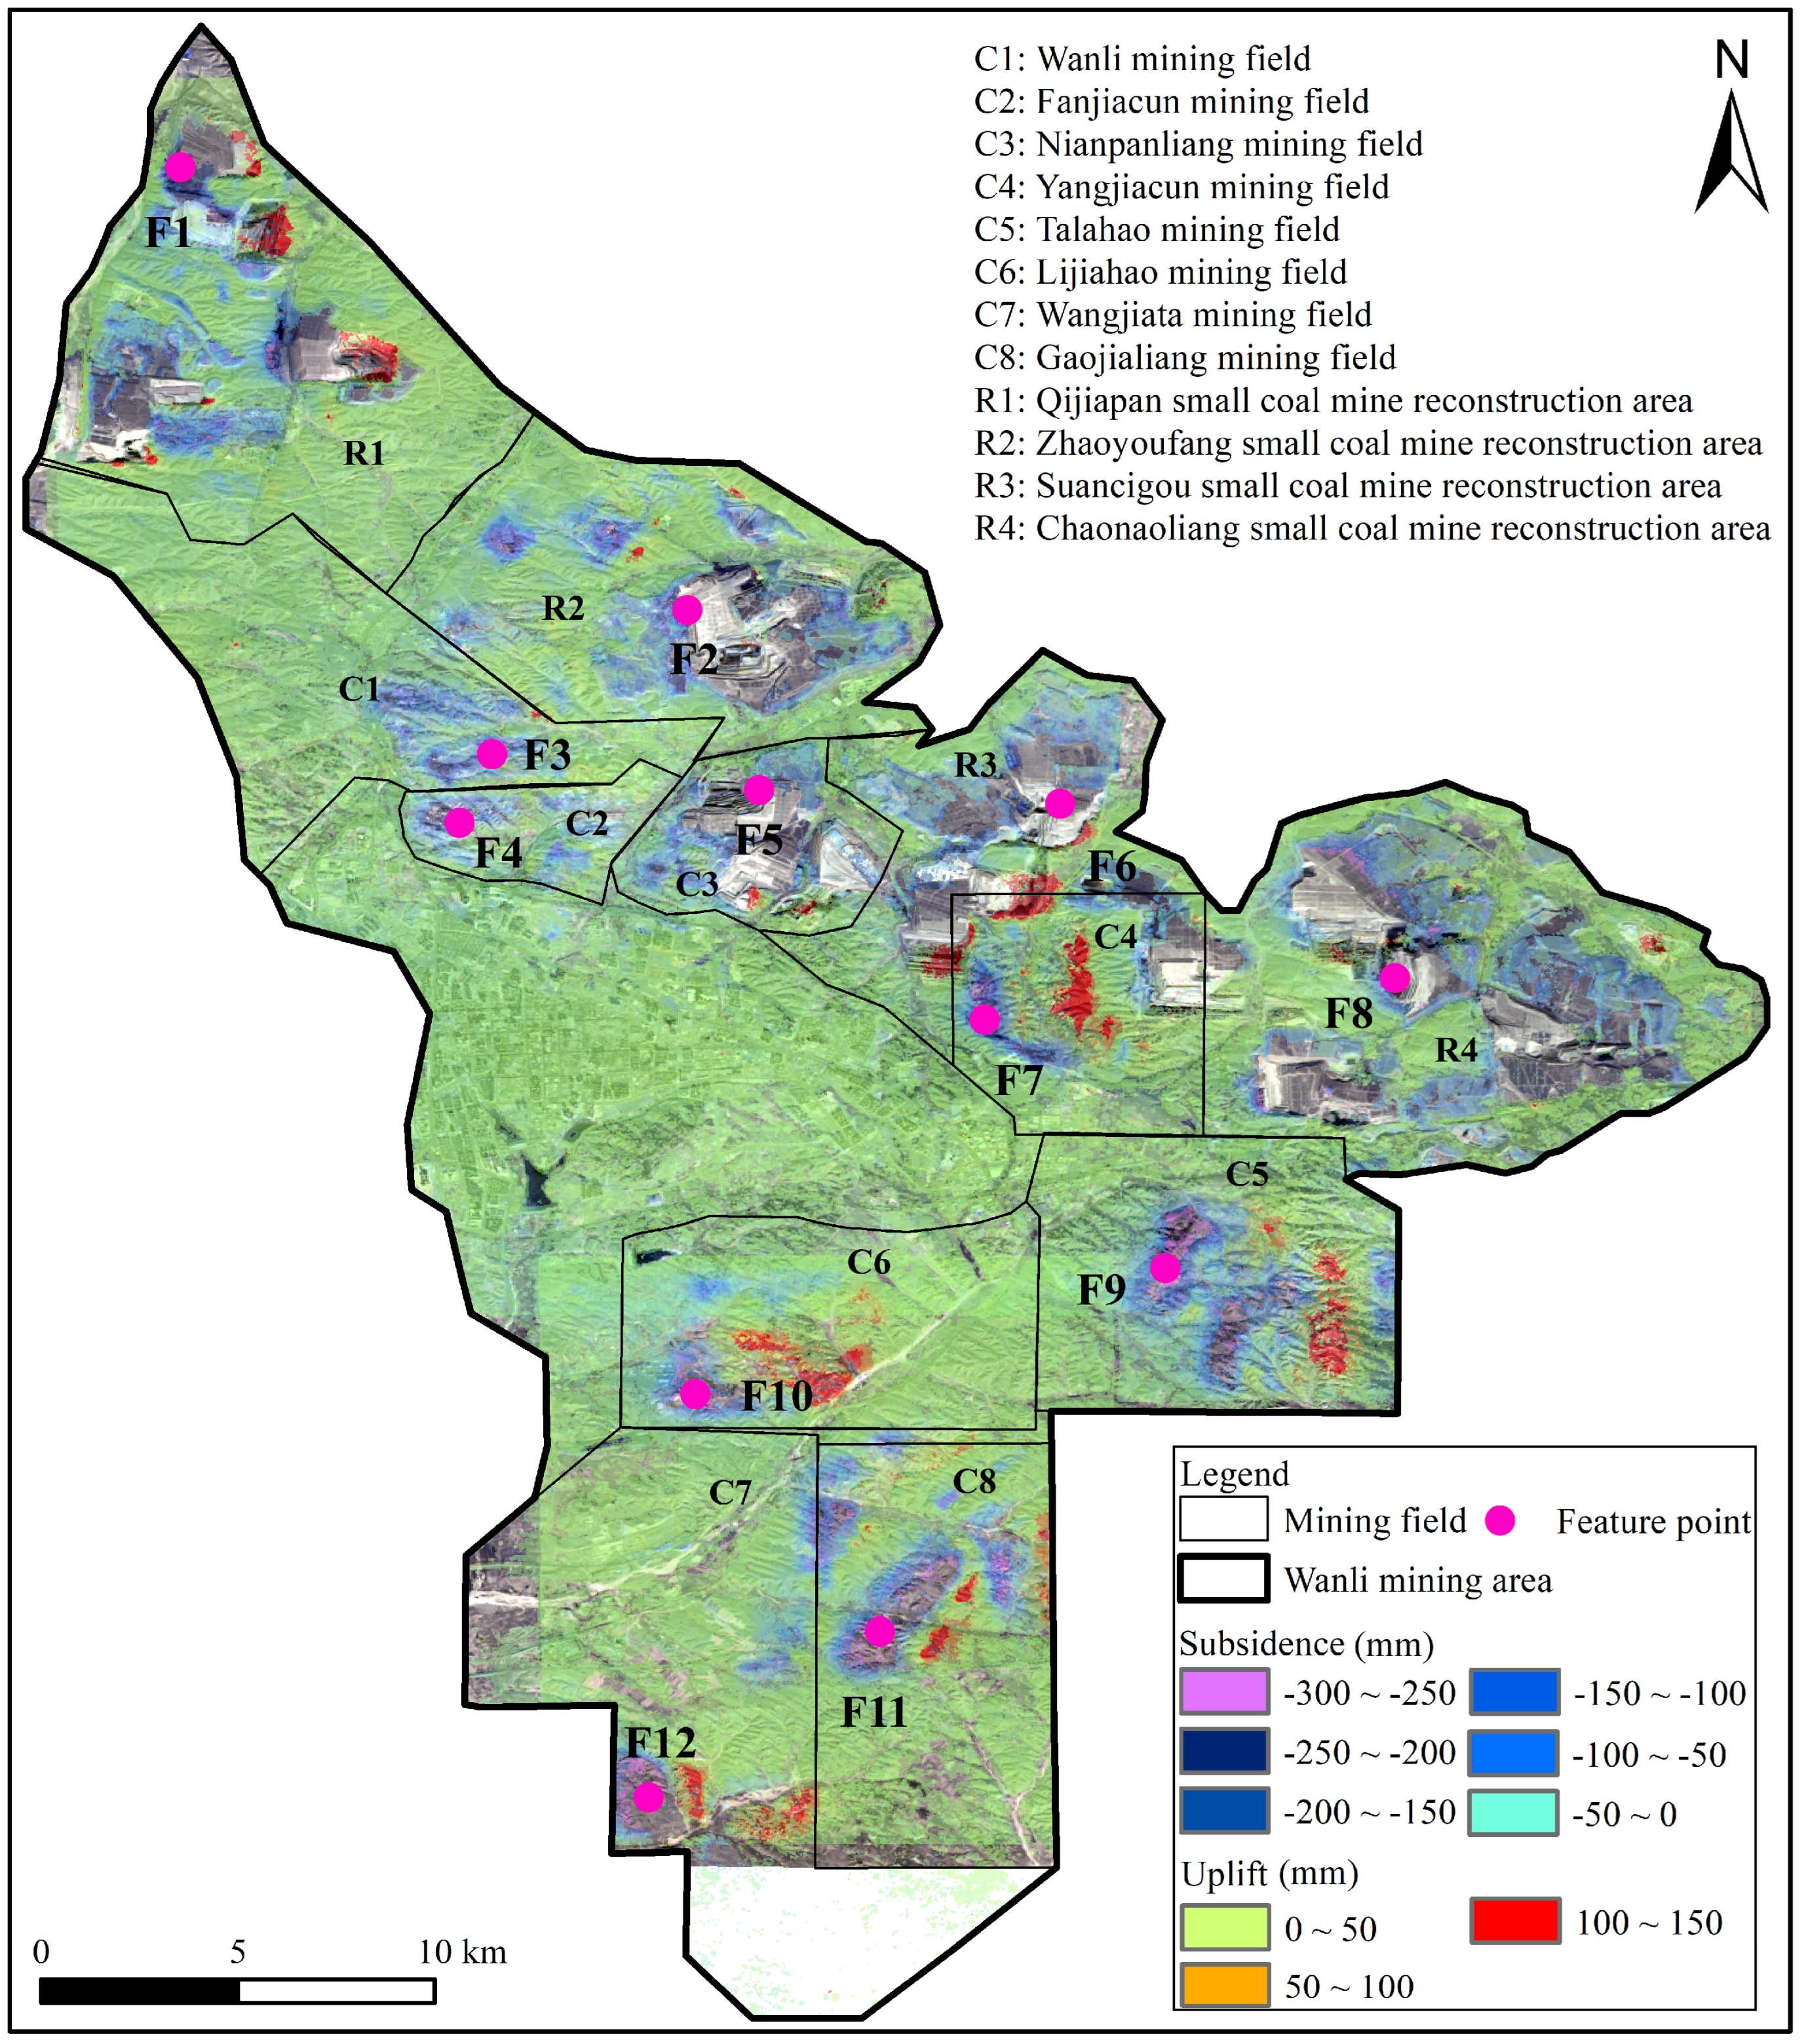
2.1. Study Area
2.2. Data
3. Methods
3.1. Principle of SBAS-InSAR
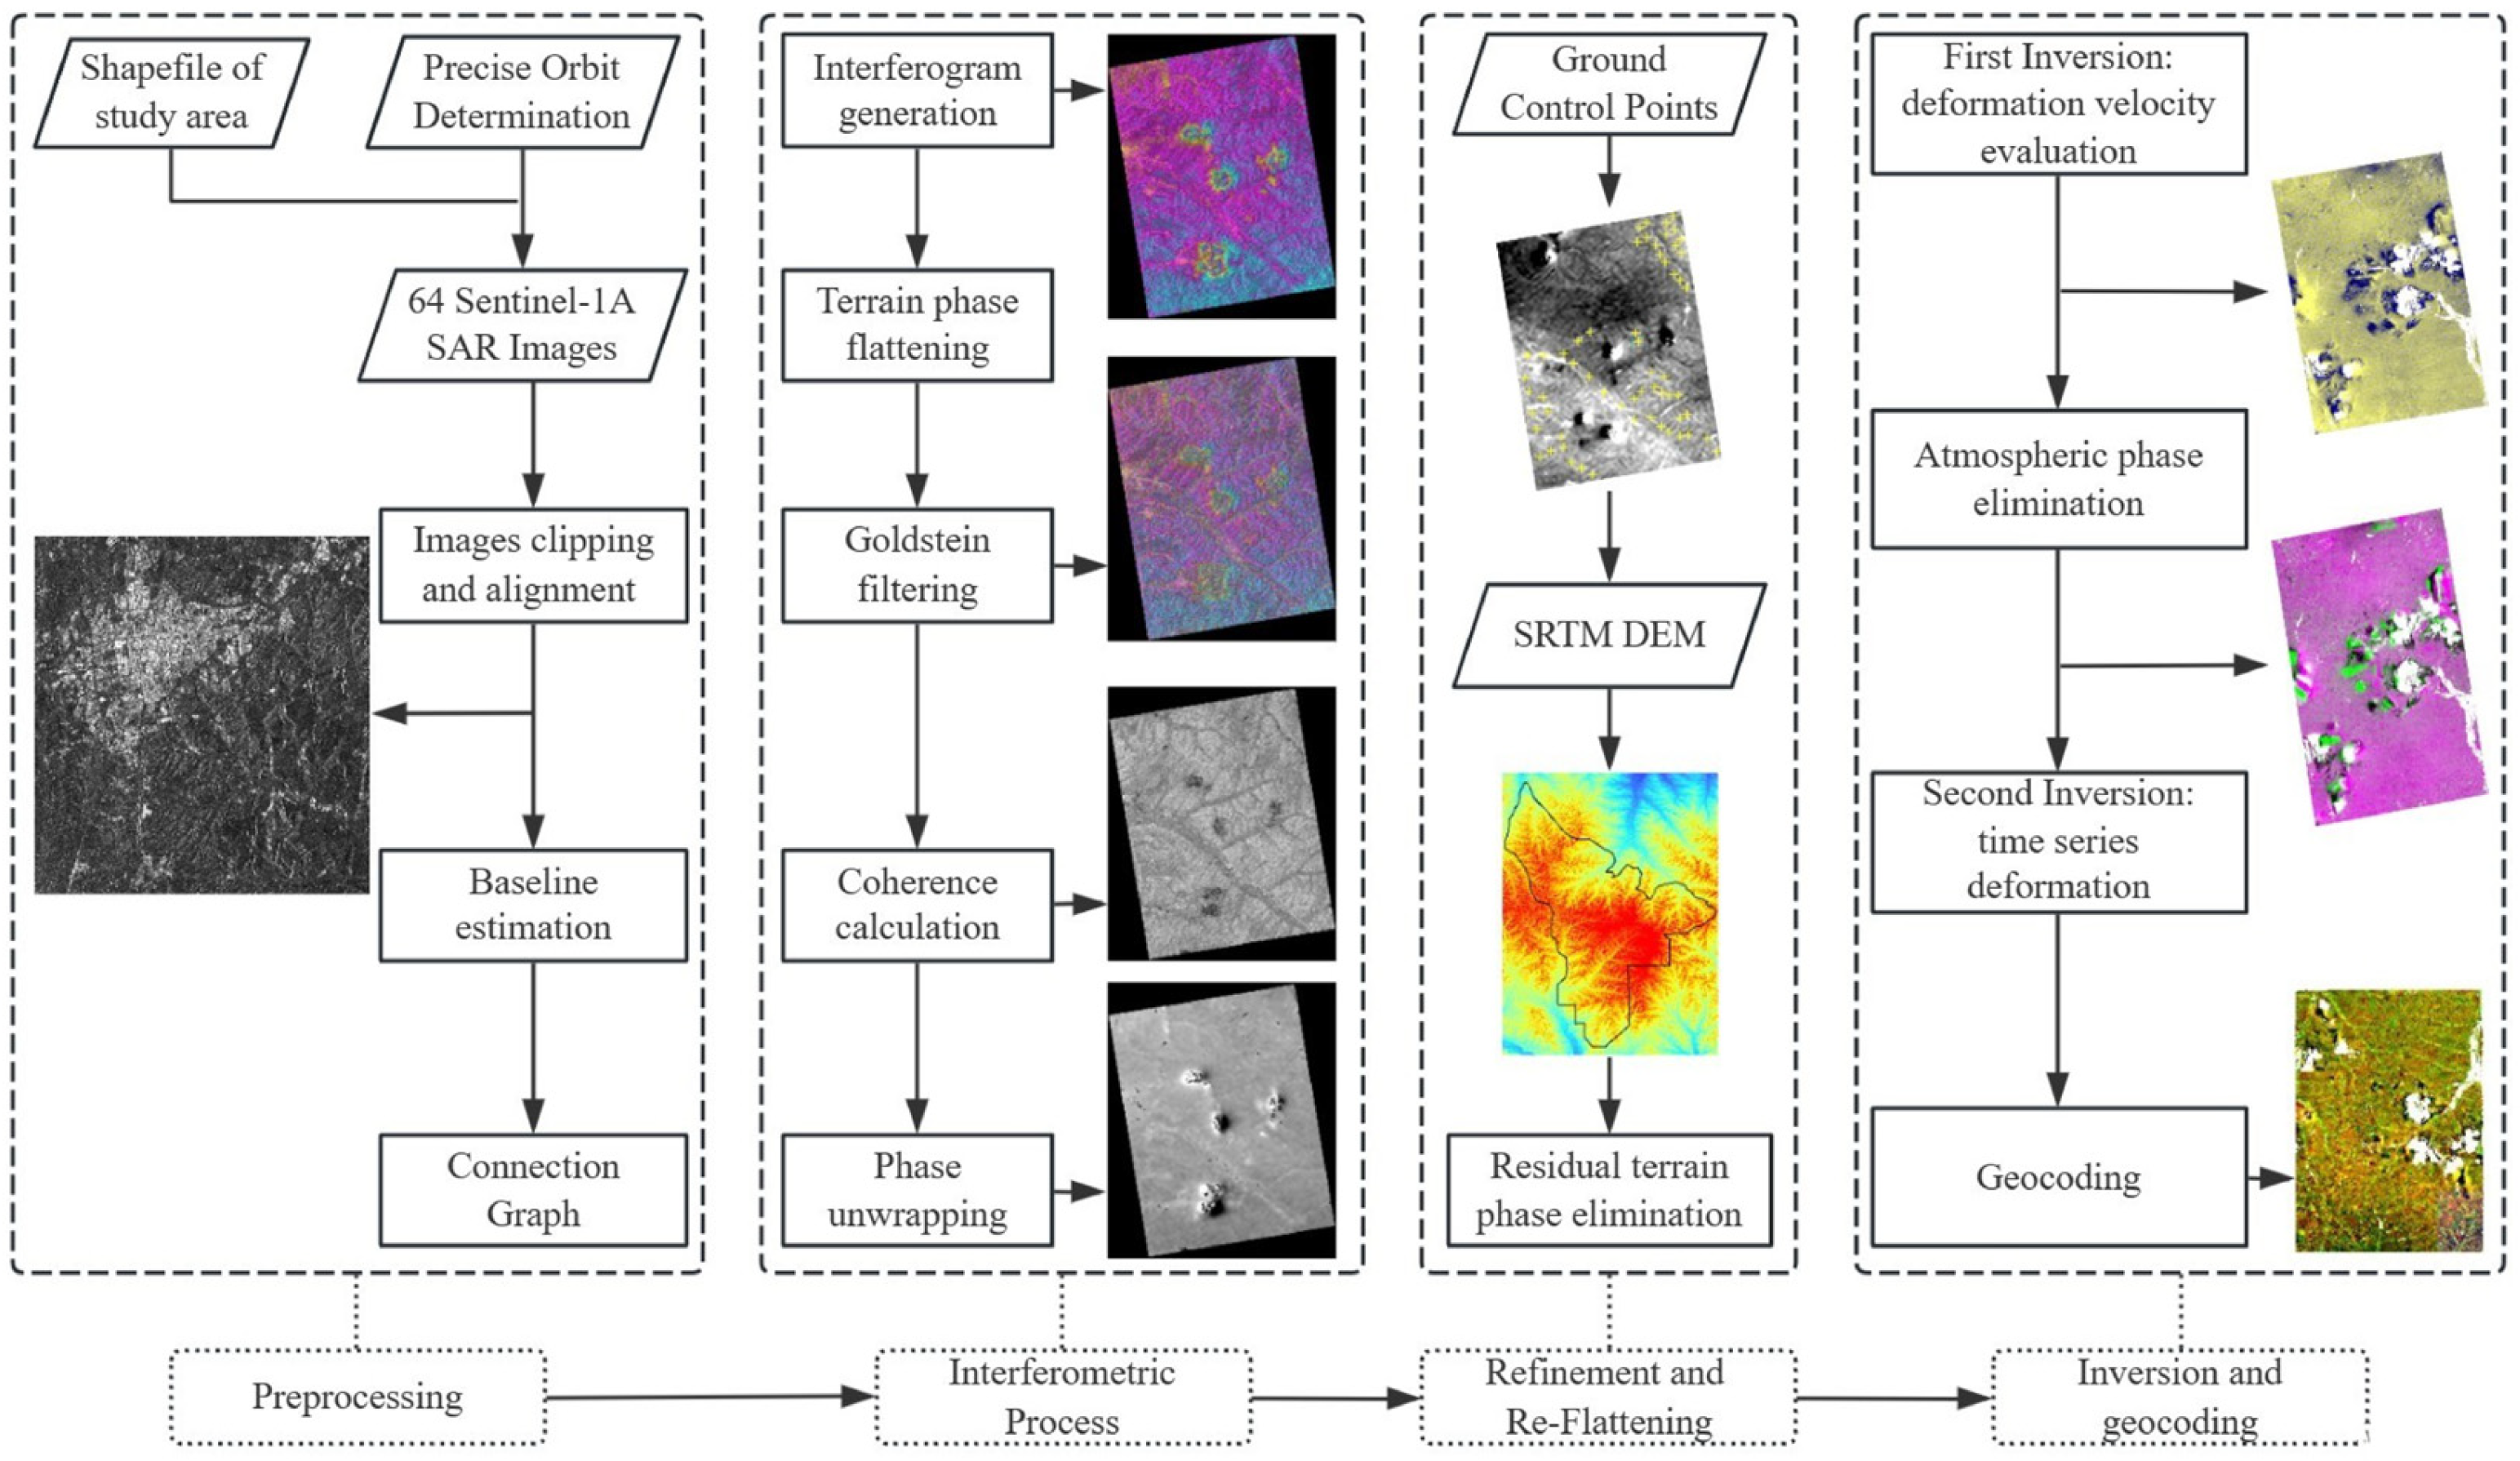
3.2. Data Processing
- (1)
- Preprocessing: The entire data processing workflow was performed using the SBAS-InSAR module in SARscape (version 5.2.1), developed by sarmap SA in Cascina, Switzerland. After configuring the initial environmental parameters, all SAR images were preprocessed (including cropping and registration) to prepare for the SBAS-InSAR analysis. Note that the polarization mode was set to the “VV” option due to its superior resistance to interference.
- (2)
- Connection graph: As the first step of SBAS-InSAR processing, 64 SAR images are supposed to be divided into a number of interference image pairs according to the thresholds of the time and space baselines. Specifically, the more image pairs there are, the more reliable the deformation results become, and the longer the data processing takes accordingly. In this study, we set the threshold of space baseline to 45% of the max space baseline and the threshold of time baseline to 120 days. Eventually, a SAR image from 26 February 2019 was selected as the super master image and 605 interference image pairs were acquired in total (Figure 3).
- (3)
- Interferometric process: In this stage, the above-mentioned interference image pairs were all subjected to an array of interference processing. Initially, all interference image pairs were aligned with the super master image. Afterwards, the SRTM DEM covering the study area was imported as assistance data, accomplishing the steps of interferogram generation, terrain phase flattening, Goldstein filtering, coherence calculation, and Minimum Cost Flow (MCF) phase unwrapping, in consecutive order [38].
- (4)
- Refinement and re-flattening: According to the Ground Control Points (GCPs) and Precise Orbit Determination (POD) ephemeris data, this step aims to estimate and eliminate the residual terrain phase and phase ramp after unwrapping. Crucially, at least 20 GCPs distributed uniformly in the study area were supposed to be selected at zones with few deformations [39].
- (5)
- Inversion: There are two steps to SBAS-InSAR inversion [40]. In the first step, deformation velocity and residual terrain phase were evaluated, which is the core of inversion. On the basis of deformation velocities, time series deformation results were captured, having experienced the estimation and elimination of the atmospheric phase by the Goldstein filtering method in the second step.

4. Results
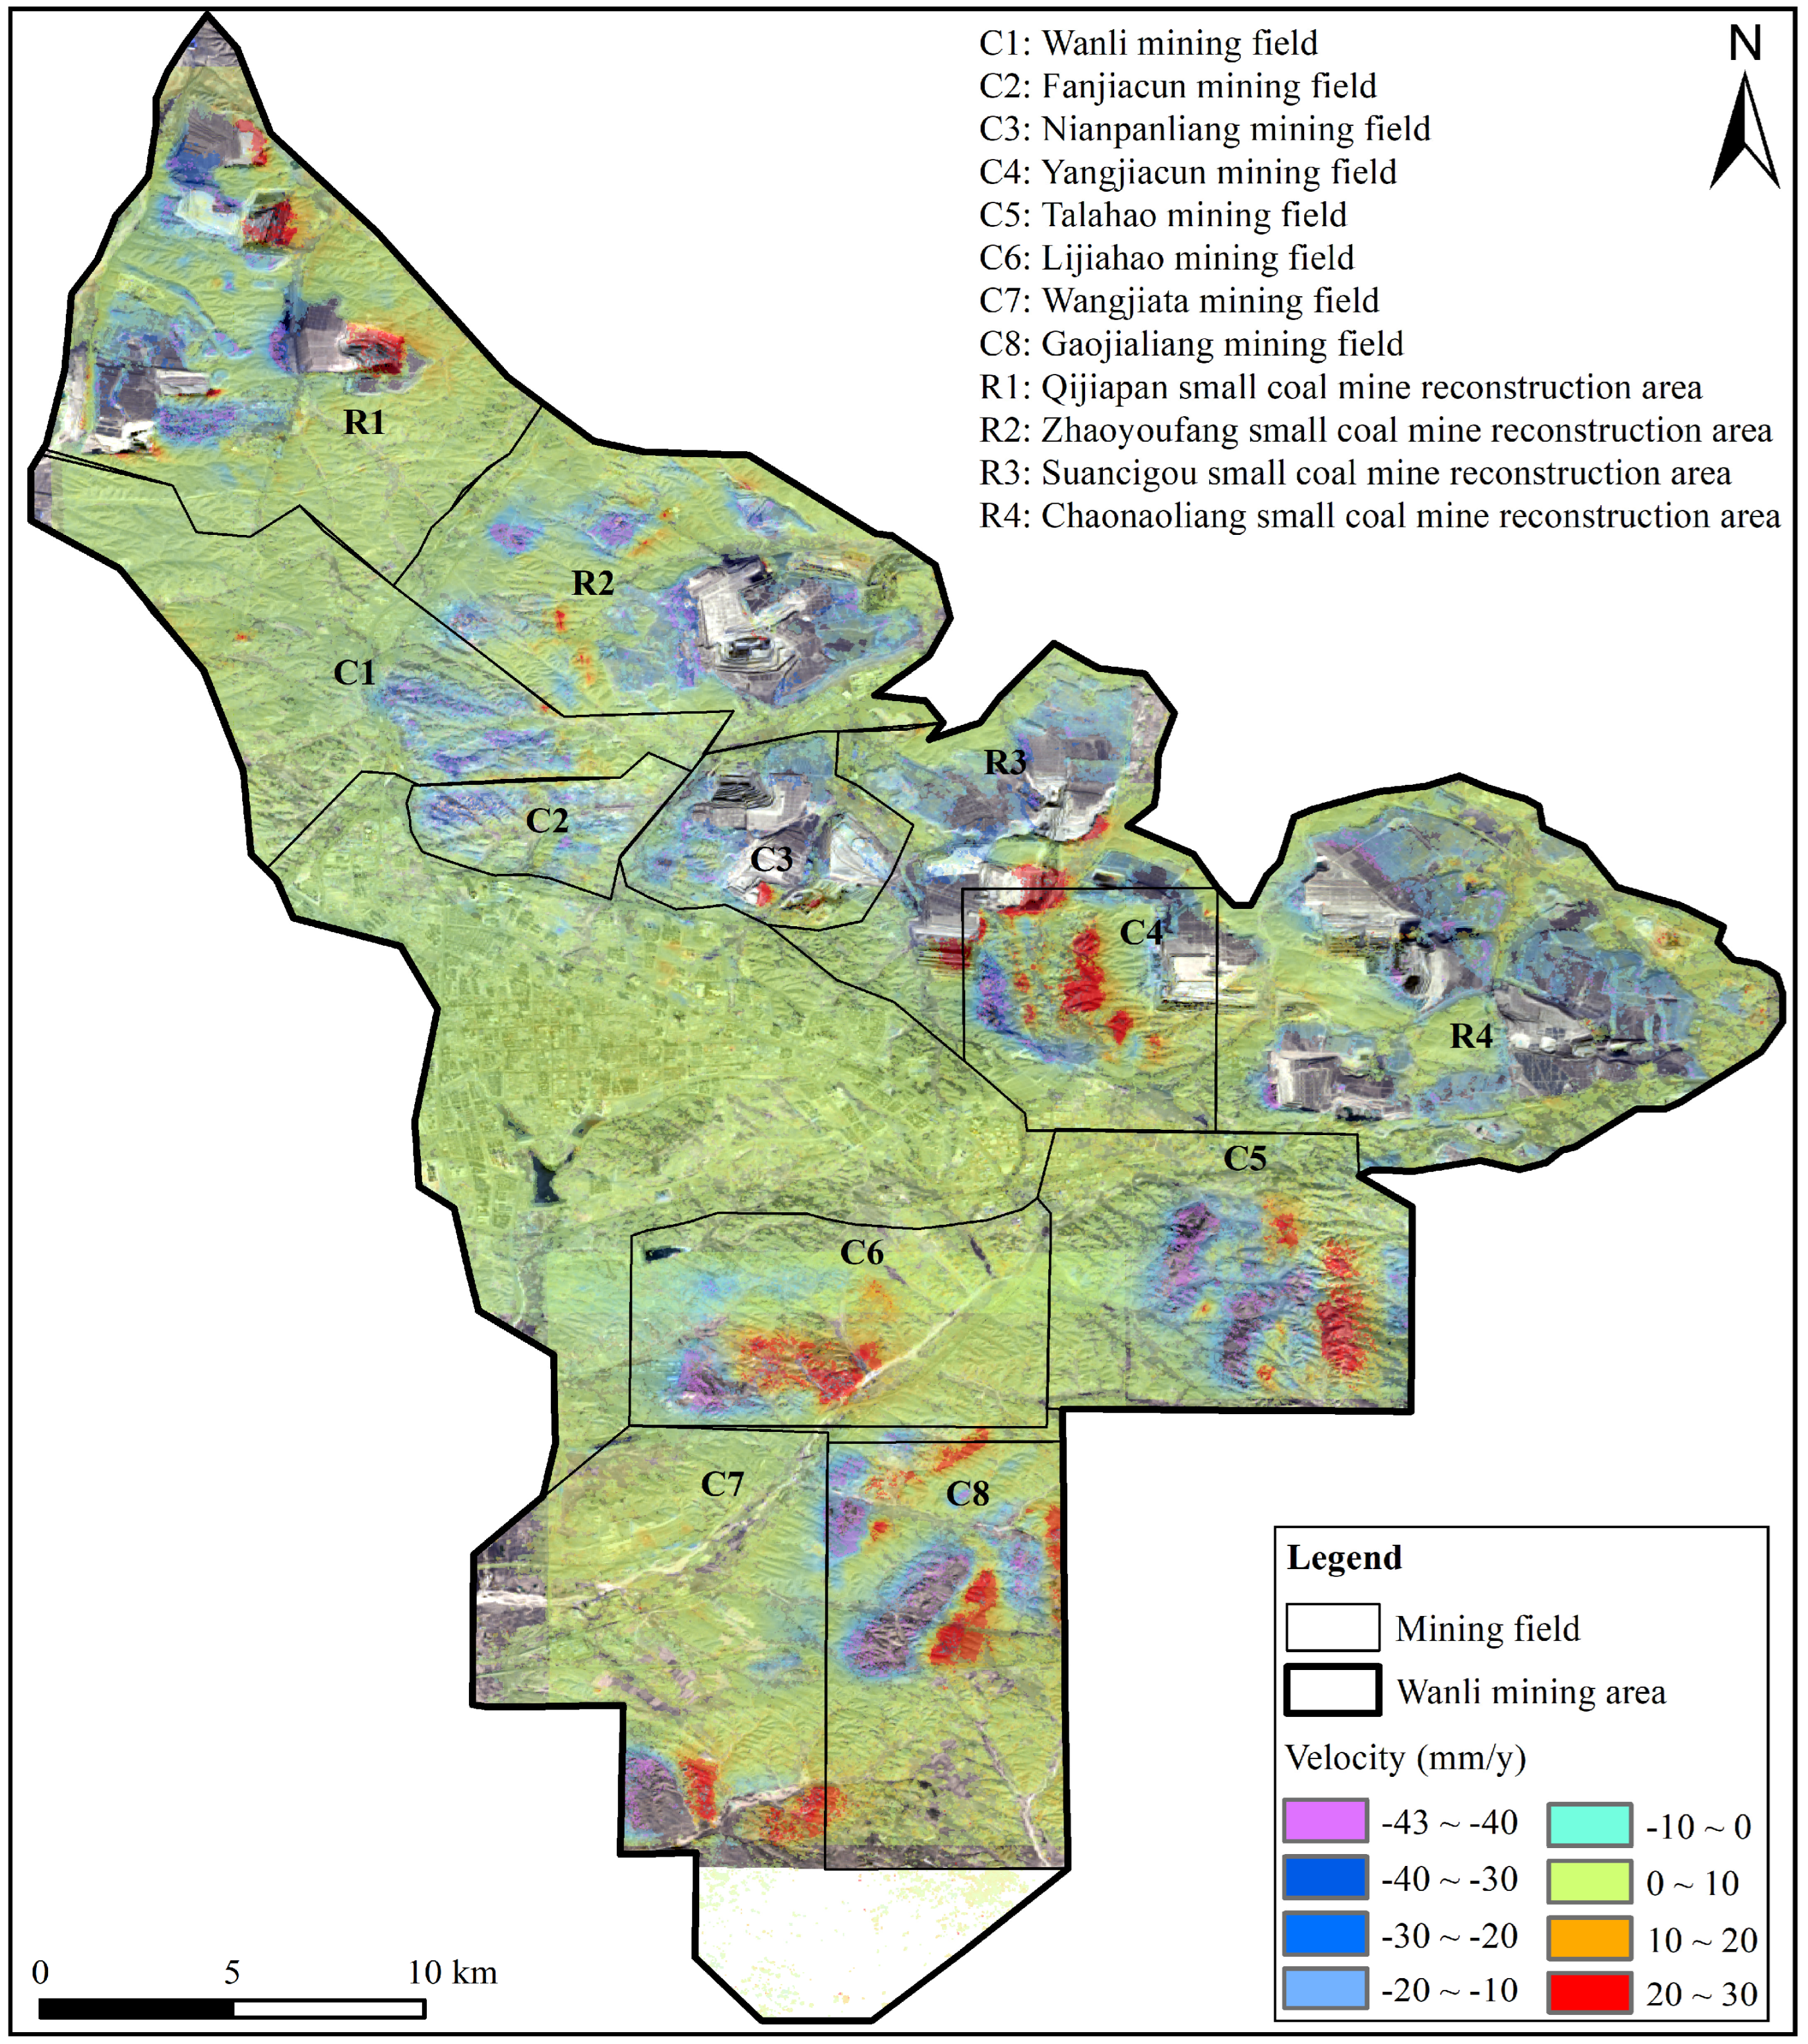
4.1. Spatial Distribution Characteristics of Surface Deformation
4.2. Annual Average Velocity of Surface Deformation
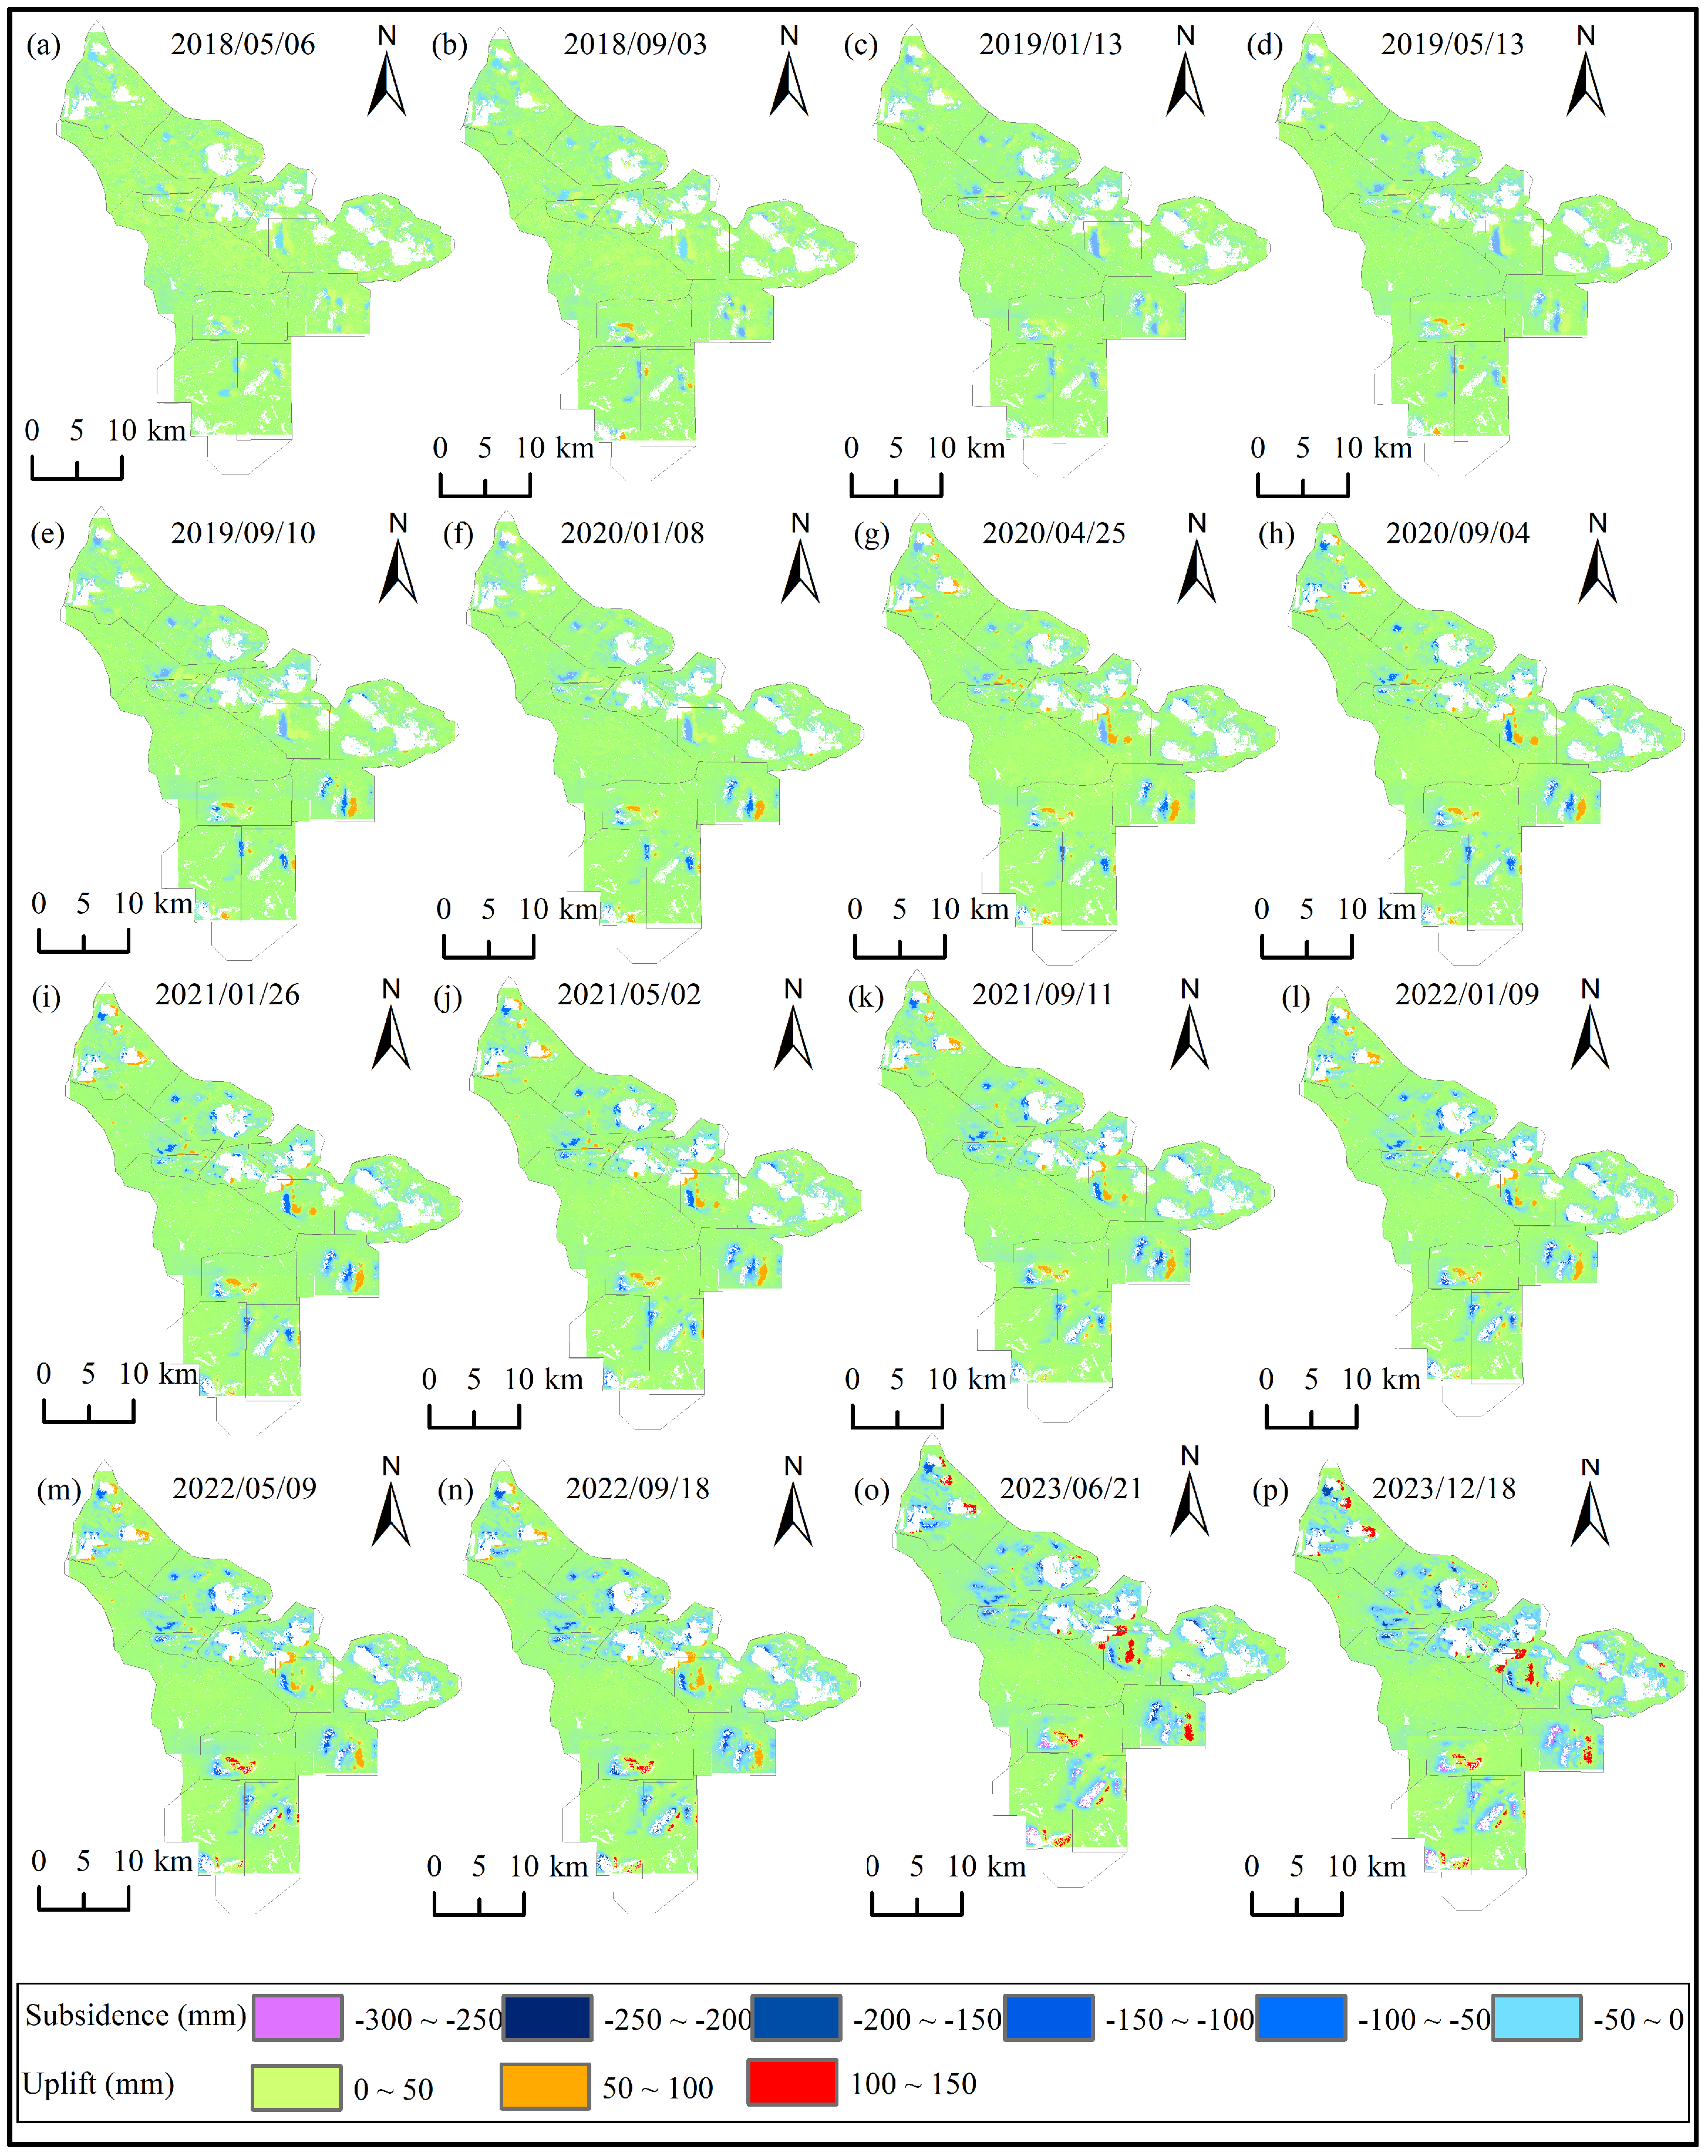
4.3. Time Series of Surface Deformation
4.4. Validation of SBAS-InSAR Monitoring Results
5. Discussion
6. Conclusions
- (1)
- The total area of subsidence during the monitoring period is 109.73 km2. Within these subsidence areas, the maximum cumulative subsidence is −283.41 mm, with the maximum surface subsidence velocity reaching −46.45 mm/y. Zone C7 is identified as the most severely affected area, with an average subsidence velocity of −11.08 mm/yr.
- (2)
- Twenty-nine ground fractures were identified, and they were concentrated along the borders of the monitored subsidence areas, where the surface slope is relatively steeper. Statistical analysis further revealed that the orientation of most ground fractures aligns with the tangential trend of the subsidence basin margin where they occur. These findings support the reliability of the SBAS-InSAR monitoring results. Moreover, the successful outcomes of this application can serve as a valuable reference for similar mining areas with complex topography.
- (3)
- The SBAS-InSAR monitoring results, including the distribution of subsidence zones, spatiotemporal evolution patterns, and subsidence trends, provide robust data to support policymaking for subsequent geological hazard mitigation and ecological conservation efforts in mining areas. Meanwhile, this study serves as a valuable reference for investigating surface subsidence patterns induced by coal mining across diverse geological conditions. However, due to inherent systematic errors and decorrelation effects, accurately quantifying subsidence rates in the central subsidence zones remains challenging, with potential measurement uncertainties. To address this limitation, future studies should combine traditional subsidence monitoring methods to implement targeted, high-precision observations in critical areas. This combined approach will not only ensure the acquisition of high-accuracy data meeting project requirements but also optimize cost efficiency in monitoring operations.
Author Contributions
Funding
Data Availability Statement
Acknowledgments
Conflicts of Interest
References
- Wang, S.; Liu, L.; Zhu, M. New way for green and low-carbon development of coal industry under the target of “daul-carbon”. J. China Coal Soc. 2024, 49, 152–171. [Google Scholar] [CrossRef]
- Soni, R.; Alam, S.M.; Vishwakarma, K.G. Prediction of InSAR deformation time-series using improved LSTM deep learning model. Sci. Rep. 2025, 15, 5333. [Google Scholar] [CrossRef]
- Hao, Q.; Zheng, Q.; Liu, S.; Hao, W.; Wu, X. Study on the Influence of Grouting Treatment on the Movement and Deformation of Surface in Longwall Coal Mining Goaf Areas. Mining Metall. Explor. 2024, 41, 1835–1858. [Google Scholar] [CrossRef]
- Bell, F.G.; Stacey, T.R.; Genske, D.D. Mining subsidence and its effect on the environment: Some differing examples. Environ. Geol. 2000, 40, 135–152. [Google Scholar] [CrossRef]
- Marín, M.R.; Sillerico, E.; Ezquerro, P.; Marchamalo, M.; Herrera, G.; Duro, J. Monitoring ground subsidence in urban environments: M-30 tunnels under Madrid City (Spain). Ing. Investig. 2015, 35, 30–35. [Google Scholar] [CrossRef]
- Cheng, J.; Wang, Z.; Li, S. Subsurface strata failure and movement based for improving gas emission control: Model development and application. Energy Sci. Eng. 2020, 8, 3285–3302. [Google Scholar] [CrossRef]
- Hrysiewicz, A.; Williamson, J.; Evans, D.C. Estimation and validation of InSAR-derived surface displacements at temperate raised peatlands. Remote Sens. Environ. 2024, 311, 114232. [Google Scholar] [CrossRef]
- Guillaume, M.; Cécile, D.; Frédéric, M. Time evolution of mining-related residual subsidence monitored over a 24-year period using InSAR in southern Alsace, France. Int. J. Appl. Earth Obs. Geoinf. 2021, 102, 102392. [Google Scholar] [CrossRef]
- Luo, P.; Jin, X.; Nie, D.; Liu, Y.; Wei, Y. Deformation Monitoring Based on SBAS-InSAR and Leveling Measurement: A Case Study of the Jing-Mi Diversion Canal in China. Sensors 2024, 24, 3871. [Google Scholar] [CrossRef]
- Li, Y.; Yang, K.; Yao, S.; Li, T. A DTSD model based on PS-InSAR surface multi-type deformation monitoring of villages in the mining area. Adv. Space Res. 2024, 74, 2042–2061. [Google Scholar] [CrossRef]
- Hu, L.; Tang, X.; Tomás, R.; Li, T.; Zhang, X.; Li, Z.; Yao, J.; Lu, J. Monitoring surface deformation dynamics in the mining subsidence area using LT-1 InSAR interferometry: A case study of Datong, China. Int. J. Appl. Earth Obs. Geoinf. 2024, 131, 103936. [Google Scholar] [CrossRef]
- Wempen, M.J.; McCarter, K.M. Comparison of L-band and X-band differential interferometric synthetic aperture radar for mine subsidence monitoring in central Utah. Int. J. Min. Sci. Technol. 2017, 27, 159–163. [Google Scholar] [CrossRef]
- Zhang, K.; Wang, Y.; Du, S.; Zhao, F.; Wang, T.; Zhang, N.; Zhou, D.; Diao, X. A Goaf-Locating Method Based on the D-InSAR Technique and Stratified Okada Dislocation Model. Remote Sens. 2024, 16, 2741. [Google Scholar] [CrossRef]
- Babaee, S.; Khalili, M.A.; Chirico, R.; Sorrentino, A.; Martire, D. Spatiotemporal characterization of the subsidence and change detection in Tehran plain (Iran) using InSAR observations and Landsat 8 satellite imagery. Remote Sens. Appl. Soc. Environ. 2024, 36, 101290. [Google Scholar] [CrossRef]
- Chen, Y.; Guo, L.; Xu, J.; Yang, Q.; Wang, H.; Zhu, C. Monitoring and Cause Analysis of surface subsidence along the Yangtze River Utilizing Time-Series InSAR. ISPRS Int. J. Geo-Inf. 2024, 13, 230. [Google Scholar] [CrossRef]
- Motagh, M.; Shamshiri, R.; Haghighi, H.M.; Wetzel, H.; Akbari, B.; Nahavandchi, H.; Roessner, S.; Arabi, S. Quantifying groundwater exploitation induced subsidence in the Rafsanjan plain, southeastern Iran, using InSAR time-series and in situ measurements. Eng. Geol. 2017, 218, 134–151. [Google Scholar] [CrossRef]
- Alam, M.S.; Kumar, D.; Chatterjee, R.S. Improving the capability of integrated DInSAR and PSI approach for better detection, monitoring, and analysis of land surface deformation in underground mining environment. Geocarto Int. 2022, 37, 3607–3641. [Google Scholar] [CrossRef]
- Colesanti, C.; Mouelic, L.S.; Bennani, M.; Raucoules, D.; Carnec, C.; Ferretti, A. Detection of mining related ground instabilities using the Permanent Scatterers technique—A case study in the east of France. Int. J. Remote Sens. 2007, 26, 201–207. [Google Scholar] [CrossRef]
- Frattini, P.; Crosta, B.G.; Rossini, M.; Allievi, J. Activity and kinematic behaviour of deep-seated landslides from PS-InSAR displacement rate measurements. Landslides 2018, 15, 1053–1070. [Google Scholar] [CrossRef]
- Shanker, P.; Casu, F.; Zebker, H.A.; Lanari, R. Comparison of Persistent Scatterers and Small Baseline Time-Series InSAR Results: A Case Study of the San Francisco Bay Area. IEEE Geosci. Remote Sens. Lett. 2011, 8, 592–596. [Google Scholar] [CrossRef]
- Berardino, P.; Fornaro, G.; Lanari, R.; Sansosti, E. A new algorithm for surface deformation monitoring based on small baseline differential SAR interferograms. IEEE Trans. Geosci. Remote Sens. 2002, 40, 2375–2383. [Google Scholar] [CrossRef]
- Hu, J.; Yan, Y.; Dai, H.; He, X.; Lv, B.; Han, M.; Zhu, Y.; Zhang, Y. Prediction Method for Dynamic Subsidence Basin in Mining Area Based on SBAS-InSAR and Time Function. Remote Sens. 2024, 16, 1938. [Google Scholar] [CrossRef]
- Ma, Z.; Yang, X.; Xie, L.; Dong, W. Life Cycle Mining Deformation Monitoring and Analysis Using Sentinel-1 and Radarsat-2 InSAR Time Series. Remote Sens. 2024, 16, 2335. [Google Scholar] [CrossRef]
- Dai, M.; Li, H.; Long, B.; Wang, X. Quantitative identification of landslide hazard in mountainous open-pit mining areas combined with ascending and descending orbit InSAR technology. Landslides, 2024, in press. [CrossRef]
- Ding, C.; Feng, G.; Zhang, L.; Wang, W. Retrospect on the Ground Deformation Process and Potential Triggering Mechanism of the Traditional Steel Production Base in Laiwu with ALOS PALSAR and Sentinel-1 SAR Sensors. Sensors 2024, 24, 4872. [Google Scholar] [CrossRef]
- Zhang, J.; Kou, P.; Tao, Y.; Jin, Z.; Huang, Y.; Cui, J.; Liang, W.; Liu, R. Urban ground subsidence monitoring and prediction using time-series InSAR and machine learning approaches: A case study of Tianjin, China. Environ. Earth Sci. 2024, 83, 473. [Google Scholar] [CrossRef]
- Xu, J.; Yan, C.; Boota, M.; Chen, X.; Li, Z.; Liu, W.; Yan, X. Research on automatic identification of coal mining subsidence area based on InSAR and time series classification. J. Clean. Prod. 2024, 470, 143293. [Google Scholar] [CrossRef]
- Wang, R.; Huang, S.; He, Y.; Wu, K.; Gu, Y.; He, Q.; Yan, H.; Yang, J. Construction of High-Precision and Complete Images of a Subsidence Basin in Sand Dune Mining Areas by InSAR-UAV-LiDAR Heterogeneous Data Integration. Remote Sens. 2024, 16, 2752. [Google Scholar] [CrossRef]
- Chang, K.; Zhao, Z.; Zhou, D.; Tian, Z.; Wang, C. Prediction of Surface Subsidence in Mining Areas Based on Ascending-Descending Orbits Small Baseline Subset InSAR and Neural Network Optimization Models. Sensors 2024, 24, 4770. [Google Scholar] [CrossRef]
- Yuan, M.; Li, M.; Liu, H.; Lv, P.; Li, B.; Zheng, W. Subsidence Monitoring Base on SBAS-InSAR and Slope Stability Analysis Method for Damage Analysis in Mountainous Mining Subsidence Regions. Remote Sens. 2021, 13, 3107. [Google Scholar] [CrossRef]
- Wang, Y.; Cui, X.; Ge, C.; Che, Y.; Zhao, Y.; Li, P.; Jiang, Y.; Han, X. Monitoring nonlinear large gradient subsidence in mining areas through SBAS-InSAR with PUNet and Weibull model fusion. Environ. Sci. Pollut. Res. Int. 2024, 31, 52815–52826. [Google Scholar] [CrossRef] [PubMed]
- Tang, W.; Ng, A.H.; Wang, H.; Kuang, J.; Du, Z. Surface Subsidence Characteristics and Causes Analysis in Ningbo Plain by Sentinel-1A TS-InSAR. Remote Sens. 2024, 16, 2438. [Google Scholar] [CrossRef]
- Wang, J.; Wang, F.; Chen, F.; Lu, S.; Li, Y.; Chen, M.; Wang, Y.; Li, C.; Zhang, Y.; Li, W. Dynamic fractionation of methane carbon isotope during mass transport in coal with bidisperse pore structures: Experiments, numerical modeling, and applications. Chem. Eng. J. 2024, 498, 154942. [Google Scholar] [CrossRef]
- Xie, Y.; Bagan, H.; Tan, L.; Te, T.; Damdinsuren, A.; Wang, Q. Time-Series Analysis of Mining-Induced Subsidence in the Arid Region of Mongolia Based on SBAS-InSAR. Remote Sens. 2024, 16, 2166. [Google Scholar] [CrossRef]
- Kalavrezou, I.; Melgar, I.; Nika, D.; Gatsios, T.; Lalechos, S.; Parcharidis, I. Application of Time Series INSAR (SBAS) Method Using Sentinel-1 for Monitoring Ground Deformation of the Aegina Island (Western Edge of Hellenic Volcanic Arc). Land 2024, 13, 485. [Google Scholar] [CrossRef]
- Huang, G.; Dong, J.; Xi, W.; Zhao, Z.; Li, S.; Kuang, Z.; An, Q.; Wei, J.; Zhu, Y. Study on surface deformation pattern in mine closure area of complex karst mountainous region based on SBAS-InSAR technology. Front. Earth Sci. 2024, 11, 1353593. [Google Scholar] [CrossRef]
- Wang, S.; Sun, H.; Wei, L.; Pi, P.; Zeng, M.; Pan, Y.; Xue, Z.; Jiang, X. Integrated Assessment of Coastal Subsidence in Nansha District, Guangzhou City, China: Insights from SBAS-InSAR Monitoring and Risk Evaluation. Remote Sens. 2024, 16, 248. [Google Scholar] [CrossRef]
- Agus, U.; Ram, A.; Wirastuti, W.; Alan, J.; Ali, P.Y.; Mohamed, K.K.; Gulab, S. Use of multifrequency (C-band and L-band) SAR data to monitor peat subsidence based on time-series SBAS InSAR technique. Land Degrad. Dev. 2021, 32, 4779. [Google Scholar] [CrossRef]
- Wang, R.; Feng, Y.; Tong, X.; Li, P.; Wang, J.; Tang, P.; Tang, X.; Xi, M.; Zhou, Y. Large-Scale Surface Deformation Monitoring Using SBAS-InSAR and Intelligent Prediction in Typical Cities of Yangtze River Delta. Remote Sens. 2023, 15, 4942. [Google Scholar] [CrossRef]
- Guo, H.; Yuan, Y.; Wang, J.; Cui, J.; Zhang, D.; Zhang, R.; Cao, Q.; Li, J.; Dai, W.; Bao, H.; et al. Large-Scale surface subsidence Monitoring and Prediction Based on SBAS-InSAR Technology with Time-Series Sentinel-1A Satellite Data. Remote Sens. 2023, 15, 2843. [Google Scholar] [CrossRef]
- Wang, S.; Cao, B.; Bai, R.; Liu, G. Dynamic optimization design of open-pit mine full-boundary slope considering uncertainty of rock mass strength. Sci. Rep. 2024, 14, 19710. [Google Scholar] [CrossRef] [PubMed]
- Han, T.; Li, Q.; Hai, Y.; Yang, Y.; Wen, Z.; Li, R.; Zheng, H. Response of ecosystem services and environmental dynamics in large open-pit coal mines: A case study in semi-arid areas. Glob. Ecol. Conserv. 2024, 51, e02891. [Google Scholar] [CrossRef]
- Ren, J.; Zhang, X.; Gu, Q.; Zhang, W.; Wang, W.; Fan, L. The Frequency Characteristics of Vibration Events in an Underground Coal Mine and Their Implications on Rock Burst Monitoring and Prevention. Sustainability 2024, 16, 5485. [Google Scholar] [CrossRef]
- Ng, M.H.A.; Wen, B.; Ma, Y.; Guo, L.; Dai, Y.; Wang, H.; Ge, L.; Du, Z. Integrating spatial modeling-assisted InSAR phase unwrapping with temporal analysis for advanced mine subsidence time series mapping. Int. J. Appl. Earth Obs. Geoinf. 2024, 133, 104143. [Google Scholar] [CrossRef]
- Pawluszek-Filipiak, K.; Borkowski, A. Integration of DInSAR and SBAS Techniques to Determine Mining-Related Deformations Using Sentinel-1 Data: The Case Study of Rydułtowy Mine in Poland. Remote Sens. 2020, 12, 242. [Google Scholar] [CrossRef]
- Karami, E.; Alizadeh, N.; Farhadi, H.; Abdolazimi, H.; Maghsoudi, Y. Monitoring of land surface displacement based on SBAS-InSAR time-series and GIS techniques: A case study over the Shiraz Merropolis, Iran. ISPRS Ann. Photogramm. Remote Sens. Spatial Inf. Sci. 2023, 10, 371–378. [Google Scholar] [CrossRef]
- Gyawu, A.; Baker, A.D.; Offei, A.K. An Assessment of Interventions to Improve Underground Coal Miners’ Ability to Self-Escape Using Human-Centered Design Methods. Mining Metall. Explor. 2024, 41, 2231–2243. [Google Scholar] [CrossRef]
- Sarychikhina, O.; Glowacka, E.; Ortega, G.A.J.; Meza, G.F.I. Three decades of subsidence monitoring in the Cerro Prieto basin, Mexicali Valley, using multi-temporal InSAR techniques. J. S. Am. Earth Sci. 2025, 156, 105375. [Google Scholar] [CrossRef]
- Woo, K.; Eberhardt, E.; Rabus, B.; Stead, D.; Vyazmensky, A. Integration of field characterisation, mine production and InSAR monitoring data to constrain and calibrate 3-D numerical modelling of block caving-induced subsidence. Int. J. Rock Mech. Min. Sci. 2012, 53, 166–178. [Google Scholar] [CrossRef]
- Anzidei, M.; Tolomei, C.; Trippanera, D.; Alberti, T.; Bosman, A.; Brunori, A.C.; Serpelloni, E.; Vecchio, A.; Falciano, A.; Deli, G. Multi-Temporal Relative Sea Level Rise Scenarios up to 2150 for the Venice Lagoon (Italy). Remote Sens. 2025, 17, 820. [Google Scholar] [CrossRef]
- Zheng, X.; Wang, C.; Tang, Y.; Zhang, H.; Li, T.; Zou, L.; Guan, S. Adaptive High Coherence Temporal Subsets SBAS-InSAR in Tropical Peatlands Degradation Monitoring. Remote Sens. 2023, 15, 4461. [Google Scholar] [CrossRef]
- Kou, P.; Xu, Q.; Jin, Z.; Tao, Y.; Yunus, A.; Feng, J.; Pu, C.; Yuan, S.; Xia, Y. Analyzing gully erosion and deposition patterns in loess tableland: Insights from small baseline subset interferometric synthetic aperture radar (SBAS InSAR). Sci. Total Environ. 2024, 916, 169873. [Google Scholar] [CrossRef]
- Duan, M.; Li, Z.; Xu, B.; Jiang, W.; Cao, Y.; Xiong, Y.; Wei, J. Turbulent atmospheric phase correction for SBAS-InSAR. J. Geod. 2024, 98, 81. [Google Scholar] [CrossRef]
- Bo, S.; Qun, D.; Wu, X. Estimation method of SBAS dual-frequency range error integrity parameter. Satell. Navig. 2020, 1, 663–673. [Google Scholar] [CrossRef]
- Cécile, D.; Aline, D.; Frédéric, M.; Anne, S.; Elias, L.; Raphaël, G.; Alexandre, N.; Patrice, U.; Jean-Bernard, C.D.; Ibrahim, S.; et al. Current deformation in Central Afar and triple junction kinematics deduced from GPS and InSAR measurements. Geophys. J. Int. 2017, 208, 936–953. [Google Scholar] [CrossRef]
- Ma, X.; Su, M.; Xue, Y.; Wang, P.; Qiu, D.; Han, M.; Ju, Z.; Liao, Z. Comprehensive Geophysical Evaluation of Grouting in the Goaf of an Urban Underground Coal Mine. Mine Water Environ. 2023, 42, 513–526. [Google Scholar] [CrossRef]
- Lee, J.C.; Shirzaei, M. Novel algorithms for pair and pixel selection and atmospheric error correction in multitemporal InSAR. Remote Sens. Environ. 2023, 286, 113447. [Google Scholar] [CrossRef]
- Guillaume, M.; Frédéric, M.; Cécile, D.; François, C. Repeated lidar acquisitions in an underground salt gallery in the Alsatian potassic basin (France): Monitoring and geomechanical modelling. Tunn. Undergr. Space Technol. 2022, 123, 104406. [Google Scholar] [CrossRef]


| Zone | Description | Area (km2) | Capacity (Mt/a) |
| R1 | Qijiapan small coal mine reconstruction area | 57.80 | 1.50 |
| R2 | Zhaoyoufang small coal mine reconstruction area | 45.90 | 1.50 |
| R3 | Suancigou small coal mine reconstruction area | 51.33 | 1.50 |
| R4 | Chaonaoliang small coal mine reconstruction area | 115.20 | 3.00 |
| C1 | Wanli mining field | 75.76 | 8.00 |
| C2 | Fanjiacun mining field | 10.03 | 1.20 |
| C3 | Nianpanliang mining field | 11.81 | 1.20 |
| C4 | Yangjiacun mining field | 37.20 | 5.00 |
| C5 | Talahao mining field | 81.90 | 6.00 |
| C6 | Lijiahao mining field | 56.05 | 6.00 |
| C7 | Wangjiata mining field | 60.11 | 5.00 |
| C8 | Gaojialiang mining field | 88.50 | 6.00 |
| Total | 691.59 | 45.90 | |
| No. 1 | Date | No. | Date | No. | Date |
|---|---|---|---|---|---|
| 1 | 2018/01/06 | 23 | 2019/11/09 | 45 | 2021/10/17 |
| 2 | 2018/02/11 | 24 | 2019/12/03 | 46 | 2021/11/10 |
| 3 | 2018/03/07 | 25 | 2020/01/08 | 47 | 2021/12/04 |
| 4 | 2018/04/12 | 26 | 2020/02/01 | 48 | 2022/01/09 |
| 5 | 2018/05/06 | 27 | 2020/03/08 | 49 | 2022/02/02 |
| 6 | 2018/06/11 | 28 | 2020/04/01 | 50 | 2022/03/22 |
| 7 | 2018/07/17 | 29 | 2020/04/25 | 51 | 2022/04/03 |
| 8 | 2018/08/10 | 30 | 2020/07/18 | 52 | 2022/05/09 |
| 9 | 2018/09/03 | 31 | 2020/08/11 | 53 | 2022/06/02 |
| 10 | 2018/10/09 | 32 | 2020/09/04 | 54 | 2022/08/01 |
| 11 | 2018/11/02 | 33 | 2020/10/10 | 55 | 2022/09/18 |
| 12 | 2018/12/08 | 34 | 2020/11/03 | 56 | 2023/03/05 |
| 13 | 2019/01/13 | 35 | 2020/11/27 | 57 | 2023/04/22 |
| 14 | 2019/02/06 | 36 | 2021/01/26 | 58 | 2023/06/21 |
| 15 | 2019/03/02 | 37 | 2021/02/07 | 59 | 2023/07/15 |
| 16 | 2019/04/07 | 38 | 2021/03/03 | 60 | 2023/08/08 |
| 17 | 2019/05/13 | 39 | 2021/04/08 | 61 | 2023/09/13 |
| 18 | 2019/06/06 | 40 | 2021/05/02 | 62 | 2023/10/19 |
| 19 | 2019/07/12 | 41 | 2021/05/14 | 63 | 2023/11/24 |
| 20 | 2019/08/05 | 42 | 2021/07/01 | 64 | 2023/12/18 |
| 21 | 2019/09/10 | 43 | 2021/08/18 | ||
| 22 | 2019/10/04 | 44 | 2021/09/11 |
| Zone | Subsidence Area (km2) | Maximum Cumulative Subsidence (mm) | Average Cumulative Subsidence (mm) |
|---|---|---|---|
| R1 | 14.01 | −219.91 | −35.98 |
| R2 | 17.75 1 | −179.41 | −34.69 |
| R3 | 9.32 | −174.91 | −39.54 |
| R4 | 14.53 | −265.11 | −41.56 |
| C1 | 6.76 | −129.4 | −38.25 |
| C2 | 5.18 | −148.01 | −35.61 |
| C3 | 7.71 | −137.31 | −34.69 |
| C4 | 6.80 | −136.91 | −36.48 |
| C5 | 9.26 | −162.61 | −49.15 |
| C6 | 4.97 | −179.91 | −33.7 |
| C7 | 3.64 | −283.41 | −37.25 |
| C8 | 9.80 | −203.81 | −44.03 |
| Zone | Maximum Velocity of Surface Subsidence (mm/y) | Average Velocity of Surface Subsidence (mm/y) |
|---|---|---|
| R1 | −33.37 | −6.47 |
| R2 | −33.70 | −7.62 |
| R3 | −28.89 | −7.71 |
| R4 | −45.74 | −8.85 |
| C1 | −20.97 | −7.36 |
| C2 | −28.27 | −7.73 |
| C3 | −21.91 | −7.22 |
| C4 | −25.06 | −8.99 |
| C5 | −30.49 | −10.96 |
| C6 | −33.36 | −8.62 |
| C7 | −46.45 1 | −11.08 |
| C8 | −38.82 | −9.03 |
| Panel | Quantity | No. 1 | Length (m) | Orientation A 2 | Orientation B 3 | Consistency 4 |
|---|---|---|---|---|---|---|
| 301 | 5 | 1 | 206 | SE-NW | SE-NW | Yes |
| 2 | 113 | SE-NW | NE-SW | No | ||
| 3 | 78 | E-W | E-W | Yes | ||
| 4 | 95 | NE-SW | NE-SW | Yes | ||
| 5 | 52 | NE-SW | NE-SW | Yes | ||
| 203 | 12 | 6 | 73 | E-W | E-W | Yes |
| 7 | 34 | NE-SW | NE-SW | Yes | ||
| 8 | 200 | N-S | N-S | Yes | ||
| 9 | 29 | NE-SW | NE-SW | Yes | ||
| 10 | 25 | NE-SW | NE-SW | Yes | ||
| 11 | 164 | SE-NW | NE-SW | No | ||
| 12 | 83 | NE-SW | NE-SW | Yes | ||
| 13 | 25 | SE-NW | SE-NW | Yes | ||
| 14 | 20 | E-W | E-W | Yes | ||
| 15 | 58 | SE-NW | SE-NW | Yes | ||
| 16 | 36 | E-W | E-W | Yes | ||
| 17 | 152 | SE-NW | SE-NW | Yes | ||
| 401 | 12 | 18 | 131 | SE-NW | SE-NW | Yes |
| 19 | 55 | SE-NW | SE-NW | Yes | ||
| 20 | 45 | SE-NW | SE-NW | Yes | ||
| 21 | 77 | E-W | E-W | Yes | ||
| 22 | 102 | E-W | NE-SW | No | ||
| 23 | 21 | E-W | NE-SW | No | ||
| 24 | 21 | E-W | E-W | Yes | ||
| 25 | 78 | NE-SW | NE-SW | Yes | ||
| 26 | 48 | NE-SW | NE-SW | Yes | ||
| 27 | 47 | NE-SW | NE-SW | Yes | ||
| 28 | 29 | NE-SW | NE-SW | Yes | ||
| 29 | 108 | NE-SW | NE-SW | Yes |
Disclaimer/Publisher’s Note: The statements, opinions and data contained in all publications are solely those of the individual author(s) and contributor(s) and not of MDPI and/or the editor(s). MDPI and/or the editor(s) disclaim responsibility for any injury to people or property resulting from any ideas, methods, instructions or products referred to in the content. |
© 2025 by the authors. Licensee MDPI, Basel, Switzerland. This article is an open access article distributed under the terms and conditions of the Creative Commons Attribution (CC BY) license (https://creativecommons.org/licenses/by/4.0/).
Share and Cite
Xue, X.; Ji, J.; Li, G.; Li, H.; Cao, Q.; Wang, K. Time Series Analysis of Mining-Induced Subsidence Using Small Baseline Subset Interferometric Synthetic Aperture Radar (Wanli Mining Area, Inner Mongolia, China). Appl. Sci. 2025, 15, 3998. https://doi.org/10.3390/app15073998
Xue X, Ji J, Li G, Li H, Cao Q, Wang K. Time Series Analysis of Mining-Induced Subsidence Using Small Baseline Subset Interferometric Synthetic Aperture Radar (Wanli Mining Area, Inner Mongolia, China). Applied Sciences. 2025; 15(7):3998. https://doi.org/10.3390/app15073998
Chicago/Turabian StyleXue, Xinlei, Jinzhu Ji, Guoping Li, Huaibin Li, Qi Cao, and Kai Wang. 2025. "Time Series Analysis of Mining-Induced Subsidence Using Small Baseline Subset Interferometric Synthetic Aperture Radar (Wanli Mining Area, Inner Mongolia, China)" Applied Sciences 15, no. 7: 3998. https://doi.org/10.3390/app15073998
APA StyleXue, X., Ji, J., Li, G., Li, H., Cao, Q., & Wang, K. (2025). Time Series Analysis of Mining-Induced Subsidence Using Small Baseline Subset Interferometric Synthetic Aperture Radar (Wanli Mining Area, Inner Mongolia, China). Applied Sciences, 15(7), 3998. https://doi.org/10.3390/app15073998