
Enhancing Street-Crossing Safety for Visually Impaired Pedestrians with Haptic and Visual Feedback

 , , and
Abstract
1. Introduction
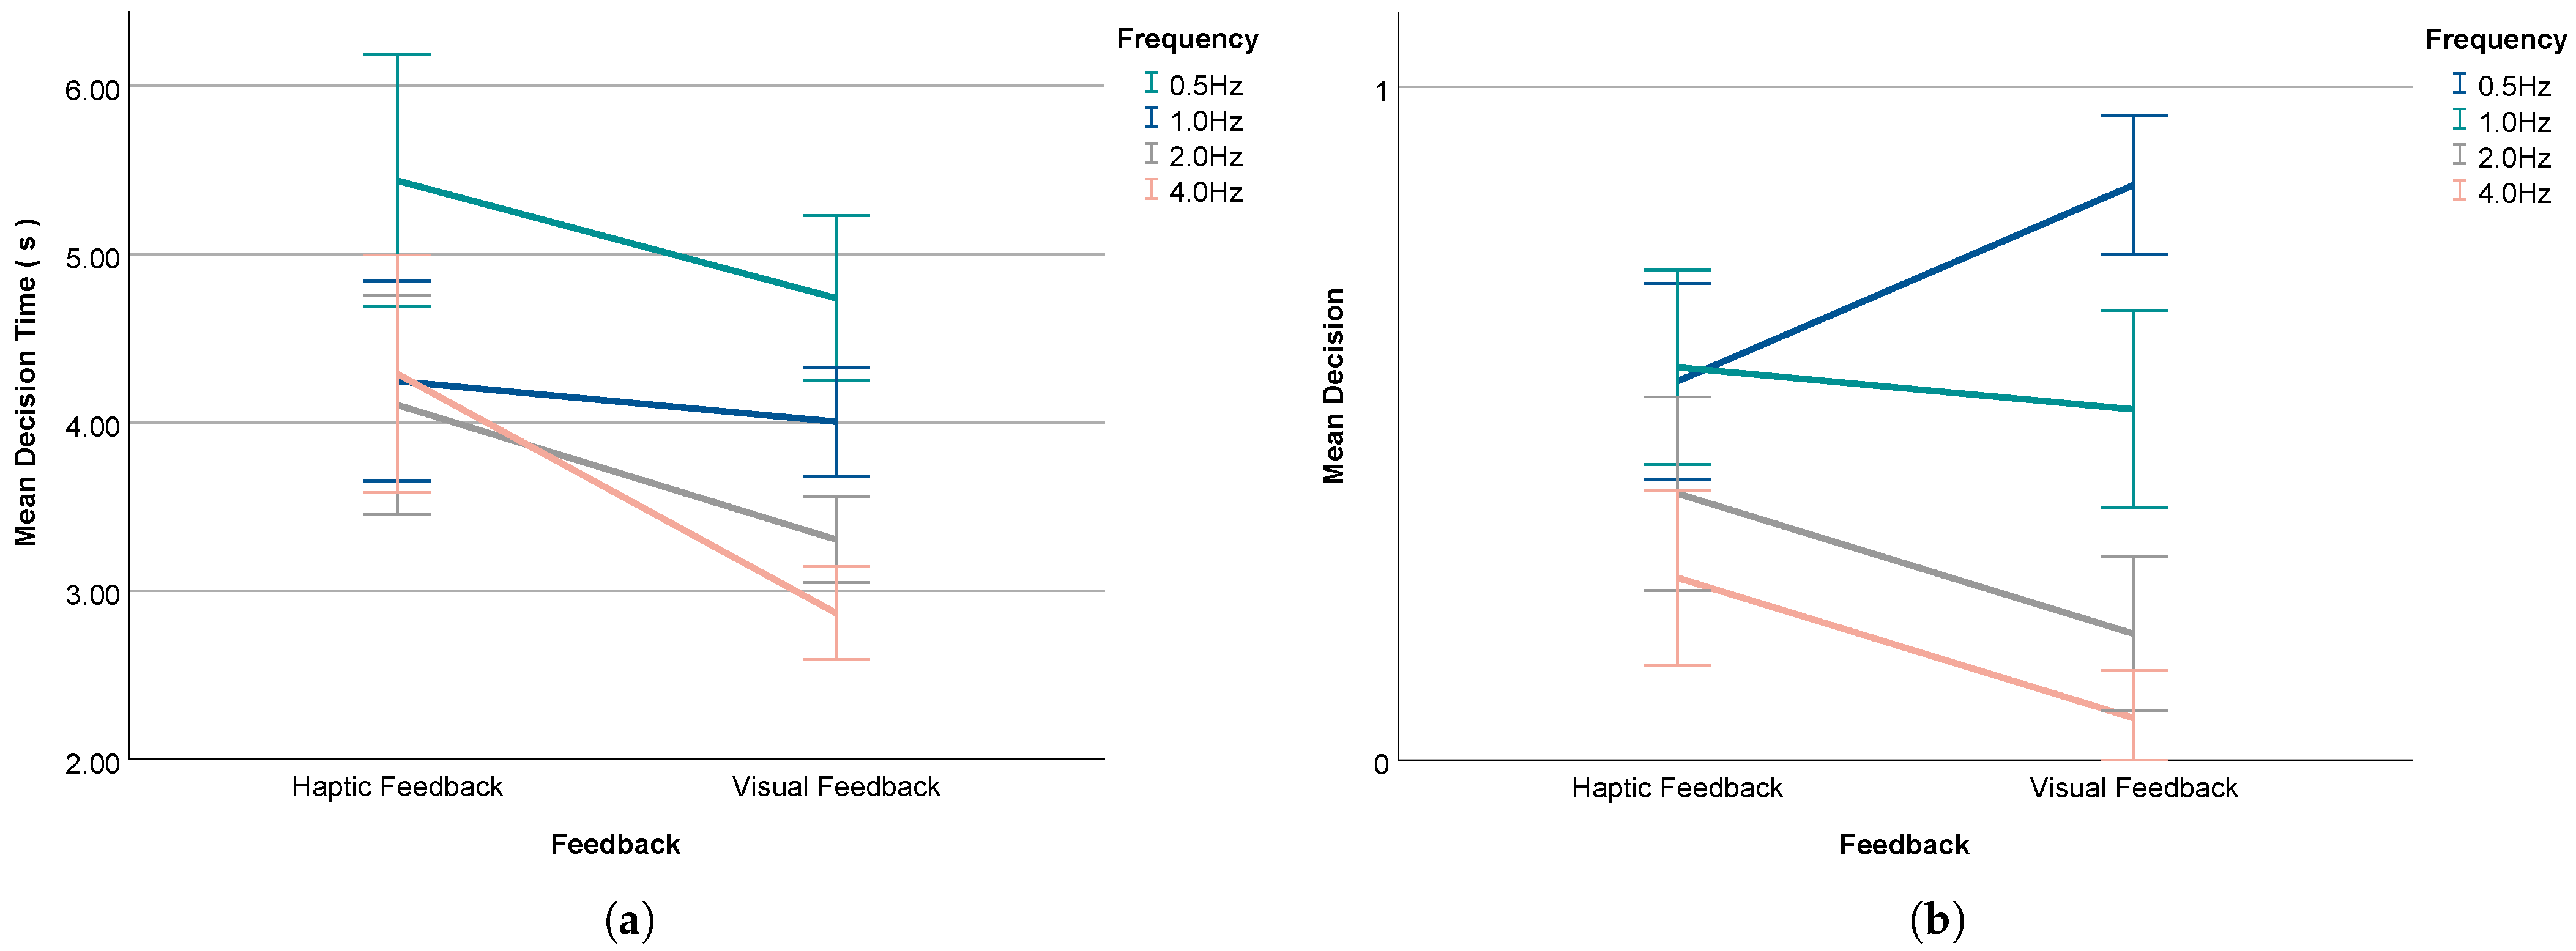
- In the traffic light crossing scenario, visual feedback significantly improved users’ decision-making efficiency and facilitated faster decisions, regardless of their confidence levels.
- In the vehicle crossing scenario, haptic feedback significantly enhanced decision efficiency, with dynamic haptic feedback outperforming dynamic visual feedback.
- In both scenarios, the high-frequency visual feedback encouraged users to make more cautious decisions, while haptic feedback was widely preferred by users due to its comfortable experience.
2. Related Works
2.1. Challenges in Mobility for Visually Impaired Individuals
2.1.1. Street-Crossing Barriers for Visually Impaired Pedestrians
2.1.2. Assistive Technology Solutions for Safe Crossing
2.2. Haptic Feedback for Visually Impaired Individuals
2.2.1. Haptic Perception Mechanisms and Assistive Applications
2.2.2. Haptic Feedback via Wearable Devices for Street-Crossing
2.3. Visual Feedback for Low-Vision and Blind Users
2.3.1. Enhanced Visual Representation for Visually Impaired Assistance
2.3.2. Harnessing Light Perception for Visual Assistance
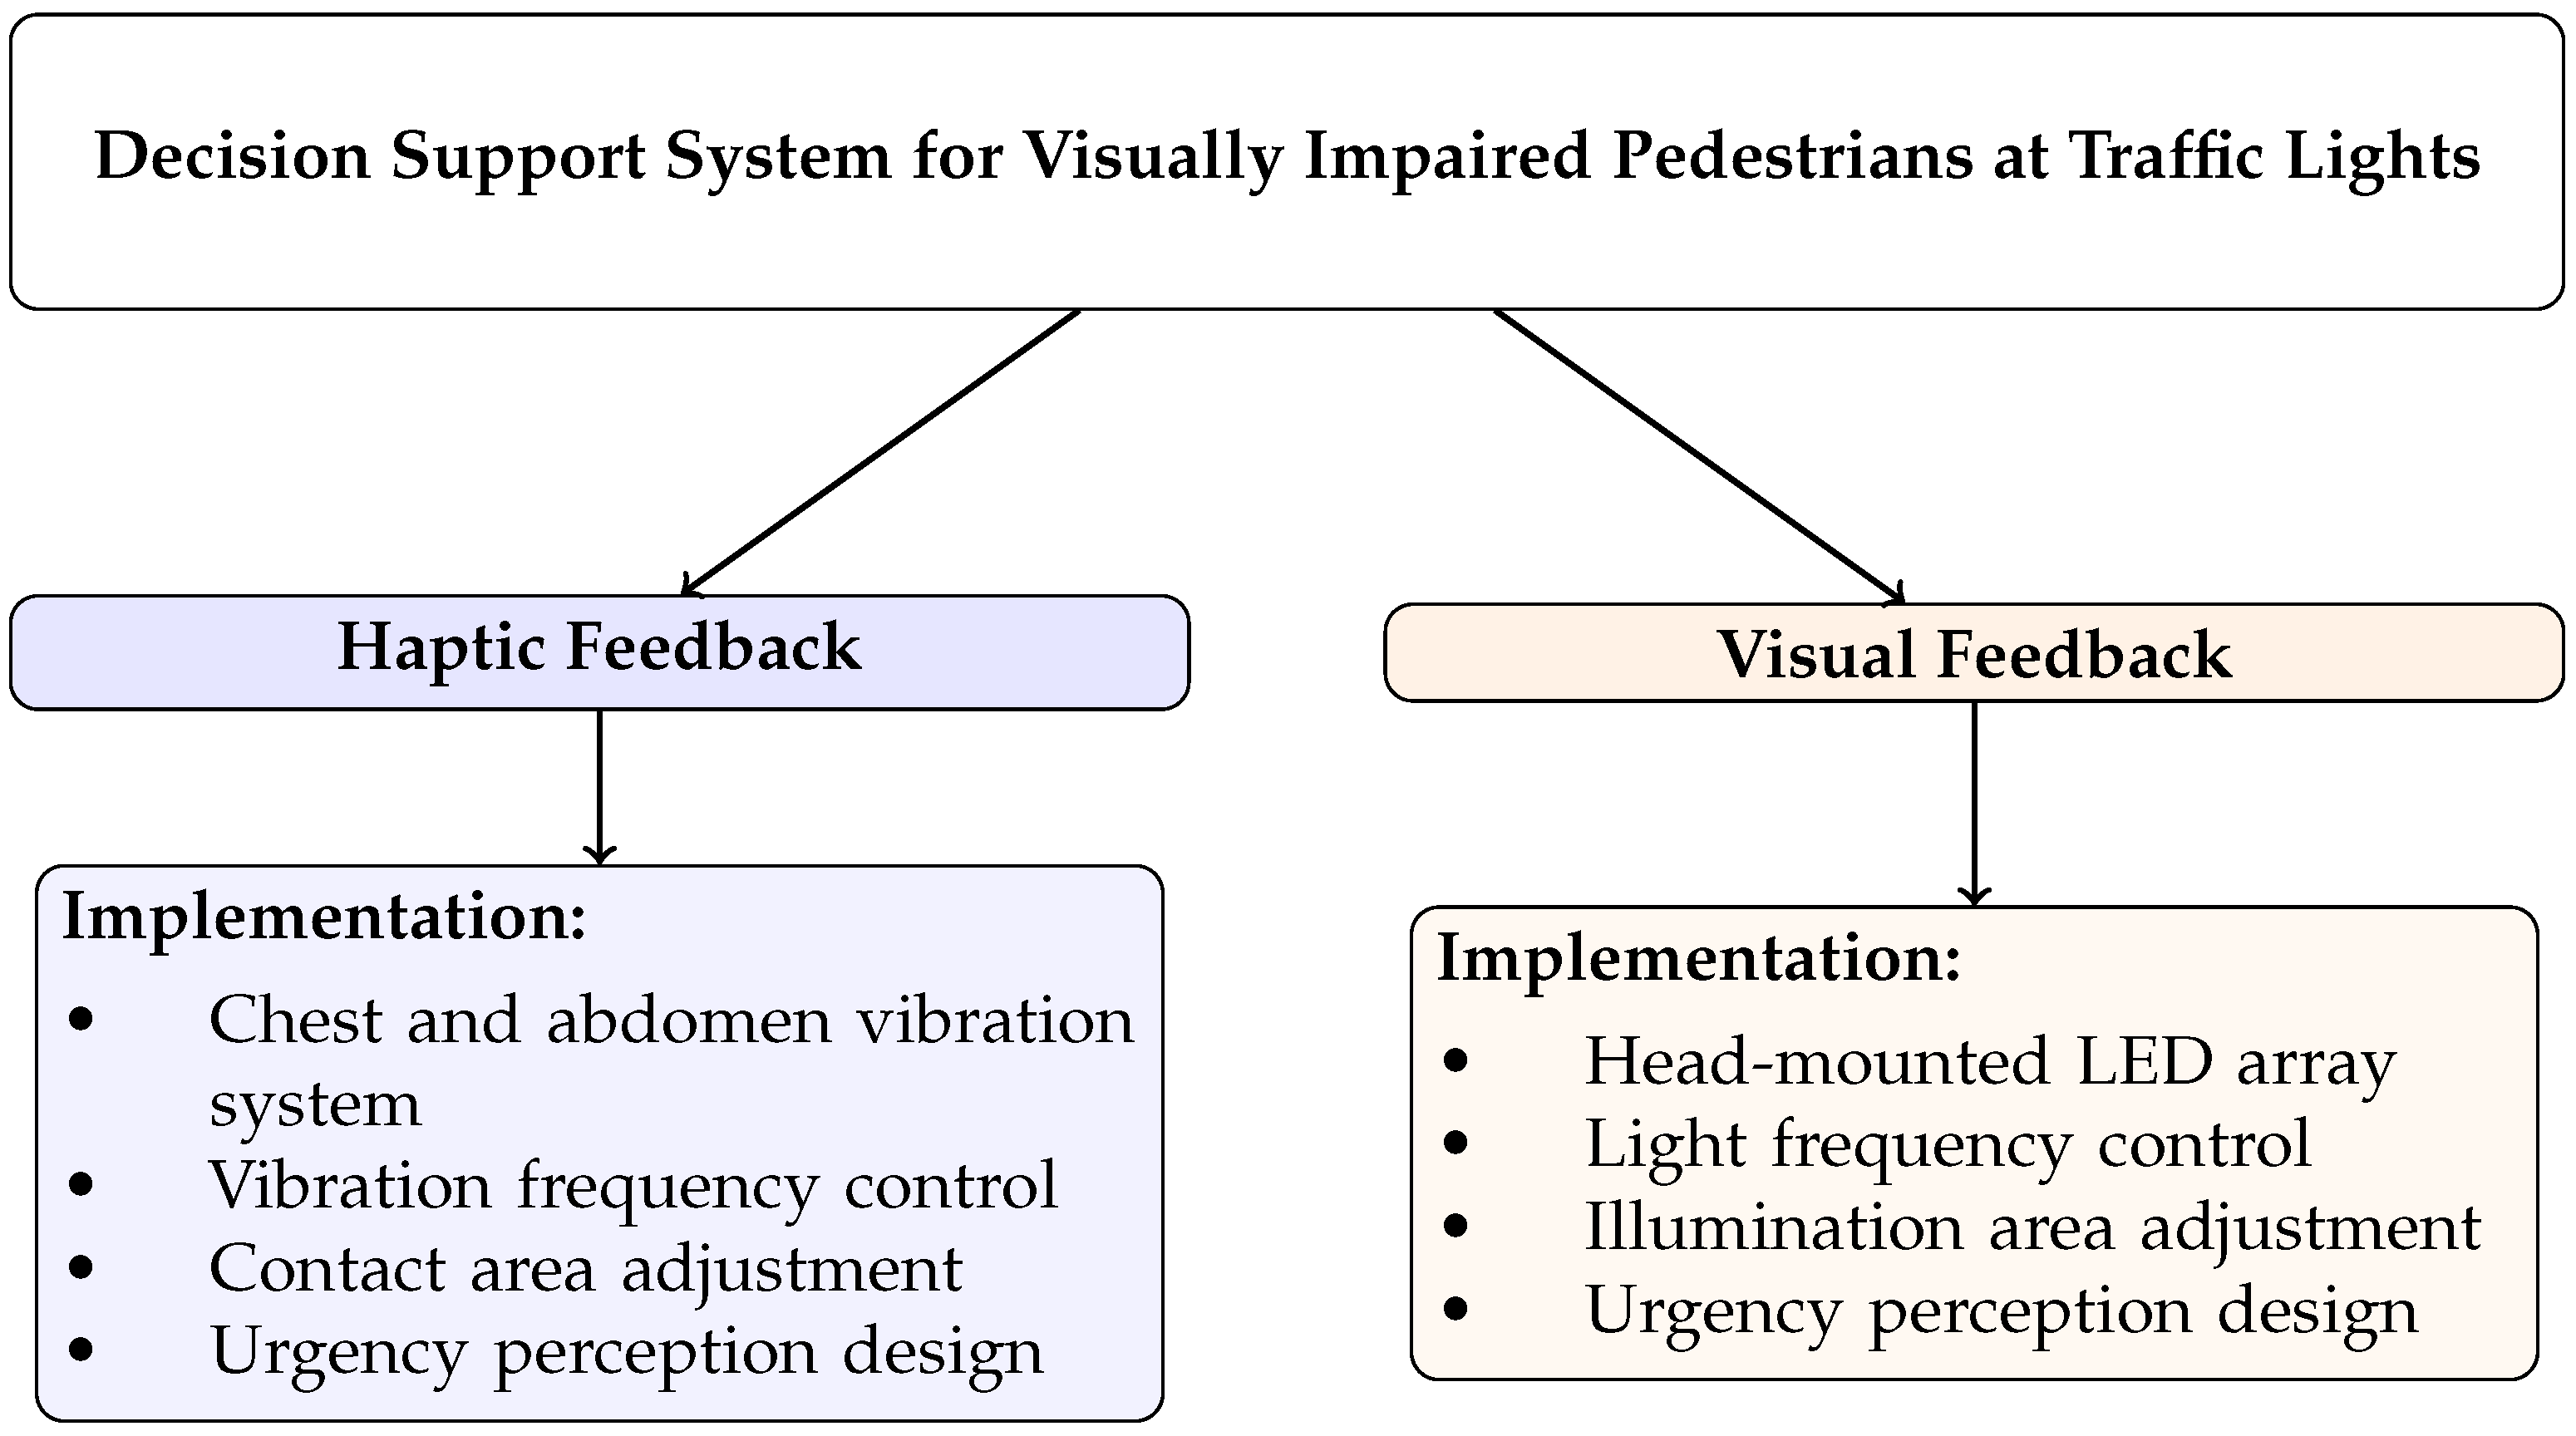
3. Study 1: Haptic and Visual Feedback for Visually Impaired Pedestrians Crossing at Traffic Signals
3.1. Experimental Design
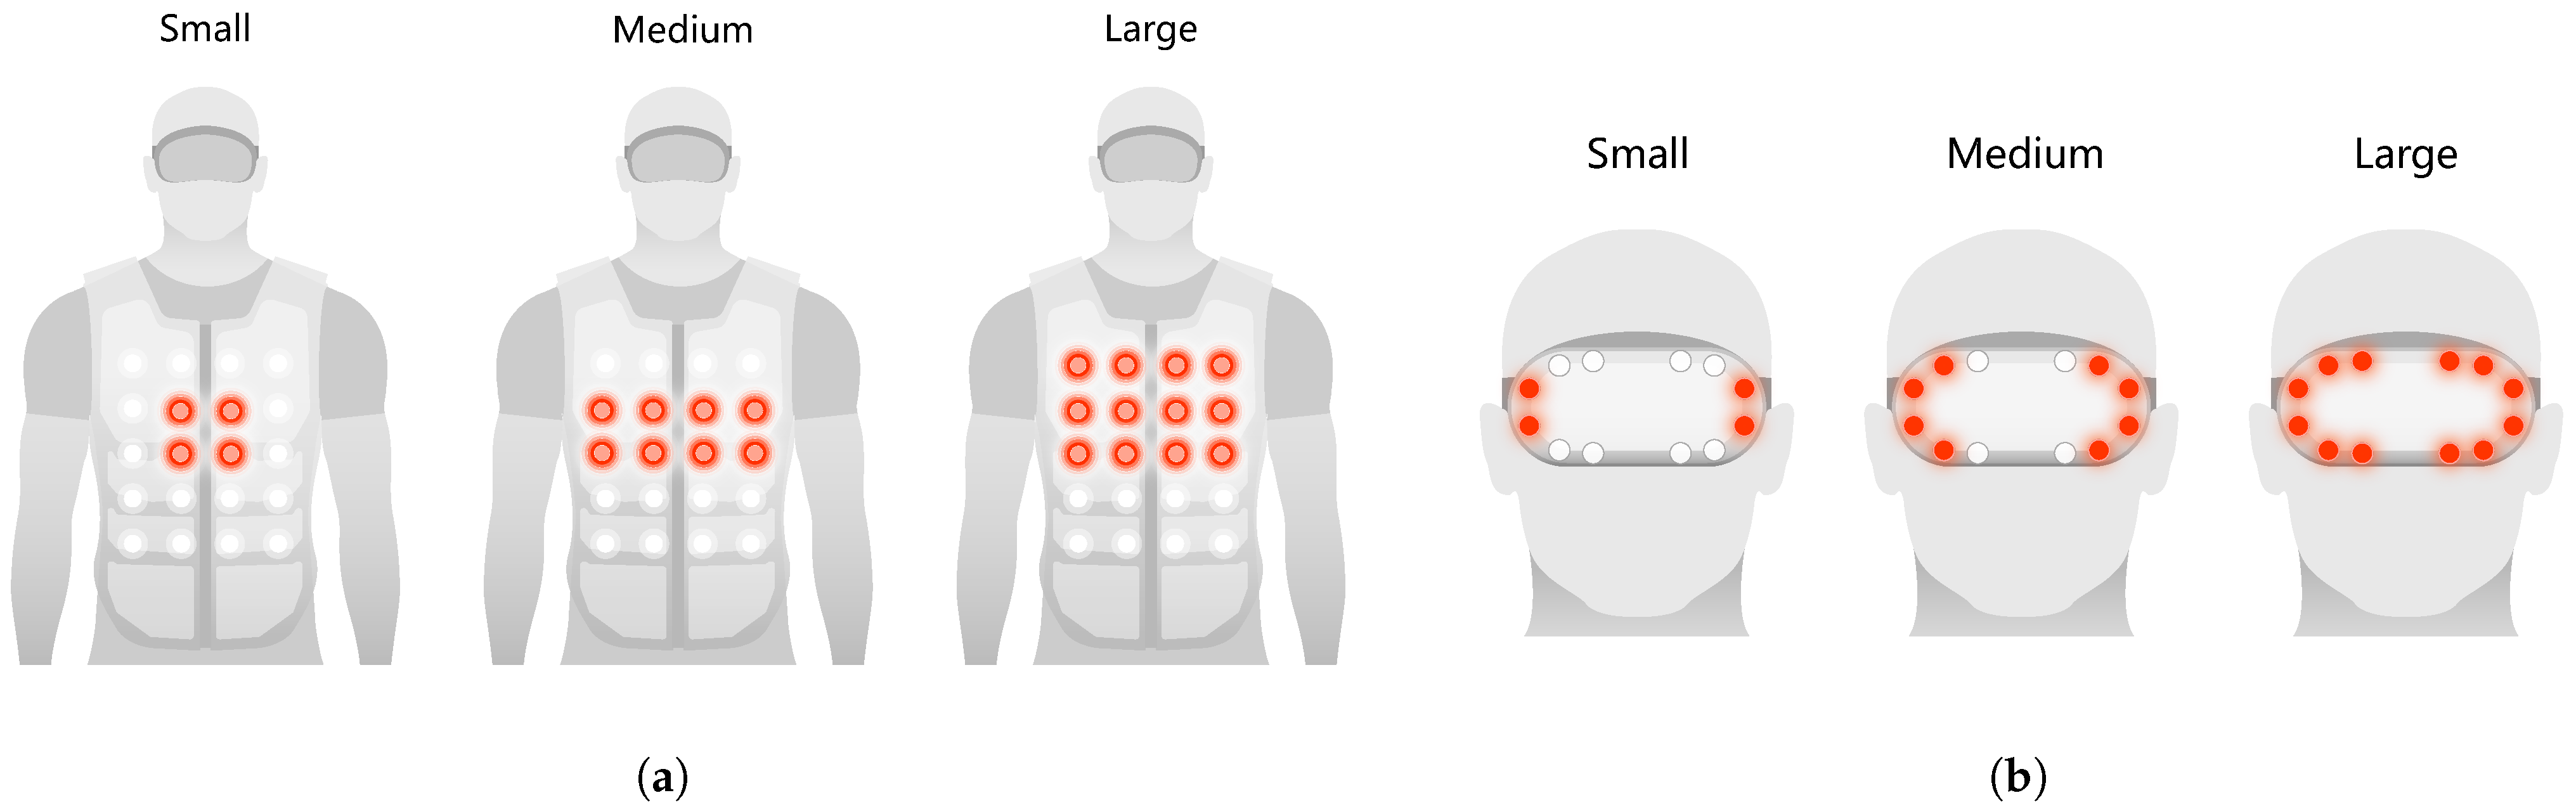
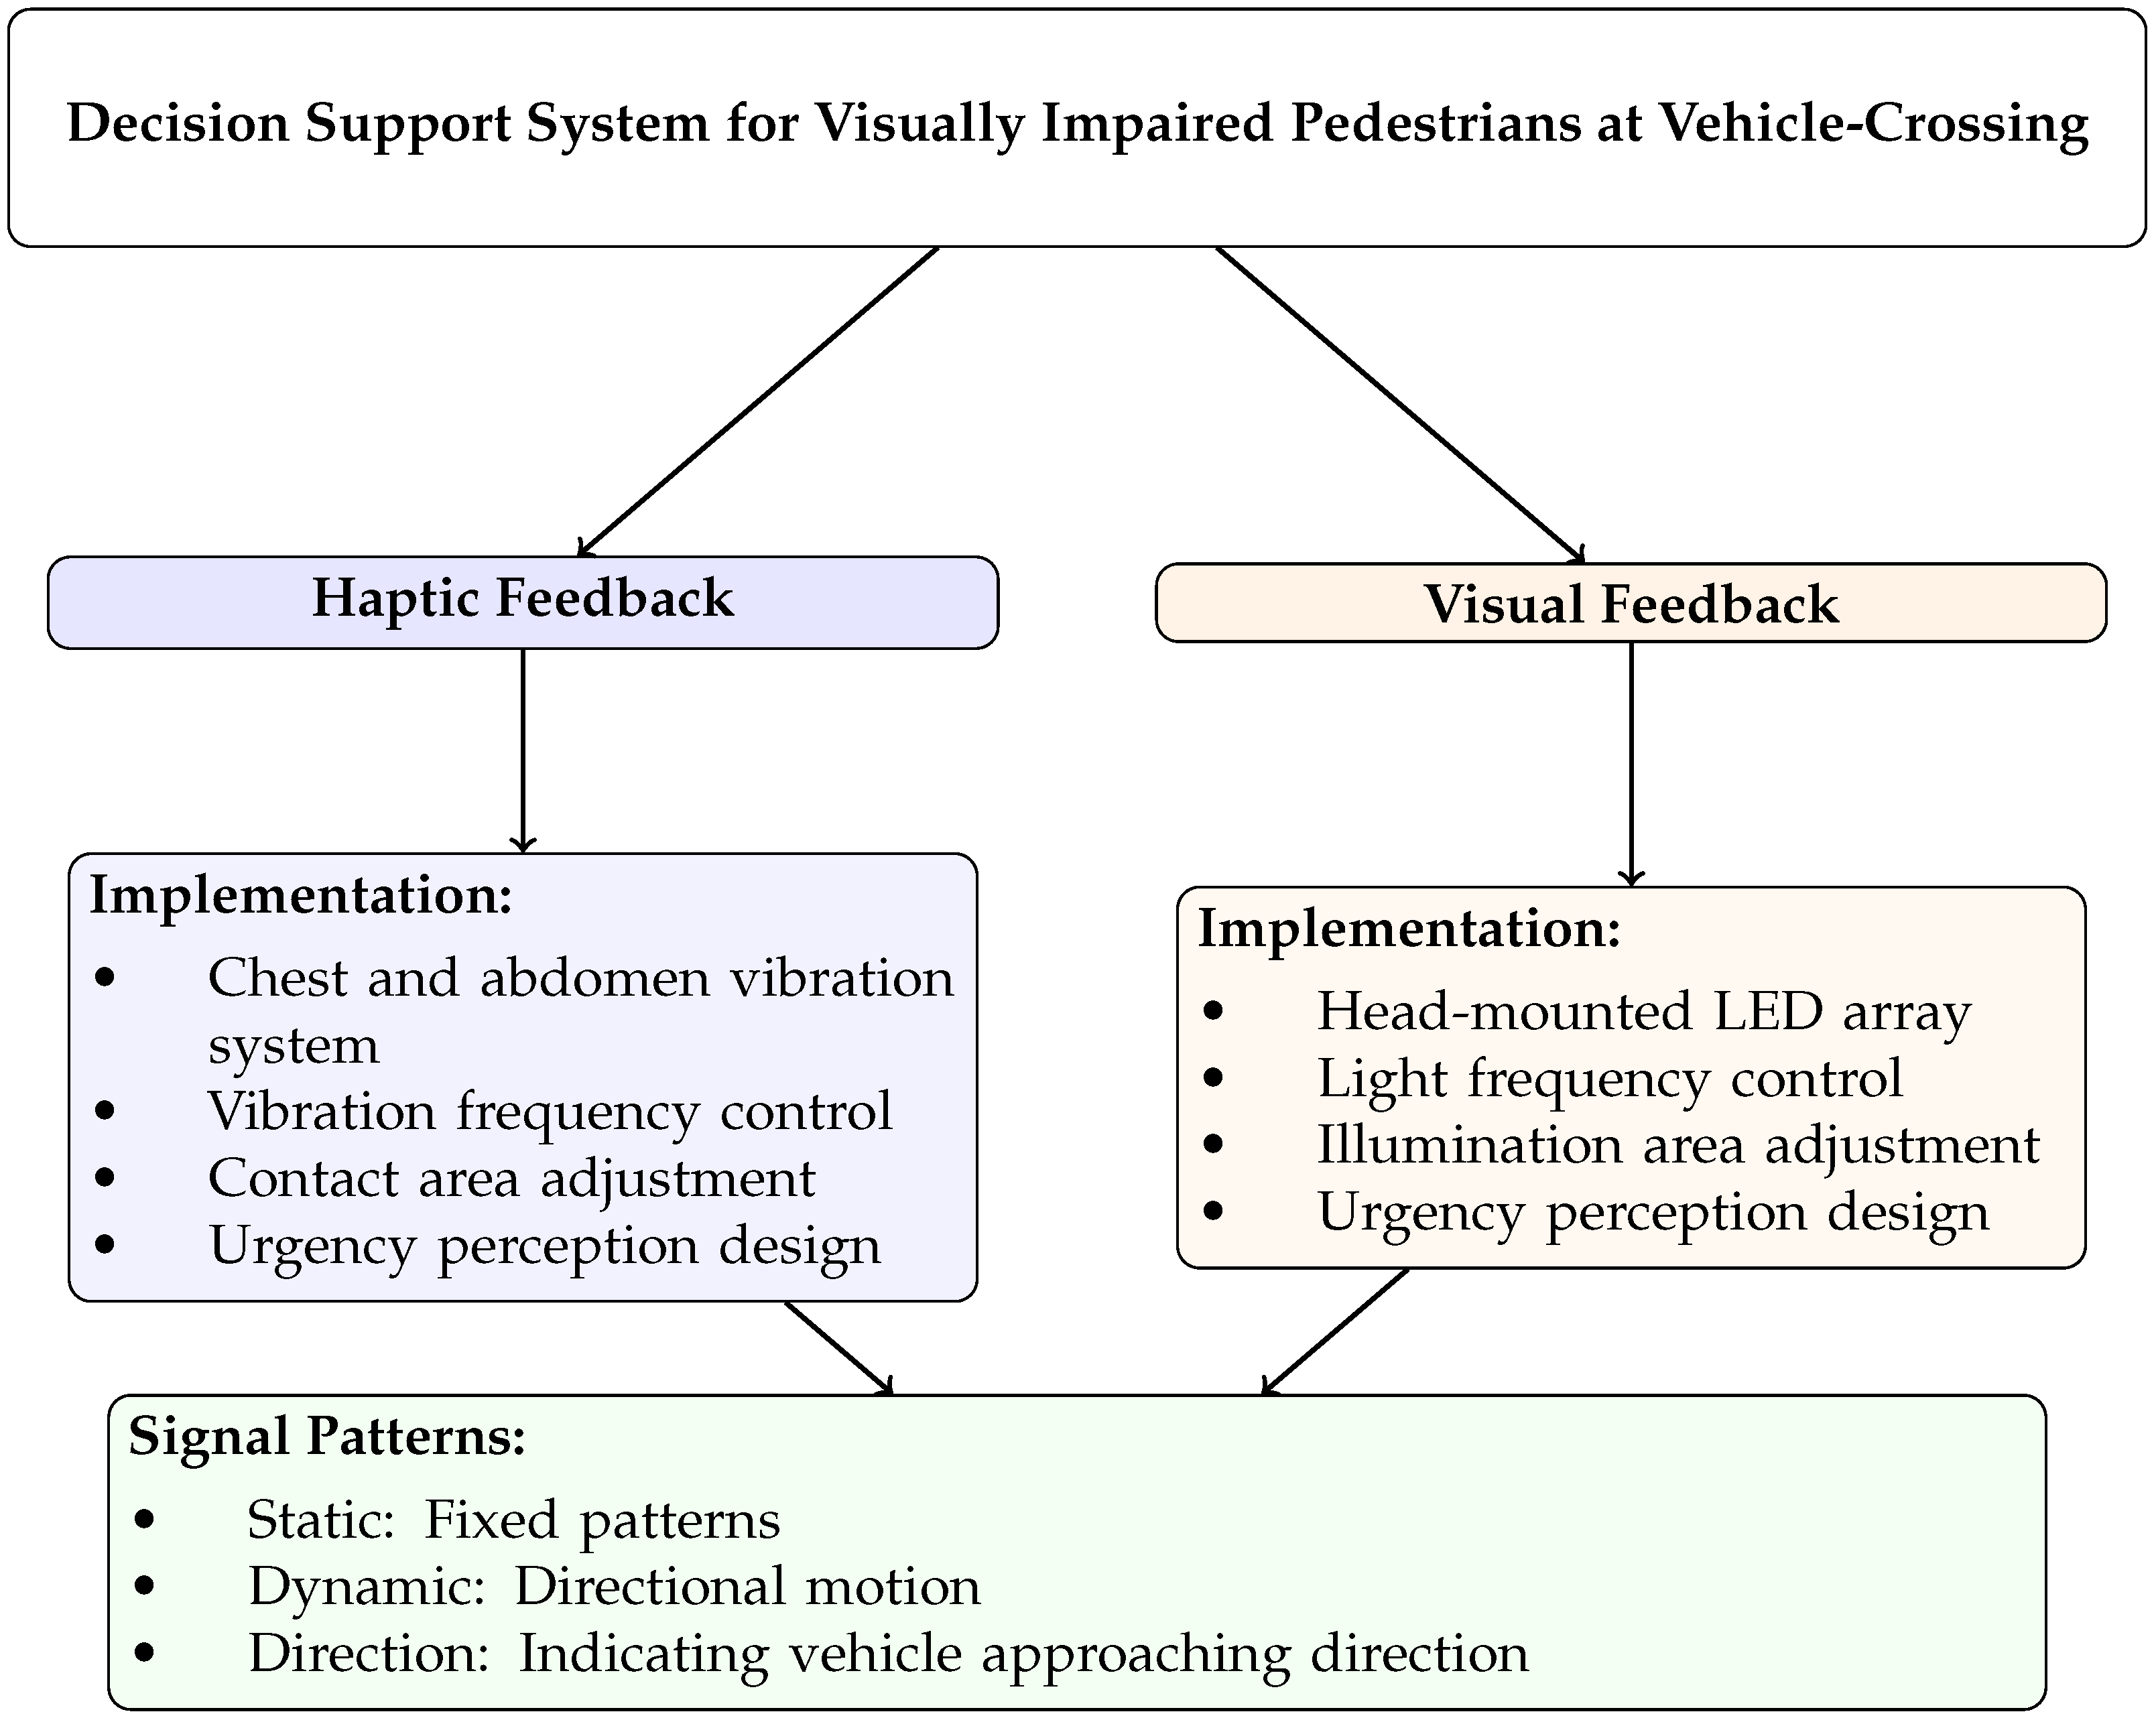
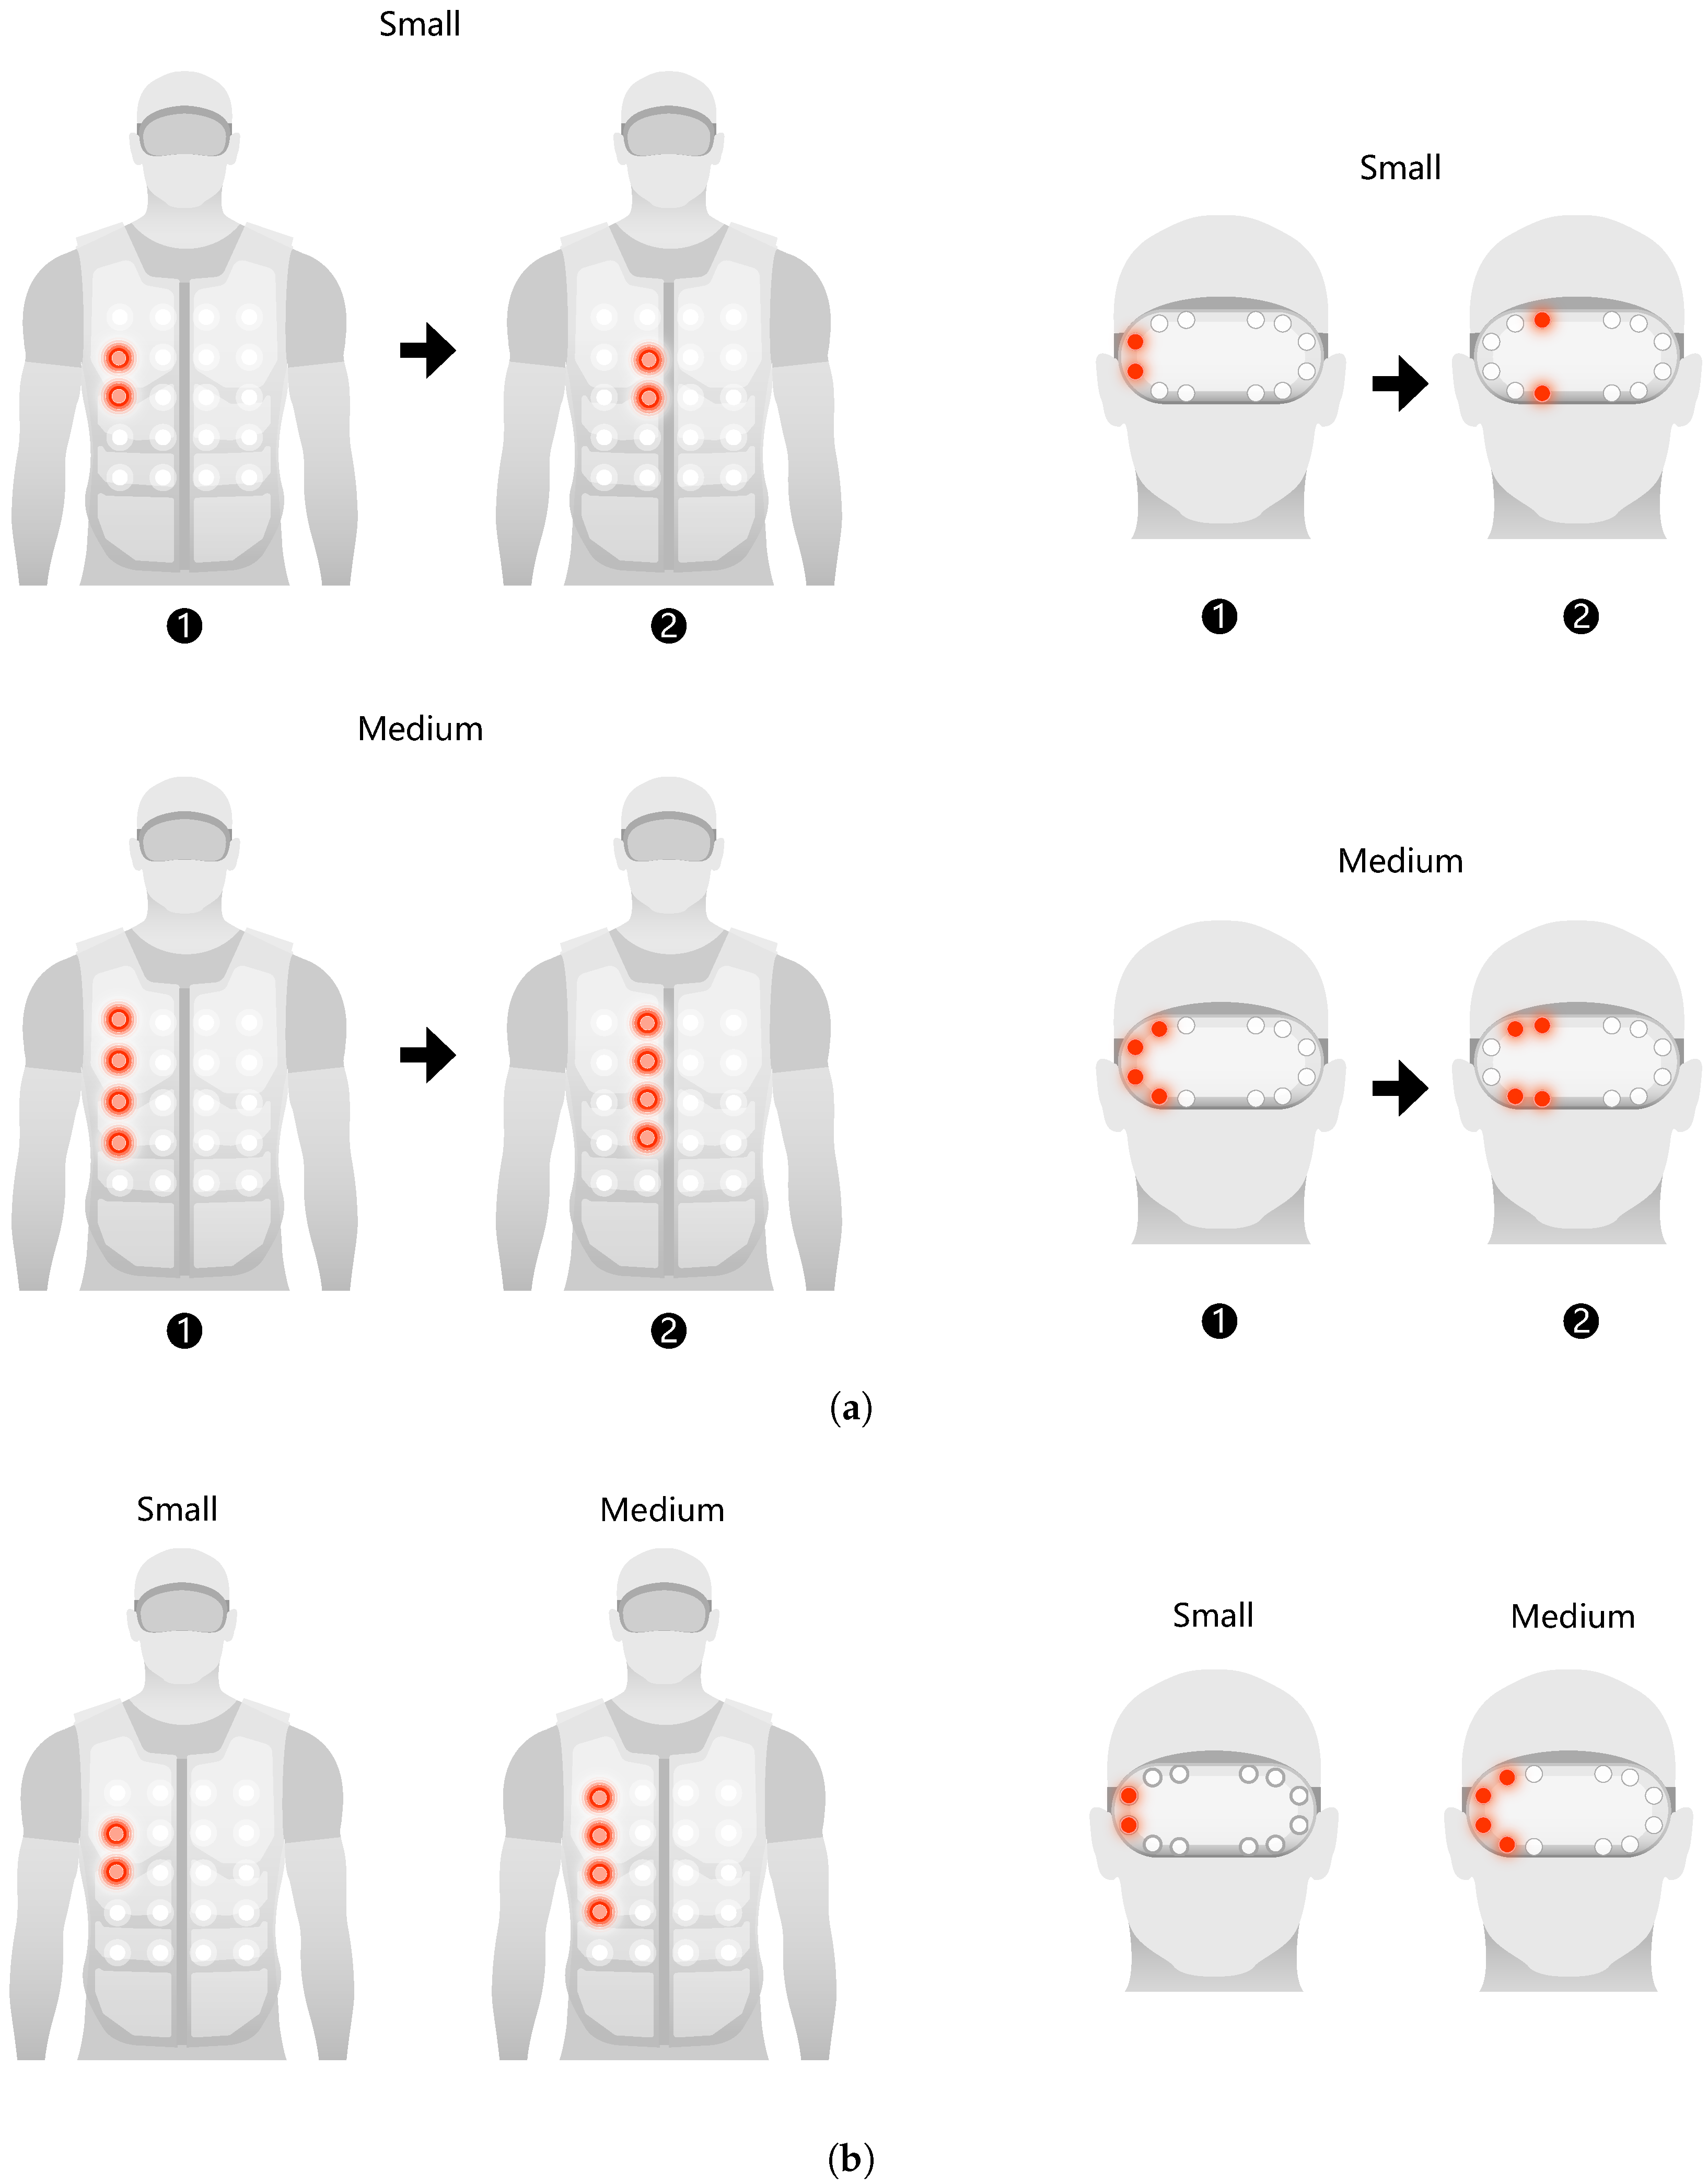
3.1.1. Haptic and Visual Feedback Design in Assistive Systems for Visually Impaired Pedestrians
3.1.2. Experimental Settings
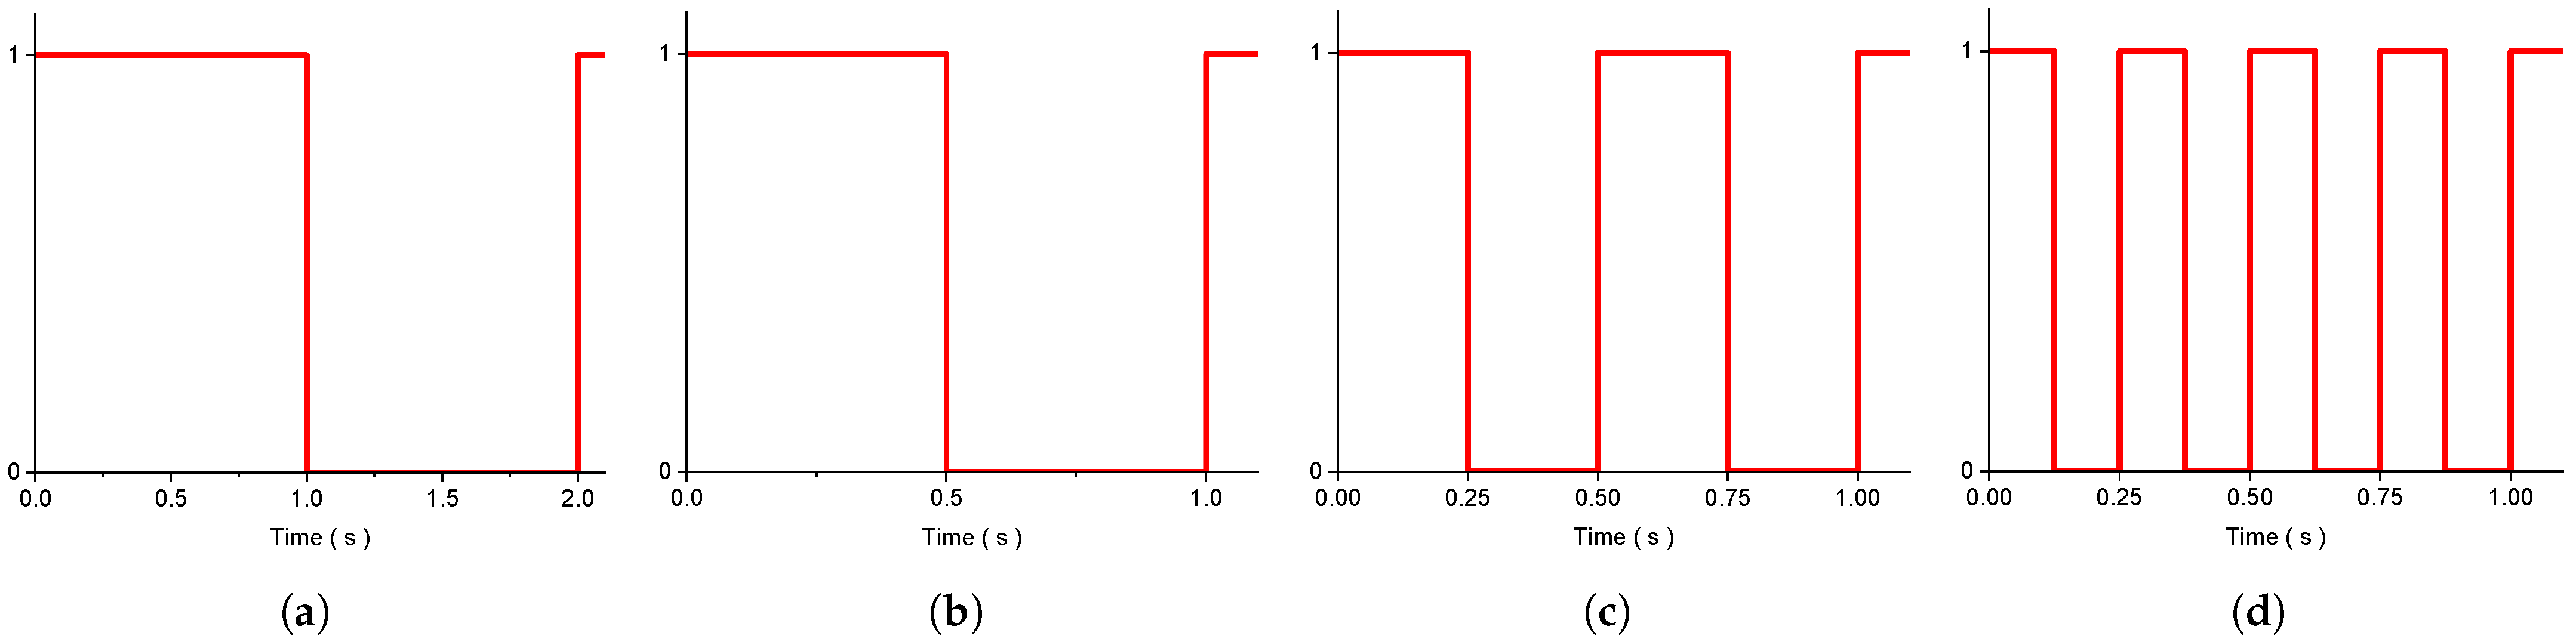
3.1.3. Independent Variables
3.1.4. Experimental Design
3.1.5. Participants and Procedure
3.2. Results
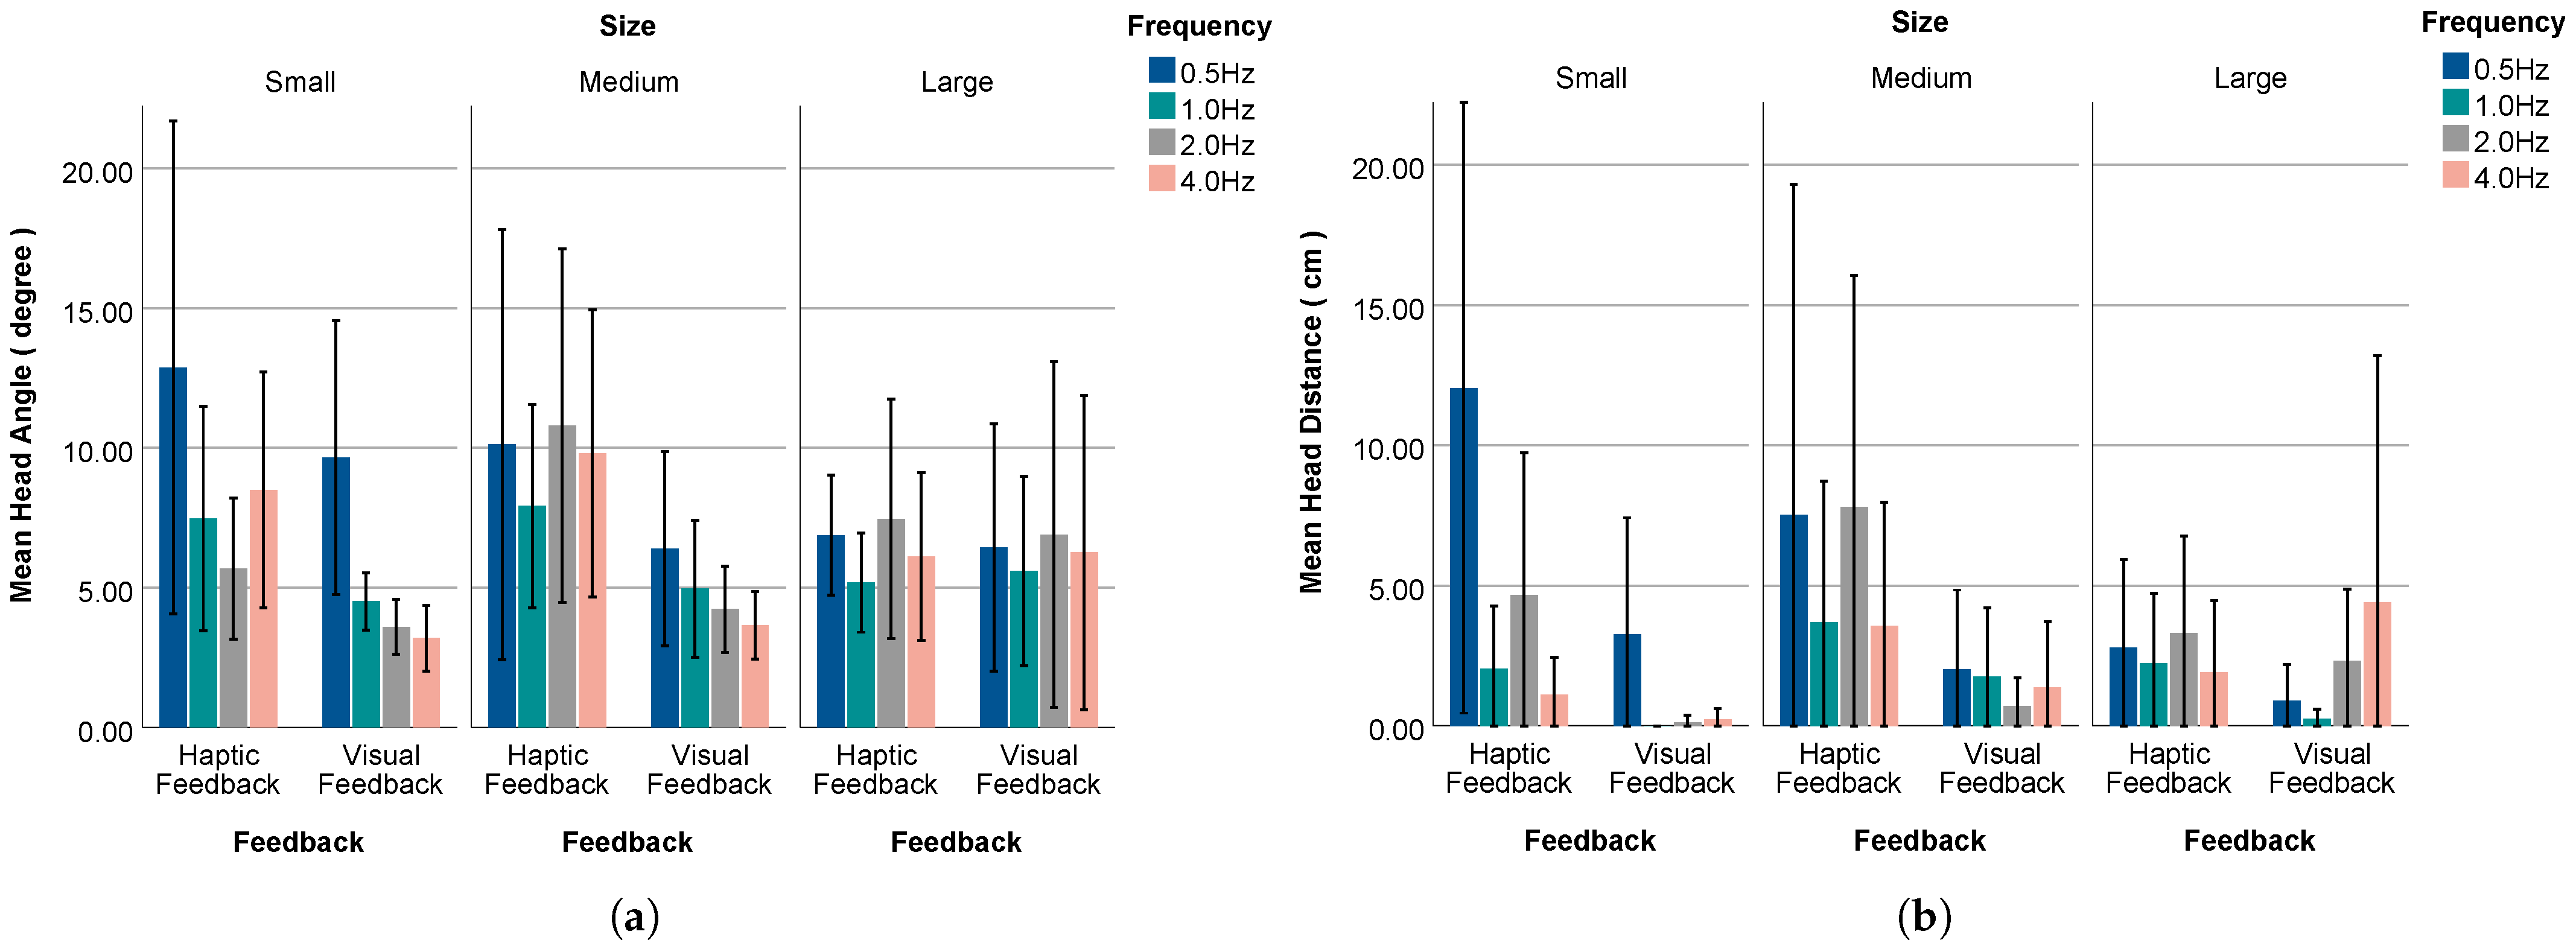
3.2.1. Cross Rate, Decision Time, and User Behavior Data in Study 1
3.2.2. User Perception of Feedback Patterns
4. Study 2: Haptic and Visual Feedback for Assisting Visually Impaired Pedestrians in Vehicle-Based Crossing Decisions
4.1. Experimental Design
4.1.1. Independent Variables
- Feedback modality (two levels): haptic feedback and visual feedback.
- Feedback direction (two levels): left and right.
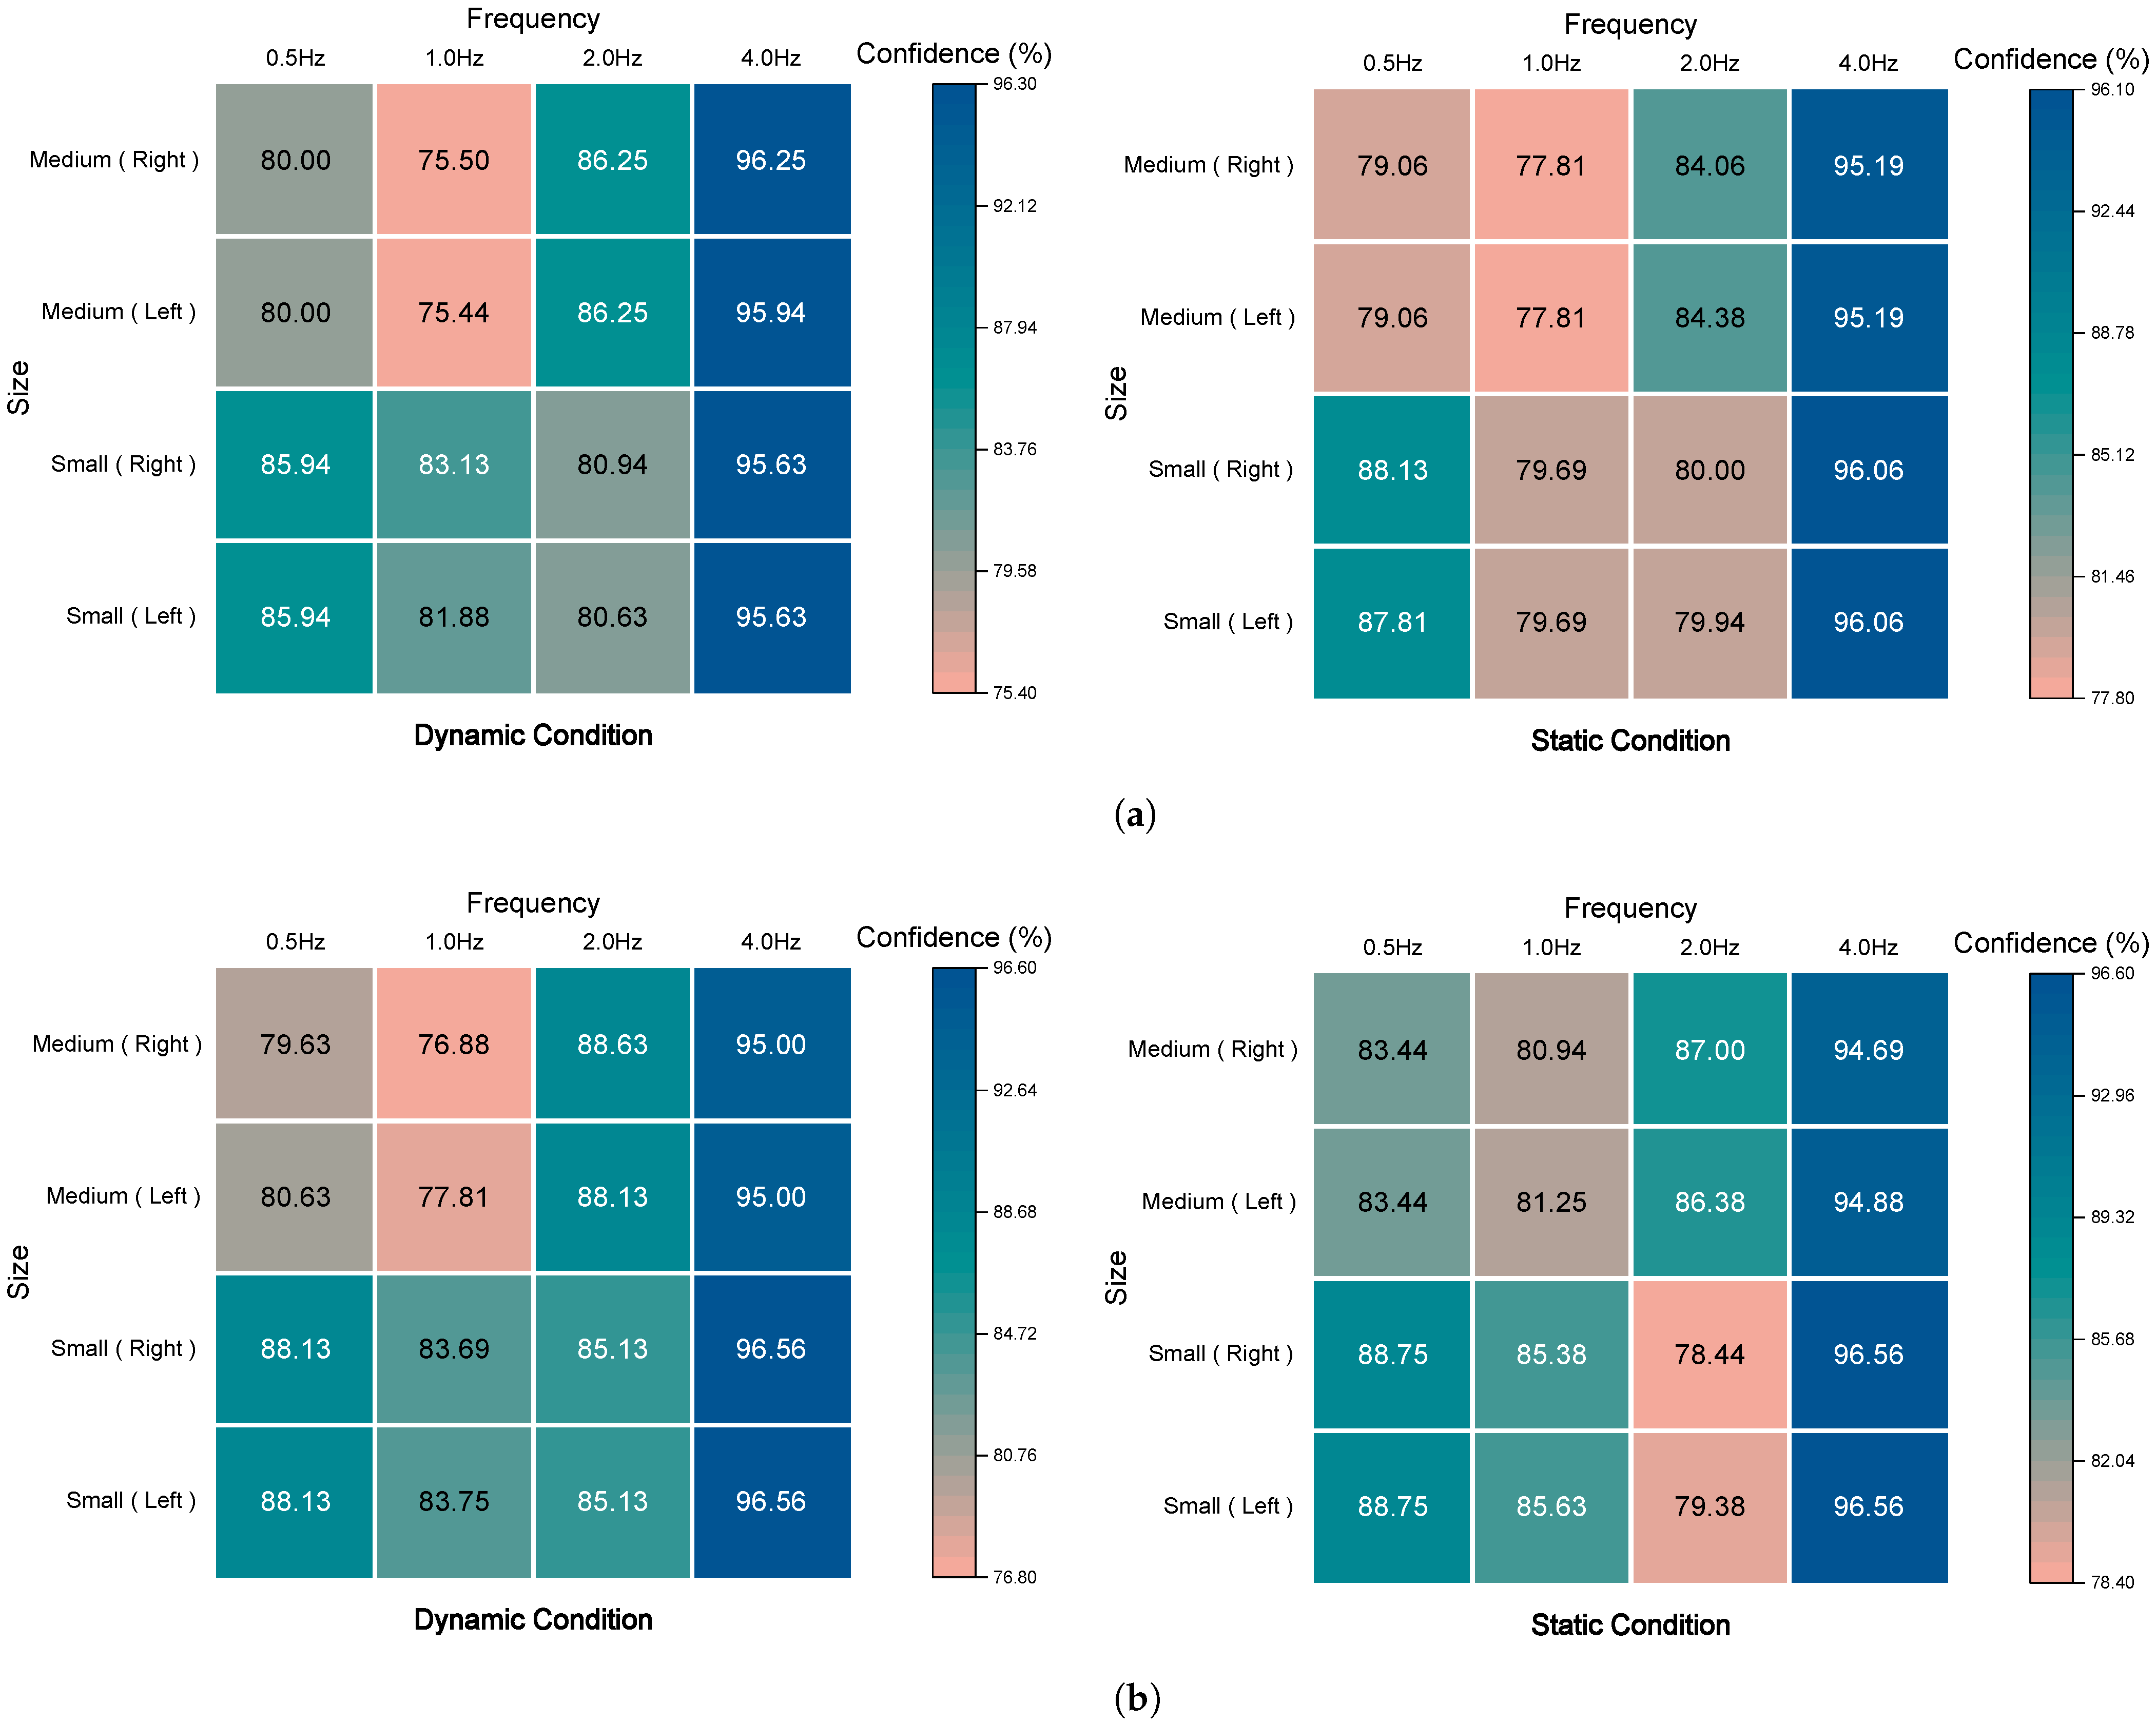
- Feedback state (two levels): dynamic and static, as shown in Figure 9.
- Feedback frequency (four levels): 0.5 Hz, 1.0 Hz, 2.0 Hz, and 4.0 Hz, as shown in Figure 2.
- Feedback size (two levels): small and medium.
4.1.2. Experimental Design
4.1.3. Participants and Procedure
4.2. Results
4.2.1. Cross Rate, Decision Time, and User Behavior Data in Study
4.2.2. User Perception of Feedback Patterns
5. Discussion
5.1. Effects of Feedback Urgency on Decision Time and Crossing Outcomes
5.2. Analysis of Confidence Levels in Relation to Decision Time and Crossing Behavior
5.3. Implications for Haptic and Visual Feedback Design
- Visual feedback significantly improved decision-making efficiency, conveying urgency that enabled users to act quickly even at lower confidence levels. Designers targeting individuals with light perception should leverage visual cues to foster timely and effective decisions.
- Haptic feedback markedly enhanced decision efficiency, particularly for users with higher confidence, who could respond more rapidly than with visual feedback. Assistive systems requiring quick, confident decisions should prioritize haptic feedback to facilitate swift user reactions.
- Visual feedback induces more cautious behavior among users, owing to its stronger sense of urgency, particularly under high-frequency cues. This approach is beneficial for scenarios that demand heightened risk awareness, such as crossing busy multi-lane roads.
- Across both scenarios, a notable user preference emerged for haptic feedback, with participants citing comfort and intuitive information delivery. Given the respective strengths of both modalities, assistive systems should allow users to select their preferred method based on personal needs and specific crossing circumstances.
6. Conclusions
Author Contributions
Funding
Institutional Review Board Statement
Informed Consent Statement
Data Availability Statement
Acknowledgments
Conflicts of Interest
Abbreviations
| 3D | Three-Dimensional |
| IoT | Internet of Things |
| V2X | Vehicle-to-Everything |
| MQTT | Message Queuing Telemetry Transport |
| GEEs | Generalized Estimating Equations |
References
- World Health Organization. World Report on Vision; Technical Report; World Health Organization: Geneva, Switzerland, 2019. [Google Scholar]
- Weiland, J.; Humayun, M. Intraocular retinal prosthesis. IEEE Eng. Med. Biol. Mag. 2006, 25, 60–66. [Google Scholar] [CrossRef] [PubMed]
- Morley, J.W.; Chowdhury, V.; Coroneo, M.T. Visual Cortex and Extraocular Retinal Stimulation with Surface Electrode Arrays. In Visual Prosthesis and Ophthalmic Devices; Humana Press: Totowa, NJ, USA, 2007; pp. 159–171. [Google Scholar] [CrossRef]
- Tian, S.; Zheng, M.; Zou, W.; Li, X.; Zhang, L. Dynamic Crosswalk Scene Understanding for the Visually Impaired. IEEE Trans. Neural Syst. Rehabil. Eng. 2021, 29, 1478–1486. [Google Scholar] [CrossRef]
- Huang, C.Y.; Wu, C.K.; Liu, P.Y. Assistive technology in smart cities: A case of street crossing for the visually-impaired. Technol. Soc. 2022, 68, 101805. [Google Scholar] [CrossRef]
- Hassan, S.E. Are normally sighted, visually impaired, and blind pedestrians accurate and reliable at making street crossing decisions? Investig. Ophthalmol. Vis. Sci. 2012, 53, 2593–2600. [Google Scholar] [CrossRef] [PubMed]
- Geruschat, D.R.; Hassan, S.E. Driver behavior in yielding to sighted and blind pedestrians at roundabouts. J. Vis. Impair. Blind. 2005, 99, 286–302. [Google Scholar] [CrossRef]
- Ihejimba, C.; Wenkstern, R.Z. DetectSignal: A Cloud-Based Traffic Signal Notification System for the Blind and Visually Impaired. In Proceedings of the 2020 IEEE International Smart Cities Conference (ISC2), Piscataway, NJ, USA, 28 September–1 October 2020; pp. 1–6, ISBN 9781728182940. [Google Scholar] [CrossRef]
- Ahmetovic, D.; Gleason, C.; Ruan, C.; Kitani, K.; Takagi, H.; Asakawa, C. NavCog: A navigational cognitive assistant for the blind. In Proceedings of the 18th International Conference on Human-Computer Interaction with Mobile Devices and Services, Florence, Italy, 6–9 September 2016; pp. 90–99, ISBN 9781450344081. [Google Scholar] [CrossRef]
- Khan, A.; Khusro, S. An insight into smartphone-based assistive solutions for visually impaired and blind people: Issues, challenges and opportunities. Univers. Access Inf. Soc. 2021, 20, 265–298. [Google Scholar] [CrossRef]
- Budrionis, A.; Plikynas, D.; Daniušis, P.; Indrulionis, A. Smartphone-based computer vision travelling aids for blind and visually impaired individuals: A systematic review. Assist. Technol. 2022, 34, 178–194. [Google Scholar] [CrossRef]
- See, A.R.; Sasing, B.G.; Advincula, W.D. A smartphone-based mobility assistant using depth imaging for visually impaired and blind. Appl. Sci. 2022, 12, 2802. [Google Scholar] [CrossRef]
- Dhod, R.; Singh, G.; Singh, G.; Kaur, M. Low cost GPS and GSM based navigational aid for visually impaired people. Wirel. Pers. Commun. 2017, 92, 1575–1589. [Google Scholar] [CrossRef]
- Bhatnagar, A.; Ghosh, A.; Florence, S.M. Android integrated voice based walking stick for blind with obstacle recognition. In Proceedings of the 2022 Fourth International Conference on Emerging Research in Electronics, Computer Science and Technology (ICERECT), Mandya, India, 26–27 December 2022; pp. 1–4, ISBN 9781665456357. [Google Scholar] [CrossRef]
- Mai, C.; Chen, H.; Zeng, L.; Li, Z.; Liu, G.; Qiao, Z.; Qu, Y.; Li, L.; Li, L. A smart cane based on 2D LiDAR and RGB-D camera sensor-realizing navigation and obstacle recognition. Sensors 2024, 24, 870. [Google Scholar] [CrossRef]
- Guerreiro, J.; Sato, D.; Asakawa, S.; Dong, H.; Kitani, K.M.; Asakawa, C. CaBot: Designing and evaluating an autonomous navigation robot for blind people. In Proceedings of the 21st International ACM SIGACCESS Conference on Computers and Accessibility, Pittsburgh, PA, USA, 28–30 October 2019; pp. 68–82, ISBN 9781450366762. [Google Scholar] [CrossRef]
- Wang, L.; Chen, Q.; Zhang, Y.; Li, Z.; Yan, T.; Wang, F.; Zhou, G.; Gong, J. Can Quadruped Guide Robots be Used as Guide Dogs? In Proceedings of the 2023 IEEE/RSJ International Conference on Intelligent Robots and Systems (IROS), Detroit, MI, USA, 1–5 October 2023; pp. 4094–4100, ISBN 9781665491907. [Google Scholar] [CrossRef]
- Chen, Y.; Xu, Z.; Jian, Z.; Tang, G.; Yang, L.; Xiao, A.; Wang, X.; Liang, B. Quadruped guidance robot for the visually impaired: A comfort-based approach. In Proceedings of the 2023 IEEE International Conference on Robotics and Automation (ICRA), London, UK, 29 May–2 June 2023; pp. 12078–12084, ISBN 9798350323658. [Google Scholar] [CrossRef]
- National Cooperative Highway Research Program; Transportation Research Board; National Academies of Sciences, Engineering, and Medicine. Accessible Pedestrian Signals: A Guide to Best Practices (Workshop Edition 2010); The National Academies Press: Washington, DC, USA, 2011; p. 22902. [Google Scholar] [CrossRef]
- Manchikanti, N.; Kumar, G.S.; Vidyadhar, R.; Dendi, P.; Yarabolu, V. Innovation in Public Transportation and Improving Accessibility for the Blind. In Proceedings of the 2023 International Conference on Circuit Power and Computing Technologies (ICCPCT), Kollam, India, 10–11 August 2023; pp. 125–129, ISBN 9798350333244. [Google Scholar] [CrossRef]
- Geruschat, D.R.; Fujiwara, K.; Wall Emerson, R.S. Traffic gap detection for pedestrians with low vision. Optom. Vis. Sci. 2011, 88, 208–216. [Google Scholar] [CrossRef] [PubMed]
- Uematsu, A.; Inoue, K.; Hobara, H.; Kobayashi, H.; Iwamoto, Y.; Hortobágyi, T.; Suzuki, S. Preferred step frequency minimizes veering during natural human walking. Neurosci. Lett. 2011, 505, 291–293. [Google Scholar] [CrossRef] [PubMed]
- Bharadwaj, A.; Shaw, S.B.; Goldreich, D. Comparing tactile to auditory guidance for blind individuals. Front. Hum. Neurosci. 2019, 13, 443. [Google Scholar] [CrossRef]
- Jones, L.A.; Sarter, N.B. Tactile displays: Guidance for their design and application. Hum. Factors J. Hum. Factors Ergon. Soc. 2008, 50, 90–111. [Google Scholar] [CrossRef]
- Gustafson-Pearce, O.; Billett, E.; Cecelja, F. Comparison between audio and tactile systems for delivering simple navigational information to visually impaired pedestrians. Br. J. Vis. Impair. 2007, 25, 255–265. [Google Scholar] [CrossRef]
- Ross, D.A.; Blasch, B.B. Wearable interfaces for orientation and wayfinding. In Proceedings of the Fourth International ACM Conference on Assistive Technologies, Arlington, VA, USA, 13–15 November 2000; pp. 193–200. [Google Scholar] [CrossRef]
- Yang, C.; Xu, S.; Yu, T.; Liu, G.; Yu, C.; Shi, Y. LightGuide: Directing Visually Impaired People Along a Path Using Light Cues. Proc. ACM Interact. Mob. Wearable Ubiquitous Technol. 2021, 5, 1–27. [Google Scholar] [CrossRef]
- Hicks, S.L.; Wilson, I.; Muhammed, L.; Worsfold, J.; Downes, S.M.; Kennard, C. A Depth-Based Head-Mounted Visual Display to Aid Navigation in Partially Sighted Individuals. PLoS ONE 2013, 8, e67695. [Google Scholar] [CrossRef]
- Xu, S.; Yang, C.; Ge, W.; Yu, C.; Shi, Y. Virtual paving: Rendering a smooth path for people with visual impairment through vibrotactile and audio feedback. Proc. ACM Interact. Mob. Wearable Ubiquitous Technol. 2020, 4, 1–25. [Google Scholar] [CrossRef]
- Adebiyi, A.; Sorrentino, P.; Bohlool, S.; Zhang, C.; Arditti, M.; Goodrich, G.; Weiland, J.D. Assessment of feedback modalities for wearable visual aids in blind mobility. PLoS ONE 2017, 12, e0170531. [Google Scholar] [CrossRef]
- Flaxman, S.R.; Bourne, R.R.A.; Resnikoff, S.; Ackland, P.; Braithwaite, T.; Cicinelli, M.V.; Das, A.; Jonas, J.B.; Keeffe, J.; Kempen, J.H.; et al. Global causes of blindness and distance vision impairment 1990–2020: A systematic review and meta-analysis. Lancet Glob. Health 2017, 5, e1221–e1234. [Google Scholar] [CrossRef]
- Colenbrander, A. Visual functions and functional vision. Int. Congr. Ser. 2005, 1282, 482–486. [Google Scholar] [CrossRef]
- Pascolini, D.; Mariotti, S.P. Global estimates of visual impairment: 2010. Br. J. Ophthalmol. 2012, 96, 614–618. [Google Scholar] [CrossRef]
- Zhao, Y.; Hu, M.; Hashash, S.; Azenkot, S. Understanding low vision people’s visual perception on commercial augmented reality glasses. In Proceedings of the 2017 CHI Conference on Human Factors in Computing Systems, CHI ’17, New York, NY, USA, 6–11 May 2017; pp. 4170–4181. [Google Scholar] [CrossRef]
- Ashmead, D.H.; Guth, D.; Wall, R.S.; Long, R.G.; Ponchillia, P.E. Street crossing by sighted and blind pedestrians at a modern roundabout. J. Transp. Eng. 2005, 131, 812–821. [Google Scholar] [CrossRef]
- Ghilardi, M.C.; Simoes, G.; Wehrmann, J.; Manssour, I.H.; Barros, R.C. Real-time detection of pedestrian traffic lights for visually-impaired people. In Proceedings of the 2018 International Joint Conference on Neural Networks (IJCNN), Rio de Janeiro, Brazil, 8–13 July 2018; pp. 1–8, ISBN 9781509060146. [Google Scholar] [CrossRef]
- Montanha, A.; Oprescu, A.M.; Romero-Ternero, M. A context-aware artificial intelligence-based system to support street crossings for pedestrians with visual impairments. Appl. Artif. Intell. 2022, 36, 2062818. [Google Scholar] [CrossRef]
- Li, X.; Cui, H.; Rizzo, J.R.; Wong, E.; Fang, Y. Cross-safe: A computer vision-based approach to make all intersection-related pedestrian signals accessible for the visually impaired. In Advances in Computer Vision; Springer International Publishing: Cham, Switzerland, 2020; Volume 944, pp. 132–146. ISBN 9783030177973. [Google Scholar] [CrossRef]
- Chen, L.B.; Pai, W.Y.; Chen, W.H.; Huang, X.R. iDog: An intelligent guide dog harness for visually impaired pedestrians based on artificial intelligence and edge computing. IEEE Sens. J. 2024, 24, 41997–42008. [Google Scholar] [CrossRef]
- Kaul, O.B.; Rohs, M. HapticHead: 3D guidance and target acquisition through a vibrotactile grid. In Proceedings of the 2016 CHI Conference Extended Abstracts on Human Factors in Computing Systems, San Jose, CA, USA, 7–12 May 2016; pp. 2533–2539, ISBN 9781450340823. [Google Scholar] [CrossRef]
- Xiao, J. Haptic Feedback Research of Human-Computer Interaction in Human-Machine Shared Control Context of Smart Cars. In Proceedings of the HCI International 2023 Posters, Copenhagen, Denmark, 23–28 July 2023. [Google Scholar] [CrossRef]
- Spelmezan, D.; Jacobs, M.; Hilgers, A.; Borchers, J. Tactile motion instructions for physical activities. In Proceedings of the SIGCHI Conference on Human Factors in Computing Systems, Boston, MA, USA, 4–9 April 2009; pp. 2243–2252, ISBN 9781605582467. [Google Scholar] [CrossRef]
- Turmo Vidal, L.; Márquez Segura, E.; Parrilla Bel, L.; Waern, A. Exteriorizing Body Alignment in Collocated Physical Training. In Proceedings of the Extended Abstracts of the 2018 CHI Conference on Human Factors in Computing Systems, Montreal, QC, Canada, 21–26 April 2018; pp. 1–6, ISBN 9781450356213. [Google Scholar] [CrossRef]
- Hayward, V.; Maclean, K.E. Do it yourself haptics: Part I. IEEE Robot. Autom. Mag. 2007, 14, 88–104. [Google Scholar] [CrossRef]
- Cholewiak, R.W.; Brill, J.C.; Schwab, A. Vibrotactile localization on the abdomen: Effects of place and space. Percept. Psychophys. 2004, 66, 970–987. [Google Scholar] [CrossRef]
- Van Erp, J.B.; Werkhoven, P.; Werkhoven, P. Validation of Principles for Tactile Navigation Displays. Proc. Hum. Factors Ergon. Soc. Annu. Meet. 2006, 50, 1687–1691. [Google Scholar] [CrossRef]
- Weber, B.; Schatzle, S.; Hulin, T.; Preusche, C.; Deml, B. Evaluation of a vibrotactile feedback device for spatial guidance. In Proceedings of the 2011 IEEE World Haptics Conference, Istanbul, Turkey, 21–24 June 2011; pp. 349–354, ISBN 9781457702990. [Google Scholar] [CrossRef]
- Wang, Y.; Kuchenbecker, K.J. HALO: Haptic alerts for low-hanging obstacles in white cane navigation. In Proceedings of the 2012 IEEE Haptics Symposium (HAPTICS), Vancouver, BC, Canada, 4–7 March 2012; pp. 527–532, ISSN 2324-7355. [Google Scholar] [CrossRef]
- Hertel, J.; Schaare, A.; Feuerbach, P.; Ariza, O.; Steinicke, F. STIC—Sensory and tactile improved cane. In Proceedings of the Mensch und Computer 2019, Hamburg, Germany, 8–11 September 2019; pp. 765–769, ISBN 9781450371988. [Google Scholar] [CrossRef]
- Shah, C.; Bouzit, M.; Youssef, M.; Vasquez, L. Evaluation of RU-netra - tactile feedback navigation system for the visually impaired. In Proceedings of the 2006 International Workshop on Virtual Rehabilitation, New York, NY, USA, 29–30 August 2006; pp. 72–77, ISBN 9781424402809. [Google Scholar] [CrossRef]
- Flores, G.; Kurniawan, S.; Manduchi, R.; Martinson, E.; Morales, L.M.; Sisbot, E.A. Vibrotactile guidance for wayfinding of blind walkers. IEEE Trans. Haptics 2015, 8, 306–317. [Google Scholar] [CrossRef]
- Cosgun, A.; Sisbot, E.A.; Christensen, H.I. Evaluation of rotational and directional vibration patterns on a tactile belt for guiding visually impaired people. In Proceedings of the 2014 IEEE Haptics Symposium (HAPTICS), Houston, TX, USA, 23–26 February 2014; pp. 367–370, ISBN 9781479931316. [Google Scholar] [CrossRef]
- Katzschmann, R.K.; Araki, B.; Rus, D. Safe local navigation for visually impaired users with a time-of-flight and haptic feedback device. IEEE Trans. Neural Syst. Rehabil. Eng. 2018, 26, 583–593. [Google Scholar] [CrossRef]
- Ni, D.; Wang, L.; Ding, Y.; Zhang, J.; Song, A.; Wu, J. The design and implementation of a walking assistant system with vibrotactile indication and voice prompt for the visually impaired. In Proceedings of the 2013 IEEE International Conference on Robotics and Biomimetics (ROBIO), Shenzhen, China, 12–14 December 2013; pp. 2721–2726, ISBN 9781479927449. [Google Scholar] [CrossRef]
- Pradeep, V.; Medioni, G.; Weiland, J. Robot vision for the visually impaired. In Proceedings of the 2010 IEEE Computer Society Conference on Computer Vision and Pattern Recognition—Workshops, San Francisco, CA, USA, 13–18 June 2010; pp. 15–22, ISBN 9781424470297. [Google Scholar] [CrossRef]
- Pradeep, V.; Medioni, G.; Weiland, J. A wearable system for the visually impaired. In Proceedings of the 2010 Annual International Conference of the IEEE Engineering in Medicine and Biology, Buenos Aires, Argentina, 31 August–4 September 2010; pp. 6233–6236, ISBN 9781424441235. [Google Scholar] [CrossRef]
- Han, S.B.; Kim, D.H.; Kim, J.H. Fuzzy gaze control-based navigational assistance system for visually impaired people in a dynamic indoor environment. In Proceedings of the 2015 IEEE International Conference on Fuzzy Systems (FUZZ-IEEE), Istanbul, Turkey, 2–5 August 2015; pp. 1–7, ISBN 9781467374286. [Google Scholar] [CrossRef]
- Bourbakis, N.; Keefer, R.; Dakopoulos, D.; Esposito, A. A multimodal interaction scheme between a blind user and the tyflos assistive prototype. In Proceedings of the 2008 20th IEEE International Conference on Tools with Artificial Intelligence, Dayton, OH, USA, 3–5 November 2008; pp. 487–494, ISBN 9780769534404. [Google Scholar] [CrossRef]
- Dakopoulos, D.; Bourbakis, N. Towards a 2D tactile vocabulary for navigation of blind and visually impaired. In Proceedings of the 2009 IEEE International Conference on Systems, Man and Cybernetics, San Antonio, TX, USA, 11–14 October 2009; pp. 45–51, ISBN 9781424427932. [Google Scholar] [CrossRef]
- De Jesus Oliveira, V.A.; Nedel, L.; Maciel, A.; Brayda, L. Localized magnification in vibrotactile HMDs for accurate spatial awareness. In Haptics: Perception, Devices, Control, and Applications; Lecture Notes in Computer Science; Springer Science & Business Media: Cham, Switzerland, 2016; Volume 9775, pp. 55–64. [Google Scholar] [CrossRef]
- De Jesus Oliveira, V.A.; Nedel, L.; Maciel, A.; Brayda, L. Anti-veering vibrotactile HMD for assistance of blind pedestrians, In Haptics: Science, Technology, and Applications Series; Lecture Notes in Computer Science; Springer Science & Business Media: Cham, Switzerland, 2018; Volume 10894, pp. 500–512. [Google Scholar] [CrossRef]
- Vorapatratorn, S.; Teachavorasinskun, K. iSonar-2: Obstacle warning device, the assistive technology integrated with universal design for the blind. In Proceedings of the 11th International Convention on Rehabilitation Engineering and Assistive Technology, Midview City, Singapore, 25–28 July 2017; pp. 1–4. [Google Scholar]
- Velázquez, R.; Bazán, O. Preliminary evaluation of podotactile feedback in sighted and blind users. In Proceedings of the 2010 Annual International Conference of the IEEE Engineering in Medicine and Biology, Buenos Aires, Argentina, 31 August–4 September 2010; pp. 2103–2106, ISBN 9781424441235. [Google Scholar] [CrossRef]
- Schaack, S.; Chernyshov, G.; Ragozin, K.; Tag, B.; Peiris, R.; Kunze, K. Haptic collar: Vibrotactile feedback around the neck for guidance applications. In Proceedings of the 10th Augmented Human International Conference 2019, Reims, France, 11–12 March 2019; pp. 1–4, ISBN 9781450365475. [Google Scholar] [CrossRef]
- Liu, G.; Yu, T.; Yu, C.; Xu, H.; Xu, S.; Yang, C.; Wang, F.; Mi, H.; Shi, Y. Tactile compass: Enabling visually impaired people to follow a path with continuous directional feedback. In Proceedings of the 2021 CHI Conference on Human Factors in Computing Systems, Yokohama, Japan, 8–13 May 2021; pp. 1–13, ISBN 9781450380966. [Google Scholar] [CrossRef]
- Leporini, B.; Raucci, M.; Rosellini, M.; Forgione, N. Towards a haptic-based virtual cane to assist blind people in obstacle detection. In Proceedings of the PETRA’23: Proceedings of the 16th International Conference on PErvasive Technologies Related to Assistive Environments, Corfu, Greece, 5–7 July 2023. [Google Scholar]
- Erp, J.B.F.V.; Paul, K.I.; Mioch, T. Tactile working memory capacity of users who are blind in an electronic travel aid application with a vibration belt. ACM Trans. Access. Comput. 2020, 13, 1–14. [Google Scholar] [CrossRef]
- Lee, M.; In, H. Novel wrist-worn vibrotactile device for providing multi-categorical information for orientation and mobility of the blind and visually impaired. IEEE Access 2023, 11, 111860–111874. [Google Scholar] [CrossRef]
- Jones, T.; Troscianko, T. Mobility performance of low-vision adults using an electronic mobility aid. Clin. Exp. Optom. 2006, 89, 10–17. [Google Scholar] [CrossRef]
- van Rheede, J.J.; Wilson, I.R.; Qian, R.I.; Downes, S.M.; Kennard, C.; Hicks, S.L. Improving mobility performance in low vision with a distance-based representation of the visual scene. Investig. Ophthalmol. Vis. Sci. 2015, 56, 4802–4809. [Google Scholar] [CrossRef]
- Kinateder, M.; Gualtieri, J.; Dunn, M.J.; Jarosz, W.; Yang, X.D.; Cooper, E.A. Using an augmented reality device as a distance-based vision aid—Promise and limitations. Optom. Vis. Sci. 2018, 95, 727–737. [Google Scholar] [CrossRef] [PubMed]
- Fox, D.R.; Ahmadzada, A.; Wang, C.T.; Azenkot, S.; Chu, M.A.; Manduchi, R.; Cooper, E.A. Using augmented reality to cue obstacles for people with low vision. Opt. Express 2023, 31, 6827. [Google Scholar] [CrossRef]
- Zhao, Y.; Kupferstein, E.; Rojnirun, H.; Findlater, L.; Azenkot, S. The effectiveness of visual and audio wayfinding guidance on smartglasses for people with low vision. In Proceedings of the 2020 CHI Conference on Human Factors in Computing Systems, Honolulu, HI, USA, 25–30 April 2020; pp. 1–14, ISBN 9781450367080. [Google Scholar] [CrossRef]
- Huang, J.; Kinateder, M.; Dunn, M.J.; Jarosz, W.; Yang, X.D.; Cooper, E.A. An augmented reality sign-reading assistant for users with reduced vision. PLoS ONE 2019, 14, e0210630. [Google Scholar] [CrossRef]
- Zhao, Y.; Kupferstein, E.; Castro, B.V.; Feiner, S.; Azenkot, S. Designing AR visualizations to facilitate stair navigation for people with low vision. In Proceedings of the 32nd Annual ACM Symposium on User Interface Software and Technology, New Orleans, LA, USA, 20–23 October 2019; pp. 387–402, ISBN 9781450368162. [Google Scholar] [CrossRef]
- Zhao, Y.; Szpiro, S.; Azenkot, S. ForeSee: A customizable head-mounted vision enhancement system for people with low vision. In Proceedings of the 17th International ACM SIGACCESS Conference on Computers & Accessibility—ASSETS’15, Lisbon, Portugal, 26–28 October 2015; pp. 239–249, ISBN 9781450334006. [Google Scholar] [CrossRef]
- Angelopoulos, A.N.; Ameri, H.; Mitra, D.; Humayun, M. Enhanced depth navigation through augmented reality depth mapping in patients with low vision. Sci. Rep. 2019, 9, 11230. [Google Scholar] [CrossRef]
- Katemake, P.; Radsamrong, A.; Dinet, É.; Heng, C.W.; Kuang, Y.C.; Kalavally, V.; Trémeau, A. Influence of LED-based assistive lighting solutions on the autonomous mobility of low vision people. Build. Environ. 2019, 157, 172–184. [Google Scholar] [CrossRef]
- Ross, R.D. Is perception of light useful to the blind patient? Arch. Ophthalmol. 1998, 116. [Google Scholar] [CrossRef]
- Karuei, I.; MacLean, K.E.; Foley-Fisher, Z.; MacKenzie, R.; Koch, S.; El-Zohairy, M. Detecting vibrations across the body in mobile contexts. In Proceedings of the SIGCHI Conference on Human Factors in Computing Systems, Vancouver, BC, Canada, 7–12 May 2011; pp. 3267–3276, ISBN 9781450302289. [Google Scholar] [CrossRef]
- Steltenpohl, H.; Bouwer, A. Vibrobelt: Tactile navigation support for cyclists. In Proceedings of the 2013 international Conference on Intelligent User Interfaces, Santa Monica, CA, USA, 19–22 March 2013; pp. 417–426. [Google Scholar] [CrossRef]
- Woźniak, M.P.; Dominiak, J.; Pieprzowski, M.; Ładoński, P.; Grudzień, K.; Lischke, L.; Romanowski, A.; Woźniak, P.W. Subtletee: Augmenting Posture Awareness for Beginner Golfers. Proc. ACM Hum. Comput. Interact. 2020, 4, 1–24. [Google Scholar] [CrossRef]
- Salzer, Y.; Oron-Gilad, T.; Ronen, A. Vibrotactor-Belt on the Thigh – Directions in the Vertical Plane. In Haptics: Generating and Perceiving Tangible Sensations; Lecture Notes in Computer Science; Springer: Berlin/Heidelberg, Germany, 2010; Volume 6192, pp. 359–364. [Google Scholar] [CrossRef]
- Kim, J.; Kim, H.; Park, C.; Choi, S. Human Recognition Performance of Simple Spatial Vibrotactile Patterns on the Torso. In Proceedings of the 2023 IEEE World Haptics Conference (WHC), Delft, The Netherlands, 10–13 July 2023; pp. 20–27, ISBN 9798350399936. [Google Scholar] [CrossRef]
- Park, W.; Alsuradi, H.; Eid, M. EEG correlates to perceived urgency elicited by vibration stimulation of the upper body. Sci. Rep. 2024, 14, 14267. [Google Scholar] [CrossRef] [PubMed]
- Palomares, N.M.C.; Romero, G.B.; Victor, J.L.A. Assessment of User Interpretation on Various Vibration Signals in Mobile Phones. In Proceedings of the Advances in Neuroergonomics and Cognitive Engineering, Washington, DC, USA, 24–28 July 2019; Ayaz, H., Ed.; Springer: Cham, Switzerland, 2020; pp. 500–511. [Google Scholar] [CrossRef]
- Saket, B.; Prasojo, C.; Huang, Y.; Zhao, S. Designing an effective vibration-based notification interface for mobile phones. In Proceedings of the 2013 Conference on Computer Supported Cooperative Work, San Antonio, TX, USA, 23–27 February 2013; pp. 149–1504, ISBN 9781450313315. [Google Scholar] [CrossRef]
- Schömbs, S.; Pareek, S.; Goncalves, J.; Johal, W. Robot-Assisted Decision-Making: Unveiling the Role of Uncertainty Visualisation and Embodiment. In Proceedings of the 2024 CHI Conference on Human Factors in Computing Systems, CHI’24, Honolulu, HI, USA, 11–16 May 2024; pp. 1–16. [Google Scholar] [CrossRef]
- Hanley, J.A. Statistical Analysis of Correlated Data Using Generalized Estimating Equations: An Orientation. Am. J. Epidemiol. 2003, 157, 364–375. [Google Scholar] [CrossRef]
- Ballinger, G.A. Using generalized estimating equations for longitudinal data analysis. Organ. Res. Methods 2004, 7, 127–150. [Google Scholar] [CrossRef]
- Chen, J.; Li, N.; Shi, Y.; Du, J. Cross-cultural assessment of the effect of spatial information on firefighters’ wayfinding performance: A virtual reality-based study. Int. J. Disaster Risk Reduct. 2023, 84, 103486. [Google Scholar] [CrossRef]
- Israr, A.; Poupyrev, I. Tactile brush: Drawing on skin with a tactile grid display. In Proceedings of the SIGCHI Conference on Human Factors in Computing Systems, Vancouver, BC, Canada, 7–12 May 2011; pp. 2019–2028, ISBN 9781450302289. [Google Scholar] [CrossRef]
- Meng, F.; Gray, R.; Ho, C.; Ahtamad, M.; Spence, C. Dynamic vibrotactile signals for forward collision avoidance warning systems. Hum. Factors J. Hum. Factors Ergon. Soc. 2015, 57, 329–346. [Google Scholar] [CrossRef]
- Schneider, O.S.; Israr, A.; MacLean, K.E. Tactile Animation by Direct Manipulation of Grid Displays. In Proceedings of the 28th Annual ACM Symposium on User Interface Software & Technology, Charlotte, NC, USA, 8–11 November 2015; pp. 21–30, ISBN 9781450337793. [Google Scholar] [CrossRef]
- Israr, A.; Poupyrev, I. Exploring surround haptics displays. In Proceedings of the CHI’10 Extended Abstracts on Human Factors in Computing Systems, Atlanta, GA, USA, 10–15 April 2010; pp. 4171–4176, ISBN 9781605589305. [Google Scholar] [CrossRef]
- Israr, A.; Kim, S.C.; Stec, J.; Poupyrev, I. Surround haptics: Tactile feedback for immersive gaming experiences. In Proceedings of the CHI ’12 Extended Abstracts on Human Factors in Computing Systems, Austin, TX, USA, 5–10 May 2012; pp. 1087–1090, ISBN 9781450310161. [Google Scholar] [CrossRef]
- Chien, H.P.; Wu, M.C.; Hsu, C.C. Flowing-Haptic Sleeve: Research on Apparent Tactile Motion Applied to Simulating the Feeling of Flow on the Arm. In Proceedings of the Adjunct Proceedings of the 2021 ACM International Joint Conference on Pervasive and Ubiquitous Computing and Proceedings of the 2021 ACM International Symposium on Wearable Computers, Virtually, 21–26 September 2021; pp. 550–554, ISBN 9781450384612. [Google Scholar] [CrossRef]


| Technology Type | Haptic Feedback | Visual Feedback |
|---|---|---|
| Portable devices | Smart canes and handheld devices [49,65,66] | LED obstacle highlighting [78] |
| Wearable devices | Vibrating belts, backpacks, and wristbands [29,67,68] | LED guides and visual displays [27,28,69] |
| Specific applications | Street-crossing and traffic navigation [25,30] | Navigation markers and enhanced visibility [73,74,75] |
| Feedback Modality | Size | Response | Frequency | |||
|---|---|---|---|---|---|---|
| 0.5 Hz | 1.0 Hz | 2.0 Hz | 4.0 Hz | |||
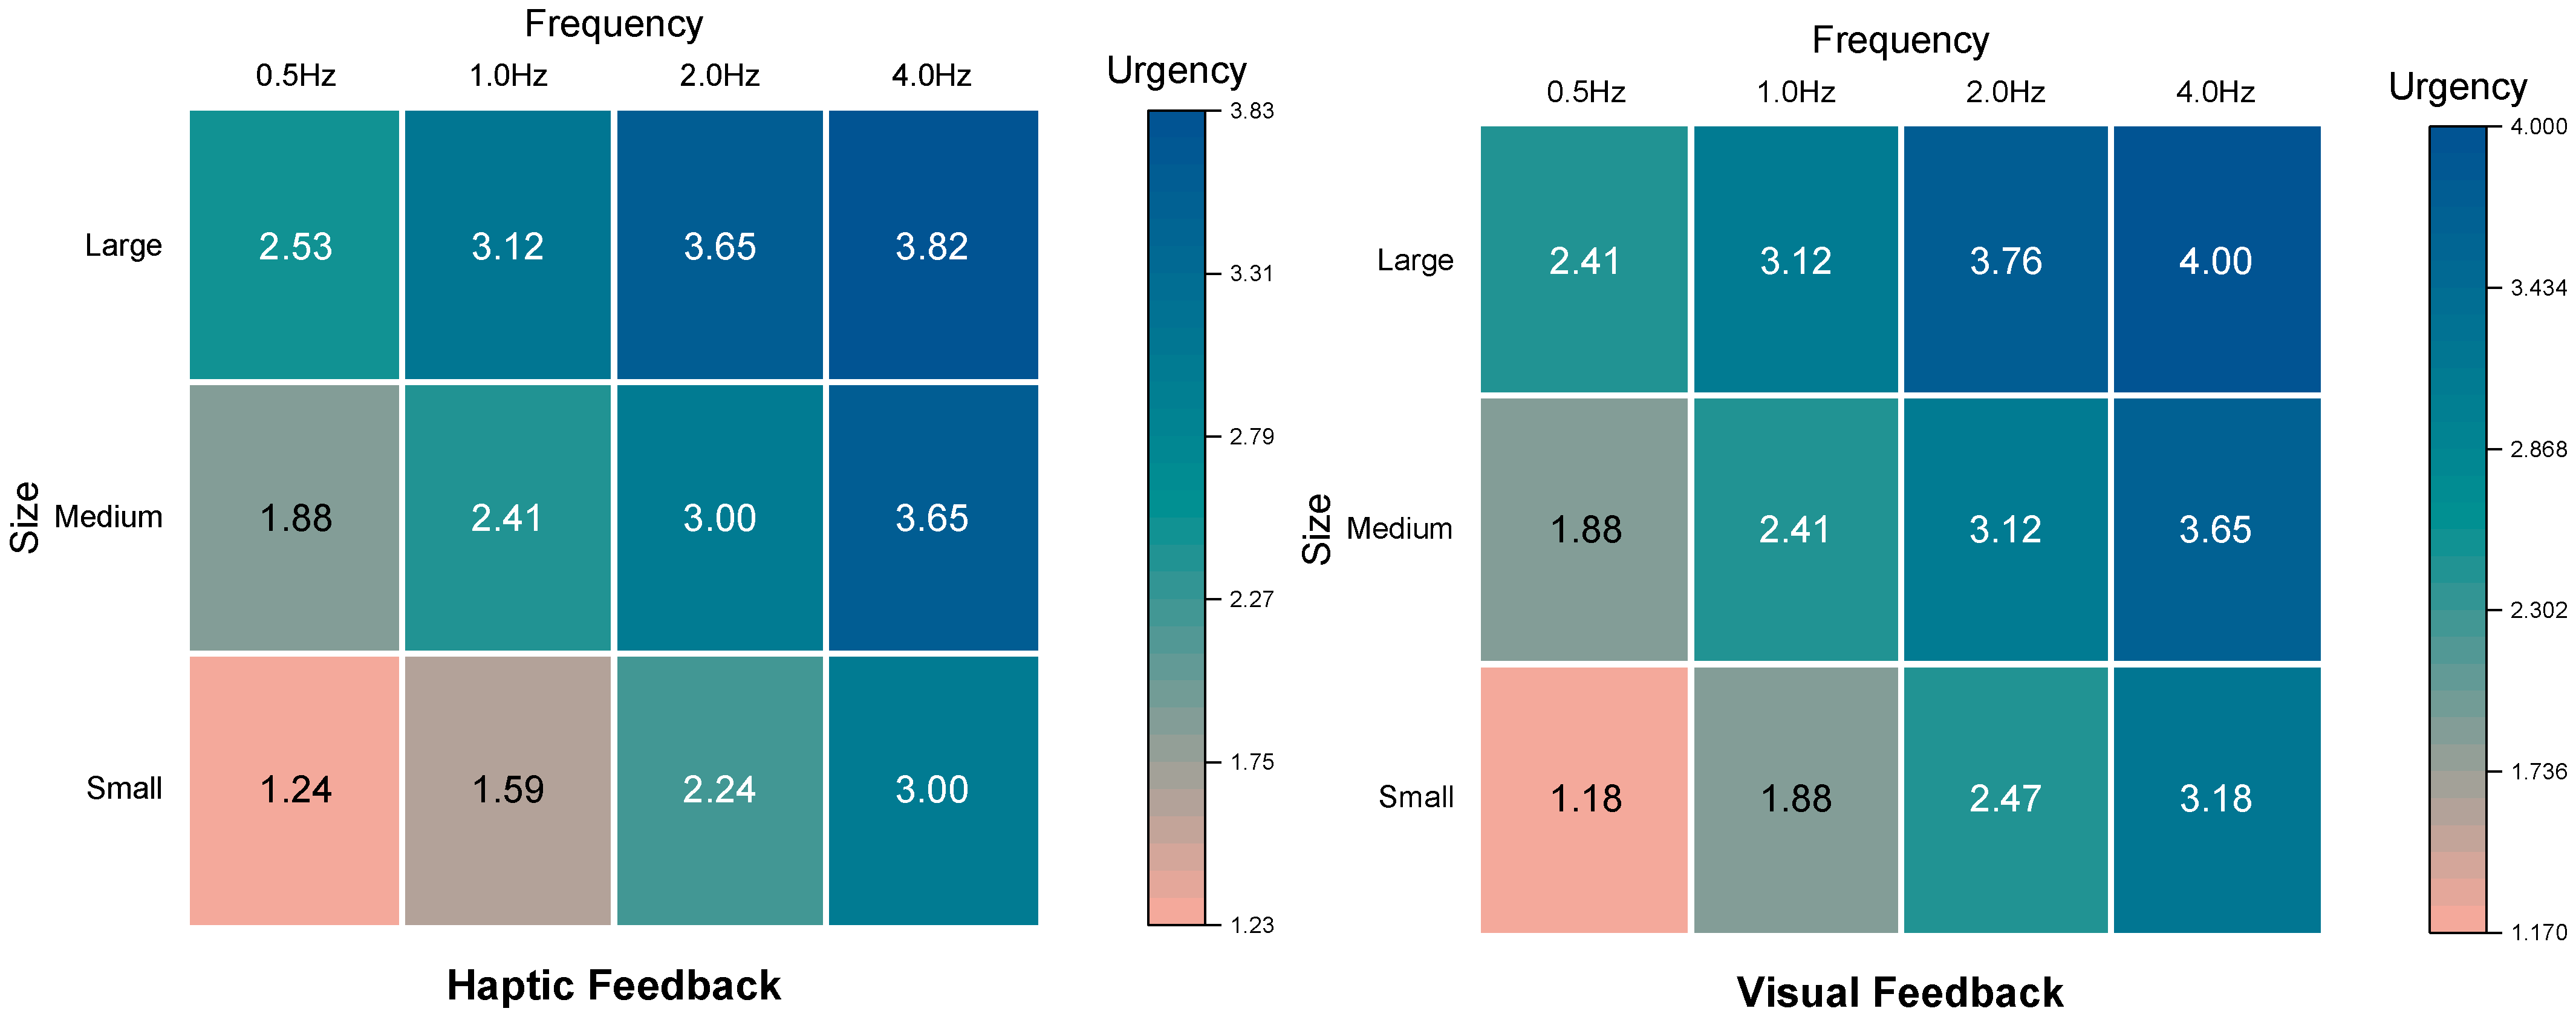
| Haptic Feedback | Large | Urgency Score | 2.53 | 3.12 | 3.65 | 3.82 |
| Cross Rate | 25% | 25% | 18.75% | 18.75% | ||
| Decision Time | 4.80 s | 3.62 s | 3.41 s | 3.30 s | ||
| Medium | Urgency Score | 1.88 | 2.41 | 3.00 | 3.65 | |
| Cross Rate | 62.5% | 62.5% | 37.5% | 31.25% | ||
| Decision Time | 5.26 s | 4.80 s | 4.96 s | 4.51 s | ||
| Small | Urgency Score | 1.24 | 1.59 | 2.24 | 3.00 | |
| Cross Rate | 81.25% | 87.5% | 62.5% | 31.25% | ||
| Decision Time | 6.25 s | 4.32 s | 3.94 s | 5.06 s | ||
| Visual Feedback | Large | Urgency Score | 2.41 | 3.12 | 3.76 | 4.00 |
| Cross Rate | 81.25% | 43.75% | 18.75% | 6.25% | ||
| Decision Time | 4.13 s | 3.99 s | 3.17 s | 2.80 s | ||
| Medium | Urgency Score | 1.88 | 2.41 | 3.12 | 3.65 | |
| Cross Rate | 87.5% | 50% | 12.5% | 6.25% | ||
| Decision Time | 4.19 s | 4.04 s | 3.23 s | 2.95 s | ||
| Small | Urgency Score | 1.18 | 1.88 | 2.47 | 3.18 | |
| Cross Rate | 87.5% | 62.5% | 25% | 6.25% | ||
| Decision Time | 5.90 s | 3.99 s | 3.51 s | 2.85 s | ||
| Feedback Modality | State | Size (Direction) | Response | Frequency | |||
|---|---|---|---|---|---|---|---|
| 0.5 Hz | 1.0 Hz | 2.0 Hz | 4.0 Hz | ||||
| Haptic Feedback | Dynamic | Medium (Right) | Urgency Score | 2.50 | 3.00 | 3.69 | 4.00 |
| Cross Rate | 31.25% | 31.25% | 6.25% | 18.75% | |||
| Decision Time | 3.54 s | 2.77 s | 2.84 s | 2.66 s | |||
| Medium (Left) | Urgency Score | 2.50 | 3.06 | 3.63 | 4.00 | ||
| Cross Rate | 31.25% | 25% | 6.25% | 25% | |||
| Decision Time | 3.42 s | 3.11 s | 2.79 s | 2.94 s | |||
| Small (Right) | Urgency Score | 1.44 | 2.19 | 2.88 | 3.69 | ||
| Cross Rate | 87.5% | 68.75% | 43.75% | 31.25% | |||
| Decision Time | 4.18 s | 3.47 s | 3.02 s | 2.69 s | |||
| Small (Left) | Urgency Score | 1.44 | 2.19 | 2.88 | 3.69 | ||
| Cross Rate | 87.5% | 68.75% | 43.75% | 25% | |||
| Decision Time | 4.15 s | 3.83 s | 2.67 s | 2.45 s | |||
| Static | Medium (Right) | Urgency Score | 2.19 | 2.63 | 3.38 | 3.81 | |
| Cross Rate | 31.25% | 31.25% | 6.25% | 18.75% | |||
| Decision Time | 3.06 s | 2.71 s | 2.95 s | 2.39 s | |||
| Medium (Left) | Urgency Score | 2.25 | 2.63 | 3.31 | 3.75 | ||
| Cross Rate | 31.25% | 31.25% | 6.25% | 12.5% | |||
| Decision Time | 3.01 s | 3.21 s | 2.79 s | 2.51 s | |||
| Small (Right) | Urgency Score | 1.19 | 1.75 | 2.75 | 3.69 | ||
| Cross Rate | 93.75% | 68.75% | 43.75% | 25% | |||
| Decision Time | 4.09 s | 3.47 s | 3.00 s | 2.72 s | |||
| Small (Left) | Urgency Score | 1.19 | 1.81 | 2.75 | 3.63 | ||
| Cross Rate | 87.5% | 87.5% | 43.75% | 31.25% | |||
| Decision Time | 3.91 s | 3.23 s | 2.88 s | 2.69 s | |||
| Visual Feedback | Dynamic | Medium (Right) | Urgency Score | 2.25 | 2.75 | 3.38 | 4.00 |
| Cross Rate | 87.5% | 56.25% | 0% | 0% | |||
| Decision Time | 5.08 s | 4.75 s | 4.35 s | 3.57 s | |||
| Medium (Left) | Urgency Score | 2.25 | 2.75 | 3.31 | 4.00 | ||
| Cross Rate | 81.25% | 56.25% | 12.5% | 0% | |||
| Decision Time | 5.05 s | 4.72 s | 4.19 s | 3.85 s | |||
| Small (Right) | Urgency Score | 1.31 | 2.00 | 2.94 | 3.75 | ||
| Cross Rate | 93.75% | 62.5% | 12.5% | 6.25% | |||
| Decision Time | 5.55 s | 4.70 s | 4.13 s | 3.85 s | |||
| Small (Left) | Urgency Score | 1.38 | 2.06 | 2.94 | 3.75 | ||
| Cross Rate | 87.5% | 62.5% | 18.75% | 0% | |||
| Decision Time | 5.24 s | 5.03 s | 4.10 s | 3.63 s | |||
| Static | Medium (Right) | Urgency Score | 2.06 | 2.88 | 3.44 | 3.94 | |
| Cross Rate | 81.25% | 75% | 12.5% | 12.5% | |||
| Decision Time | 3.70 s | 3.52 s | 2.66 s | 2.52 s | |||
| Medium (Left) | Urgency Score | 2.13 | 2.88 | 3.38 | 3.88 | ||
| Cross Rate | 81.25% | 75% | 6.25% | 0% | |||
| Decision Time | 4.03 s | 3.52 s | 2.84 s | 2.45 s | |||
| Small (Right) | Urgency Score | 1.13 | 1.88 | 2.81 | 3.38 | ||
| Cross Rate | 93.75% | 87.5% | 18.75% | 6.25% | |||
| Decision Time | 4.49 s | 3.50 s | 3.06 s | 2.66 s | |||
| Small (Left) | Urgency Score | 1.13 | 1.81 | 2.81 | 3.38 | ||
| Cross Rate | 93.75% | 81.25% | 12.5% | 6.25% | |||
| Decision Time | 4.08 s | 3.46 s | 3.15 s | 2.60 s | |||
| Feedback Modality | Size | Response | Frequency | |||
|---|---|---|---|---|---|---|
| 0.5 Hz | 1.0 Hz | 2.0 Hz | 4.0 Hz | |||
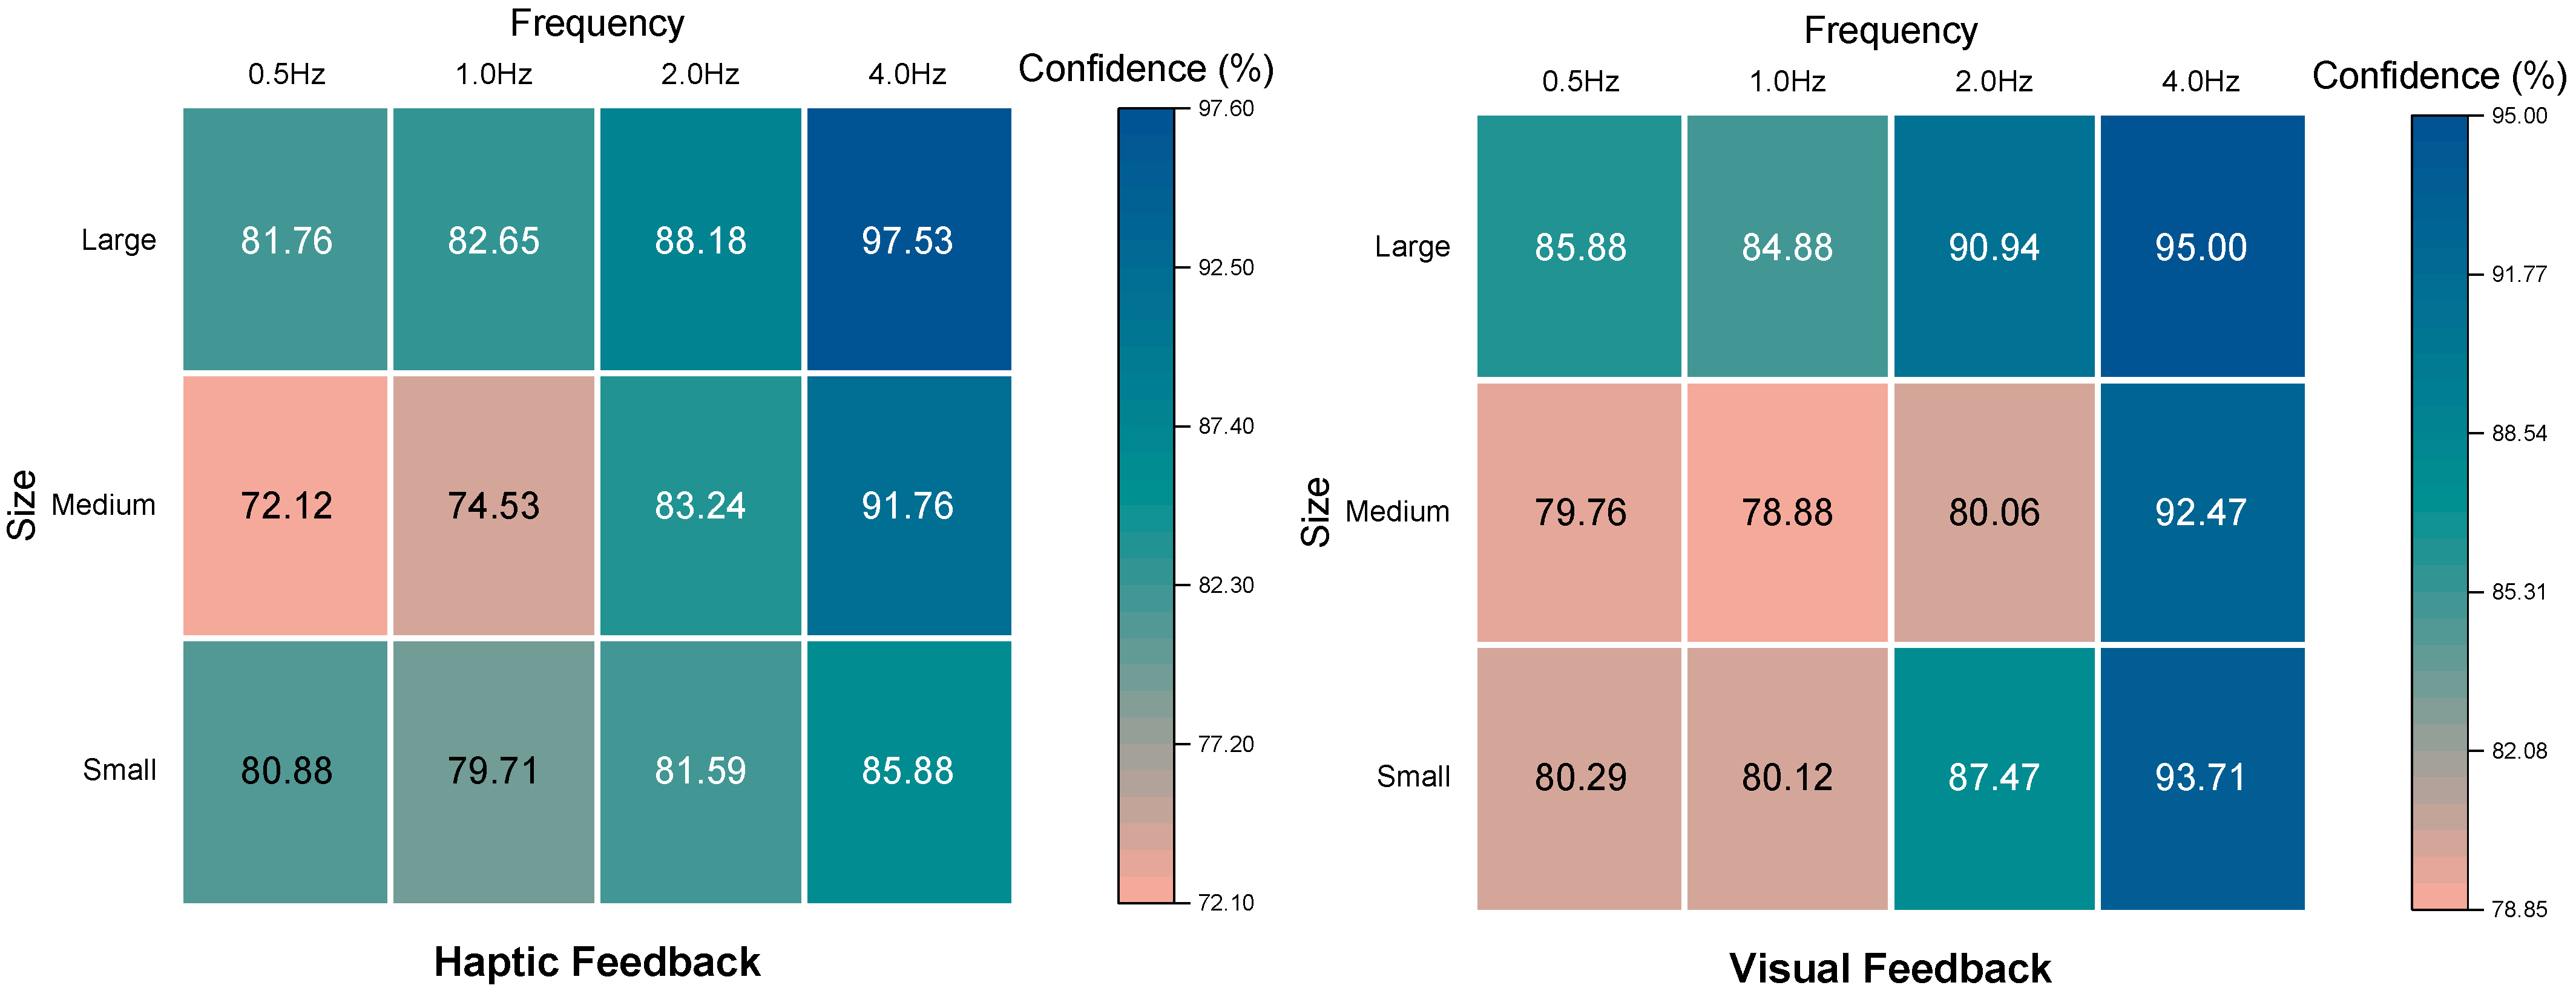
| Haptic Feedback | Large | Confidence = 100% | 4 | 3 | 7 | 14 |
| Cross Count (100%) | 1 | 1 | 2 | 2 | ||
| Cross Count | 4 | 4 | 3 | 3 | ||
| Medium | Confidence = 100% | 1 | 0 | 3 | 9 | |
| Cross Count (100%) | 1 | 0 | 2 | 4 | ||
| Cross Count | 10 | 10 | 6 | 5 | ||
| Small | Confidence = 100% | 6 | 3 | 3 | 7 | |
| Cross Count (100%) | 5 | 3 | 2 | 1 | ||
| Cross Count | 13 | 14 | 10 | 5 | ||
| Visual Feedback | Large | Confidence = 100% | 6 | 5 | 10 | 14 |
| Cross Count (100%) | 4 | 2 | 2 | 1 | ||
| Cross Count | 13 | 7 | 3 | 1 | ||
| Medium | Confidence = 100% | 4 | 0 | 2 | 11 | |
| Cross Count (100%) | 4 | 0 | 0 | 0 | ||
| Cross Count | 14 | 8 | 2 | 1 | ||
| Small | Confidence = 100% | 5 | 3 | 4 | 9 | |
| Cross Count (100%) | 5 | 2 | 0 | 0 | ||
| Cross Count | 14 | 10 | 3 | 1 | ||
| Feedback Modality | State | Size (Direction) | Response | Frequency | |||
|---|---|---|---|---|---|---|---|
| 0.5 Hz | 1.0 Hz | 2.0 Hz | 4.0 Hz | ||||
| Haptic Feedback | Dynamic | Medium (Right) | Confidence = 100% | 4 | 1 | 5 | 13 |
| Cross Count (100%) | 1 | 1 | 0 | 1 | |||
| Cross Count | 5 | 5 | 1 | 3 | |||
| Medium (Left) | Confidence = 100% | 4 | 1 | 5 | 12 | ||
| Cross Count (100%) | 1 | 1 | 0 | 3 | |||
| Cross Count | 5 | 4 | 1 | 4 | |||
| Small (Right) | Confidence = 100% | 7 | 2 | 1 | 11 | ||
| Cross Count (100%) | 7 | 1 | 1 | 4 | |||
| Cross Count | 14 | 11 | 7 | 5 | |||
| Small (Left) | Confidence = 100% | 7 | 2 | 1 | 11 | ||
| Cross Count (100%) | 7 | 1 | 1 | 4 | |||
| Cross Count | 14 | 11 | 7 | 4 | |||
| Static | Medium (Right) | Confidence = 100% | 3 | 2 | 3 | 10 | |
| Cross Count (100%) | 1 | 1 | 0 | 1 | |||
| Cross Count | 5 | 5 | 1 | 3 | |||
| Medium (Left) | Confidence = 100% | 3 | 2 | 3 | 10 | ||
| Cross Count (100%) | 1 | 1 | 0 | 0 | |||
| Cross Count | 5 | 5 | 1 | 2 | |||
| Small (Right) | Confidence = 100% | 9 | 1 | 1 | 10 | ||
| Cross Count (100%) | 9 | 1 | 1 | 3 | |||
| Cross Count | 15 | 11 | 7 | 4 | |||
| Small (Left) | Confidence = 100% | 9 | 1 | 1 | 10 | ||
| Cross Count (100%) | 8 | 1 | 1 | 4 | |||
| Cross Count | 14 | 14 | 7 | 5 | |||
| Visual Feedback | Dynamic | Medium (Right) | Confidence = 100% | 4 | 1 | 5 | 11 |
| Cross Count (100%) | 4 | 0 | 0 | 0 | |||
| Cross Count | 14 | 9 | 0 | 0 | |||
| Medium (Left) | Confidence = 100% | 4 | 1 | 5 | 13 | ||
| Cross Count (100%) | 4 | 0 | 1 | 0 | |||
| Cross Count | 13 | 9 | 2 | 0 | |||
| Small (Right) | Confidence = 100% | 8 | 3 | 2 | 12 | ||
| Cross Count (100%) | 8 | 3 | 0 | 1 | |||
| Cross Count | 15 | 10 | 2 | 1 | |||
| Small (Left) | Confidence = 100% | 7 | 2 | 1 | 11 | ||
| Cross Count (100%) | 7 | 3 | 0 | 0 | |||
| Cross Count | 14 | 10 | 3 | 0 | |||
| Static | Medium (Right) | Confidence = 100% | 4 | 2 | 5 | 11 | |
| Cross Count (100%) | 4 | 2 | 1 | 2 | |||
| Cross Count | 13 | 12 | 2 | 2 | |||
| Medium (Left) | Confidence = 100% | 4 | 2 | 5 | 11 | ||
| Cross Count (100%) | 3 | 1 | 0 | 0 | |||
| Cross Count | 13 | 12 | 1 | 0 | |||
| Small (Right) | Confidence = 100% | 8 | 3 | 2 | 10 | ||
| Cross Count (100%) | 8 | 3 | 0 | 0 | |||
| Cross Count | 15 | 14 | 3 | 1 | |||
| Small (Left) | Confidence = 100% | 8 | 3 | 2 | 10 | ||
| Cross Count (100%) | 8 | 2 | 0 | 0 | |||
| Cross Count | 15 | 13 | 2 | 1 | |||
| Feedback Modality | Size | Confidence Level | Frequency | |||
|---|---|---|---|---|---|---|
| 0.5 Hz | 1.0 Hz | 2.0 Hz | 4.0 Hz | |||
| Haptic Feedback | Large | 100% | 3.53 | 2.83 | 3.05 | 3.36 |
| 90–99% | 6.93 | 4.16 | 4.52 | 3.86 | ||
| <90% | 4.65 | 3.51 | 3.02 | 2.63 | ||
| Medium | 100% | 4.05 | – | 2.96 | 4.31 | |
| 90–99% | 3.24 | 4.08 | 5.82 | 3.00 | ||
| <90% | 5.66 | 4.96 | 5.18 | 6.12 | ||
| Small | 100% | 5.20 | 2.60 | 2.48 | 5.73 | |
| 90–99% | 4.49 | 2.76 | 3.86 | 4.12 | ||
| <90% | 7.15 | 5.07 | 4.63 | 4.87 | ||
| Visual Feedback | Large | 100% | 4.38 | 3.12 | 2.86 | 2.63 |
| 90–99% | 4.03 | 4.05 | 3.38 | 5.24 | ||
| <90% | 4.01 | 4.32 | 3.65 | 2.67 | ||
| Medium | 100% | 3.61 | – | 3.07 | 2.67 | |
| 90–99% | 4.00 | 4.42 | 3.49 | 5.51 | ||
| <90% | 4.46 | 3.95 | 3.16 | 3.07 | ||
| Small | 100% | 5.82 | 4.26 | 2.91 | 2.92 | |
| 90–99% | 5.12 | 4.20 | 3.48 | 2.87 | ||
| <90% | 6.12 | 3.85 | 4.03 | 2.52 | ||
| Study | Feedback | State | Full Confidence | High Confidence | Low Confidence |
|---|---|---|---|---|---|
| (100%) | (90–99%) | (<90%) | |||
| 1 | Haptic Feedback | 3.65 | 4.24 | 4.79 | |
| Visual Feedback | 3.45 | 4.15 | 3.82 | ||
| 2 | Haptic Feedback | Dynamic | 3.53 | 2.88 | 3.27 |
| Static | 3.26 | 3.10 | 2.99 | ||
| Visual Feedback | Dynamic | 4.79 | 4.59 | 4.32 | |
| Static | 3.36 | 3.48 | 2.89 |
| Feedback Modality | State | Size (Direction) | Confidence Level | Frequency | |||
|---|---|---|---|---|---|---|---|
| 0.5 Hz | 1.0 Hz | 2.0 Hz | 4.0 Hz | ||||
| Haptic Feedback | Dynamic | Medium (Right) | 100% | 3.91 | 2.73 | 3.55 | 2.42 |
| 90–99% | 4.16 | 2.64 | 2.35 | 3.67 | |||
| <90% | 3.18 | 2.80 | 2.67 | 3.71 | |||
| Medium (Left) | 100% | 2.98 | 4.05 | 3.72 | 2.85 | ||
| 90–99% | 3.68 | 2.73 | 2.27 | 3.23 | |||
| <90% | 3.53 | 3.13 | 2.46 | 3.10 | |||
| Small (Right) | 100% | 3.98 | 3.93 | 4.52 | 2.81 | ||
| 90–99% | 2.51 | 3.25 | 2.94 | 2.43 | |||
| <90% | 4.86 | 3.50 | 2.91 | 2.37 | |||
| Small (Left) | 100% | 3.85 | 5.17 | 3.62 | 2.44 | ||
| 90–99% | 3.29 | 3.29 | 2.26 | 2.44 | |||
| <90% | 4.69 | 3.83 | 2.92 | 2.63 | |||
| Static | Medium (Right) | 100% | 3.33 | 2.47 | 2.66 | 2.34 | |
| 90–99% | 4.02 | 2.81 | 3.28 | 2.35 | |||
| <90% | 2.35 | 2.72 | 2.86 | 2.62 | |||
| Medium (Left) | 100% | 3.16 | 2.96 | 3.52 | 2.51 | ||
| 90–99% | 3.43 | 3.05 | 2.49 | 2.23 | |||
| <90% | 2.68 | 3.33 | 2.74 | 2.77 | |||
| Small (Right) | 100% | 4.50 | 3.62 | 4.66 | 2.71 | ||
| 90–99% | 2.94 | 3.66 | 2.66 | 2.68 | |||
| <90% | 3.80 | 3.32 | 3.00 | 3.09 | |||
| Small (Left) | 100% | 3.97 | 3.45 | 3.37 | 2.91 | ||
| 90–99% | 4.24 | 3.28 | 2.77 | 2.27 | |||
| <90% | 3.67 | 3.17 | 2.88 | 2.62 | |||
| Visual Feedback | Dynamic | Medium (Right) | 100% | 4.07 | 5.91 | 4.02 | 3.80 |
| 90–99% | 4.96 | 5.25 | 5.39 | 2.92 | |||
| <90% | 5.46 | 4.46 | 3.76 | 3.26 | |||
| Medium (Left) | 100% | 4.83 | 6.91 | 4.16 | 3.85 | ||
| 90–99% | 4.95 | 5.48 | 4.36 | 4.19 | |||
| <90% | 5.13 | 4.35 | 4.04 | 3.32 | |||
| Small (Right) | 100% | 5.60 | 4.45 | 5.20 | 3.96 | ||
| 90–99% | 4.63 | 4.79 | 4.07 | 3.71 | |||
| <90% | 5.79 | 4.75 | 3.92 | 3.35 | |||
| Small (Left) | 100% | 5.37 | 4.98 | 5.77 | 3.79 | ||
| 90–99% | 6.11 | 5.16 | 4.25 | 3.01 | |||
| <90% | 4.79 | 5.00 | 3.58 | 3.35 | |||
| Static | Medium (Right) | 100% | 3.39 | 3.47 | 2.85 | 2.72 | |
| 90–99% | 5.37 | 3.81 | 2.76 | 2.07 | |||
| <90% | 2.69 | 3.37 | 2.42 | 2.08 | |||
| Medium (Left) | 100% | 3.10 | 3.20 | 3.19 | 2.61 | ||
| 90–99% | 5.56 | 3.68 | 2.94 | 1.87 | |||
| <90% | 3.47 | 3.49 | 2.52 | 2.49 | |||
| Small (Right) | 100% | 4.46 | 3.91 | 4.28 | 2.85 | ||
| 90–99% | 5.16 | 3.21 | 3.04 | 2.37 | |||
| <90% | 3.86 | 3.57 | 2.81 | 2.19 | |||
| Small (Left) | 100% | 4.05 | 3.41 | 3.94 | 2.81 | ||
| 90–99% | 4.93 | 3.57 | 2.99 | 2.38 | |||
| <90% | 3.30 | 3.36 | 3.07 | 1.56 | |||
Disclaimer/Publisher’s Note: The statements, opinions and data contained in all publications are solely those of the individual author(s) and contributor(s) and not of MDPI and/or the editor(s). MDPI and/or the editor(s) disclaim responsibility for any injury to people or property resulting from any ideas, methods, instructions or products referred to in the content. |
© 2025 by the authors. Licensee MDPI, Basel, Switzerland. This article is an open access article distributed under the terms and conditions of the Creative Commons Attribution (CC BY) license (https://creativecommons.org/licenses/by/4.0/).
Share and Cite
Ren, G.; Huang, Z.; Lin, W.; Huang, T.; Wang, G.; Lee, J.H. Enhancing Street-Crossing Safety for Visually Impaired Pedestrians with Haptic and Visual Feedback. Appl. Sci. 2025, 15, 3942. https://doi.org/10.3390/app15073942
Ren G, Huang Z, Lin W, Huang T, Wang G, Lee JH. Enhancing Street-Crossing Safety for Visually Impaired Pedestrians with Haptic and Visual Feedback. Applied Sciences. 2025; 15(7):3942. https://doi.org/10.3390/app15073942
Chicago/Turabian StyleRen, Gang, Zhihuang Huang, Wenshuo Lin, Tianyang Huang, Gang Wang, and Jee Hang Lee. 2025. "Enhancing Street-Crossing Safety for Visually Impaired Pedestrians with Haptic and Visual Feedback" Applied Sciences 15, no. 7: 3942. https://doi.org/10.3390/app15073942
APA StyleRen, G., Huang, Z., Lin, W., Huang, T., Wang, G., & Lee, J. H. (2025). Enhancing Street-Crossing Safety for Visually Impaired Pedestrians with Haptic and Visual Feedback. Applied Sciences, 15(7), 3942. https://doi.org/10.3390/app15073942