Article

Predicting College Student Engagement in Physical Education Classes Using Machine Learning and Structural Equation Modeling

1
School of Physical Education, Shandong University, Jinan 250014, China
2
School of Physical Education and Health Sciences, Guangxi Minzu University, Nanning 530006, China
*
Author to whom correspondence should be addressed.
Appl. Sci. 2025, 15(7), 3884; https://doi.org/10.3390/app15073884
Submission received: 17 March 2025 / Revised: 28 March 2025 / Accepted: 30 March 2025 / Published: 2 April 2025

Abstract

:
Digital technology has become increasingly prevalent in higher education classrooms. However, the impact of different types and use frequencies of digital technology on college students’ classroom engagement can vary substantially. This study aims to develop an interpretable machine learning model to predict student classroom engagement based on various digital technologies and construct a structural equation model (SEM) to further investigate the underlying mechanisms involving perceived usefulness (PU), perceived ease of use (PEU), and academic self-efficacy (ASE). Nine machine learning algorithms were employed to develop interpretable predictive models, rank the importance of digital technology tools, and identify the optimal predictive model for student engagement. A total of 1158 eligible Chinese university students participated in this study. The results indicated that subject-specific software, management software, websites, and mobile devices were identified as key factors influencing student engagement. Interaction effect analyses revealed significant synergistic effects between management software and subject-specific software, identifying them as primary determinants of student engagement. SEM results demonstrated that digital technology usage frequency indirectly influenced student engagement through PU, PEU, and ASE, with both PU and ASE as well as PEU and ASE playing chain-mediated roles. The findings underscore the importance of integrating digital tools strategically in PE classrooms to enhance engagement. These insights offer practical implications for higher education institutions and policymakers.

1. Introduction

Student engagement has long been recognized as a key indicator of teaching quality and academic success. In higher education contexts, particularly in physical education (PE) classes, student engagement plays a pivotal role not only in acquiring motor skills but also in enhancing physical and psychological well-being and fostering lifelong physical activity awareness [1]. Higher classroom engagement enables students to actively integrate into the instructional process, increases their learning satisfaction, and reduces the risk of learning burnout and dropout. Thus, it is of great importance to deeply understand and accurately predict college students’ engagement in PE classes and its related influencing factors to improve teaching quality and enhance the overall educational experience.
With the rapid advancement of information technology, educational institutions at all levels—from primary and secondary schools to higher education—have increasingly integrated various forms of digital technologies and multimedia tools into classroom instruction. The effects of these technologies vary across different educational settings. Research has shown that in primary education, the use of interactive whiteboards and gamified learning platforms can enhance students’ motivation and attention [2,3]. In secondary school environments, the implementation of online collaborative tools, virtual reality (VR), and smart classroom technologies has been associated with increased classroom engagement [4,5,6]. In higher vocational education, the use of digital tools by students has also been positively linked to learning satisfaction and academic engagement [7]. Cross-national studies further highlight the diverse impacts of digital technology on student engagement. For example, in Asia, the use of augmented reality-based games in flipped classroom settings has been found to enhance medical undergraduates’ engagement and improve teacher–student relationships [8]. Similarly, studies conducted among university students in the Czech Republic, Taiwan, and Iraq have demonstrated that digital tools can promote greater participation and satisfaction in foreign language learning contexts [9]. Despite the growing interest in technology-enhanced instruction, the majority of existing studies focus primarily on conventional academic disciplines such as mathematics and language education, which are largely centered on cognitive knowledge transmission. In contrast, PE represents an integrative domain that combines physical, cognitive, and affective dimensions. PE instruction emphasizes the acquisition of motor skills, the development of physical competence, and the cultivation of intrinsic motivation and active participation. Consequently, the goals, modes, and outcomes of digital technology use in PE differ substantially from those in traditional academic subjects. Given this distinct pedagogical context, more in-depth investigations are needed into the mechanisms through which digital technologies influence student engagement in PE settings. Such inquiry is essential to distinguish the instructional demands of PE from those of other subject areas and to develop technology integration strategies that are specifically tailored to the unique characteristics of physical education.
Various digital technologies and multimedia tools have gradually been integrated into university PE teaching practices. Numerous studies have demonstrated that the appropriate use of digital technology can significantly enhance students’ learning motivation, interactivity, and classroom engagement [8,10]. According to multimedia learning theory, learners who study through multimedia resources such as images and videos are more likely to comprehend and retain knowledge, thereby increasing their engagement [11]. Building on this theoretical framework, previous research has found that digital tools, such as fitness trackers, interactive applications, and online platforms, can effectively capture students’ attention and improve their engagement in PE classes [12,13]. Technologies such as VR and augmented reality (AR) create immersive learning environments that enable students to experience diverse sports scenarios, thereby fostering greater interest and participation in class [14]. Classroom management software enhances students’ learning motivation by improving the efficiency of instructional organization and facilitating access to educational resources. Additionally, the use of social media in classrooms has been shown to promote collaborative learning and discussions. However, some studies have also highlighted potential drawbacks associated with digital tools in higher education settings. Over-reliance on digital technologies, digital literacy disparities, and potential distractions may divert students’ attention and negatively impact their classroom engagement [15,16]. Despite the increasing integration of digital technology into PE instruction, there remains a lack of empirical research that precisely analyzes and predicts the specific effects of different digital technologies on university students’ engagement in PE classes. Therefore, further empirical investigation is necessary to bridge this research gap.
In addition to digital technologies, students’ psychological factors profoundly influence their classroom engagement behavior. Research indicates that perceived usefulness (PU) and perceived ease of use (PEU), as core constructs of the Technology Acceptance Model (TAM), significantly influence students’ attitudes, motivations, and actual technology usage behavior [17]. Specifically, higher levels of PU and PEU toward digital tools are associated with more active adoption of these tools in class, thus enhancing students’ classroom behaviors and overall engagement [18]. A survey conducted among undergraduate students revealed that the integration of digital technologies in flipped classroom settings affects students’ PU, PEU, and consequently their classroom participation. Among various digital tools, students rated classroom response systems most positively in terms of PU and acceptance, followed by electronic lectures and classroom chats, while mobile virtual reality (mobile VR) received the lowest ratings [19]. Moreover, PU significantly influences students’ academic self-efficacy (ASE). Specifically, when students perceive digital tools as beneficial, their confidence in their academic capabilities increases, leading to enhanced satisfaction and improved outcomes in online learning contexts [20]. However, the direct impact of PEU on ASE remains inconclusive. Some studies argue that PEU may not directly affect self-efficacy, but instead fosters positive attitudes toward digital tools, indirectly influencing self-efficacy through these favorable attitudes [21].
According to social cognitive theory, an individual’s cognitive processes, including perceptions and beliefs about their capabilities, play a crucial role in shaping their behaviors [22]. Research has demonstrated that employing feedback technologies, such as virtual reality, in PE classes enables students to directly observe their progress in knowledge and skills, subsequently boosting their ASE [23]. Numerous studies have indicated that higher ASE positively influences students’ learning motivation and classroom engagement. Particularly in virtual or online classrooms, students who experience enhanced self-efficacy, either due to successful interactions with digital tools or a perceived improvement facilitated by these technologies, generally exhibit higher levels of classroom participation [24,25]. In PE contexts, ASE is recognized as a critical determinant of student interest and participation, significantly influencing their learning success [26].
In summary, the current study proposes the following hypotheses (Figure 1):
Hypothesis 1. 
The frequency of digital technology use has a significant positive effect on students’ classroom engagement.
Hypothesis 2. 
The frequency of digital technology use has a significant positive effect on perceived usefulness.
Hypothesis 3. 
The frequency of digital technology use has a significant positive effect on perceived ease of use.
Hypothesis 4. 
The frequency of digital technology use has a significant positive effect on academic self-efficacy.
Hypothesis 5. 
Perceived usefulness has a significant positive effect on students’ classroom engagement.
Hypothesis 6. 
Perceived ease of use has a significant positive effect on students’ classroom engagement.
Hypothesis 7. 
Perceived usefulness has a significant positive effect on academic self-efficacy.
Hypothesis 8. 
Perceived ease of use has a significant positive effect on academic self-efficacy.
Hypothesis 9. 
Academic self-efficacy has a significant positive effect on students’ classroom engagement.
Given the limitations of traditional regression models in capturing nonlinear and multivariate interactions, this study adopts a machine learning approach to predict student engagement. Additionally, SEM is employed to analyze causal pathways, providing deeper insights into how digital technology influences student participation. By integrating these methodologies, this research aims to bridge the gap in understanding the role of digital tools in PE settings.

2. Materials and Methods

2.1. Participants and Procedure

This study employed convenience and snowball sampling methods to conduct a cross-sectional survey among university students across seven geographical regions in China: East China, South China, Central China, North China, Northwest China, Southwest China, and Northeast China. The survey was administered via the online platform “Wenjuanxing” (https://www.wjx.cn/) from 1 December 2024 to 31 December 2024. The survey collected a total of 1612 questionnaires. After excluding participants who took less than 15 min to complete the questionnaire, a final sample of 1158 valid responses remained.

2.2. Measures

2.2.1. Digital Technology Usage

This study utilized the Classroom Technology Usage Questionnaire, developed by Wang et al. [27], which was adapted from the “Actual Behavior” subscale of the Teacher Digital Educational Resource Usage Scale [28]. This questionnaire assessed the use of digital devices and resources in PE classrooms, including digital devices, mobile devices, multimedia courseware, multimedia materials, question banks, subject-specific software and tools, websites, electronic textbooks/journals, and course management software. A 5-point Likert scale was employed, ranging from 1 (never used) to 5 (frequently used). Higher scores indicate a greater level of integration of digital technology in the classroom. In this study, the Cronbach’s α coefficient for this scale was 0.972.

2.2.2. Student Classroom Engagement

Classroom engagement was measured using the Classroom Engagement Scale developed by Reeve and Jang [29,30] and subsequently revised by Wang et al. [28]. This scale assessed students’ affective, cognitive, and behavioral engagement in class and consists of 10 items. A 5-point Likert scale was employed. The overall score was derived by summing all items responses, with higher scores reflecting greater level of classroom engagement. In this study, the Cronbach’s α coefficient for this scale was 0.972.

2.2.3. Perceived Usefulness and Perceived Ease of Use

The perceived usefulness (PU) and perceived ease of use (PEU) scales were originally developed by Davis [17] and later adapted by Lee [31]. The PU scale and PEU scale each contain three items. Higher scores indicate a greater degree of perceived usefulness and perceived ease of use. In this study, the Cronbach’s α coefficients for the PU and PEU scales were 0.957 and 0.944, respectively.

2.2.4. Academic Self-Efficacy

Academic self-efficacy was measured using the Academic Self-Efficacy Scale originally developed by Pintrich and Degroot [32] and later revised by Liang [33]. This scale consists of two dimensions: academic ability self-efficacy and academic behavior self-efficacy, comprising a total of 22 items. In this study, the Cronbach’s α coefficient for this scale was 0.927. Detailed questionnaire items can be found in Appendix A.

2.3. Interpretable Machine Learning Modeling

2.3.1. Model Development and Performance Evaluation

Nine machine learning algorithms, including Random Forest (RF), Decision Tree (DT), Gradient Boosting Decision Tree (GBDT), AdaBoost (AB), Support Vector Machine (SVM), Multilayer Perceptron (MLP), Ridge Regression (RR), Voting Classifier (VC), and K-Nearest Neighbors (KNN), were applied to develop predictive models for student classroom engagement. All models were trained using the training dataset (n = 926) and evaluated on an independent test set (n = 232). The predictive performance and robustness of the model were evaluated using a variety of metrics. The hyperparameter details of the nine machine learning models are provided in Table S1.

2.3.2. Interpretable Methods and Variable Importance Analysis

In this study, we constructed interpretable machine learning procedures to analyze the impacts of digital technologies on classroom engagement. Initially, feature importance was calculated and ranked to quantify the relative contributions of nine digital technology tools to the predictions [34]. This process was implemented using the Python package ELI5 as illustrated by Equation (1):
I j = K = 1 K I k , j K = S 1 k K = 1 K s k , j
where Ij represents the importance score of feature, j, K denotes the total number of permutation iterations, and Ik,j refers to the contribution of feature j to the model prediction in the k-th permutation. S indicates the overall performance of the original model, while sk,j represents the model performance after permuting feature j in the k-th iteration. Based on the ranked feature importance scores, all digital technology tools were ordered accordingly. The top five features with the highest importance scores were identified and designated as key variables for further analysis.
Additionally, partial dependence plots (PDPs) were generated to explore the marginal effects of individual or combined digital technology tools on student engagement. PDP analysis quantifies how changes in specific features affect model predictions by averaging out the effects of all other features [35]. Specifically, the univariate PDP examines the marginal impact of a single feature on the predicted outcome, while the bivariate PDPs illustrates the interaction or joint effects between two features [36]. This procedure was performed as described in Equation (2):
f ^ x s ( X s ) = E x s f ^ ( x s , x c ) = f ^ ( x s , x c ) d P ( x c )
where f ^ x s ( X s ) represents the partial dependence function for the feature subset Xs, E x c denotes the expectation taken over the distribution of the complement feature set Xc, and f ^ ( x s , x c ) is the prediction function of the model based on both xs and xc. The integral f ^ ( x s , x c ) d P ( x c ) expresses the expectation of the prediction function with respect to the marginal probabilityd distribution P(xc) of the complementary features. This formulation quantifies the marginal effect of the selected feature subset on the model’s predictions by averaging out the influence of all other features.

2.3.3. SHAP Value-Based Interpretability

Additionally, SHapley Additive exPlanations (SHAP) analysis was conducted to explain model predictions and quantify the importance of each feature more precisely. SHAP values provide both global insights, by quantifying the average impact of digital technologies, and local explanations, by illustrating how each feature contributes to individual predictions. This approach enables detailed personalized decision analysis [37]. The SHAP analysis was conducted using the Python SHAP package, as shown in Equation (3):
Φ ( f , x e ) = 1 D x b D Φ ( f , x e , x b )
where Φ ( f , x e ) represents the SHAP value for the explanatory feature set xe, quantifying its contribution to the model f. The term |D| denotes the cardinality of the dataset D, ensuring normalization over all possible background samples. The summation x b D Φ ( f , x e , x b ) calculates the average contribution of the explanatory feature xe when combined with background feature instances xb, where xb ∈ D represents background feature values sampled from dataset D.

2.4. Statistical Analysis

All data analyses were conducted using Python (version 3.10.9) and Amos 28.0 (IBM Corporation, Armonk, NY, USA). In the machine learning models, student engagement was dichotomized based on the median split. Pearson correlation analysis was performed for all predictor variables (nine digital technology tools). To identify the most influential digital technology tools, we employed Least Absolute Shrinkage and Selection Operator (LASSO) regression, which minimizes overfitting while retaining key predictors. The optimal tuning parameter, determined through cross-validation, was log(λ) ≈ −1.83 (i.e., λ ≈ 0.16). Five digital technology variables—mobile devices, multimedia materials, subject-specific software, websites, and management software—were retained for the final analysis. Prior to constructing the structural equation model (SEM), the Harman single-factor test and descriptive and correlation analysis were performed. Various fit indices were employed to evaluate the model’s goodness of fit. Finally, the significance of the hypothesized paths was examined. A statistical significance threshold of p < 0.05 was applied.

3. Results

3.1. Descriptive Statistics, Correlation Analysis, and Variable Selection

Table 1 displays the demographic characteristics of the participants included in this study. A total of 1158 Chinese university students were included in the analysis, comprising 717 males (61.9%) and 441 females (38.1%). Figure S1 displays the Pearson correlation analysis results among the feature variables. The results indicated significant positive correlations among the nine digital technology tools. Subsequently, a Least Absolute Shrinkage and Selection Operator (LASSO) regression analysis was conducted to identify significant predictor variables for inclusion in the final model. The optimal tuning parameter identified through cross-validation was log(λ) ≈ −1.83 (i.e., λ ≈ 0.16). Under this optimal condition, five digital technology variables were retained in the final LASSO regression model: mobile devices, multimedia materials, subject-specific software, websites, and management software. The coefficient paths of variables and the optimal parameter selection process in the LASSO regression are illustrated in Figures S2 and S3. Furthermore, variance inflation factor (VIF) analysis was conducted to examine multicollinearity among these selected variables. The results indicated that all VIF values were below the recommended threshold of 10, suggesting no significant multicollinearity issues in the final model (see Table S2).

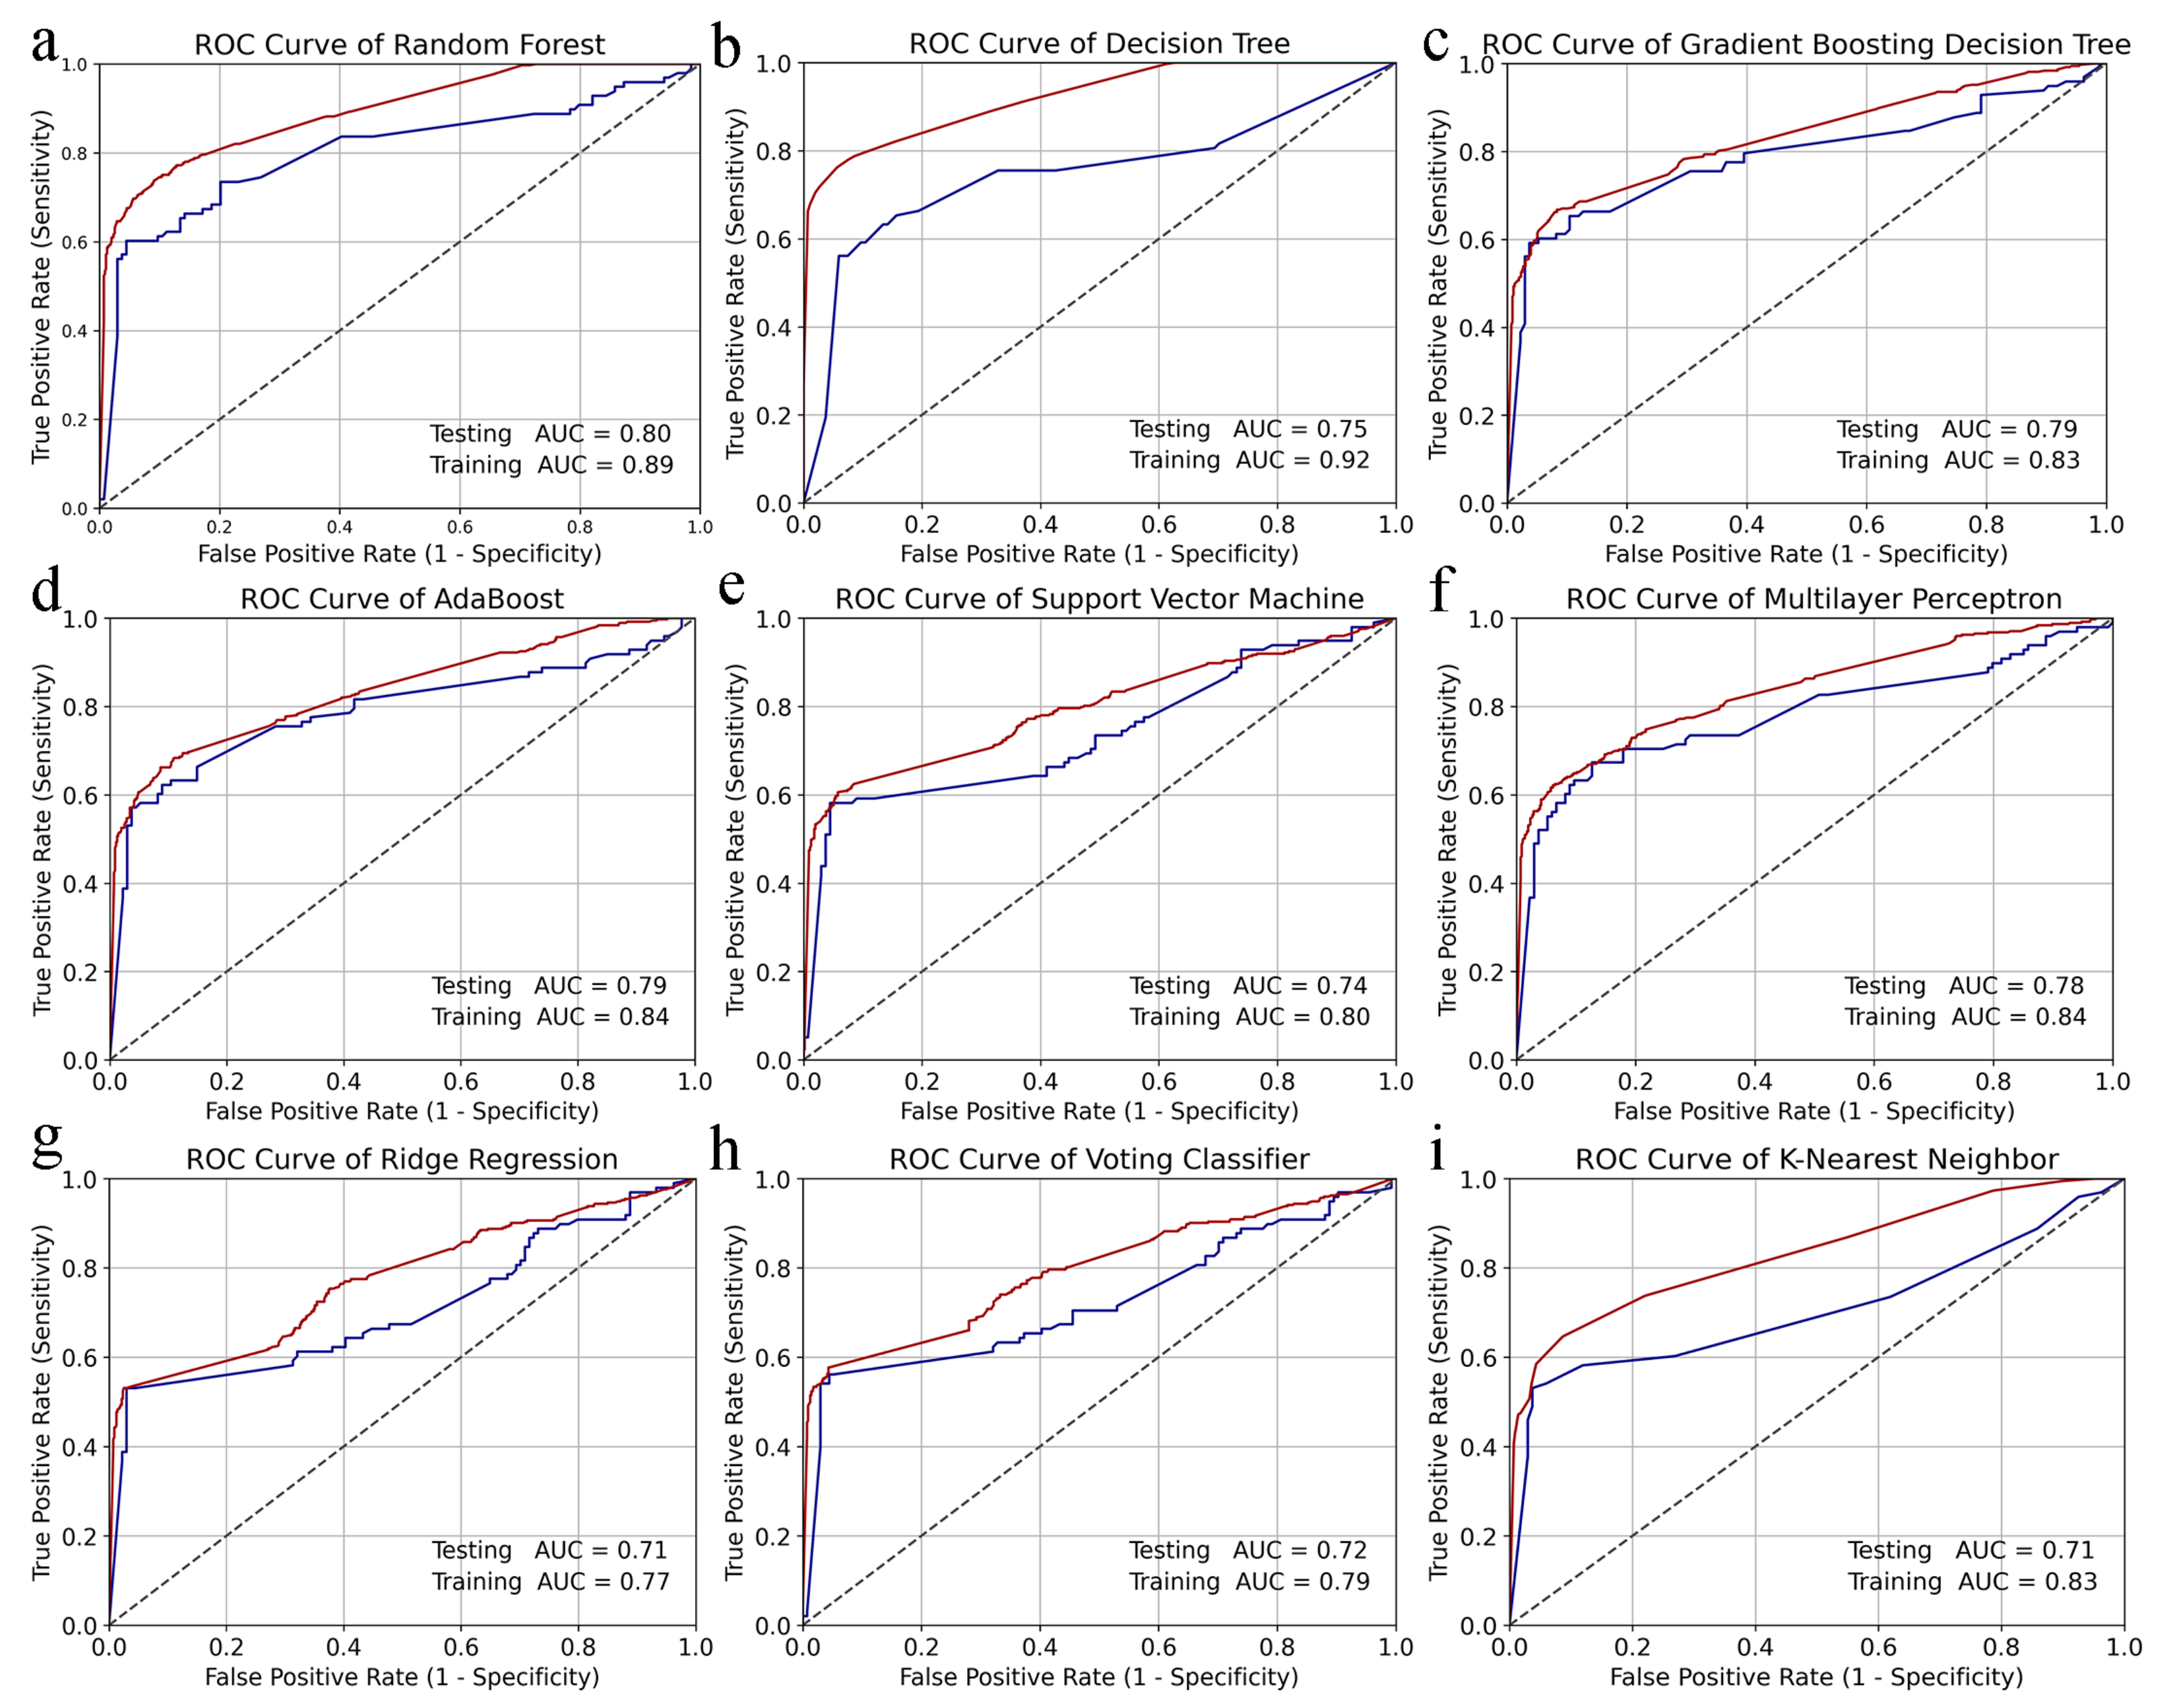
3.2. Model Performance Evaluation

The predictive performance of the nine machine learning models, including Random Forest (RF), Decision Tree (DT), Gradient Boosting Decision Tree (GBDT), AdaBoost (AB), Support Vector Machine (SVM), Multilayer Perceptron (MLP), Ridge Regression (RR), Voting Classifier (VC), and K-Nearest Neighbors (KNN), was evaluated using Receiver Operating Characteristic (ROC) curve analysis (Figure 2). The results indicated that the RF model exhibited the highest area under the ROC curve (AUC) value on the test set (0.80), outperforming the other algorithms. Specifically, the AUC values for RF, DT, GBDT, AB, SVM, MLP, RR, VC, and KNN were 0.80, 0.75, 0.79, 0.79, 0.74, 0.78, 0.71, 0.72, and 0.75, respectively. To further assess model performance, additional metrics were computed and are presented in Table 2. Among these nine machine learning models, the RF algorithm demonstrated the best predictive performance, achieving an accuracy of 79.74% and an F1-score of 0.72, surpassing traditional regression-based approaches. Therefore, the RF model was selected for further interpretive analysis.

3.3. Interpretable Modeling Approach

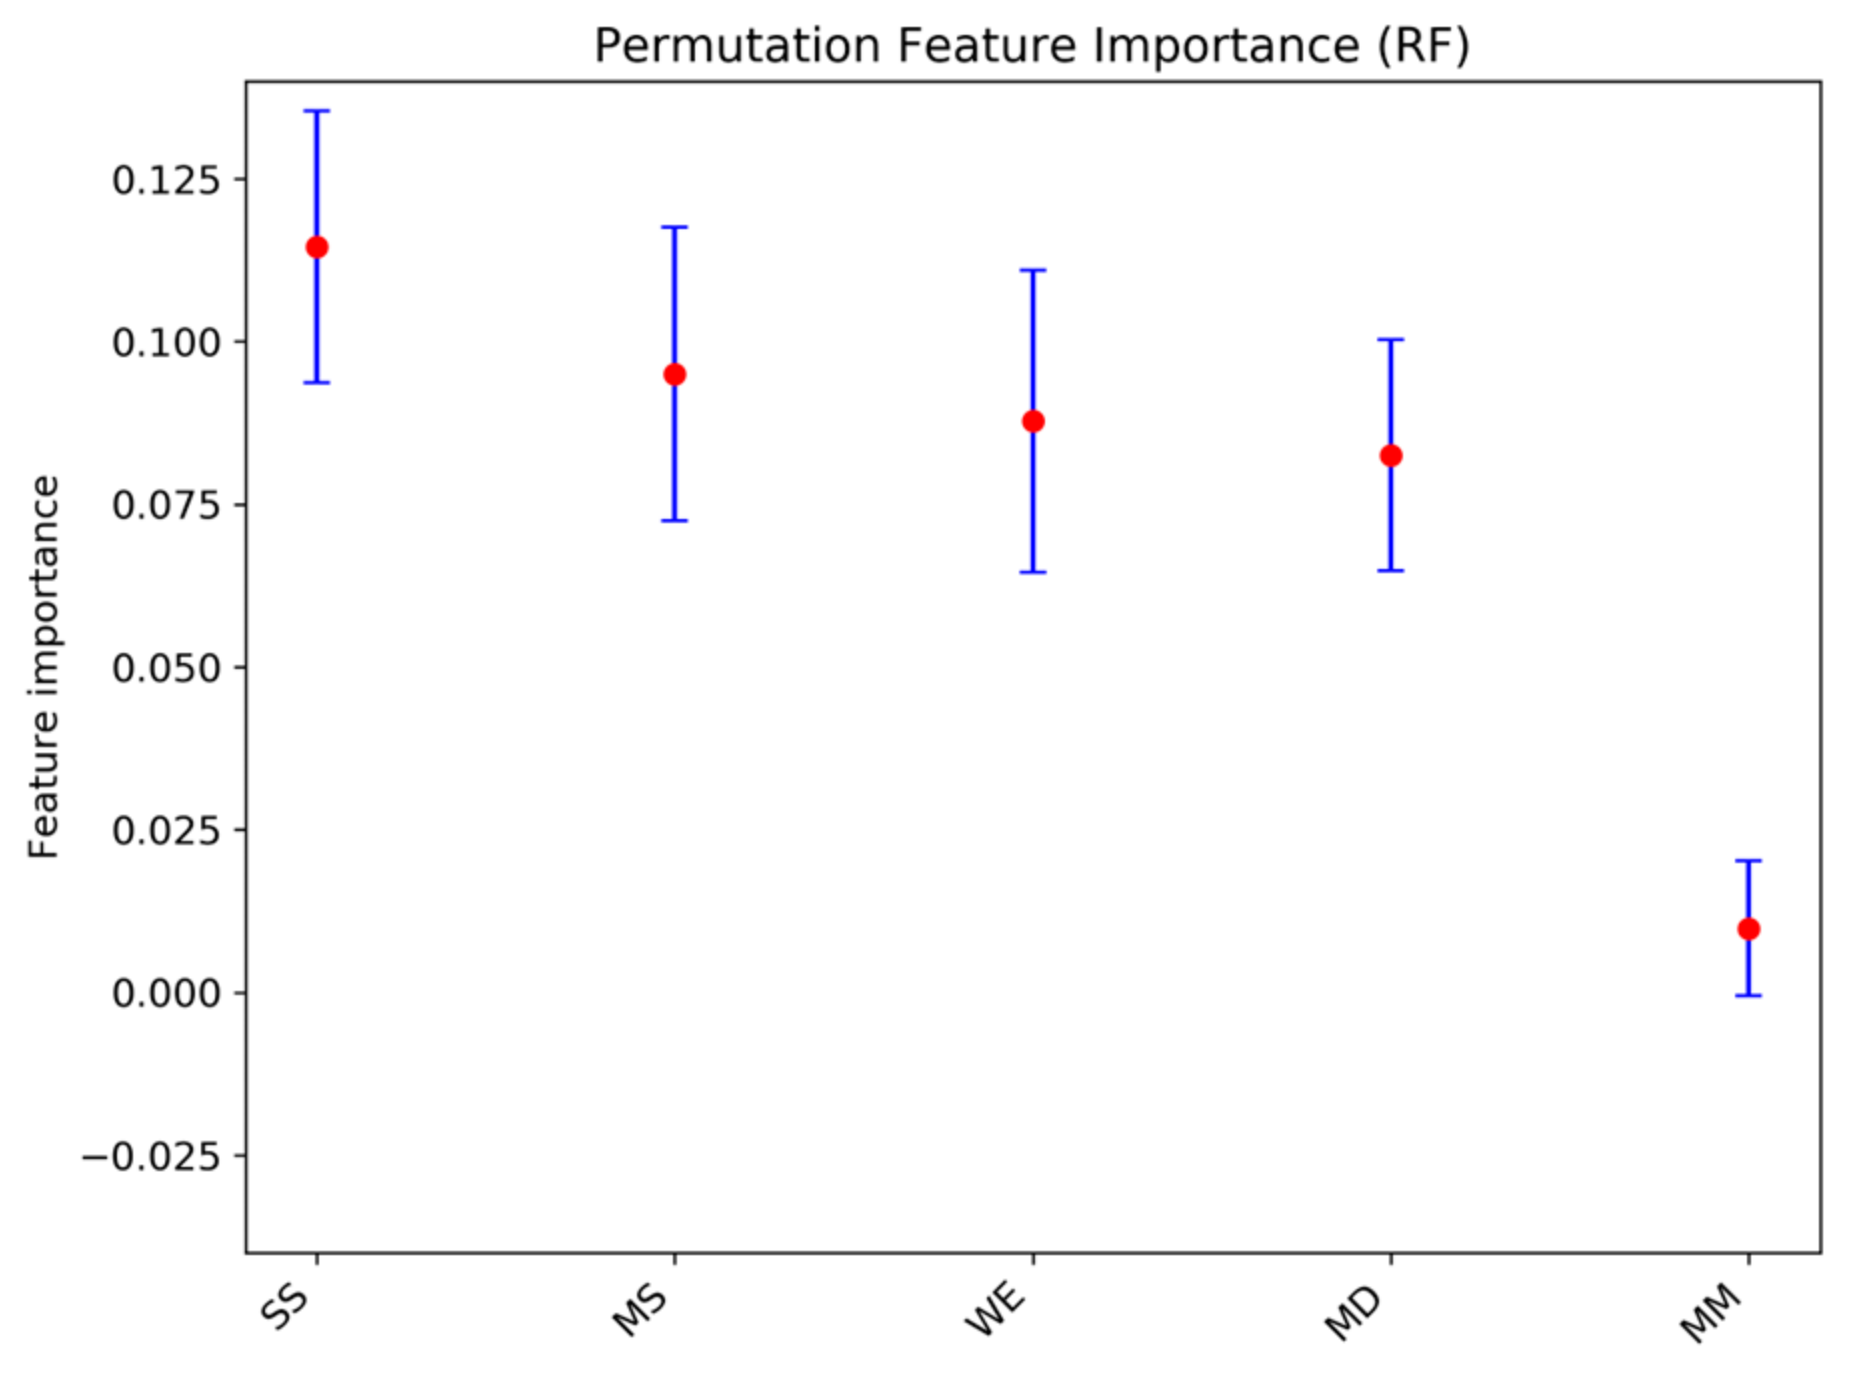
3.3.1. Importance Ranking of Digital Technologies

Figure 3 presents the feature importance scores for the five digital technology tools obtained from the RF model. The results indicate that subject-specific software had the highest contribution weight (0.1146 ± 0.0209), followed by management software (0.0950 ± 0.0225), websites (0.0878 ± 0.0232), and mobile devices (0.0825 ± 0.0177). These findings suggest that these four variables are highly influential and important predictors of student classroom engagement. In contrast, multimedia materials had the lowest contribution weight (0.0098 ± 0.0104), indicating its relatively limited impact on student engagement in PE classes.

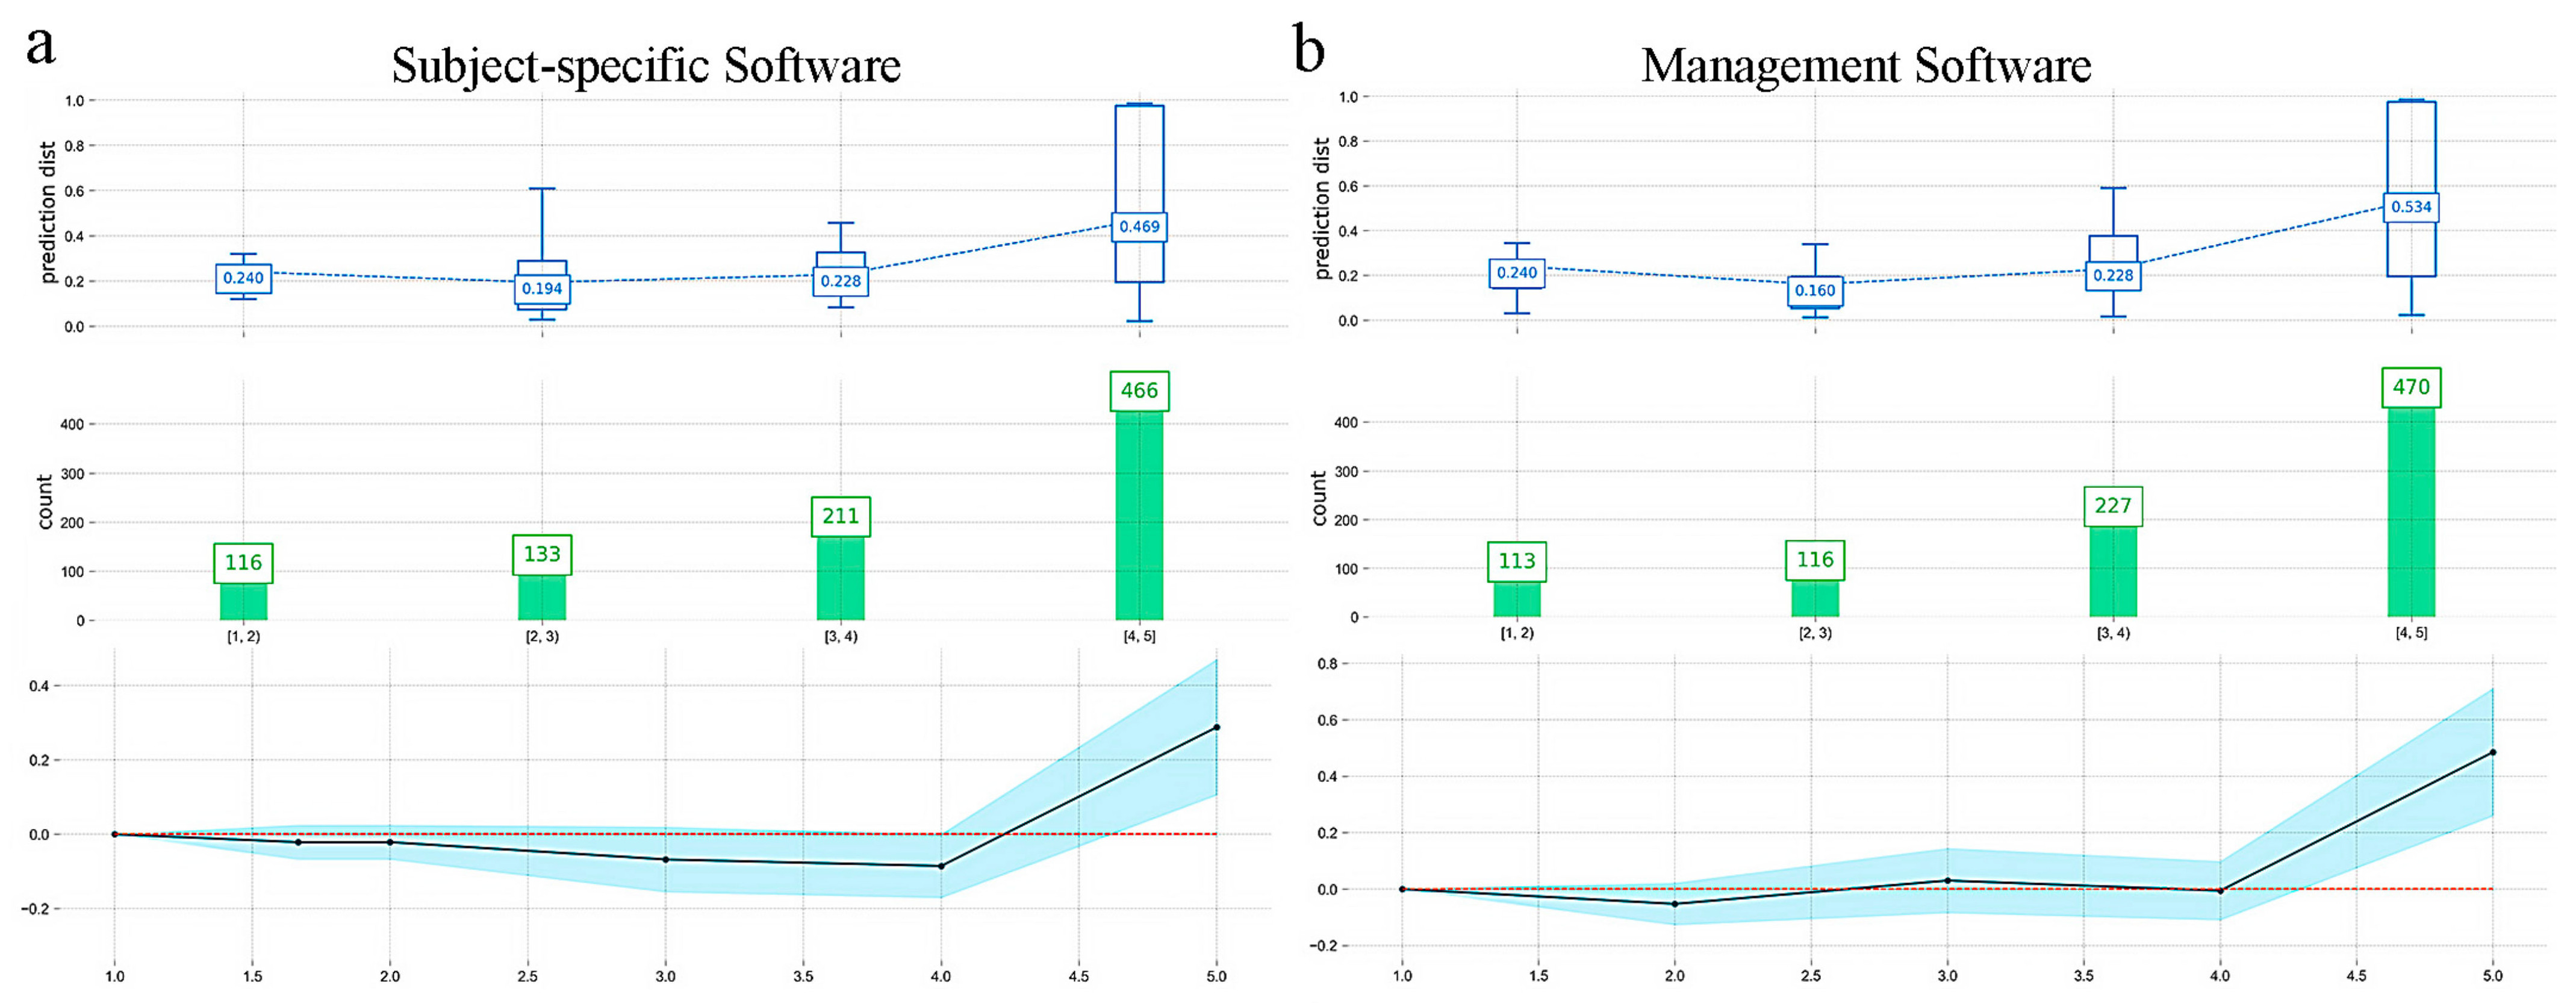
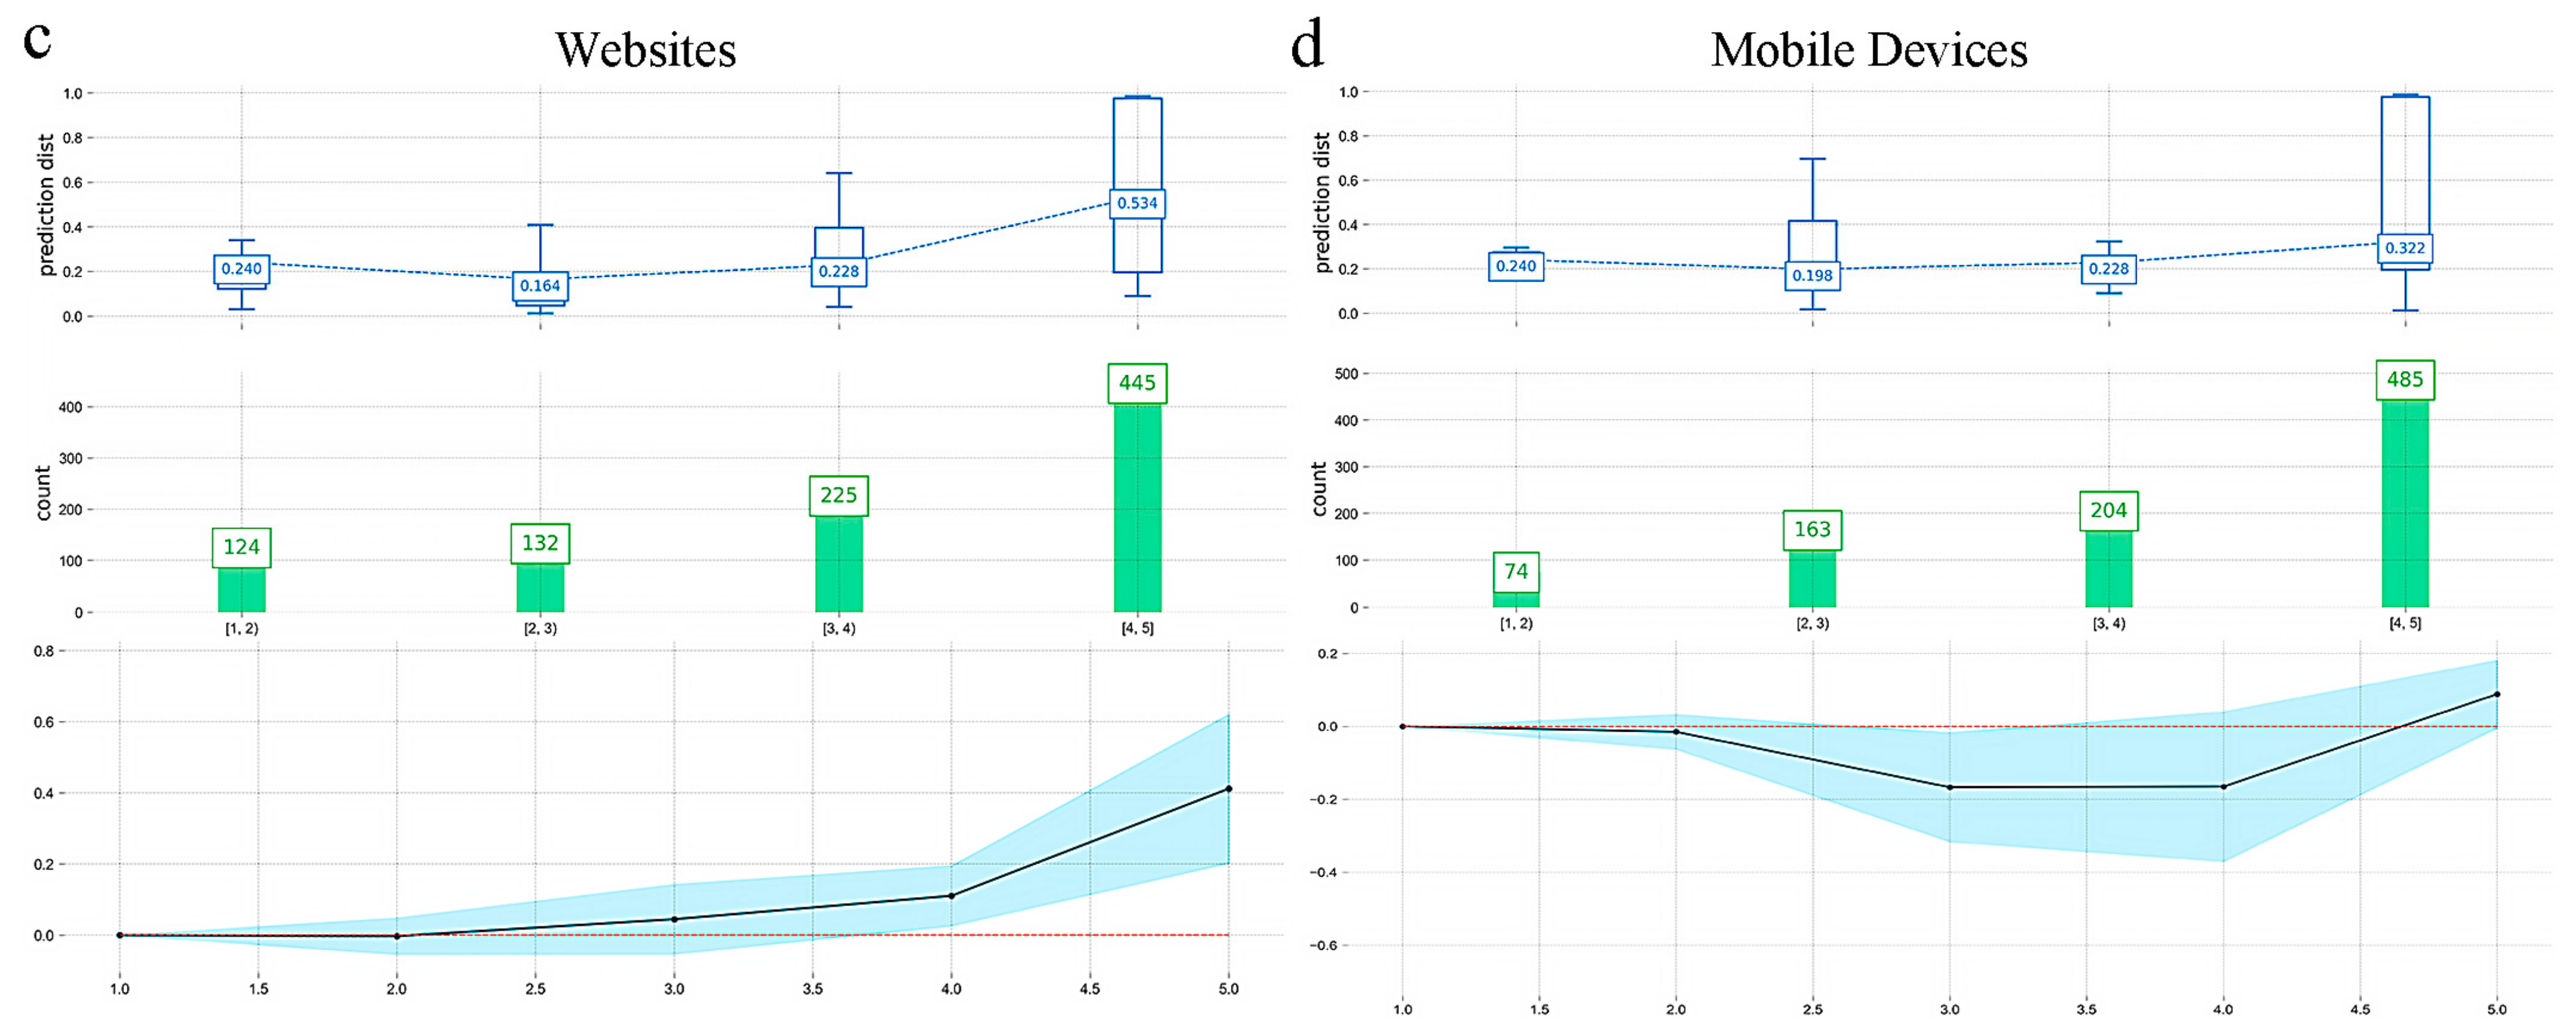
3.3.2. Relationships Between Key Digital Technologies and Classroom Engagement

To effectively interpret the relationships between digital technology usage and student classroom engagement, partial dependence plots (PDPs) were generated. As shown in Figure 4, when the logarithmically transformed values of subject-specific software, management software, websites, and mobile devices ranged approximately from 2 to 5, student classroom engagement exhibited an upward trend. This indicates that within a specific range, an increased usage frequency of these digital technologies could significantly enhance student engagement in PE classes.

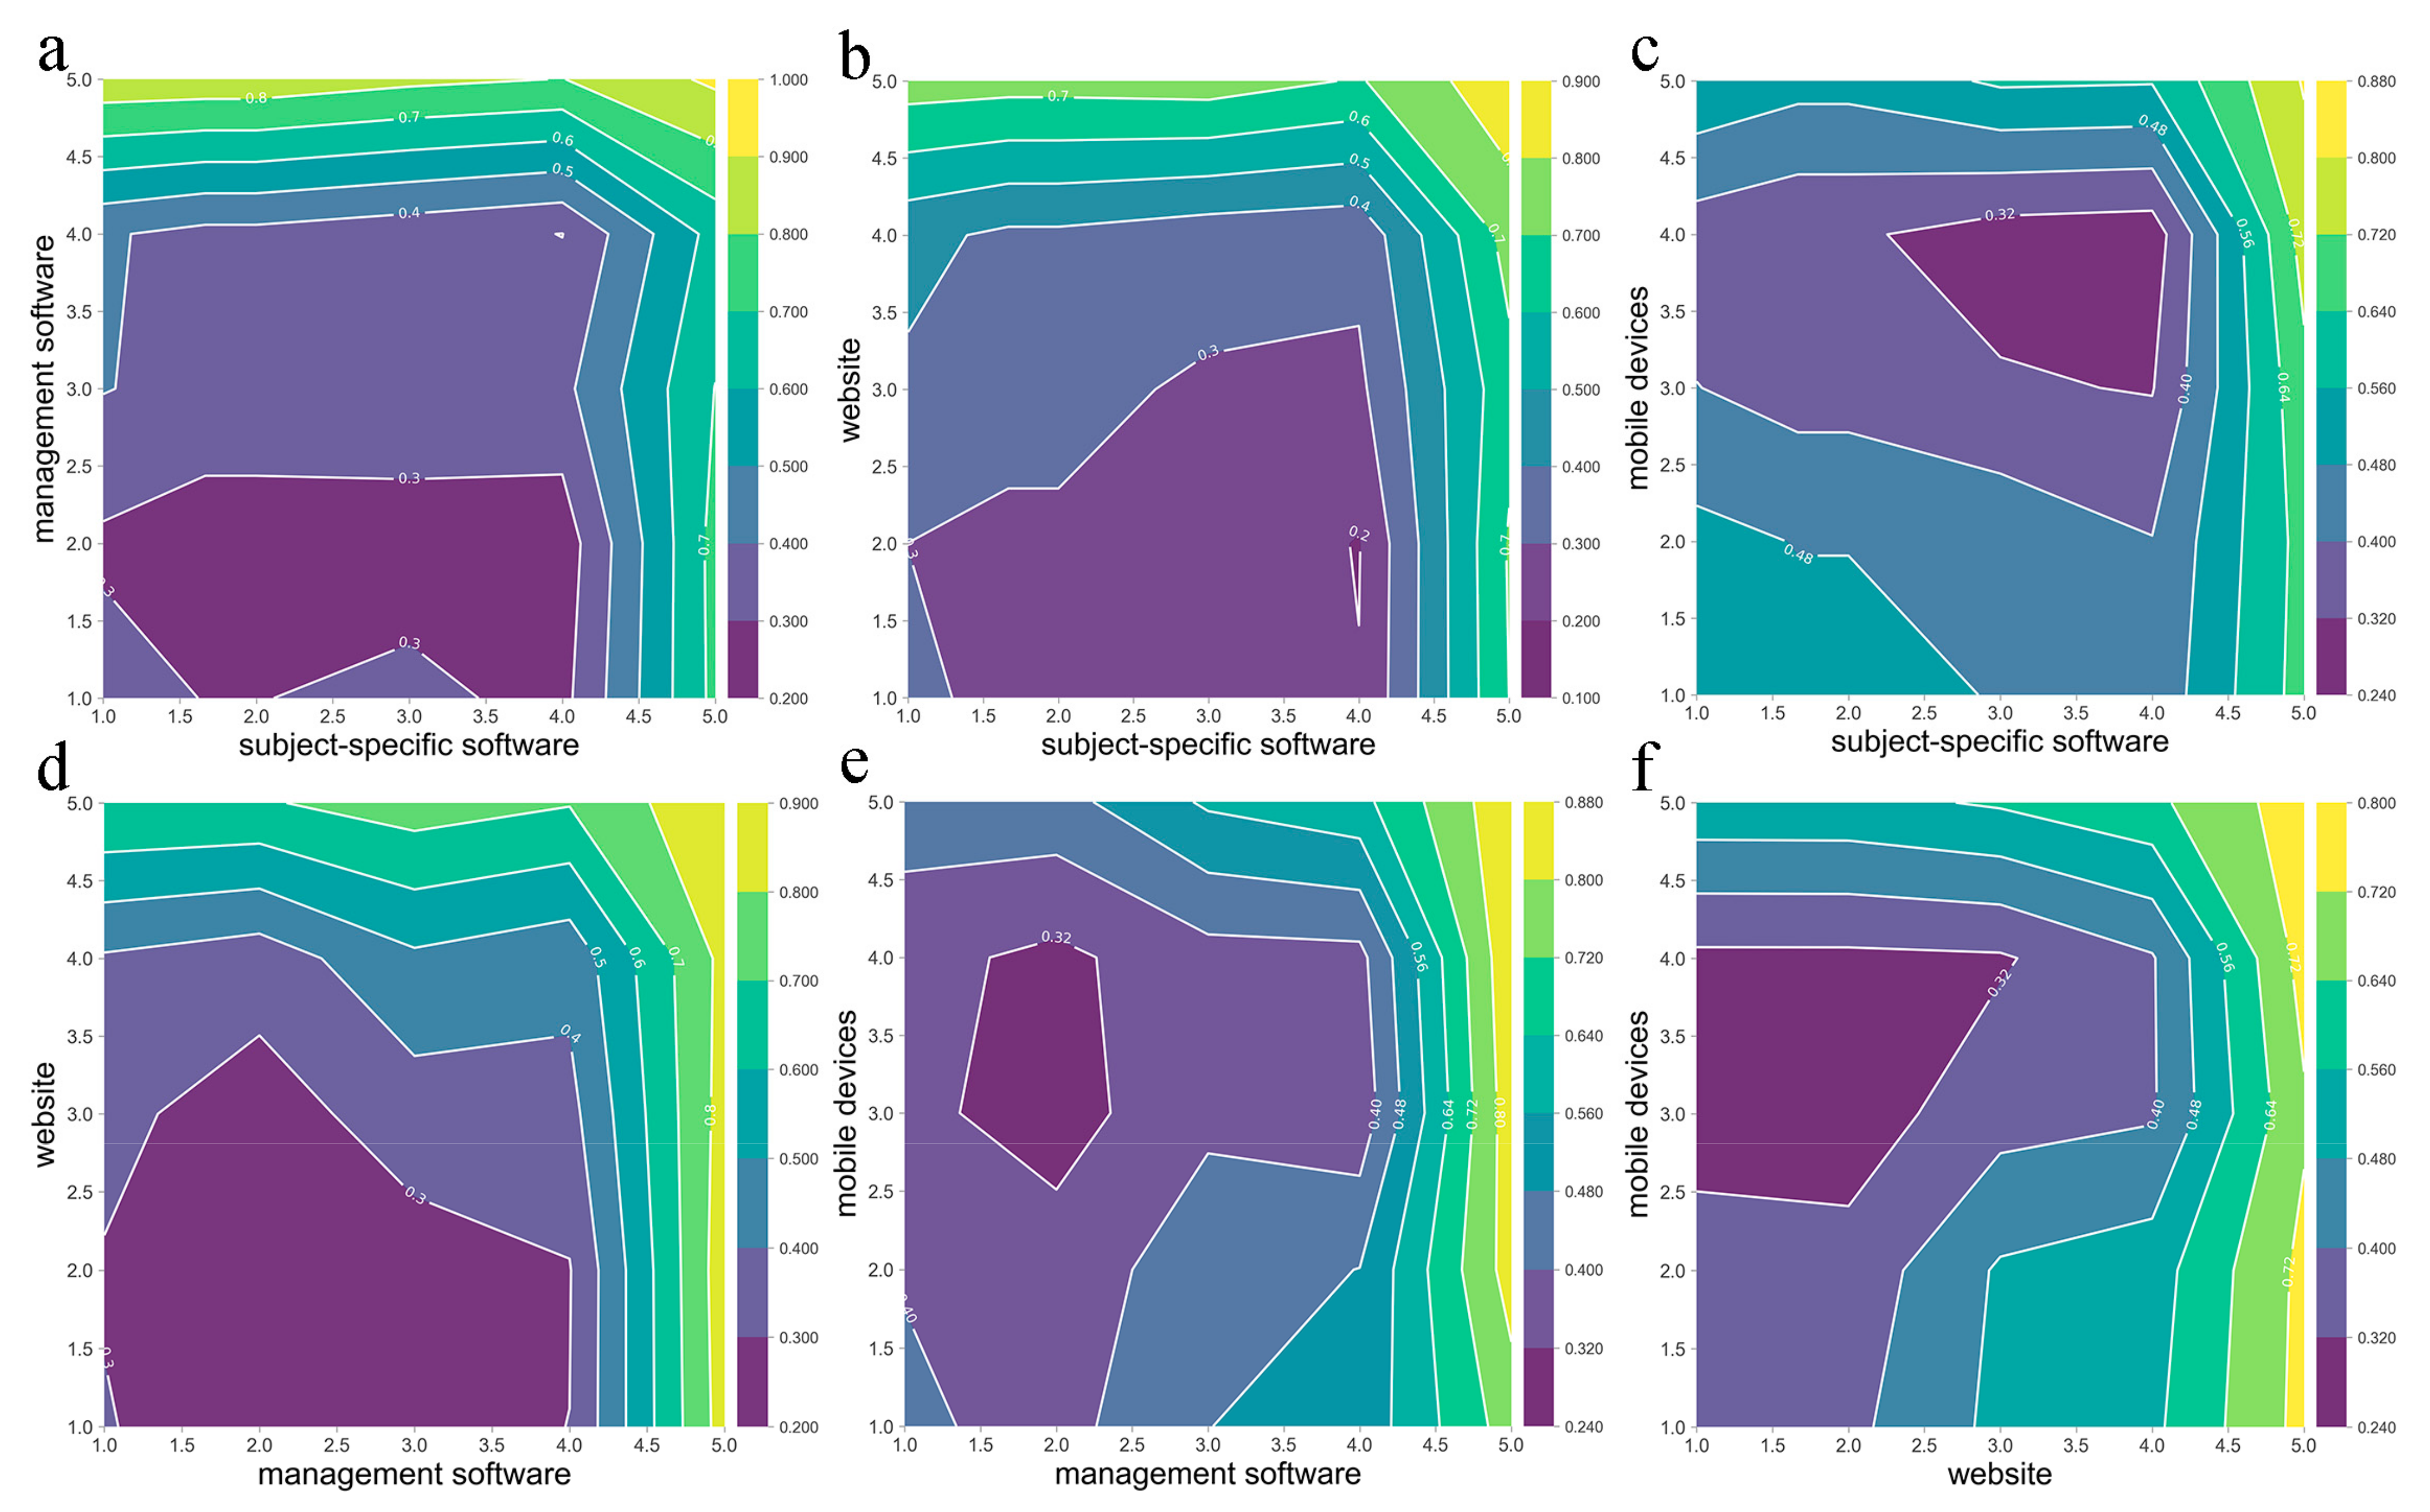
3.3.3. Synergistic Effects of Key Digital Technologies on Student Classroom Engagement

Given that digital technologies in classroom settings are typically used in combination rather than independently, we further examined the synergistic effects of paired combinations of digital technology tools on student classroom engagement. Figure 5a–f illustrates the interaction effects between subject-specific software, management software, websites, and mobile devices on classroom engagement. Figure 5a depicts the combined effects of subject-specific software and management software on classroom engagement, demonstrating a pronounced synergistic effect. Specifically, the simultaneous high-level application of both subject-specific software and management software resulted in optimal predicted classroom engagement. Moreover, management software alone was also found to substantially enhance engagement, even at relatively low levels of subject-specific software usage. Figure 5b shows the joint impact of subject-specific software and websites on student engagement. The results reveal that once the usage level of subject-specific software exceeds a critical threshold (approximately 4.0), classroom engagement rapidly increases even when website technology usage remains at a lower level. Thus, subject-specific software represents a primary driving factor in enhancing student classroom engagement, whereas website technology plays a secondary role, effectively amplifying engagement only when combined with a higher level of subject-specific software. Figure 5c indicates that increasing levels of subject-specific software significantly improve student classroom engagement. However, the standalone use of mobile devices at high levels (4.0–5.0) does not notably enhance classroom engagement unless coupled with similarly high usage of subject-specific software. Moreover, excessive reliance on mobile devices without sufficient subject-specific software usage could negatively affect predicted student engagement. Figure 5d reveals that classroom engagement gradually increases with higher management software usage levels, even when website usage remains moderate or low. When the usage level of management software surpasses a threshold (approximately 4.0 or higher), the positive influence of website becomes significantly magnified, substantially boosting student engagement. This indicates that the beneficial impact of websites strongly depends on the effective utilization of management software. Figure 5e illustrates that increasing mobile device usage alone does not lead to substantial improvements in classroom engagement. However, as management software usage increases, student engagement significantly improves, reaching its peak when both management software and mobile device usage are at high levels (4.0–5.0). Lastly, Figure 5f demonstrates that classroom engagement remains low when mobile device usage increases independently, particularly at low levels of website technology usage. Nevertheless, student engagement significantly improves as the usage of website technology increases. Notably, when both website technology and mobile device usage reach high levels, predicted classroom engagement achieves its highest value, underscoring a significant synergistic effect.

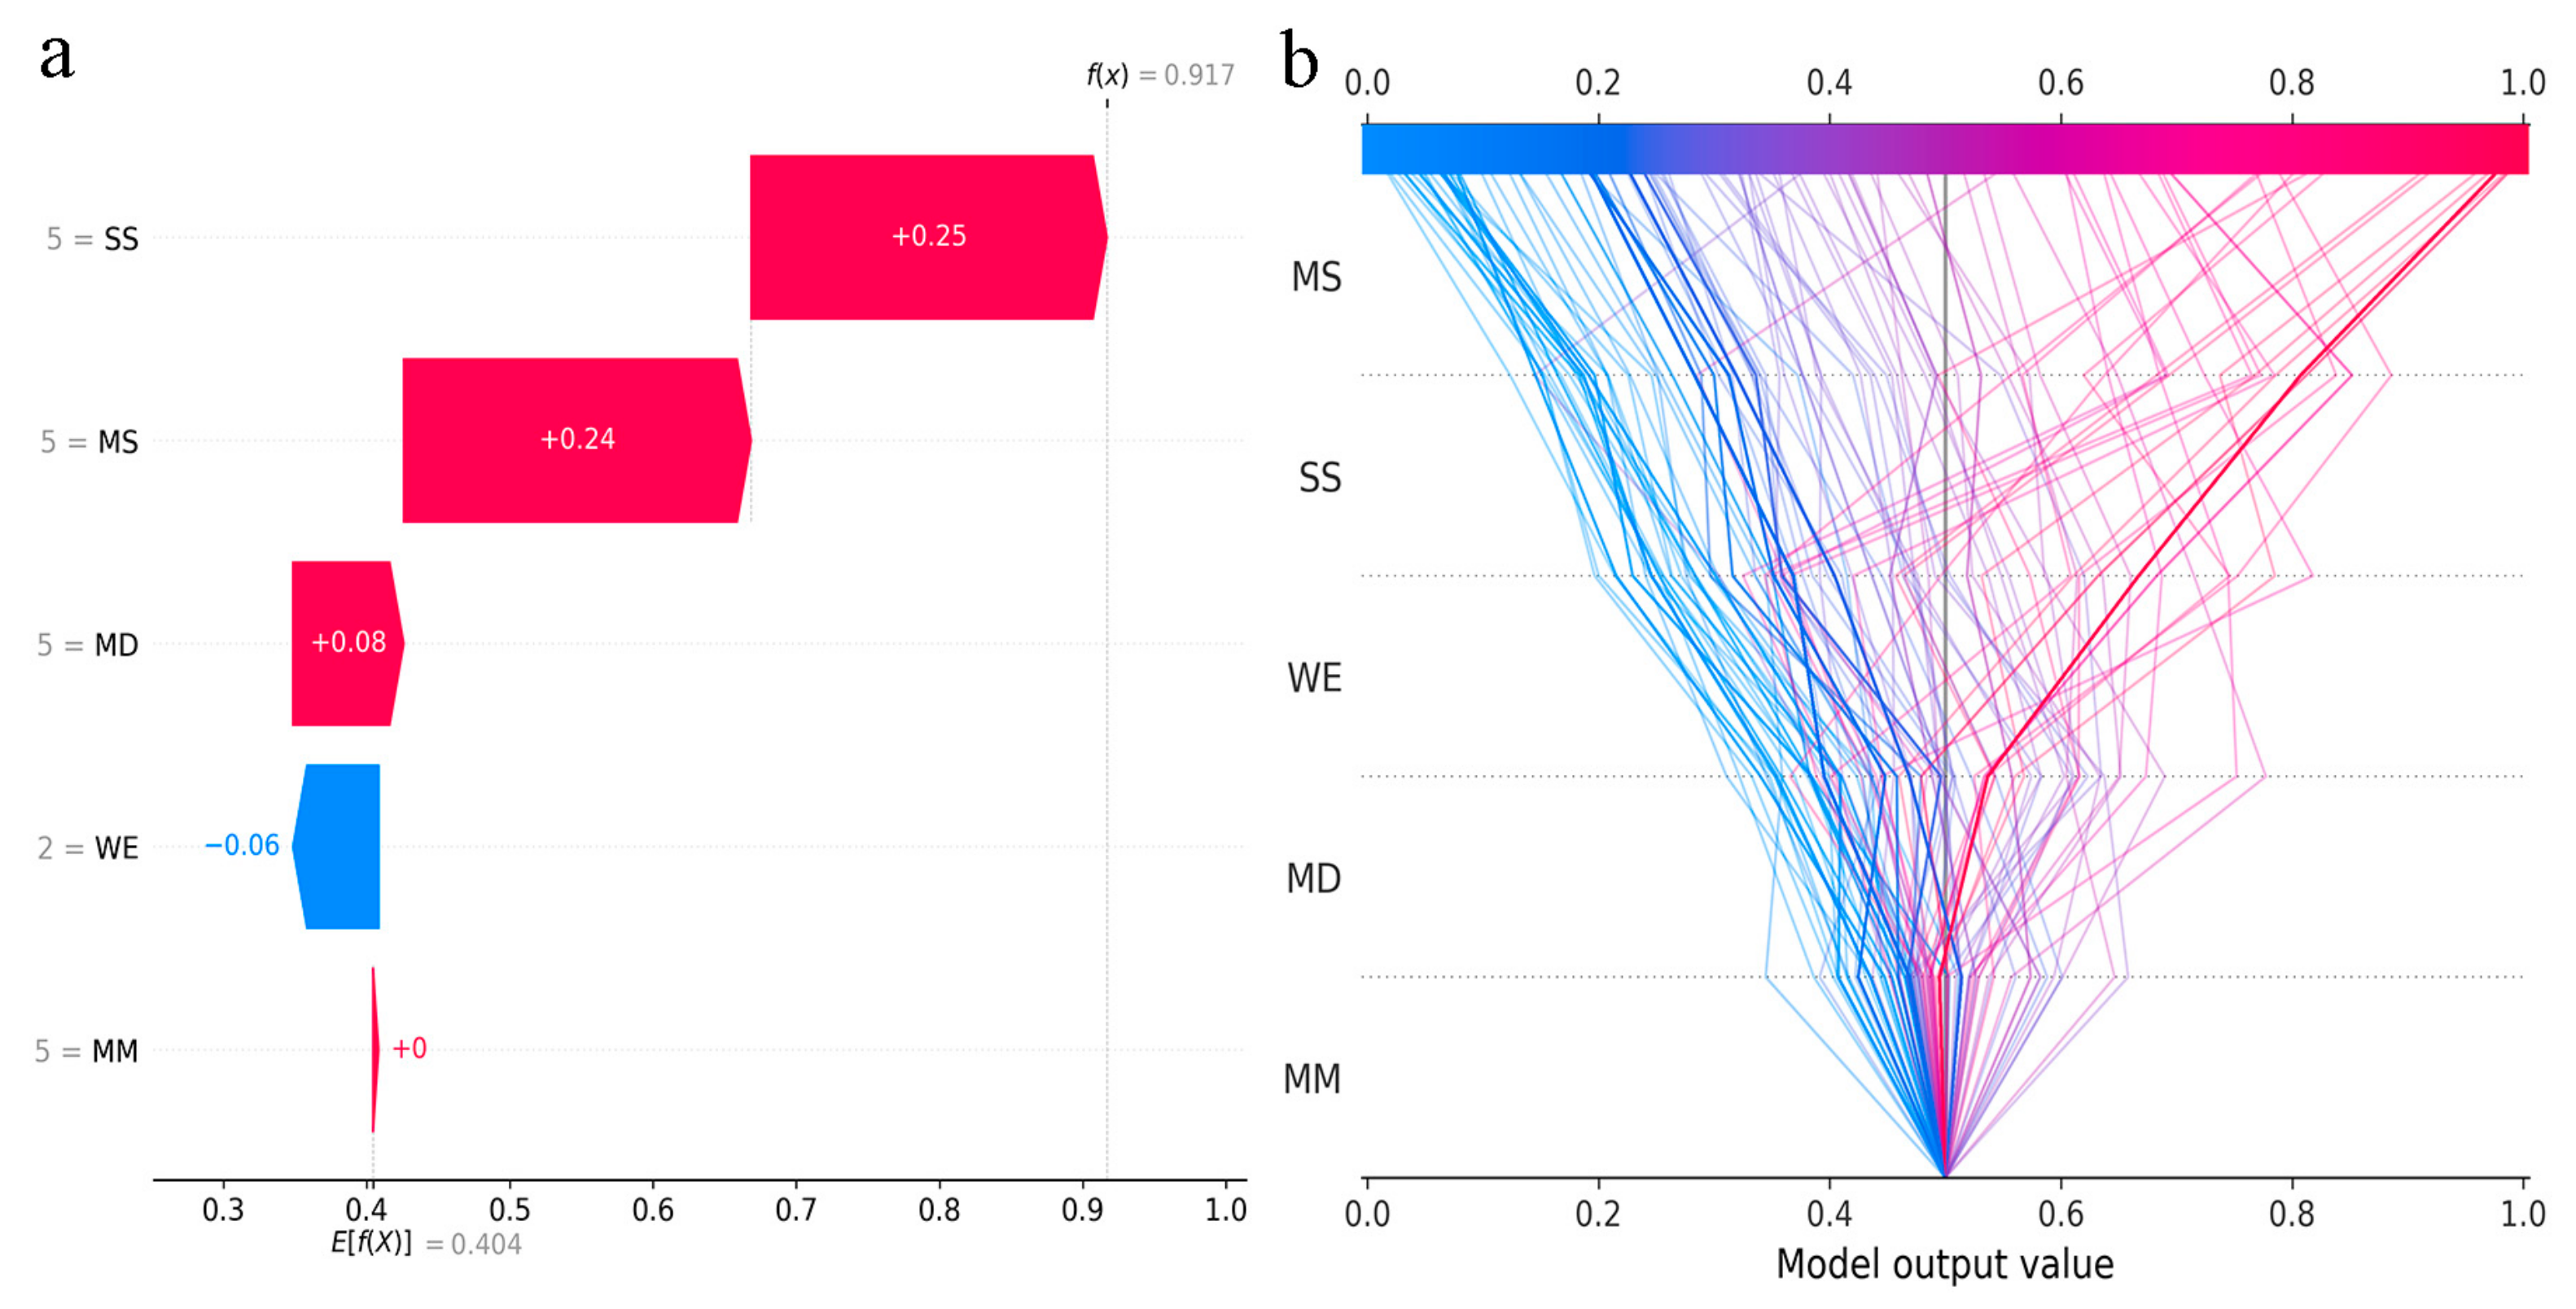
3.3.4. SHAP Analysis for Model Interpretation

Figure 6 presents the SHAP waterfall plot and decision plot of the RF model. Figure 6a indicates that the model’s average predicted classroom engagement was 0.404. Subject-specific software and management software notably increased student classroom engagement, followed by mobile devices. In contrast, insufficient or low-level website usage negatively impacted engagement, while multimedia technology exhibited minimal influence. Figure 6b further illustrates that management software and subject-specific software were the most influential predictors of student classroom engagement. Higher levels of subject-specific software and management software usage corresponded to increased predicted engagement levels and vice versa. Although websites, mobile devices, and multimedia materials exerted relatively minor effects, they functioned as auxiliary facilitators of engagement for certain student subgroups.

3.4. Structural Equation Modeling Analysis

Before conducting the structural equation modeling (SEM) analysis, Harman’s single-factor test was employed to assess common method bias. The analysis extracted six factors with eigenvalues greater than 1.0, and the cumulative variance explained by the first factor was 23.49%, which is well below the commonly accepted threshold of 40%. Therefore, no significant common method bias was detected in this study. Table 3 summarizes the correlation coefficients among the key study variables, indicating significant positive correlations between digital technology usage, perceived usefulness (PU), perceived ease of use (PEU), academic self-efficacy (ASE), and student classroom engagement (all p-values < 0.001). Subsequently, two structural equation models were constructed using Amos 28.0. The first model included digital technology usage, PU, ASE, and student engagement in PE classes, while the second model comprised digital technology usage, PEU, ASE, and student engagement. Gender, age, ethnicity, grade level, and residential location were included as control variables in both models. Table 4 presents the model fit indices, most of which were within acceptable ranges, indicating good overall model fit. Table 5 reports the path coefficients and significance levels for both structural equation models. The results demonstrated that the frequency of digital technology usage had a significant positive effect on student classroom engagement (β = 0.108, p < 0.001), PU (β = 0.506, p < 0.001), PEU (β = 0.487, p < 0.001), and ASE (β = 0.258, p < 0.001), supporting Hypotheses 1–4. Additionally, PU, PEU, and ASE also had significant positive effects on student classroom engagement (β = 0.572, p < 0.001; β = 0.535, p < 0.001; β = 0.256, p < 0.001), confirming Hypotheses 5, 6, and 9. Furthermore, PU and PEU were found to significantly influence ASE (β = 0.436, p < 0.001; β = 0.445, p < 0.001), supporting Hypotheses 7 and 8. These findings suggest that PU, PEU, and ASE not only serve as mediators in the relationship between digital technology usage frequency and student classroom engagement but also function as chain mediators between digital technology usage, PU, PEU, and ASE.

4. Discussion

This study aimed to develop an interpretable predictive model using machine learning to investigate the contribution of different types of digital technology tools to university students’ engagement in PE classrooms. Furthermore, SEM was employed to analyze the pathways and mechanisms by which digital technology usage frequency, PU, PEU, and ASE influence student engagement. The findings demonstrate that the RF model achieved the highest predictive performance, identifying subject-specific software, management software, websites, and mobile devices as key factors influencing classroom engagement. Notably, subject-specific software and management software showed significant synergistic effects. Additionally, SEM results revealed that digital technology usage frequency not only directly influenced classroom engagement but also exerted indirect effects through PU, PEU, and ASE. This study further confirmed a chain-mediated effect, wherein PU and ASE, as well as PEU and ASE, sequentially contributed to engagement enhancement. By integrating machine learning with SEM, this study introduces a novel approach that enables both the precise prediction of classroom engagement and a systematic exploration of its underlying mechanisms. These findings provide valuable insights for optimizing digital learning environments and improving instructional strategies in PE classrooms.
This study confirms the significant role of digital technology in enhancing student engagement, aligning with prior research [12]. However, unlike previous studies that broadly associate technology use with engagement, our findings highlight the specific impact of subject-specific and management software, which exhibited synergistic effects. This suggests that digital tools should be strategically implemented, rather than used indiscriminately, to optimize learning outcomes. While websites and mobile devices also contribute to engagement, their effects are relatively weaker. In contrast, multimedia technology has a more limited influence on classroom engagement. This may be because subject-specific software is typically designed for specific disciplines, providing highly relevant resources and tools that enhance students’ understanding and interest in course materials, thereby fostering more active classroom participation. Similarly, management software facilitates the organization and administration of learning processes, improving instructional efficiency and effectiveness [38] and providing timely feedback, which in turn promotes student engagement. In contrast, multimedia technology has become a standard component of teaching, offering limited additional benefits beyond its routine use. A comparative study of four types of classroom digital technologies—electronic lectures, classroom response systems, classroom chat, and mobile virtual reality—found that classroom response systems had the highest acceptance, whereas mobile virtual reality had the lowest. After three months of use, students’ PU and behavioral intention declined significantly [19]. This suggests that the impact of digital technology on student engagement may diminish over time [39,40].
Furthermore, this study highlights the existence of a threshold effect in digital technology usage. Increasing the frequency of digital technology use enhances student engagement only up to a certain point. For instance, the use of mobile devices alone does not significantly improve engagement unless accompanied by frequent use of subject-specific or management software. This finding supports previous research indicating that the intensity of digital technology use must remain within an optimal range to maximize classroom effectiveness. Additionally, disparities in students’ digital literacy levels may contribute to unequal classroom experiences, causing some students to feel frustrated in the learning process, thereby impacting educational equity [41,42]. Therefore, effectively integrating digital technology into PE classrooms to ensure equitable access and benefits for all students remains a crucial challenge requiring further investigation. However, in practical application, considerable variability exists across institutions and regions in financial capacity and technological readiness. For example, the adoption of subject-specific or management software often requires substantial upfront investment, comprehensive teacher training, and continuous technical support. Institutions with limited funding or underdeveloped digital infrastructure may face significant barriers to implementing these tools effectively. Thus, educational administrators should conduct cost–benefit analyses and infrastructure audits prior to large-scale implementation, striving to balance technological innovation, long-term sustainability, and equitable access.
Based on these considerations, this study offers the following recommendations. First, institutions should prioritize investment in subject-specific and management software that directly aligns with the pedagogical goals of physical education, as their synergistic use demonstrates the greatest potential to enhance classroom engagement. Second, digital technology training programs should be provided for all teachers to ensure that each educator is equipped to effectively integrate these tools into instructional practice. In turn, teachers can support students in developing their own digital literacy, helping to reduce disparities and enhance students’ perceptions of usefulness and ease of use regarding educational technologies. Third, the implementation of digital tools should be accompanied by ongoing evaluation and feedback mechanisms to monitor their impact on student engagement and guide continuous instructional improvement, thereby maximizing the effectiveness of digital integration in PE classrooms.
The results of the SEM analysis indicate that PU, PEU, and ASE serve as significant mediators in the relationship between digital technology usage frequency and classroom engagement. Notably, PU and PEU function as critical mediating variables, further amplifying the positive impact of ASE on engagement. These findings are consistent with previous research [20,43,44]. The Technology Acceptance Model (TAM) provides a theoretical explanation for this mechanism [17]. Prior studies have suggested that access to digital infrastructure and technical support is closely related to learners’ PU [45], which, in turn, positively influences ASE [20,46,47]. In the context of university PE classrooms, when students perceive digital tools as beneficial for improving their learning experience and academic outcomes, and when they find these tools easy to use, their ASE increases. Higher ASE, in turn, fosters positive emotions toward using digital technology and engaging in PE, leading to greater classroom engagement and improved physical activity outcomes [48].
This study’s primary strength lies in its methodological innovation. It is the first to integrate machine learning with SEM, not only enabling the precise prediction of classroom engagement but also quantifying the contribution of different digital technology tools. Furthermore, it systematically elucidates the complex mechanisms by which digital technology usage frequency, PU, PEU, and ASE influence engagement. Additionally, this study incorporates a large and geographically diverse sample of university students, enhancing the generalizability and robustness of the findings. Beyond offering valuable policy insights for educational institutions and policymakers regarding the allocation of educational resources and the integration of digital technologies in classrooms, the findings of this study also provide concrete pedagogical implications for PE instructors. In practical PE instruction, teachers must first enhance their digital teaching literacy. This involves not only technical proficiency but also a deeper understanding of the educational potential of digital tools, the ability to analyze and respond to student feedback, and the capacity to effectively align digital technologies with pedagogical objectives. Second, PE teachers should be aware of the “threshold effect” and “synergistic effect” associated with digital technology usage, ensuring that excessive implementation does not lead to negative outcomes. Finally, teachers should adopt student-centered teaching approaches that leverage technology to foster interaction, reflection, and autonomy throughout the learning process, thereby increasing student engagement.
However, some limitations should be acknowledged. First, the cross-sectional research design precludes causal inferences between variables. Future studies could employ longitudinal designs and controlled experiments to better understand the long-term effects of digital technology on student engagement in PE classrooms, as well as to discern the specific impact of each type of digital tool on classroom engagement. Second, since this study relies on self-reported survey data, there is a potential for response bias. To enhance the reliability and validity of the data, future research may consider employing multiple methodological approaches, such as direct observation, interviews (e.g., with students and teachers), and the collection of physiological or behavioral data, in order to deepen the understanding of the mechanisms behind classroom engagement and to provide a more comprehensive and objective evaluation of the impact of digital technology on classroom engagement. Lastly, although the RF model demonstrated strong predictive performance in this study, it is known to be sensitive to sample characteristics and data distribution. When applied to diverse student populations, educational levels, or cultural contexts, its generalizability may be constrained. Therefore, future research should further assess the model’s predictive performance across varied educational and cultural settings to evaluate its broader applicability.

5. Conclusions

This study integrates machine learning and SEM to investigate the impact of digital technology on student engagement in PE classrooms. The findings reveal that subject-specific software and management software are the most influential factors, demonstrating strong synergistic effects that significantly enhance student engagement. The use of digital technology increases student engagement both directly and indirectly through PU, PEU, and ASE. By combining predictive modeling with theoretical validation, this study provides both theoretical insights and empirical evidence to optimize digital technology applications and enhance instructional quality and student learning experiences in PE classrooms. However, the cross-sectional research design and reliance on self-reported questionnaire data limit causal inference and may introduce response bias. Future research could adopt longitudinal designs and methods such as direct observation to improve the reliability and validity of the results. Additionally, further studies could explore the applicability of these findings across various subject areas or educational levels, thereby expanding the understanding of how digital technology promotes student classroom engagement.

Supplementary Materials

The following supporting information can be downloaded at https://www.mdpi.com/article/10.3390/app15073884/s1: Table S1. Details of hyperparameter for ML models; Table S2. Assessment of multicollinearity among model variables using variance inflation factors (VIF); Figure S1. Heatmap of the correlation matrix between all digital technology tools; Figure S2. LASSO regularization path showing coefficient shrinkage as a function of log(λ); Figure S3. Selection of the optimal tuning parameter (λ) in LASSO regression via cross-validation.

Author Contributions

Conceptualization, L.Z. (Liguo Zhang) and A.G.; methodology, L.Z. (Liangyu Zhao); software, L.Z. (Liangyu Zhao); validation, J.G.; formal analysis, L.Z. (Liguo Zhang); investigation, L.Z. (Liguo Zhang); resources, L.Z. (Liguo Zhang); data curation, L.Z. (Liguo Zhang); writing—original draft preparation, L.Z. (Liguo Zhang); writing—review and editing, A.G.; visualization, J.G. and Z.L.; supervision, L.Z. (Liguo Zhang) and A.G.; project administration, A.G.; funding acquisition, A.G. All authors have read and agreed to the published version of the manuscript.

Funding

This research was funded by Shandong Humanities and Social Sciences Project, grant number 20CLYJ34.

Institutional Review Board Statement

This study was conducted in accordance with the Declaration of Helsinki and approved by the Ethics Committee of the School of Basic Medical Sciences, Shandong University (protocol code 2021-1-114).

Informed Consent Statement

Informed consent was obtained from all subjects involved in this study.

Data Availability Statement

The original contributions presented in this study are included in this article; further inquiries can be directed to the corresponding author.

Acknowledgments

We would like to express our gratitude to the participants in the questionnaire and interviews for their support in our research. We also appreciate the feedback and comments provided by the journal editors and reviewers.

Conflicts of Interest

The authors declare no conflicts of interest.

Abbreviations

The following abbreviations are used in this manuscript:
PEPhysical Education
PUPerceived usefulness
PEUPerceived ease of use
ASEAcademic self-efficacy
χ2/dfChi-square to Degrees of Freedom Ratio
GFIGoodness-of-Fit Index
AGFIAdjusted Goodness of Fit Index
CFIComparative Fit Index
TLITucker–Lewis Index
RMSEARoot Mean Square Error of Approximation
NFINormed Fit Index
IFIIncremental Fit Index
RFIRelative Fit Index
CIConfidence interval

Appendix A

Appendix A.1. Digital Technology Usage Questionnaire

Using a 5-point Likert scale (never = 1, rarely = 2, sometimes = 3, often = 4, very often = 5).
1. Digital devices used by teachers and the entire class (e.g., projection screens, interactive whiteboards, and touchscreen televisions).
2. Mobile devices used individually by teachers and students (e.g., laptops, tablets, and smartphones).
3. Multimedia courseware.
4. Multimedia materials (e.g., text, images, animations, videos, and audio).
5. Question banks/electronic test papers.
6. Subject-specific software and tools (e.g., motion detection devices, virtual laboratories).
7. Thematic webpages/websites.
8. Electronic textbooks/journals.
9. Course management software.

Appendix A.2. Student Classroom Engagement Questionnaire

Using a 5-point Likert scale (completely disagree = 1, disagree = 2, unsure = 3, agree = 4, completely agree = 5).
1. I listen carefully in the Smart Classroom.
2. In the Smart Classroom, I pay attention in class.
3. In the Smart Classroom, I listen attentively when the teacher talks about a new topic for the first time.
4. In the Smart classroom, I actively ask questions.
5. In the Smart classroom, when doing homework, I try to make connections between what I am learning and what I already know.
6. In the Smart classroom, when studying, I try to relate what I am learning to my own experiences.
7. In the Smart classroom, I try to combine all the different ideas to make sense of them.
8. I am curious about what I am learning.
9. I am interested in what I have learned.
10. I enjoy the class.

Appendix A.3. Perceived Usefulness of Digitization Questionnaire

Using a 5-point Likert scale (completely disagree = 1, disagree = 2, unsure = 3, agree = 4, completely agree = 5).
1. Using digital learning can improve my academic performance.
2. Using digital learning can improve my learning efficiency.
3. I think digital learning is useful to me.

Appendix A.4. Perceived Ease of Use of Digitization Questionnaire

Using a 5-point Likert scale (completely disagree = 1, disagree = 2, unsure = 3, agree = 4, completely agree = 5).
1. Learning to operate the e-learning system was easy for me.
2. It was easy for me to become proficient in using the e-learning system.
3. Overall, the e-learning system was easy to use.

Appendix A.5. Academic Self-Efficacy Questionnaire

Using a 5-point Likert scale (completely consistent = 1, less consistent = 2, unsure = 3, more consistent = 4, completely consistent = 5).
1. I believe that I am capable of achieving good results in my studies.
2. I believe I am capable of solving the problems I encounter in my studies.
3. Compared to other students in the class, my learning ability is relatively strong.
4. I believe I am able to master what the teacher teaches in class in a timely manner.
5. I believe I am able to apply what I have learned.
6. I have a broader understanding of my major than other students in my class.
7. I like to choose challenging learning tasks.
8. I believe I can understand books and what the teacher is teaching well.
9. I often choose tasks that are difficult but that I can learn from, even if they require more effort.
10. Even if I receive a poor grade on a test, I can calmly analyze the mistakes I made on it.
11. I never doubt my ability to learn, regardless of my academic performance.
12. When I study, I always check whether I have mastered what I have learned by asking myself questions.
13. When I think about a problem, I can connect what I have learned before and after.
14. I often find myself reading a book without understanding its content.
15. When I read a book, I can relate what I have read to what I already know.
16. I find that I am always distracted in class so that I cannot listen carefully.
17. I often fail to accurately summarize the main ideas of what I read.
18. I always underline the key parts in my books or notebooks to help me study.
19. When I revise for a test, I can review what I have learned both before and after.
20. When I take notes in class, I always try to memorize everything the teacher says, regardless of whether it makes sense.
21. When I do my homework, I always try to remember what the teacher said in class to perform well.
22. Even if the teacher doesn’t ask me, I will voluntarily complete the exercises at the end of each chapter in the book to test my knowledge.

References

  1. Appleton, J.J.; Christenson, S.L.; Furlong, M.J. Student engagement with school: Critical conceptual and methodological issues of the construct. Psychol. Sch. 2008, 45, 369–386. [Google Scholar] [CrossRef]
  2. Bautista-Vallejo, J.M.; Hernández-Carrera, R.M.; Moreno-Rodriguez, R.; Lopez-Bastias, J.L. Improvement of memory and motivation in language learning in primary education through the interactive digital whiteboard (idw): The future in a post-pandemic period. Sustainability 2020, 12, 8109. [Google Scholar] [CrossRef]
  3. Lin, Y.T.; Cheng, C.T. Effects of technology-enhanced board game in primary mathematics education on students’ learning performance. Appl. Sci. 2022, 12, 11356. [Google Scholar] [CrossRef]
  4. Ateş, H.; Köroğlu, M. Online collaborative tools for science education: Boosting learning outcomes, motivation, and engagement. J. Comput. Assist. Learn. 2024, 40, 1052–1067. [Google Scholar] [CrossRef]
  5. Lin, X.P.; Li, B.B.; Yao, Z.N.; Yang, Z.; Zhang, M. The impact of virtual reality on student engagement in the classroom–a critical review of the literature. Front. Psychol. 2024, 15, 1360574. [Google Scholar] [CrossRef]
  6. Xu, L. Navigating the educational landscape: The transformative power of smart classroom technology. J. Knowl. Econ. 2024, 1–32. [Google Scholar] [CrossRef]
  7. Zhang, X.; Qian, W.; Chen, C. The effect of digital technology usage on higher vocational student satisfaction: The mediating role of learning experience and learning engagement. Front. Educ. 2024, 9, 1508119. [Google Scholar] [CrossRef]
  8. Teo, T.; Khazaie, S.; Derakhshan, A. Exploring teacher immediacy-(non)dependency in the tutored augmented reality game-assisted flipped classrooms of English for medical purposes comprehension among the Asian students. Comput. Educ. 2022, 179, 104406. [Google Scholar] [CrossRef]
  9. Pikhart, M.; Klimova, B.; Al-Obaydi, L.H. Exploring university students’ preferences and satisfaction in utilizing digital tools for foreign language learning. Front. Educ. 2024, 9, 1412377. [Google Scholar] [CrossRef]
  10. Ahadi, A.; Bower, M.; Lai, J.; Singh, A.; Garrett, M. Evaluation of teacher professional learning workshops on the use of technology—A systematic review. Prof. Dev. Educ. 2024, 50, 221–237. [Google Scholar] [CrossRef]
  11. Mayer, R.E. Multimedia Learning, 2nd ed.; Cambridge University Press: Cambridge, UK, 2009. [Google Scholar] [CrossRef]
  12. Osterlie, O.; Sargent, J.; Killian, C.; Garcia-Jaen, M.; Garcia-Martinez, S.; Ferriz-Valero, A. Flipped learning in physical education: A scoping review. Eur. Phys. Educ. Rev. 2023, 29, 125–144. [Google Scholar] [CrossRef]
  13. Calabuig-Moreno, F.; Huertas Gonzalez-Serrano, M.; Fombona, J.; Garcia-Tascon, M. The Emergence of Technology in Physical Education: A General Bibliometric Analysis with a Focus on Virtual and Augmented Reality. Sustainability 2020, 12, 2728. [Google Scholar] [CrossRef]
  14. Wang, N.; Abdul Rahman, M.N.; Lim, B.-H. Teaching and Curriculum of the Preschool Physical Education Major Direction in Colleges and Universities under Virtual Reality Technology. Comput. Intell. Neurosci. 2022, 2022, 3250986. [Google Scholar] [CrossRef] [PubMed]
  15. Alenezi, M.; Wardat, S.; Akour, M. The Need of Integrating Digital Education in Higher Education: Challenges and Opportunities. Sustainability 2023, 15, 4782. [Google Scholar] [CrossRef]
  16. Karaoglan Yilmaz, F.G.; Yilmaz, R. Learning Analytics Intervention Improves Students’ Engagement in Online Learning. Technol. Knowl. Learn. 2022, 27, 449–460. [Google Scholar] [CrossRef]
  17. Davis, F.D. Perceived usefulness, perceived ease of use, and user acceptance of information technology. MIS Q. 1989, 13, 319–340. [Google Scholar] [CrossRef]
  18. Kim, S.S. Motivators and concerns for real-time online classes: Focused on the security and privacy issues. Interact. Learn. Environ. 2023, 31, 1875–1888. [Google Scholar] [CrossRef]
  19. Sprenger, D.A.; Schwaninger, A. Technology acceptance of four digital learning technologies (classroom response system, classroom chat, e-lectures, and mobile virtual reality) after three months’ usage. Int. J. Educ. Technol. High. Educ. 2021, 18, 8. [Google Scholar] [CrossRef]
  20. Bai, Y.-Q.; Jiang, J.-W. Meta-analysis of factors affecting the use of digital learning resources. Interact. Learn. Environ. 2024, 32, 522–533. [Google Scholar] [CrossRef]
  21. Lee, W. The Effect of Self-Efficacy and Service Quality on Ease of Use and Usefulness of an e-Learning System. J. Inf. Syst. 2003, 12, 41–56. [Google Scholar]
  22. Bufford, R.K. Social foundations of thought and action—A social cognitive theory—Bandura, A. J. Psychol. Theol. 1986, 14, 341–342. [Google Scholar]
  23. Eghterafi, W.; Tucker, M.C.; Zhang, I.; Son, J.Y. Effect of Feedback with Video-based Peer Modeling on Learning and Self-efficacy. Online Learn. 2022, 26, 1–5. [Google Scholar] [CrossRef]
  24. Han, J.; Geng, X.; Wang, Q. Sustainable Development of University EFL Learners’ Engagement, Satisfaction, and Self-Efficacy in Online Learning Environments: Chinese Experiences. Sustainability 2021, 13, 11655. [Google Scholar] [CrossRef]
  25. Kuo, T.M.; Tsai, C.-C.; Wang, J.-C. Linking web-based learning self-efficacy and learning engagement in MOOCs: The role of online academic hardiness. Internet High. Educ. 2021, 51, 100819. [Google Scholar] [CrossRef]
  26. Morales-Sanchez, V.; Hernandez-Martos, J.; Reigal, R.E.; Morillo-Baro, J.P.; Caballero-Cerban, M.; Hernandez-Mendo, A. Physical Self-Concept and Motor Self-Efficacy Are Related to Satisfaction/Enjoyment and Boredom in Physical Education Classes. Sustainability 2021, 13, 8829. [Google Scholar] [CrossRef]
  27. Wang, J.; Tigelaar, D.E.H.; Luo, J.; Admiraal, W. Teacher beliefs, classroom process quality, and student engagement in the smart classroom learning environment: A multilevel analysis. Comput. Educ. 2022, 183, 104501. [Google Scholar] [CrossRef]
  28. Wang, J.; Tigelaar, D.E.H.; Admiraal, W. Connecting rural schools to quality education: Rural teachers’ use of digital educational resources. Comput. Hum. Behav. 2019, 101, 68–76. [Google Scholar] [CrossRef]
  29. Reeve, J.; Tseng, C.-M. Agency as a fourth aspect of students’ engagement during learning activities. Contemp. Educ. Psychol. 2011, 36, 257–267. [Google Scholar] [CrossRef]
  30. Jang, H.; Kim, E.J.; Reeve, J. Longitudinal Test of Self-Determination Theory’s Motivation Mediation Model in a Naturally Occurring Classroom Context. J. Educ. Psychol. 2012, 104, 1175–1188. [Google Scholar] [CrossRef]
  31. Lee, M.-C. Explaining and predicting users’ continuance intention toward e-learning: An extension of the expectation-confirmation model. Comput. Educ. 2010, 54, 506–516. [Google Scholar] [CrossRef]
  32. Pintrich, P.R.; Degroot, E.V. Motivational and self-regulated learning components of classroom academic-performance. J. Educ. Psychol. 1990, 82, 33–40. [Google Scholar] [CrossRef]
  33. Liang, Y.S. Study on Achievement Goals, Attribution Styles and Academic Self-Efficacy of College Students. Master’s Thesis, Central China Normal University, Wuhan, China, 2000, unpublished. [Google Scholar]
  34. Yu, Q.; Ji, W.; Prihodko, L.; Ross, C.W.; Anchang, J.Y.; Hanan, N.P. Study becomes insight: Ecological learning from machine learning. Methods Ecol. Evol. 2021, 12, 2117–2128. [Google Scholar] [CrossRef] [PubMed]
  35. Chang, S.-C.; Chu, C.-L.; Chen, C.-K.; Chang, H.-N.; Wong, A.M.K.; Chen, Y.-P.; Pei, Y.-C. The comparison and interpretation of machine-learning models in post-stroke functional outcome prediction. Diagnostics 2021, 11, 1784. [Google Scholar] [CrossRef] [PubMed]
  36. Park, J.; Lee, W.H.; Kim, K.T.; Park, C.Y.; Lee, S.; Heo, T.-Y. Interpretation of ensemble learning to predict water quality using explainable artificial intelligence. Sci. Total Environ. 2022, 832, 155070. [Google Scholar] [CrossRef]
  37. Chen, H.; Lundberg, S.M.; Lee, S.-I. Explaining a series of models by propagating Shapley values. Nat. Commun. 2022, 13, 4512. [Google Scholar] [CrossRef]
  38. Yu, H.; Shi, G.; Li, J.; Yang, J. Analyzing the Differences of Interaction and Engagement in a Smart Classroom and a Traditional Classroom. Sustainability 2022, 14, 8184. [Google Scholar] [CrossRef]
  39. Wang, Y.; Cao, Y.; Gong, S.; Wang, Z.; Li, N.; Ai, L. Interaction and learning engagement in online learning: The mediating roles of online learning self-efficacy and academic emotions. Learn. Individ. Differ. 2022, 94, 102128. [Google Scholar] [CrossRef]
  40. Lu, G.; Xie, K.; Liu, Q. What influences student situational engagement in smart classrooms: Perception of the learning environment and students’ motivation. Br. J. Educ. Technol. 2022, 53, 1665–1687. [Google Scholar] [CrossRef]
  41. Cleary, P.F.; Pierce, G.; Trauth, E.M. Closing the digital divide: Understanding racial, ethnic, social class, gender and geographic disparities in Internet use among school age children in the United States. Univers. Access Inf. Soc. 2006, 4, 354–373. [Google Scholar] [CrossRef]
  42. Kalyanpur, M.; Kirmani, M.H. Diversity and technology: Classroom implications of the digital divide. J. Spec. Educ. Technol. 2005, 20, 9–18. [Google Scholar] [CrossRef]
  43. Ke, C.-H.; Sun, H.-M.; Yang, Y.-C. Effects of user and system characteristics on perceived usefulness and perceived ease of use for the web-based classroom response system. Turk. Online J. Educ. Technol. 2012, 11, 128–143. [Google Scholar]
  44. Zhang, T.; Zhao, J.; Shen, B. The influence of perceived teacher and peer support on student engagement in physical education of Chinese middle school students: Mediating role of academic self-efficacy and positive emotions. Curr. Psychol. 2024, 43, 10776–10785. [Google Scholar] [CrossRef]
  45. Hanham, J.; Lee, C.B.; Teo, T. The influence of technology acceptance, academic self-efficacy, and gender on academic achievement through online tutoring. Comput. Educ. 2021, 172, 104252. [Google Scholar] [CrossRef]
  46. Khan, M.J.; Reddy, L.K.V.; Khan, J.; Narapureddy, B.R.; Vaddamanu, S.K.; Alhamoudi, F.H.; Vyas, R.; Gurumurthy, V.; Altijani, A.A.G.; Chaturvedi, S. Challenges of E-Learning: Behavioral Intention of Academicians to Use E-Learning during COVID-19 Crisis. J. Pers. Med. 2023, 13, 555. [Google Scholar] [CrossRef]
  47. Abdullah, F.; Ward, R. Developing a General Extended Technology Acceptance Model for E-Learning (GETAMEL) by analysing commonly used external factors. Comput. Hum. Behav. 2016, 56, 238–256. [Google Scholar] [CrossRef]
  48. Banos, R.; Calleja-Nunez, J.J.; Espinoza-Gutierrez, R.; Granero-Gallegos, A. Mediation of academic self-efficacy between emotional intelligence and academic engagement in physical education undergraduate students. Front. Psychol. 2023, 14, 1178500. [Google Scholar] [CrossRef]
Figure 1. Hypothetical model.
Applsci 15 03884 g001
Figure 2. The ROC curves of nine machine learning models in predicting student engagement: (a) Random Forest, (b) Decision Tree, (c) Gradient Boosting Decision Tree, (d) AdaBoost, (e) Support Vector Machine, (f) Multilayer Perceptron, (g) Ridge Regression, (h) Voting Classifier, and (i) K-Nearest Neighbor. The diagonal line in the figure represents the baseline for random guessing. Along this line, the true positive rate (TPR) is equal to the false positive rate (FPR), indicating that the classifier possesses no discriminatory power to differentiate between positive and negative samples.
Applsci 15 03884 g002
Figure 3. Permutation feature importance of digital technology variables in the RF model. SS, Subject-specific software; MS, management software; WE, websites; MD, mobile devices; MM, multimedia materials. The red dots represent the mean importance values for each feature, and the blue error bars indicate the standard deviation/confidence interval computed over multiple runs or cross-validation.
Applsci 15 03884 g003
Figure 4. Partial dependence plots of digital technology variables on student engagement: (a) subject-specific software, (b) management software, (c) websites, (d) mobile devices. The upper blue boxplot illustrates the data distribution across various usage frequency intervals after logarithmic transformation, including the median, interquartile range, and extreme values, while the green bars indicate the corresponding sample size or frequency for each interval. The blue solid line in the lower section represents the trend of student classroom engagement as a function of usage frequency, derived from partial dependence analysis (PDP), with the blue shaded area denoting the associated confidence interval (or standard error).
Applsci 15 03884 g004aApplsci 15 03884 g004b
Figure 5. Contour plots depicting the interaction effects of digital technology tools on student engagement: (a) subject-specific software and management software, (b) subject-specific software and website, (c) subject-specific software and mobile devices, (d) management software and website, (e) management software and mobile devices, and (f) website and mobile devices.
Applsci 15 03884 g005
Figure 6. SHAP analysis of feature contributions to model output: (a) SHAP waterfall plot displaying individual feature contributions; (b) SHAP decision plot illustrating the impact of digital technology tools on model predictions.
Applsci 15 03884 g006
Table 1. Descriptive statistics for all variables (total n = 1158).
VariableOptionNumber%
GenderFemale44138.08
Male71761.92
Age≤18 years old373.20
18~25 years old111596.29
26~30 years old40.35
≥30 years old20.17
NationHan nationality104390.07
Minority1159.93
GradeFirst-year undergraduate65356.39
Second-year undergraduate40234.72
Third-year undergraduate917.86
Fourth-year undergraduate121.04
AddressEast China39333.94
South China18315.80
Central China32928.41
North China100.86
Northwest China10.09
Southwest China847.25
Northeast China15813.64
Note: East China: Shandong, Jiangsu, Anhui, Zhejiang, Fujian, Shanghai, and Jiangxi; South China: Guangdong, Guangxi, Hainan; Central China: Hubei, Hunan, and Henan; North China: Beijing, Tianjin, Hebei, Shanxi, and Inner Mongolia; Northwest China: Ningxia, Xinjiang, Qinghai, Shaanxi, and Gansu; Southwest China: Sichuan, Yunnan, Guizhou, Tibet, and Chongqing; Northeast China: Liaoning, Jilin, and Heilongjiang.
Table 2. Performance evaluation of machine learning models.
CharacteristicsRFDTGBDTABSVMMLPRRVCKNN
AUC0.800.750.790.790.740.780.710.720.75
Accuracy (%)0.800.770.790.790.790.780.630.650.78
Sensitivity/Recall0.600.590.550.560.560.560.610.610.52
Specificity0.940.900.970.960.960.940.640.680.96
FPR0.060.100.030.040.040.060.360.320.04
FNR0.400.410.450.440.440.440.390.390.48
PPV0.880.810.930.920.900.870.560.580.91
NPV0.760.750.750.750.750.750.690.710.73
F1 score0.720.680.690.700.690.680.580.600.66
Note: RF, Random Forest; DT, Decision Tree; GBDT, Gradient Boosting Decision Tree; AB, AdaBoost; SVM, Support Vector Machine; MLP, Multilayer Perceptron; RR, Ridge Regression; VC, Voting Classifier; KNN, K-Nearest Neighbor; AUC, area under the receiver operator curve; FPR, false positive rate; FNR, false negative rate; PPV, positive predictive value; NPV, negative predictive value.
Table 3. Descriptive statistics and correlation coefficients of variables (total n = 1158).
MeanSD12345
1. Digital technology29.82710.707
2. Classroom participation41.5867.1390.519 ***
3. Perceived usefulness12.4342.2200.506 ***0.774 ***
4. Perceived ease of use12.4762.1860.487 ***0.752 ***0.874 ***
5. Academic self-efficacy83.86712.4000.478 ***0.628 ***0.566 ***0.572 ***
Note: *** p < 0.001.
Table 4. Fit indices for structural equation modeling.
Indexχ2/dfGFIAGFICFITLIRMSEANFIIFIRFI
Model 15.7540.9720.9500.9470.9240.0640.9370.9470.909
Model 25.4360.9740.9530.9490.9260.0620.9380.9490.911
Ideal value<3.0>0.9>0.8>0.9>0.9<0.08>0.9>0.9>0.9
Table 5. Path coefficients analysis.
PathBS.E.C.R.βp
Model 1Digital Technology → Classroom Participation0.0720.0145.2790.1080.000
Digital Technology → Perceived Usefulness0.1050.00519.9310.5060.000
Perceived Usefulness → Classroom Participation1.8410.07026.1870.5720.000
Digital Technology → Academic Self-efficacy0.2980.0319.5240.2580.000
Academic Self-efficacy → Classroom Participation0.1480.01211.9470.2560.000
Perceived Usefulness → Academic Self-efficacy2.4360.15116.1200.4360.000
Model 2Digital Technology → Classroom Participation0.0900.0146.4780.1350.000
Digital Technology → Perceived Ease of Use0.0990.00518.9740.4870.000
Perceived Ease of Use → Classroom Participation1.7550.07323.9710.5350.000
Digital Technology → Academic Self-efficacy0.3030.0319.8520.2610.000
Academic Self-efficacy → Classroom Participation0.1520.01311.8500.2630.000
Perceived Ease of Use → Academic Self-efficacy2.5240.15016.7760.4450.000
Note: SE = Standard Error, CR = Critical Ratio.
Disclaimer/Publisher’s Note: The statements, opinions and data contained in all publications are solely those of the individual author(s) and contributor(s) and not of MDPI and/or the editor(s). MDPI and/or the editor(s) disclaim responsibility for any injury to people or property resulting from any ideas, methods, instructions or products referred to in the content.

