Article

A Transfer Learning Remote Sensing Landslide Image Segmentation Method Based on Nonlinear Modeling and Large Kernel Attention

1
School of Environment and Resources, Southwest University of Science and Technology, Mianyang 621010, China
2
School of Information and Control Engineering, Southwest University of Science and Technology, Mianyang 621010, China
*
Author to whom correspondence should be addressed.
Appl. Sci. 2025, 15(7), 3855; https://doi.org/10.3390/app15073855
Submission received: 27 February 2025 / Revised: 25 March 2025 / Accepted: 28 March 2025 / Published: 1 April 2025
(This article belongs to the Special Issue Deep Learning for Image Recognition and Processing)

Abstract

:
Image segmentation plays a key role in remote sensing, particularly in landslide image segmentation. Remote sensing of landslide images is challenging due to their single category but complex detailed features, making it difficult to determine landslide boundaries and extents. Traditional segmentation methods often yield poor results for such images. To address these challenges, we propose the Large Kernel Nested UKAN (LKN-UKAN). The key contributions and findings are as follows. (1) We embed a Tokenized KAN Block (Tok-KAN) in U-Net++ to enhance complex feature modeling, leveraging Tok-KAN’s strengths in nonlinear modeling and relationship capture. (2) We design a Dual Large Fusion Selective Kernel Attention (DLFFSKA) module to improve global perception and contextual information capture. (3) We apply transfer learning to transfer feature-rich remote sensing image features to landslide data, significantly improving segmentation performance. The experimental results demonstrate that the LKN-UKAN achieved significant improvements in remote sensing landslide image segmentation compared with state-of-the-art methods, particularly in terms of boundary accuracy and feature representation.

1. Introduction

Landslides are a common geological hazard with a significant impact on human life. Recent studies have shown that climate change exacerbates the frequency and severity of landslides. Drought-induced soil desiccation and structural weakening [1], coupled with slope destabilization from flood-induced saturation [2], collectively increase the likelihood of landslides. It is estimated that landslides cause billions of dollars in economic losses worldwide each year [3]. An irregular shape for a landslide area poses a considerable challenge to subsequent rescue and investigation efforts. Therefore, accurate identification of a landslide area is essential for effective rescue, mitigation, and exploration.
In the field of landslide exploration, remote sensing images have long been employed for the monitoring and analysis of geological hazards due to their extensive coverage, all-weather operability, and high resolution [4,5]. This is particularly the case in the context of landslide detection [6,7]. However, it should be noted that there are numerous types of remote sensing imagery, and the relative advantages of different types in landslide detection vary. While visible light is relatively inexpensive, it is not possible to continuously monitor landslide displacements, and long-term dynamic analyses are difficult to perform. Near-infrared and thermal infrared data are capable of accurately capturing environmental information [8]. However, the resolution is typically low, which impairs the observation of landslide details. Synthetic-aperture radar (SAR) [9] and laser radar (LiDAR) are not susceptible to the effects of weather and light [10,11], yet they require processing through interferometric and polarimetric analyses prior to further analysis. The aforementioned disparate types of remote sensing imagery can all play a role in landslide exploration, providing a reliable basis for real-time monitoring and risk assessment. The objective of this research is to address the issue of landslide image segmentation in the aftermath of disasters. This entails accurately delineating the landslide area and precisely determining the extent of landslide occurrence. Among the various imaging means, the visible light image has significant potential for landslide image segmentation due to its intuitive visualization, low acquisition cost, and other characteristics. Accordingly, this paper selects the visible-light image as the primary subject of investigation, upon which the associated landslide detection and analysis procedures are conducted [12]. Nevertheless, the intricate nature of landslide morphology, the multi-scale distribution of features, and the interference of background features such as rivers, vegetation, and bare soil render the precise delineation of landslide areas a persistently challenging undertaking [13,14].
It is indubitable that traditional image processing methods have always played an important role in the processing of visible light images. Such methods include threshold segmentation [15,16], edge detection [17,18], and region-growing algorithms [19,20]. These methods are characterized by their simplicity and straightforwardness, as well as their lack of requirement for high computer performance. As a result, they have been the dominant approach in landslide segmentation for an extended period of time. Threshold segmentation is a method that effectively delineates the landslide region from the background by establishing thresholds for intensity or color, particularly in well-lit and high-contrast scenes. However, in complex environments with significant illumination variations or noise, since threshold segmentation is entirely based on pixel gray values, the segmentation effect is unstable when the gray contrast between the landslide region and the background is low or the illumination is uneven [21]. Similarly, edge detection delineates landslide boundaries by recognizing sudden changes in image intensity. However, the presence of noisy pixels in a landslide image usually has a high local gradient, which can lead to erroneous detection of landslide edges [22]. Region-growing methods expand the region from selected seed points, and the segmentation effect can be flexibly adjusted by modifying the growth rule or the similarity threshold. However, as the image resolution and the size of a landslide region increase, the growth process requires the analysis of a greater number of pixels, which reduces computational efficiency [23,24].
In order to overcome the limitations inherent to traditional image processing techniques, machine learning-based algorithms have been progressively implemented in the context of landslide image detection. In the initial stages of research, traditional machine learning algorithms were employed. Among these, support vector machines (SVMs) reduce the sensitivity to noisy data by maximizing the bounding interval [25], and random forests reduce the overfitting of a single decision tree to noise by integrating multiple decision trees [26] and also utilize manually extracted features such as the texture, shape, and spectral features for classification [27,28]. However, they all rely heavily on feature engineering, which limits their ability to capture complex, high-dimensional feature distributions and their effectiveness in multi-scale feature scenarios.
In recent years, the rapid development of deep learning technology has demonstrated considerable potential in the detection of landslide images, establishing itself as a pivotal solution to the challenge of landslide image segmentation [29]. Convolutional neural networks (CNNs) are capable of unparalleled feature extraction and pattern recognition, and they are adept at dealing with complex backgrounds and multi-scale feature distributions [30]. Architectures such as U-Net [31] and U-Net++ [32] have demonstrated considerable success in medical [33] and remote sensing image segmentation [34] and also shown great potential in landslide detection [35,36]. Nevertheless, the identification of minor landslide formations remains a significant challenge due to their irregular morphologies and the paucity of available marker data. To address these limitations, researchers have proposed the integration of multi-scale feature fusion and context-aware network architectures [37]. Models such as PSPNet [38] and DeepLab v3+ [39] have further enhanced segmentation accuracy through the incorporation of attention mechanisms [40] and multi-scale learning strategies [41]. Additionally, migration learning has been employed to mitigate the constraints of small datasets by leveraging pretrained models, thereby markedly improving generalization performance [42,43].
Despite these advances, several critical challenges persist. Current models often underperform when segmenting small, fragmented landslide regions with ambiguous or complex boundaries. Furthermore, the limited scale of available landslide datasets makes deep learning models susceptible to overfitting, compromising generalizability. To address these challenges, the introduction of Kolmogorov–Arnold networks (KANs) offers a promising avenue for landslide segmentation, leveraging their capacity for modeling complex nonlinear features [44,45]. Concurrently, deep learning models incorporating multi-scale attention mechanisms [46] and those leveraging transfer learning techniques [47] have demonstrated outstanding performance in remote sensing image processing.
To tackle the challenges in landslide image segmentation, this study introduces a novel model, the Large Kernel Nested UKAN (LKN-UKAN), which is built upon an enhanced U-Net++ architecture and further refined with transfer learning techniques. The model incorporates several key innovations to boost segmentation accuracy, boundary clarity, and adaptability, particularly in data-scarce environments. First, we integrate the Tokenized KAN Block (Tok-KAN) convolutional module into the deeper layers of the network backbone, leveraging its nonlinear learning capabilities to embed structured knowledge and thus improve both robustness and precision. Additionally, we introduce the Dual Large Fusion Selective Kernel Attention (DLFFSKA) mechanism before the convolutional jumps, enabling dynamic adjustments of the receptive field to more effectively capture the intricate details of a landslide’s morphology. Furthermore, we employ a fine-tuning transfer learning (FTTL) strategy to transfer knowledge from remote sensing image segmentation tasks to landslide image segmentation, significantly enhancing the model’s adaptability.
Through a series of experiments and result analysis, we demonstrate that the LKN-UKAN with the FTTL strategy excels in the landslide image segmentation task, outperforming existing mainstream deep learning methods in terms of boundary delineation, segmentation accuracy, and small-sample adaptability. The proposed approach offers a novel solution for landslide remote sensing monitoring and identification, with substantial practical application potential.

2. Materials and Methods

Most existing landslide datasets are taken from a high altitude, and the edges of the landslide area in the image are blurred and disturbed by noise. After the network extracts features at multiple levels, it is easy to lose the details of a landslide’s features. To address this problem, this paper uses U-Net++ as the baseline network and makes improvements on and optimizations to it. Some of the sampling methods in the network are redesigned, and the feature extraction method is enhanced to combine multi-scale feature prediction, further enriching the feature expression of the landslide area.
Figure 1 shows the overall architecture design of the proposed LKN-UKAN. The first three layers ( L 1 , L 2 , and L 3 ) of the network use standard Conv2d for feature extraction, while the fourth and fifth layers ( L 4 and L 5 , respectively) introduce Tok-KAN convolutions to enhance the modeling of nonlinear features. In the backbone network, each convolutional block X i , 0 is processed through the DLFFSKA module prior to its skip connection to subsequent layers, strengthening the network’s ability to perceive and represent landslide-specific features. In addition, max pooling is employed for pooling operations, whereas bilinear ipsampling is used to ensure smooth and effective resolution recovery during upsampling.
The architecture follows a progressive relationship between resolution and depth; for every pooling operation, the feature resolution is halved, and for every upsampling operation, the resolution is doubled. The network depth increases from L 1 to L 5 , with the L 1 , L 2 , and L 3 layers utilizing standard Conv2d blocks to extract basic features and L 4 and L 5 layers introducing Tok-KAN convolutions to better capture complex features. At the same time, in order to further enhance the network’s ability to perceive the spatiotemporal information of landslide images, a learnable time embedding is added between the convolutional blocks in the L 4 and L 5 layers. This design can capture the dynamic characteristics of landslide scenes, thereby significantly enhancing the expressiveness and robustness of the network.

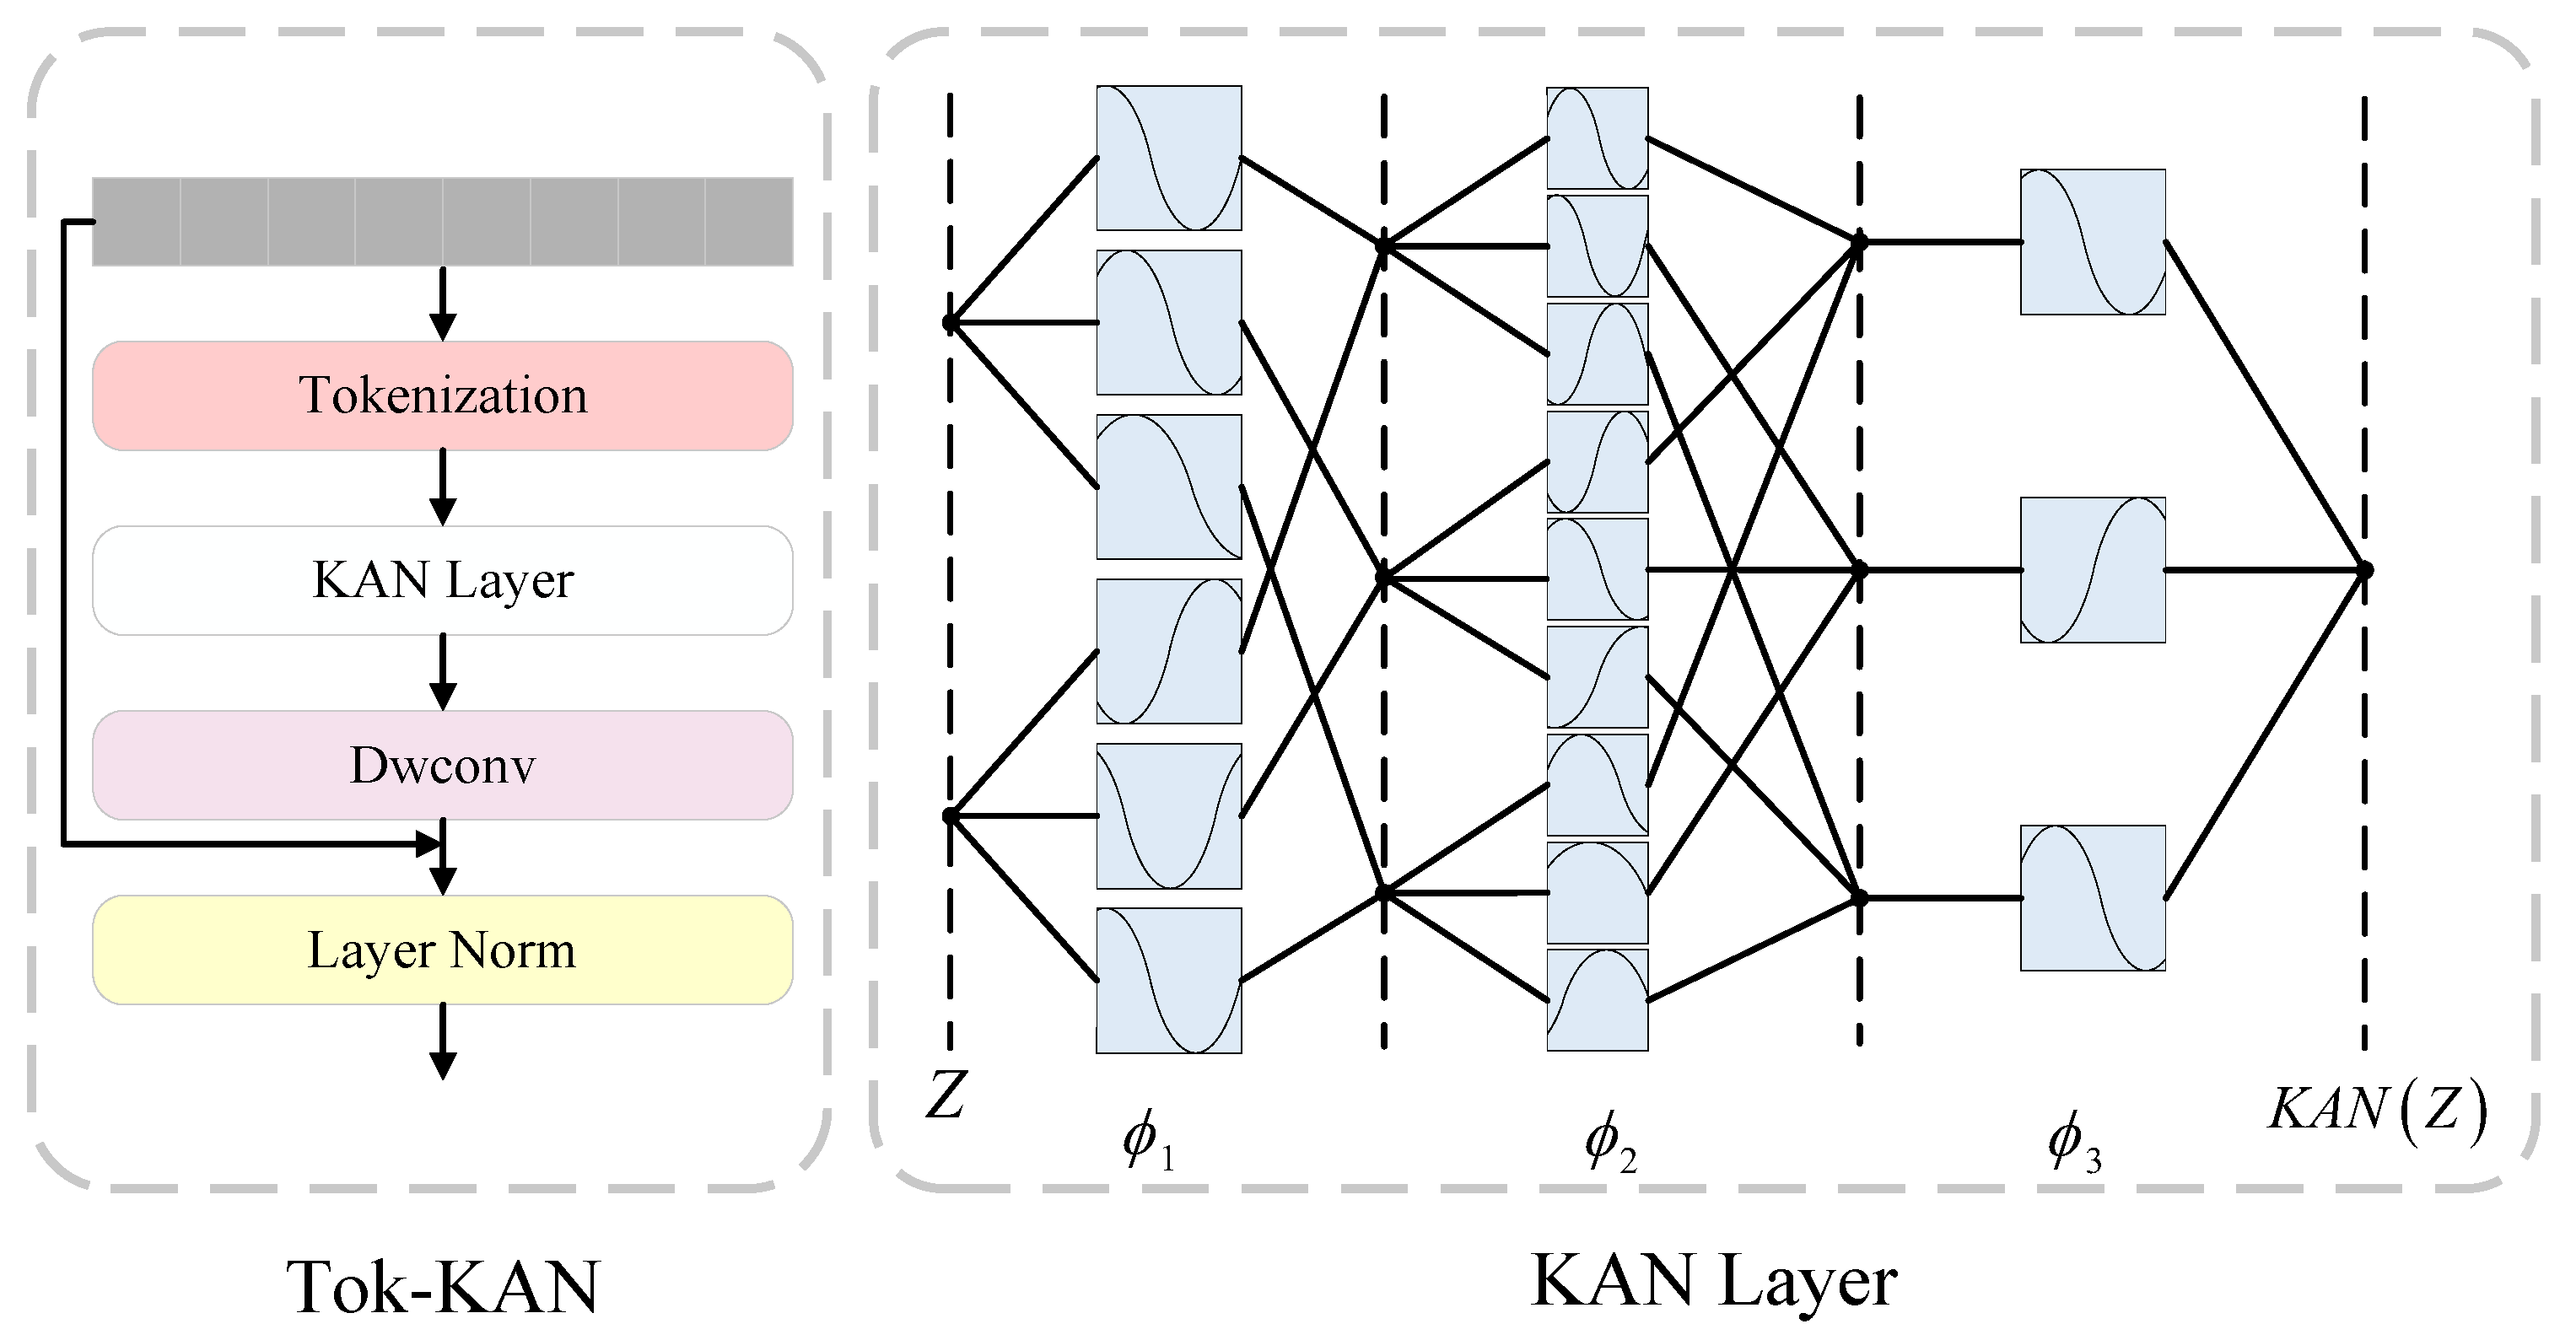
2.1. Tokenized KAN Block (Tok-KAN)

The characteristics of landslide images are typically intricate and nonlinear, rendering traditional linear networks inadequate for capturing and processing their nonlinear features. This hinders the effective extraction of complex image details and patterns. The objective of this section is to introduce the Kolmogorov–Arnold network (KAN) into the U-Net++ framework, with the aim of enhancing the model’s ability to learn and represent landslide image features. The multilayer perceptron (MLP), inherited from the KAN, is capable of modeling complex nonlinear relationships through a sequence of multi-level nonlinear transformations, thereby enabling it to deal with complex input data. Nevertheless, despite the MLP’s exemplary performance in multilayer nonlinear transformations, the decision-making process is not readily comprehensible due to its dependence on a multitude of parameters when processing data, in addition to its status as a deep neural network. Consequently, there are still some limitations in terms of parameter efficiency and interpretability. To overcome these shortcomings, the KAN is designed with a more efficient structure based on the Kolmogorov–Arnold representation theorem, which enables the network to improve its interpretability while maintaining its efficiency, thus capturing complex image features more effectively. This innovation opens up new possibilities for improving performance in landslide image segmentation tasks.
Based on the efficiency and interpretability of the KAN, the U-KAN has been proposed as a novel network architecture, demonstrating remarkable performance in medical image processing tasks [45]. However, the relatively simple structure of the U-KAN is still insufficient to capture subtle differences in a landslide area. To compensate for this shortcoming, we introduce the Tok-KAN and incorporate it into the U-Net++ framework. The Tok-KAN further enhances the learning ability of landslide image features by effectively extending the KAN based on the nested skip connection and multi-scale feature fusion mechanism of U-Net++. This design enables the model to integrate information and capture details at a deeper level, thereby significantly improving the overall performance of the landslide image segmentation task. Figure 2 shows the overall structure of the Tok-KAN.
Firstly, the tokenization process is a crucial step in the tokenized KAN (Tok-KAN) module [48]. By performing tokenization, the output features of the convolutional phrase X L are reshaped into a flattened sequence of 2D patches X L i P 2 · C L | i = 1 , 2 , N , where each patch has a size of P × P and N = H L × W L / P 2 represents the additional feature augmentation. To achieve this transformation, we employ a trainable linear projection E R P 2 C L × D through a convolution layer with a kernel size of three, mapping the vectorized patches into a latent D-dimensional embedding space as described by Equation (1):
Z 0 = X L 1 E ; X L 2 E ; X L 3 E ; ; X L N E
Seccondly, the tokenized features are processed by the KAN layer, which further handles the tokenized input sequence. Similar to an MLP, a KAN with k layers can be described as a nested sequence of multiple KAN layers as shown in Equation (2). It uses learnable edge activation functions and parameterized activation functions as weights, eliminating the need for a linear weight matrix:
KAN ( Z ) = Φ K 1 Φ K 2 Φ 1 Φ 0 Z ,
where Φ i denotes the ith mapping function, K represents the total number of layers, and the input Z is iteratively transformed through each mapping function Φ i from i = 0 to i = K 1 . The output of each layer serves as the input for the next one, with the symbol ∘ representing the composition of functions, indicating that the functions Φ i are applied sequentially, starting from Φ 0 and ending with Φ K 1 . This multilayer composition enables the network to progressively capture and model complex, nonlinear relationships in the data. Each layer of the KAN consists of an input dimension n in , an output dimension n out , and a learnable activation function ϕ as shown in Equation (3):
Φ = ϕ q , p , p = 1 , 2 , 3 , , n i n , q = 1 , 2 , 3 , , n o u t
The computations from layer k to layer k + 1 in the KAN can be expressed in matrix form as Z k + 1 = Φ k Z k , where
Φ k = ϕ k , 1 , 1 · ϕ k , 1 , 2 · ϕ k , 1 , 3 · ϕ k , 1 , n k · ϕ k , 2 , 1 · ϕ k , 2 , 2 · ϕ k , 2 , 3 · ϕ k , 2 , n k · ϕ k , 3 , 1 · ϕ k , 3 , 2 · ϕ k , 3 , 3 · ϕ k , 3 , n k ·   ϕ k , n k + 1 , 1 · ϕ k , n k + 1 , 2 · ϕ k , n k + 1 , 3 · ϕ k , n k + 1 , n k ·
Finally, after processing at each KAN layer, the features are further optimized by an efficient deep convolutional layer (DwConv) [49] and batch normalization (BN) and ReLU activation functions. To enhance training stability and the network’s representational power, residual connections are introduced in the KAN layers. Specifically, the original tokenized sequence is added as a residual to the output of the current layer, followed by layer normalization (LN) [50] for feature standardization. Formally, the output of the kth tokenized KAN module can be expressed as follows:
Z k = L N Z k 1 + DwConv KAN Z k 1 ,
where Z k R H k × W k × D k is the output feature map of the kth layer.

2.2. Dual Large Feature Fusion Selective Kernel Attention (DLFFSKA)

In landslide images, the size and shape of the landslide area are usually uncertain, and there is interference from irrelevant backgrounds, resulting in inaccurate capture of the location of the landslide area by the model and an insufficient ability to represent the contour of the landslide.
Therefore, we designed a DLFFSKA module based on a large selective kernel (LSK) [51]. This module constructs two feature fusion convolutions by fusing three large kernel convolutions of different sizes so that the model has a wider and adaptive contextual understanding ability, which significantly enhances the ability to distinguish between the background and the target. The network structure is shown in Figure 3.
The DLFFSKA module utilizes depthwise convolutions with dilated properties to build a model with a broader receptive field. In this model, the input features X, after passing through different convolutional kernels, can produce diverse feature representations with varying receptive fields. Let the ith depthwise convolution kernel be k with a dilation rate d and the receptive field of the output feature map be R F . The relationship among these three factors is described by Equation (6):
R F 1 = k 1 , R F i = d i ( k i 1 ) + R F i 1 k i 1 k i , d 1 = 1 , d i 1 < d i 1 R F i 1
By increasing the kernel size and dilation rate, the rapid expansion of the receptive field is ensured. Compared with a larger convolutional kernel, the same receptive field is obtained by a series of convolutional decompositions, but fewer parameters are used to obtain contextual information of different ranges. Subsequently, based on this multi-scale feature information, a spatial selection mechanism is used to dynamically adjust the weights at different depths.
The original LSK only used two parallel large kernel convolutions. Although the ability to capture large-scale features was enhanced, the landslide image also contains a large number of small-scale features. Therefore, the DLFFSKA model first uses a convolution with a kernel size of five (K = 5) and then applies convolutions with kernel sizes of seven (K = 7) and nine (K = 9) on this basis to further enhance the model’s focus on spatially critical background information about the target. By using a spatial selection mechanism, the model can effectively spatially select feature maps with different receptive fields. The selection of these kernel sizes is based on both theoretical and empirical considerations. Theoretically, increasing the kernel size expands the receptive field, enabling the model to capture more contextual information. However, excessively large kernels may dilute local feature details critical for delineating landslide boundaries. A balance must be struck between capturing global dependencies and preserving fine-grained spatial details. The chosen values (five, seven, and nine) ensure a hierarchical feature extraction process that enhances both large-scale structural awareness and small-scale contour accuracy.
Firstly, a large kernel convolution operation is applied to the input X to obtain U i i = 1 , 2 , 3 , as shown in Equation (7):
U 1 = C o n v 2 d ( X , K = 5 ) U 2 = C o n v 2 d ( U 1 , K = 7 ) U 3 = C o n v 2 d ( U 1 , K = 9 )
Secondly, a convolution with a kernel size of one is applied to U i , obtaining the feature representation U i i = 1 , 2 , 3 from different large kernel convolutions as shown in Equation (8):
U i = C o n v 2 d ( U i , K = 1 ) , i = 1 , 2 , 3
Thirdly, the features from different large kernel convolutions are fused, and the feature fusion result C 1 , C 2 is represented as shown in Equation (9):
C 1 = C o n c a t U 2 , U 1 C 2 = C o n c a t U 3 , U 1
Fourthly, to capture feature information more comprehensively, maximum pooling ( P M a x ) and average pooling ( P A v g ) are applied to C 1 , C 2 , facilitating better interaction between the different types of information. The pooling results are concatenated and their dimensions transformed, yielding the spatial feature map S A i as shown in Equation (10):
S A i = C o n v 2 d [ C o n c a t ( P M a x ( C i ) , P A v g ( C i ) ) ] ; i = 1 , 2
Finally, a sigmoid ( σ ) activation function is applied to S A i to obtain the selection weights for different spatial depths. Then, the features from different receptive fields are weighted and fused spatially to produce the final output as shown in Equation (11):
O u t = X × A d d ( σ ( S A 1 ) · α + σ ( S A 2 ) · β ) × U 1 σ ( S A 1 ) × U 2 σ ( S A 2 ) × U 3 , α = 0.5 , β = 0.5

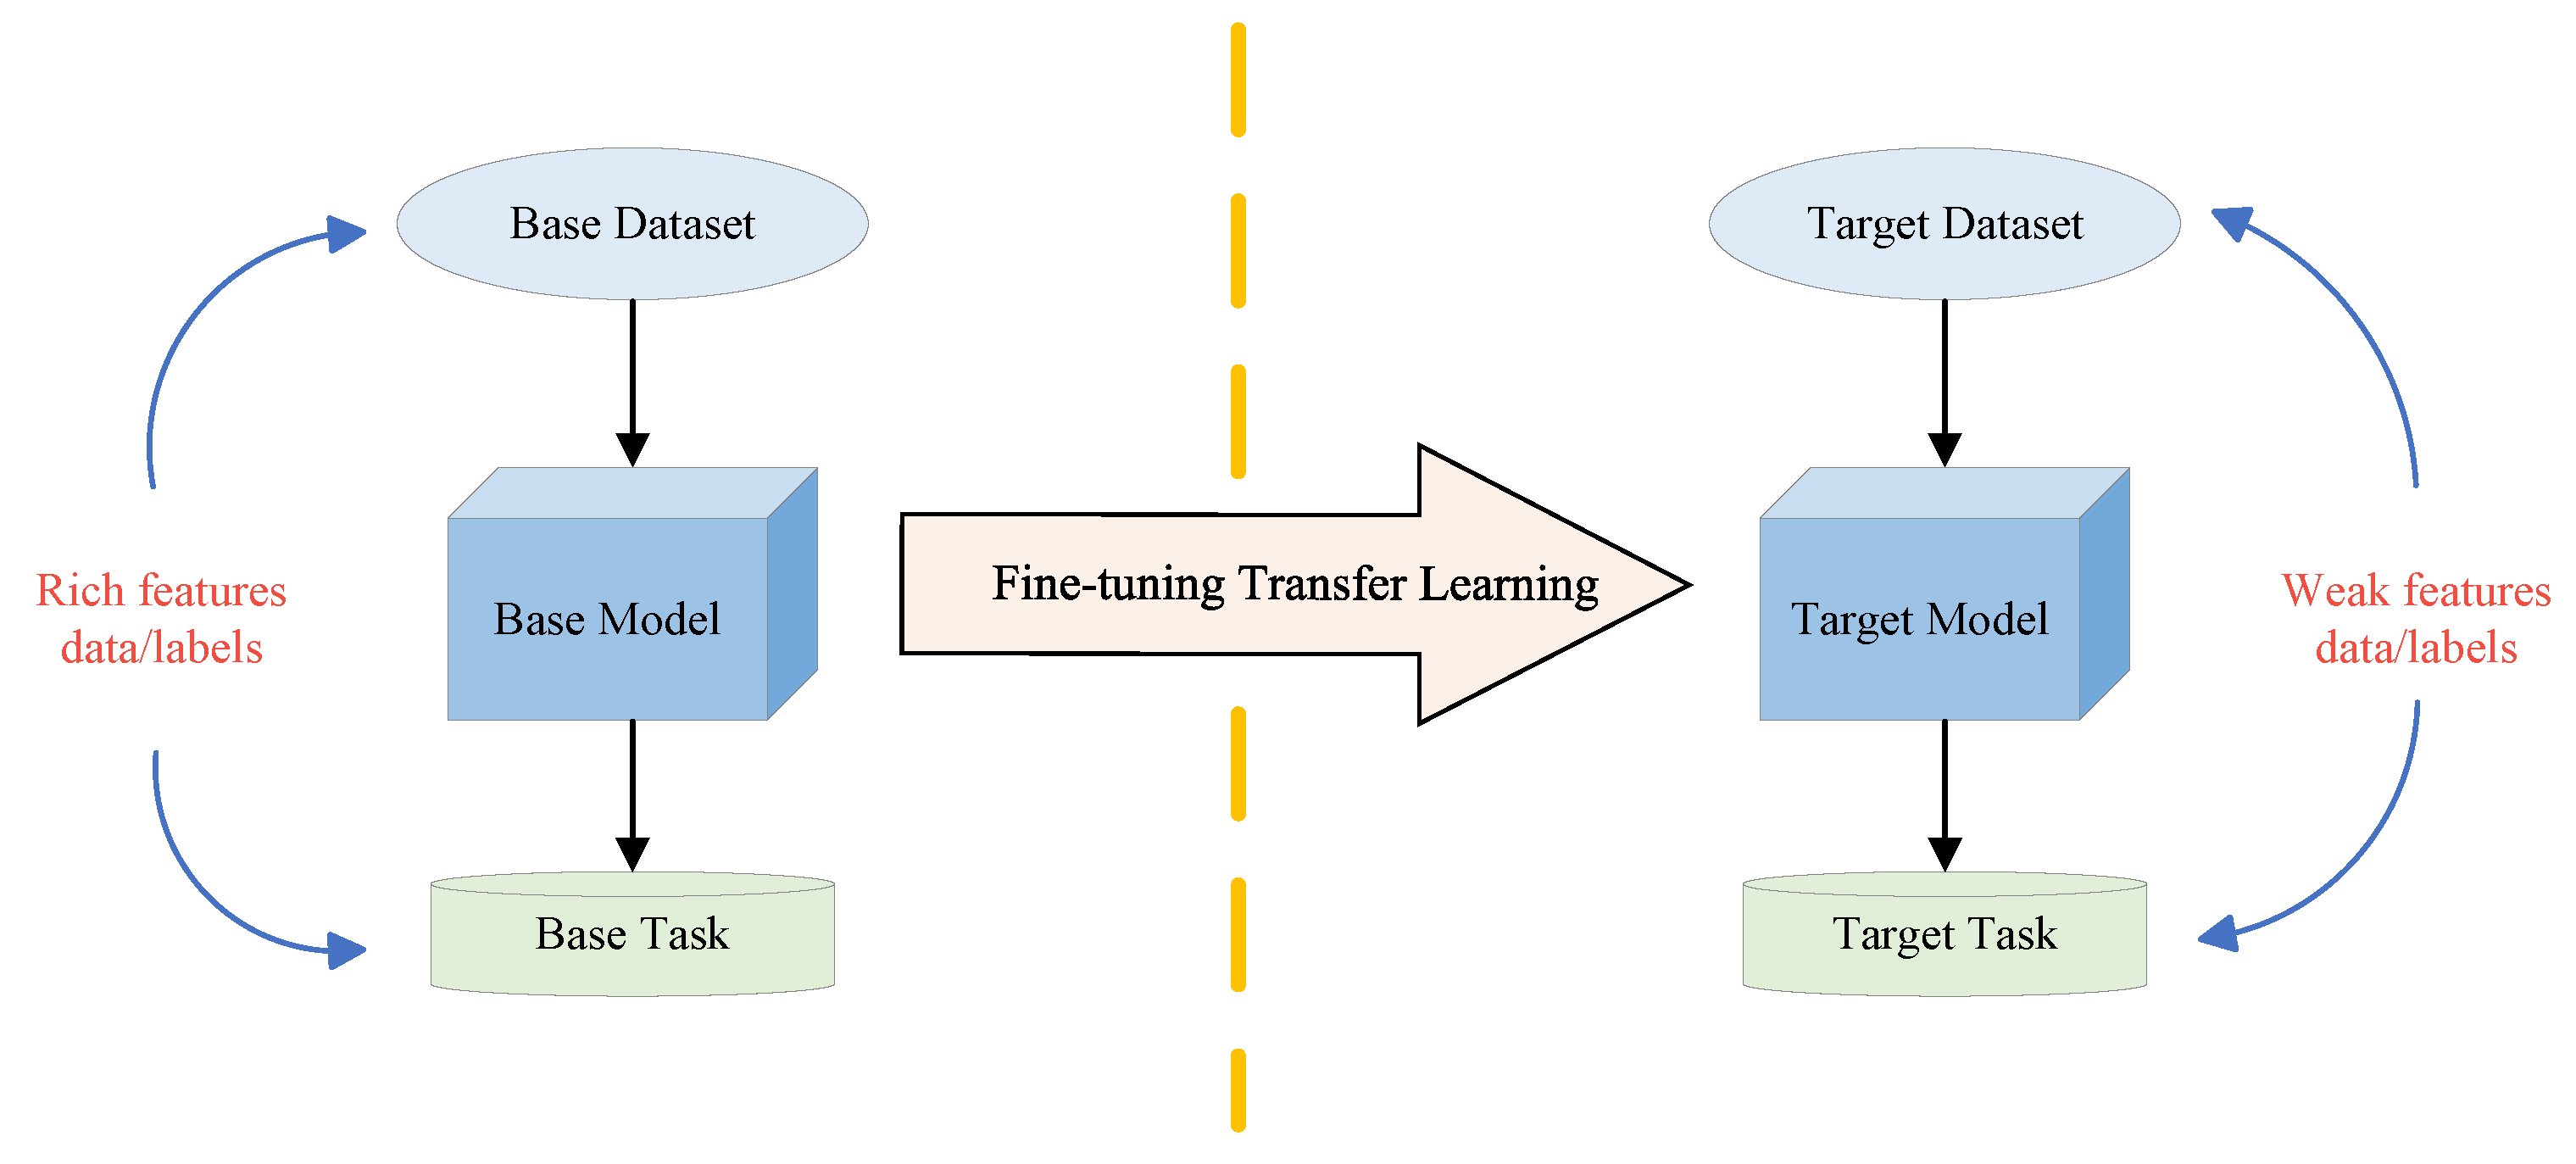
2.3. Fine-Tuning Transfer Learning (FTTL)
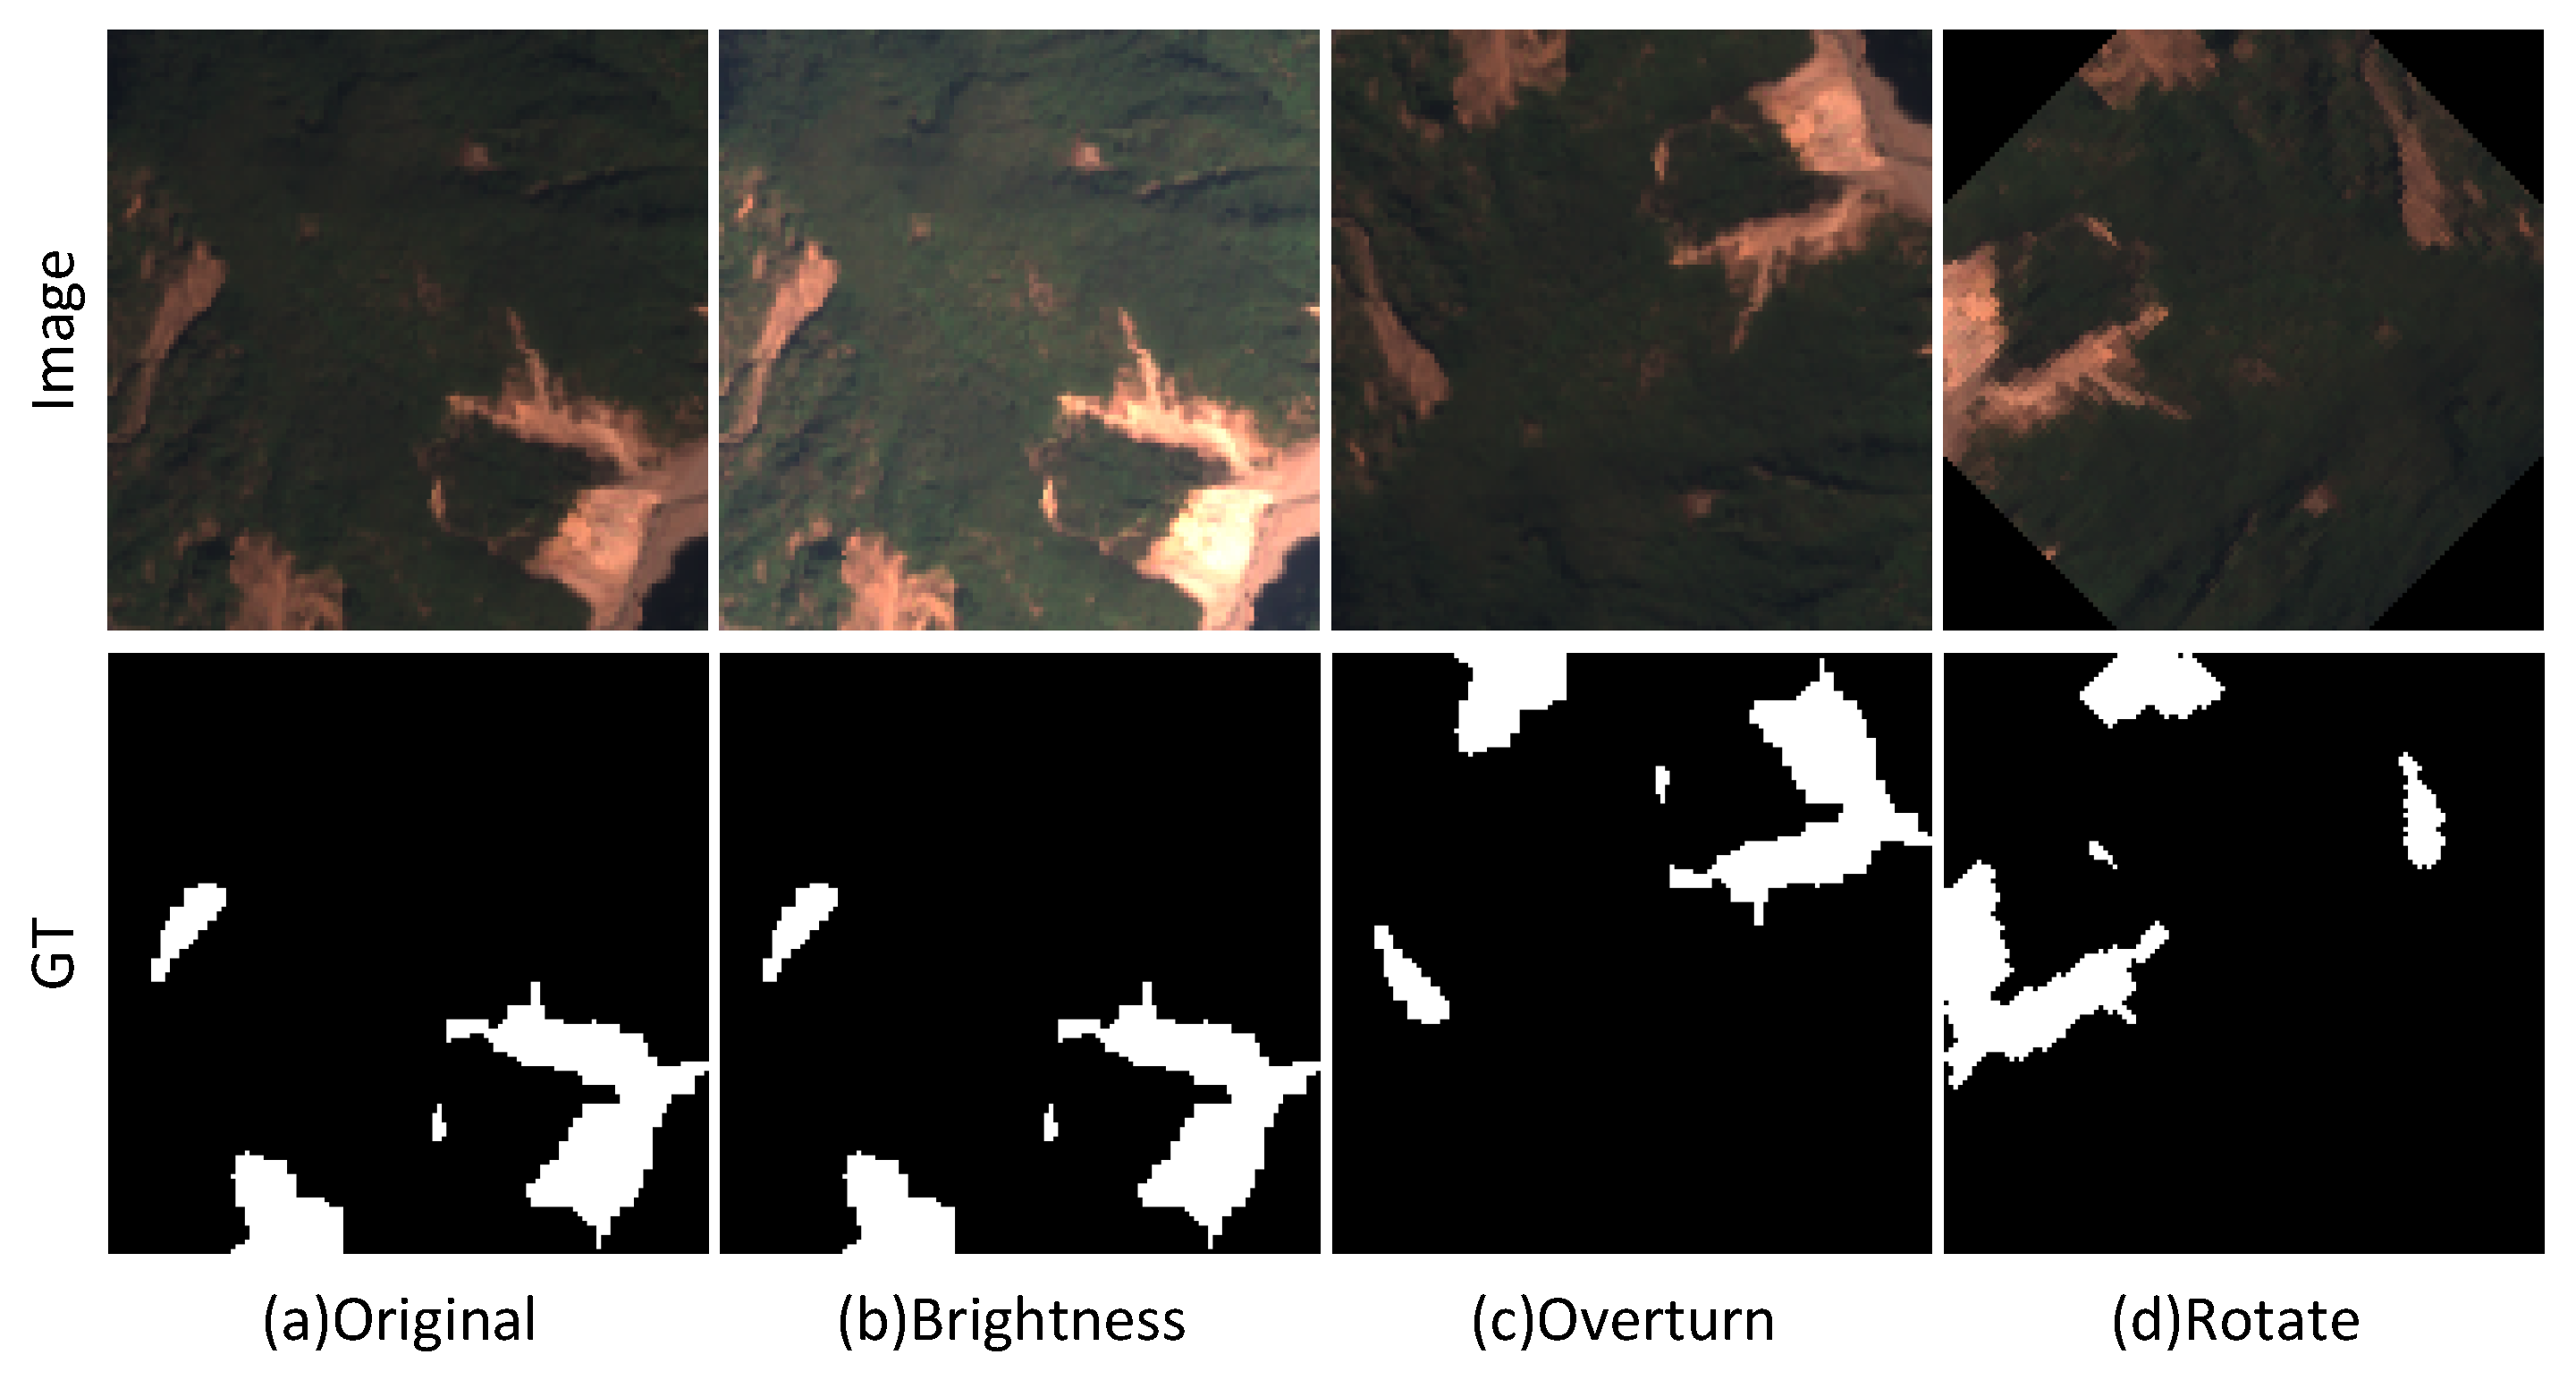
With the introduction of the Tok-KAN and DLFFSKA modules, the model not only possesses strong nonlinear learning capabilities but also excels in contextual understanding, enabling it to more accurately capture the complex features of landslide regions. However, due to the scarcity of publicly available landslide image datasets, even though the network exhibits superior performance, the insufficient training data may still result in slow model convergence, limited generalization, and low segmentation accuracy.
Therefore, we introduce FTTL technology [52], which aims to make full use of existing knowledge by adjusting the weights of the base model to adapt to the data characteristics of the target task. Suppose that the parameters of the base model are θ pre , which have been pretrained on a large-scale dataset and contain learned general features. The model parameters for the target task are θ target , and we expect to fine-tune these parameters to make them more suitable for the characteristics of landslide images. Specifically, the loss function of the fine-tuning process is shown in Equation (12):
L target = E ( x , y ) D target ( f θ target ( x ) , y )
In fine-tuning, L t a r g e t denotes the target landslide image dataset, E ( x , y ) D target denotes the expectation of the sample x , y of the target dataset, and is the loss function used to compare the predicted and true values, while f θ target is the output of the target task model.
To apply FTTL to the landslide image segmentation task, we can freeze certain layers [53] of the base model to preserve the generality of the low-level features. The frozen layers’ parameters θ freeze belong to the parameters of the base model θ pre , and during training, these parameters remain fixed.
By freezing the low-level features, we allow the high-level features to adjust according to the characteristics of the landslide images. This strategy ensures that the frozen low-level features capture general image features, such as edges and textures, while the high-level features are optimized to detect specific landslide characteristics, such as the shape and topographical features. This approach not only significantly enhances the model’s ability to adapt to landslide features but also improves the model’s understanding of the shape, texture, and contextual relationships within the landslide regions.
In this paper, the base model is first pretrained on a large-scale dataset to learn general features. Next, only the target landslide dataset is trained by freezing the shallow network of the base model to obtain high-level features that are closely related to the task. The training process for the target task can be seen in Equation (13):
θ target t + 1 = θ target t η θ unfreeze L target
where θ unfreeze represents the high-level feature parameters that have not been frozen, η is the learning rate, and θ unfreeze L target is the gradient of the target task loss function with respect to the unfrozen parameters. Finally, a model suitable for the landslide segmentation task is constructed based on the fine-tuned target model. The principle and process of FTTL are shown in Figure 4.

2.4. Dataset

2.4.1. Base Model Dataset

Our base model was initially trained on the public dataset DLRSD [54,55], which consists of images with a resolution of 256 × 256 across 21 categories, each containing 100 images, and a total of 17 segmentation labels. To better adapt the model for learning landslide features, we extracted two categories of images from DLRSD that were similar to landslide features—bare soil and sand—and merged these two categories into a new category: soil. The final dataset was called DLRSD-SOIL and contained 2063 images.
To further improve the generalization ability of the base model, we used data augmentation techniques. By using the PIL library in Python to perform brightness (b), rotation (c), and flip (d) operations on the original image (a) in Figure 5 and Figure 6, we obtained the base model dataset for this paper: DLRSD-Expand.
The brightness adjustment (b) in Figure 5 and Figure 6 modifies pixel intensity values without altering the spatial structure or content of the image. Consequently, the mask images for (a) and (b) remain identical, as brightness changes do not affect the ground truth labels. This is a standard practice in data augmentation to enhance dataset diversity while preserving annotation integrity.
The specific parameters for brightness (b), rotation (c), and flip (d) adjustments and data augmentation using the PIL library are shown in Table 1.
The DLRSD-Expand dataset was enlarged by a factor of four, increasing the total number of images to 8252. The expanded dataset was then randomly divided into a training set and a testing set at an 8:2 ratio, resulting in a training dataset comprising 6602 images and a testing dataset with 1650 images. The visual examples of the augmented original images (Image) and their corresponding ground truth annotations (Ground Truth (GT)) are shown in Figure 5.

2.4.2. Target Model Dataset

For the selection of the dataset of the target model, we chose Landslide4SenseSimple [56], a simplified version of the open competition dataset Landslide4Sense, as the training dataset. The original Landslide4Sense dataset contains a large number of unlabeled images, and some of the images are of poor quality and have readability issues. To improve the effectiveness of the dataset and the efficiency of training, Landslide4SenseSimple removes all unlabeled images and ensures that only meaningful annotation masks are retained in the dataset, thereby optimizing the model training effect. The dataset contains a total of 1980 landslide images with a resolution of 128 × 128.
To prevent overfitting and further improve the generalization ability, as well as enhance the model’s robustness in practical applications, we employed the same data augmentation techniques as that used for the base model’s dataset. To maintain consistency, the resolution of the training dataset was adjusted to 256 × 256, and the same augmentation parameters were applied. This process resulted in the creation of the target model’s dataset, termed Landslide-Expand.
The Landslide-Expand dataset was enlarged by a factor of four, bringing the total number of images to 7920. The expanded dataset was then randomly split into a training set and a testing set at an 8:2 ratio, yielding a training dataset of 6336 images and a testing dataset of 1584 images. Visual examples of the augmented original images (Image) and their corresponding ground truth annotations (Ground Truth, GT) are shown in Figure 6.

2.5. Model Performance Evaluation Indicators

To evaluate the performance of the proposed model, we adopted the intersection over union (IoU), recall (R), precision (P), F1 score (F1), and BCEDiceLoss (Loss) as evaluation metrics. These metrics were used to quantify the discrepancy between the network’s predicted segmentation results and the ground truth annotations.
The IoU indicates the degree of overlap between the predicted region and the ground-truth region, and its mathematical expression is shown in Equation (14). Recall indicates how many true positive samples are successfully predicted as positive by the model, and its mathematical expression is shown in Equation (15). Precision indicates how many true positive samples are included in the positive category samples. Its mathematical expression is shown in Equation (16). The F1 score comprehensively considers both recall and precision, focusing on both accuracy and coverage. Its mathematical expression is shown in Equation (17):
IoU = TP TP + FP + FN
R = TP TP + FN
P = TP TP + FP
F 1 = 2 × Precision × Recall Precision + Recall
Where TP indicates that the original datum is a positive sample and remains a positive sample after the model’s prediction and FN indicates that the original datum is a negative sample and remains a negative sample after the model’s prediction, as shown in Table 2.
BCEDiceLoss is a loss function that combines binary cross-entropy (BCE) and Dice loss. Binary cross-entropy loss is usually used for binary classification tasks. Its expression is shown in Equation (18), where y i is the true label (zero or one) of the ith sample, y ^ i is the predicted probability of the ith sample, and N is the number of samples:
BCE ( y , y ^ ) = 1 N i = 1 N y i log ( y ^ i ) + ( 1 y i ) log ( 1 y ^ i )
The Dice loss is used to measure the similarity between two sample sets. Its expression is shown in Equation (19), where y is the binary mask of the true label and y ^ is the predicted binary mask:
Dice Loss ( y , y ^ ) = 1 2 i = 1 N y i y ^ i i = 1 N y i 2 + i = 1 N y ^ i 2
In the BCEDiceLoss used in this paper, the BCE loss is used to accurately classify each pixel, while the Dice loss is more concerned with the overlap of the overall area, thereby maintaining good performance even in the case of class imbalance. Its expression is shown in Equation (20), where α and β are the weight coefficients:
BCEDiceLoss ( y , y ^ ) = α · BCE ( y , y ^ ) + β · Dice Loss ( y , y ^ )

2.6. Experimental Set-Up

This experiment was built on the deep learning framework Pytorch and used the Ubuntu system to carry out related tests. The specific experimental configurations are shown in Table 3.
To account for the differences in features between the base model dataset and the target model dataset, and to ensure smooth convergence for both datasets while fully demonstrating the superiority of the proposed method across different datasets, we adopted different training epochs for each dataset while keeping the other training hyperparameters consistent. The batch size for the experiments was set to 32, and the resolution of the training images was fixed at 256 × 256 pixels.The training hyperparameters are listed in Table 4, and the training epochs for each dataset are detailed in Table 5.

3. Results and Discussion

3.1. Ablation Experiment Results and Discussion

In order to verify the effectiveness of the Tok-KAN, DLFFSKA modules, and transfer learning in this paper, ablation experiments were conducted on the DLRSD-Expand and Landslide-Expand datasets.

3.1.1. Tokenized KAN Block Ablation Experiment

In this section, we evaluate the nonlinear learning capabilities of the Tok-KAN and its effectiveness when integrated with the U-Net++ architecture. Our ablation experiments compare the baseline U-Net++ model with the Tok-KAN-enhanced U-Net++ and the U-KAN model. The comparison focuses on evaluating the performance of these object detection models using three key metrics: the intersection over union (IoU), F1 score, and loss.
The experiments were conducted based on the DLRSD-Expand dataset and the expanded Landslide-Expand dataset. In the comparative experiments, we selected the baseline models U-KAN and U-Net++ as well as the Tok-KAN integrated U-Net++ network as test subjects. All models were trained and tested under the same conditions, and a unified set of evaluation metrics was applied for performance assessment.
Based on Table 6, the Tok-KAN enhanced the model’s ability to capture and represent complex, nonlinear relationships in remote sensing images, particularly in challenging scenarios such as heterogeneous terrain features and landslide regions. As shown in Table 6, the Tok-KAN significantly improved the model’s ability to distinguish complex interclass feature relationships on the DLRSD Expand dataset. This capability is essential for handling the diverse natural characteristics found in remote sensing images, where conventional models often struggle to manage the unpredictability of object boundaries and intricate terrain patterns. The Tok-KAN’s performance improvement in terms of the IoU (+1.16%) and F1 score (+0.77%) on the DLRSD-Expand dataset highlights its ability to model nonlinear features, outperforming the baseline U-Net++ and U-KAN models.
To provide a more intuitive understanding of the Tok-KAN’s impact on model performance across different datasets, the training and validation IoU curves (Train IoU and Val IoU) are presented in Figure 7.
On both the DLRSD-Expand and Landslide-Expand datasets, integrating the Tok-KAN with U-Net++ led to significant improvements in the IoU on the validation set, demonstrating the model’s enhanced generalization ability. While the IoU on the training set was slightly lower than that of the baseline U-Net++ on the DLRSD-Expand dataset, this suggests that the Tok-KAN’s nonlinear modeling capabilities helped the model handle complex interclass relationships, fuzzy boundaries, and interclass interference effectively. The Tok-KAN’s regularization effect also alleviated overfitting, improving robustness in real-world scenarios. On the Landslide-Expand dataset, the validation IoU initially fluctuated in the first 100 epochs due to the model’s exploratory behavior. However, as training progressed, the Tok-KAN adapted to the complex contextual relationships, leading to steady improvement in the final performance.
By analyzing the ablation experiment results in Table 6 and Figure 7, integrating the Tok-KAN into U-Net++ not only reduced the parameters and accelerated training but also significantly improved the segmentation accuracy. The Tok-KAN excels in modeling intricate nonlinear relationships and adapting to various scenarios, demonstrating strong potential for remote sensing image segmentation tasks. Its advantages are evident in both multiclass datasets with rich features and single-class datasets with complex details.

3.1.2. Dual Large Feature Fusion Selective Kernel Attention Ablation Experiment

In the previous experiments, the significant potential of integrating the Tok-KAN into the U-Net++ network for remote sensing image segmentation tasks was thoroughly validated. To further explore the potential of the Tok-KAN, this section introduces the DLFFSKA module on top of the U-Net++ network integrated with the Tok-KAN. The DLFFSKA module was placed between the convolutional operations and the skip connections on the far-left side of the network to examine its impact on improving segmentation performance.
To evaluate the effectiveness of the DLFFSKA module compared with the LSK module in remote sensing image segmentation tasks, this study took the U-Net++ network integrated with the Tok-KAN as the baseline model. The LSK and DLFFSKA modules were added to the network, and a comparative experiment was conducted. The results are shown in Table 7.
Introducing the LSK module to the network resulted in a marginal improvement in the IoU, with increases of 0.22% and 0.09% on the DLRSD-Expand and Landslide-Expand datasets, respectively, compared with the baseline model (Table 7). However, the DLFFSKA module proposed in this study further enhanced the performance by using larger convolution kernels. This modification improved the model’s capacity to capture receptive fields at multiple scales, making it more adaptable to the diversity of features in remote sensing images. The DLFFSKA module led to significant improvements in global segmentation performance. As shown in Table 7, despite an increase of just 0.1 M parameters, the DLFFSKA module boosted the IoU by 4.03% and 1.7% on the DLRSD-Expand and Landslide-Expand datasets, respectively, compared with U-Net++ with a Tok-KAN alone, and the loss value decreased by 0.0497 and 0.019, respectively. These results clearly demonstrate the superior performance of the DLFFSKA module in remote sensing image segmentation tasks.
Furthermore, to explore the impact of the DLFFSKA module on feature extraction using different fusion kernel volumes, we examined the performance of the module with varying feature fusion convolution weights. The weight parameters α and β represent the respective weights for feature fusion convolutions with large kernels of seven and nine, as illustrated in Figure 3. The results of this ablation experiment are presented in Table 8.
When the weight was set to α = 0.25 and β = 0.75 , the IoU and F1 values of the two datasets did not change much compared with the LSK module, but the loss value decreased, and the IoU of DLRSD-Expand decreased slightly. This is because the weight of the large kernel convolution was too high, which weakened the model’s ability to capture detailed features and affected the overall segmentation performance. When the weight was set to α = 0.5 and β = 0.5 , the model achieved better results than the LSK module on both datasets in this paper. To verify that the smaller the proportion of large kernel convolutions, the better the effect, we set the weight to α = 0.75 and β = 0.25 . Compared with the LSK module, it achieved some improvement, but it was still far lower than when the weight was set to α = 0.5 and β = 0.5 . When the weight of the DLFFSKA feature fusion kernel was set to α = 0.5 and β = 0.5 , the model on the DLRSD-Expand dataset improved the IoU and F1 score by 3.81% and 2.66% compared with the LSK module, respectively, and the loss value decreased by 0.0458. On Landslide-Expand, the IoU and F1 score improved by 1.61% and 1.54% compared with the LSK module, and the loss value decreased by 0.0183.
The heatmaps presented in Figure 8 provide an intuitive visualization of the performance improvements achieved by the DLFFSKA attention mechanism. The color intensity reflects the confidence levels, with deep red indicating high confidence and deep blue indicating low confidence. The transition zones between red and blue represent intermediate values.
The analysis revealed that without the attention mechanism, the target regions were ambiguous, with numerous red-to-blue transition areas in the heatmap (Figure 8A), leading to significant misidentification of boundaries. When the LSK attention mechanism was added (Figure 8B), these transition areas were reduced, and the target boundaries became clearer. However, for the smaller target regions, the model still struggled with incomplete recognition.
With the introduction of the DLFFSKA attention mechanism, the transition zones between the target boundaries and the background were further minimized (Figure 8C). As the ratio of the large kernel weight increased, the distinction between high- and low-confidence regions became more pronounced. The α = 0.5 and β = 0.5 configuration yielded the best performance (Figure 8D), clearly distinguishing the target-background boundary and accurately identifying the target region with high confidence.
The results effectively demonstrate that the DLFFSKA mechanism, by balancing large and small convolution kernels, significantly enhanced the model’s ability to perceive global features while retaining image details. This improvement optimizes the model’s performance in recognizing remote sensing image features, resulting in a clearer delineation between targets and backgrounds and better identification of target areas. Here, U-Net++ with the addition of a Tok-KAN and DLFFSKA ( α = 0.5 and β = 0.5 ) is referred to as the Large Kernel Nested UKAN (LKN-UKAN).

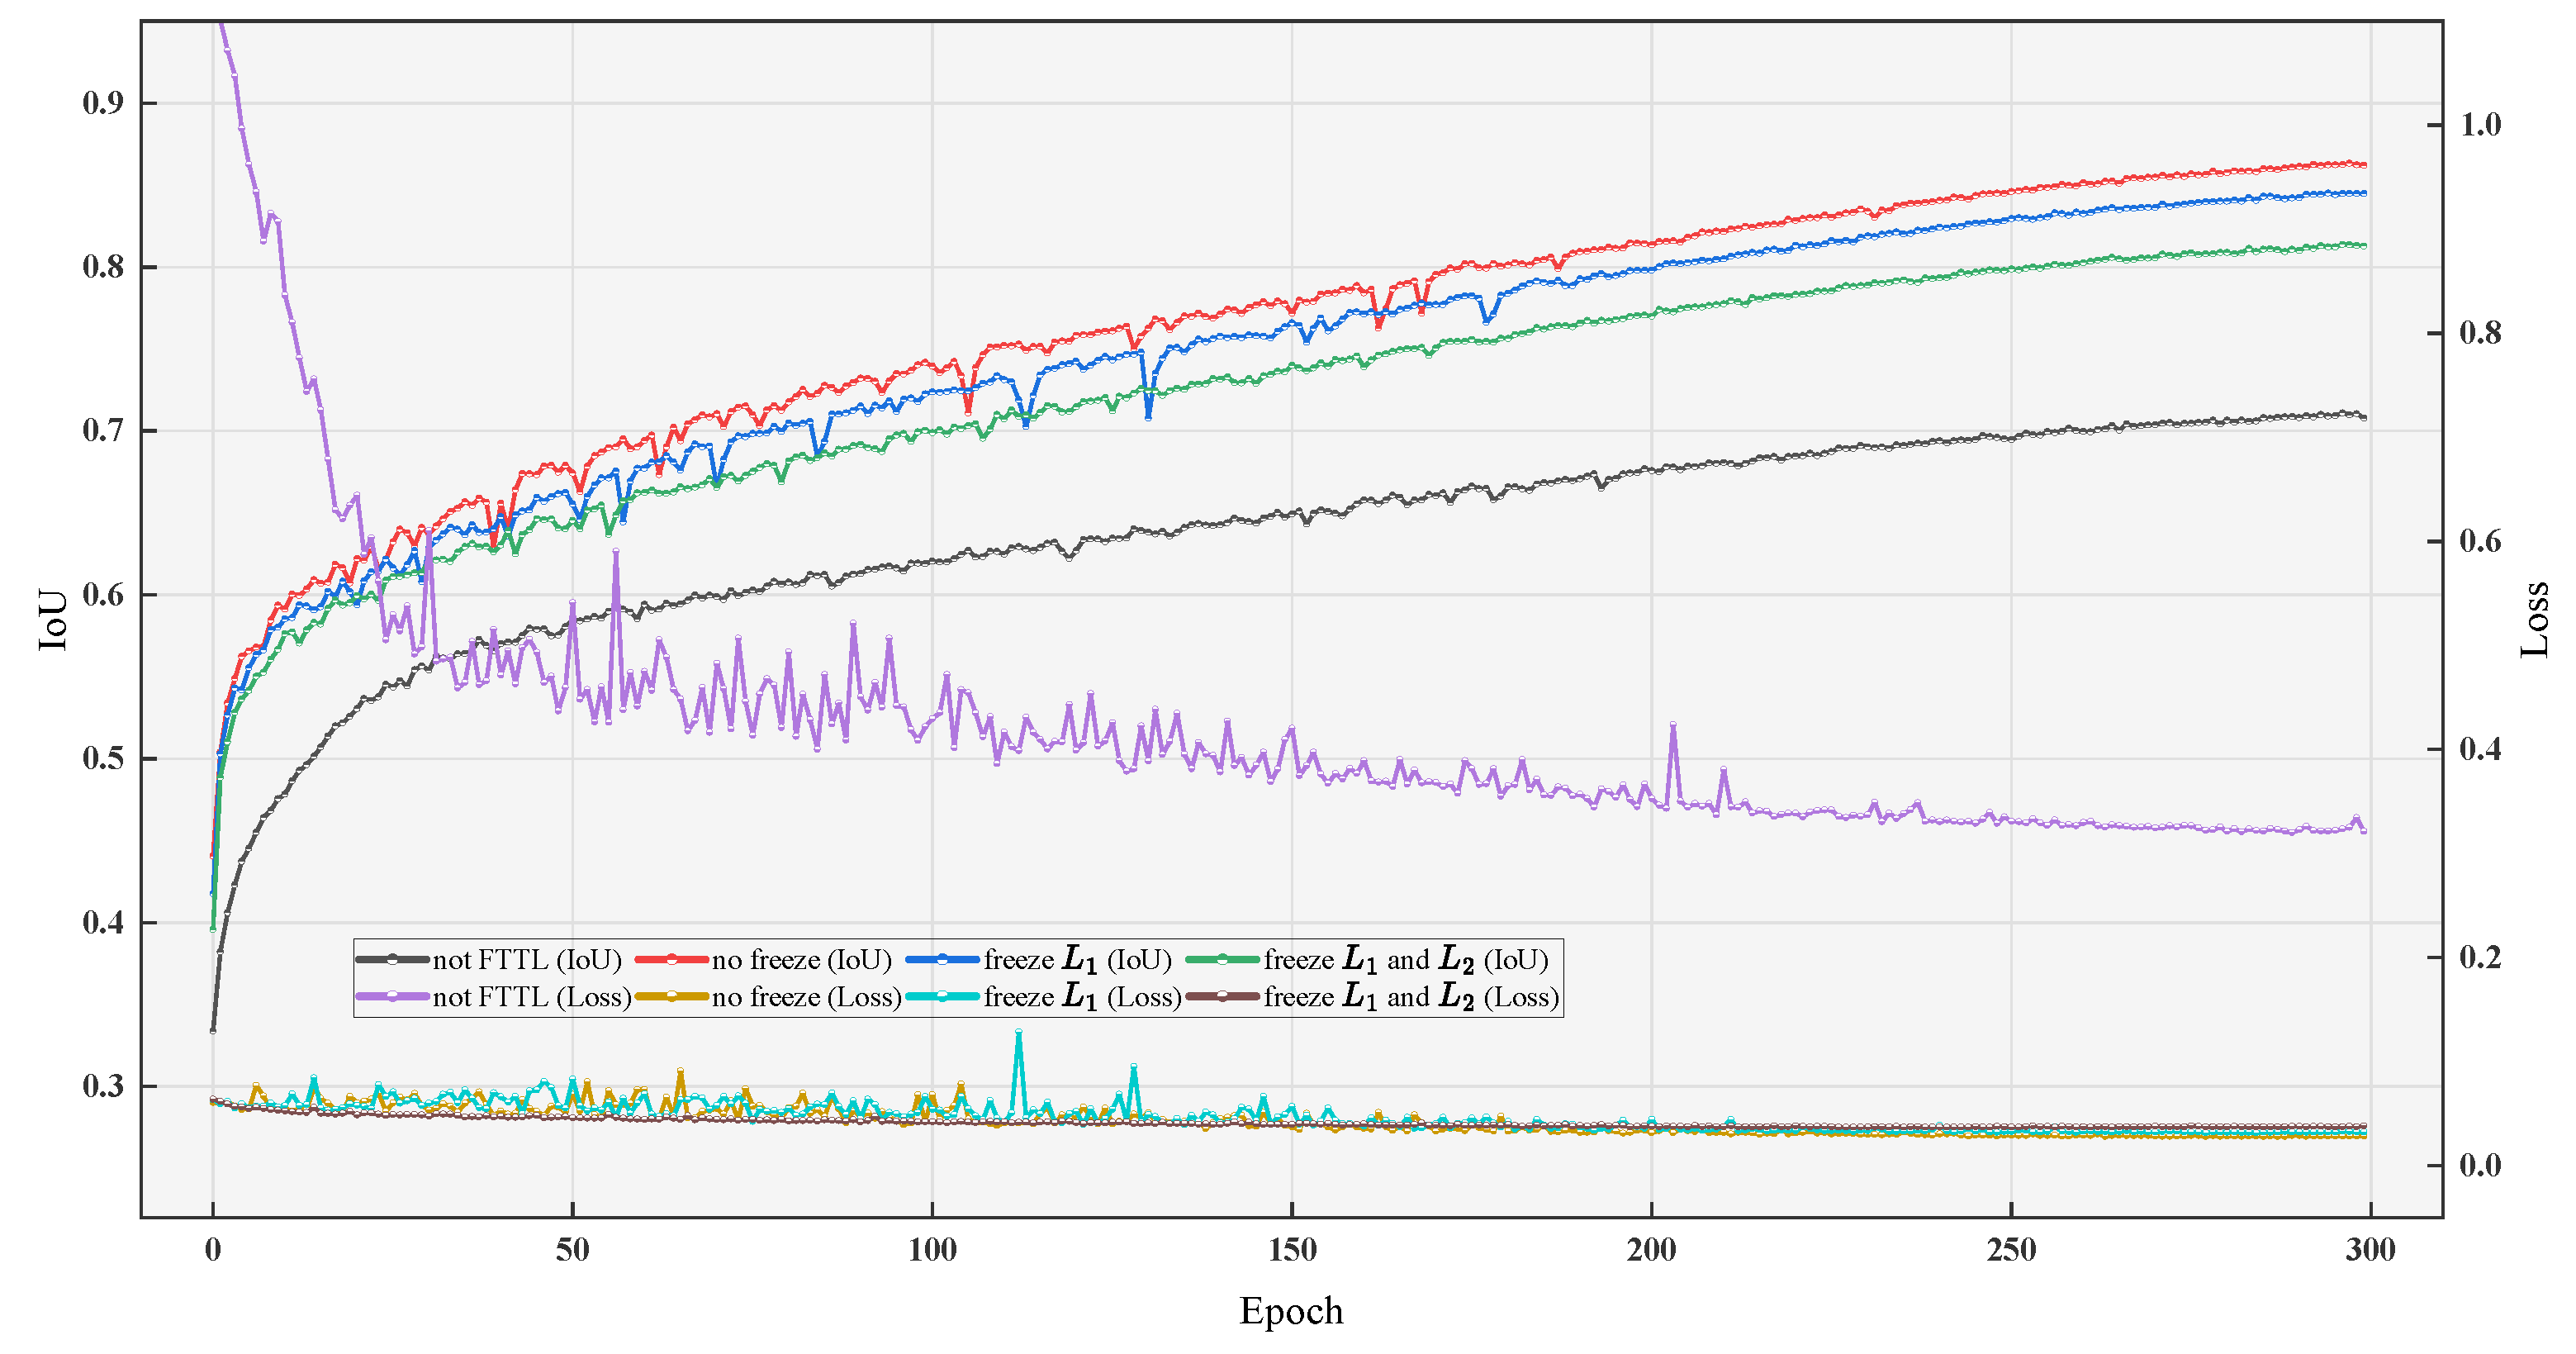
3.1.3. Fine-Tuning Transfer Learning Ablation Experiment

The preliminary results show that the LKN-UKAN achieved notable performance improvements on the feature-rich DLRSD-Expand dataset. However, performance gains on the Landslide-Expand dataset, characterized by a single category and complex features, were relatively limited. To enhance model performance on the Landslide-Expand dataset, we explored the use of FTTL in this section.
FTTL offers the advantage of selectively freezing specific network layers, thereby improving efficiency and adaptability to different dataset characteristics. In our experiments, we used the pretrained LKN-UKAN model on the DLRSD-Expand dataset as the baseline, sequentially freezing different layers during fine-tuning on the Landslide-Expand dataset to evaluate the impact of layer freezing on model performance.
As shown in Table 9, when no layers were frozen, the model’s performance improved significantly, with the IoU, recall, precision, and F1 scores increasing by 10.38%, 4.85%, 9.16%, and 6.93%, respectively, compared with the baseline model, while the loss value decreased by 0.2929. Furthermore, the average training time per batch was reduced by 9 s, indicating that FTTL not only enhanced model performance but also optimized training efficiency. This aligns with existing research indicating that fine-tuning enables more efficient adaptation to target datasets.
However, performance degraded when freezing low-level layers, suggesting that the pretrained features from the DLRSD-Expand dataset may not have adequately captured the unique geomorphic features of the Landslide-Expand dataset. Specifically, freezing low-level layers reduced the model’s ability to dynamically adjust the mid- and high-level features, which is crucial for distinguishing the fine terrain and structural details of landslide images. This result is consistent with previous studies showing that low-level features, such as textures and edges, are often too general and require fine-tuning for better adaptation to specialized tasks.
Further analysis revealed that freezing the layers resulted in faster training times but did not improve model accuracy. When the low-level layers were frozen, the model’s capacity to capture local variations was compromised, leading to a decline in segmentation performance. This highlights the critical role of low-level feature fine-tuning in effectively transferring knowledge from a rich base dataset to a specialized target dataset.
Figure 9 shows the variation in the IoU and loss values across different freezing strategies. The model using FTTL without freezing the layers outperformed all others, demonstrating superior IoU and lower loss values. As more layers were frozen, both the IoU and loss decreased, supporting the hypothesis that non-frozen layers provided better feature representation for the Landslide-Expand dataset.
In conclusion, in the landslide image segmentation task, the strategy of not freezing any network layers when using FTTL can significantly improve the performance of the target model while taking into account the training efficiency. The strategy of freezing layers has certain advantages in terms of computational efficiency, but it performed worse than the fully unfrozen network model in terms of geomorphic feature expression and segmentation accuracy.

3.1.4. Ablation Experiment Between Different Methods

In the preceding three sections, we investigated the insertion position of diverse modules within the network model and the influence of the feature extraction methodology employed within the module on the model performance. In order to further verify the impact of these methods on the overall model performance, this section employs U-Net++ as the baseline network and conducts experiments with the Landslide-Expand dataset. On this basis, the target model was trained separately by combining different methods in different ways to evaluate the specific contribution and interaction of each method. The results of the ablation experiment for different method combinations are presented in Table 10.
The results of the ablation experiments demonstrate that both the Tok-KAN and DLFFSKA modules, when employed individually, were capable of markedly enhancing the model’s performance. When compared with the baseline U-Net++, there was a notable improvement in all evaluation metrics, which served to substantiate the efficacy of the design of these modules. The joint utilization of the Tok-KAN and DLFFSKA (LKN-UKAN) resulted in a further enhancement in performance when compared with the use of these two modules in isolation. As shown in Table 10, despite a reduction in the model parameters by 0.79 M, there was an improvement in the IoU, recall, precision, and F1 scores by 1.74%, 1.16%, 1.83%, and 1.49%, respectively. Furthermore, the loss was reduced by 0.0176 in comparison with the baseline U-Net++. This demonstrates that the nonlinear properties of the Tok-KAN and the contextual understanding capability of DLFFSKA exhibited a high degree of complementarity.
Nevertheless, for the Landslide-Expand dataset, which has a single target category and intricate, detailed features, it remained challenging to fully harness the model’s potential by relying solely on the aforementioned modules. Accordingly, we introduced the FTTL strategy with the objective of enhancing the model’s performance. In comparison with the baseline U-Net++, the utilization of FTTL alone resulted in improvement in the IoU, recall, precision, and F1 score by 6.98%, 4.27%, 5.1%, and 4.68%, respectively, accompanied by a reduction in loss of 0.3045. In combination with the Tok-KAN and DLFFSKA, the IoU, recall, precision, and F1 score were improved by 12.12%, 6.01%, 10.99%, and 8.42%, respectively, and the loss was reduced by 0.3105 in comparison with the baseline U-Net++. This provides compelling evidence in favor of the joint method.
In order to illustrate the impact of each method on the model’s predictive efficacy, three images were selected for display in Figure 10. These images are accompanied by the heatmaps and segmentation results (Mask) of the prediction results, which were generated through the execution of ablation experiments utilizing a variety of methods. The leftmost column (Image and GT) depicts the original images and ground-truth masks of the three groups of images in sequence. The rightmost column presents the prediction outcomes of the methodology proposed in this paper, which exhibits the heatmaps and masks predicted by the methodology for the three groups of images in sequence. E1, E2, E3, E4, and E5 present the prediction results of the ablation experiments in sequence. The heatmap and prediction mask in E1 demonstrate that the baseline U-Net++ model encountered difficulties in distinguishing between target and background regions, resulting in the misclassification of non-landslide areas as landslide areas. The Tok-KAN experiment (E2) demonstrated an improvement in accuracy compared with experiment E1, with a reduction in the number of incorrectly identified non-landslide areas as landslide areas. However, as evidenced by the heatmap in E2, the boundary between the target and background regions remained challenging to discern, exhibiting a considerable number of red and blue transition areas. The heatmap of experiment E3 demonstrates that the boundary between the target and the background could be discerned with clarity. However, there persisted the issue of misidentifying certain non-landslide regions as landslide regions. In experiment E4, which incorporated both DLFFSKA and a Tok-KAN (LKN-UKAN), the mask indicates that the model’s image segmentation was largely accurate. However, the heatmap persisted in exhibiting an insufficiently clear delineation of the target and background. Further improvements could be made. In experiment E5, the introduction of FTTL resulted in a clear partitioning of the target and background colors, with only a few areas exhibiting recognition errors. The combination of a Tok-KAN with DLFFSKA and the introduction of FTTL resulted in the most accurate heatmap of all the experiments, effectively eliminating background interference and accurately delineating the boundary between the target and the background. This demonstrated excellent performance in the segmentation of landslide images via remote sensing.

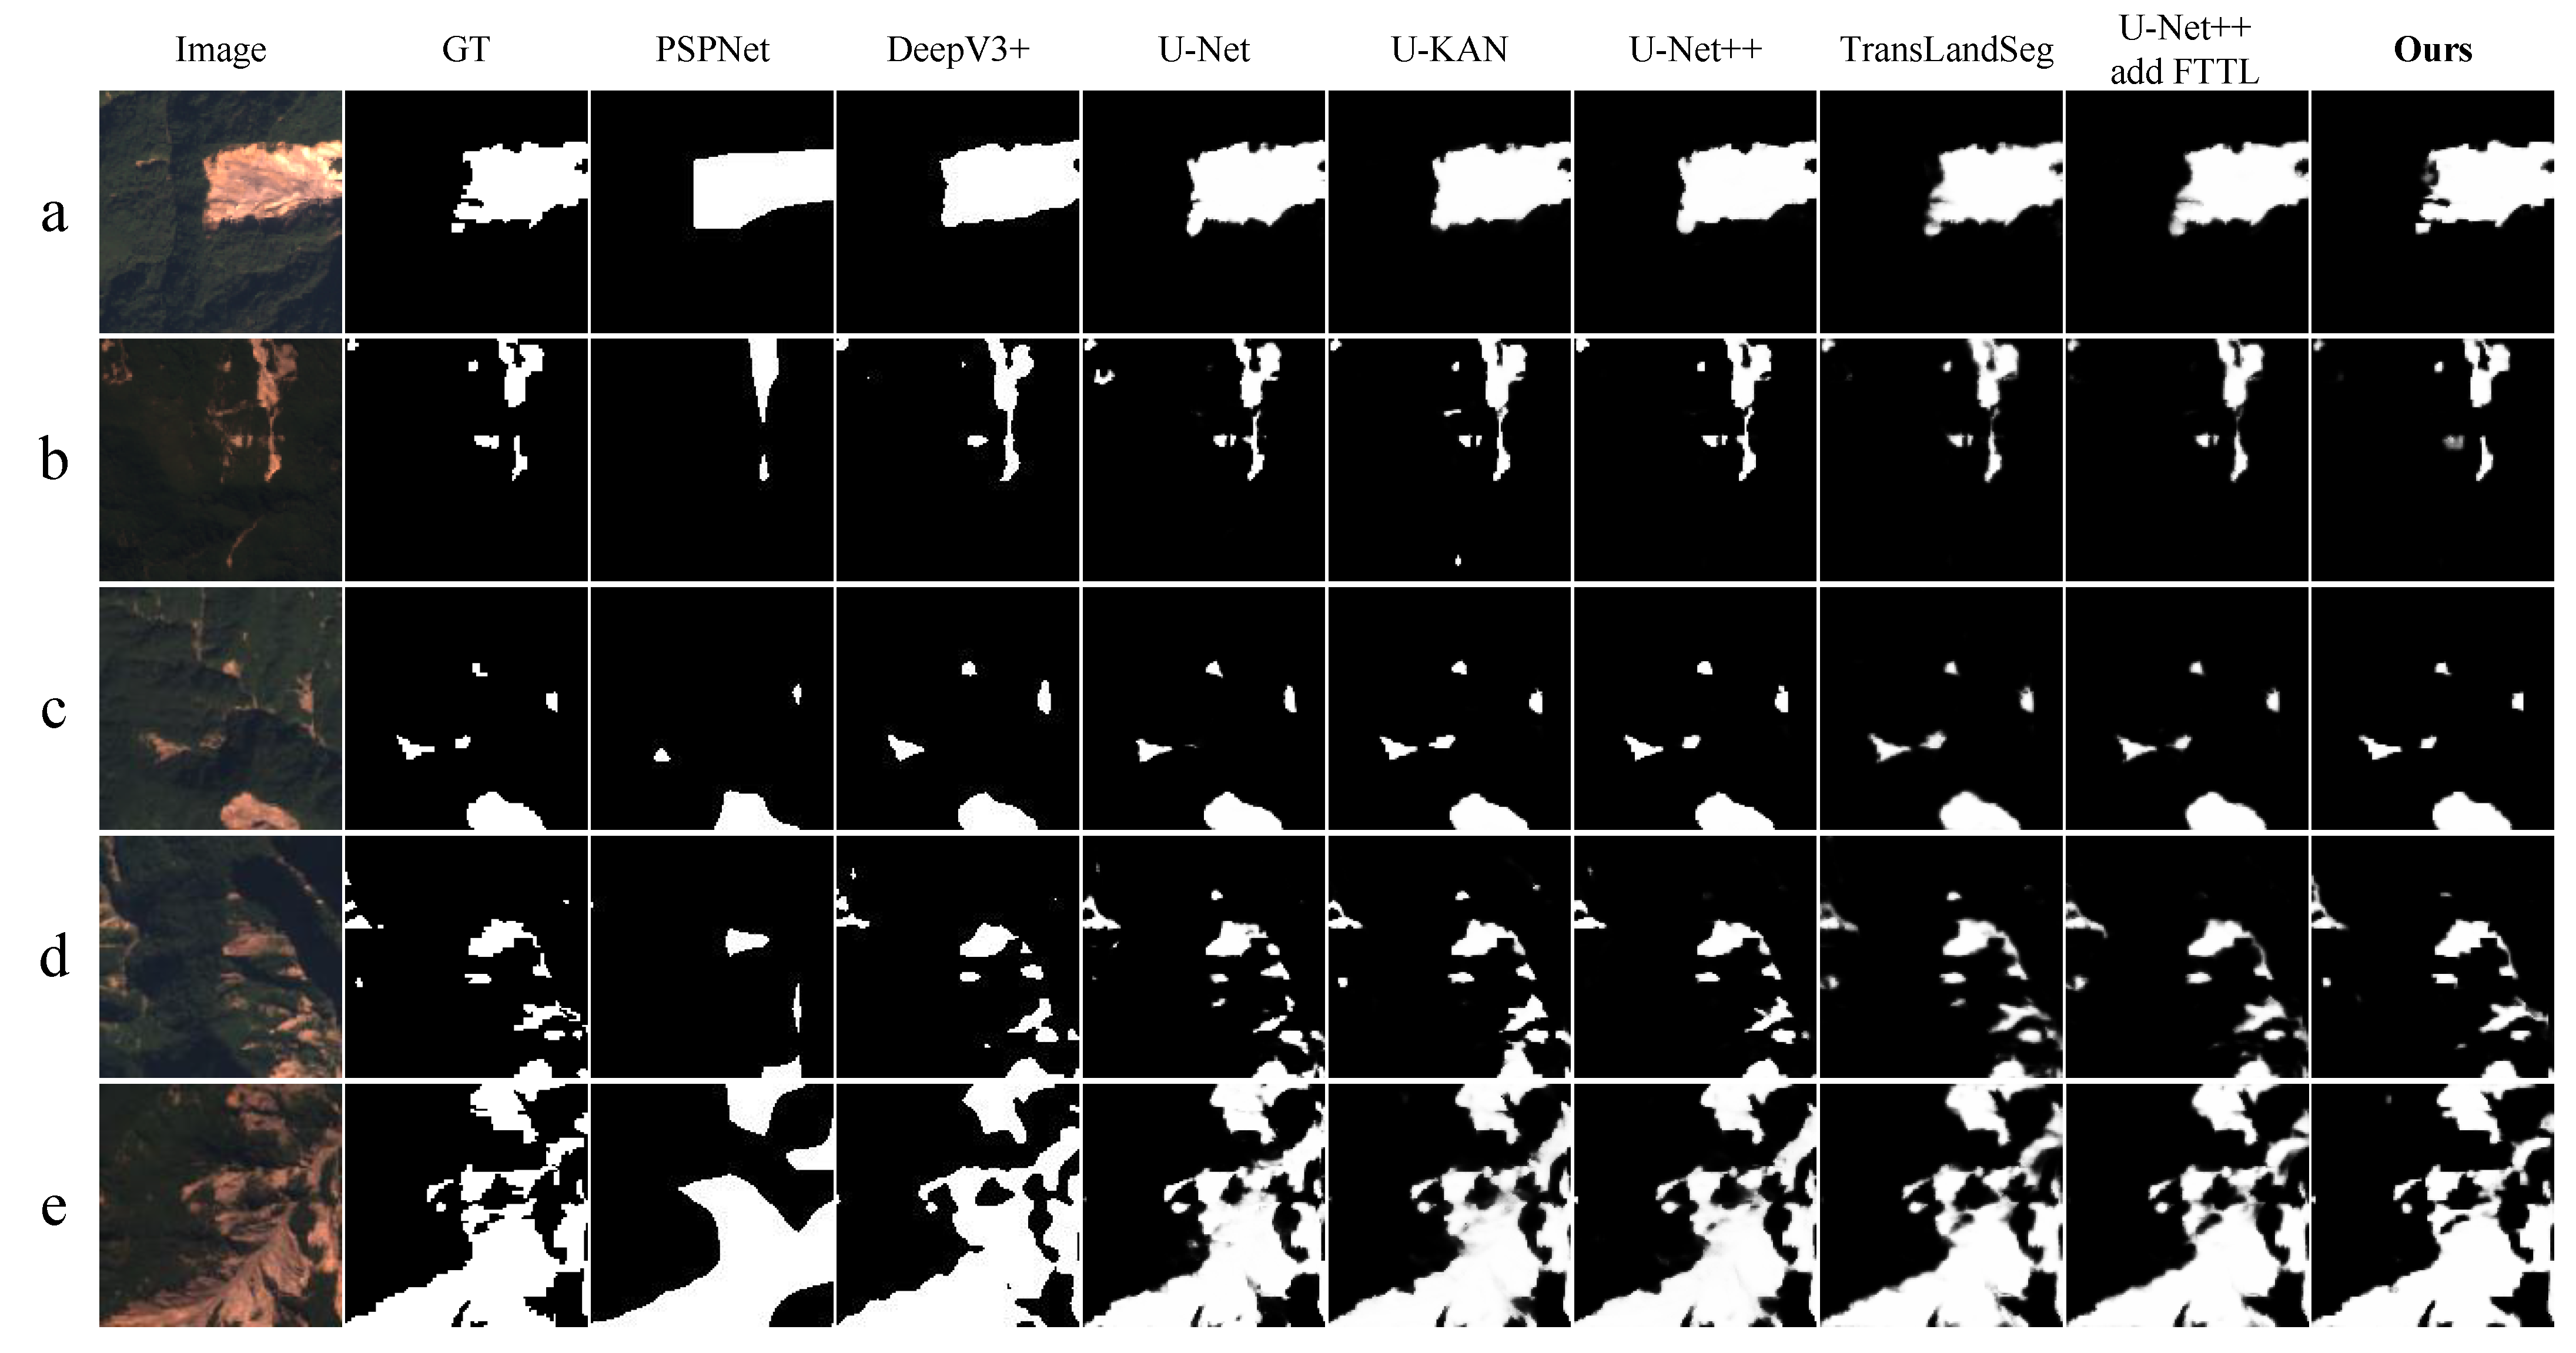
3.2. Comparative Experiments Results and Discussion

In order to further verify the superiority of the network designed in this paper for landslide image segmentation, some mainstream segmentation models were selected for comparative experiments, including PSPNet, Deephlabv3+, U-Net, U-KAN, U-Net++, and the LKN-UKAN method using FTTL in this paper. The results of the comparative experiments are shown in Table 11, and the comparison results are shown in Figure 11.
As demonstrated in Table 11, for the algorithm comparison experiments, although the U-KAN [45] exhibited the lowest parameter count among all networks, its segmentation performance did not demonstrate corresponding superiority. The conventional segmentation architectures, including PSPNet [38], Deeplabv3+ [39], U-Net [31], and U-Net++ [32], showed no significant advantages across any metrics on our dataset. Notably, while the transfer learning approaches TransLandSeg [47] and U-Net++ with FTTL achieved better segmentation performance than traditional methods, ours (LKN-UKAN with FTTL) demonstrated superior comprehensive performance. Specifically, compared with these transfer learning-enhanced methods, our approach achieved optimal performance across multiple evaluation metrics while maintaining a marginal increase in parameter count. As clearly evidenced in Table 11, quantitative analysis revealed that the proposed method achieved significant improvements of 12.22% for the IoU, 5.4% for precision, and 8.36% for the F1 score compared with the baseline network U-Net++ used in this study.
As demonstrated in Figure 11a,b, conventional segmentation architectures (PSPNet, DeepLabV3+, U-Net, U-KAN, and U-Net++) exhibited fundamental capability in delineating primary landslide areas within concentrated landslide regions. However, these methods demonstrated limited precision in edge detection, particularly failing to distinguish discrete landslide patches adjacent to main landslide bodies. While transfer learning-enhanced approaches (TransLandSeg and U-Net++ with FTTL) showed improved boundary recognition, their performance remained suboptimal for internal non-landslide features within landslide areas. In contrast, our proposed method (LKN-UKAN with FTTL) achieved superior edge delineation accuracy while effectively identifying both intra-landslide heterogeneities and peripheral scattered landslide clusters, demonstrating enhanced granularity in segmentation outcomes.
Figure 11b,c reveals the critical limitations of conventional methods in handling landslide discontinuities, where these architectures consistently misclassified fracture zones as landslide areas. Ours emerged as the sole framework capable of accurate fracture detection while maintaining high sensitivity to marginal landslide features in image peripheries, confirming its exceptional segmentation capability. As illustrated in Figure 11c,d, although all evaluated networks demonstrated basic localization competence for distributed landslide patterns, ours achieved superior shape fidelity and spatial consistency, producing segmentation results which most closely approximated ground-truth distributions.
As shown in Figure 11c,d, although all evaluated networks demonstrated basic localization competence for distributed landslide patterns, ours achieved superior shape fidelity and spatial consistency, producing segmentation results which most closely approximate ground-truth distributions.
As shown in Figure 11e, for images with complex interleaving of landslide and non-landslide areas, the transfer learning-based segmentation method demonstrated superior performance in edge detail segmentation compared with traditional segmentation approaches. In particular, ours achieved the most outstanding performance among all methods, enabling clear and accurate delineation of landslide areas with precise boundary definition between landslide and non-landslide regions. This methodology significantly enhanced segmentation effectiveness, yielding optimal results.
In conclusion, our model (LKN-UKAN with FTTL) outperformed both conventional segmentation architectures and existing transfer learning methods across various challenging scenarios, including edge refinement, fracture zone detection, and distributed landslide recognition. This empirical evidence substantiates the framework’s practical value and transformative potential for landslide image analysis applications.

4. Conclusions and Outlook

4.1. Conclusions

This study proposed an enhanced LKN-UKAN model and applied FTTL to it to address the deficiencies of existing segmentation networks in remote sensing landslide image segmentation tasks. The key findings and contributions are summarized as follows. (1) Tok-KAN module: We introduced the tokenized KAN block (Tok-KAN) to enhance the network’s ability to model complex nonlinear features, addressing the limitations of U-Net++ in capturing intricate landslide details. (2) DLFFSKA module: We designed the DLFFSKA module to improve the network’s global perception and multi-scale feature fusion capabilities, significantly enhancing edge delineation and segmentation accuracy in complex areas. (3) FTTL strategy: By applying FTTL, we developed an efficient and precise target model tailored for landslide image segmentation. The experimental results demonstrated that the LKN-UKAN achieved notable improvements over U-Net++, with the IoU, precision, and F1 score increasing by 12.22%, 5.4%, and 8.36%, respectively.

4.2. Outlook

Although the combination of the LKN-UKAN and FTTL has made significant progress in landslide segmentation, several challenges remain. The limited scale and diversity of the target dataset (Landslide-Expand) may have constrained generalization to unseen scenarios. Future research will focus on the following aspects: (1) investigating adaptive weight ratio adjustments for α and β in the DLFFSKA module to further optimize feature fusion; (2) exploring more effective layer-freezing strategies in FTTL for different remote sensing image segmentation tasks; and (3) validating the applicability and generalizability of the LKN-UKAN in a wider range of remote sensing image processing tasks. Additionally, although the model reduced the parameters compared with U-Net++, its computational efficiency in real-time applications requires further validation. Lightweight adaptations, such as model pruning or adaptive layer compression, could optimize deployment on edge devices.
To align with practical needs, future research should focus on the performance in specific landslide scenarios, such as small-area landslides and obstructed landslides, and explore integration with geographic information systems (GISs) for real-time hazard management. Finally, validating the LKN-UKAN’s applicability to broader remote sensing tasks, such as single-type image segmentation or multi-class geological hazard detection, will strengthen its versatility. Addressing these challenges through interdisciplinary collaboration will bridge algorithmic innovation with real-world geological risk mitigation, ensuring the model’s reliability and scalability in diverse operational scenarios.

Author Contributions

Conceptualization, J.L. (Jiajun Li), Q.L. and K.Z.; methodology, J.L. (Jiajun Li), J.L. (Jinzheng Lu) and Q.X.; software, J.L. (Jiajun Li), L.W. and Q.X.; validation, J.L. (Jiajun Li), L.W. and Q.X.; formal analysis, J.L. (Jiajun Li), Q.L., J.L. (Jinzheng Lu) and K.Z.; investigation, J.L. (Jiajun Li), J.L. (Jinzheng Lu) and K.Z.; resources, J.L. (Jiajun Li), Q.L. and K.Z.; data curation, J.L. (Jiajun Li); writing—original draft preparation, J.L. (Jiajun Li) and L.W.; writing—review and editing, J.L. (Jiajun Li), Q.L., J.L. (Jinzheng Lu), L.W. and K.Z.; visualization, J.L. (Jiajun Li), L.W. and Q.X.; supervision, Q.L., J.L. (Jinzheng Lu) and K.Z.; project administration, Q.L., J.L. (Jinzheng Lu) and K.Z.; funding acquisition, Q.L. and J.L. (Jinzheng Lu). All authors have read and agreed to the published version of the manuscript.

Funding

This research was funded by the Science and Technology Project of Xizang Autonomous Region (XZ202501YD0008), the Project of Southwest University of Science and Technology (21JPKC13) and the National Natural Science Foundation of China (62362017).

Institutional Review Board Statement

Not applicable.

Informed Consent Statement

Not applicable.

Data Availability Statement

The original contributions presented in this study are included in the article. Further inquiries can be directed to the corresponding author.

Conflicts of Interest

The authors declare no conflicts of interest.

Abbreviations

The following abbreviations are used in this manuscript:
LKN-UKANLarge Kernel Nested UKAN
KANsKolmogorov–Arnold networks
DLFFSKADual Large Fusion Selective Kernel Attention
LiDARLight detection and ranging
SVMSupport vector machine
CNNsConvolutional neural networks
FTTLFine-tuning transfer learning
Tok-KANTokenized KAN block
MLPMultilayer perceptron
LSKLarge selective kernel
GTGround truth
BCEBinary cross-entropy
BNBatch normalization
LNLayer normalization

References

  1. Thanh-Nhan-Duc Tran; Tapas, M.R.; Do, S.K.; Etheridge, R.; Lakshmi, V. Investigating the impacts of climate change on hydroclimatic extremes in the Tar-Pamlico River basin, North Carolina. J. Environ. Manag. 2024, 363, 121375. [Google Scholar] [CrossRef]
  2. Lakshmi, V. Enhancing human resilience against climate change: Assessment of hydroclimatic extremes and sea level rise impacts on the Eastern Shore of Virginia, United States. Sci. Total Environ. 2024, 947, 174289. [Google Scholar] [CrossRef]
  3. Marín-Rodríguez, N.J.; Vega, J.; Zanabria, O.B.; González-Ruiz, J.D.; Botero, S. Towards an understanding of landslide risk assessment and its economic losses: A scientometric analysis. Landslides 2024, 1865–1881. [Google Scholar] [CrossRef]
  4. Van Westen, C.J. Remote sensing for natural disaster management. Int. Arch. Photogramm. Remote Sens. 2000, 33, 1609–1617. [Google Scholar]
  5. Han, W.; Zhang, X.; Wang, Y.; Wang, L.; Huang, X.; Li, J.; Wang, S.; Chen, W.; Li, X.; Feng, R.; et al. A survey of machine learning and deep learning in Remote Sens. of geological environment: Challenges, advances, and opportunities. ISPRS J. Photogramm. Remote Sens. 2023, 202, 87–113. [Google Scholar] [CrossRef]
  6. Liu, X.; Peng, Y.; Lu, Z.; Li, W.; Yu, J.; Ge, D.; Xiang, W. Feature-Fusion Segmentation Network for Landslide Detection Using High-Resolution Remote Sens. Images and Digital Elevation Model Data. IEEE Trans. Geosci. Remote Sens. 2023, 61, 4020405. [Google Scholar] [CrossRef]
  7. Casagli, N.; Intrieri, E.; Tofani, V.; Gigli, G.; Raspini, F. Landslide detection, monitoring and prediction with remote-sensing techniques. Nat. Rev. Earth Environ. 2023, 4, 51–64. [Google Scholar] [CrossRef]
  8. Su, H.; Ma, J.; Zhou, R.; Wen, Z. Detect and identify earth rock embankment leakage based on UAV visible and infrared images. Infrared Phys. Technol. 2022, 122, 104105. [Google Scholar] [CrossRef]
  9. Nava, L.; Monserrat, O.; Catani, F. Improving Landslide Detection on SAR Data Through Deep Learning. IEEE Geosci. Remote Sens. Lett. 2021, 19, 4020405. [Google Scholar] [CrossRef]
  10. Crutchley, S. Light detection and ranging (lidar) in the Witham Valley, Lincolnshire: An assessment of new Remote Sens. techniques. Archaeol. Prospect. 2006, 13, 251–257. [Google Scholar] [CrossRef]
  11. Fang, C.; Fan, X.; Zhong, H.; Lombardo, L.; Tanyas, H.; Wang, X. A Novel Historical Landslide Detection Approach Based on LiDAR and Lightweight Attention U-Net. Remote Sens. 2022, 14, 4357. [Google Scholar] [CrossRef]
  12. Cheng, G.; Han, J. A survey on object detection in optical Remote Sens. images. ISPRS J. Photogramm. Remote Sens. 2016, 117, 11–28. [Google Scholar] [CrossRef]
  13. Medwedeff, W.G.; Clark, M.K.; Zekkos, D.; West, A.J. Characteristic landslide distributions: An investigation of landscape controls on landslide size. Earth Planet. Sci. Lett. 2020, 539, 116203. [Google Scholar] [CrossRef]
  14. Varol, N.; Cengiz, L.D. An Overview of Landslide Management: Scope, Difficulties, Limitations with Future Directions and Opportunities. Afet Risk Derg. 2023, 6, 609–621. [Google Scholar] [CrossRef]
  15. Al-Amri, S.S.; Kalyankar, N.V.; Khamitkar, S.D. Image segmentation by using threshold techniques. arXiv 2010, arXiv:1005.4020. [Google Scholar]
  16. Martha, T.R.; Kerle, N.; Van Westen, C.J.; Jetten, V.; Kumar, K.V. Segment Optimization and Data-Driven Thresholding for Knowledge-Based Landslide Detection by Object-Based Image Analysis. IEEE Trans. Geosci. Remote Sens. 2011, 49, 4928–4943. [Google Scholar] [CrossRef]
  17. Ziou, D.; Tabbone, S. Edge Detection Techniques-An Overview. Pattern Recognit. Image Anal. Adv. Math. Theory Appl. 1998, 8, 537–559. [Google Scholar]
  18. Wang, F.; Wu, E.; Chen, S.; Wu, H. Texture Feature Extraction and Morphological Analysis of Landslide Based on Image Edge Detection. Math. Probl. Eng. 2022, 2022, 2302271. [Google Scholar] [CrossRef]
  19. Mehnert, A.; Jackway, P. An improved seeded region growing algorithm. Pattern Recognit. Lett. 1997, 18, 1065–1071. [Google Scholar]
  20. Beheshtifar, S. Identification of landslide-prone zones using a GIS-based multi-criteria decision analysis and region-growing algorithm in uncertain conditions. Nat. Hazards 2023, 115, 1475–1497. [Google Scholar] [CrossRef]
  21. Otsu, N. A Threshold Selection Method from Gray-Level Histograms. Automatica 1975, 11, 23–27. [Google Scholar] [CrossRef]
  22. Canny, J. A Computational Approach to Edge Detection. IEEE Trans. Pattern Anal. Mach. Intell. 1986, 6, 679–698. [Google Scholar] [CrossRef]
  23. Adams, R.; Bischof, L. Seeded region growing. IEEE Trans. Pattern Anal. Mach. Intell. 1994, 16, 641–647. [Google Scholar]
  24. Zhong, C.; Liu, Y.; Gao, P.; Chen, W.; Li, H.; Hou, Y.; Nuremanguli, T.; Ma, H. Landslide mapping with remote sensing: Challenges and opportunities. Int. J. Remote Sens. 2020, 41, 1555–1581. [Google Scholar] [CrossRef]
  25. Huang, Y.; Zhao, L. Review on landslide susceptibility mapping using support vector machines. Catena 2018, 165, 520–529. [Google Scholar] [CrossRef]
  26. Chen, W.; Xie, X.; Wang, J.; Pradhan, B.; Hong, H.; Bui, D.T.; Duan, Z.; Ma, J. A comparative study of logistic model tree, random forest, and classification and regression tree models for spatial prediction of landslide susceptibility. Catena 2017, 151, 147–160. [Google Scholar] [CrossRef]
  27. Plank, S.; Twele, A.; Martinis, S. Landslide Mapping in Vegetated Areas Using Change Detection Based on Optical and Polarimetric SAR Data. Remote Sens. 2016, 8, 307. [Google Scholar] [CrossRef]
  28. Dai, F.C.; Lee, C.F. Terrain-based mapping of landslide susceptibility using a geographical information system: A case study. Can. Geotech. J. 2001, 38, 911–923. [Google Scholar] [CrossRef]
  29. Zhang, Q.; Wang, T. Deep Learning for Exploring Landslides with Remote Sens. and Geo-Environmental Data: Frameworks, Progress, Challenges, and Opportunities. Remote Sens. 2024, 16, 1344. [Google Scholar] [CrossRef]
  30. Shi, W.; Zhang, M.; Ke, H.; Fang, X.; Zhan, Z.; Chen, S. Landslide Recognition by Deep Convolutional Neural Network and Change Detection. IEEE Trans. Geosci. Remote Sens. 2020, 59, 4654–4672. [Google Scholar] [CrossRef]
  31. Ronneberger, O.; Fischer, P.; Brox, T. U-Net: Convolutional Networks for Biomedical Image Segmentation. In Proceedings of the 18th International Conference Medical Image Computing and Computer-Assisted Intervention, Munich, Germany, 5–9 October 2015; Springer: Berlin/Heidelberg, Germany, 2015; pp. 234–241. [Google Scholar]
  32. Zhou, Z.; Rahman Siddiquee, M.M.; Tajbakhsh, N.; Liang, J. UNet++: A Nested U-Net Architecture for Medical Image Segmentation. In Proceedings of the Deep Learning in Medical Image Analysis and Multimodal Learning for Clinical Decision Support, Granada, Spain, 20 September 2018; pp. 3–11. [Google Scholar]
  33. Du, G.; Cao, X.; Liang, J.; Chen, X.; Zhan, Y. Medical Image Segmentation based on U-Net: A Review. J. Imaging Sci. Technol. 2020, 64, 2. [Google Scholar]
  34. Gy, X.; Li, S.; Ren, S.; Zheng, H.; Fan, C.; Xu, H. Adaptive enhanced swin transformer with U-net for remote sensing image segmentation. Comput. Electr. Eng. 2022, 102, 108223. [Google Scholar] [CrossRef]
  35. Chen, H.; He, Y.; Zhang, L.; Yao, S.; Yang, W.; Fang, Y.; Liu, Y.; Gao, B. A landslide extraction method of channel attention mechanism U-Net network based on Sentinel-2A Remote Sens. images. Int. J. Digit. Earth 2023, 16, 552–577. [Google Scholar] [CrossRef]
  36. Wang, J.; Zhang, Q.; Xie, H.; Chen, Y.; Sun, R. Enhanced Dual-Channel Model-Based with Improved Unet++ Network for Landslide Monitoring and Region Extraction in Remote Sens. Images. Remote Sens. 2024, 16, 2990. [Google Scholar] [CrossRef]
  37. Dong, Z.; An, S.; Zhang, J.; Yu, J.; Li, J.; Xu, D. L-Unet: A Landslide Extraction Model Using Multi-Scale Feature Fusion and Attention Mechanism. Remote Sens. 2022, 14, 2552. [Google Scholar] [CrossRef]
  38. Zhao, H.; Shi, J.; Qi, X.; Wang, X.; Jia, J. Pyramid scene parsing network. In Proceedings of the IEEE Conference on Computer Vision and Pattern Recognition, Honolulu, HI, USA, 21–26 July 2017; pp. 2881–2890. [Google Scholar] [CrossRef]
  39. Chen, L.; Zhu, Y.; Papandreou, G.; Schroff, F.; Adam, H. Encoder-Decoder with Atrous Separable Convolution for Semantic Image Segmentation. In Proceedings of the European Conference on Computer Vision (ECCV), Munich, Germany, 8–14 September 2018; pp. 801–818. [Google Scholar] [CrossRef]
  40. Li, Z.; Guo, Y. Semantic segmentation of landslide images in Nyingchi region based on PSPNet network. In Proceedings of the 2020 7th International Conference on Information Science and Control Engineering (ICISCE), Changsha, China, 18–20 December 2020; pp. 1269–1273. [Google Scholar] [CrossRef]
  41. Gao, O.; Niu, C.; Liu, W.; Li, T.; Zhang, H.; Hu, Q. E-DeepLabV3+: A Landslide Detection Method for Remote Sensing Images. In Proceedings of the 2022 IEEE 10th Joint International Information Technology and Artificial Intelligence Conference (ITAIC), Chongqing, China, 17–19 June 2022; pp. 573–577. [Google Scholar] [CrossRef]
  42. Ghobadi, F.; Yaseen, Z.M.; Kang, D. Long-term streamflow forecasting in data-scarce regions: Insightful investigation for leveraging satellite-derived data, Informer architecture, and concurrent fine-tuning transfer learning. J. Hydrol. 2024, 631, 130772. [Google Scholar] [CrossRef]
  43. Huang, S.; Li, Q.; Li, J.; Lu, J. 4RATFNet: Four-Dimensional Residual-Attention Improved-Transfer Few-Shot Semantic Segmentation Network for Landslide Detection. In Proceedings of the Computer Graphics International Conference, Shanghai, China, 28 August–1 September 2023; pp. 65–77. [Google Scholar] [CrossRef]
  44. Liu, Z.; Wang, Y.; Vaidya, S.; Ruehle, F.; Halverson, J.; Soljačić, M.; Hou, T.Y.; Tegmark, M. KAN: Kolmogorov-Arnold Networks. arXiv 2024, arXiv:2404.19756. [Google Scholar]
  45. Li, C.; Liu, X.; Li, W.; Wang, C.; Liu, H.; Liu, Y.; Chen, Z.; Yuan, Y. U-KAN Makes Strong Backbone for Medical Image Segmentation and Generation. arXiv 2024, arXiv:2406.02918. [Google Scholar]
  46. Zhou, N.; Hong, J.; Cui, W.; Wu, S.; Zhang, Z. A Multiscale Attention Segment Network-Based Semantic Segmentation Model for Landslide Remote Sens. Images. Remote Sens. 2024, 16, 1712. [Google Scholar] [CrossRef]
  47. Hou, C.; Yu, J.; Ge, D.; Yang, L.; Xi, L.; Pang, Y.; Wen, Y. TransLandSeg: A Transfer Learning Approach for Landslide Semantic Segmentation Based on Vision Foundation Model. arXiv 2024, arXiv:2403.10127. [Google Scholar] [CrossRef]
  48. Chen, Y.; Shi, H.; Liu, X.; Shi, T.; Zhang, R.; Liu, D.; Xiong, Z.; Wu, F. TokenUnify: Scalable Autoregressive Visual Pre-training with Mixture Token Prediction. arXiv 2024, arXiv:2405.16847. [Google Scholar]
  49. Cao, J.; Li, Y.; Sun, M.; Chen, Y.; Lischinski, D.; Cohen-Or, D.; Chen, B.; Tu, C. DO-Conv: Depthwise Over-Parameterized Convolutional Layer. IEEE Trans. Image Process. 2022, 31, 3726–3736. [Google Scholar] [CrossRef] [PubMed]
  50. Ba, J.L.; Kiros, J.R.; Hinton, G.E. Layer Normalization. arXiv 2016, arXiv:1607.06450. [Google Scholar]
  51. Li, Y.; Hou, Q.; Zheng, Z.; Cheng, M.-M.; Yang, J.; Li, X. Large Selective Kernel Network for Remote Sensing Object Detection. In Proceedings of the IEEE/CVF International Conference on Computer Vision, Paris, France, 1–6 October 2023; pp. 16794–16805. [Google Scholar] [CrossRef]
  52. Yosinski, J.; Clune, J.; Bengio, Y.; Lipson, H. How transferable are features in deep neural networks? Adv. Neural Inf. Process. Syst. 2014, 27, 964. [Google Scholar]
  53. Pires, L.; Marfurt, K. Convolutional neural network for remote-sensing scene classification: Transfer learning analysis. Remote Sens. 2019, 12, 86. [Google Scholar] [CrossRef]
  54. Shao, Z.; Yang, K.; Zhou, W. Performance Evaluation of Single-Label and Multi-Label Remote Sens. Image Retrieval Using a Dense Labeling Dataset. Remote Sens. 2018, 10, 964. [Google Scholar] [CrossRef]
  55. Chaudhuri, B.; Demir, B.; Chaudhuri, S.; Bruzzone, L. Multilabel Remote Sens. Image Retrieval Using a Semisupervised Graph-Theoretic Method. IEEE Trans. Geosci. Remote Sens. 2017, 56, 1144–1158. [Google Scholar] [CrossRef]
  56. Landslide Segmentation. Available online: https://www.kaggle.com/datasets/niyarrbarman/landslide-divided (accessed on 3 October 2024).
Figure 1. Architecture of the proposed LKN-UKAN network. The network consists of two main components: (1) the Tok-KAN (highlighted in grayish green), which enhances nonlinear feature modeling, and (2) the DLFFSKA module (highlighted in blue), which improves global perception through multi-scale feature fusion.
Applsci 15 03855 g001
Figure 2. Schematic diagram of Tok-KAN and KAN layer structure in Tok-KAN.
Applsci 15 03855 g002
Figure 3. Structure of the DLFFSKA module. The blue rectangles represent Conv2d layers with kernel sizes of 5, 7, and 9. The blue cube illustrates the convolutional prediction results of the current step in the model. The yellow rectangles indicate different pooling methods. The deep pink rectangle labeled “Concat+Conv” denotes the operation where the input first undergoes a Concat operation, followed by a Conv2d operation with a 1 × 1 kernel.
Applsci 15 03855 g003
Figure 4. Schematic of FTTL. The ellipse represents the input dataset, the rectangle denotes the model trained on the dataset, and the cylinder signifies the target task. The pink arrows illustrate the process of FTTL.
Applsci 15 03855 g004
Figure 5. Basic model dataset DLRSD-Expand. In GT, the black areas denote non-target regions, while the white areas indicate the target regions (soil).
Applsci 15 03855 g005
Figure 6. Target model dataset Landslide-Expand. In GT, the black areas denote non-target regions, while the white areas indicate the target regions (landslide).
Applsci 15 03855 g006
Figure 7. The IoU and epoch variation curves of two datasets during the Tok-KAN ablation experiment.
Applsci 15 03855 g007
Figure 8. Heatmap of DLFFSKA ablation experiment. Image = orgin image; GT = ground truth. (A) Add Tok-KAN to U-Net++. (B) Add Tok-KAN and LSK to U-Net++. (C) Add Tok-KAN and DLFFSKA ( α = 0.25, β = 0.75) to U-Net++. (D) Add Tok-KAN and DLFFSKA ( α = 0.5, β = 0.5) to U-Net++. (E) Add Tok-KAN and DLFFSKA ( α = 0.75, β = 0.25) to U-Net++.
Applsci 15 03855 g008
Figure 9. The IoU and epoch variation curves of the target dataset during the FTTL ablation experiment.
Applsci 15 03855 g009
Figure 10. Visualization results of ablation experiments using different methods. E1 = U-Net++; E2 = U-Net++ add Tok-KAN; E3 = U-Net++ add DLFFSKA; E4 = U-Net++ add Tok-KAN and DLFFSKA (LAN-UKAN); E5 = U-Net++ with FTTL; Ours = LAN-UKAN with FTTL.
Applsci 15 03855 g010
Figure 11. Visualization results of comparative experiments of different segmentation algorithms. (top) Ours; LAN-UKAN with FTTL. (left) (a) Concentrated landslide areas, (b) relatively concentrated landslide areas with fractures, (c) fragmented and dispersed landslide areas, (d) dispersed landslide areas, and (e) complex interleaving of landslide and non-landslide areas.
Applsci 15 03855 g011
Table 1. Data augmentation parameters.
MethodConfiguration
Brightness2
Rotate−135
TransposeFLIP_TOP_BOTTOM
Table 2. Confusion matrix.
Positive SampleNegative Sample
Forecast positiveTPFP
Forecast negativeTNFN
Table 3. Experimental environment set-up.
PlatformConfiguration
Operating SystemUbuntu 20.04
IDEPycharm
Scripting LanguagePython 3.10.11
Frameworktorch-2.0.0+cu118
CPUIntel Xeon silver 4210R
GPUNVIDIA RTX 4500 (20 G)
RAM128 G
Table 4. Model training hyperparameters.
Super ParameterConfiguration
OptimizerSGD
Momentum0.9
Learning rate0.001
Weight decay0.0001
Table 5. Model training hyperparameters.
DatasetEpoch
DLRSD-Expand1000
Landslide-Expand300
Table 6. Tok-KAN ablation experiment results.
DatasetMethodIoU (%) ↑R (%) ↑P (%) ↑F1 (%) ↑Loss ↓Params (M) ↓
DLRSD-
Expand
U-KAN70.3381.6080.7881.190.32822.36
U-Net++71.3782.8081.5582.170.31467.07
U-Net++ add Tok-KAN72.5582.7883.1382.940.29956.28
Landslide-
Expand
U-KAN57.7872.6371.7872.200.34022.36
U-Net++57.8872.0272.2672.140.33887.07
U-Net++ add Tok-KAN57.9272.6372.0372.320.34026.28
Table 7. Comparison between LSK and DLFFSKA modules.
DatasetMethodIoU (%) ↑R (%) ↑P (%) ↑F1 (%) ↑Loss ↓Params (M) ↓
DLRSD-
Expand
Tok-KAN72.5582.7883.1382.940.29956.28
Tok-KAN and LSK72.7783.2682.9383.100.29566.35
Tok-KAN and DLFFSKA76.5885.6185.9085.760.24986.38
Landslide-
Expand
Tok-KAN57.9272.6372.0372.320.34026.28
Tok-KAN and LSK58.0171.9172.2872.090.33956.35
Tok-KAN and DLFFSKA59.6273.1874.0973.630.32126.38
Table 8. Comparison of different feature weights.
DatasetMethodIoU (%) ↑F1 (%) ↑Loss ↓
DLRSD-
Expand
add LSK72.7783.100.2956
add DLFFSKA ( α = 0.25, β = 0.75)72.6983.110.2972
add DLFFSKA ( α = 0.5, β = 0.5)76.5885.760.2498
add DLFFSKA ( α = 0.75, β = 0.25)73.9983.940.2797
Landslide-
Expand
add LSK58.0172.090.3395
add DLFFSKA ( α = 0.25, β = 0.75)58.0972.330.3406
add DLFFSKA ( α = 0.5, β = 0.5)59.6273.630.3212
add DLFFSKA ( α = 0.75, β = 0.25)59.4773.430.3233
Table 9. Comparison of different feature weights.
MethodIoU (%) ↑R (%) ↑P (%) ↑F1 (%) ↑Loss ↓Params (M) ↓BatchTime (S) ↓
not FTTL59.6273.1874.0973.630.32126.38123
not frozen70.0078.0383.2580.560.02836.38114
freeze the L 1 67.5877.0680.5178.740.03246.38105
freeze the L 1 and L 2 62.4973.1577.0575.050.03826.38100
Table 10. Comparison of different feature weights.
MethodIoU (%) ↑R (%) ↑P (%) ↑F1 (%) ↑Loss ↓Params (M) ↓
U-Net++57.8872.0272.2672.140.33887.07
U-Net++ add Tok-KAN57.9272.6372.0372.320.34026.28
U-Net++ add DLFFSKA58.1973.4971.3672.410.34077.17
U-Net++ add Tok-KAN and DLFFSKA59.6273.1874.0973.630.32126.38
U-Net++ with FTTL64.8676.2977.3676.820.03437.07
Ours70.0078.0383.2580.560.02836.38
Table 11. Comparison of different feature weights.
MethodIoU (%) ↑R (%) ↑P (%) ↑F1 (%) ↑Loss ↓Params (M) ↓
PSPNet30.7834.8269.1346.310.060816.67
Deeplabv3+47.4763.8766.3665.090.241513.47
U-Net46.3562.7662.3762.560.48253.12
U-KAN57.7872.6371.7872.200.34022.36
U-Net++57.8872.0272.2672.140.33887.07
TransLandSeg62.9773.9677.2775.580.31074.18
U-Net++ with FTTL64.8676.2977.3676.820.03437.07
Ours70.0078.0383.2580.560.02836.38
Disclaimer/Publisher’s Note: The statements, opinions and data contained in all publications are solely those of the individual author(s) and contributor(s) and not of MDPI and/or the editor(s). MDPI and/or the editor(s) disclaim responsibility for any injury to people or property resulting from any ideas, methods, instructions or products referred to in the content.

