Article

A Comparative Analysis of IMUs and Optical Systems in Layup Shot Biomechanics

School of Sport, Exercise and Health Sciences, Loughborough University, Loughborough LE11 3TU, UK
*
Author to whom correspondence should be addressed.
Appl. Sci. 2025, 15(7), 3847; https://doi.org/10.3390/app15073847
Submission received: 31 January 2025 / Revised: 27 March 2025 / Accepted: 27 March 2025 / Published: 1 April 2025
(This article belongs to the Special Issue Advances in Sport and Exercise Biomechanics)

Abstract

:
The purpose of this study was to assess the validity and reliability of an inertial measurement unit (IMU) system against an optical motion capture system in detecting motion in the dynamically complex and constraint-governed task of the basketball layup shot. Ten basketball players performed 10 trials with and 10 without a defender. Key kinematic variables (jump height, take-off angle, joint angles, and centre of mass (COM) displacement) were derived, and agreement (intraclass correlation coefficient (ICC) and Bland–Altman plots) and disagreement (root mean square difference (RMSD) and statistical parametric mapping (SPM)) calculations were carried out for each trial. The IMU system provided agreeable results for jump height and take-off angle, while joint angles and COM displacement agreement were plane-specific. A between-condition analysis demonstrated the IMU system reliably detected joint angle differences between defended and undefended conditions comparable to the optical system for nine out of twelve joint angles, with shoulder flexion-extension and external-internal and elbow external-internal joint angles showing inconclusive results. Ultimately, the IMU system was generally able to detect similar magnitudes of difference between conditions to those detected by the optical motion-based system. Therefore, conclusions can be drawn for between-condition comparisons if data are derived from either system.

1. Introduction

Experimental biomechanics studies commonly utilise optical motion capture technologies in controlled laboratory settings. However, a significant limitation of such studies is their confinement to small capture volumes [1] and the elimination of sport-specific environmental contexts [2]. These constraints hinder the ecological validity of biomechanical research, making it challenging to generalise findings to real-world scenarios.
Inertial measurement units (IMUs) offer a promising solution to some of the main drawbacks associated with optical motion capture systems. Unlike optical systems, IMUs are portable, lightweight, and capable of capturing motion data in varied and less restrictive environments [3]. Their flexibility in terms of capture location and volume makes them particularly appealing for biomechanical studies conducted in real world environments. The portability of IMU-based systems, such as Xsens, has driven increasing interest in their use for analysing complex and dynamic movements [4]. However, despite the advantages of IMUs, optical motion capture systems (e.g., Vicon) remain the gold standard in biomechanics research, offering superior data quality and established validity and reliability [5].
Recent systematic reviews have highlighted inherent limitations of current IMUs, such as calibration error, magnetic field disturbance, and sensor bias [6]; however, their accuracy has been shown to be comparable to optical motion capture systems under certain conditions [7]. Studies on Xsens performance during walking and running demonstrated generally acceptable root mean square differences (RMSD) in joint angles: 3.2° ± 1.5 for knee flexion-extension and 4.5° ± 1.8 for ankle dorsi-plantarflexion joint angles. However, larger differences were noted for the hip flexion-extension joint angles (10.1° ± 5.6), with abduction-adduction and external-internal joint angles performing better for the hip but worse for the knee and ankle joints. These differences likely arise from differences in participant calibration and marker placement procedures [8,9,10]. The validity of IMUs for upper limb kinematics was investigated in comparison to optical motion capture, predominantly in controlled, low-range motion tasks [11]. In a simulated surgical training task, where movement complexity and joint ranges of motion were considerably lower than those observed in dynamic sports performance, IMUs demonstrated accuracy within 2.9 ± 0.9° for neck flexion/extension and 1.6 ± 1.1° for trunk flexion/extension. However, larger discrepancies were observed in shoulder elevation (6.8 ± 2.7°) and elbow flexion (8.2 ± 2.8°), highlighting potential limitations when applied to higher-velocity, multi-planar movements typical of sport-specific tasks. While IMUs are increasingly used in sports biomechanics, their application in dynamic, sport-specific contexts requiring multi-planar lower and upper body tracking, like basketball, require further assessment. One key area of importance is the movement of the arms above shoulder level during a layup shot, which involves complex, high-velocity, and multi-planar motion requiring large joint ranges of motion and rotational velocities. This movement exceeds the typical range assessed in prior studies, making it essential to address the utility of IMUs for evaluating dynamic, overhead movements in basketball and other sports.
Most reliability studies on IMUs have focused on simple planar movements of basic locomotor tasks [3]. In basketball, IMU applications have primarily been limited to activity classification for athlete performance monitoring rather than detailed kinematic analysis [12]. Studies on jump shots [13] have examined relatively constrained upper body movements where the shoulder and elbow remain within moderate ranges of motion compared to the more dynamic layup shot. In contrast, complex motor tasks such as the basketball layup pose unique challenges due to their context-driven nature, where movement execution is heavily influenced by external factors such as defensive pressure and spatial constraints [14]. Context-driven performance in basketball is defined by interactions with the surrounding environment, including opponents, teammates, and situational demands [15]. Defensive conditions are particularly important, as they directly affect the demands and movement variability of the layup [16]. For example, when a defender is present, athletes often modify their approach, jump height, and release angle to optimise success while avoiding a block, introducing variability that may not be observed in undefended trials [17]. Thus, analysis of the layup requires an ecologically valid environment, which IMUs are good for, but they may be less effective at accurately tracking multiplanar motion of the upper and lower body.
To have confidence in using IMUs for the analysis of a layup, the ability for IMUs to accurately and consistently measure more complex whole-body tasks needs to be established. Although accuracy of measurement is typically key for biomechanical analyses, there are also questions that can be answered if the data are precise and have sufficient resolution to detect changes between conditions, a question not typically addressed previously by studies assessing IMUs’ accuracy. Studying changes in technique with changing environmental constraints is one such area where sufficient resolution and precision can be useful even if absolute accuracy is poor.
The purpose of this study was to examine the agreement between an Xsens system and a Vicon system for analysing the basketball layup shot and to determine whether the Xsens system had the ability to detect similar magnitudes of changes in technique under different constraints to Vicon. The present study incorporated both defended and undefended trials to evaluate the performance of IMUs across a spectrum of contextual variability representative of game scenarios. By examining the systems under varying external constraints, the study sought to determine the reliability of IMUs in capturing biomechanical adaptations associated with environmental and task-specific demands. This approach enhances the ecological validity of the findings and contributes to the growing body of research emphasizing the importance of representative task design in sports science [18]. It was hypothesised that the IMU system would demonstrate high accuracy in measuring flexion-extension joint angles during basketball layup shots. Additionally, it was hypothesised that the IMU system would reliably detect technique changes under varying defensive constraints and exhibit similar sensitivity to Vicon in identifying condition-based kinematic adjustments.

2. Materials and Methods

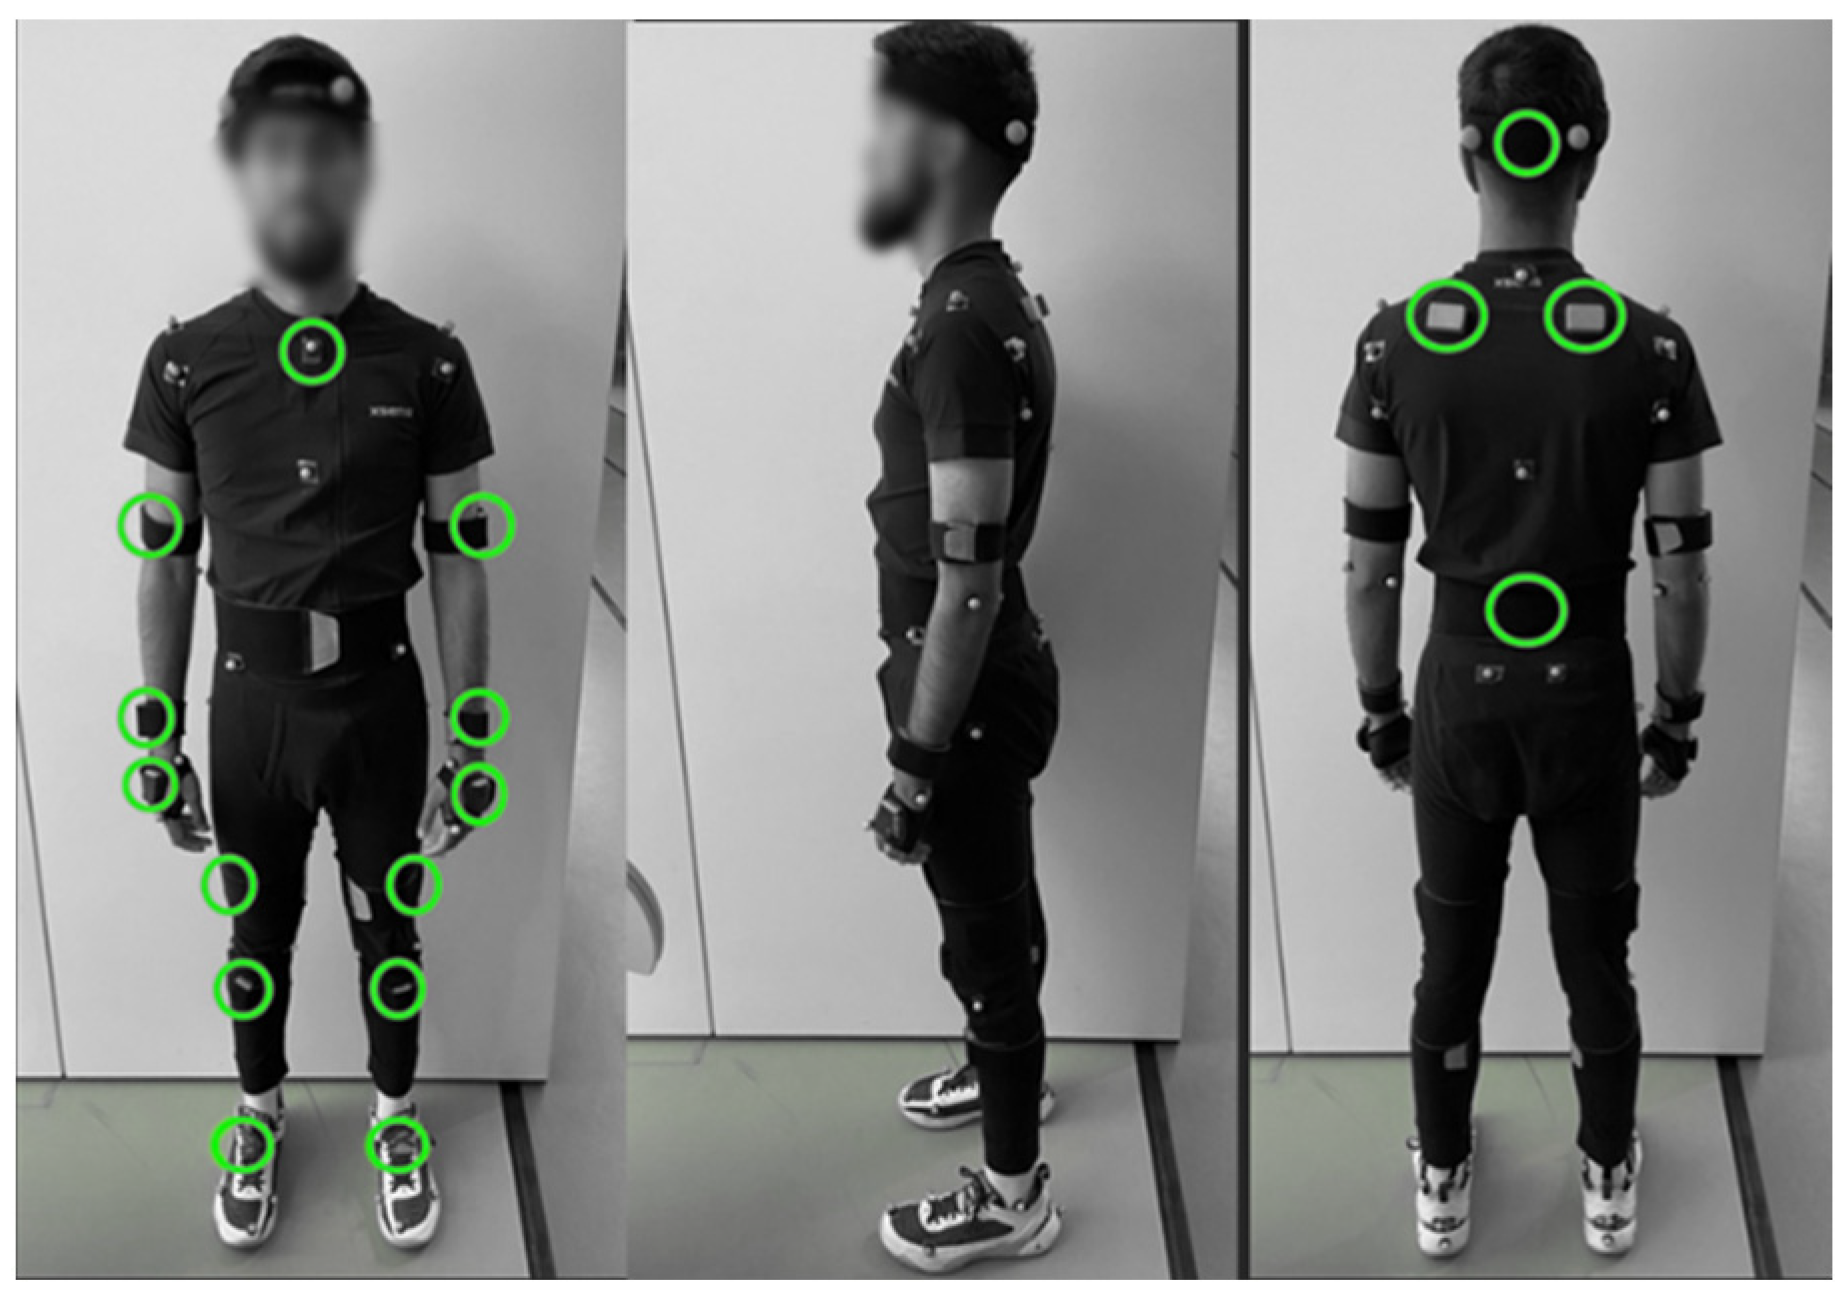
2.1. Participant and Equipment

Ten basketball players of recreational to university-level skill, six males and four females (age = 23.8 ± 3.19 years, height = 1.72 ± 0.10 m, body mass = 70.43 ± 9.29 kg), took part after providing informed consent in line with the university ethical approval granted for the study. Seventeen Xsens (Xsens Technologies B.V., Enschede, The Netherlands) sensors (weight: 16 g, dimensions: 47 × 30 × 13 mm) sampling at 60 Hz were affixed to 14 body segments. Concurrently, 52 reflective markers (diameter 14 mm) were attached to the participants according to a custom marker set model. This model incorporated Vicon’s (Vicon Motion Systems Ltd., Oxford, UK) plug-in gait markers along with additional markers placed distally on the middle finger, the distal ends of the second and fifth metacarpal bones, and one marker positioned inferior to the shoulder joint to accurately capture joint angle positions at 180° (Figure 1). The markers were tracked by eighteen T40/T20 Vicon cameras (Vicon Motion Systems Ltd., Oxford, UK) recording at a frequency of 240 Hz over a capture volume of approximately 4 × 8 × 3.5 m. A standard regulation basketball hoop (rim height = 3.05 m, rim diameter = 0.45 m, backboard height = 0.88 m, backboard width = 1.44 m) was used for the study, along with official internationally recognised Molten BG4500 basketballs (size 7 for males, size 6 for females), which are used by the British Basketball League (BBL).

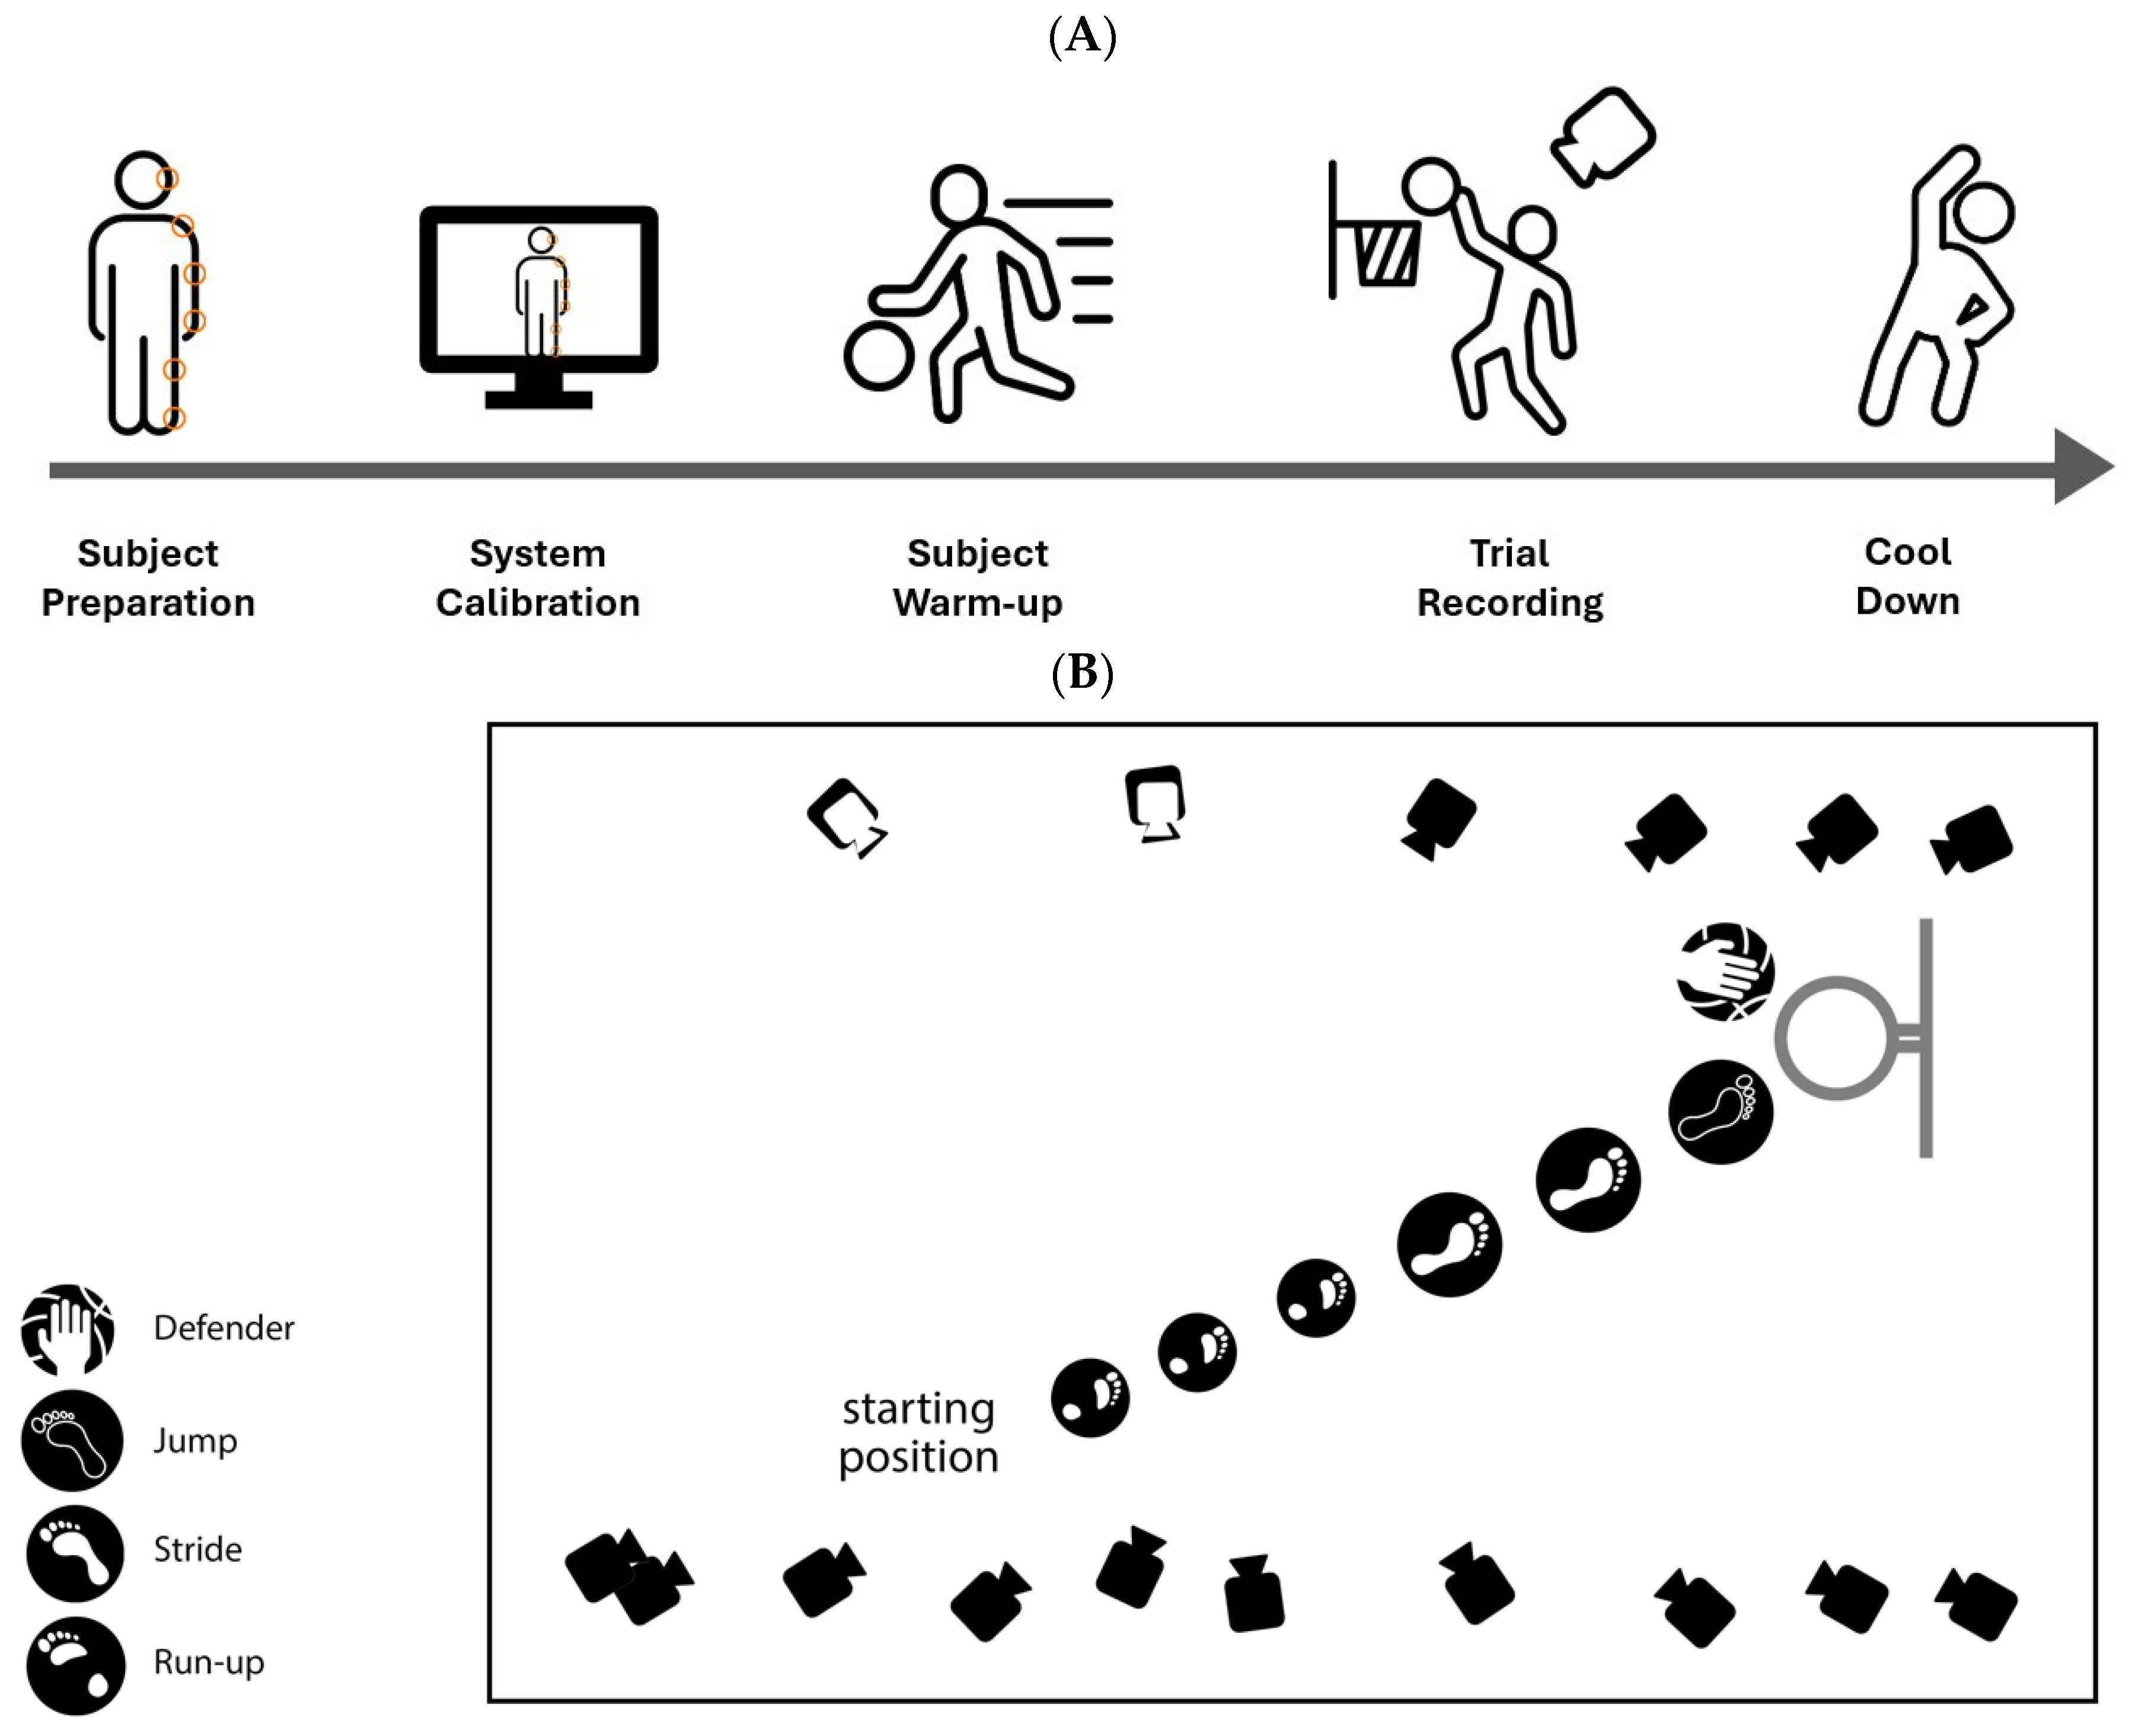
2.2. Testing Protocol

Following a dynamic self-selected warm-up and familiarization with the lab setup, participants performed a total of 20 layup shots (Figure 2A). Each shot was taken from the right at a 45° angle after running approximately 5 to 6 m towards the hoop (Figure 2B). Of these trials, 10 were defended, and 10 were undefended. Calibration procedures and relevant anthropometric measurements were undertaken for each system following the manufacturer’s guidelines prior to testing. The calibration process included both static (N-pose) and dynamic (walking) for Xsens and static (N-pose) and dynamic (walking) for Vicon. The Xsens biomechanical model was scaled using the anthropometric data (height, arm span, elbow span, shoulder and hip width and height, and knee and ankle height) collected from each participant before testing.
Defence was administered by a second experimenter using a padded wooden stick. The stick was introduced at chest height, approximately 50 cm in front of the participant’s leading shoulder, ensuring it required an in-air adjustment without obstructing natural movement. The timing and intensity of the defence were consistent across all trials, with the stick introduced at a predetermined point in the participant’s movement to maintain standardization. The hoop was positioned 2.9 m above of the defender, preserving a consistent spatial relationship between the defensive action and the layup attempt (Figure 2A). To ensure randomization, the order of whether the defence was introduced or not was randomly assigned across trials. The defence was not physically forceful but aimed to simulate typical game constraints without interfering with the participant’s ability to complete the layup.

2.3. Data Processing and Analysis

Raw marker trajectories from the Vicon system were labelled, gap-filled, and low-pass filtered at 10 Hz using a fourth-order zero-lag Butterworth filter in Nexus 2.15 (Vicon Motion Systems Ltd., Oxford, UK) as per established protocols [19]. Joint angles were constructed using Bodybuilder code, with joint angles adjusted as needed to match the Xsens’ joint angle convention. Flexion-extension, abduction-adduction, and external-internal shoulder and hip joint angles; flexion-extension and external-internal elbow and ankle; flexion-extension and ulnar-radial deviation wrist; and flexion-extension knee joint angles were then exported to MATLAB R2022b (MathWorks Inc., Nantucket, MA, USA), where further analysis was conducted. To ensure comparability, the Vicon data were down-sampled from 240 Hz to 60 Hz by retaining every fourth frame, matching the Xsens sampling rate. Xsens data underwent proprietary fusion of accelerometer, gyroscope, and magnetometer signals via the Xsens Kalman Filter [8], while the LXsolver algorithm—automatically executed by the system—applied biomechanical constraints during reconstruction to reduce soft tissue artifact and improve joint estimation. The calculated Euler angles in degrees followed the YXZ (+/−) cardan sequence, which corresponded to the medio-lateral, antero-posterior, and axial rotations, respectively.
The start of the movement was defined at the heel strike of the step preceding the layup jump (0% of the task) and the end at the instant of ground contact on landing following ball release (100% of the task) (Figure 2B). Event detection was performed manually through identifying the local minima and maxima around key foot contacts within the linear acceleration profiles of the foot and toe segments [20]. Whole-body COM location of the VICON data was computed using De Leva’s [21] anthropometric conventions to obtain 3D coordinates of the COM pathway. COM velocity, which was used to calculate resultant jump take-off angle, was obtained from the numerical differentiation of the COM position data. Jump height was calculated as the difference between COM position in the vertical direction (z) at the maximum height achieved during the jump and the COM vertical position during standing. Joint angle data and COM path data were interpolated and time-normalised to 101 points to represent 0–100% of the movement. To eliminate the inherent system offset between the joint angle COM trajectory data captured by the Vicon and Xsens systems, an adjustment process was implemented based on the method of [22]. The difference between the two traces was calculated, and the average difference was determined across all time points. The Vicon data were then adjusted by subtracting the average difference. Finally, RMSD was computed between the original Xsens data and the adjusted Vicon data to evaluate alignment accuracy.

2.4. Statistical Analysis

The normality of the data was assessed using the Anderson–Darling test (p < 0.05), confirming a normal distribution and justifying the use of parametric statistical tests. Of the 200 collected trials, 188 valid trials (94%) were retained for comparison, with 12 excluded due to errors in either system. Averages and standard deviations were computed at the participant level and combined for group-level interpretation. Root mean squared difference (RMSD), a measure of the systematic error between predicted and observed values [23], was used to compare joint angle and centre of mass (COM) displacement data between the Vicon and Xsens systems. RMSD was calculated at the trial level for each joint (shoulder, hip, elbow, wrist, knee, and ankle) across relevant movement planes as well as for COMx and COMy displacement during the run-up before the shot. RMSD values were averaged across trials for each participant and used for group-level statistical interpretation, with values ≤ 5° indicating excellent agreement and values above this threshold considered poor [24,25]. Agreement between systems was further evaluated using intraclass correlation coefficients (ICC) and Bland–Altman plots, which measure reliability and assess consistency and limits of agreement [26,27]. These measures were analysed using a paired-sample t-test (SPSS Inc., Chicago, IL, USA), which was applied to both take-off angle and jump height for between-system and between-condition comparisons. Statistical parametric mapping (SPM) was conducted using MATLAB’s spm1d package [28] to assess differences in continuous biomechanical data for both system-based (Vicon vs. Xsens) and condition-based (defended vs. undefended trials within each system) comparisons. Individual trial time traces were entered into an SPM paired-sample t-test to identify significant differences across the entire movement cycle. The statistical significance of all tests was set at α = 0.05.

3. Results

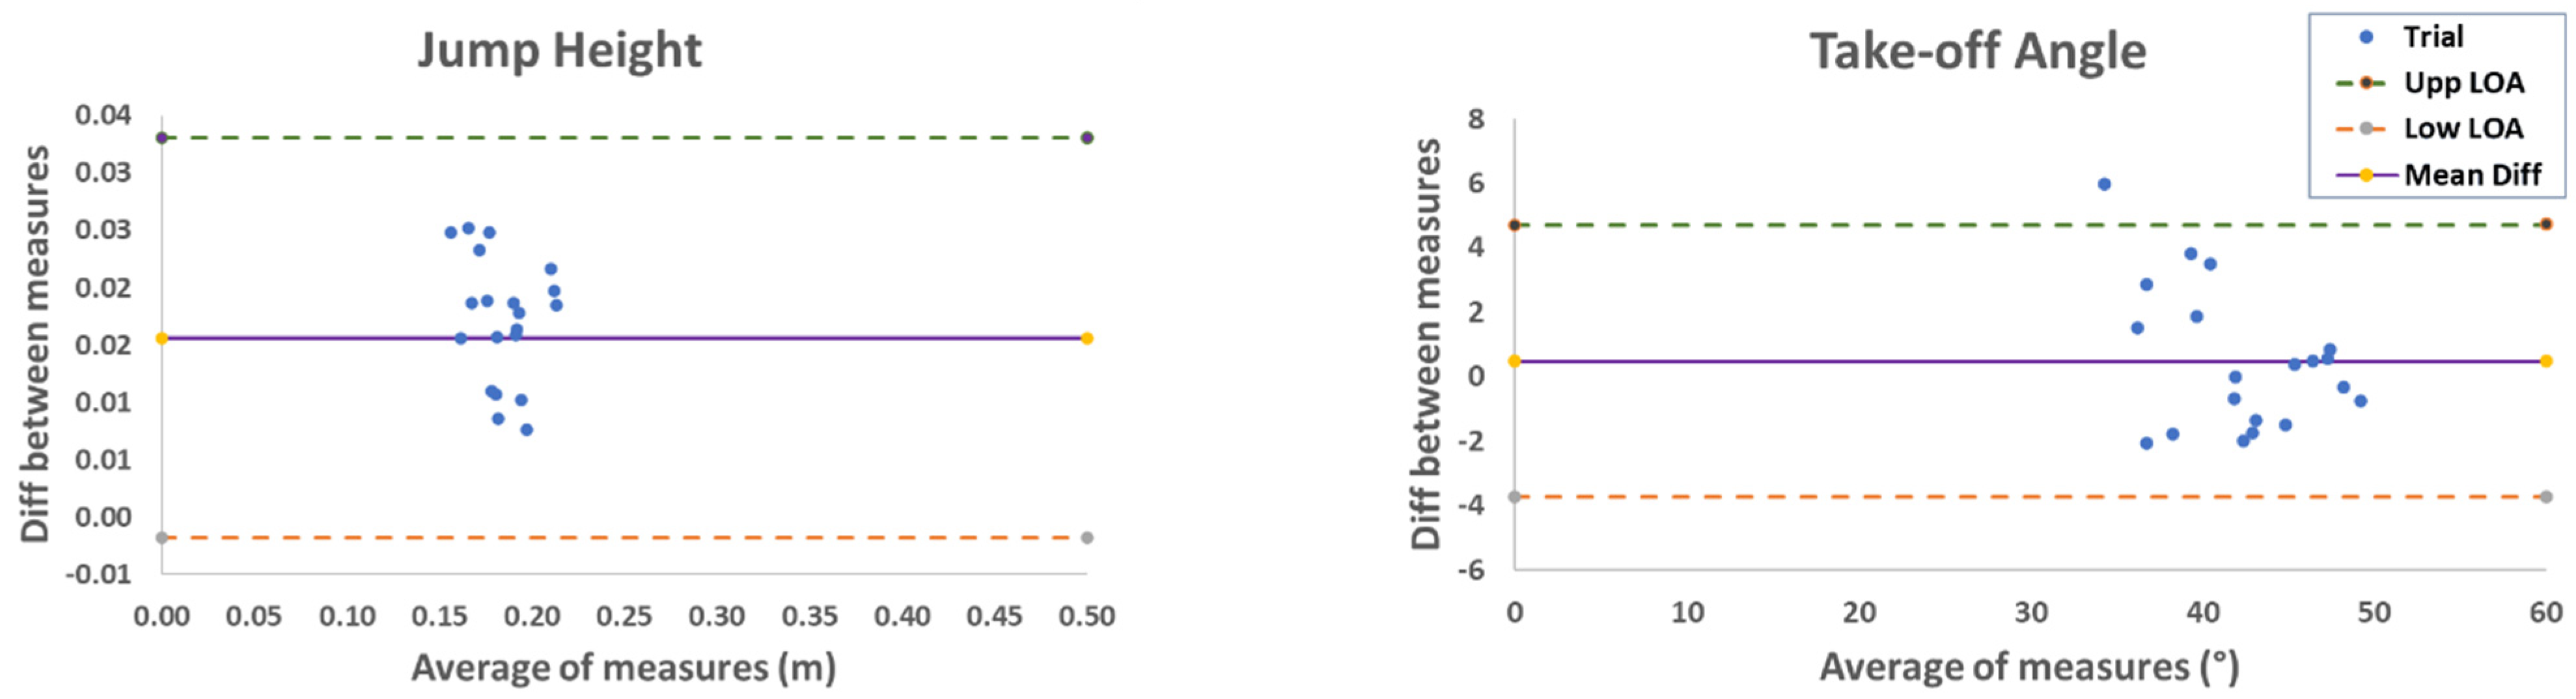
3.1. Discrete Measures

A paired-sample t-test found no significance difference in jump height and take-off angle between the two systems ((jump height (Vicon: 0.34 m (0.039), Xsens: 0.34 m (0.042), t(18) = −0.09, p ≥ 0.925, 95%CI [−0.10, 0.09]), take-off angle (Vicon: 43.47° (5.01), Xsens: 43.05° (5.17)), t(18) = 0.53, p ≥ 0.727, 95%CI [−4.52, 6.35]). Effect size analysis further confirmed the strong agreement between systems, with Cohen’s d indicating no effect for jump height (d = 0) and a negligible effect for take-off angle (d = 0.08). This was confirmed by the strong agreement in the Bland–Altman test plots (Figure 3), indicating most data points fell within the region of acceptable difference (highest agreement: 100%, lowest agreement: 90%), with the majority of participants displaying no data points falling outside the limits of acceptable disagreement range. A mean offset of 0.025 m and 1.5° was found between the two systems for jump height and take-off angle. Additionally, a paired sample t-test found no significant differences between the Vicon and Xsens systems in detecting changes between conditions (jump height: Vicon difference: 0.028 m (0.23), Xsens difference: 0.022 m (0.016), t = 1.26, p ≥ 0.238; take-off angle: Vicon difference: 2.03° (3.18), Xsens difference: 2.91° (4.48), t = −1.303, p ≥ 0.225). This result further supports the reliability of both systems in detecting these changes across conditions. Excellent reliability was found for jump height (ICC = 0.97 (95%CI: 0.89–0.99), p < 0.001) and take-off angle (ICC = 0.96 (95%CI: 0.86–0.99) p < 0.001).

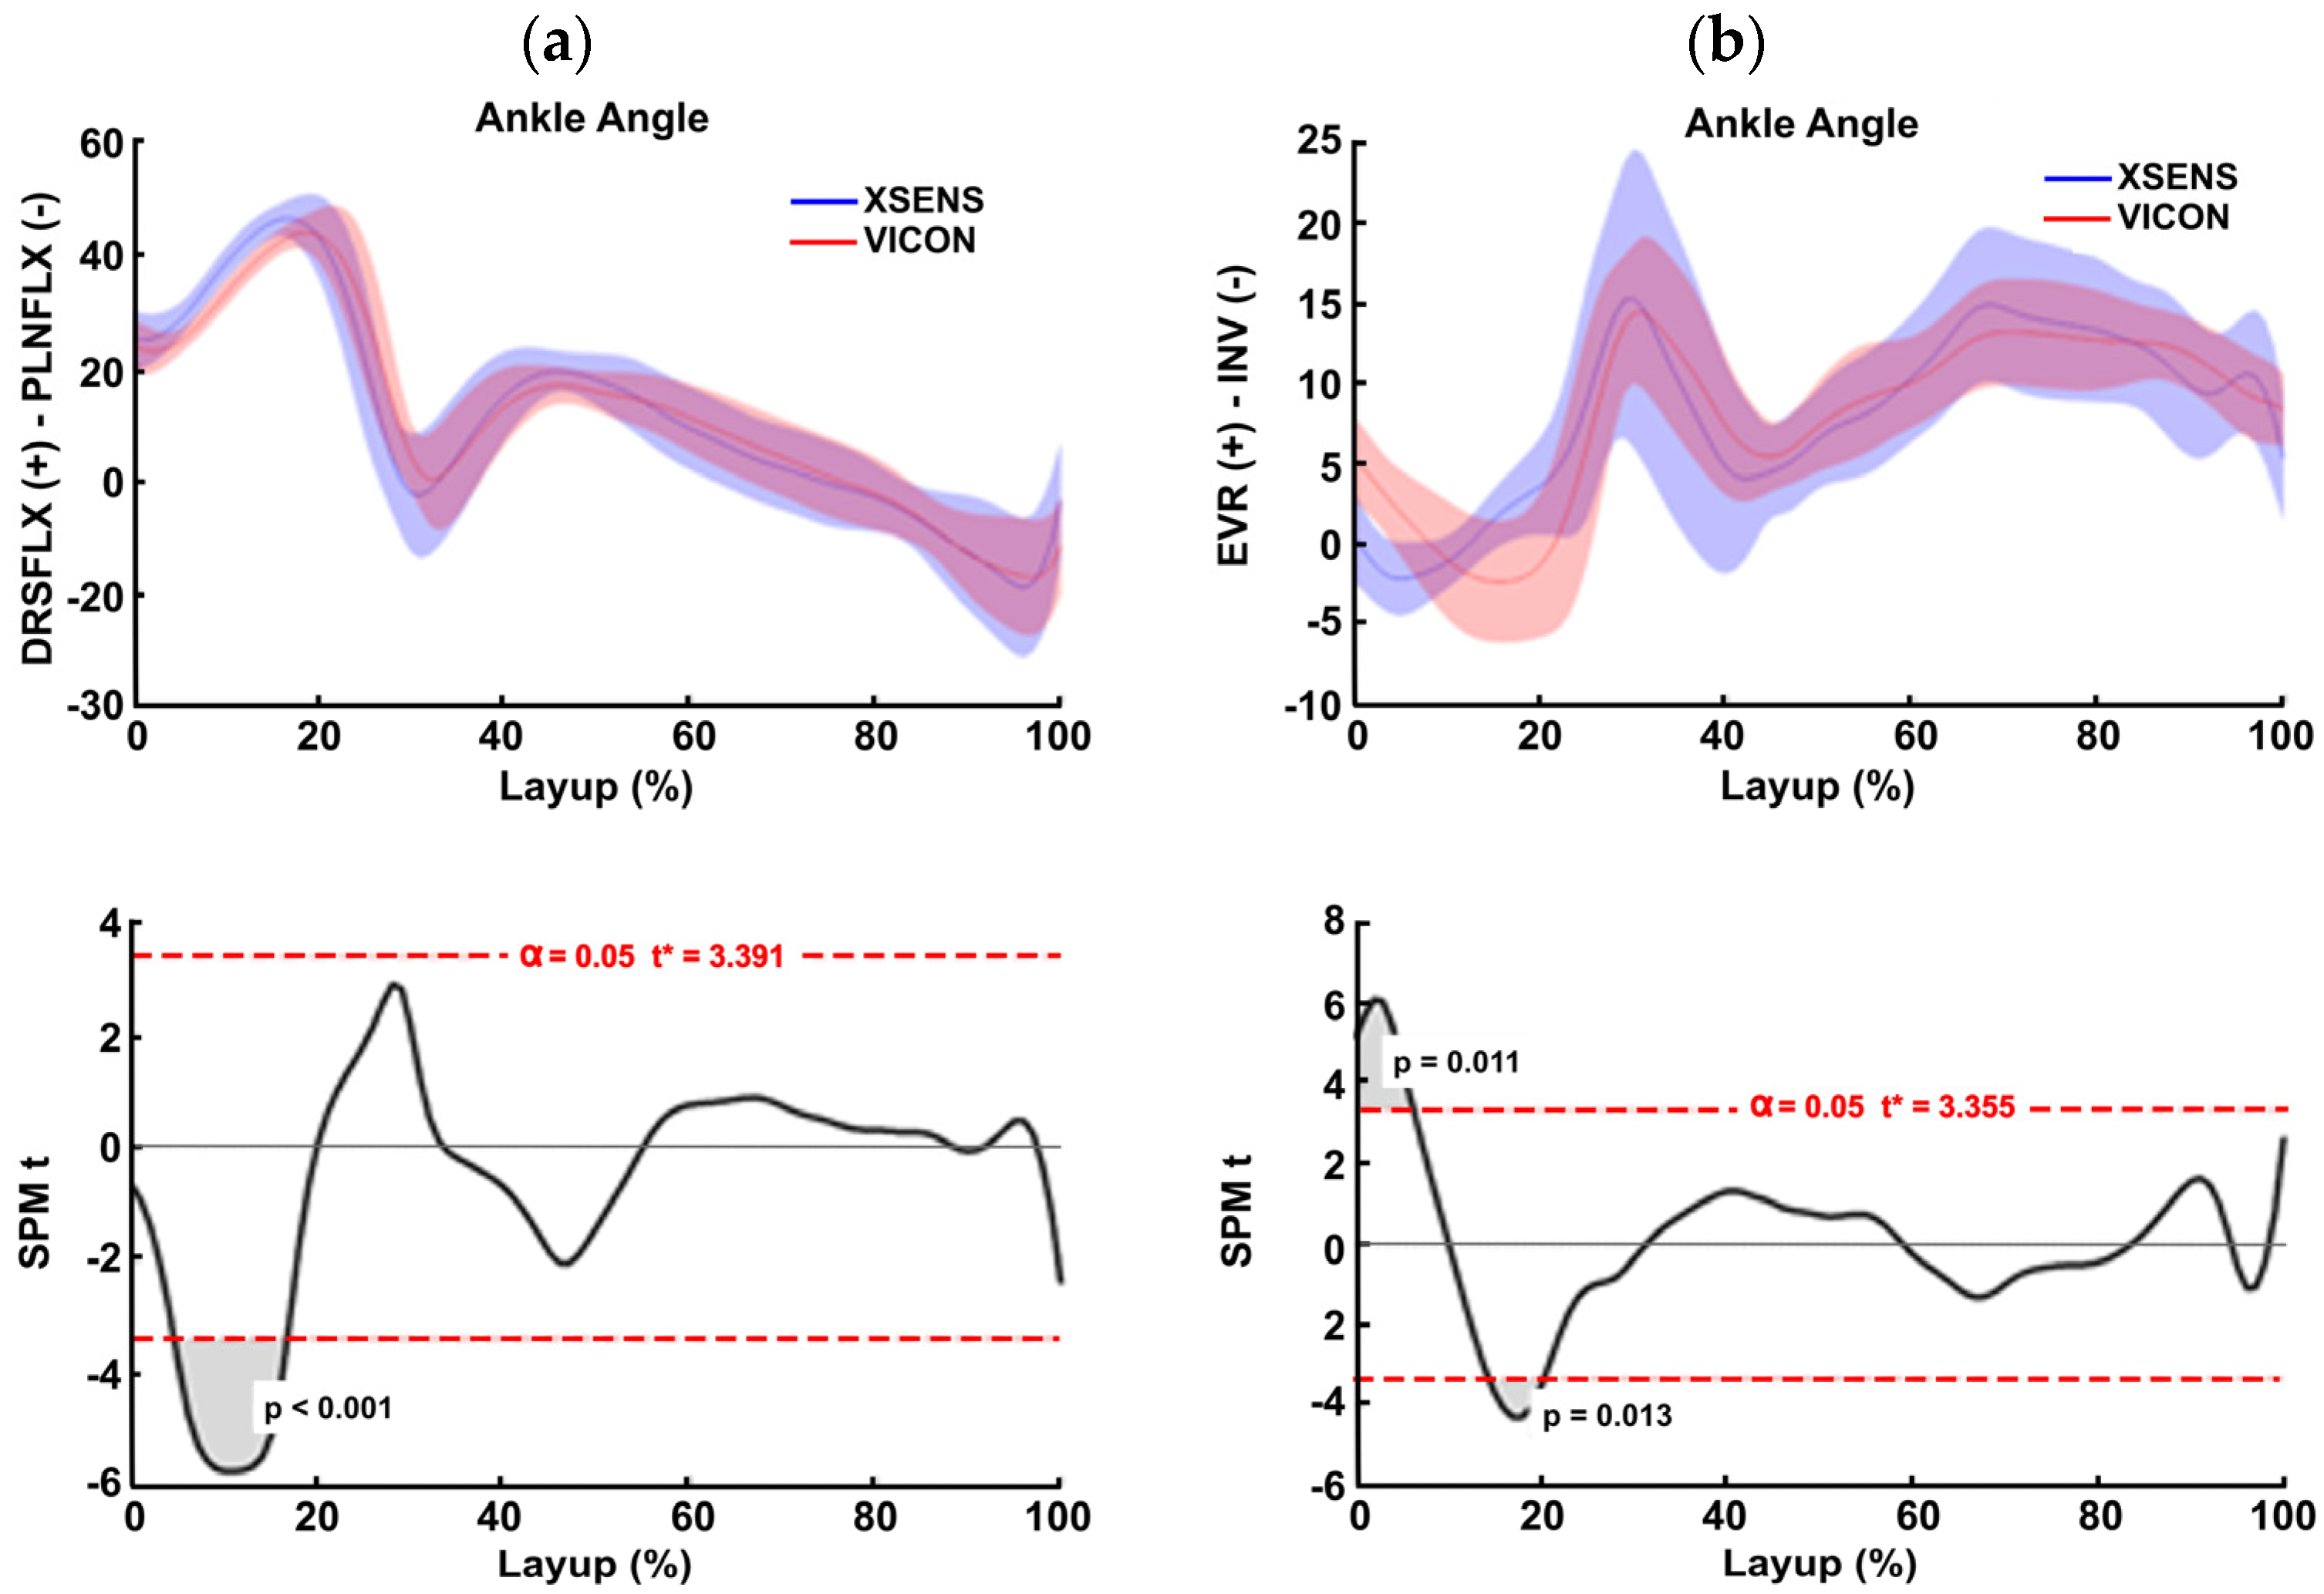
3.2. Continuous Measures

Between-system offset (RMSD) were calculated for joint angles (Table 1). Flexion-extension shoulder joint angles exhibited consistently high RMSD levels (right: 9.3°, left: 9.3°) despite trajectories showing overall consistency. Shoulder abduction-adduction and external-internal joint angles demonstrated RMSD values of 11.2° (1.22) and 12.8° (0.70) for the right shoulder abduction-adduction and external-internal joint angles and 6.9° (1.13) and 10.2° (2.81) for the left shoulder abduction-adduction and external-internal joint angles, respectively. Smaller joints, such as the wrist and ankle, exhibited lower RMSD values for flexion-extension angles (right wrist: 4.9°, left wrist: 5.1°; right ankle: 5.6°, left ankle: 6.4°) and for ulnar-radial deviation at the wrist and external-internal rotation at the ankle (right wrist: 5.4°, left wrist: 4.3°; right ankle: 4.9°, left ankle: 6.7°). Although flexion-extension angles of the knee and elbow showed relatively higher errors (Table 1), the overall trajectory patterns for these joints were consistent across systems (Figure 4).
Xsens’ COM tracking (displacement in meters) during the layup shot was closest to Vicon in the vertical direction (z), with a 0.029 m (0.002) offset. The resultant horizontal displacement of the COMx and COMy had a mean 8% difference between the systems over roughly 2 m of total travel.

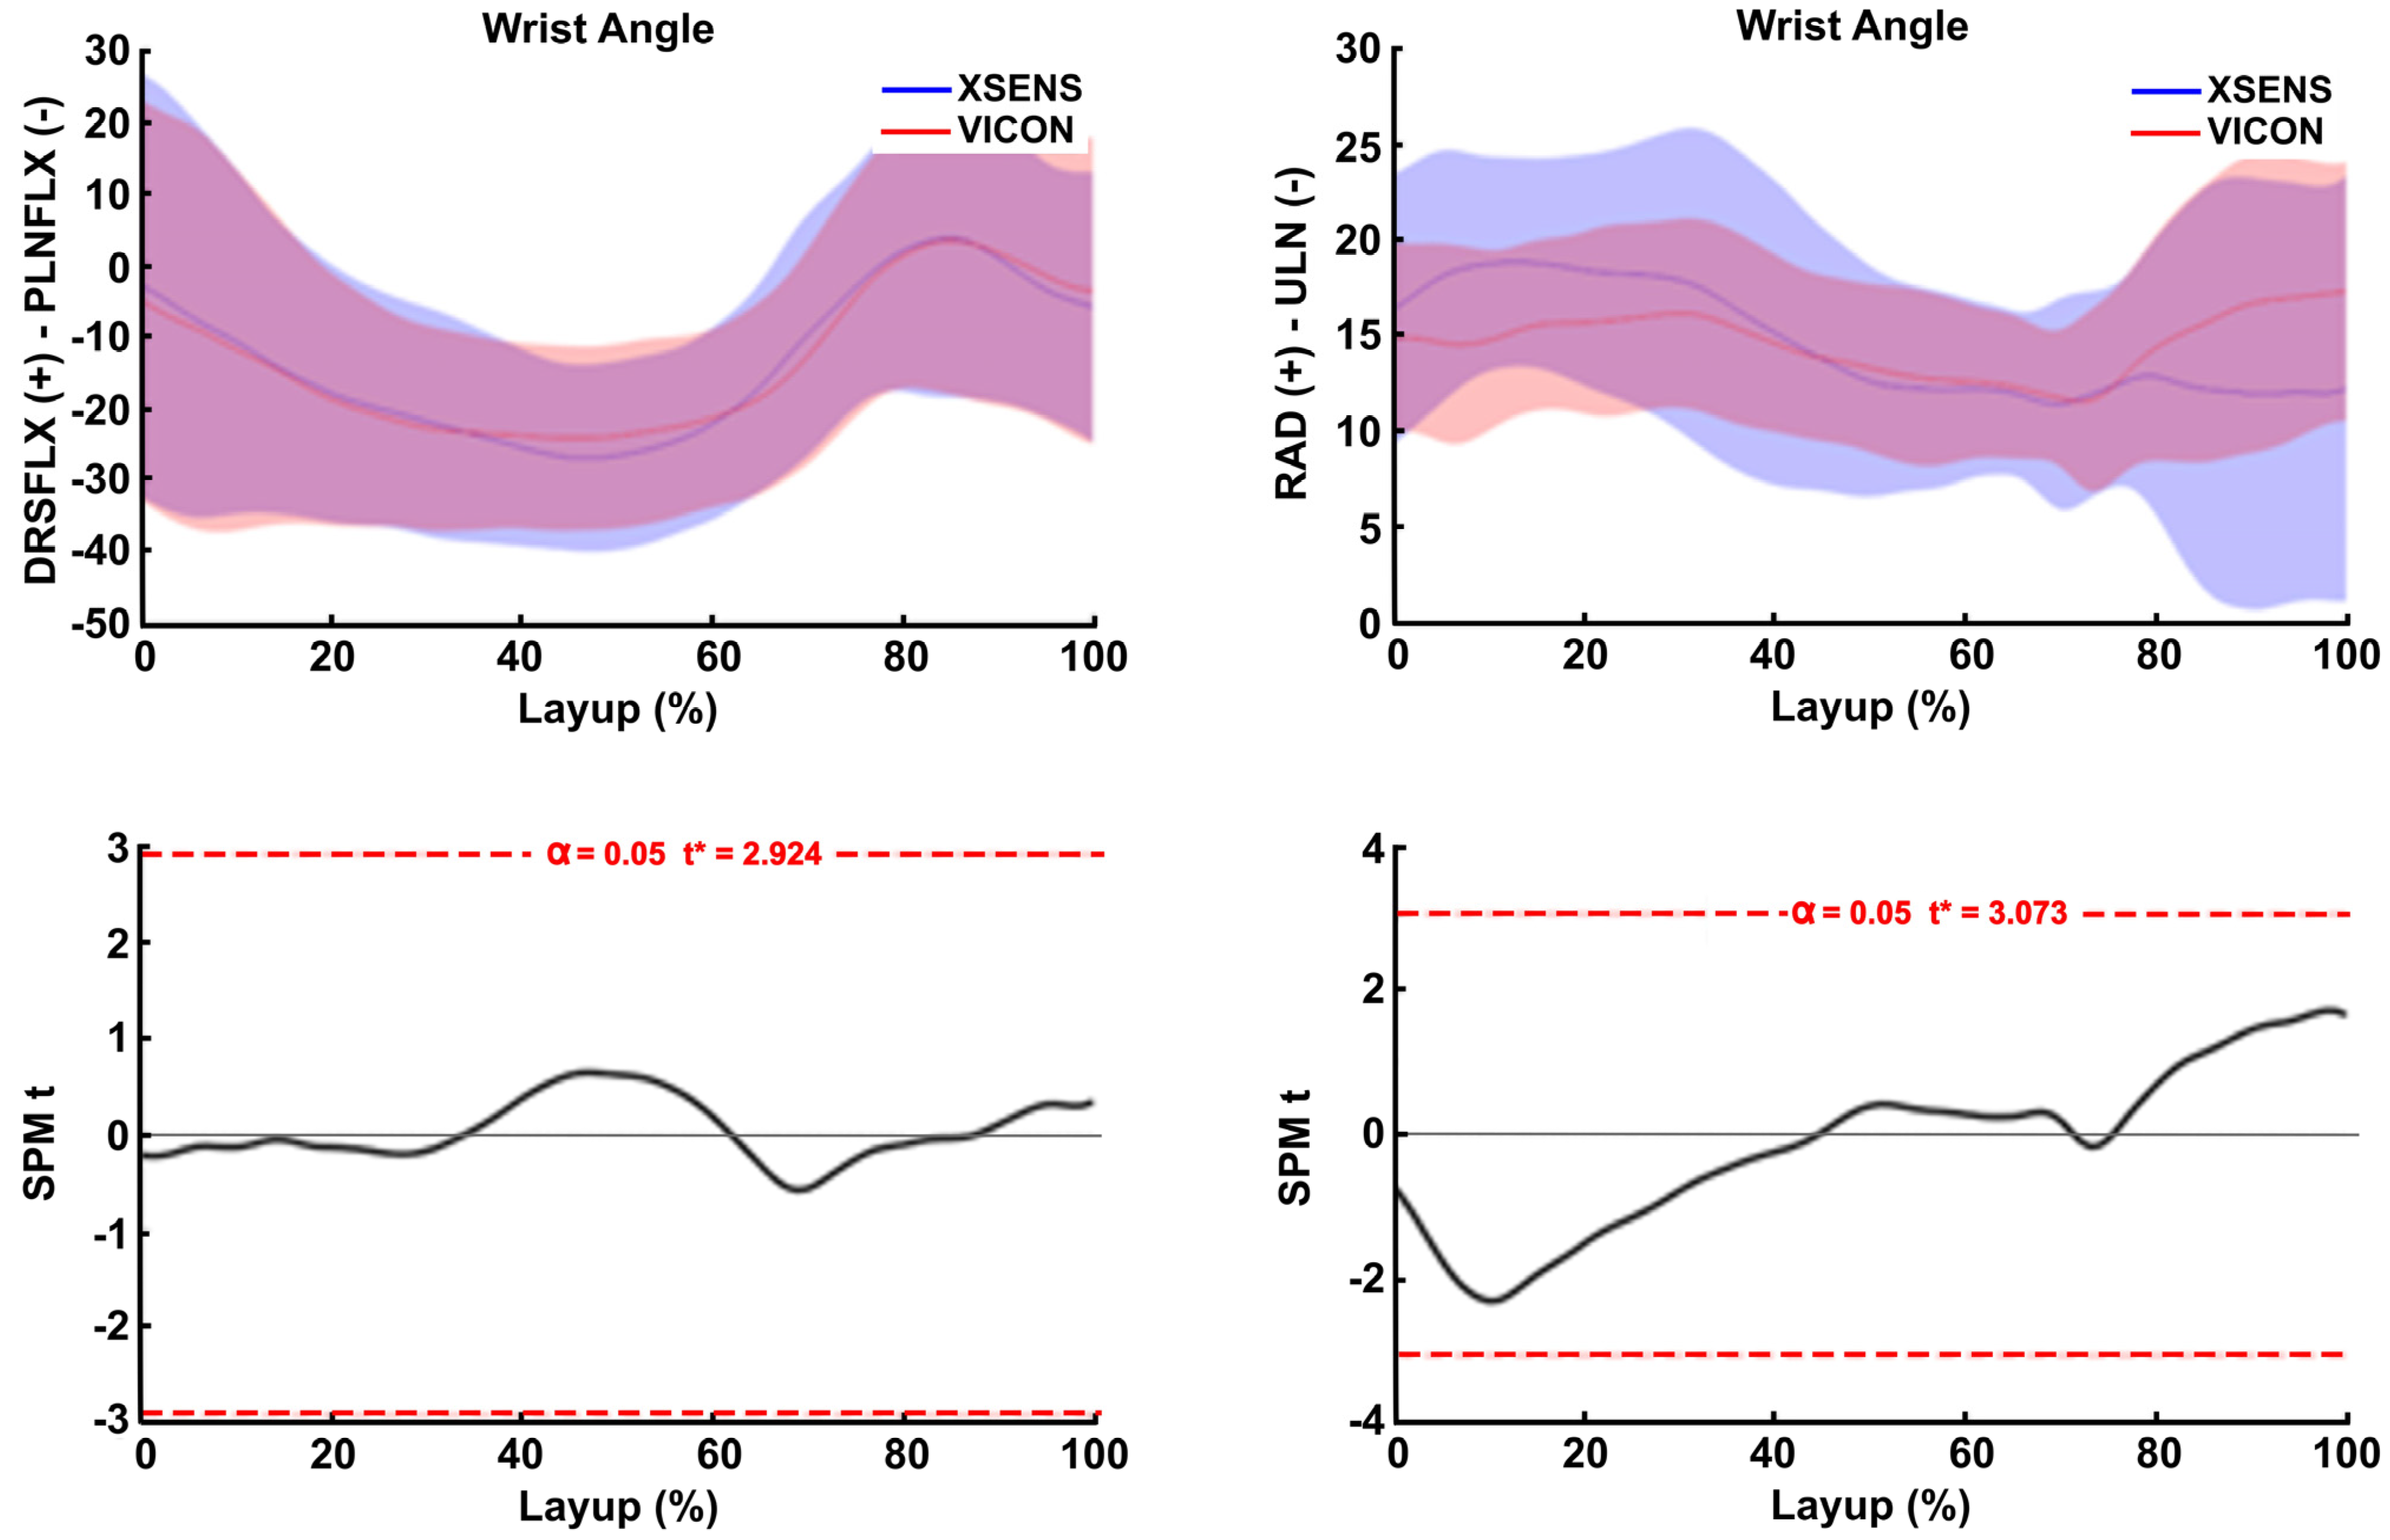
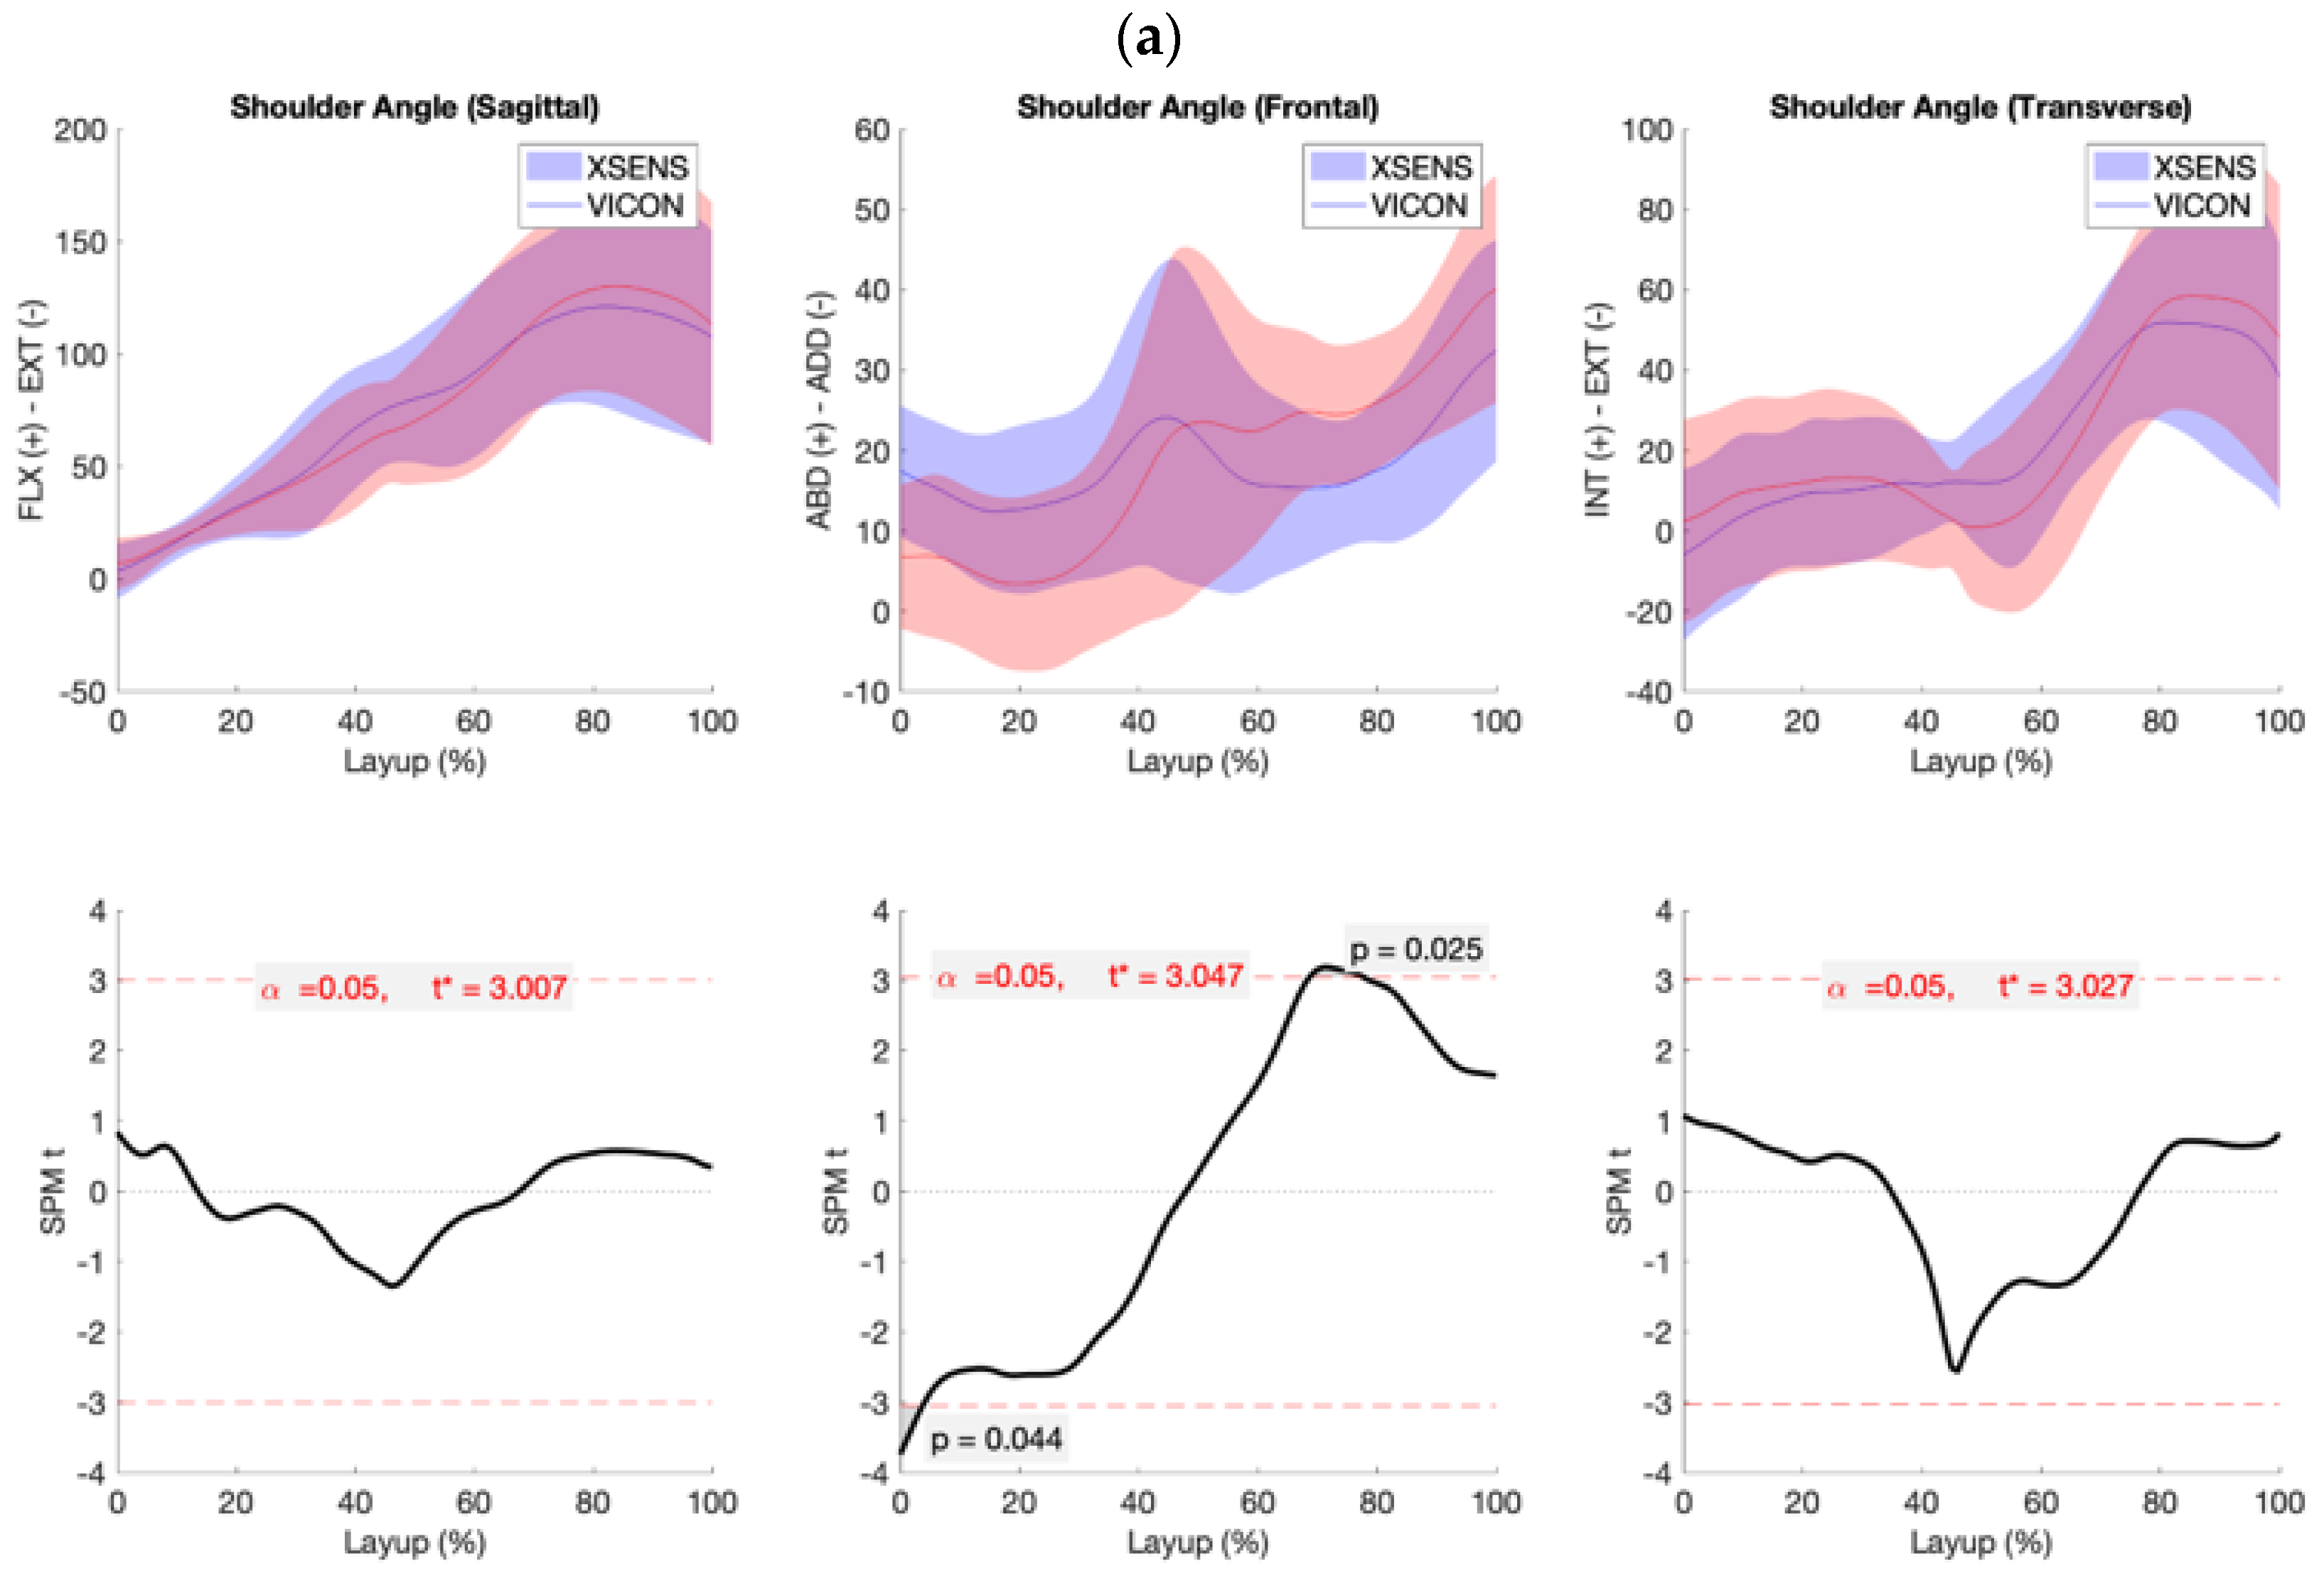
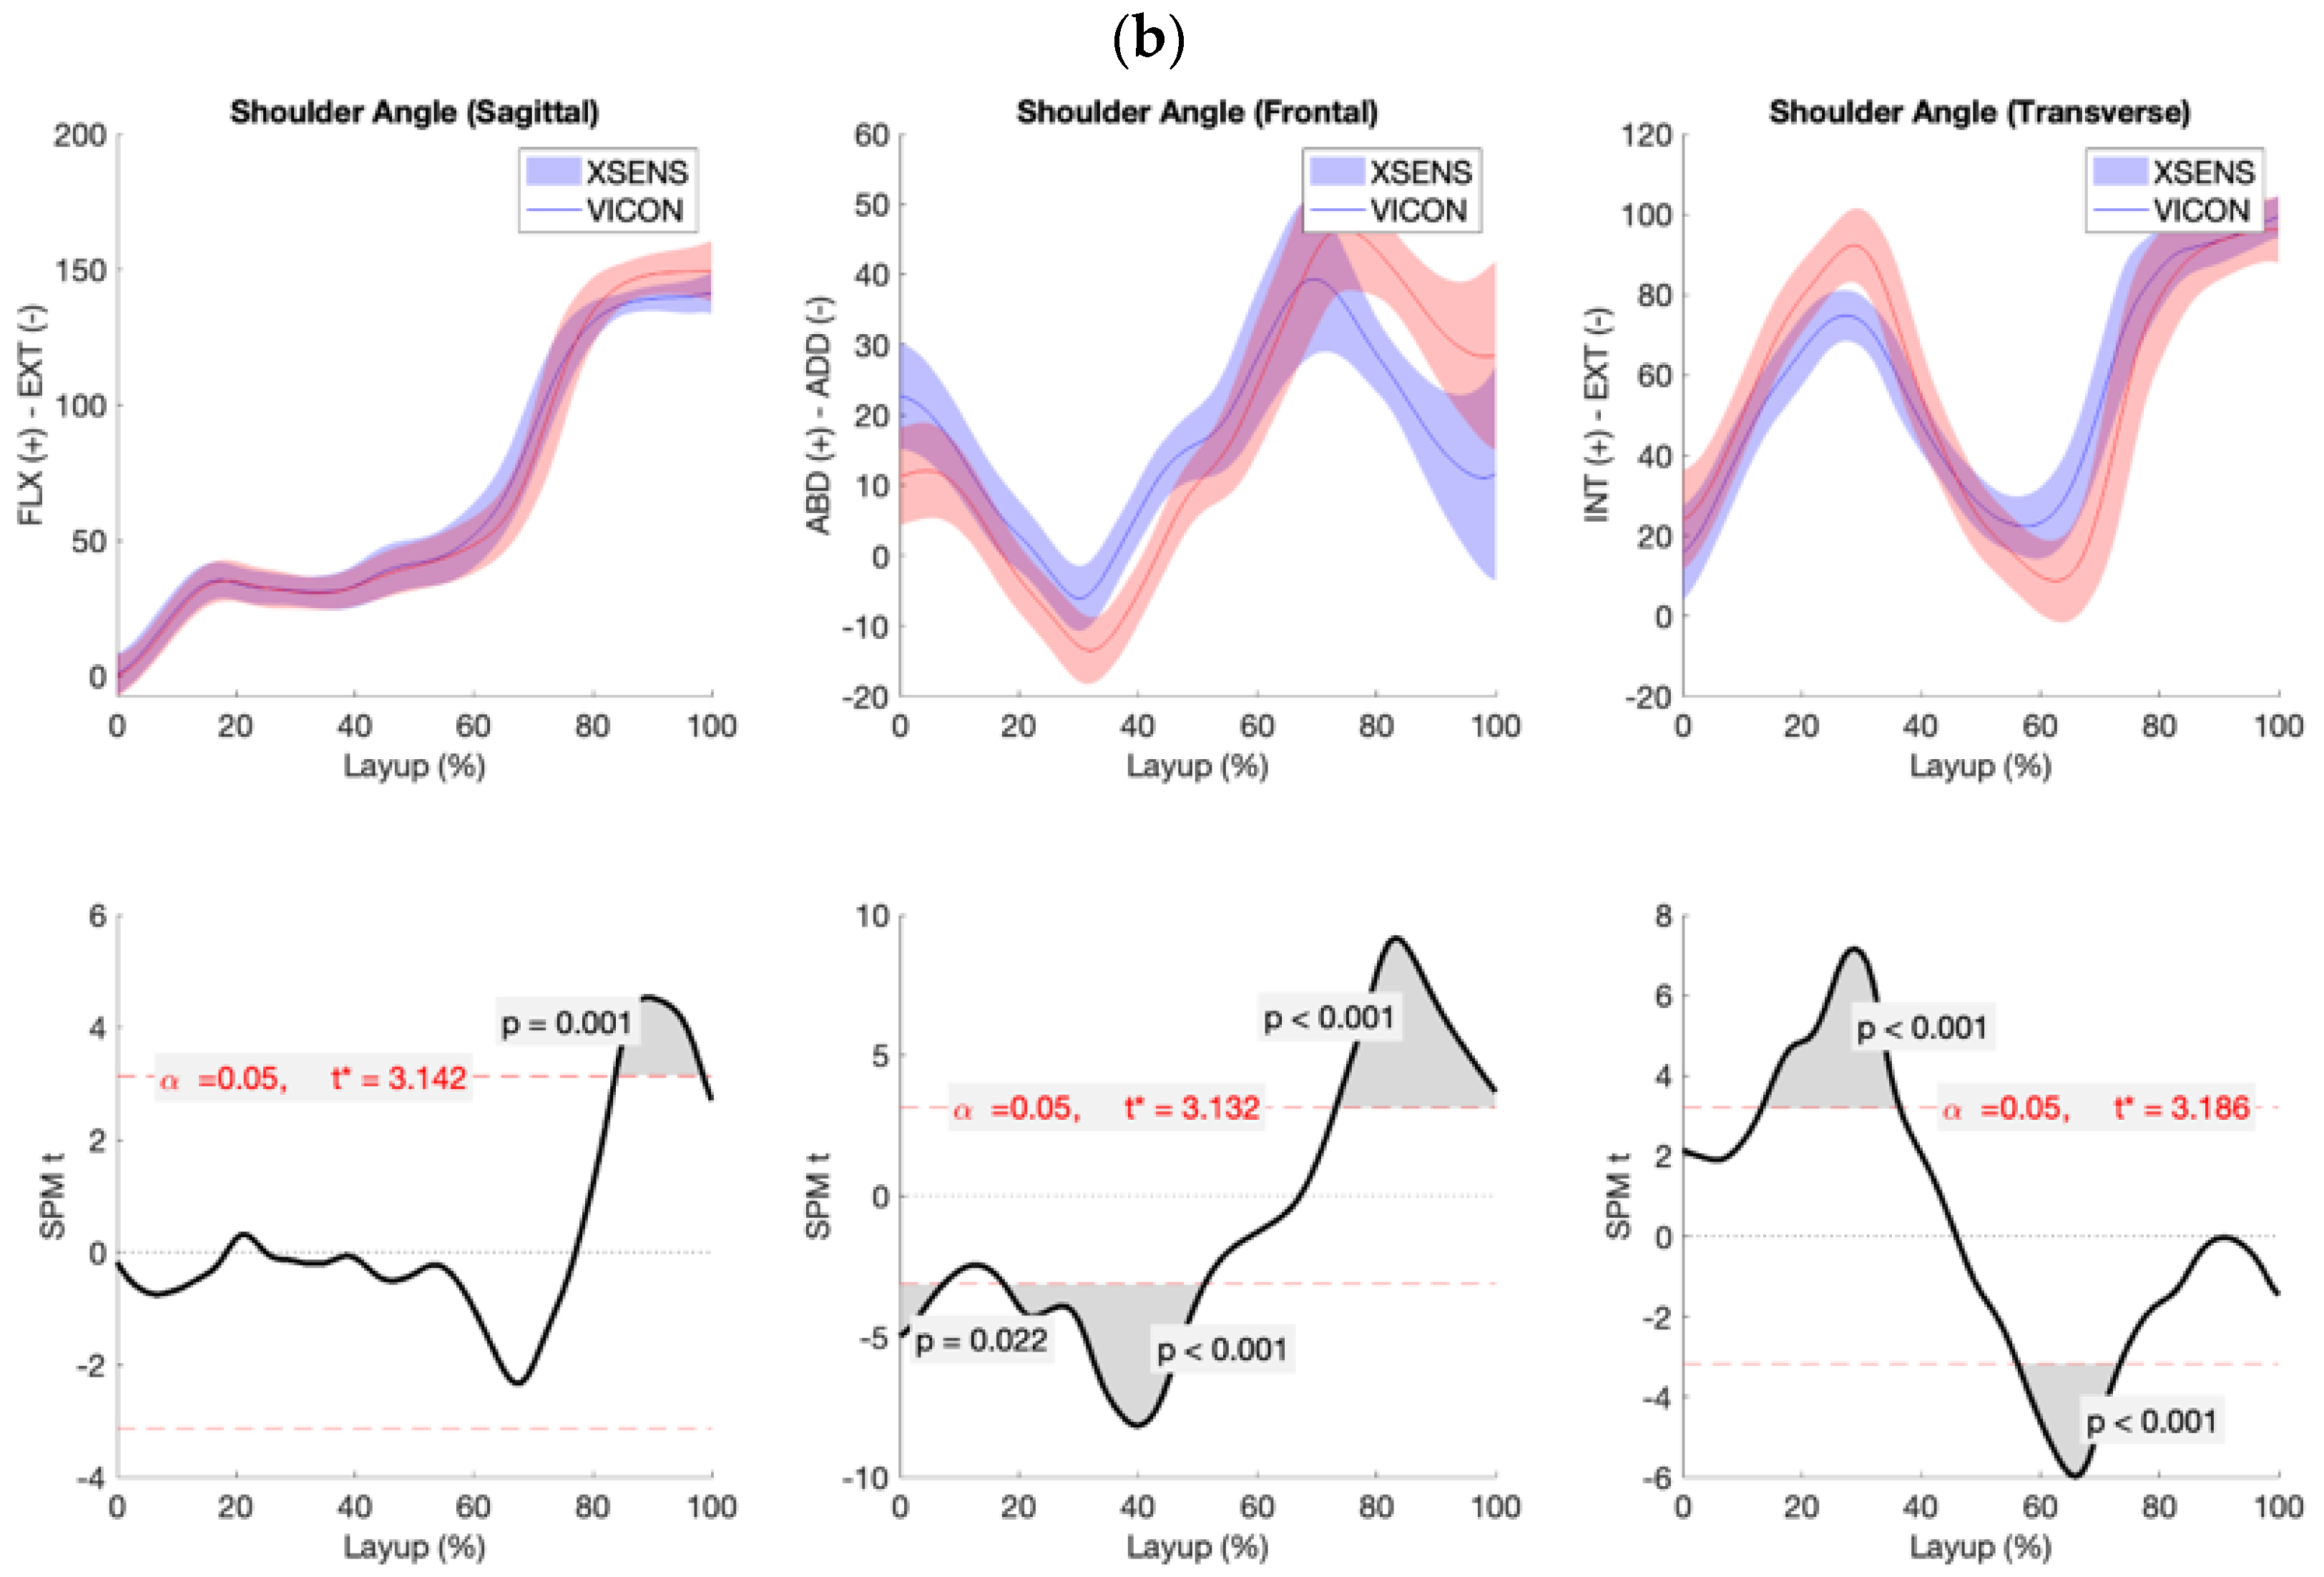
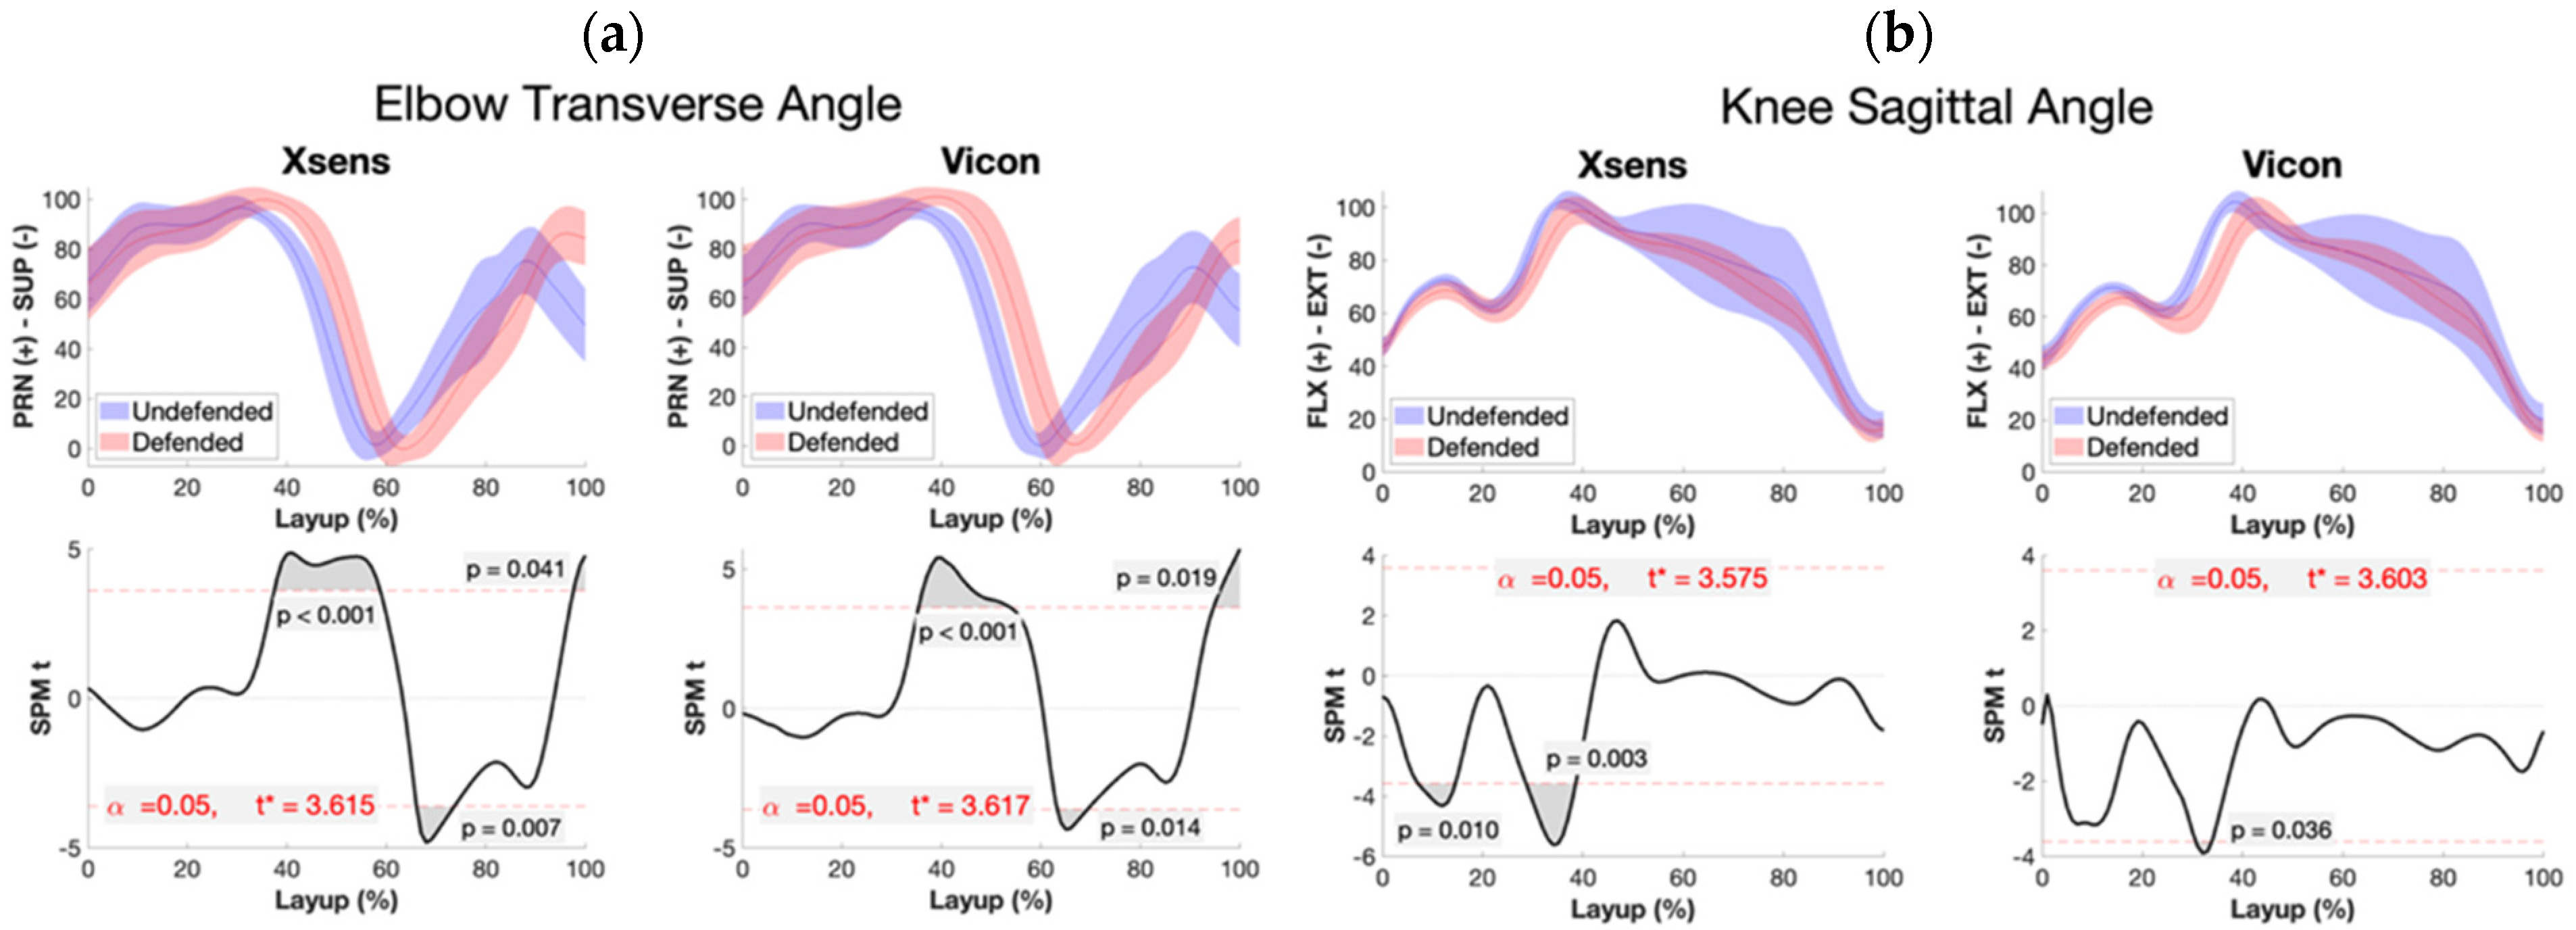
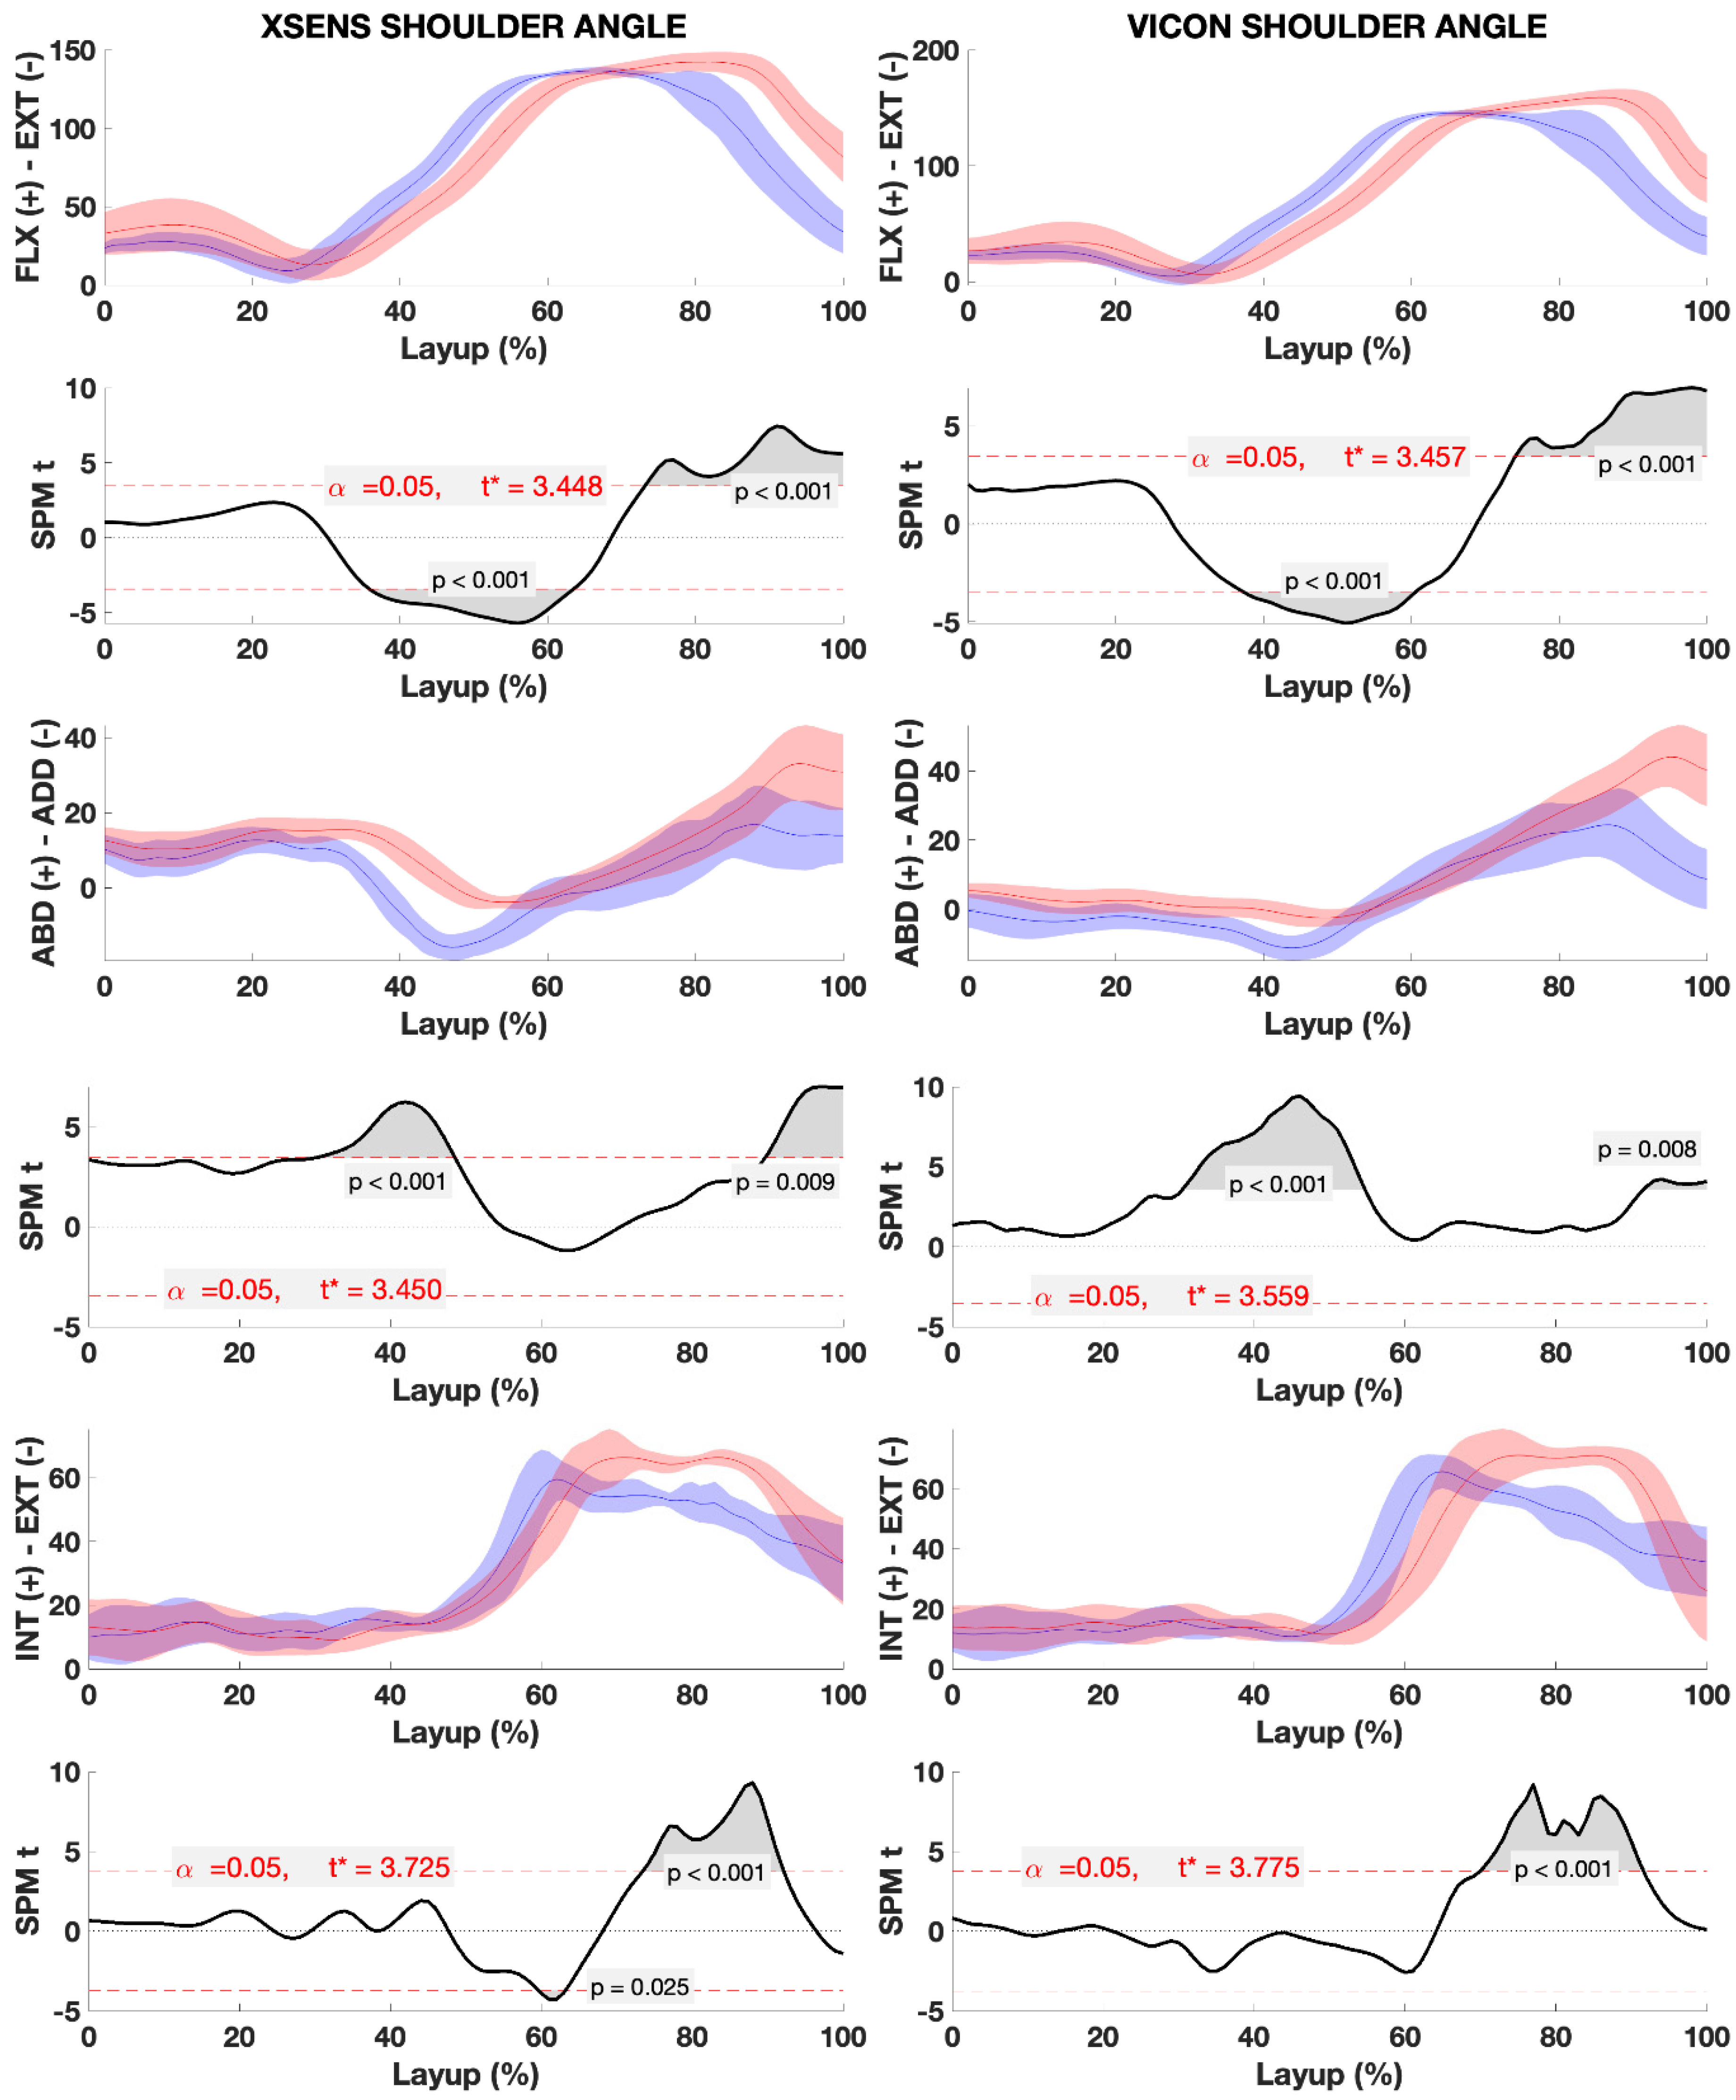
3.3. Statistical Parametric Mapping (SPM) Analysis

SPM analysis was conducted to identify differences between joint angle outputs from the Vicon and Xsens systems during the layup shot. The results revealed three distinct patterns across joint angles: (1) no significant differences across participants (e.g., wrist flexion-extension motion), (2) varied responses across participants (e.g., external-internal shoulder, hip, ankle, and elbow angles), and (3) consistent differences across participants (e.g., shoulder and hip abduction-adduction angles).
Knee flexion-extension joint angles exhibited high waveform agreement between the two systems across participants. However, significant differences were detected during the initial phase of the movement. The SPM critical threshold (t = 3.321) was exceeded between 0% and 10% of the task (Figure 4), with a supra-threshold cluster probability of p = 0.001, indicating a significantly more extended angle detected from the Vicon system.
Ankle flexion-extension joint angle also witnessed the presence of supra-threshold clusters at some instances despite the systems’ general waveform agreement (Figure 5). Significant differences were detected between 5% and 14% of the task (t = 3.391, p < 0.001), where the Xsens system reported a more dorsiflexed angle compared to the Vicon system (Figure 5a). In the external-internal joint angles, significant differences emerged at 0% to 8% and 15% to 20% of the task (p = 0.011, p = 0.013), with Xsens initially reporting a more everted angle followed by a reversal, where the Vicon system showed more eversion (Figure 5b). The remaining waveform sections displayed no significant differences.
The wrist flexion-extension and ulnar-radial deviation joint angles demonstrated no significant differences between the systems. SPM critical thresholds for flexion/extension (t = 2.924) and radial/ulnar deviation (t = 3.073) were not exceeded, indicating homogeneous waveforms (Figure 6). However, differences were observed in ulnar-radial deviation joint angles for some participants during specific phases, such as take-off or the preparatory step.
The shoulder flexion-extension joint angles showed minimal differences between the systems, with occasional discrepancies centred around the peak of the jump or maximum shoulder flexion. In contrast, the abduction-adduction and external-internal joint angles exhibited significant differences across participants, with no consistent pattern in timing or duration of supra-threshold clusters (Figure 7a,b). For instance, the abduction-adduction joint angles surpassed the critical threshold twice during 0% to 3% and 70% to 76% of the task (t = 3.047, p = 0.025, p = 0.044). Similarly, the external-internal joint angles displayed significant clusters occurring at varying times before and after take-off (t = 3.186, p < 0.001) despite general waveform agreement.
A between-condition analysis was performed to assess the consistency of Xsens and Vicon in detecting changes between defended and undefended conditions (Table 1). Joint angles were classified into three categories based on the results of the between-condition analysis: (1) Both systems detected similar defence-induced changes within the same time windows across the time series (Figure 8a). This pattern was also evident in the shoulder flexion-extension, abduction-adduction and internal-external rotation angles (Figure 9), where ensemble plots showed strong alignment in trajectory trends between systems, and SPM analysis confirmed that significant condition-based differences occurred at comparable time points, with a high degree of overlap in significant clusters (p < 0.001). (2) Both systems detected comparable condition-based changes, although these occurred in different time windows (Figure 8b). The knee flexion-extension and shoulder internal-external rotation angles displayed this characteristic, as ensemble means revealed similar overall trends, but the timing of condition-specific variations differed. SPM analysis detected statistically significant differences between conditions in both systems; however, cluster sizes and locations were misaligned, suggesting a timing offset in how each system captured condition-based changes. (3) High offsets were observed between systems, notably in the external-internal shoulder rotation, where the largest offset of 4.9° was recorded (Table 1). Despite this, SPM analysis demonstrated that both systems consistently identified condition-specific differences (p < 0.001), though alignment of significant clusters was limited, indicating potential challenges in time synchronization.
The mean offset across all joint angles was 1.3°, with the highest offset observed in the external-internal shoulder angle (4.9°), while the lowest offset was found in the flexion-extension knee angle (0.0°). Notably, the majority of joint angles showed differences of less than 1.0°. SPM confirmed the consistency of Xsens in detecting condition-specific changes, with cluster sizes and locations showing strong similarity between defended and undefended conditions in both systems (Table 1).

4. Discussion

This study evaluated the accuracy and reliability of IMUs (Xsens) in capturing basketball layup kinematics. The goal was to assess their suitability for performance analysis in representative environments, such as the basketball court, compared to an optical motion capture system (Vicon). The findings demonstrated strong agreement for global metrics such as jump height and take-off angle but highlighted significant RMSD for joint-specific measures, particularly in the flexion-extension joint angle of the shoulder. This aligns with numerous validation studies that indicate task-specific and anatomical plane-dependent performance of IMUs [11,29]. Furthermore, a between-condition analysis revealed an ability of Xsens to detect relative changes in joint angle kinematic adjustments when task-relevant condition constraints were incorporated that was comparable to Vicon. These results emphasise the potential of IMUs as portable alternatives for field-based biomechanical assessments while identifying limitations in capturing detailed joint-level kinematics.
The findings of the present study demonstrate a high level of agreement between the Vicon and Xsens systems for measuring jump height and take-off angle. The paired-samples t-test showed no significant differences between the systems, highlighting the comparability of outputs. Specifically, the mean jump height values were identical (jump height (Table 1), with a minor mean offset of 0.025 m. Similarly, take-off angle (Table 1) showed minimal divergence with a mean offset of 1.5°, confirming the systems’ consistency in measuring key metrics for dynamic movements, such as the basketball layup. These two metrics, derived from the system-calculated COM location, demonstrate reliable tracking of the COM. This aligns with previous studies highlighting that COM displacement and jump height are less influenced by drift and alignment errors compared to joint-specific measures [30,31]. The excellent reliability scores for jump height and take-off angle (ICC = 0.97–0.96) indicate strong consistency, ensuring observed variations reflect performance differences rather than measurement error.

4.1. Between-System Analysis

Shoulder flexion-extension joint angles demonstrated consistently high between-system RMSD levels across participants (Table 1). Although the time-series trajectories indicated waveform agreement throughout the task, occasional underestimation by Xsens was observed, particularly around ball release. This finding aligns with previous research, which suggests that IMUs generally provide acceptable accuracy for upper body kinematics but may underestimate joint angles, especially as the magnitude of movement increases [11]. These discrepancies at higher joint angles may explain the observed underestimation near ball release, where the demands on shoulder joint mobility are likely elevated.
A closer examination of the discrepancies highlights several contributing factors. First, IMU-based systems, by nature, tend to underestimate joint angles at larger ranges of motion while overestimating at smaller angles [11,32]. Bland–Altman analyses in previous studies have confirmed this trend, particularly for shoulder elevation, where the largest errors are typically observed [11]. These previous findings are consistent with the results in the current study, where the underestimation near ball release coincides with elevated shoulder flexion demands. Additionally, the soft tissue artifact (STA) inherent to all non-invasive motion analysis techniques, including optical systems, introduces error into the reference data, further complicating the comparison between systems [33]. Thus, the observed RMSD values may partly reflect STA effects, which reduce the precision of both measurement systems in capturing true joint motion.
Furthermore, the complexity of shoulder kinematics, characterised by multi-planar motion and interdependence between segmental axes, adds another layer of challenge for IMUs. Notably, while studies have investigated specific upper-limb criteria, such as the scapulohumeral rhythm and repeatability of segment axes [34,35], the influence of these factors on task-specific performance in dynamic, sport-representative environments remains underexplored. The observed high RMSD values may, therefore, reflect a combination of methodological limitations, soft tissue-induced artifacts, and the inherent challenges of capturing highly dynamic, multi-planar movements with portable systems like IMUs.
This study also confirms previous studies suggesting the presence of high between-systems RMSD values for the abduction-adduction and external-internal joint angles for the complex motions of the mobile and multiplanar shoulder joint [3] (Table 1). Together with the high between-participant variability of the SPM plots (Figure 7), the validity of Xsens to detect these motions accurately for the layup cannot be confirmed. This finding is in line with the limited number of studies that have incorporated the shoulder joint for complex tasks (multi-planal motion), suggesting the validity of IMUs’ detection of motion accuracy is highly variable [24,36,37,38]. The shoulder joint is very mobile [39], and its biomechanical modelling requires unique mathematical representation [40]. The shoulder joint, due to its high degrees of freedom, is expected to perform multi-planar motions simultaneously. In the context of a basketball layup, while the extension-to-flexion movement of the arm is consistent throughout the task, motions in the abduction-adduction and external-internal joint angles can vary, displaying one or a combination of directions depending on player preference or task-specific constraints, such as defensive pressure. Total joint angles are derived from the summation of individual rotational components across anatomical planes. However, this process introduces the potential for cross-talk or noise, whereby inaccuracies in the measurement or alignment of rotations in one plane may erroneously influence or be attributed to rotations in another, compromising the accuracy of the resulting total angle [41,42]. This highlights the inherent challenges in accurately capturing shoulder kinematics during dynamic, sport-specific tasks.
Similarly, despite comparable hip joint angle waveforms between the systems, high error rates (Table 1) and the presence of significant difference clusters in the SPM plots questioned Xsens accuracy. In a recent systematic review by Poitras et al. [3], the validity of hip kinematics ranged from fair to excellent, with RMSD values spanning 0.2° to 9.3° and correlation coefficients (r) between 0.53 and 1.00. Movements involving hip rotation exhibited the greatest inaccuracies, with RMSD reaching up to 11.8° and correlations dropping as low as 0.35. The discrepancies presented in this work may be attributed to the unique demands of this layup shot task, which differ significantly from the predominantly uni-planar movements typically studied in running and walking datasets [24,25,43,44,45,46,47]. Unlike the consistent, uni-planar patterns of walking and running, the layup shot demands dynamic, multi-planar hip movements, including frequent transitions between flexion, abduction, and rotation to adapt to task-specific constraints. Rapid accelerations, decelerations, and directional changes add variability, causing noise and algorithmic drift in IMU data. These factors increase cross-talk between planes (e.g., [41]), reducing accuracy in capturing all planal motions of the hip and further highlighting the challenges of applying IMUs to complex sport-specific tasks.
Flexion-extension joint angles of the smaller joints (i.e., wrist and ankle) have demonstrated relatively low RMSD values (Table 1). This can be confirmed by the SPM trajectory lacking any difference signifying clusters for the wrist joint and by the general waveform agreement for the ankle joint flexion-extension angle. However, wrist ulnar-radial deviation and ankle external-internal joint angles also displayed low RMSD results (Table 1), but this was not reflected congruently across participants’ SPM trajectory ensemble plots. This may be due to the smaller ranges of motion, which have amplified levels of noise compared to flexion-extension joint angles [48], with some noise potentially resulting from between-plane cross-talk when one plane motion is incorrectly detected as the motion of another [41]. This has been a common phenomenon reported with studies featuring multi-planal complex movements in which the accuracy of inertial sensors can be affected by high segment linear accelerations [3]. Similar disagreements have been noted by previous sensor vs. marker studies for the ankle external-internal angle [47,48], but the discrepancy in the agreement of the ankle rotational angle between the systems may also be due to the foot sensor fixation method being prone to impact, as statistically significance difference has been detected roughly—but not exceptional to—around ground contact points (i.e., toe-off and landing). Efforts to secure the foot sensor placement can be made through tightening the shoe strap or taping the sensor to reduce impact effect.
Despite the flexion-extension knee and elbow joint angles displaying relatively high errors (Table 1) and the presence of supra-threshold clusters across the joint angle trajectories, the two waveforms remain morphologically similar, except for low deviations at random time points that do not constitute a marked anomaly, according to the trajectory plots. The observed SPM clusters between the systems may partly be attributed to differences in their event detection methods. Although both systems are consistent, slight synchronization delays, potentially up to ≤4 data points, might occur between the two waveforms. This could result in misalignment, particularly at time points where rapid changes in joint angles take place. The notable between-system discrepancies in some of these angles, which occur during large ranges of motion in short durations, may be explained by the established argument that dynamic movements are associated with higher error levels. For example, ref. [49] reported greater errors during countermovement jumps compared to bilateral squats or single-leg squats. Similarly, ref. [1] noted greater errors in dynamic tasks like running double-leg vertical jumps and single-leg hops compared to single-leg decelerations and push-offs or running sidestep cuts.

4.2. Between-Condition Analysis

The paired-sample t-test revealed no significant differences between the Vicon and Xsens systems in detecting changes between conditions for both jump height and take-off angle. Specifically, the differences detected by Vicon (jump height: 0.028 m; take-off angle: 2.03°) and Xsens (jump height: 0.022 m; take-off angle: 2.91°) were not statistically significant (p ≥ 0.238 and p ≥ 0.225, respectively). These findings reinforce the reliability of both systems in consistently detecting condition-induced changes in performance metrics.
Due to the inability to confirm joint angle accuracy between the two systems, a between-condition analysis was conducted to evaluate Xsens’ reliability in capturing condition-specific biomechanical changes. This analysis revealed a mean offset of 1.3° between systems, with most joint angles differing by less than 1.0°. In line with the prior literature, an RMSD threshold of ≤5° was considered indicative of excellent agreement [24,25]. Our results showed that the majority of joint angles, particularly in the sagittal plane, fell within or near this threshold, supporting the practical use of IMUs in applied sport settings where high relative precision is desirable, but absolute accuracy is not always critical. Prior research has noted that IMUs may not replicate raw joint angles as precisely as optical systems, especially during complex, multi-planar movements [50,51]. Therefore, assessing condition-specific trends rather than direct system comparisons offers a more suitable approach for evaluating movement adaptations.
The condition-based SPM analysis (Figure 8 and Figure 9) supported these findings by identifying comparable cluster sizes and locations for defended and undefended conditions across both systems. The analysis demonstrated that Xsens was capable of detecting similar magnitudes of condition-based differences in shoulder joint angles as Vicon, particularly during the layup task. While absolute measurement precision could not be confirmed, Xsens reliably detected changes induced by defensive conditions.
This result is significant for tasks involving complex upper-limb mechanics, such as layup shots, shooting, and passing under defensive pressure, where shoulder positioning and rotation are critical. The ability of Xsens to capture condition-induced changes underscores its practical application in performance analysis and training. Its portability and capacity to provide real-time feedback make it particularly advantageous for applied sports settings.
These findings further demonstrate that Xsens effectively captures relative biomechanical changes under varying conditions. Minor differences in timing or magnitude of significance clusters, such as Xsens showing slightly broader time windows of significant effects, may reflect subtle discrepancies in precision or noise sensitivity. Nonetheless, consistent kinematic differences between defended and undefended conditions were observed across both systems, with critical-t values and p-values confirming the statistical robustness of the results.
By focusing on within-system, condition-specific changes, the potential for confounding factors introduced by inter-system variability is minimized. This ensures that observed trends in joint angles, timing, and coordination patterns can be reliably attributed to experimental conditions rather than inconsistencies between measurement platforms, thus providing strong validation for the use of Xsens in layup mechanics analysis.

5. Implications

The findings of our study, alongside the existing literature, highlight the utility of wearable IMUs in providing accessible, portable, and cost-effective solutions for field-based sports biomechanics. IMUs like Xsens are particularly effective for assessing global metrics and sagittal plane kinematics, making them suitable for applications in performance monitoring, skill acquisition analysis, and injury prevention strategies. However, the study’s findings emphasise the need for caution when using IMUs for detailed kinematic analyses, particularly for tasks involving high velocities or complex multi-planar dynamics.
Xsens demonstrated strong capability in capturing and detecting relative biomechanical changes under varying conditions, highlighting its practicality for applied sports biomechanics, particularly in real-world, non-laboratory settings where optical systems like Vicon may not be feasible. Its ability to identify kinematic adaptations, such as those athletes make in response to external constraints like defensive pressure, reinforces its value as a robust alternative for performance analysis. The comparable results between Xsens and Vicon in differentiating defended and undefended conditions further emphasise its reliability in applied biomechanics research.

6. Conclusions

The between-condition analyses revealed Xsens’ capability to detect changes between defended and undefended conditions, aligning closely with Vicon’s detection in certain instances. This additional analysis underscores the ability of wearable sensors like Xsens to identify changes in movement mechanic under varying conditions, demonstrating performance similar to Vicon in most cases, despite limitations in absolute accuracy.
These findings suggest that wearable sensors like Xsens can facilitate informed decisions by players and coaches regarding the impact of layup shooting mechanics on performance and injury risk within their specific environments. By providing portable and efficient motion analysis tools, Xsens supports practical sports biomechanics applications, paving the way for improved athlete monitoring and training in field-based settings. We can generalise that our method should be used to verify detection capabilities before applying these systems to other sports contexts, ensuring reliable performance assessment across diverse athletic scenarios.

Author Contributions

Conceptualization, N.A., M.T.G.P. and M.J.H.; Methodology, N.A., M.T.G.P. and M.J.H.; Software, N.A.; Formal analysis, N.A.; Investigation, N.A.; Data curation, N.A.; Writing—original draft, N.A.; Writing—review & editing, M.T.G.P. and M.J.H.; Visualization, N.A.; Supervision, M.T.G.P. and M.J.H.; Project administration, N.A. All authors have read and agreed to the published version of the manuscript.

Funding

This research received no external funding.

Institutional Review Board Statement

The study was conducted in accordance with the Declaration of Helsinki, and approved by the Ethics Committee of Loughborough University (protocol code 2022-11209-12096, date of approval, 1 March 2023).

Informed Consent Statement

Informed consent was obtained from all subjects involved in the study.

Data Availability Statement

The data presented in this study are available on request from the corresponding author. The data are not publicly available due to privacy of the subjects.

Conflicts of Interest

The authors declare no conflict of interest.

References

  1. Nijmeijer, E.M.; Heuvelmans, P.; Bolt, R.; Gokeler, A.; Otten, E.; Benjaminse, A. Concurrent validation of the Xsens IMU system of lower-body kinematics in jump-landing and change-of-direction tasks. J. Biomech. 2023, 154, 111637. [Google Scholar]
  2. Benjaminse, A.; Bolt, R.; Gokeler, A.; Otten, B. A validity study comparing Xsens with vicon. ISBS Proc. Arch. 2020, 38, 752. [Google Scholar]
  3. Poitras, I.; Dupuis, F.; Bielmann, M.; Campeau-Lecours, A.; Mercier, C.; Bouyer, L.J.; Roy, J.S. Validity and reliability of wearable sensors for joint angle estimation: A systematic review. Sensors 2019, 19, 1555. [Google Scholar] [CrossRef] [PubMed]
  4. Godfrey, A.C.R.M.D.O.G.; Conway, R.; Meagher, D.; ÓLaighin, G. Direct measurement of human movement by accelerometry. Med. Eng. Phys. 2008, 30, 1364–1386. [Google Scholar]
  5. Ceseracciu, E.; Sawacha, Z.; Cobelli, C. Comparison of markerless and marker-based motion capture technologies through simultaneous data collection during gait: Proof of concept. PLoS ONE 2014, 9, e87640. [Google Scholar]
  6. Marin, F. Human and animal motion tracking using inertial sensors. Sensors 2020, 20, 6074. [Google Scholar] [CrossRef]
  7. Arlotti, J.S.; Carroll, W.O.; Afifi, Y.; Talegaonkar, P.; Albuquerque, L.; Ball, J.E.; Chander, H.; Petway, A. Benefits of IMU-based wearables in sports medicine: Narrative review. Int. J. Kinesiol. Sports Sci. 2022, 10, 36–43. [Google Scholar]
  8. Schepers, M.; Giuberti, M.; Bellusci, G. Xsens MVN: Consistent Tracking of Human Motion Using Inertial Sensing. Xsens Technol. 2018, 1, 1–8. [Google Scholar] [CrossRef]
  9. Delp, S.L.; Anderson, F.C.; Arnold, A.S.; Loan, P.; Habib, A.; John, C.T.; Guendelman, E.; Thelen, D.G. OpenSim: Open-source software to create and analyze dynamic simulations of movement. IEEE Trans. Biomed. Eng. 2007, 54, 1940–1950. [Google Scholar]
  10. Benedetti, M.G.; Merlo, A.; Leardini, A. Inter-laboratory consistency of gait analysis measurements. Gait Posture 2013, 38, 934–939. [Google Scholar]
  11. Morrow, M.M.; Lowndes, B.; Fortune, E.; Kaufman, K.R.; Hallbeck, M.S. Validation of inertial measurement units for upper body kinematics. J. Appl. Biomech. 2017, 33, 227–232. [Google Scholar] [PubMed]
  12. McGrath, J.; Neville, J.; Stewart, T.; Cronin, J. Upper body activity classification using an inertial measurement unit in court and field-based sports: A systematic review. Proc. Inst. Mech. Eng. Part P J. Sports Eng. Technol. 2021, 235, 83–95. [Google Scholar]
  13. Eggert, B.; Mundt, M.; Markert, B. IMU-based activity recognition of the basketball jump shot. ISBS Proc. Arch. 2020, 38, 344. [Google Scholar]
  14. Chow, J.Y.; Davids, K.; Button, C.; Renshaw, I. Nonlinear Pedagogy in Skill Acquisition: An Introduction; Routledge: London, UK, 2021. [Google Scholar]
  15. Travassos, B.; Araújo, D.; Duarte, R.; McGarry, T. Spatiotemporal coordination behaviors in futsal (indoor football) are guided by informational game constraints. Hum. Mov. Sci. 2012, 31, 932–945. [Google Scholar] [CrossRef]
  16. Button, C.; Macleod, M.; Sanders, R.; Coleman, S. Examining movement variability in the basketball free-throw action at different skill levels. Res. Q. Exerc. Sport 2003, 74, 257–269. [Google Scholar]
  17. Esteves, P.T.; de Oliveira, R.F.; Araújo, D. Posture-related affordances guide attacks in basketball. Psychol. Sport Exerc. 2011, 12, 639–644. [Google Scholar] [CrossRef]
  18. Pinder, R.A.; Davids, K.; Renshaw, I.; Araújo, D. Representative learning design and functionality of research and practice in sport. J. Sport Exerc. Psychol. 2011, 33, 146–155. [Google Scholar] [CrossRef]
  19. Benjaminse, A.; Otten, B.; Gokeler, A.; Diercks, R.L.; Lemmink, K.A. Motor learning strategies in basketball players and its implications for ACL injury prevention: A randomized controlled trial. Knee Surg. Sports Traumatol. Arthrosc. 2017, 25, 2365–2376. [Google Scholar] [CrossRef]
  20. Lambrecht, S.; Harutyunyan, A.; Tanghe, K.; Afschrift, M.; De Schutter, J.; Jonkers, I. Real-time gait event detection based on kinematic data coupled to a biomechanical model. Sensors 2017, 17, 671. [Google Scholar] [CrossRef]
  21. De Leva, P. Adjustments to Zatsiorsky-Seluyanov’s segment inertia parameters. J. Biomech. 1996, 29, 1223–1230. [Google Scholar] [CrossRef]
  22. Di Paolo, S.; Lopomo, N.F.; Della Villa, F.; Paolini, G.; Figari, G.; Bragonzoni, L.; Grassi, A.; Zaffagnini, S. Rehabilitation and return to sport assessment after anterior cruciate ligament injury: Quantifying joint kinematics during complex high-speed tasks through wearable sensors. Sensors 2021, 21, 2331. [Google Scholar] [CrossRef]
  23. Chai, T.; Draxler, R.R. Root mean square error (RMSE) or mean absolute error (MAE)?—Arguments against avoiding RMSE in the literature. Geosci. Model Dev. 2014, 7, 1247–1250. [Google Scholar] [CrossRef]
  24. Robert-Lachaine, X.; Mecheri, H.; Larue, C.; Plamondon, A. Validation of inertial measurement units with an optoelectronic system for whole-body motion analysis. Med. Biol. Eng. Comput. 2017, 55, 609–619. [Google Scholar] [CrossRef] [PubMed]
  25. Zhang, J.T.; Novak, A.C.; Brouwer, B.; Li, Q. Concurrent validation of Xsens MVN measurement of lower limb joint angular kinematics. Physiol. Meas. 2013, 34, N63. [Google Scholar] [CrossRef]
  26. Shrout, P.E.; Fleiss, J.L. Intraclass correlations: Uses in assessing rater reliability. Psychol. Bull. 1979, 86, 420. [Google Scholar] [CrossRef]
  27. Bland, J.M. Statistical methods for assessing agreement between two methods of clinical measurement. Lancet 1986, 1, 307–310. [Google Scholar] [CrossRef]
  28. Pataky, T.C. Generalized n-dimensional biomechanical field analysis using statistical parametric mapping. J. Biomech. 2010, 43, 1976–1982. [Google Scholar] [CrossRef]
  29. Chia, L.; Andersen, J.T.; McKay, M.J.; Sullivan, J.; Megalaa, T.; Pappas, E. Evaluating the validity and reliability of inertial measurement units for determining knee and trunk kinematics during athletic landing and cutting movements. J. Electromyogr. Kinesiol. 2021, 60, 102589. [Google Scholar] [CrossRef]
  30. Fathian, R.; Khandan, A.; Chiu, L.Z.; Rouhani, H. Assessment of countermovement jump with and without arm swing using a single inertial measurement unit. Sports Biomech. 2024, 23, 2390–2407. [Google Scholar] [CrossRef]
  31. Villarejo-García, D.H.; Moreno-Villanueva, A.; Soler-López, A.; Reche-Soto, P.; Pino-Ortega, J. Use, validity and reliability of inertial movement units in volleyball: Systematic review of the scientific literature. Sensors 2023, 23, 3960. [Google Scholar] [CrossRef]
  32. Bouvier, B.; Duprey, S.; Claudon, L.; Dumas, R.; Savescu, A. Upper limb kinematics using inertial and magnetic sensors: Comparison of sensor-to-segment calibrations. Sensors 2015, 15, 18813–18833. [Google Scholar] [CrossRef] [PubMed]
  33. Leardini, A.; Chiari, L.; Della Croce, U.; Cappozzo, A. Human movement analysis using stereophotogrammetry. Part 3. Soft tissue artifact assessment and compensation. Gait Posture 2005, 21, 212–225. [Google Scholar] [PubMed]
  34. De Vries, W.H.K.; Veeger, H.E.J.; Cutti, A.G.; Baten, C.; Van Der Helm, F.C.T. Functionally interpretable local coordinate systems for the upper extremity using inertial & magnetic measurement systems. J. Biomech. 2010, 43, 1983–1988. [Google Scholar] [PubMed]
  35. Parel, I.; Cutti, A.; Fiumana, G.; Porcellini, G.; Verni, G.; Accardo, A. Ambulatory measurement of the scapulohumeral rhythm: Intra-and inter-operator agreement of a protocol based on inertial and magnetic sensors. Gait Posture 2012, 35, 636–640. [Google Scholar] [PubMed]
  36. Godwin, A.; Agnew, M.; Stevenson, J. Accuracy of inertial motion sensors in static, quasistatic, and complex dynamic motion. J. Biomech. Eng. 2009, 131, 114501. [Google Scholar]
  37. Fantozzi, S.; Giovanardi, A.; Magalhães, F.A.; Di Michele, R.; Cortesi, M.; Gatta, G. Assessment of three-dimensional joint kinematics of the upper limb during simulated swimming using wearable inertial-magnetic measurement units. J. Sports Sci. 2016, 34, 1073–1080. [Google Scholar]
  38. Ertzgaard, P.; Öhberg, F.; Gerdle, B.; Grip, H. A new way of assessing arm function in activity using kinematic Exposure Variation Analysis and portable inertial sensors–A validity study. Man. Ther. 2016, 21, 241–249. [Google Scholar]
  39. Cuesta-Vargas, A.I.; Galán-Mercant, A.; Williams, J.M. The use of inertial sensors system for human motion analysis. Phys. Ther. Rev. 2010, 15, 462–473. [Google Scholar]
  40. Šenk, M.; Cheze, L. Rotation sequence as an important factor in shoulder kinematics. Clin. Biomech. 2006, 21, S3–S8. [Google Scholar]
  41. Mok, K.M.; Kristianslund, E.K.; Krosshaug, T. The effect of thigh marker placement on knee valgus angles in vertical drop jumps and sidestep cutting. J. Appl. Biomech. 2015, 31, 269–274. [Google Scholar]
  42. Zhu, K.; Li, J.; Li, D.; Fan, B.; Shull, P.B. IMU shoulder angle estimation: Effects of sensor-to-segment misalignment and sensor orientation error. IEEE Trans. Neural Syst. Rehabil. Eng. 2023, 31, 4481–4491. [Google Scholar] [PubMed]
  43. Dejnabadi, H.; Jolles, B.M.; Casanova, E.; Fua, P.; Aminian, K. Estimation and visualization of sagittal kinematics of lower limbs orientation using body-fixed sensors. IEEE Trans. Biomed. Eng. 2006, 53, 1385–1393. [Google Scholar] [PubMed]
  44. Cloete, T.; Scheffer, C. Benchmarking of a full-body inertial motion capture system for clinical gait analysis. In Proceedings of the 2008 30th Annual International Conference of the IEEE Engineering in Medicine and Biology Society, Vancouver, BC, Canada, 20–25 August 2008; IEEE: Piscataway, NJ, USA, 2008; pp. 4579–4582. [Google Scholar]
  45. Buganè, F.; Benedetti, M.G.; D’Angeli, V.; Leardini, A. Estimation of pelvis kinematics in level walking based on a single inertial sensor positioned close to the sacrum: Validation on healthy subjects with stereophotogrammetric system. Biomed. Eng. Online 2014, 13, 1–15. [Google Scholar]
  46. Lebel, K.; Boissy, P.; Nguyen, H.; Duval, C. Inertial measurement systems for segments and joints kinematics assessment: Towards an understanding of the variations in sensors accuracy. Biomed. Eng. Online 2017, 16, 1–16. [Google Scholar]
  47. Al-Amri, M.; Nicholas, K.; Button, K.; Sparkes, V.; Sheeran, L.; Davies, J.L. Inertial measurement units for clinical movement analysis: Reliability and concurrent validity. Sensors 2018, 18, 719. [Google Scholar] [CrossRef]
  48. Heuvelmans, P.; Benjaminse, A.; Bolt, R.; Baumeister, J.; Otten, E.; Gokeler, A. Concurrent validation of the Noraxon MyoMotion wearable inertial sensors in change-of-direction and jump-landing tasks. Sports Biomech. 2022, 1–16. [Google Scholar] [CrossRef]
  49. Teufl, W.; Miezal, M.; Taetz, B.; Fröhlich, M.; Bleser, G. Validity of inertial sensor based 3D joint kinematics of static and dynamic sport and physiotherapy specific movements. PLoS ONE 2019, 14, e0213064. [Google Scholar]
  50. Choo, C.Z.Y.; Chow, J.Y.; Komar, J. Validation of the Perception Neuron system for full-body motion capture. PLoS ONE 2022, 17, e0262730. [Google Scholar]
  51. Brice, S.M.; Phillips, E.J.; Millett, E.L.; Hunter, A.; Philippa, B. Comparing inertial measurement units and marker-based biomechanical models during dynamic rotation of the torso. Eur. J. Sport Sci. 2020, 20, 767–775. [Google Scholar]
Figure 1. Marker and sensor (green circles) placement on the participant. Markers were placed on the following body landmarks: C7, T10, the sternum, clavicle, anterior/posterior shoulder, elbow lateral/medial epicondyles, distal ulna/radius, 1st and 5th metacarpal heads, distal middle finger, posterior heel, 1st and 5th metatarsal heads, 1st toe, lateral and medial malleoli, lateral and medial femoral epicondyles, anterior and posterior superior iliac spines, greater trochanters, and the head (19 mm in diameter). Sensors are circled in green (right and left figures) and were placed on the back of the head, sternum, shoulders (middle of the scapula spine), upper arms (lateral side above elbow), forearms (lateral side above wrist), hands (posterior side), pelvis (middle of both the posterior superior iliac spines), thighs (lateral side above the knees), shanks (upper surface of the tibias), and forefeet (dorsal side).
Applsci 15 03847 g001
Figure 2. (A) Protocol workflow for data collection, illustrating the sequential steps of the testing procedure, circles are indicative of sensor application. (B) A top-down view of the testing lab set-up, including the camera arrangement around the capture volume, the position of the basketball hoop and defender, and the participant’s starting position and path of travel toward the basket. The cameras depicted as icons with a white interior indicate the presence of two cameras at the same position, arranged on two different levels: high-mounted cameras positioned overhead and middle-mounted cameras placed horizontally parallel to the capture volume. This configuration ensured comprehensive coverage, providing both top-down and horizontal perspectives for motion capture and analysis.
Applsci 15 03847 g002
Figure 3. Single participant example of the Bland–Altman plots of the jump height (meters) and take-off angle (°) data. For all participants, no more than two data points fell outside the acceptable difference range, with most participants displaying no data points falling outside the limits of agreement range, indicating high agreeability between the outputs from both systems.
Applsci 15 03847 g003
Figure 4. (Top half) a single participant example of the mean trajectories and standard deviations for the right knee joint angle of the Xsens (blue line and shaded area) and Vicon (red line and shaded area) systems during the layup shot. (Bottom half) The paired-samples t-test statistic SPM {t}. The critical threshold of 3.321 (red dashed line) was exceeded at time 0–10%, with a supra-threshold cluster probability of p = 0.001 indicating a significantly more extended angle detection from the Vicon system.
Applsci 15 03847 g004
Figure 5. (Top half) a single participant example of the mean trajectories and standard deviations for the flexion-extension and external-internal ankle joint angles of the Xsens (blue line and shaded area) and Vicon (red line and shaded area) systems during the layup shot. (Bottom half) (a) The paired-samples t-test statistic SPM {t} shows the critical threshold of 3.391 (red dashed line) being exceeded at time ~5–14%, with a supra-threshold cluster probability of p < 0.001 indicating a significantly more dorsiflexed angle detected by the Xsens than the Vicon system. (b) Supra-threshold clusters at time 0–8 and 15–20% of the ankle external-internal joint angle (p = 0.011, p = 0.013) indicated a more everted ankle joint from the Xsens system, but then, a more everted ankle joint from the Vicon system before the two waveforms displayed no significant difference across the remaining part of the task.
Applsci 15 03847 g005
Figure 6. (Top half) a single participant example of the mean trajectories and standard deviations for the wrist joint angle of the Xsens (blue line and shaded area) and Vicon (red line and shaded area) systems during the layup shot. (Bottom half) The paired-samples t-test statistic SPM {t}, indicating homogenous waveforms from the two systems, as no supra-threshold clusters exceeded the critical-t lines.
Applsci 15 03847 g006
Figure 7. (a) An example of the difference between the shoulder joint angle output of the Vicon and Xsens, where the shoulder flexion-extension and external-internal joint angle trajectories did not exceed the dotted lines, which indicate the critical threshold for significance (t* = 3.007, t* = 3.027), while the shoulder’s abduction-adduction joint angle had supra-threshold clusters that crossed the significance threshold twice (t* = 3.047, p = 0.025, p = 0.044), but this occurred during consecutive time points not exceeding 6% of the task (0–3%, 70–76%). (b) Despite general waveforms agreement, significant differences were detected at separate instances for shoulder abduction-adduction and external-internal joint angles, evident by sizable supra-threshold clusters crossing the critical-t line (t* = 3.132, p = 0.022, p < 0.001; t* = 3.186, p < 0.001). Time window of clusters occurring roughly before and after take-off.
Applsci 15 03847 g007aApplsci 15 03847 g007b
Figure 8. SPM plots of the between-condition differences as detected by the Xsens and Vicon systems for the elbow external-internal angle (a) and knee flexion-extension angle (b) during the layup task under two conditions: defended and undefended. Significant but consistent differences were detected between the conditions from the two systems, as revealed by the supra-threshold clusters exceeding critical-t value for the elbow external-internal angle in Xsens (t* = 3.615, p < 0.001, p = 0.041) and Vicon (t* = 3.617, p < 0.001, p = 0.019) appearing roughly within the same time windows (Xsens: 40–60%, 65–70% and 97–100%, Vicon: 37–57%, 65–70% and 96–100%). Consistency in the detection of change was also observed for the knee flexion-extension angle for Xsens (t* = 3.575, p = 0.003, p = 0.010) and Vicon (t* = 3.603, p = 0.036), spanning approximately 8–15% and 30–38% and 12–14% of the task, respectively.
Applsci 15 03847 g008
Figure 9. SPM plots of the between-condition differences detected by the Xsens (left) and Vicon (right) systems for the shoulder joint angles during the layup task under defended and undefended conditions. Significant condition-based differences, indicated by supra-threshold clusters exceeding the critical t-value, were consistently detected by both systems, occurring within similar time windows.
Applsci 15 03847 g009
Table 1. Offset between joint angles of both systems in degrees (°) presented as group mean (standard deviation) and the between-condition changes detected by each system and the offset between the systems; results of the jumping leg (right side).
Between-System RMSD (°)Between-Condition RMSD (°)
Joint Angle Right LimbLeft LimbXSENSVICONOffset *
ShoulderFlexion-extension9.3 (0.79)9.3 (3.88)21.423.52.1
Abduction-adduction11.2 (1.22)6.9 (1.13)11.210.90.3
External-internal12.8 (0.70)10.2 (2.81)17.822.74.9
ElbowFlexion-extension7.1 (0.74)5.5 (4.71)17.617.30.3
Supination-pronation9.9 (0.95)6.9 (1.60)17.220.73.5
WristFlexion-extension4.9 (0.98)5.1 (3.56)17.517.20.3
Ulnar-Radial Deviation5.4 (0.56)4.3 (1.23)8.37.60.7
HipFlexion-extension9.2 (0.81)9.4 (0.60)12.912.10.8
Abduction-adduction7.6 (1.46)7.26 (0.54)6.85.90.8
External-internal7.7 (0.70)7.6 (0.77)9.27.51.6
KneeFlexion-extension6.7 (0.74)7.3 (2.95)12.912.90.0
AnkleFlexion-extension5.6 (0.52)6.4 (1.37)9.48.90.5
External-internal4.9 (0.48)6.7 (0.59)4.94.10.8
* Difference between the change detected by Xsens and change detected by Vicon when comparing defended to undefended conditions.
Disclaimer/Publisher’s Note: The statements, opinions and data contained in all publications are solely those of the individual author(s) and contributor(s) and not of MDPI and/or the editor(s). MDPI and/or the editor(s) disclaim responsibility for any injury to people or property resulting from any ideas, methods, instructions or products referred to in the content.

