

Seismic Comparison of Hybrid Steel–Reinforced Concrete and Conventional Frames

Abstract
1. Introduction
2. Considered Buildings and Seismic Analysis
3. Results and Discussion
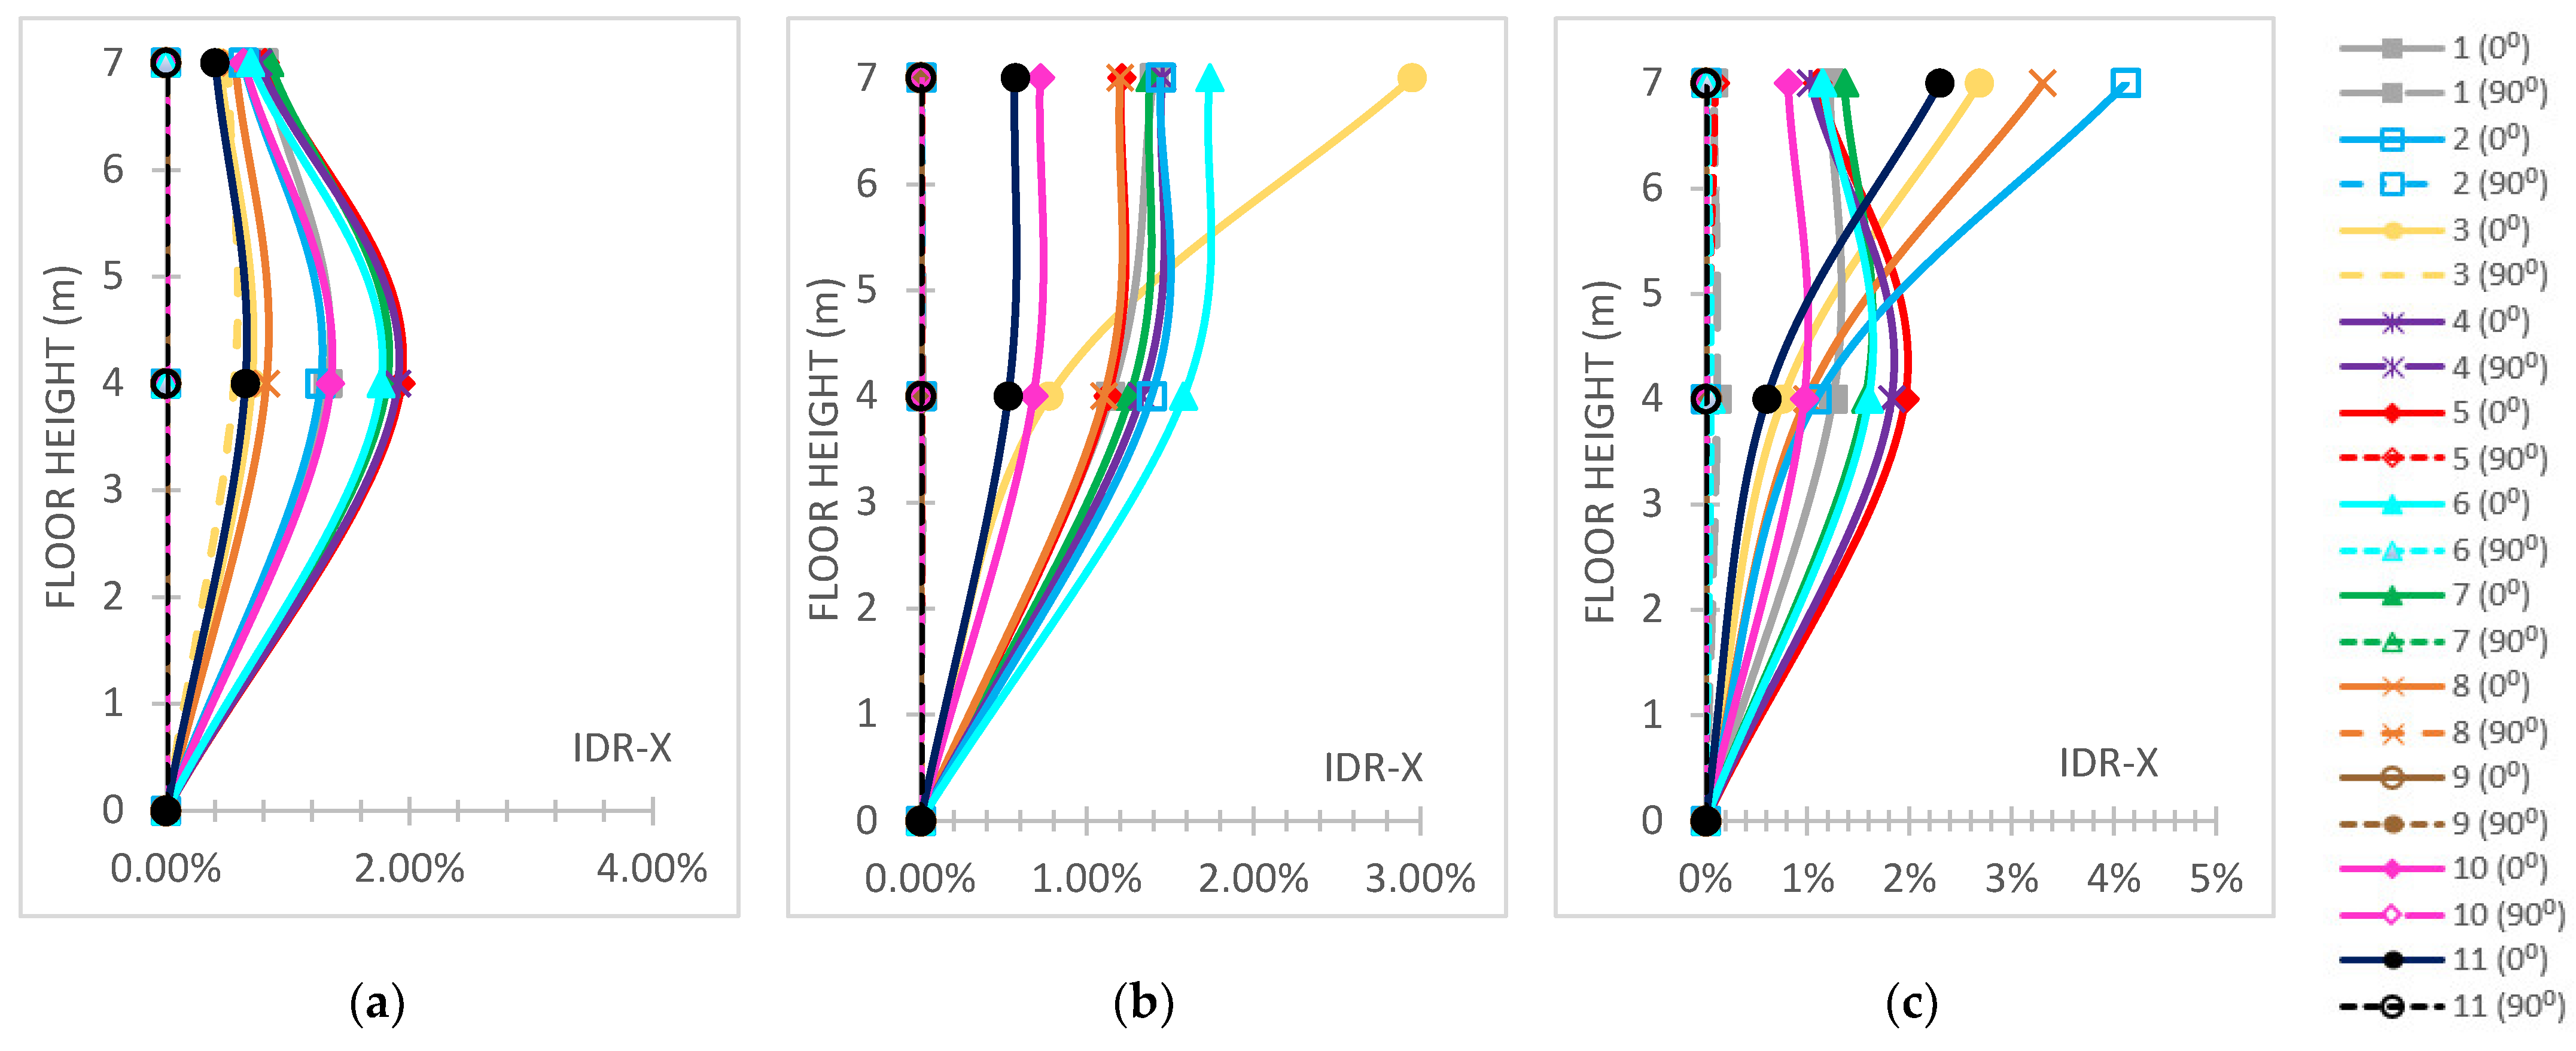
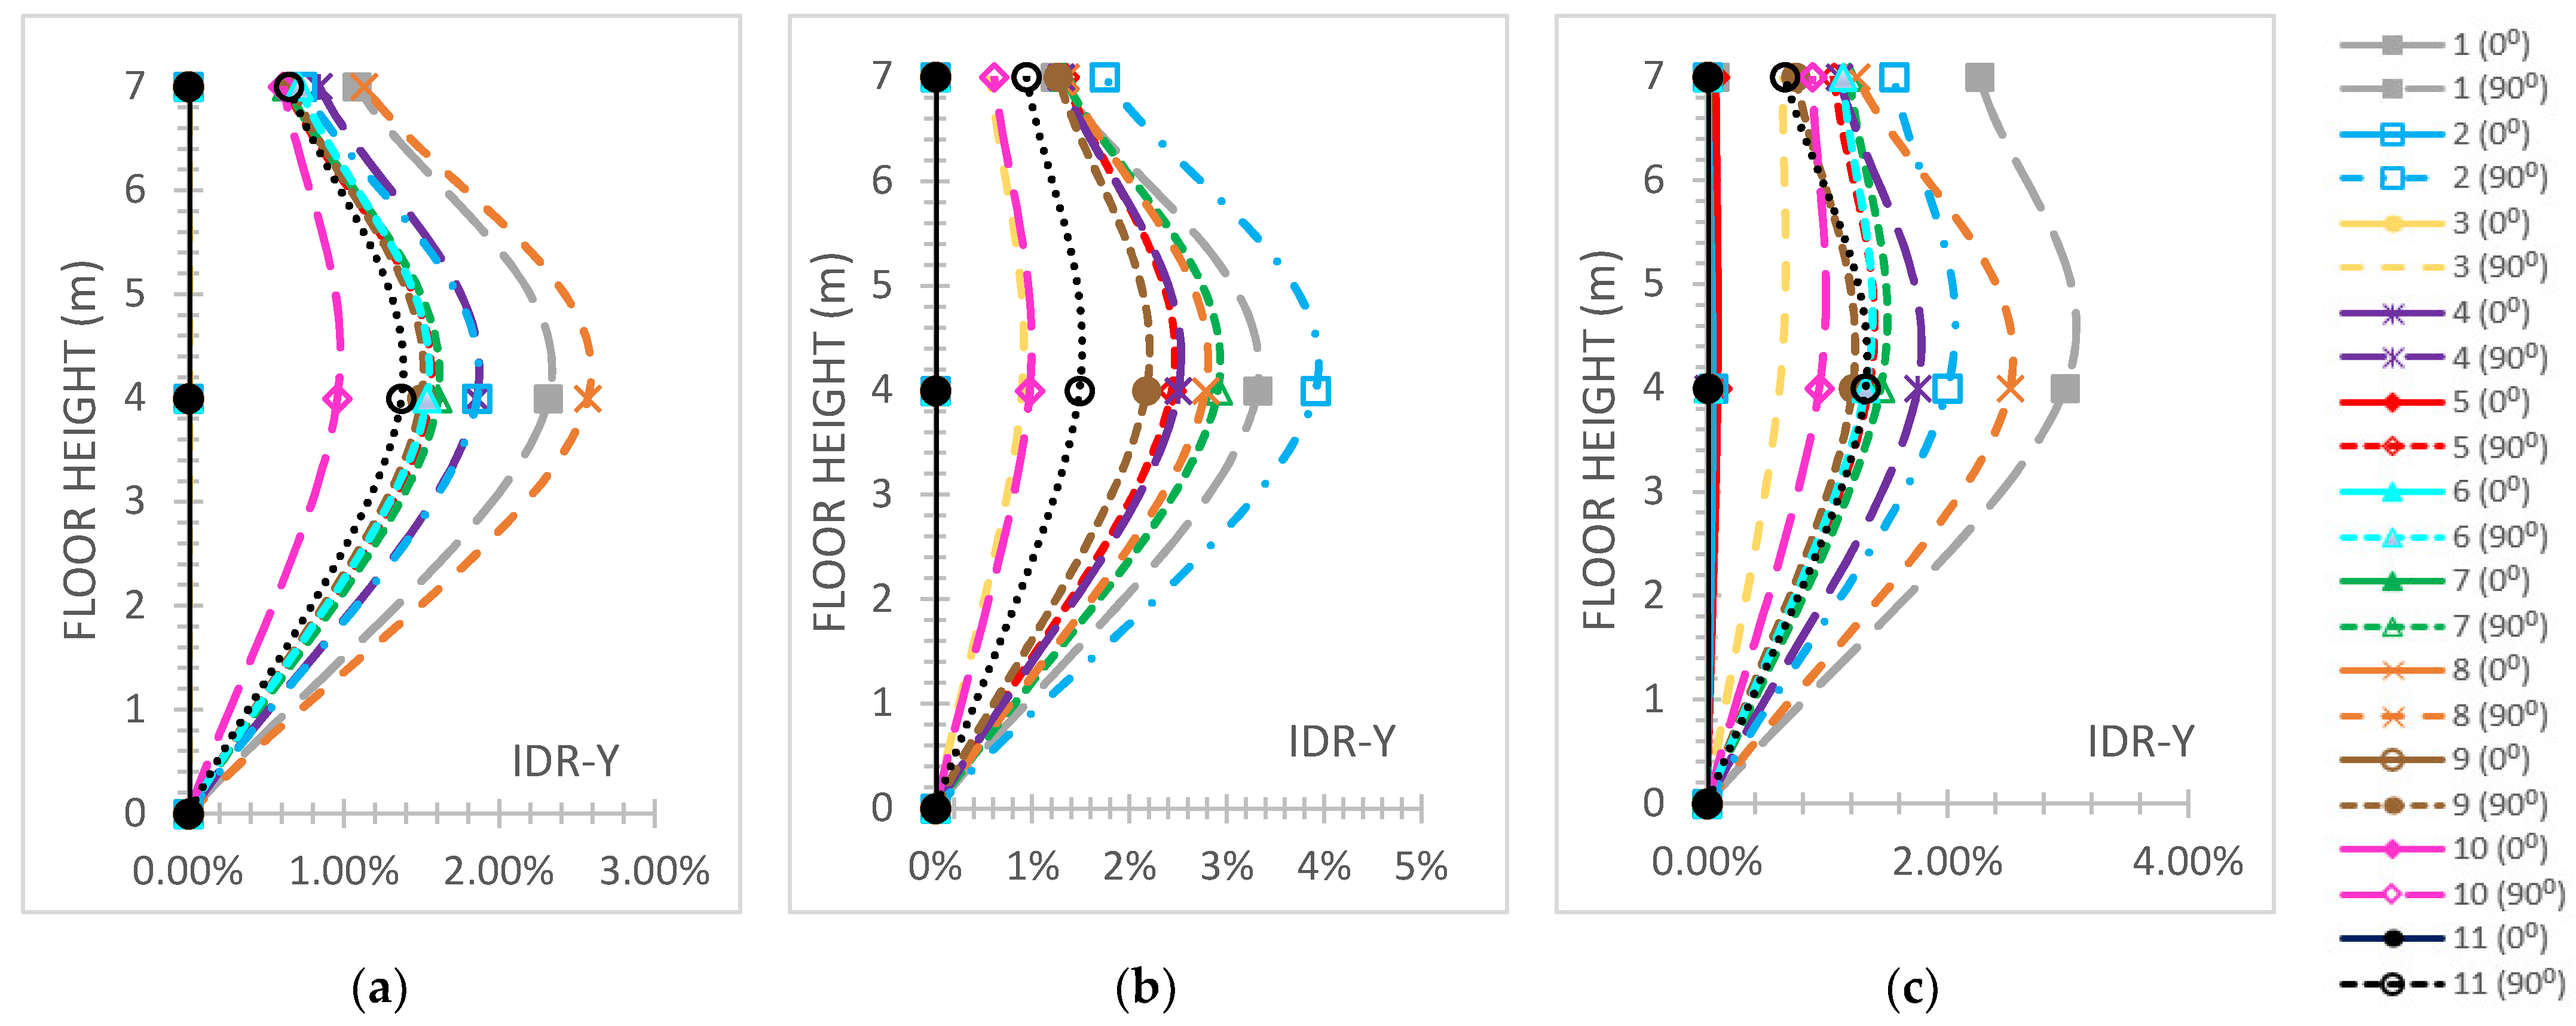
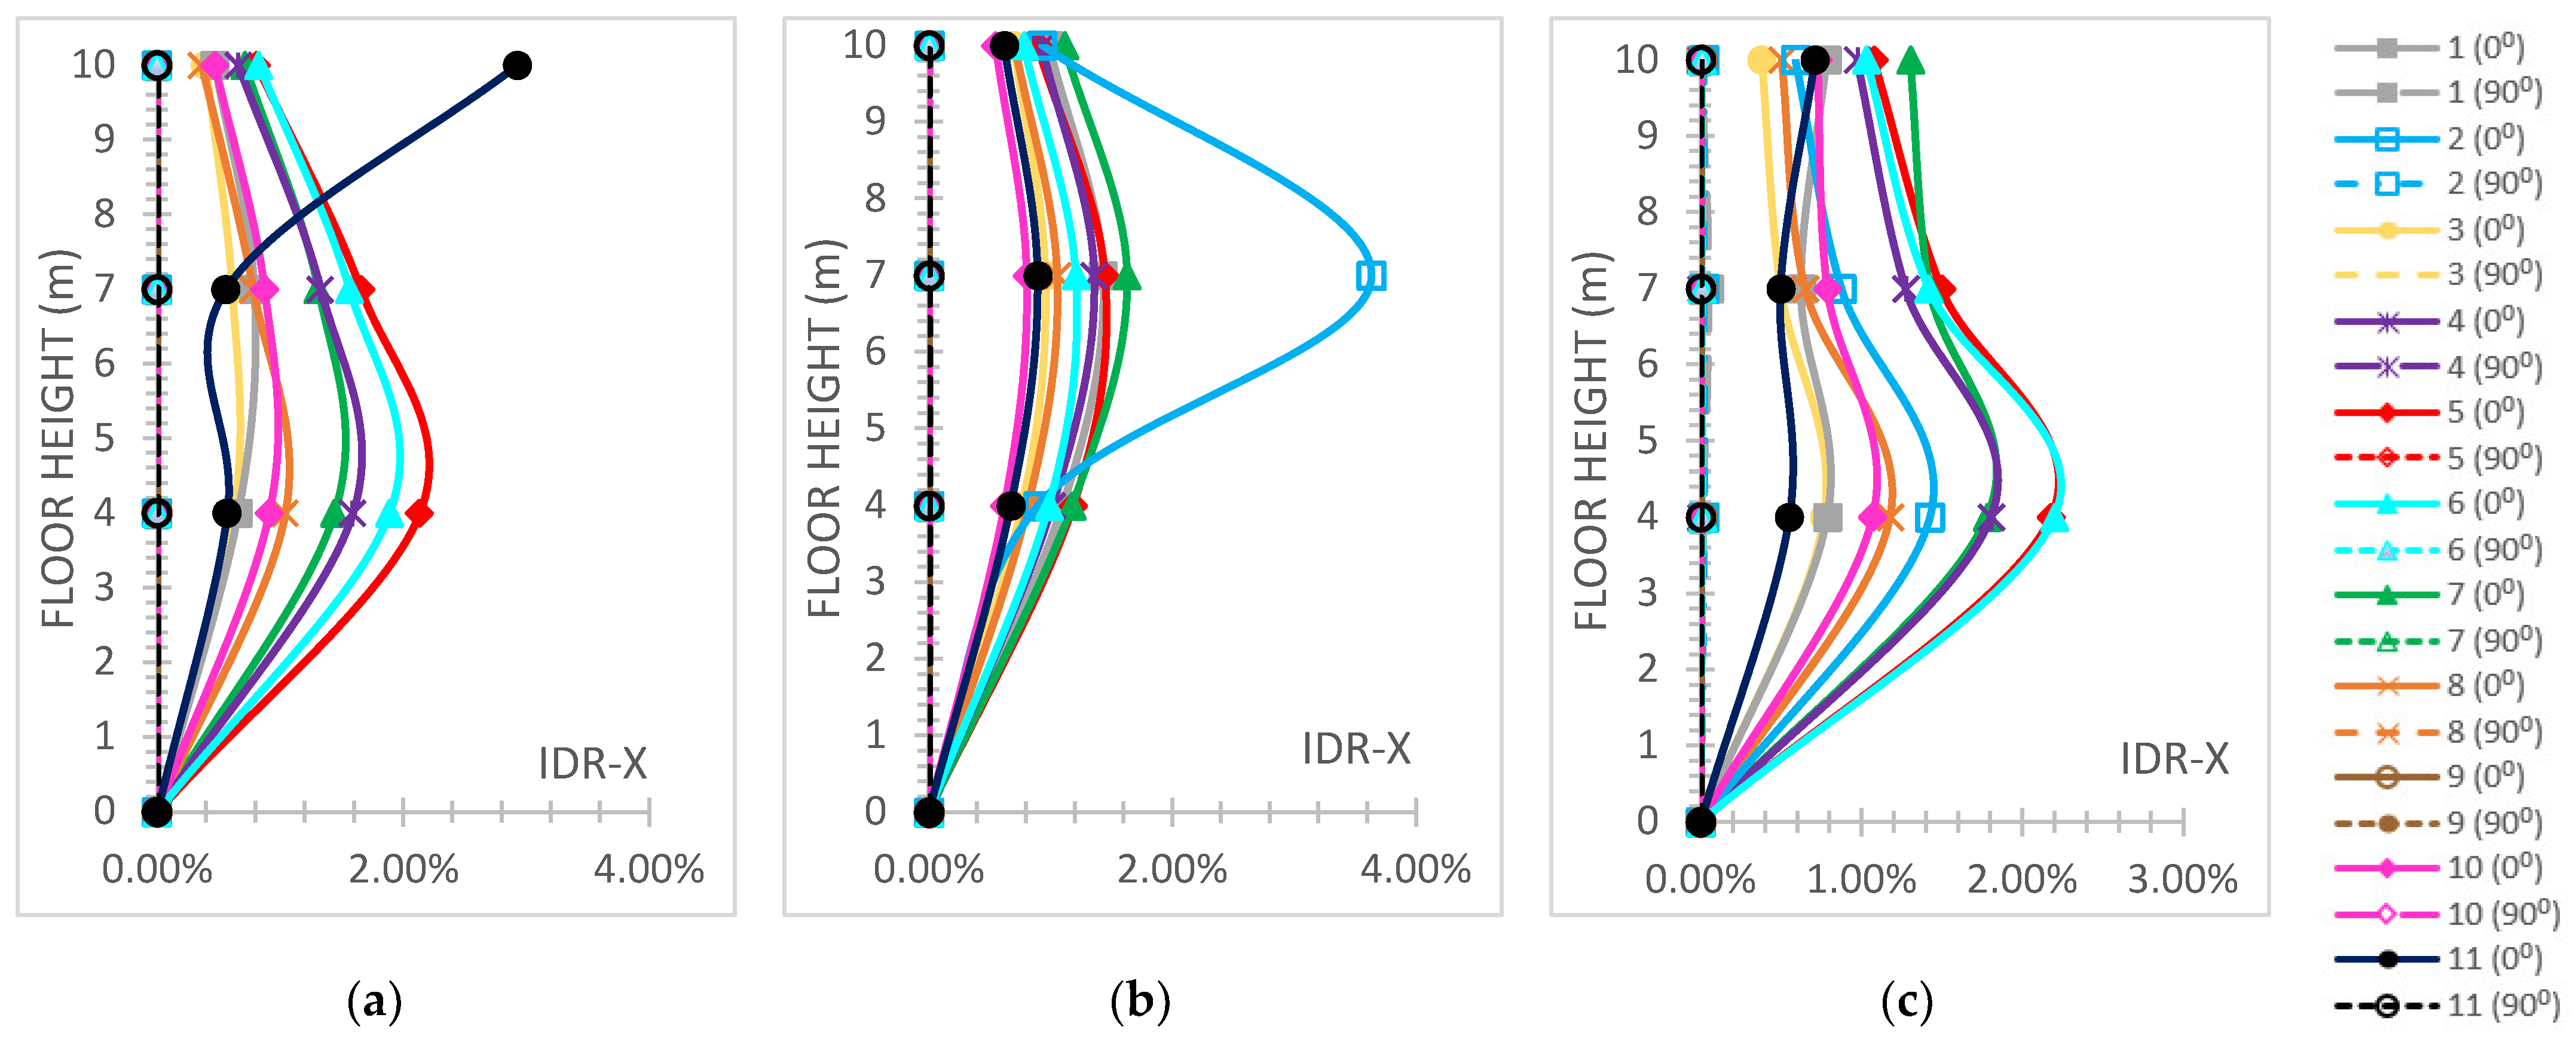
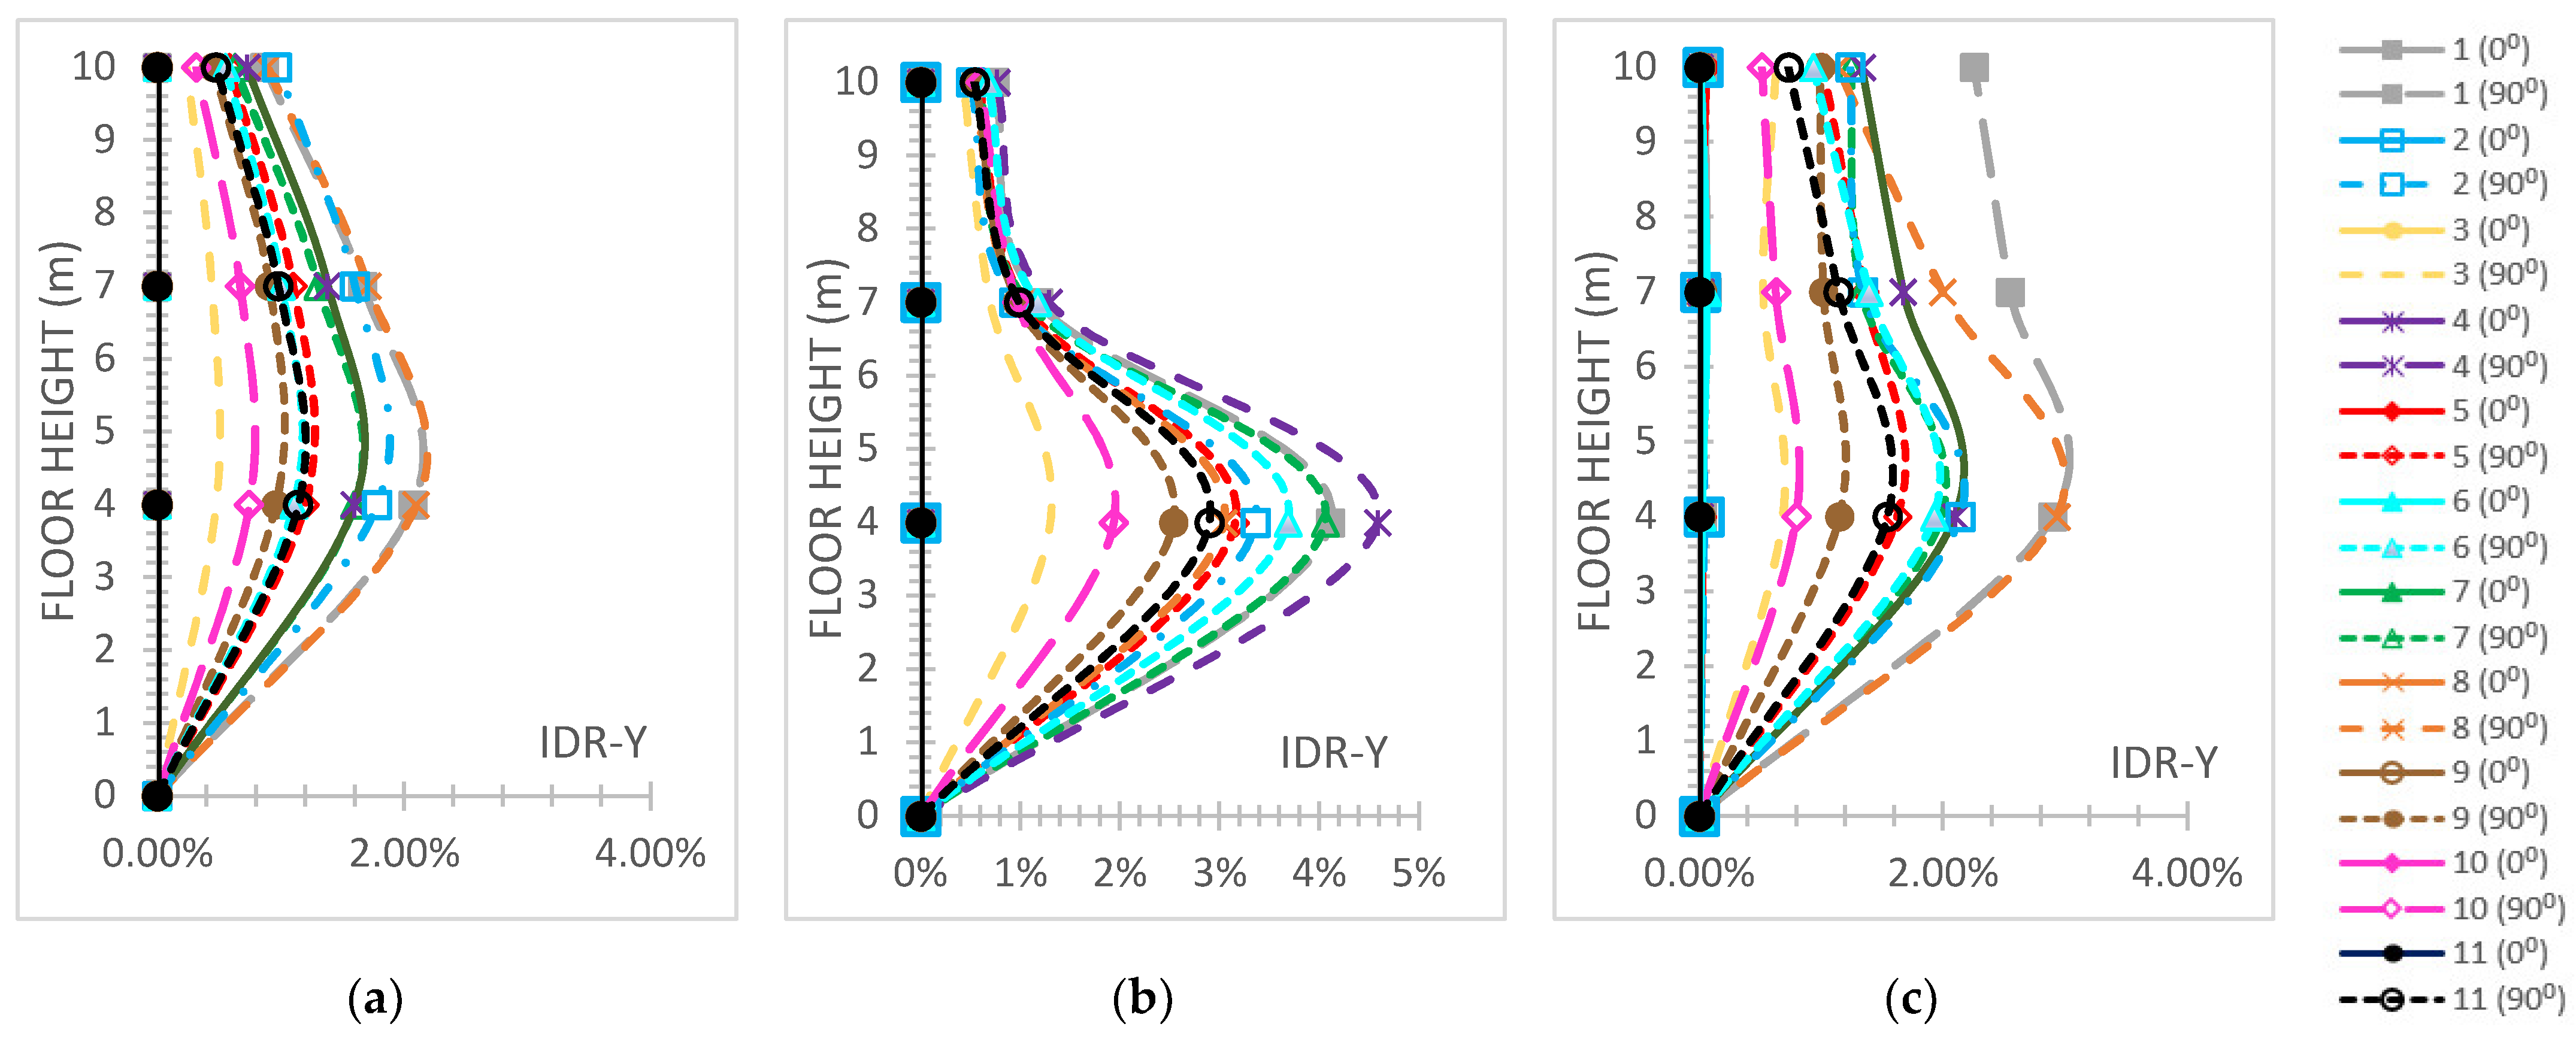
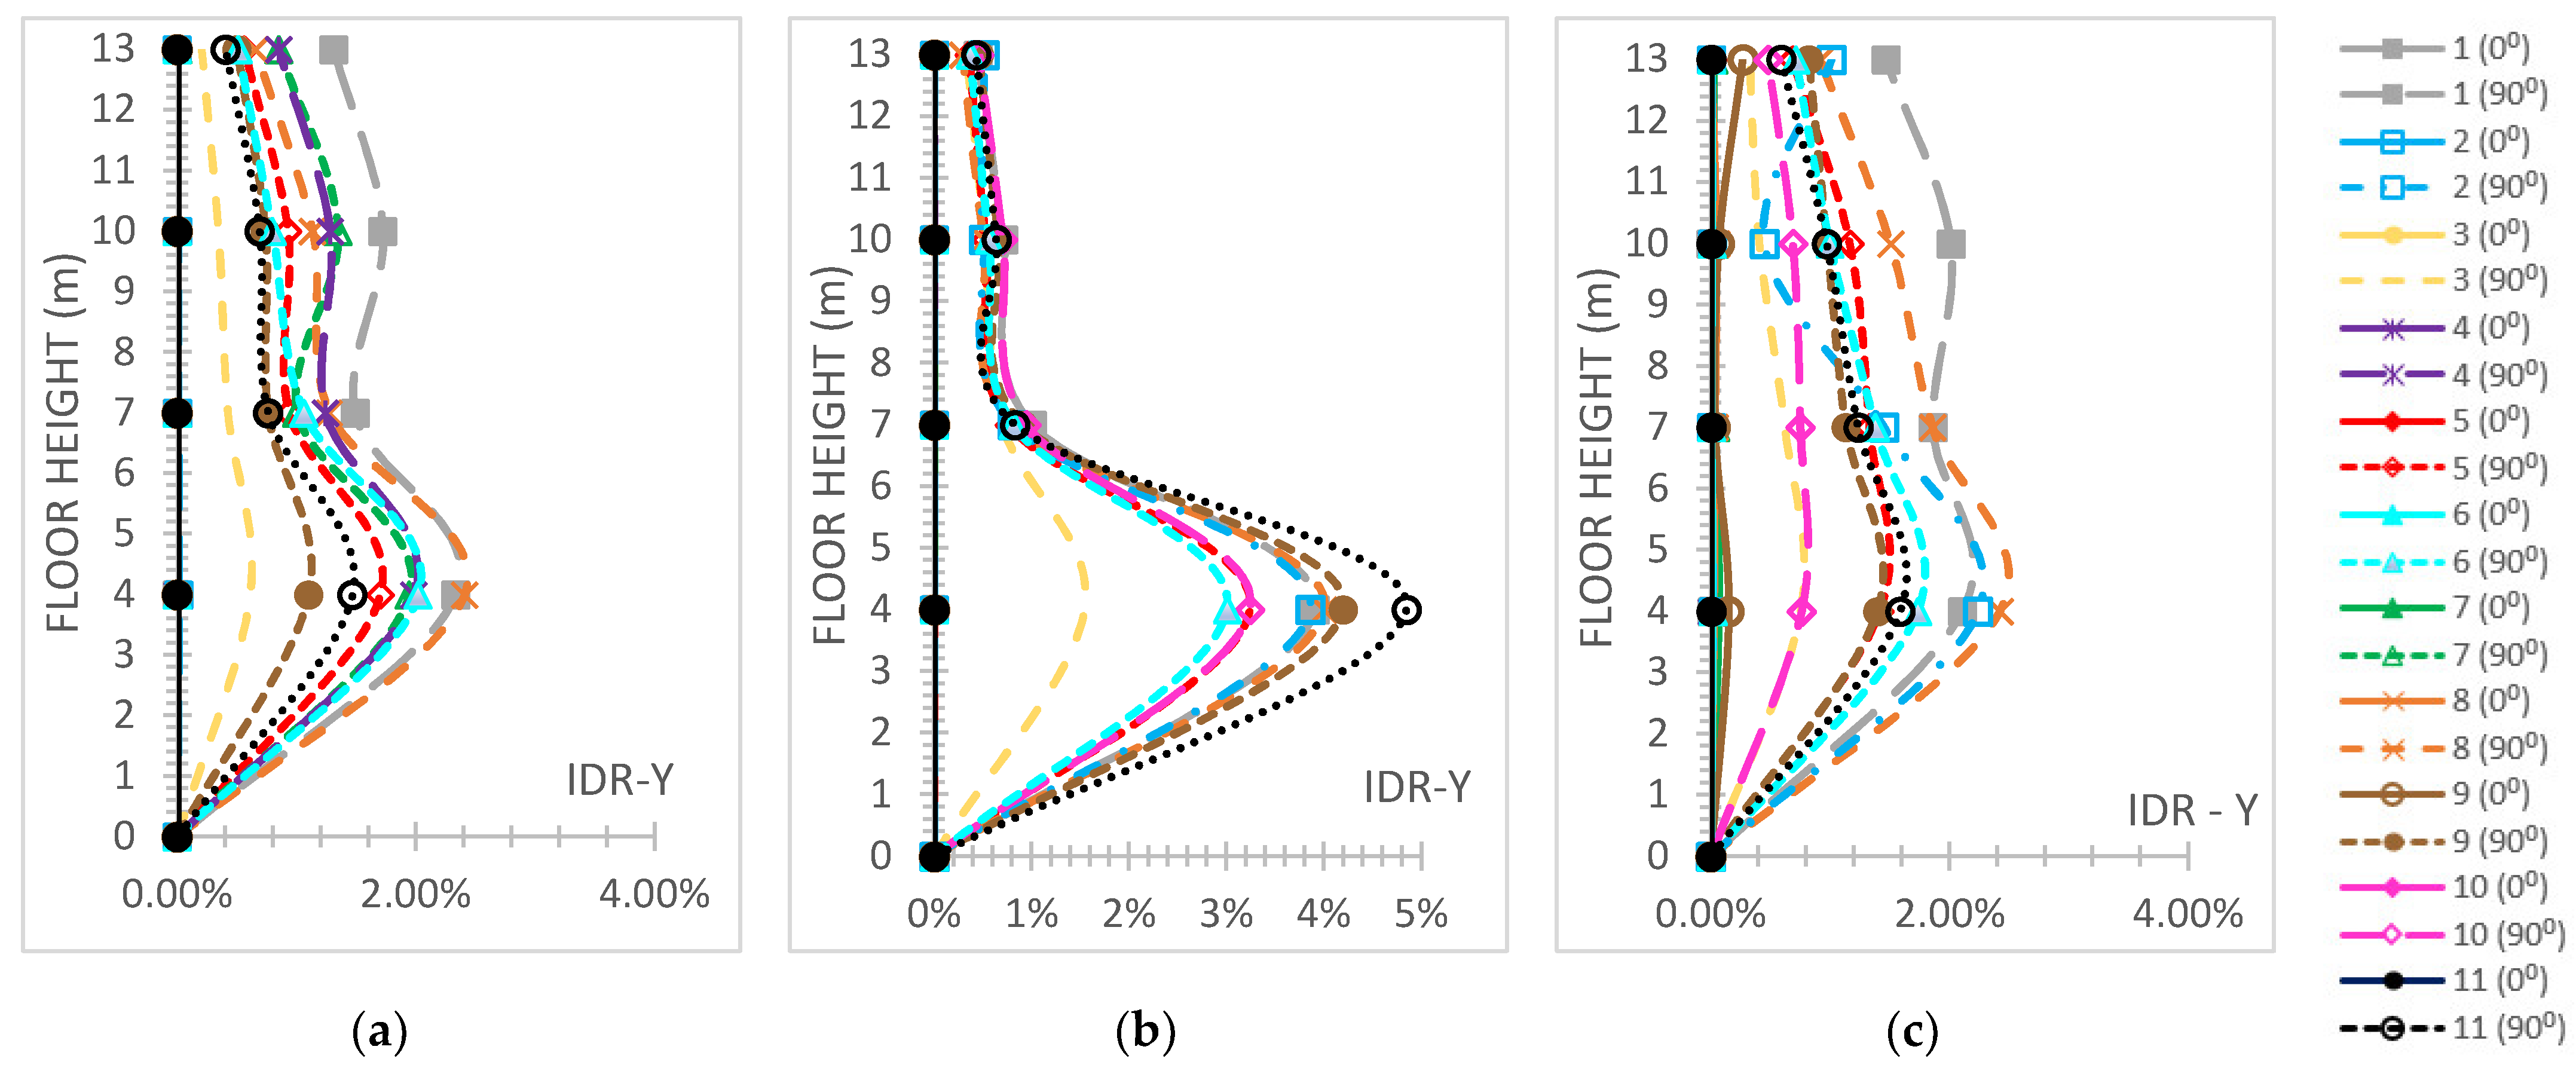
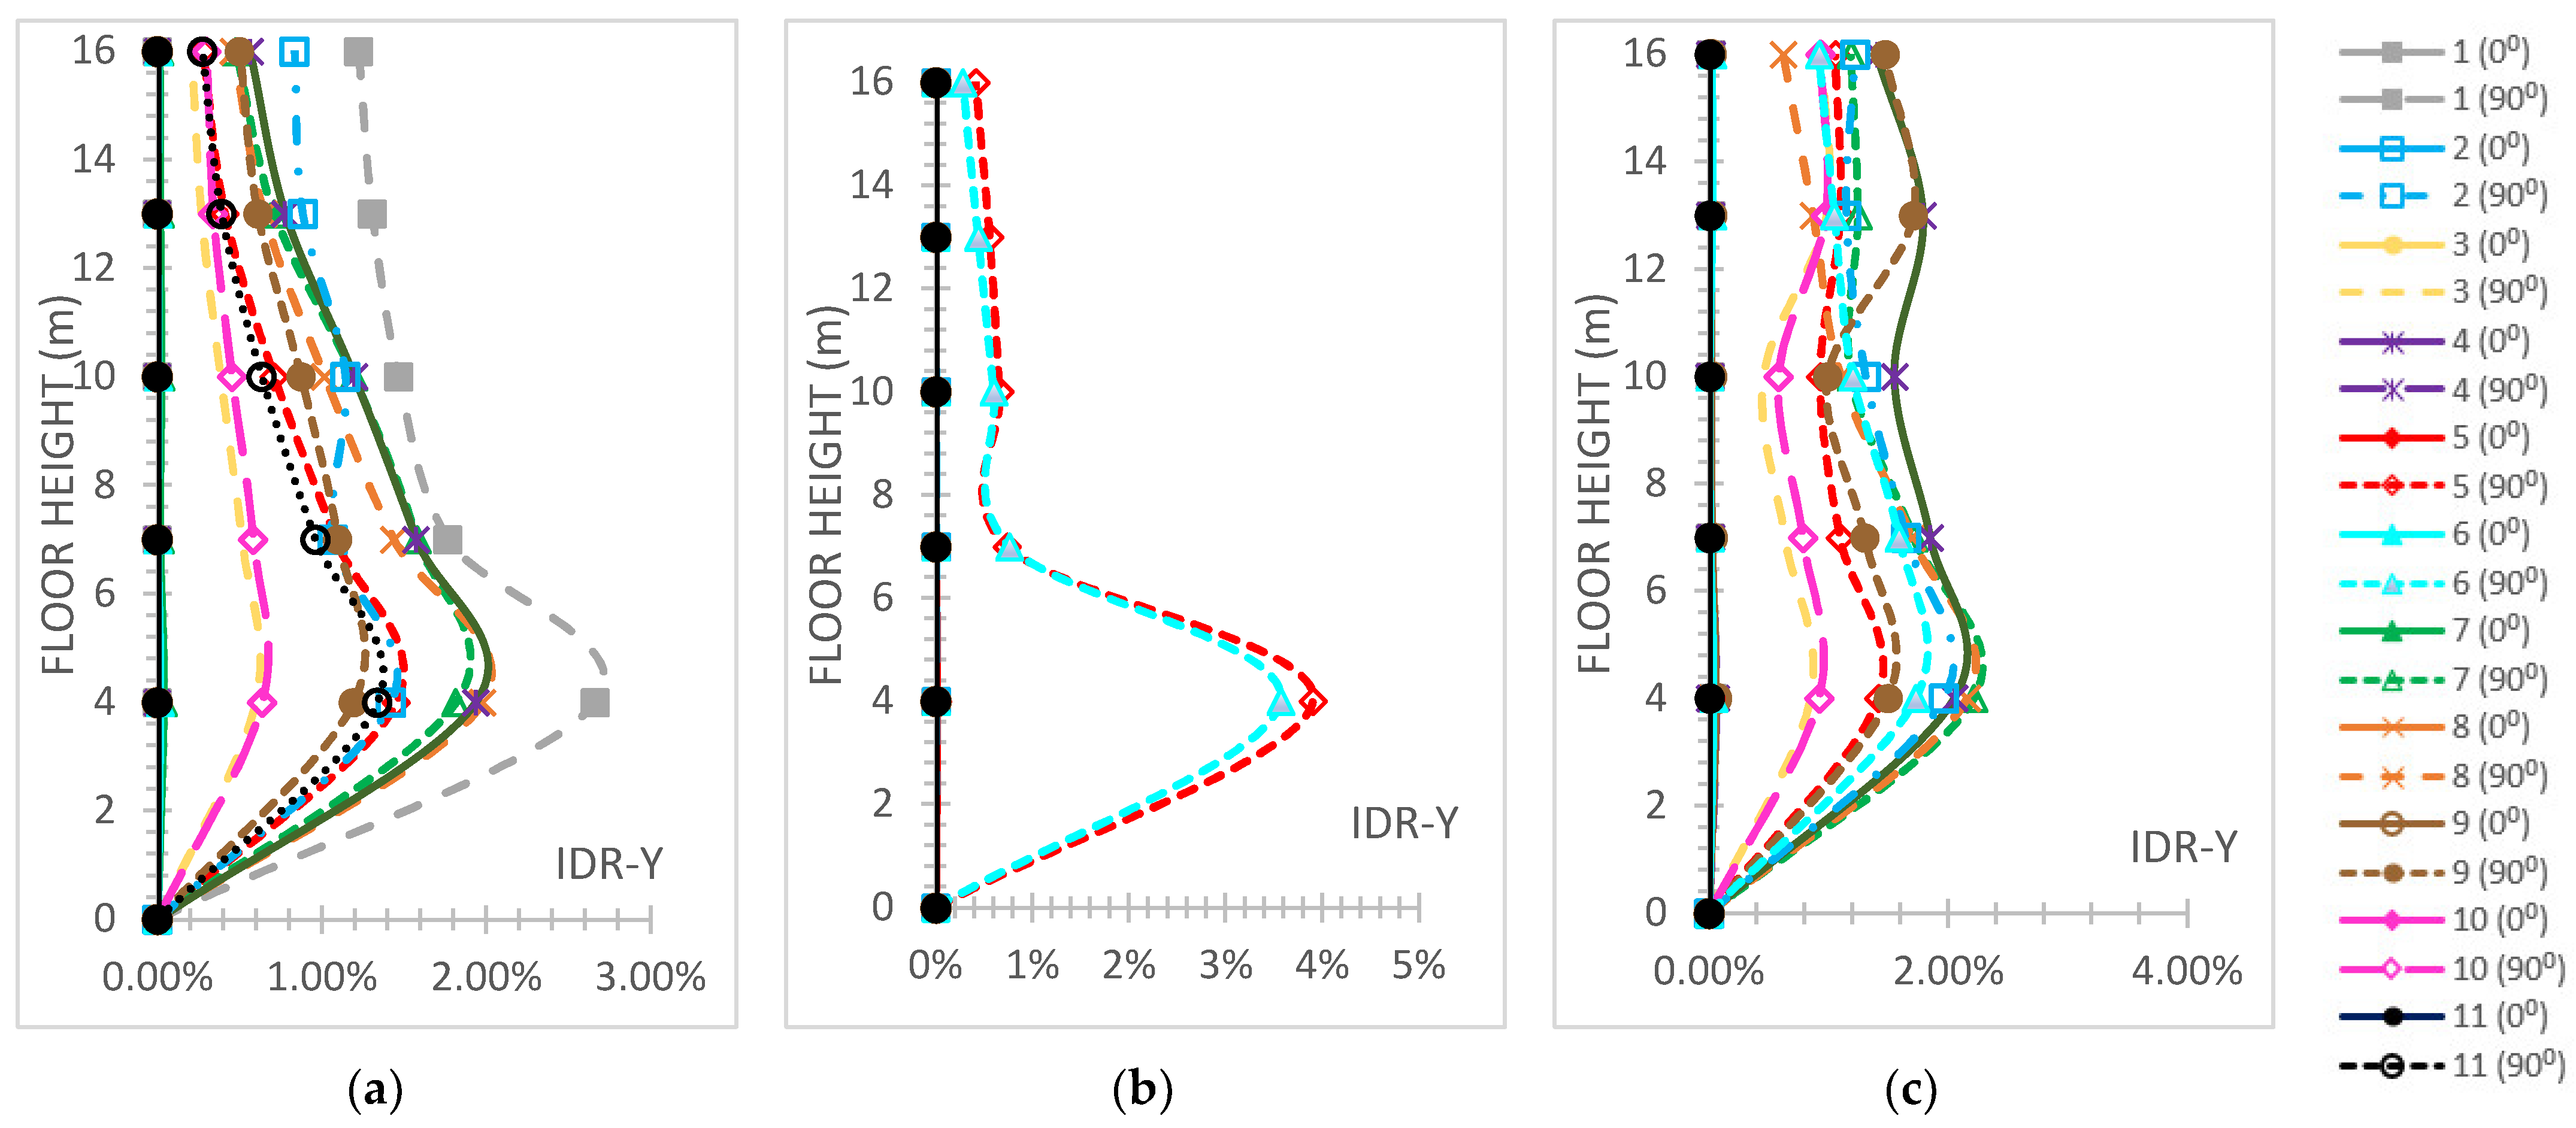
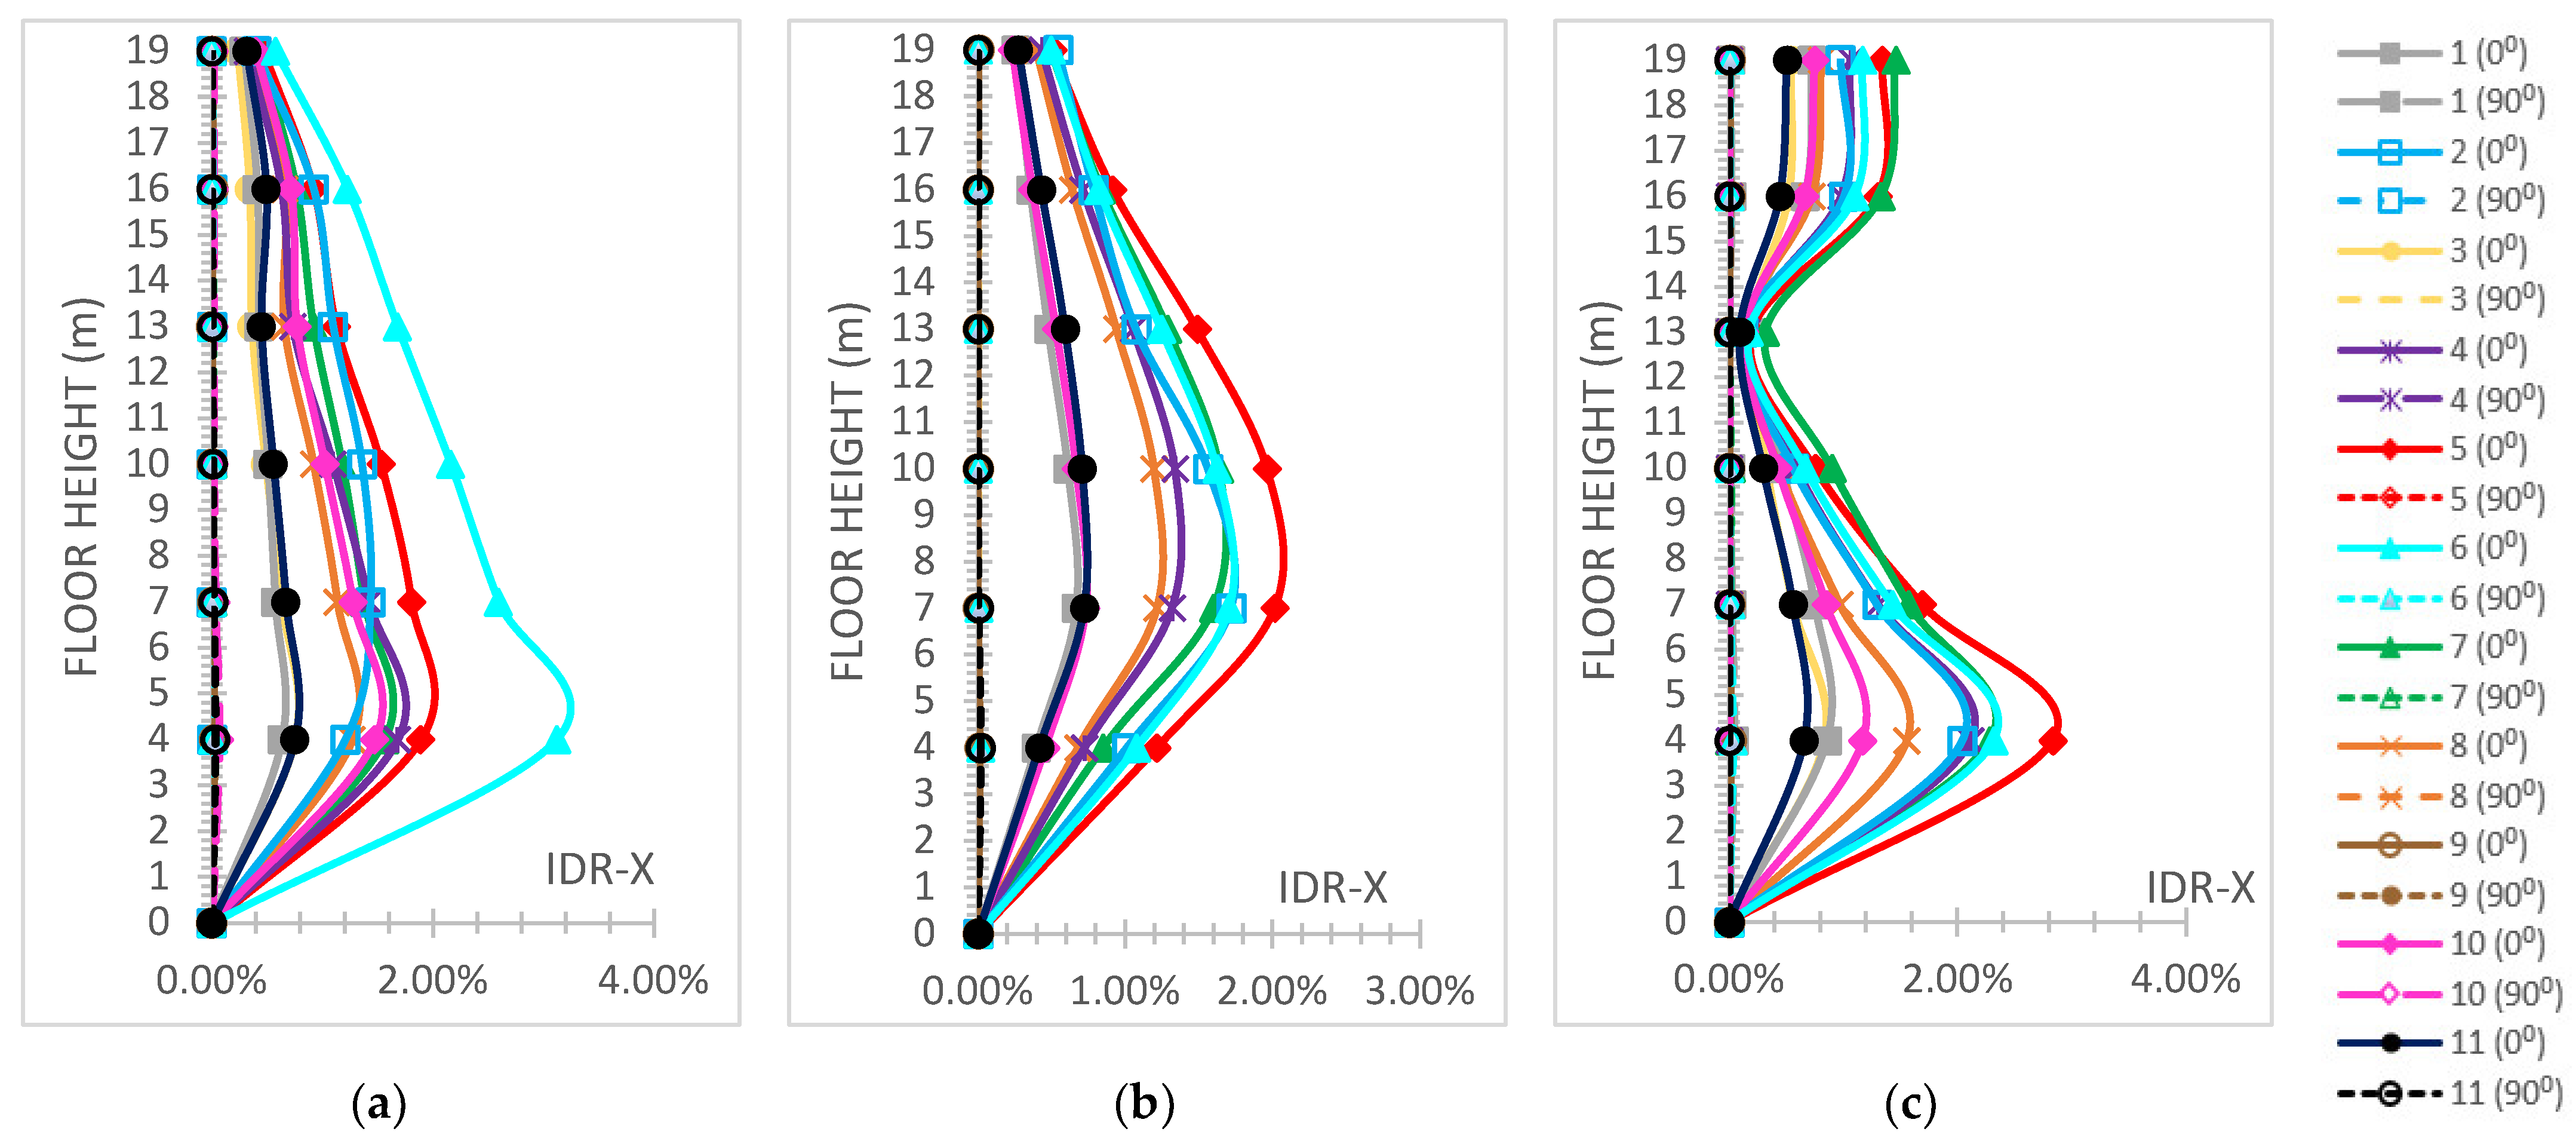
- The “interstorey drift ratio (IDR)” [59] on both horizontal global directions is represented and comparatively discussed according to the respective performance code limits [59], which are “1%” regarding “Immediate Occupancy (IO)”, “2%” regarding “Life Safety (LS)” and “4%“ regarding the “Collapse Prevention (CP)” levels concerning r/c MRFs; while for steel MRFs, the respective limit values are “0.7%” for “IO”, “2.5%” for “LS” and “5%” for the ”CP” levels [59]. The IDR plots present their distributions along the height of each building.
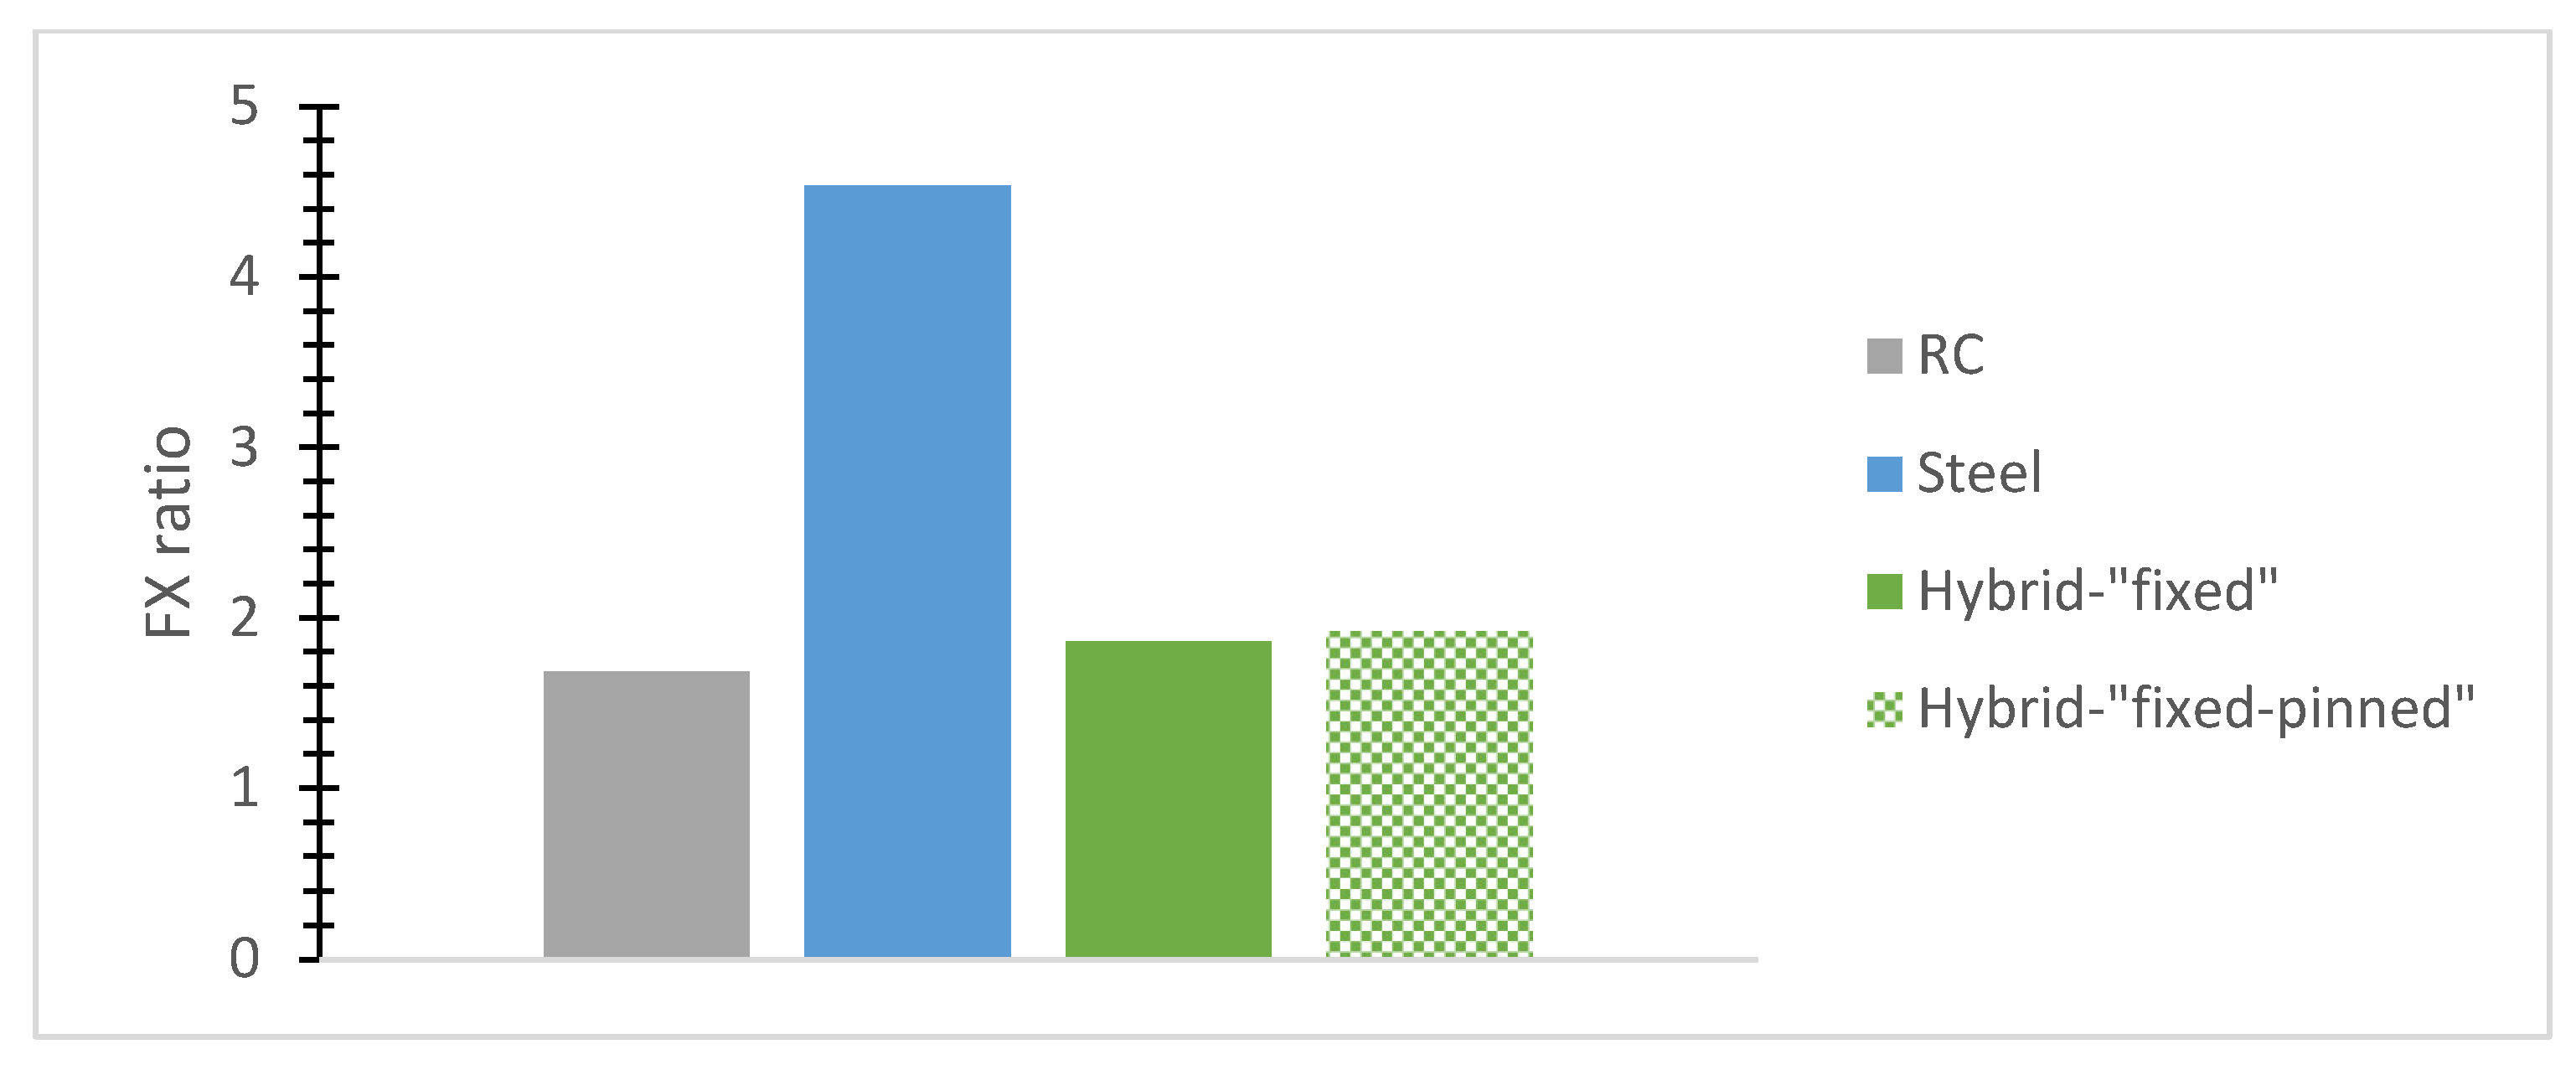
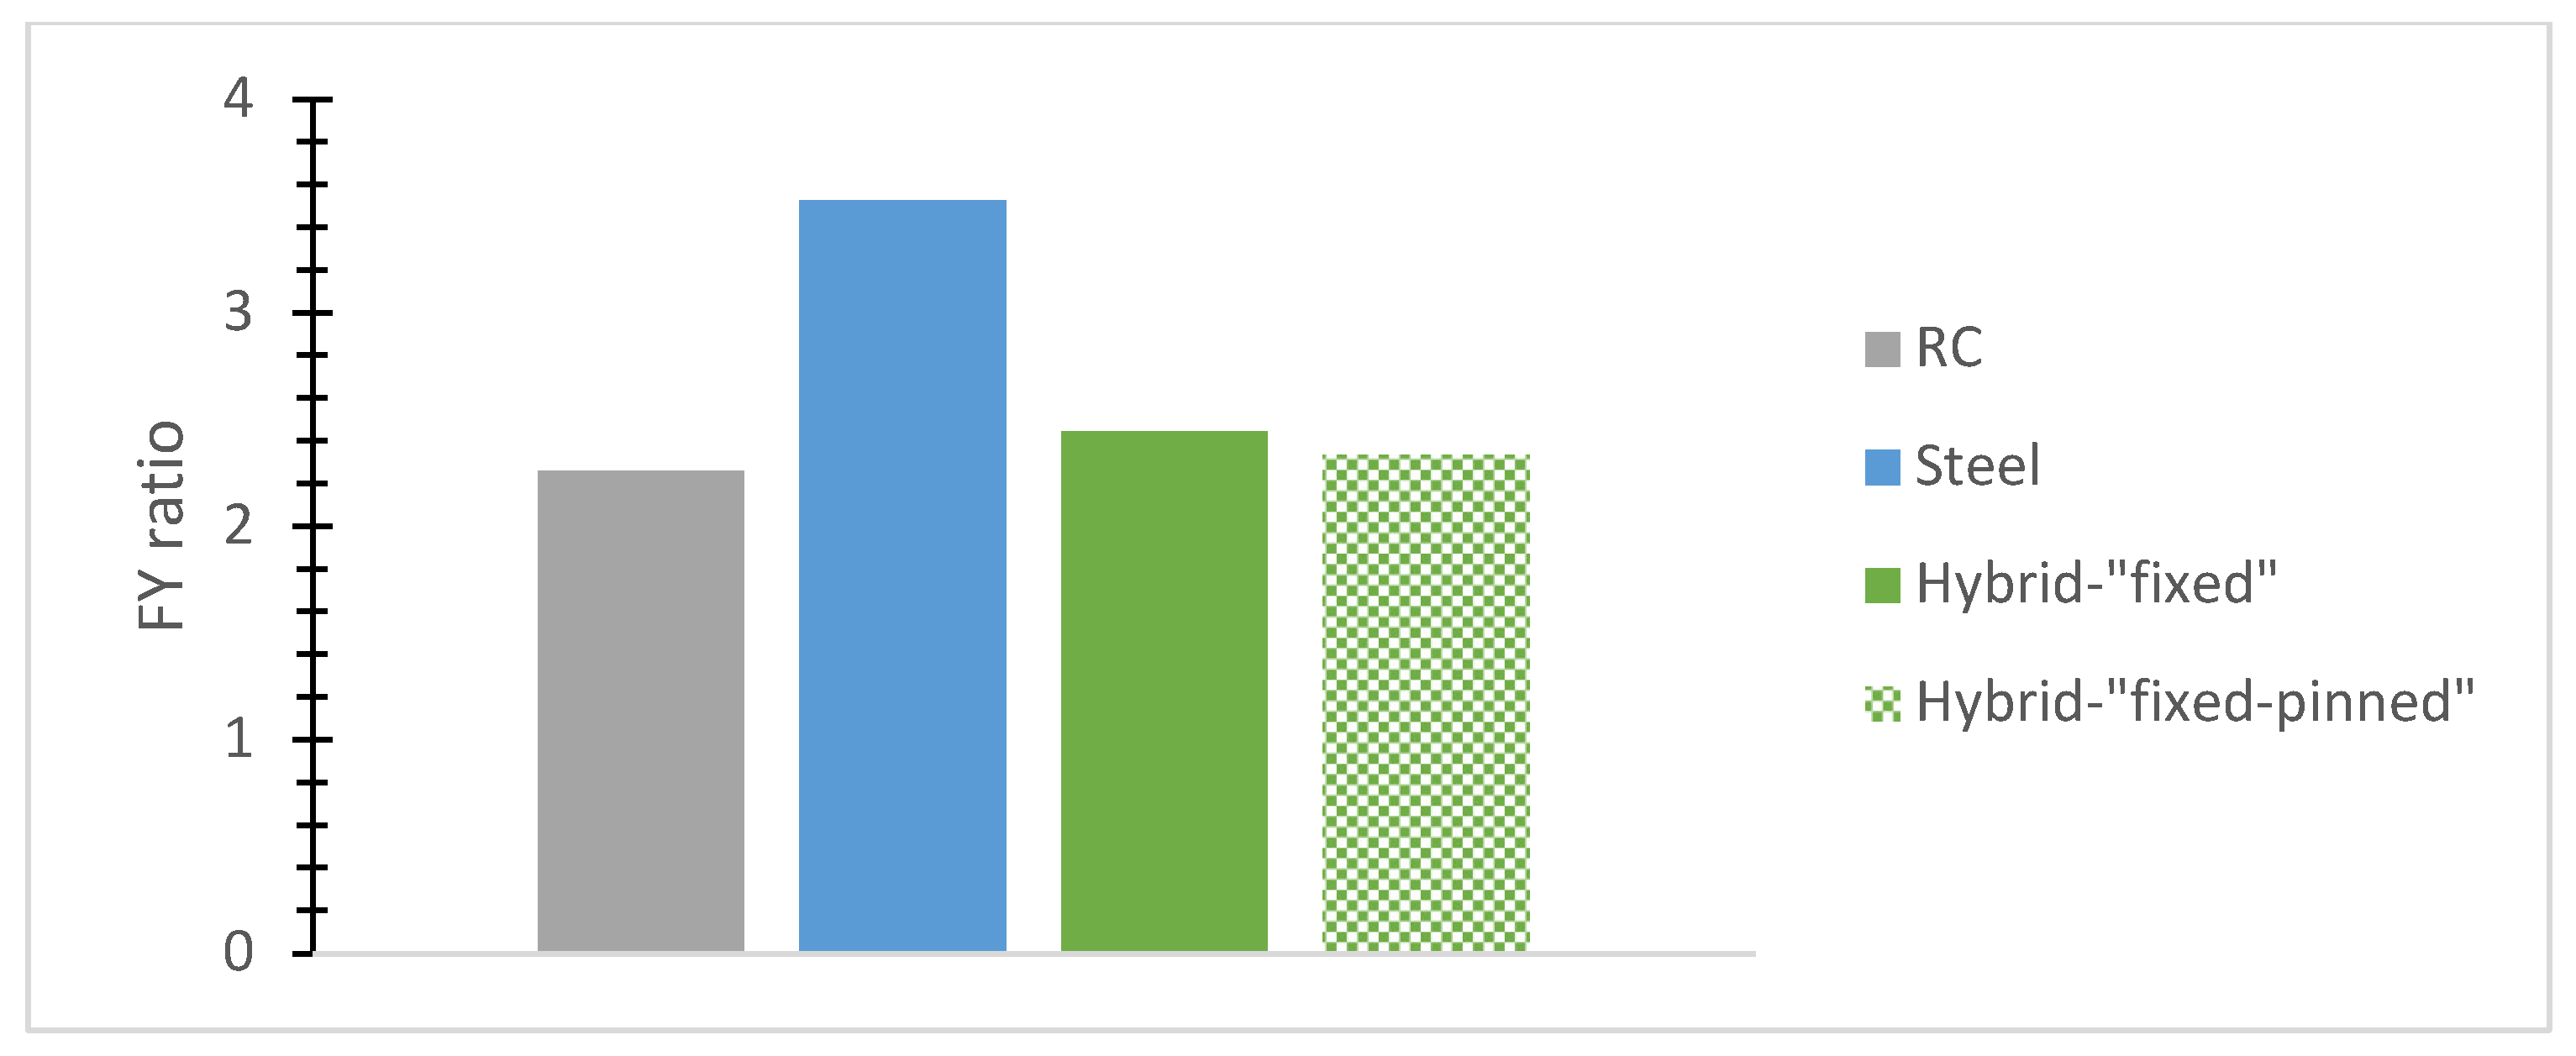
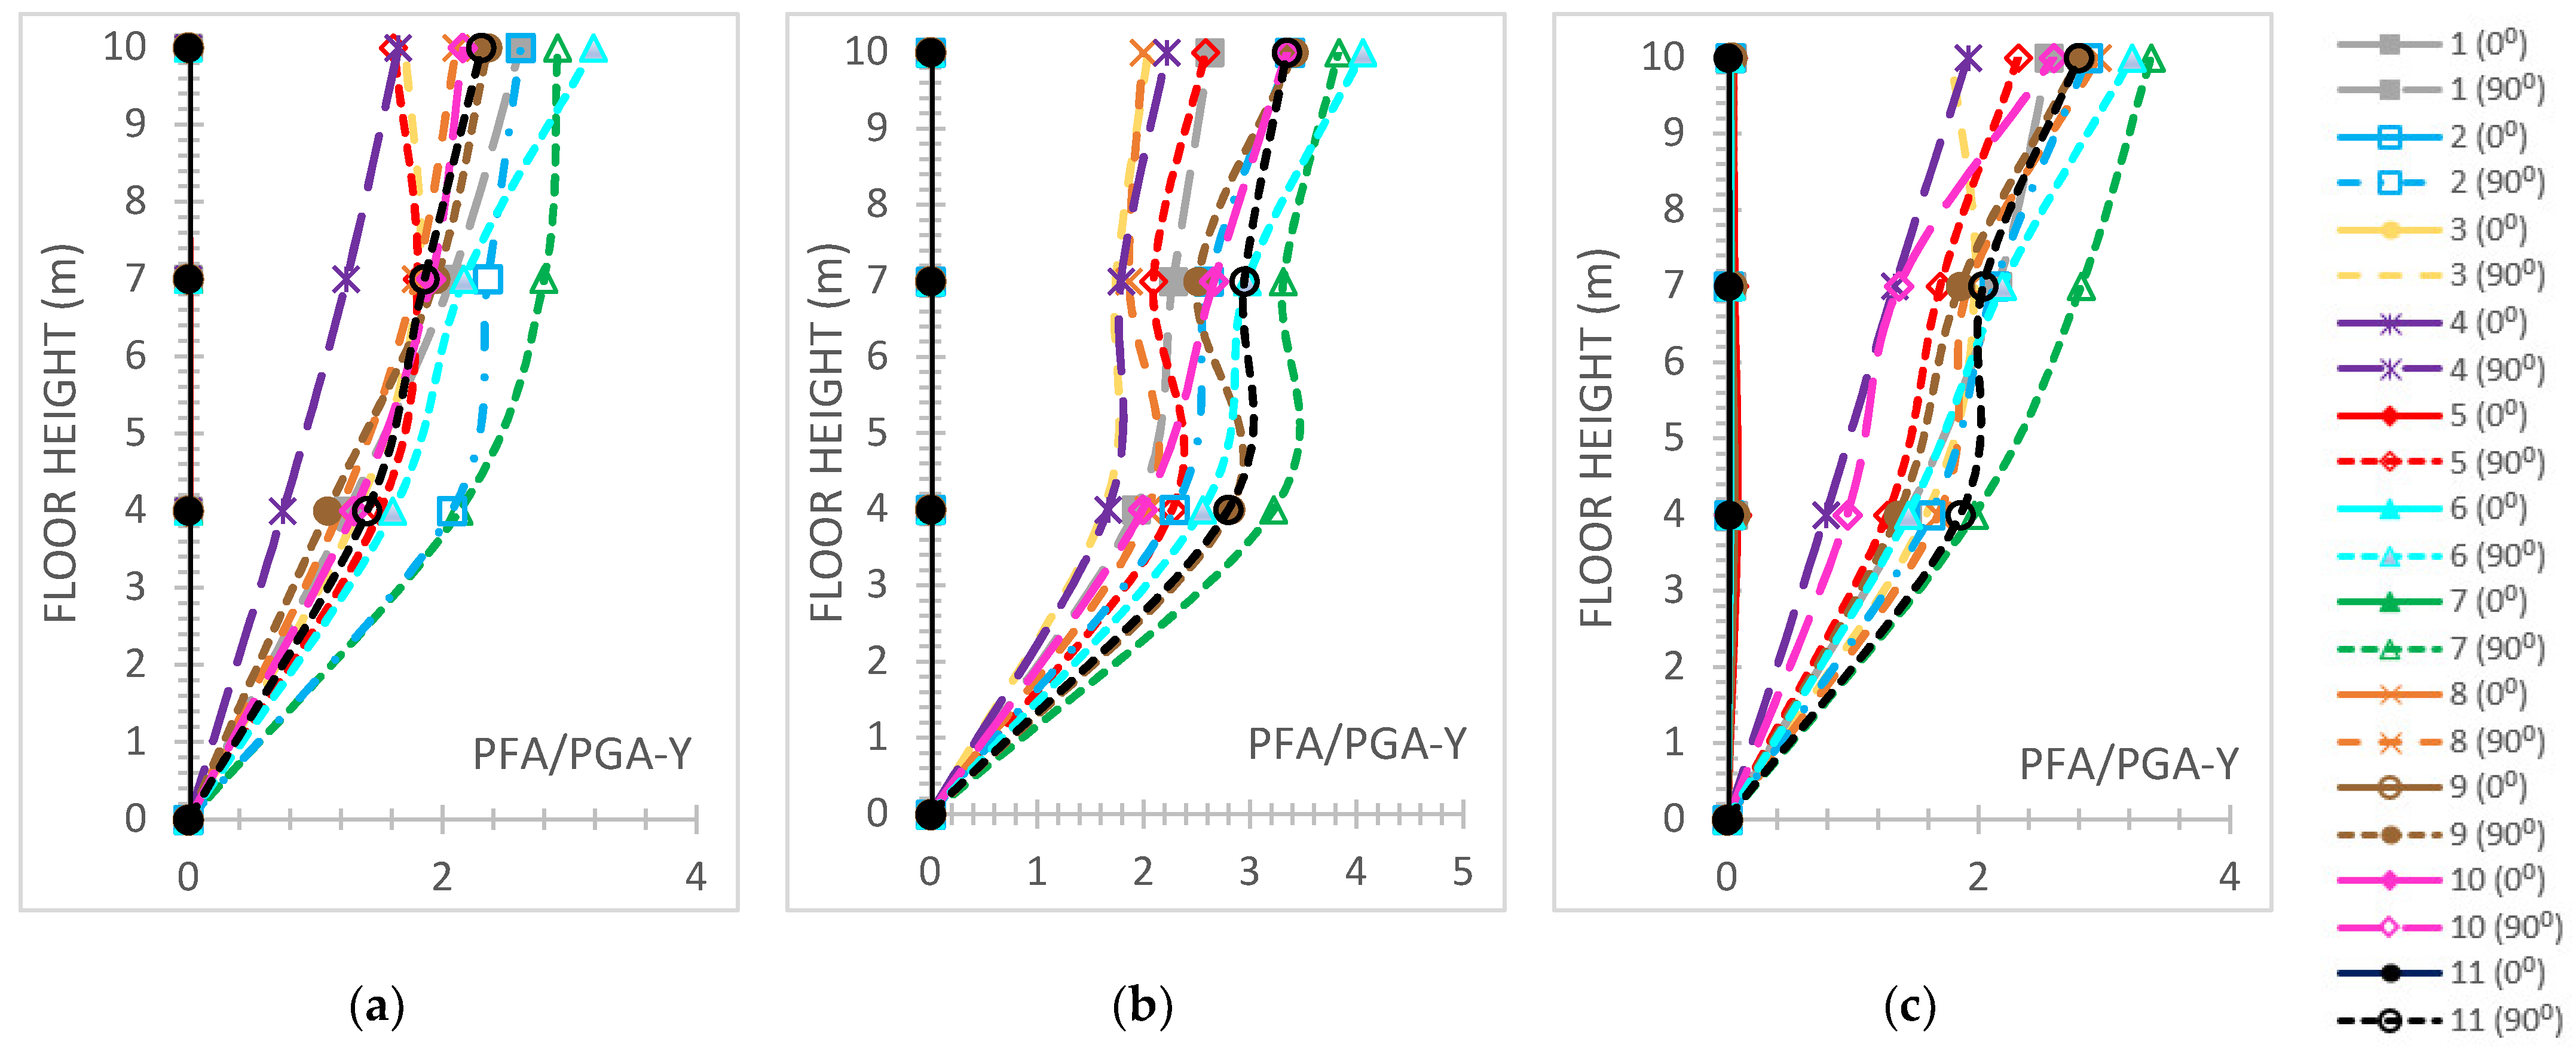
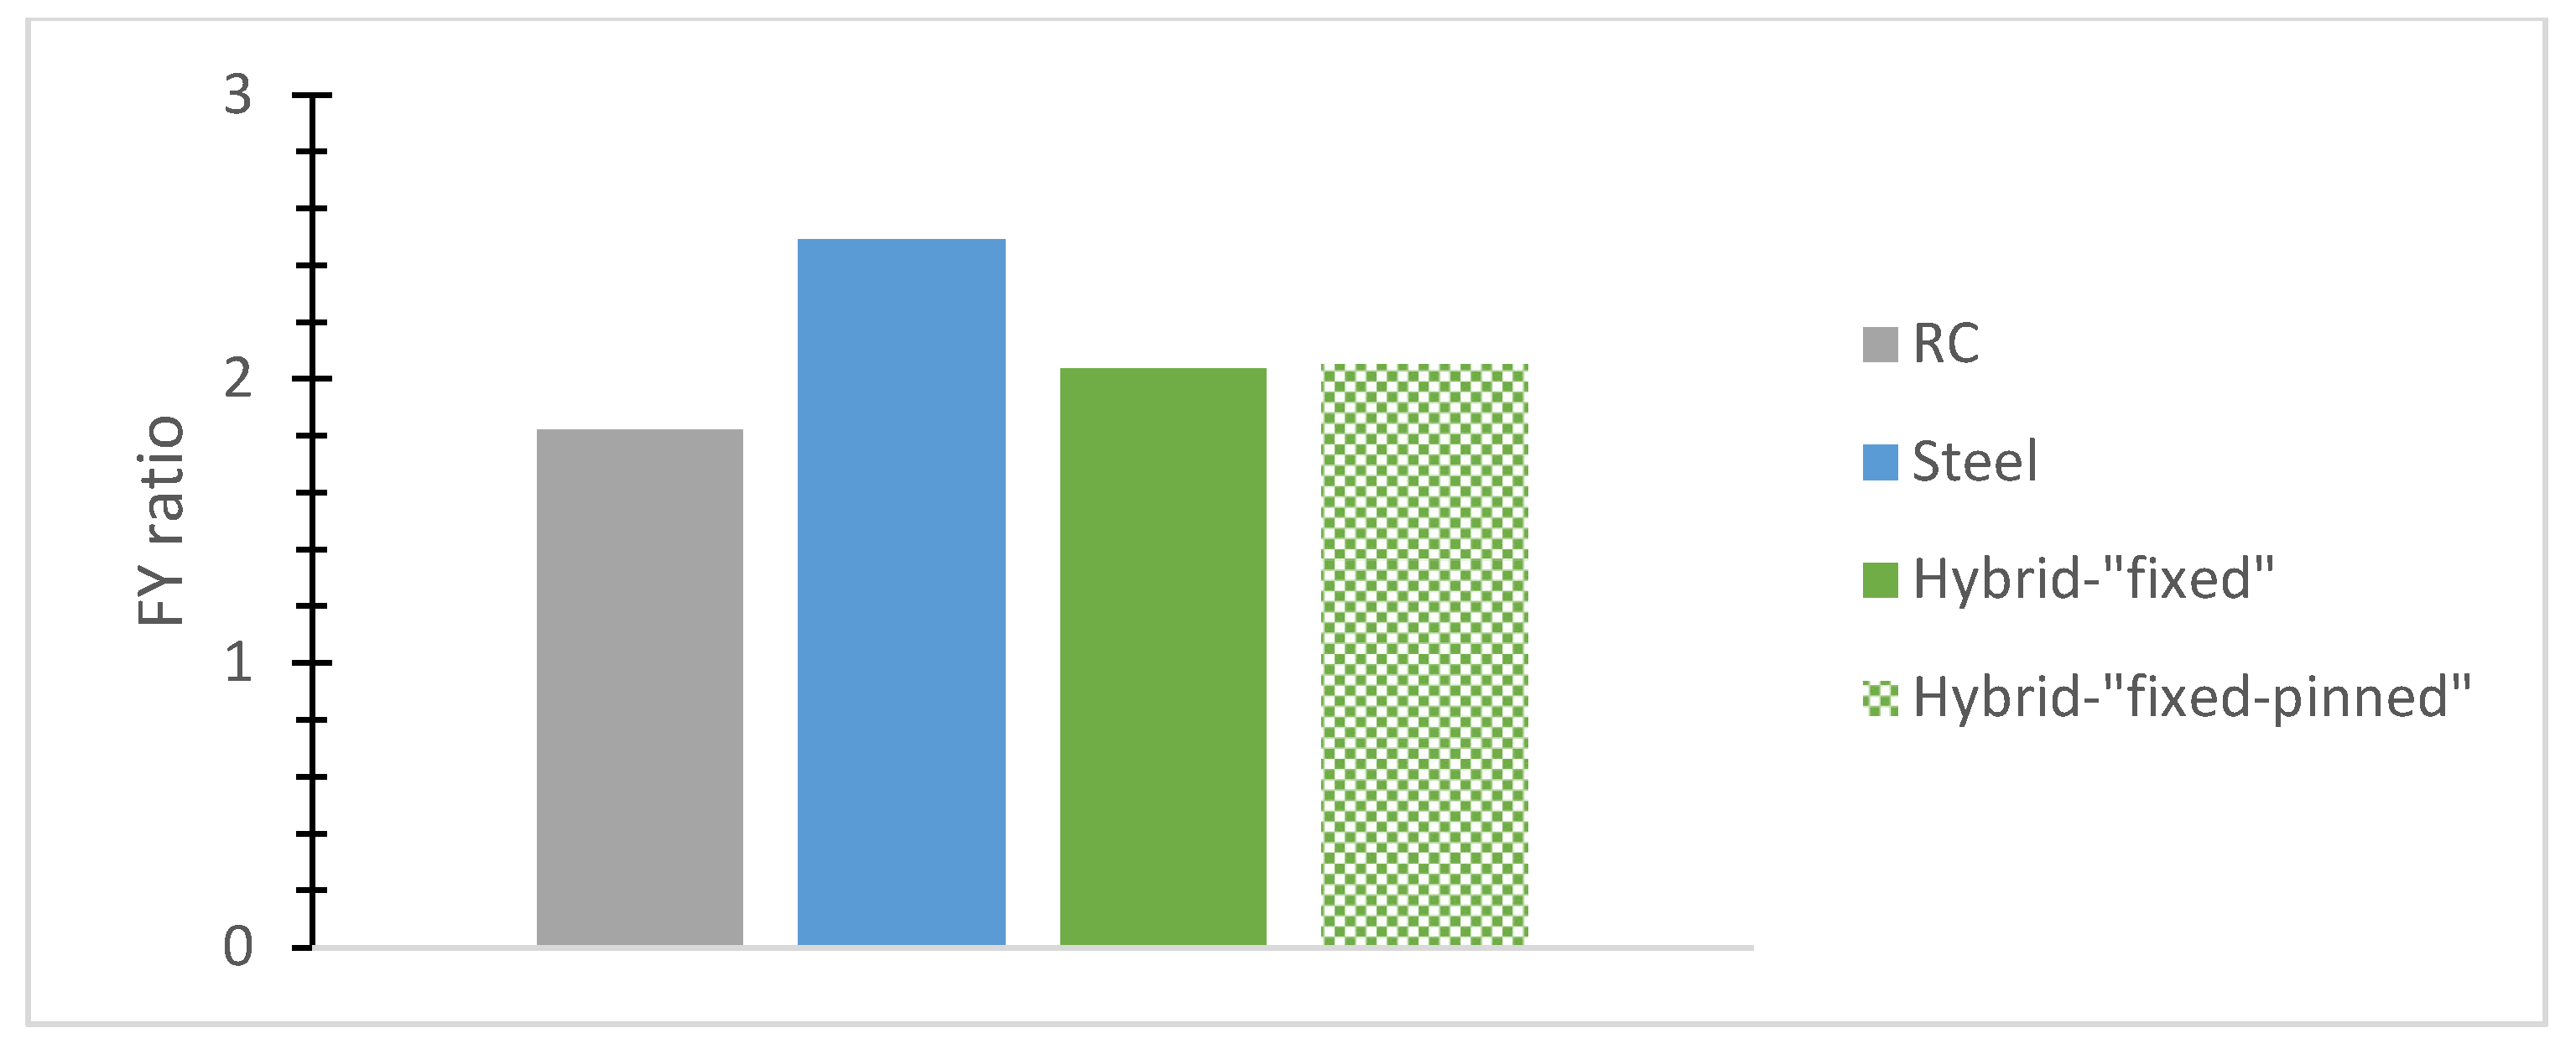
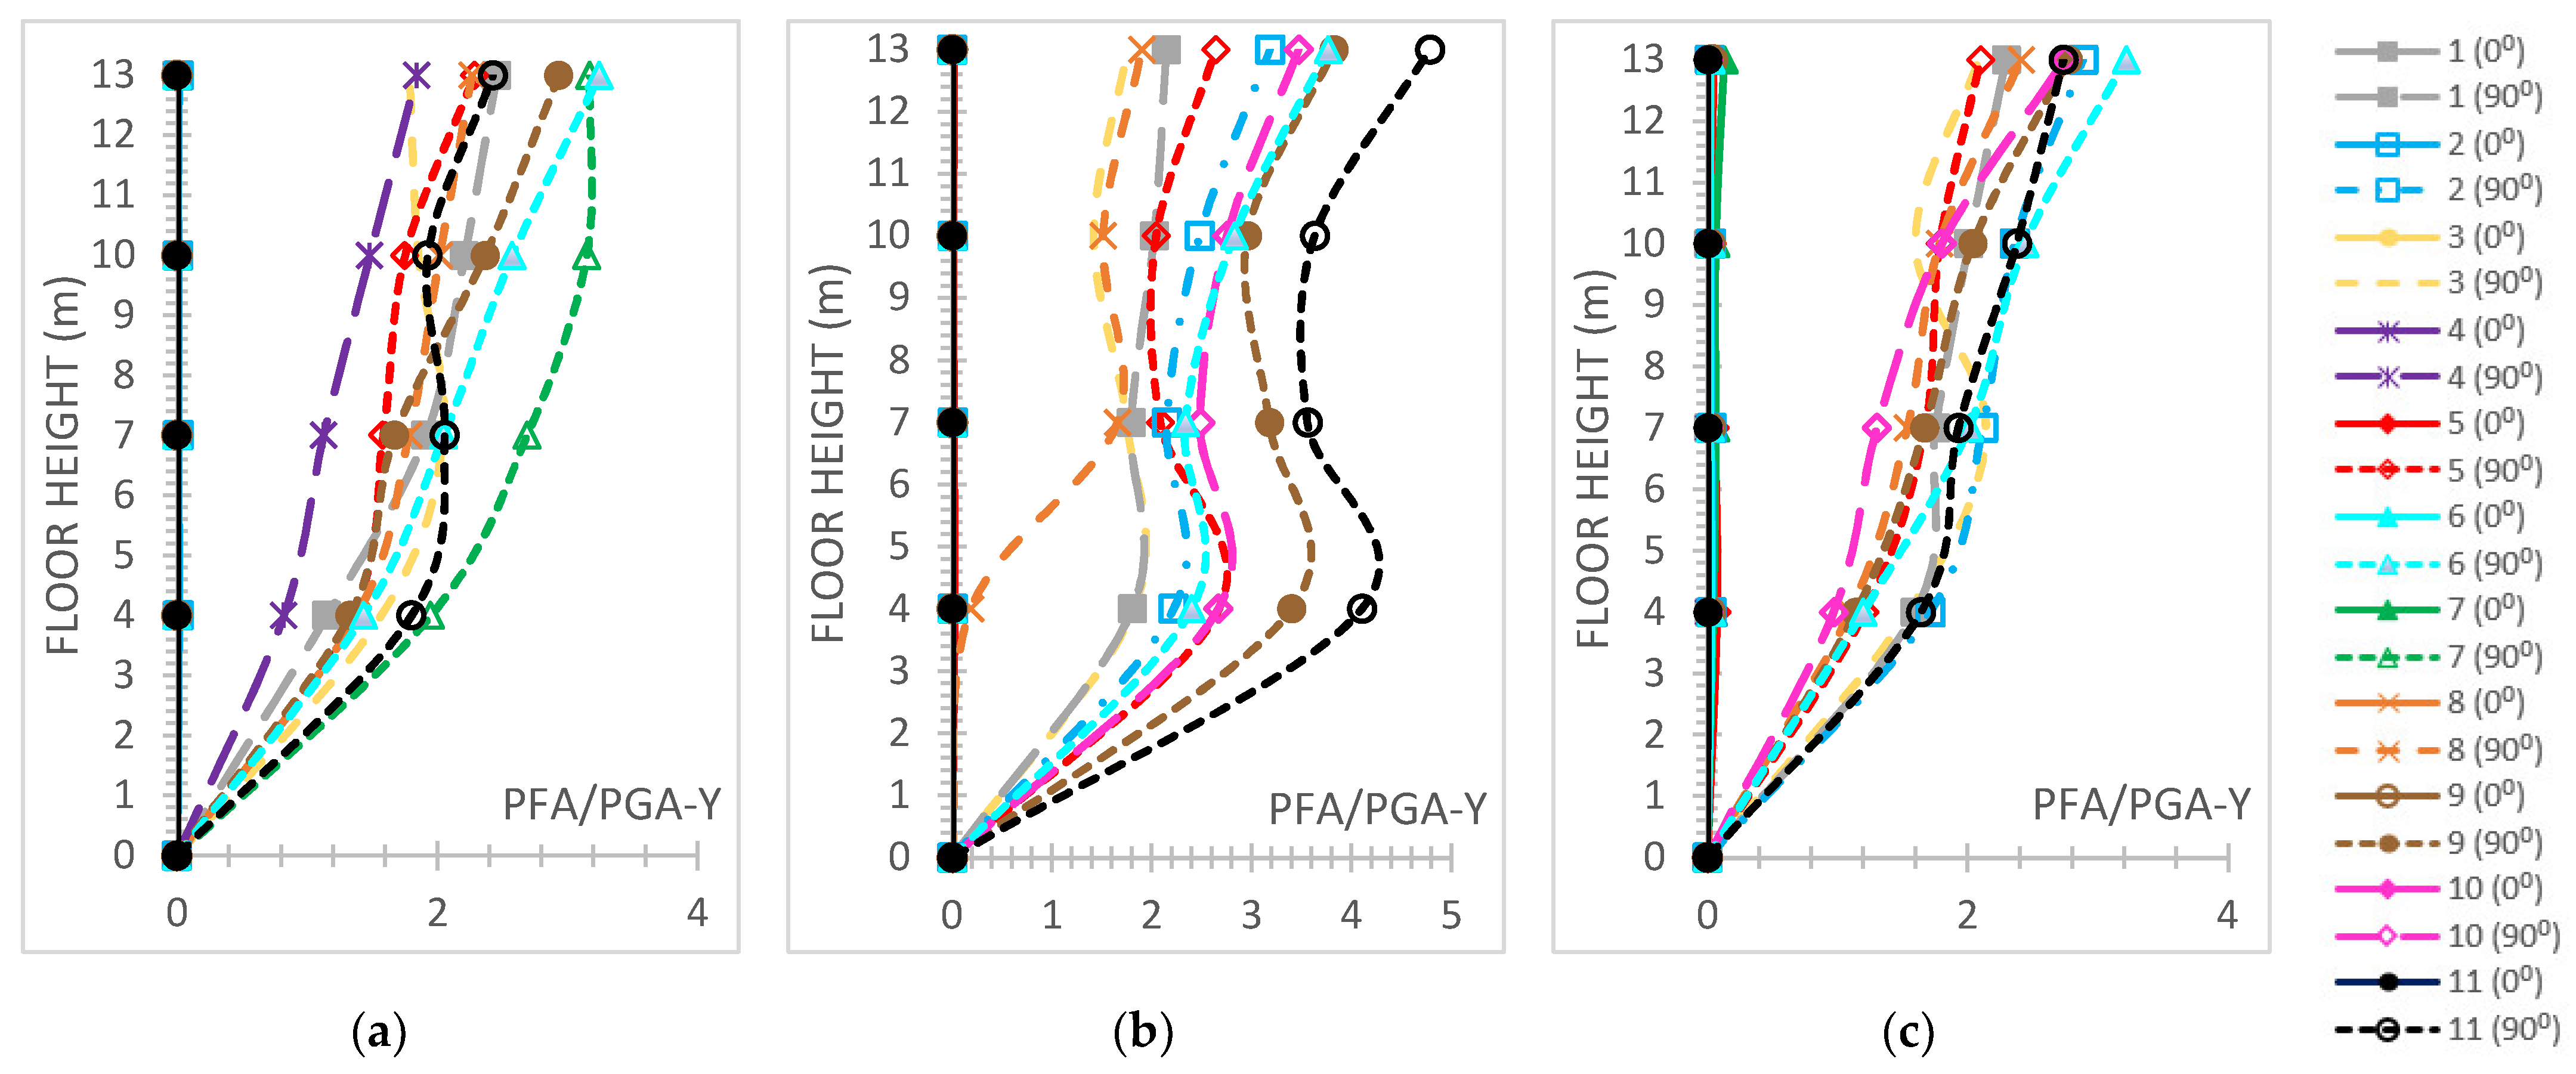
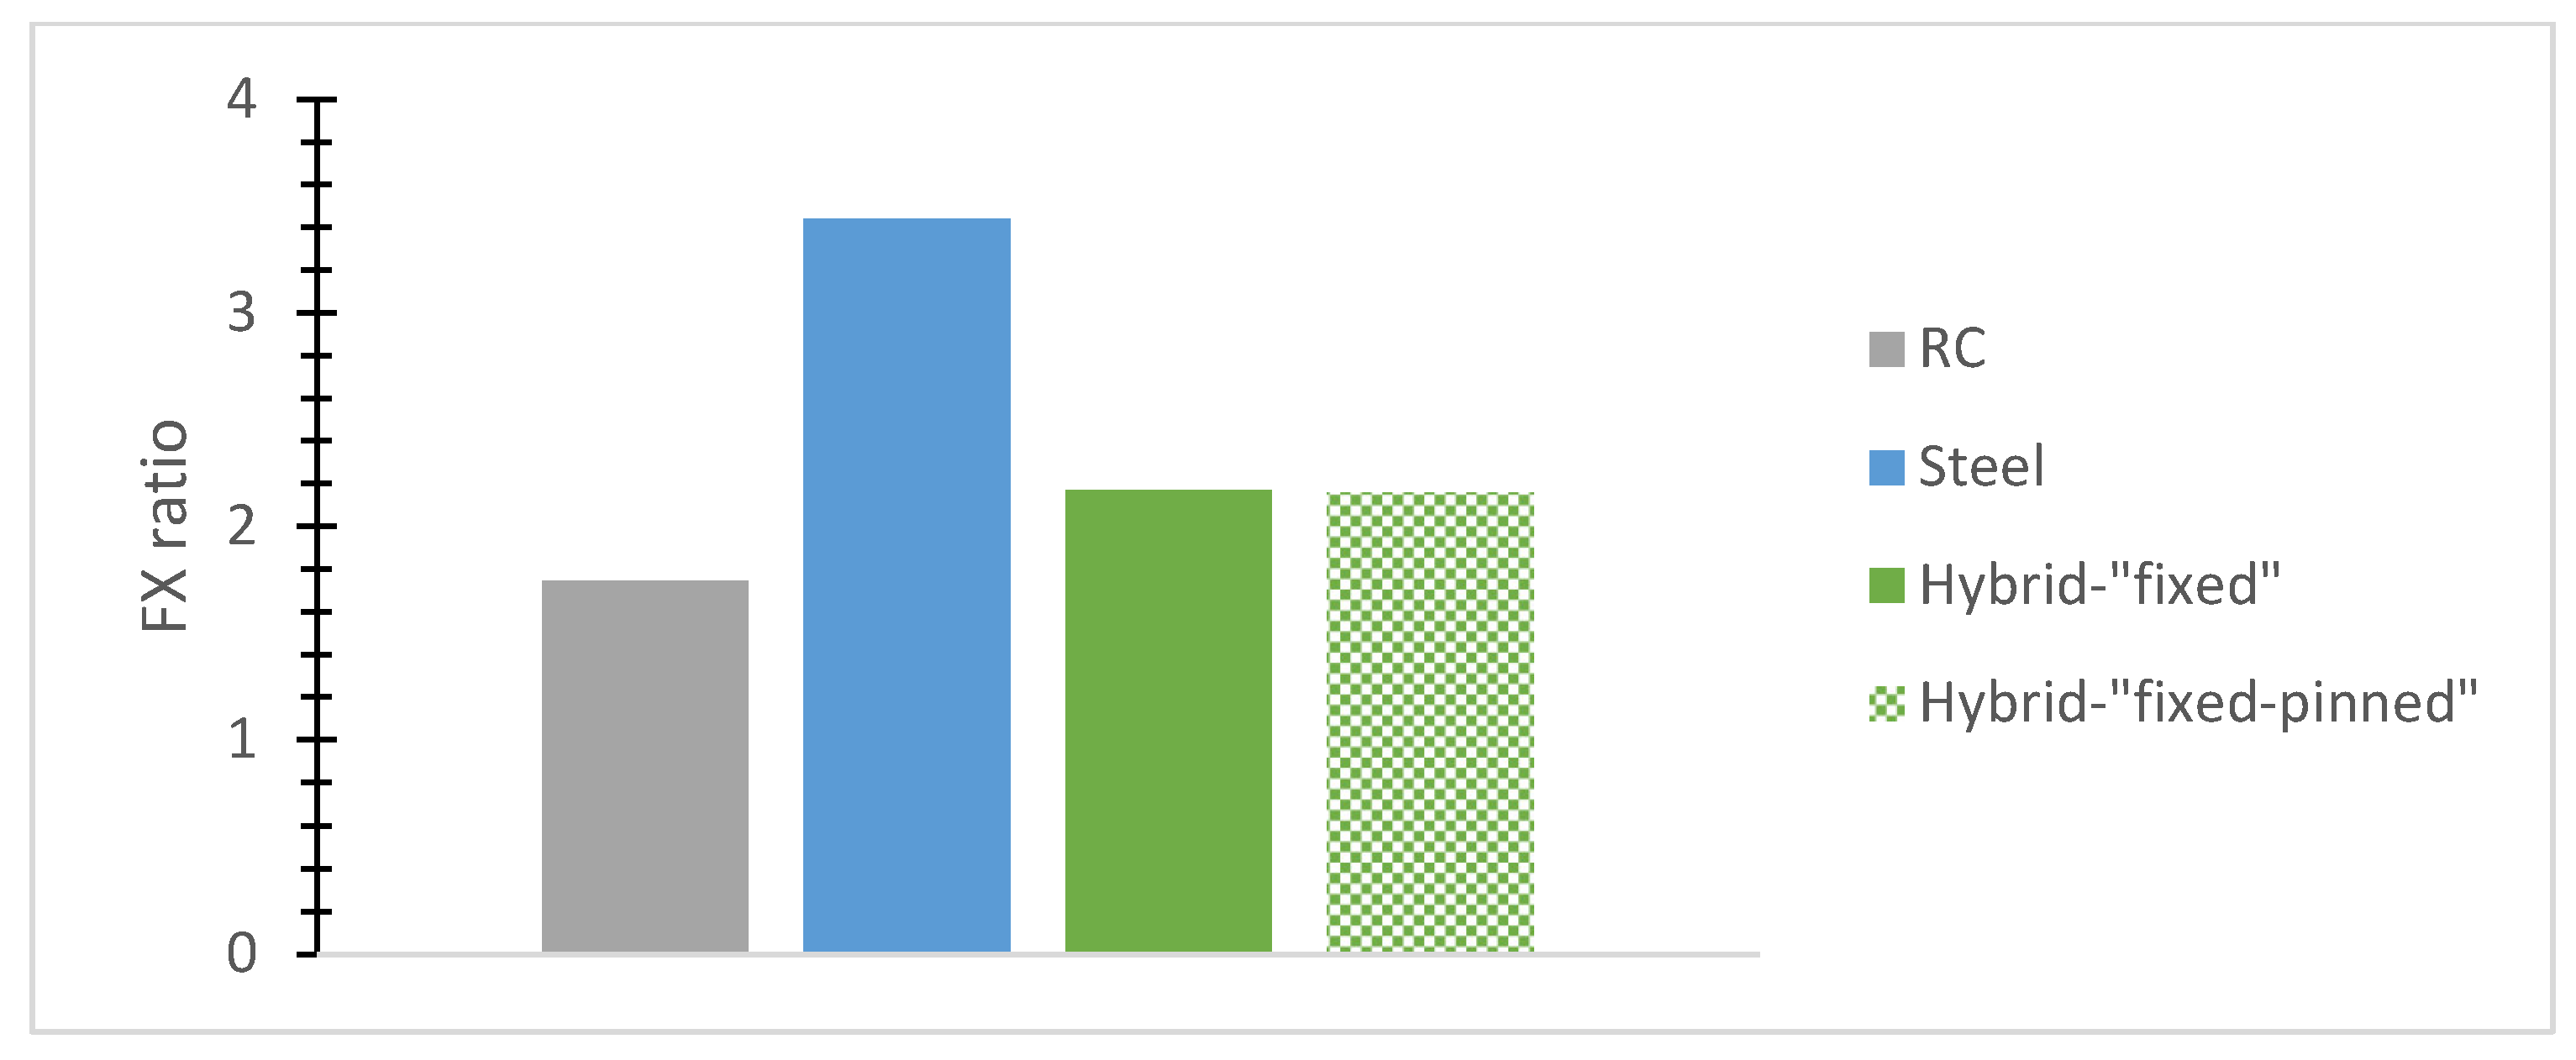
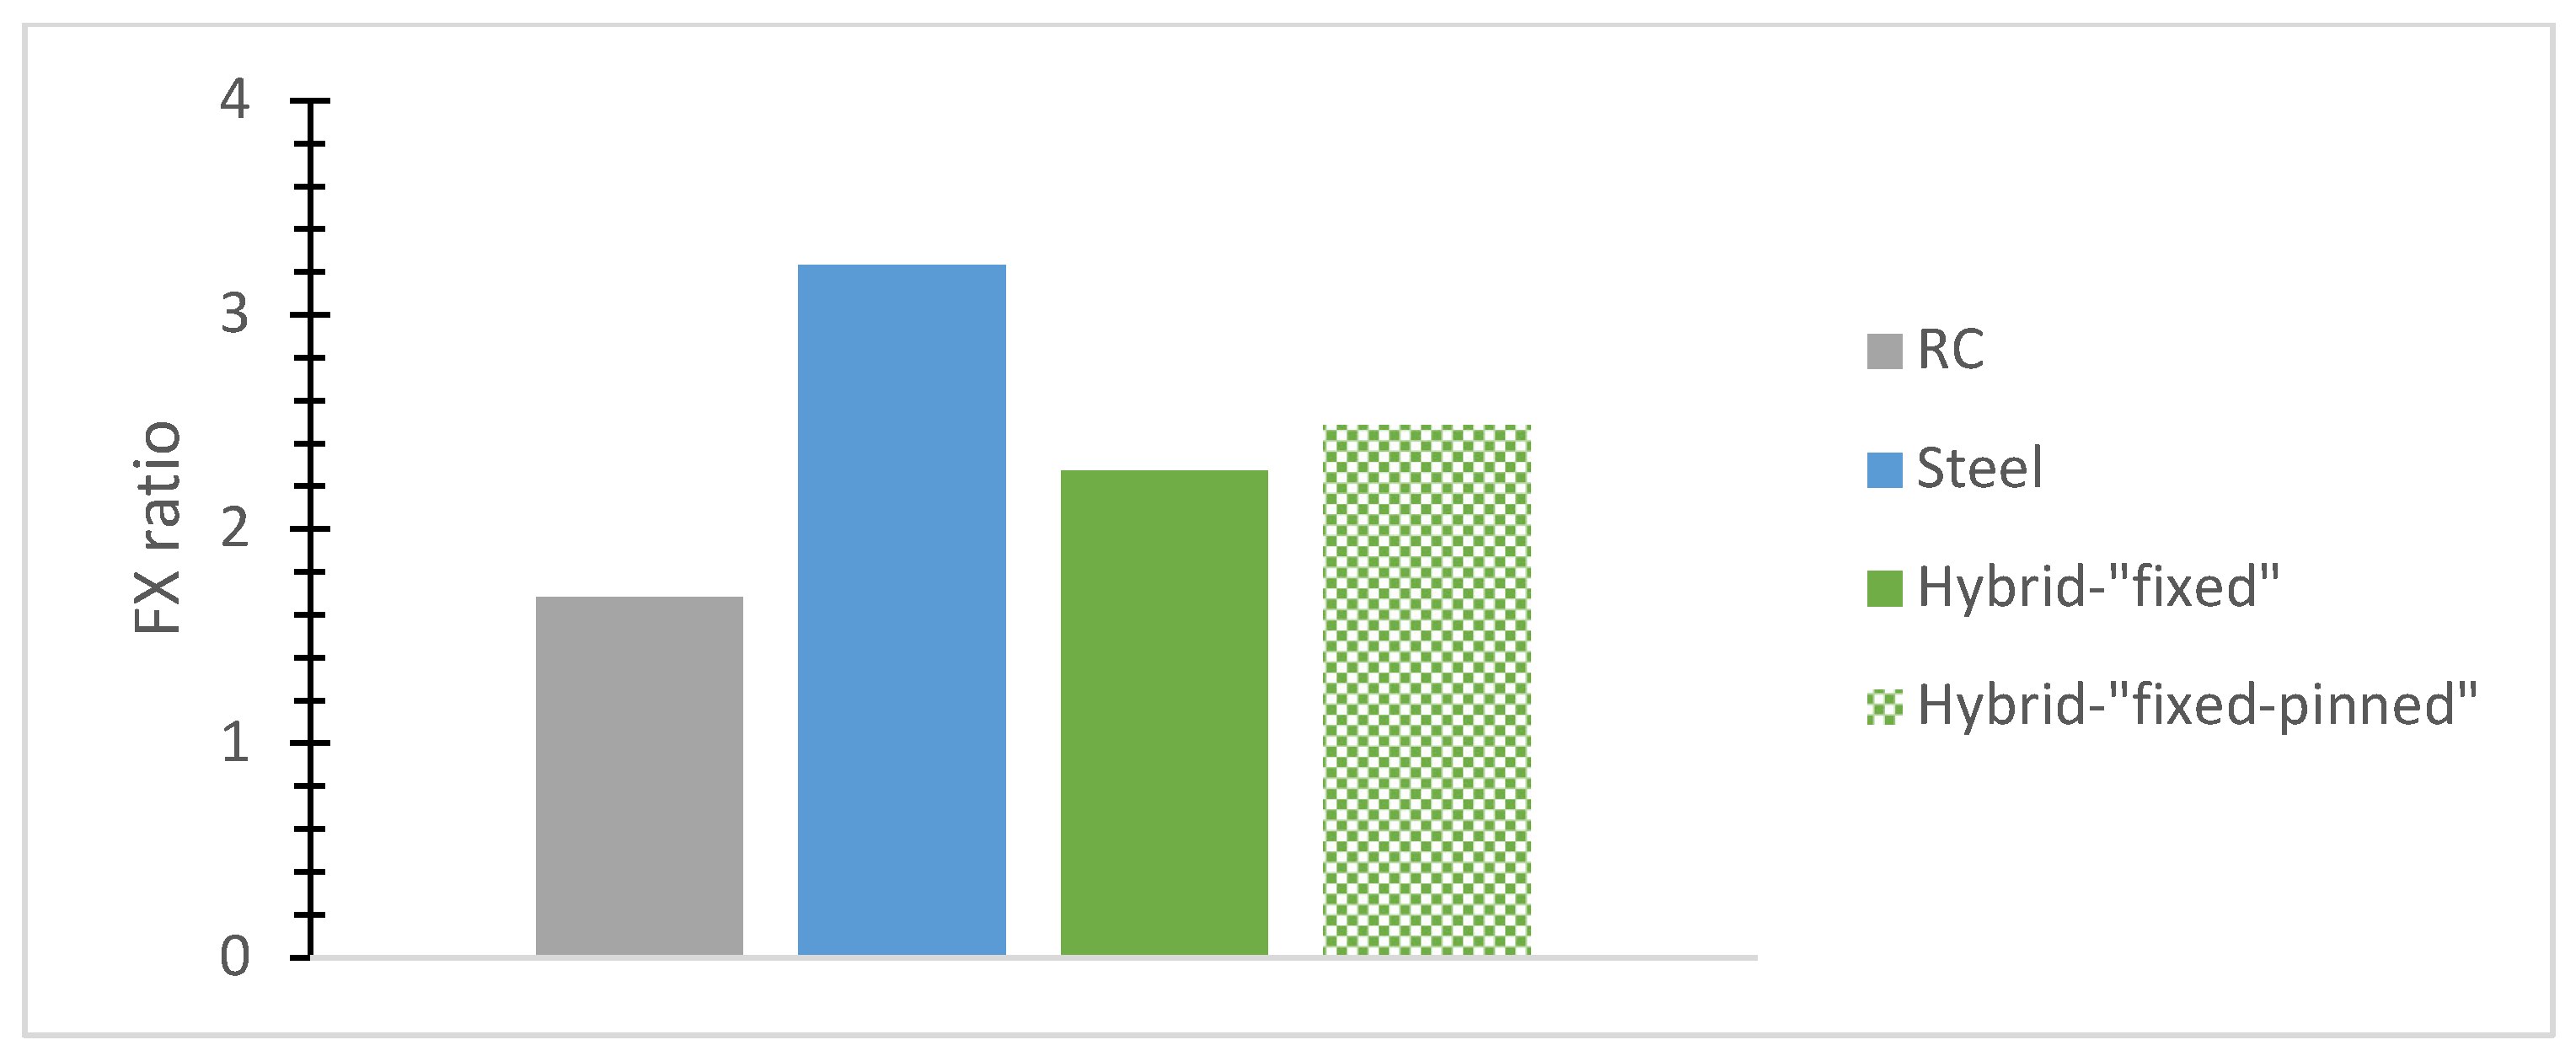
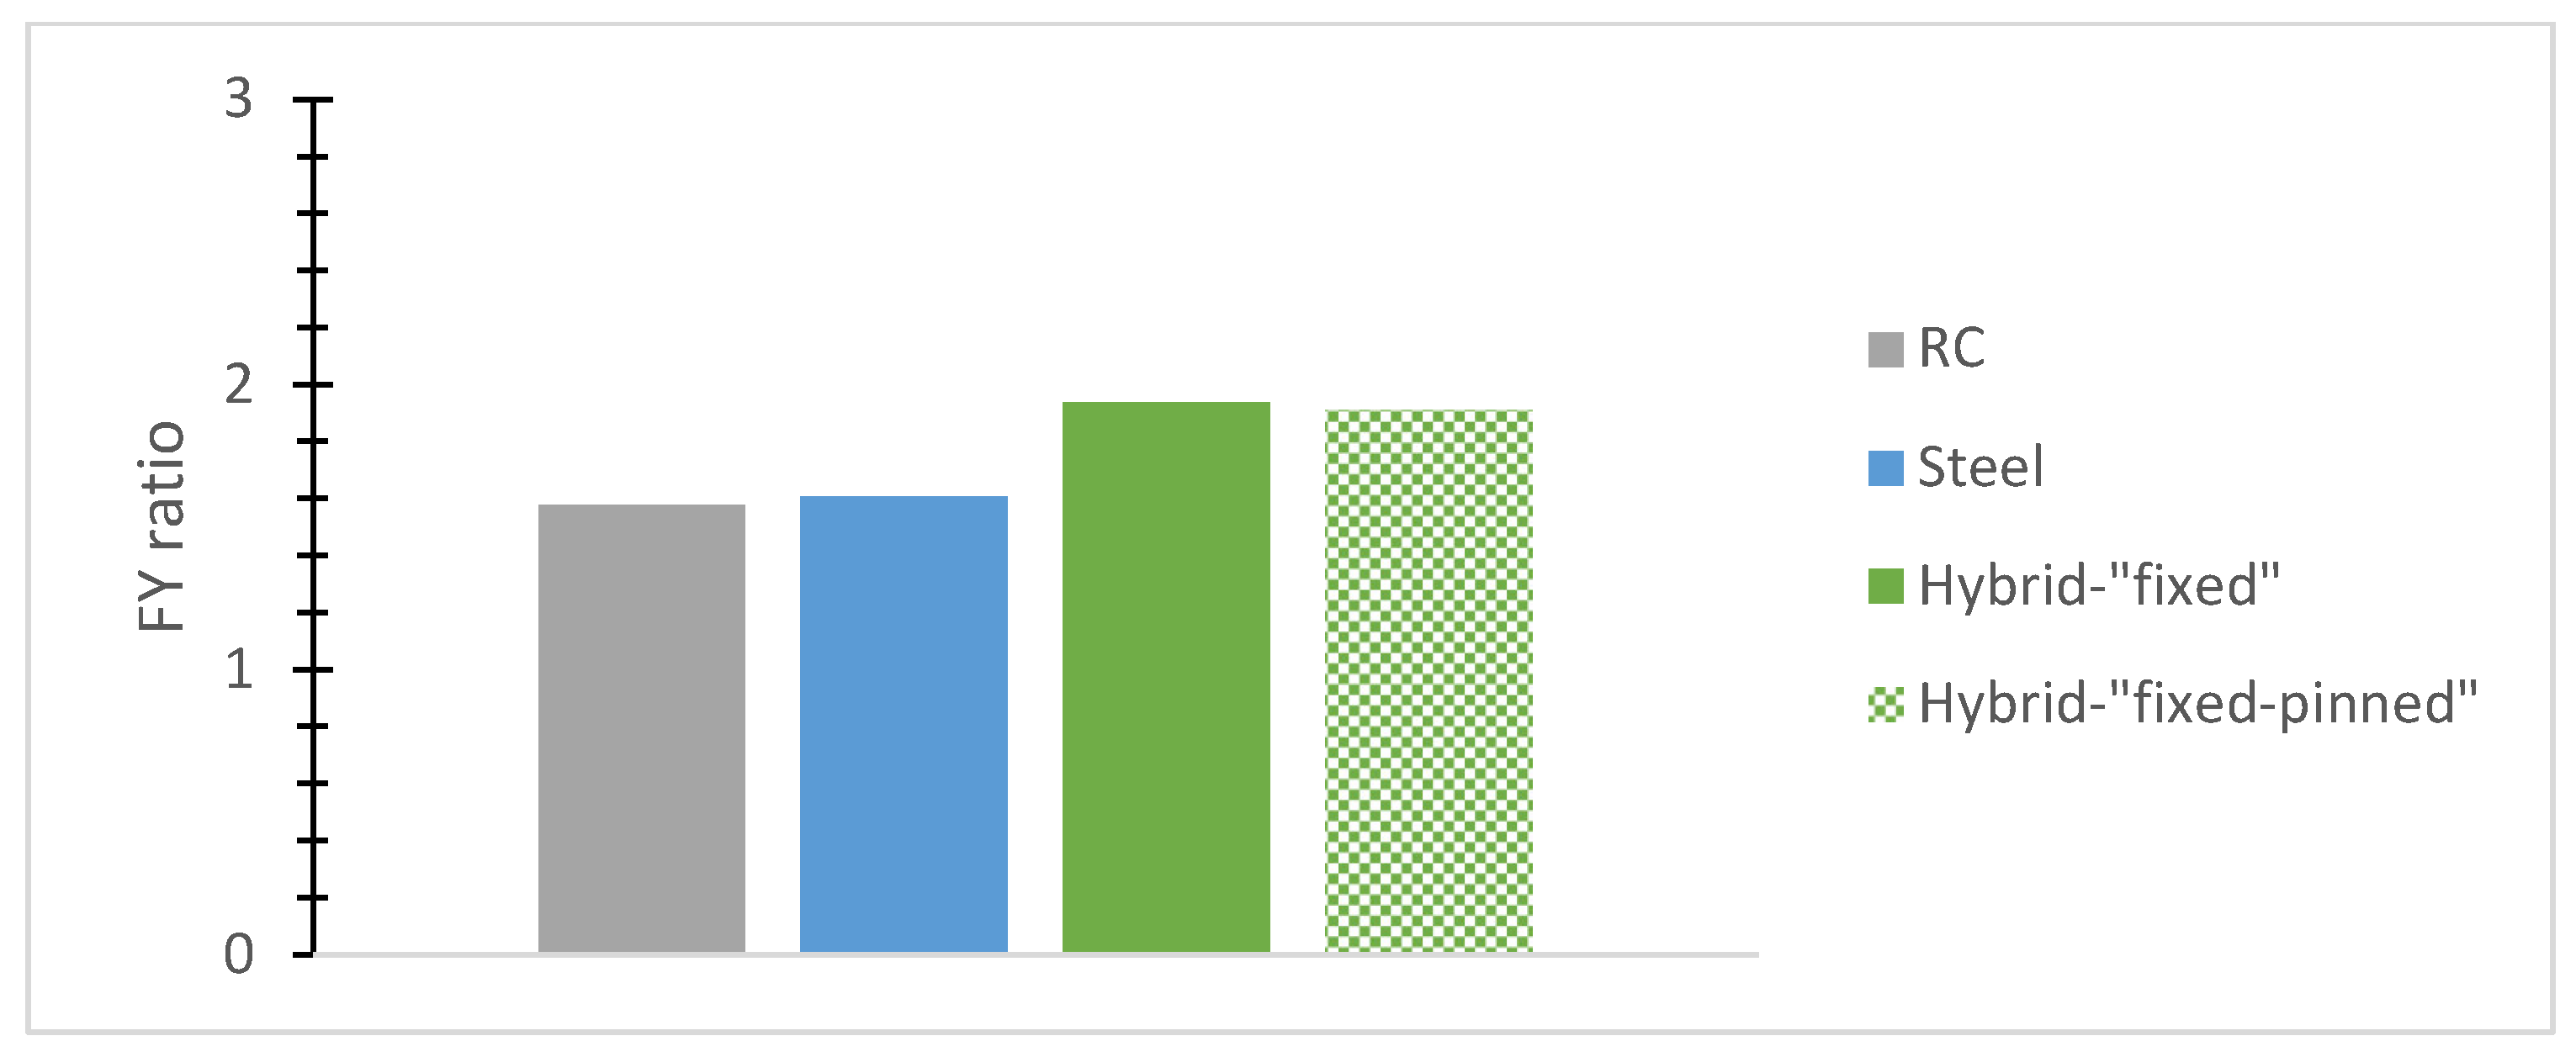
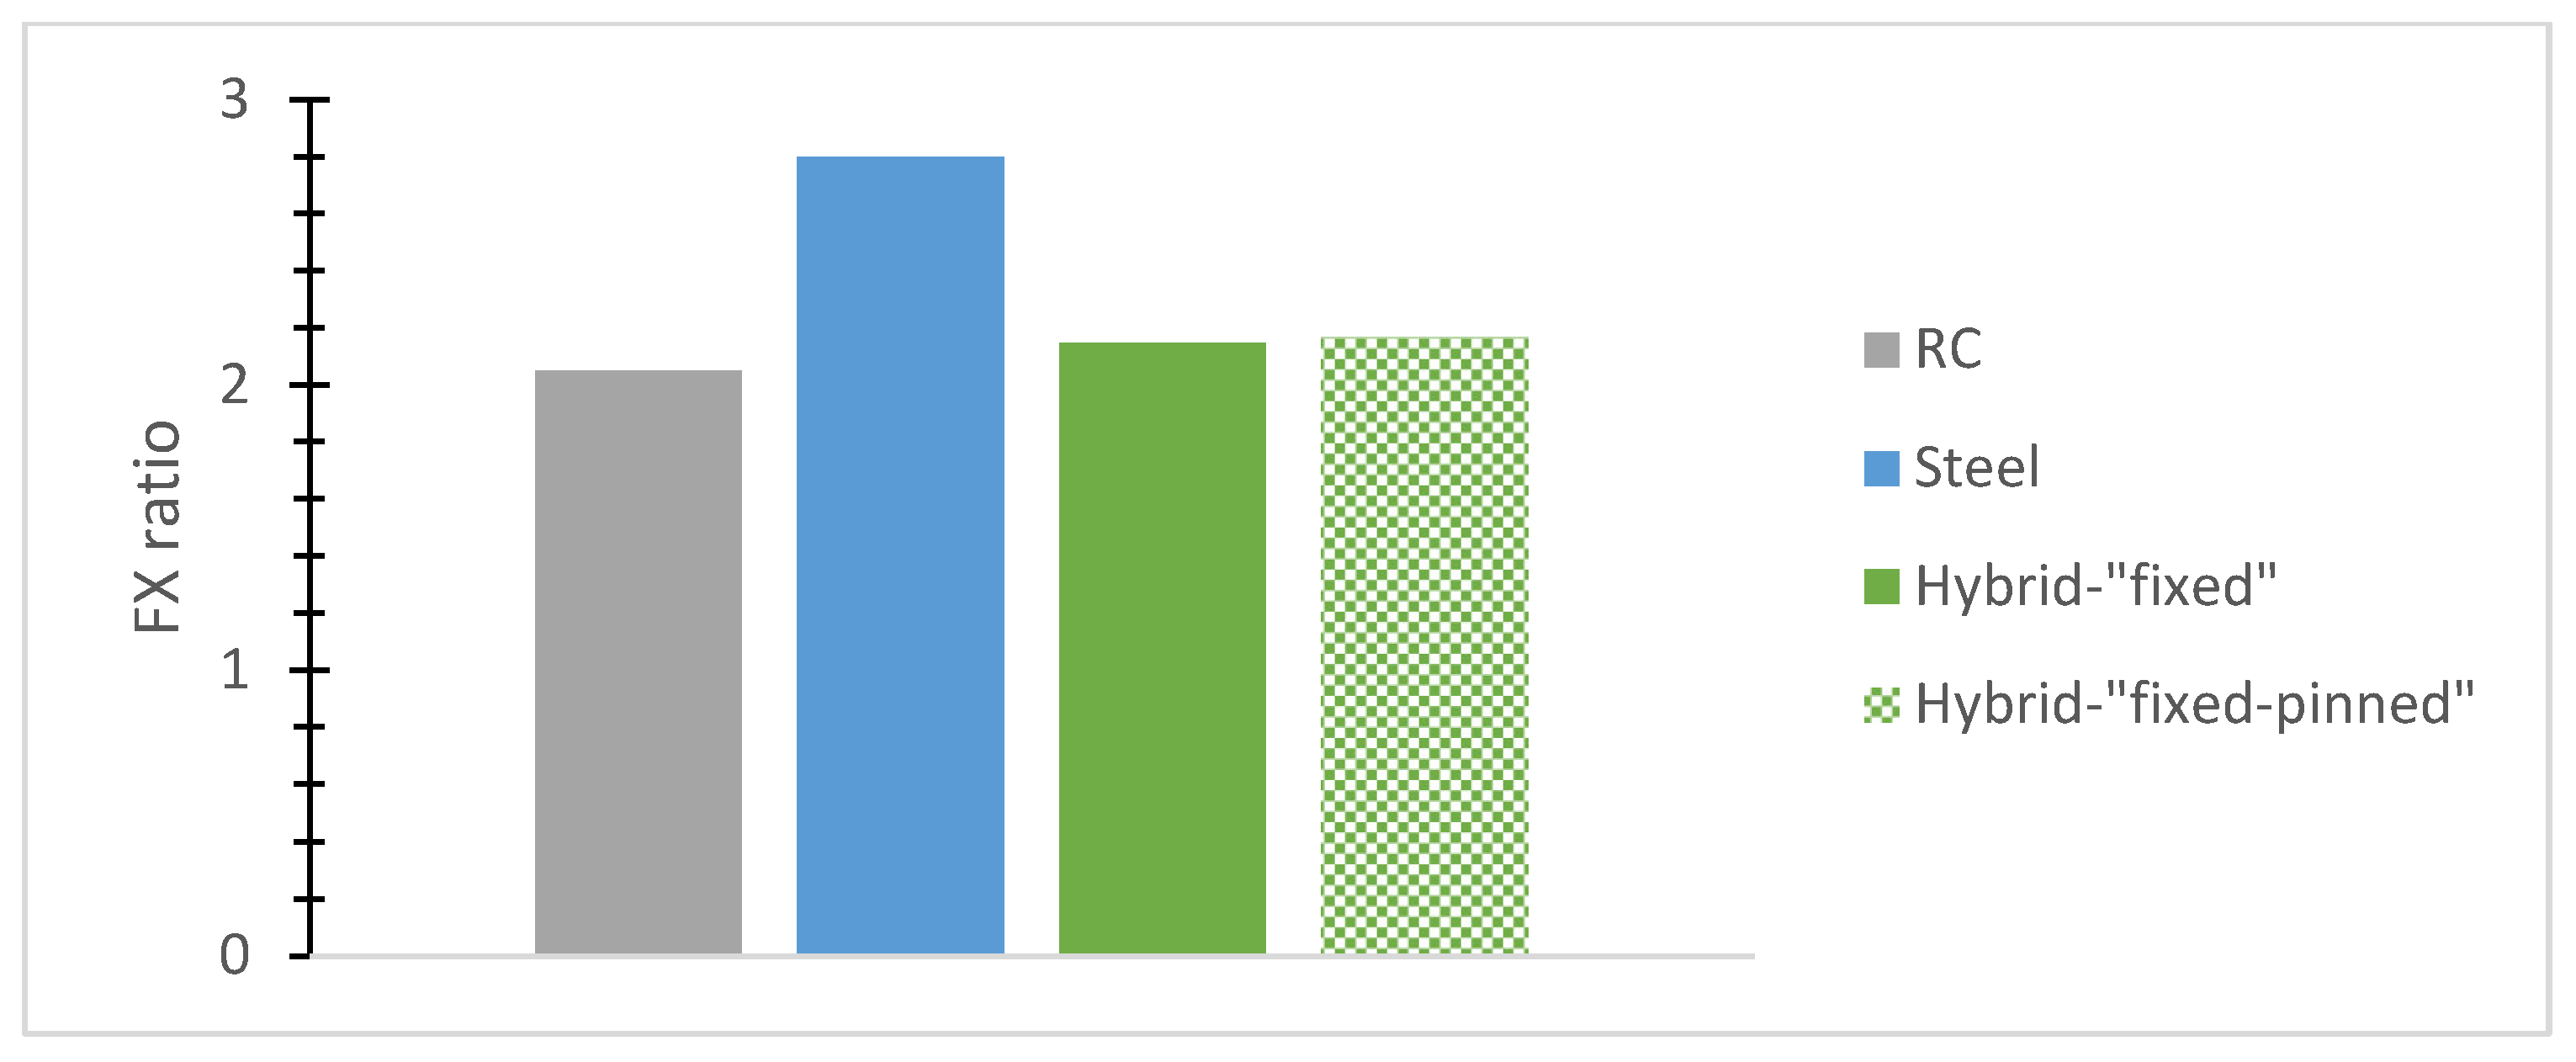
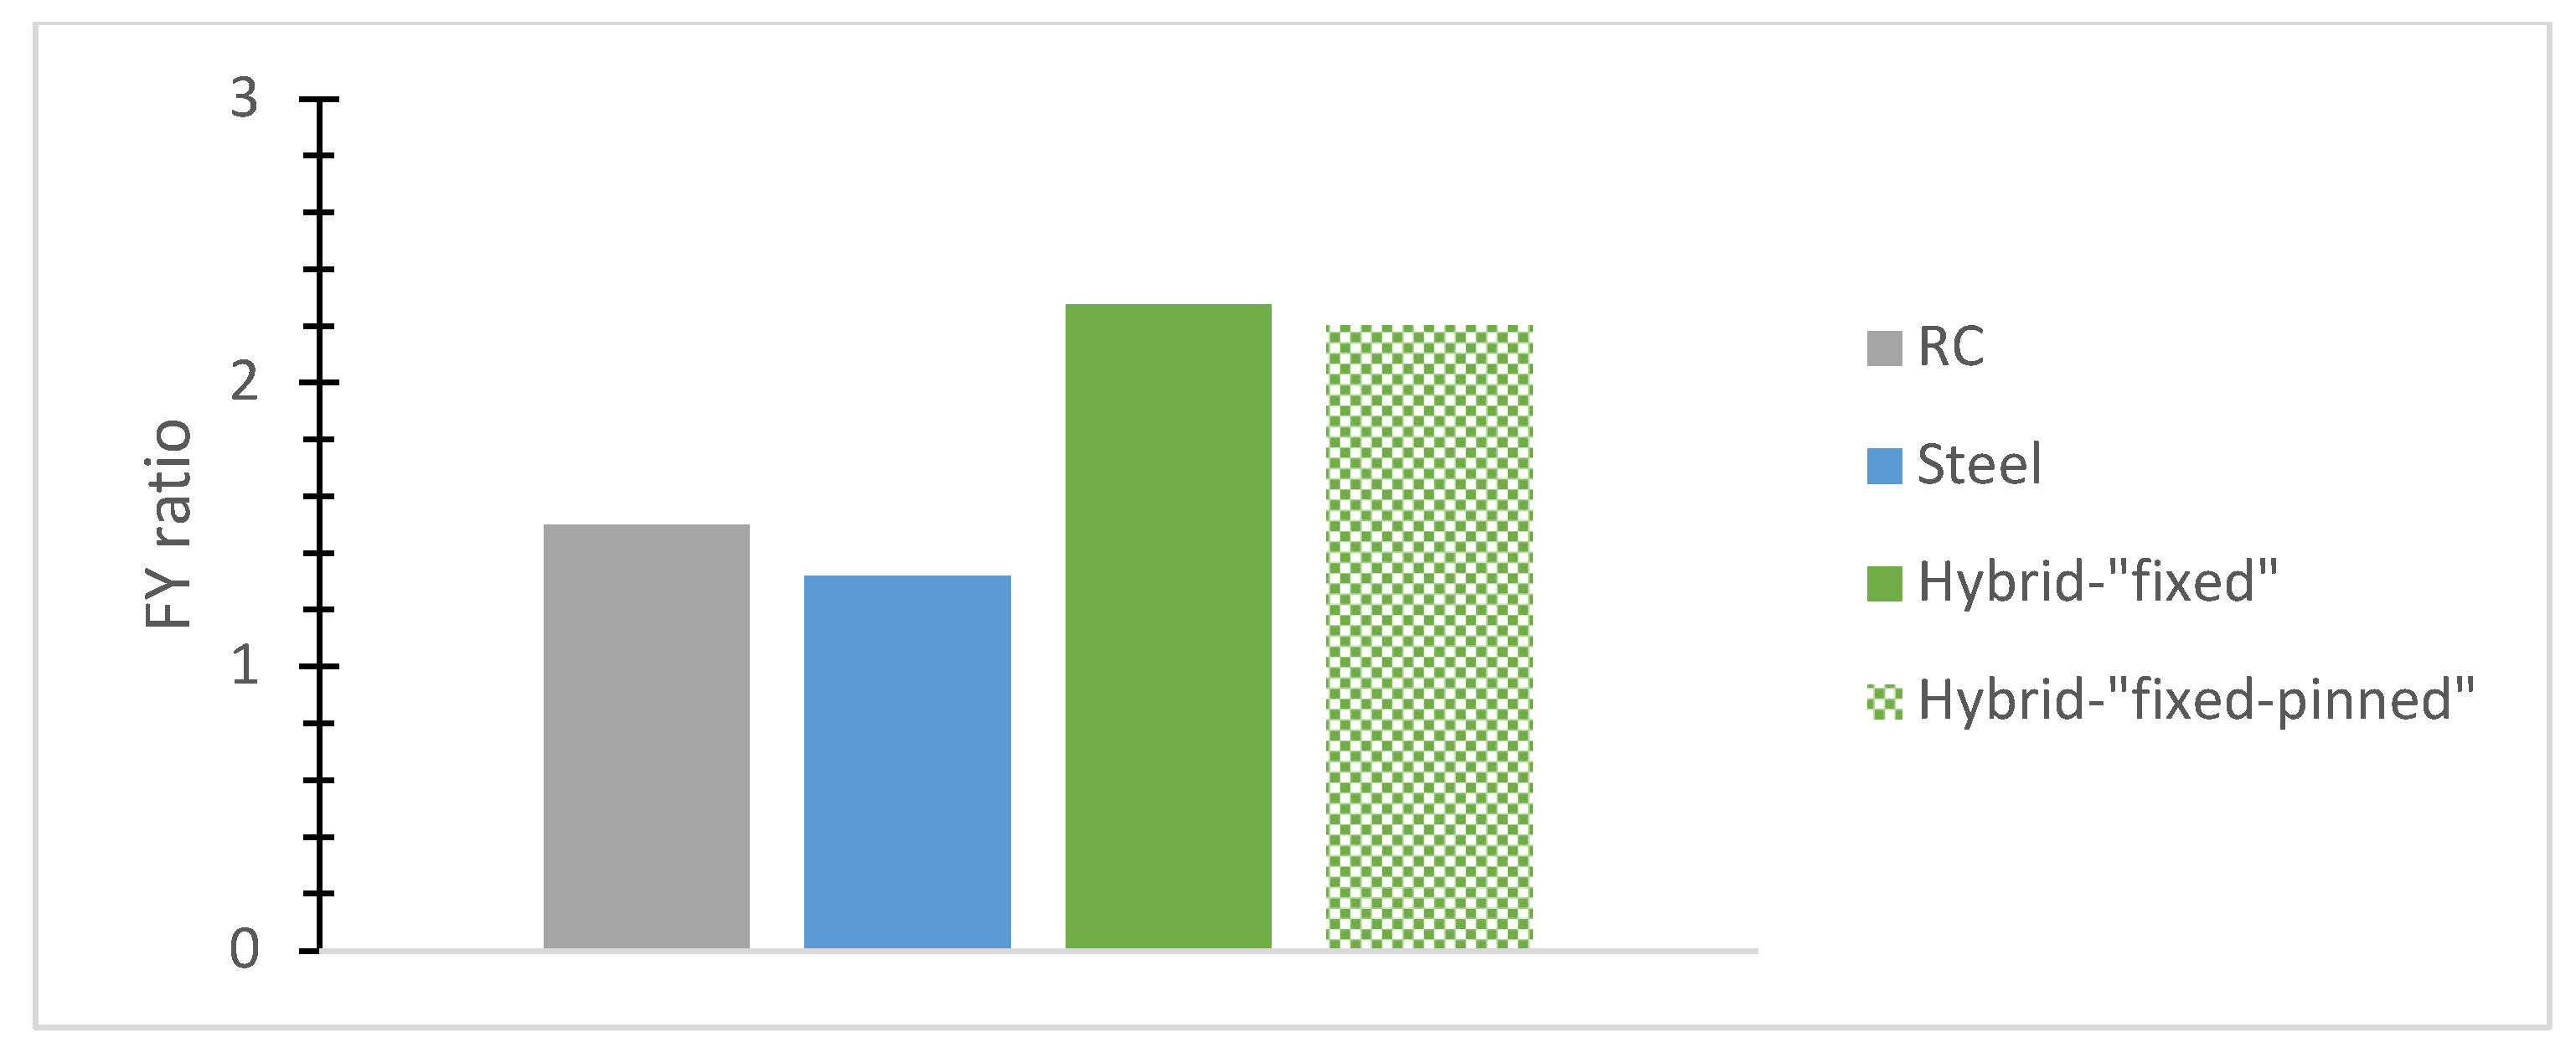
- The normalized base shear ratio, called here for brevity reasons the “FX ratio”, denotes the fraction of the highest base shear absolute value divided by each building’s weight along the X-axis while being used for a comparative evaluation of typical r/c or steel and hybrid models. The “FY ratio” means the corresponding ratio along the Y direction.
3.1. Two-Story Buildings
3.2. Three-Story Buildings
3.3. Four-Story Buildings
3.4. Five-Story Buildings
3.5. Six-Story Buildings
4. Conclusions
Funding
Institutional Review Board Statement
Informed Consent Statement
Data Availability Statement
Conflicts of Interest
References
- Askouni, P.K. The Behavior of Hybrid Reinforced Concrete-Steel Buildings under Sequential Ground Excitations. Computation 2023, 11, 102. [Google Scholar] [CrossRef]
- Eurocode 2 (EC2). Design of Concrete Structures—Part 1-1: General Rules and Rules for Buildings; European Committee for Standardization: Brussels, Belgium, 2004. [Google Scholar]
- Eurocode 3 (EC3). Design of Steel Structures—Part 1-1: General Rules and Rules for Buildings; European Committee for Standardization: Brussels, Belgium, 2009. [Google Scholar]
- Eurocode 8 (EC8). Design of Structures for Earthquake Resistance—Part 1: General Rules, Seismic Actions and Rules for Buildings; European Committee for Standardization: Brussels, Belgium, 2004. [Google Scholar]
- Eurocode 8 (EC8). Design of Structures for Earthquake Resistance—Part 3: Assessment and Retrofitting of Buildings; European Committee for Standardization: Brussels, Belgium, 2004. [Google Scholar]
- Eurocode 8 (EC8). Design of Structures for Earthquake Resistance—Part 5: Foundations, Retaining Structures and Geotechnical Aspects; European Committee for Standardization: Brussels, Belgium, 2004. [Google Scholar]
- Eurocode 8 (EC8). Design of Structures for Earthquake Resistance—Part 6: Towers, Masts and Chimneys; European Committee for Standardization: Brussels, Belgium, 2004. [Google Scholar]
- Fardis, M.N. Seismic Design, Assessment and Retrofitting of Concrete Buildings: Based on EN-Eurocode 8, 1st ed.; Springer: Berlin, Germany, 2009. [Google Scholar] [CrossRef]
- Fajfar, P.; Krawinkler, H. (Eds.) Nonlinear Seismic Analysis and Design of Reinforced Concrete Buildings: Workshop on Nonlinear Seismic Analysis of Reinforced Concrete Buildings, 1st ed.; CRC Press: Bled, Slovenia, 1992. [Google Scholar]
- Penelis, G.G.; Kappos, A.J. Earthquake-Resistant Concrete Structures, 1st ed.; CRC Press: Boca Raton, FL, USA; Taylor & Francis: London, UK, 1997. [Google Scholar]
- Zameeruddin, M.; Sangle, K.K. Review on Recent developments in the performance-based seismic design of reinforced concrete structures. Structures 2016, 6, 119–133. [Google Scholar] [CrossRef]
- Lu, X.; Jiang, C.; Yang, B.; Quan, L. Seismic design methodology for self-centering reinforced concrete frames. Soil Dyn. Earthq. Eng. 2019, 119, 358–374. [Google Scholar] [CrossRef]
- Otani, S. Earthquake resistant design of reinforced concrete buildings past and future. J. Adv. Concr. Technol. 2004, 2, 3–24. [Google Scholar]
- Papagiannopoulos, G.A.; Hatzigeorgiou, G.D.; Beskos, D.E. Seismic Design Methods for Steel Building Structures, 1st ed.; Springer: Cham, Switzerland, 2021. [Google Scholar] [CrossRef]
- Gioncu, V.; Mazzolani, F. Seismic Design of Steel Structures, 1st ed.; CRC Press: Boca Raton, FL, USA, 2013. [Google Scholar]
- Kato, B.; Akiyama, H. Seismic design of steel buildings. J. Struct. Div. 1982, 108, 1709–1721. [Google Scholar] [CrossRef]
- Li, G.Q.; Wang, Y.B.; Chen, S.W. The art of application of high-strength steel structures for buildings in seismic zones. Adv. Steel Constr. 2015, 11, 492–506. [Google Scholar]
- Maley, T.J.; Sullivann, T.J.; Pampanin, S. Issues with the seismic design of mixed MRF Systems. In Proceedings of the 15th World Conference on Earthquake Engineering, Lisboa, Portugal, 24–28 September 2012. [Google Scholar]
- Fanaie, N.; Shamlou, S.O. Response modification factor of mixed structures. Steel Compos. Struct. 2015, 19, 1449–1466. [Google Scholar] [CrossRef]
- Bhattarai, A.; Shakya, A.C. Response Reduction Factor of Steel–RC Hybrid Structure. KEC J. Sci. Eng. 2023, 7, 77–81. [Google Scholar] [CrossRef]
- Villaverde, R. Seismic design of secondary structures: State of the art. J. Struct. Eng. 1997, 123, 1011–1019. [Google Scholar] [CrossRef]
- Kiani, A.; Kheyroddin, A.; Kafi, M.A.; Naderpour, H. Seismic fragility assessment for mixed concrete/steel buildings considering the appropriate position of the transition story. Soil Dyn. Earthq. Eng. 2022, 163, 107552. [Google Scholar] [CrossRef]
- Kiani, A.; Kheyroddin, A.; Kafi, M.A.; Naderpour, H. Nonlinear study of the method of transition in mixed concrete/steel structures. Soil Dyn. Earthq. Eng. 2023, 170, 107925. [Google Scholar] [CrossRef]
- Ghanbari, B.; Fathi, M.; Akhaveissy, A.H. Fragility curves for reinforced concrete (RC)/steel vertical hybrid frame structure under mainshock–aftershock sequences. J. Struct. Integr. Maint. 2023, 8, 179–187. [Google Scholar] [CrossRef]
- Askouni, P.K.; Papagiannopoulos, G.A. Seismic Behavior of a Class of Mixed Reinforced Concrete-Steel Buildings Subjected to Near-Fault Motions. Infrastructures 2021, 6, 172. [Google Scholar] [CrossRef]
- Askouni, P.K.; Papagiannopoulos, G.A. The Nonlinear Behavior of Mixed Reinforced Concrete–Steel Frames under Strong Earthquakes. Eng. Proc. 2023, 53, 15. [Google Scholar] [CrossRef]
- Askouni, P.K.; Papagiannopoulos, G.A. The Seismic Response of Mixed Reinforced Concrete–Steel Buildings Under Near-Fault Earthquakes. In Proceedings of the COMPDYN 2023, 9th International Conference on Computational Methods in Structural Dynamics and Earthquake Engineering, Athens, Greece, 12–14 June 2023. [Google Scholar] [CrossRef]
- Askouni, P.K.; Papagiannopoulos, G.A. On the Seismic Response of Vertically Mixed Reinforced Concrete–Steel Buildings. In Proceedings of the 10th Hellenic National Conference of Steel Structures, Athens, Greece, 19–21 October 2023. [Google Scholar]
- Li, L.; Li, G.-Q.; Liu, Y. Simplified algorithm of the novel steel-concrete mixed structure under lateral load. Int. J. High-Rise Build. 2012, 1, 247–254. [Google Scholar]
- Kaveh, A.; Ardebili, S.R. Optimal Design of Mixed Structures under Time-history Loading Using Metaheuristic Algorithm. Period. Polytech. Civ. Eng. 2023, 67, 57–64. [Google Scholar] [CrossRef]
- Kiani, A.; Yang, T.Y.; Kheyroddin, A.; Kafi, M.A.; Naderpour, H. Quantification of seismic performance factors of mixed concrete/steel buildings using the FEMA P695 methodology. Structures 2024, 61, 106144. [Google Scholar] [CrossRef]
- Pnevmatikos, N.; Blachowski, B.; Papavasileiou, G. Damage detection of mixed concrete/steel frame subjected to earthquake excitation. In Proceedings of the 7th International Conference on Computational Methods in Structural Dynamics and Earthquake Engineering (COMPDYN 2019), Crete, Greece, 24–26 June 2019. [Google Scholar]
- Papagiannopoulos, G. On the modal damping ratios of mixed reinforced concrete–steel buildings. Soil Dyn. Earthq. Eng. 2024, 178, 108481. [Google Scholar] [CrossRef]
- Farghaly, A.A. Parametric study on equivalent damping ratio of different composite structural building systems. Steel Compos. Struct. 2013, 14, 349–365. [Google Scholar] [CrossRef]
- Sivandi-Pour, A.; Gerami, M.; Kheyroddin, A. Determination of modal damping ratios for non-classically damped rehabilitated steel structures. Iran. J. Sci. Technol. Trans. Civ. Eng. 2015, 39, 81. [Google Scholar]
- Sivandi-Pour, A.; Gerami, M.; Kheyroddin, A. Uniform damping ratio for non-classically damped hybrid steel concrete structures. Int. J. Civ. Eng. 2016, 14, 1–11. [Google Scholar] [CrossRef]
- Sivandi-Pour, A.; Gerami, M.; Khodayarnezhad, D. Equivalent modal damping ratios for non-classically damped hybrid steel concrete buildings with transitional storey. Struct. Eng. Mech. 2014, 50, 383–401. [Google Scholar] [CrossRef]
- Liu, W.; Ni, Y.Q.; Ikago, K.; Ao, W.K. Seismic control of base-isolated structures using rate-independent damping devices. J. Build. Eng. 2023, 78, 107744. [Google Scholar] [CrossRef]
- Liu, W.; Ni, Y.Q.; Ao, W.K. Feasibility Study of a Novel Modal Decomposition Method for Low-Frequency Structure with Nonproportionally Distributed Rate-Independent Linear Damping. Struct. Control Health Monit. 2024, 2024, 8896925. [Google Scholar] [CrossRef]
- Askouni, P.K. The Influence of Soil Deformability on the Seismic Response of 3D Mixed R/C–Steel Buildings. Infrastructures 2024, 9, 80. [Google Scholar] [CrossRef]
- Roy, A.; Santra, A.; Roy, R. Estimating seismic response under bi-directional shaking per uni-directional analysis: Identification of preferred angle of incidence. Soil Dyn. Earthq. Eng. 2018, 106, 163–181. [Google Scholar] [CrossRef]
- Rigato, A.B.; Medina, R.A. Influence of angle of incidence on seismic demands for inelastic single-storey structures subjected to bi-directional ground motions. Eng. Struct. 2007, 29, 2593–2601. [Google Scholar] [CrossRef]
- Di Sarno, L.; Amiri, S.; Garakaninezhad, A. Effects of incident angles of earthquake sequences on seismic demands of structures. Structures 2020, 28, 1244–1251. [Google Scholar] [CrossRef]
- Altunişik, A.C.; Kalkan, E. Earthquake incidence angle influence on seismic performance of reinforced concrete buildings. Sigma J. Eng. Nat. Sci. 2017, 35, 609–631. Available online: https://dergipark.org.tr/en/download/article-file/2060311 (accessed on 1 October 2024).
- Dwivedi, A.; Reddy, K.K.; Somala, S.N. Study of seismic orientation of structure with bi-directional response analysis in the vicinity of branched fault earthquake rupture. Structures 2022, 37, 613–623. [Google Scholar] [CrossRef]
- Larijani, A.K.; Tehrani, P. Investigating the effect of earthquake incident angle on seismic response and fragility analysis of irregular RC buildings with nonparallel systems. Structures 2024, 38, 107135. [Google Scholar] [CrossRef]
- Bosco, M.; Ferrara, G.A.; Ghersi, A.; Marino, E.M.; Rossi, P.P. Application of Nonlinear Static Method with Corrective Eccentricities to Multistorey Buildings: A Case Study. In Seismic Behaviour and Design of Irregular and Complex Civil Structures I, 1st ed.; Lavan, O., De Stefano, M., Eds.; Springer Science+Business Media: Dordrecht, The Netherlands, 2013; Volume 4, pp. 173–188. [Google Scholar] [CrossRef]
- Bosco, M.; Ghersi, A.; Marino, E.M.; Rossi, P.P. Comparison of nonlinear static methods for the assessment of asymmetric buildings. Bull. Earthq. Eng. 2013, 11, 2287–2308. [Google Scholar] [CrossRef]
- Hatzigeorgiou, G.D.; Liolios, A.A. Nonlinear behaviour of RC frames under repeated strong ground motions. Soil Dyn. Earthq. Eng. 2010, 30, 1010–1025. [Google Scholar] [CrossRef]
- Bugueño, I.; Carvallo, J.; Vielma, J.C. Influence of Directionality on the Seismic Response of Typical RC Buildings. Appl. Sci. 2022, 12, 1534. [Google Scholar] [CrossRef]
- Eurocode 1 (EC1). Actions on Structures—Part 1-1: General Actions, Densities, Self-Weight, Imposed Loads for Buildings; European Committee for Standardization: Brussels, Belgium, 2001. [Google Scholar]
- SAP 2000. Static and Dynamic Finite Element Analysis of Structures; Version 22.2.0; Computers and Structures (CSI): Berkeley, CA, USA, 2020. [Google Scholar]
- Chopra, A. Dynamics of Structures, 4th ed.; Prentice Hall Pearson: Essex, UK, 2014. [Google Scholar]
- Center for Engineering Strong Motion Data. Available online: www.strongmotioncenter.org (accessed on 10 June 2022).
- Hanks, T.C.; Kanamori, H. A moment magnitude scale. J. Geophys. Res. Solid Earth 1979, 84, 2348–2350. [Google Scholar] [CrossRef]
- Kanamori, H. Magnitude scale and quantification of earthquakes. Tectonophysics 1983, 93, 185–199. [Google Scholar] [CrossRef]
- SeismoSpect. Software for Signal Processing for Ground Motion Records, Version 2023; Seismosoft. Available online: https://seismosoft.com/products/seismospect/ (accessed on 1 October 2024).
- ASCE 41-17; Seismic Evaluation and Retrofit of Existing Buildings. American Society of Civil Engineers (ASCE): Reston, VA, USA, 2017.
- FEMA-356; Prestandard and Commentary for the Seismic Rehabilitation of Buildings. Federal Emergency Management Agency: Washington, DC, USA, 2000.
- Petrone, C.; Magliulo, G.; Cimmino, M.; Manfredi, G. Evaluation of the seismic demand on acceleration sensitive non-structural components in RC frame structures. In Proceedings of the Second European Conference on Earthquake Engineering and Seismology, Istanbul, Turkey, 25–29 August 2014. [Google Scholar]
- Alavi, B.; Krawinkler, H. Behavior of moment-resisting frame structures subjected to near-fault ground motions. Earthq. Eng. Struct. Dyn. 2004, 33, 687–706. [Google Scholar] [CrossRef]
- Alavi, B.; Krawinkler, H. Consideration of near-fault ground motion effects in seismic design. In Proceedings of the 12th World Conference on Earthquake Engineering, Auckland, New Zealand, 30 January–4 February 2000; p. 2000. [Google Scholar]
- Zhang, S.; Wang, G. Effects of near-fault and far-fault ground motions on nonlinear dynamic response and seismic damage of concrete gravity dams. Soil Dyn. Earthq. Eng. 2013, 53, 217–229. [Google Scholar] [CrossRef]


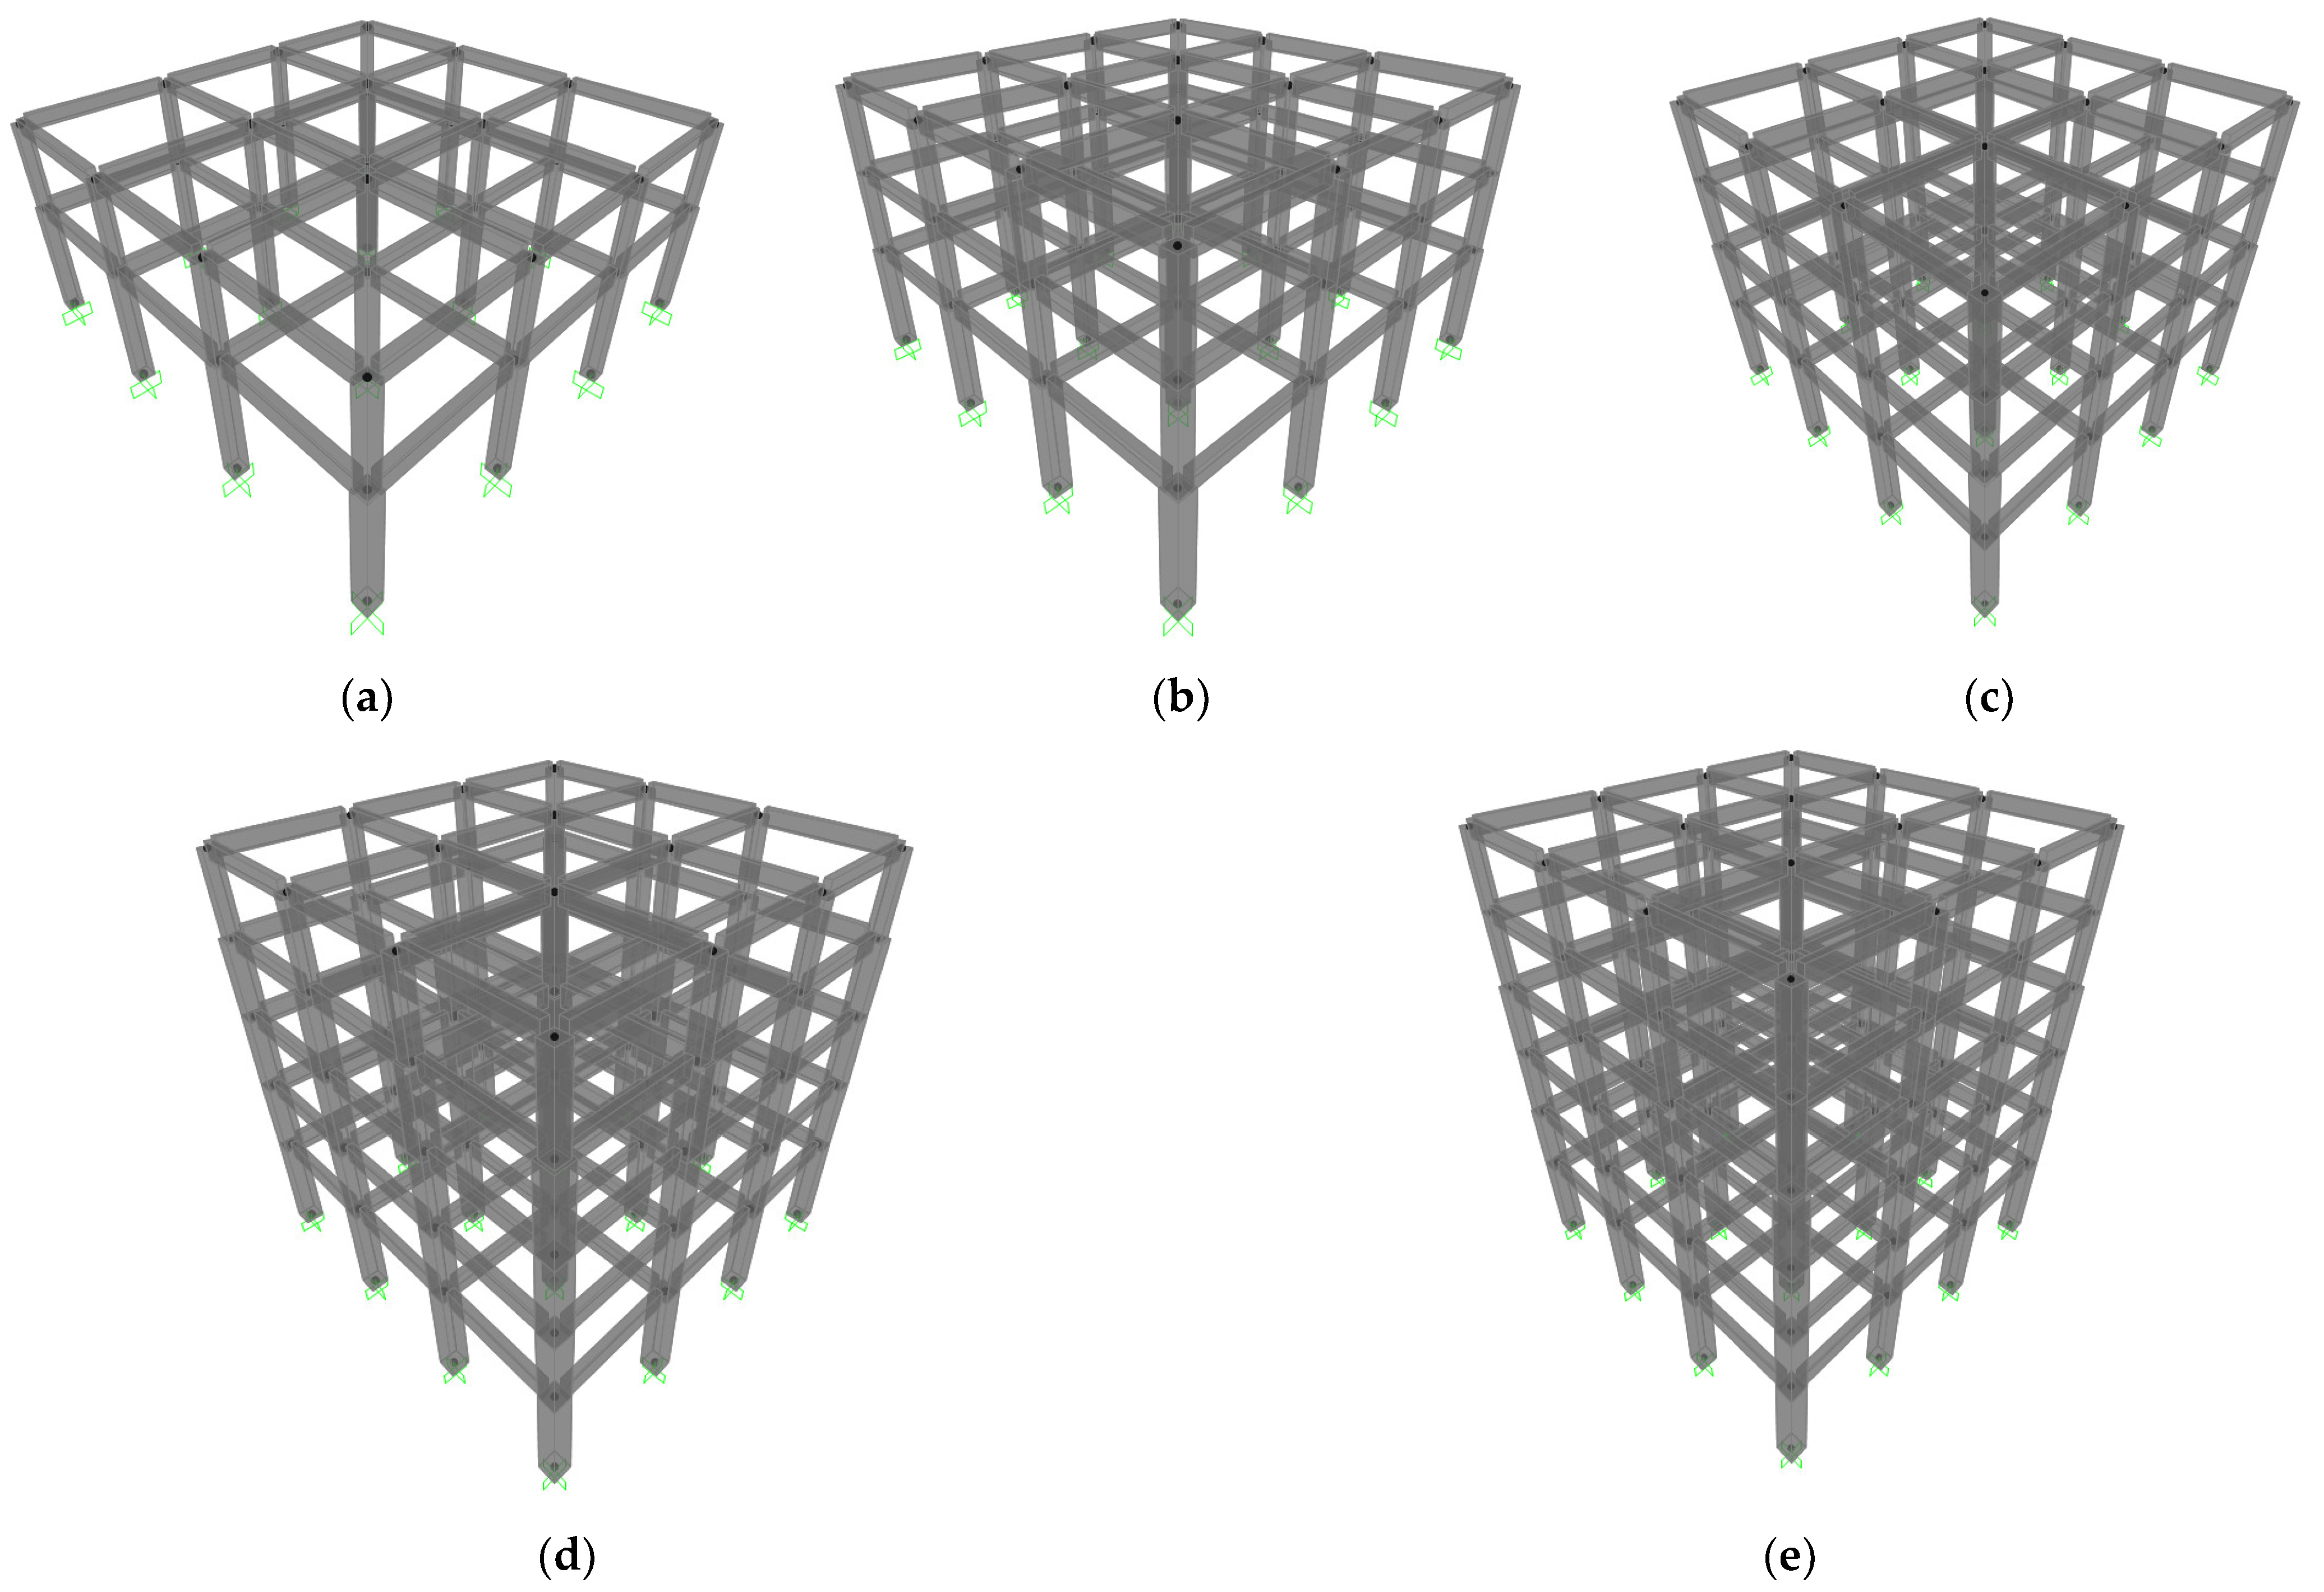
| R/C Building (Figure 1a) | ||||||
| Story | Columns | Beams | ||||
| Section (m2) | Axial Bars | Stirrups | Section (m2) | Axial Bars | Stirrups | |
| 1 | 0.50 × 0.50 | 8 Ø 26 | Ø 8/10 | 0.25 × 0.60 | 8 Ø 18 | Ø 8/10 |
| 2 | 0.40 × 0.40 | 8 Ø 18 | Ø 8/10 | 0.25 × 0.50 | 6Ø 14, 2Ø 8 | Ø 8/10 |
| R/C building (Figure 1b) | ||||||
| Story | Columns | Beams | ||||
| Section (m2) | Axial Bars | Stirrups | Section (m2) | Axial Bars | Stirrups | |
| 1 | 0.60 × 0.60 | 16 Ø 20 | Ø 8/10 | 0.25 × 0.60 | 8Ø18 | Ø 8/10 |
| 2 | 0.50 × 0.50 | 8Ø20, 4Ø14 | Ø 8/10 | 0.25 × 0.60 | 8Ø18 | Ø 8/10 |
| 3 | 0.50 × 0.50 | 8Ø20, 4Ø14 | Ø 8/10 | 0.25 × 0.60 | 8Ø18 | Ø 8/10 |
| R/C building (Figure 1c) | ||||||
| Story | Columns | Beams | ||||
| Section (m2) | Axial Bars | Stirrups | Section (m2) | Axial Bars | Stirrups | |
| 1 | 0.60 × 0.60 | 16Ø20 | Ø 8/10 | 0.25 × 0.70 | 8Ø20, 4Ø14 | Ø 8/10 |
| 2 | 0.60 × 0.60 | 8Ø20, 8Ø16 | Ø 8/10 | 0.25 × 0.70 | 8Ø20, 4Ø14 | Ø 8/10 |
| 3 | 0.50 × 0.50 | 8Ø20, 4Ø16 | Ø 8/10 | 0.25 × 0.60 | 8Ø18 | Ø 8/10 |
| 4 | 0.50 × 0.50 | 8Ø20, 4Ø16 | Ø 8/10 | 0.25 × 0.60 | 8Ø18 | Ø 8/10 |
| R/C building (Figure 1d) | ||||||
| Story | Columns | Beams | ||||
| Section (m2) | Axial Bars | Stirrups | Section (m2) | Axial Bars | Stirrups | |
| 1 | 0.70 × 0.70 | 8Ø22, 16Ø20 | Ø 8/10 | 0.25 × 0.75 | 8Ø20, 4Ø14 | Ø 8/10 |
| 2 | 0.70 × 0.70 | 16Ø20 | Ø 8/10 | 0.25 × 0.70 | 8Ø20, 4Ø14 | Ø 8/10 |
| 3 | 0.70 × 0.70 | 16Ø20 | Ø 8/10 | 0.25 × 0.70 | 8Ø20, 4Ø14 | Ø 8/10 |
| 4 | 0.70 × 0.70 | 16Ø20 | Ø 8/10 | 0.25 × 0.70 | 8Ø18 | Ø 8/10 |
| 5 | 0.50 × 0.50 | 12Ø18 | Ø 8/10 | 0.25 × 0.60 | 8Ø18 | Ø8/10 |
| R/C building (Figure 1e) | ||||||
| Story | Columns | Beams | ||||
| Section (m2) | Axial Bars | Stirrups | Section (m2) | Axial Bars | Stirrups | |
| 1 | 0.75 × 0.75 | 16Ø22, 8Ø18 | Ø 8/10 | 0.25 × 0.75 | 8Ø20, 4Ø14 | Ø 8/10 |
| 2 | 0.75 × 0.75 | 16Ø22 | Ø 8/10 | 0.25 × 0.75 | 8Ø20, 4Ø14 | Ø 8/10 |
| 3 | 0.70 × 0.70 | 16Ø20 | Ø 8/10 | 0.25 × 0.70 | 8Ø20, 4Ø14 | Ø 8/10 |
| 4 | 0.70 × 0.70 | 16Ø20 | Ø 8/10 | 0.25 × 0.70 | 8Ø20, 4Ø14 | Ø 8/10 |
| 5 | 0.50 × 0.50 | 8Ø20, 8Ø14 | Ø 8/10 | 0.25 × 0.70 | 8Ø18 | Ø 8/10 |
| 6 | 0.50 × 0.50 | 8Ø20, 8Ø14 | Ø 8/10 | 0.25 × 0.60 | 8Ø18 | Ø 8/10 |
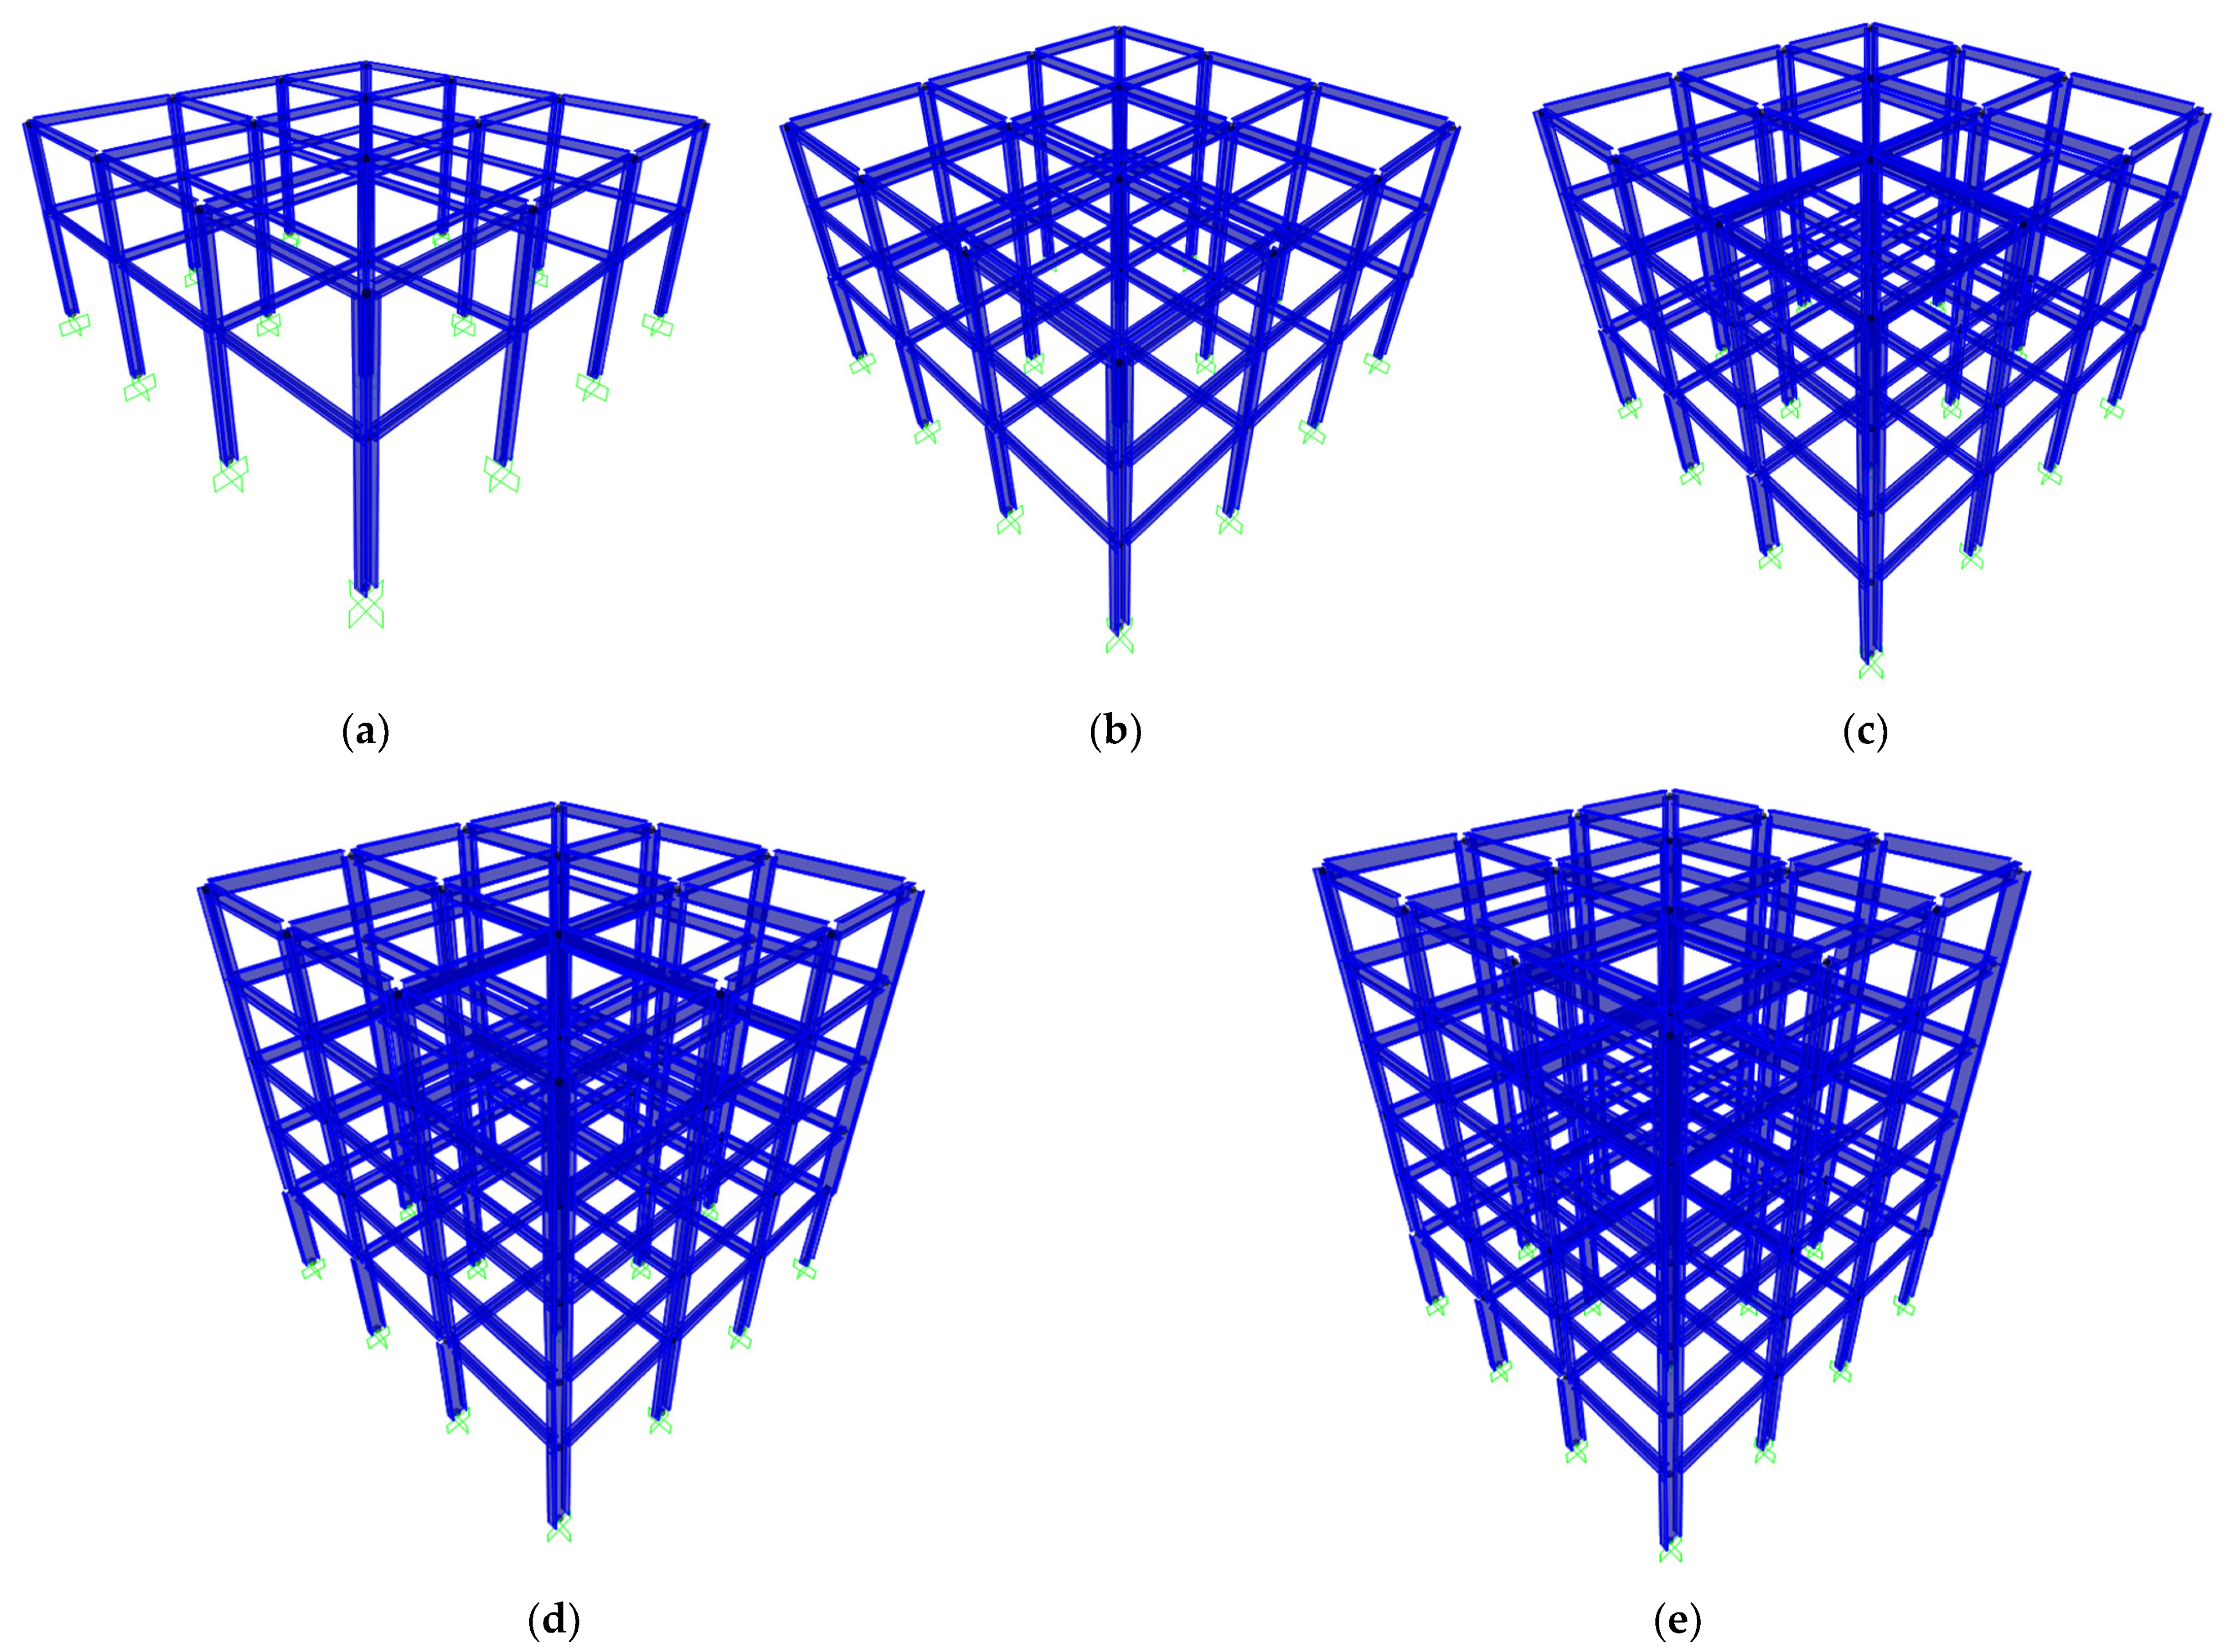
| Steel Frames | Steel Columns | Steel Beams |
|---|---|---|
| Two-Story Steel Frames (Figure 2a) | HEM 300 * | IPE 300 * |
| Three-Story Steel Frames (Figure 2b) | HEM 400 * | IPE 400 * |
| Four-Story Steel Frames (Figure 2c) | HEM 550 * | IPE 450 * |
| Five-Story Steel Frames (Figure 2d) | HEM 600 * | IPE 500 * |
| Six-Story Steel Frames (Figure 2e) | HEM 650 * | IPE 550 * |
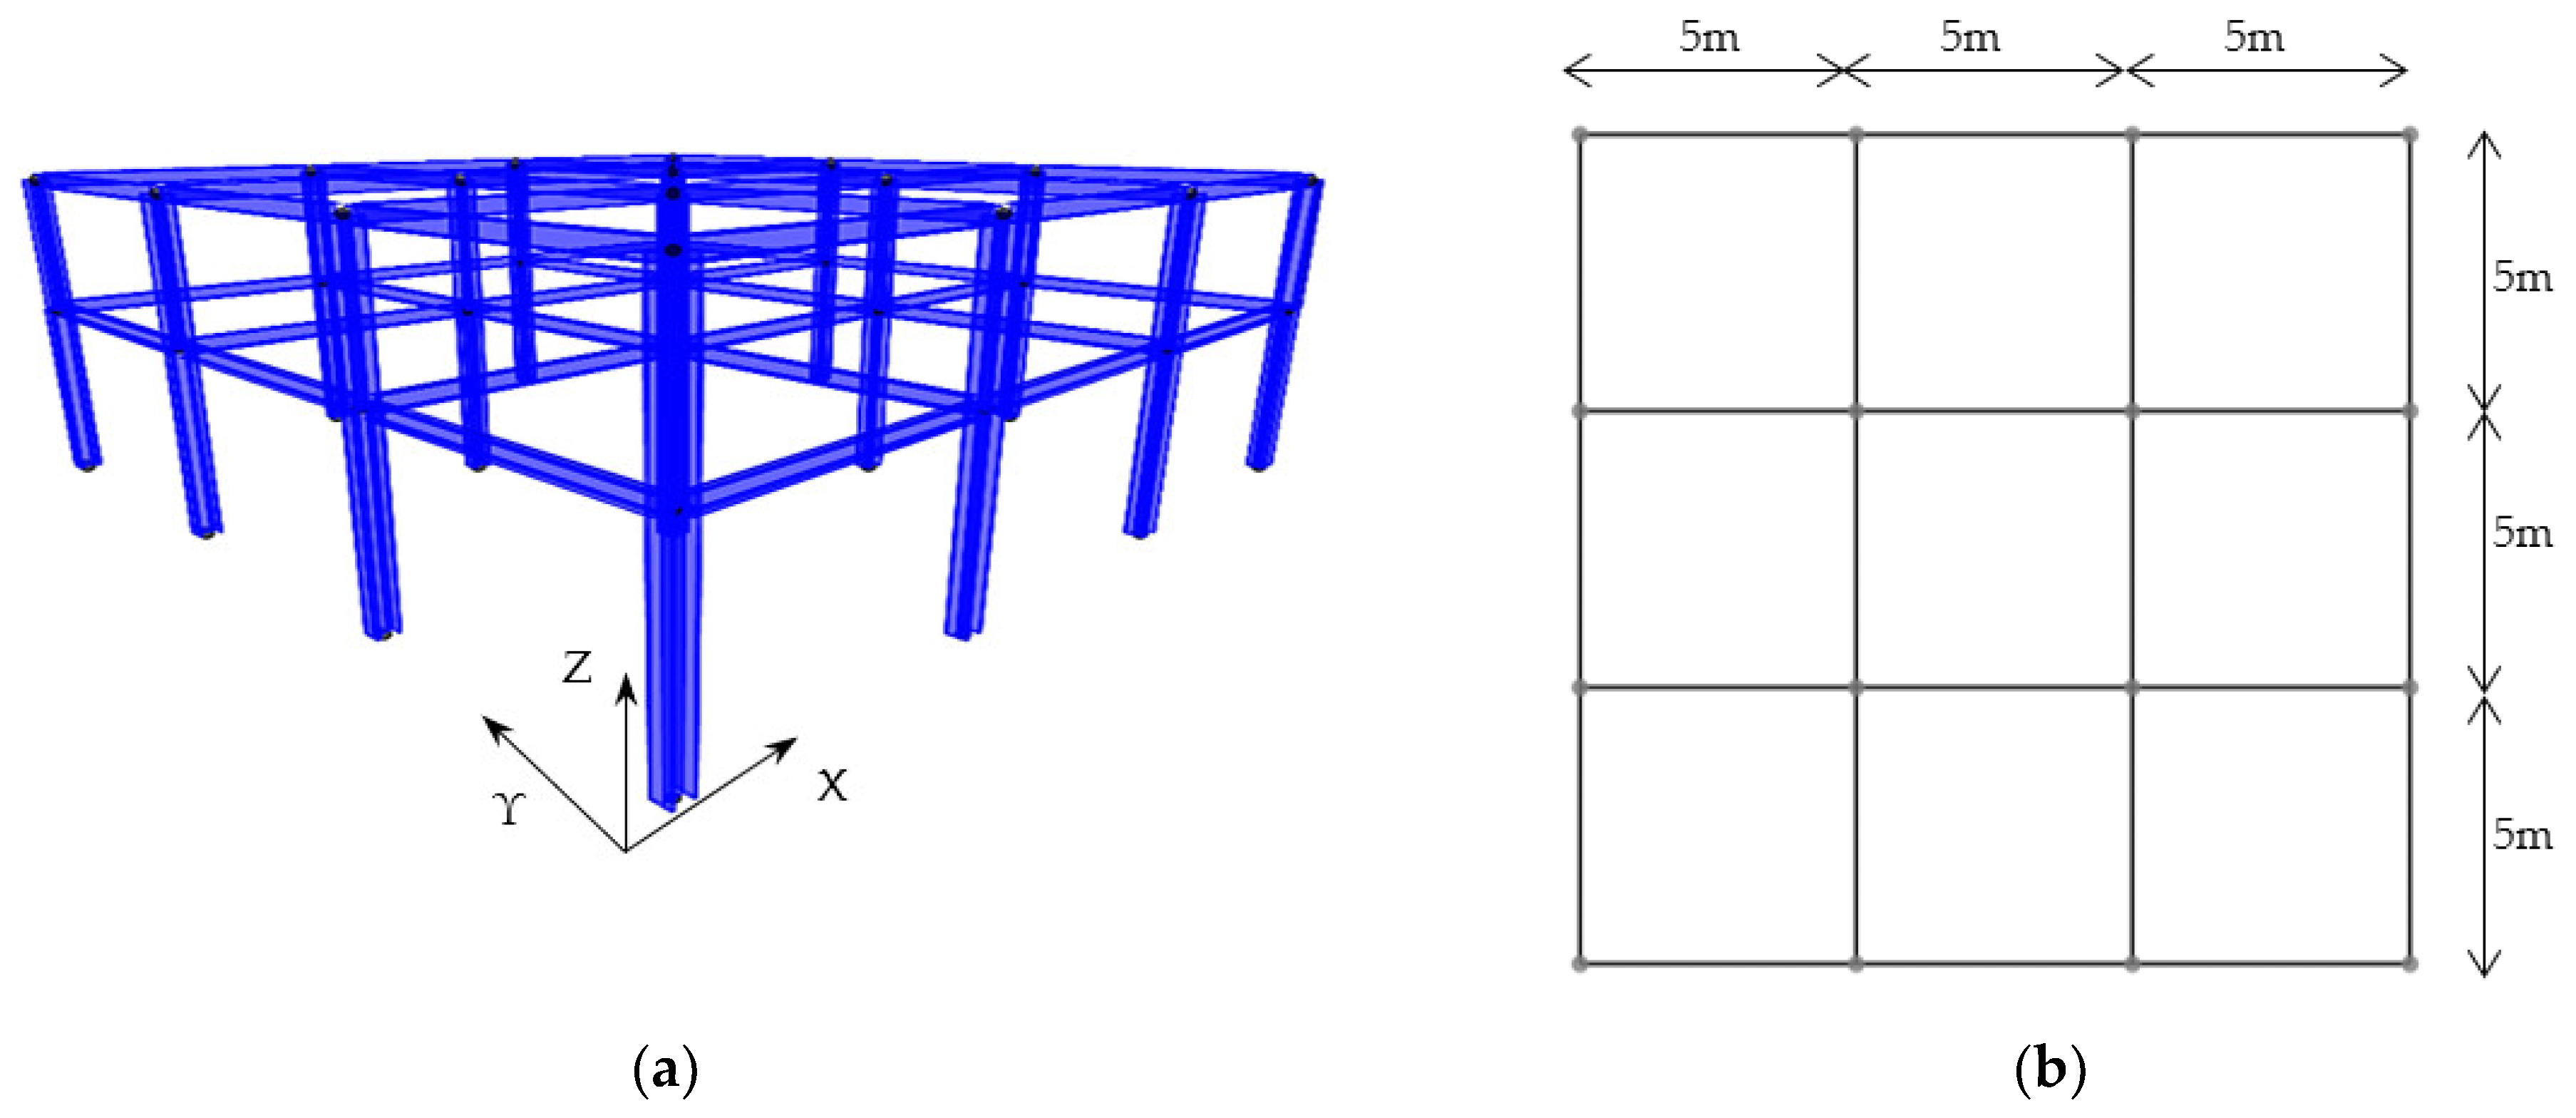
| Hybrid Building (Figure 3a) | |||||||
| Story | Material | Columns | Beams | ||||
| Section (m2) | Axial bars | Stirrups | Section (m2) | Axial Bars | Stirrups | ||
| 1 | Reinforced concrete | 0.50 × 0.50 | 8Ø 22 | Ø 8/10 | 0.25 × 0.60 | 8Ø 18 | Ø 8/10 |
| 2 | Structural steel | HEA360 | IPE270 | ||||
| Hybrid Building (Figure 3b) | |||||||
| Story | Material | Columns | Beams | ||||
| Section (m2) | Axial bars | Stirrups | Section (m2) | Axial Bars | Stirrups | ||
| 1 | Reinforced concrete | 0.55 × 0.55 | 16Ø20 | Ø 8/10 | 0.25 × 0.60 | 8Ø20, 8Ø10 | Ø 8/10 |
| 2 | Reinforced concrete | 0.50 × 0.50 | 8Ø20, 8Ø10 | Ø 8/10 | 0.25 × 0.60 | 8Ø18 | Ø 8/10 |
| 3 | Structural steel | HEA360 | IPE270 | ||||
| Hybrid Building (Figure 3c) | |||||||
| Story | Material | Columns | Beams | ||||
| Section (m2) | Axial bars | Stirrups | Section (m2) | Axial Bars | Stirrups | ||
| 1 | Reinforced concrete | 0.60 × 0.60 | 16Ø20 | Ø 8/10 | 0.25 × 0.70 | 8Ø20, 8Ø10 | Ø 8/10 |
| 2 | Reinforced concrete | 0.60 × 0.60 | 8Ø20, 8Ø16 | Ø 8/10 | 0.25 × 0.70 | 8Ø20, 8Ø10 | Ø 8/10 |
| 3 | Reinforced concrete | 0.50 × 0.50 | 8Ø20, 8Ø10 | Ø 8/10 | 0.25 × 0.60 | 8Ø18 | Ø 8/10 |
| 4 | Structural steel | HEA360 | IPE270 | ||||
| Hybrid Building (Figure 3d) | |||||||
| Story | Material | Columns | Beams | ||||
| Section (m2) | Axial bars | Stirrups | Section (m2) | Axial Bars | Stirrups | ||
| 1 | Reinforced concrete | 0.70 × 0.70 | 8Ø22, 16Ø20 | Ø 8/10 | 0.25 × 0.70 | 8Ø20, 8Ø16 | Ø 8/10 |
| 2 | Reinforced concrete | 0.70 × 0.70 | 16Ø20 | Ø 8/10 | 0.25 × 0.70 | 2Ø20, 3Ø10 | Ø 8/10 |
| 3 | Reinforced concrete | 0.70 × 0.70 | 8Ø20, 8Ø10 | Ø 8/10 | 0.25 × 0.60 | 8Ø18 | Ø 8/10 |
| 4 | Structural steel | HEΒ500 | IPE360 | ||||
| 5 | Structural steel | HEΒ500 | IPE300 | ||||
| Hybrid Building (Figure 3e) | |||||||
| Story | Material | Columns | Beams | ||||
| Section (m2) | Axial bars | Stirrups | Section (m2) | Axial Bars | Stirrups | ||
| 1 | Reinforced concrete | 0.70 × 0.70 | 32Ø20 | Ø 8/10 | 0.25 × 0.70 | 8Ø20, 8Ø10 | Ø 8/10 |
| 2 | Reinforced concrete | 0.70 × 0.70 | 16Ø20 | Ø 8/10 | 0.25 × 0.70 | 8Ø18 | Ø 8/10 |
| 3 | Reinforced concrete | 0.70 × 0.70 | 16Ø20 | Ø 8/10 | 0.25 × 0.70 | 8Ø18 | Ø 8/10 |
| 4 | Reinforced concrete | 0.70 × 0.70 | 16Ø20 | Ø 8/10 | 0.25 × 0.70 | 8Ø18 | Ø 8/10 |
| 5 | Structural steel | HEA500 | IPE400 | ||||
| 6 | Structural steel | HEA500 | IPE440 | ||||
| Building Stories | Mode Number | R/C Buildings | Steel Buildings | Hybrid Buildings: Fixed Case | Hybrid Buildings: Fixed-Pinned Case | ||||
|---|---|---|---|---|---|---|---|---|---|
| Period (S) | Participating Mass Percentage | Period (S) | Participating Mass Percentage | Period (S) | Participating Mass Percentage | Period (S) | Participating Mass Percentage | ||
| Two stories | 1 | 0.414 | 93% | 0.525 | 96% | 0.399 | 91% | 0.429 | 83% |
| 2 | 0.414 | 93% | 0.412 | 96% | 0.399 | 91% | 0.429 | 83% | |
| 3 | 0.375 | 93% | 0.407 | 91% | 0.356 | 92% | 0.394 | 80% | |
| Three stories | 1 | 0.469 | 89% | 0.616 | 96% | 0.506 | 89% | 0.522 | 85% |
| 2 | 0.469 | 89% | 0.446 | 96% | 0.451 | 89% | 0.474 | 85% | |
| 3 | 0.427 | 89% | 0.436 | 96% | 0.425 | 90% | 0.451 | 82% | |
| Four stories | 1 | 0.546 | 87% | 0.711 | 95% | 0.559 | 86% | 0.571 | 83% |
| 2 | 0.546 | 87% | 0.488 | 95% | 0.559 | 86% | 0.571 | 83% | |
| 3 | 0.494 | 87% | 0.463 | 95% | 0.504 | 86% | 0.519 | 82% | |
| Five stories | 1 | 0.569 | 85% | 0.795 | 95% | 0.581 | 80% | 0.601 | 76% |
| 2 | 0.569 | 85% | 0.552 | 95% | 0.581 | 80% | 0.601 | 76% | |
| 3 | 0.517 | 85% | 0.508 | 95% | 0.522 | 81% | 0.545 | 75% | |
| Six stories | 1 | 0.650 | 80% | 0.863 | 95% | 0.498 | 80% | 0.509 | 82% |
| 2 | 0.650 | 80% | 0.603 | 95% | 0.498 | 80% | 0.509 | 82% | |
| 3 | 0.589 | 80% | 0.54 | 95% | 0.449 | 80% | 0.465 | 83% | |
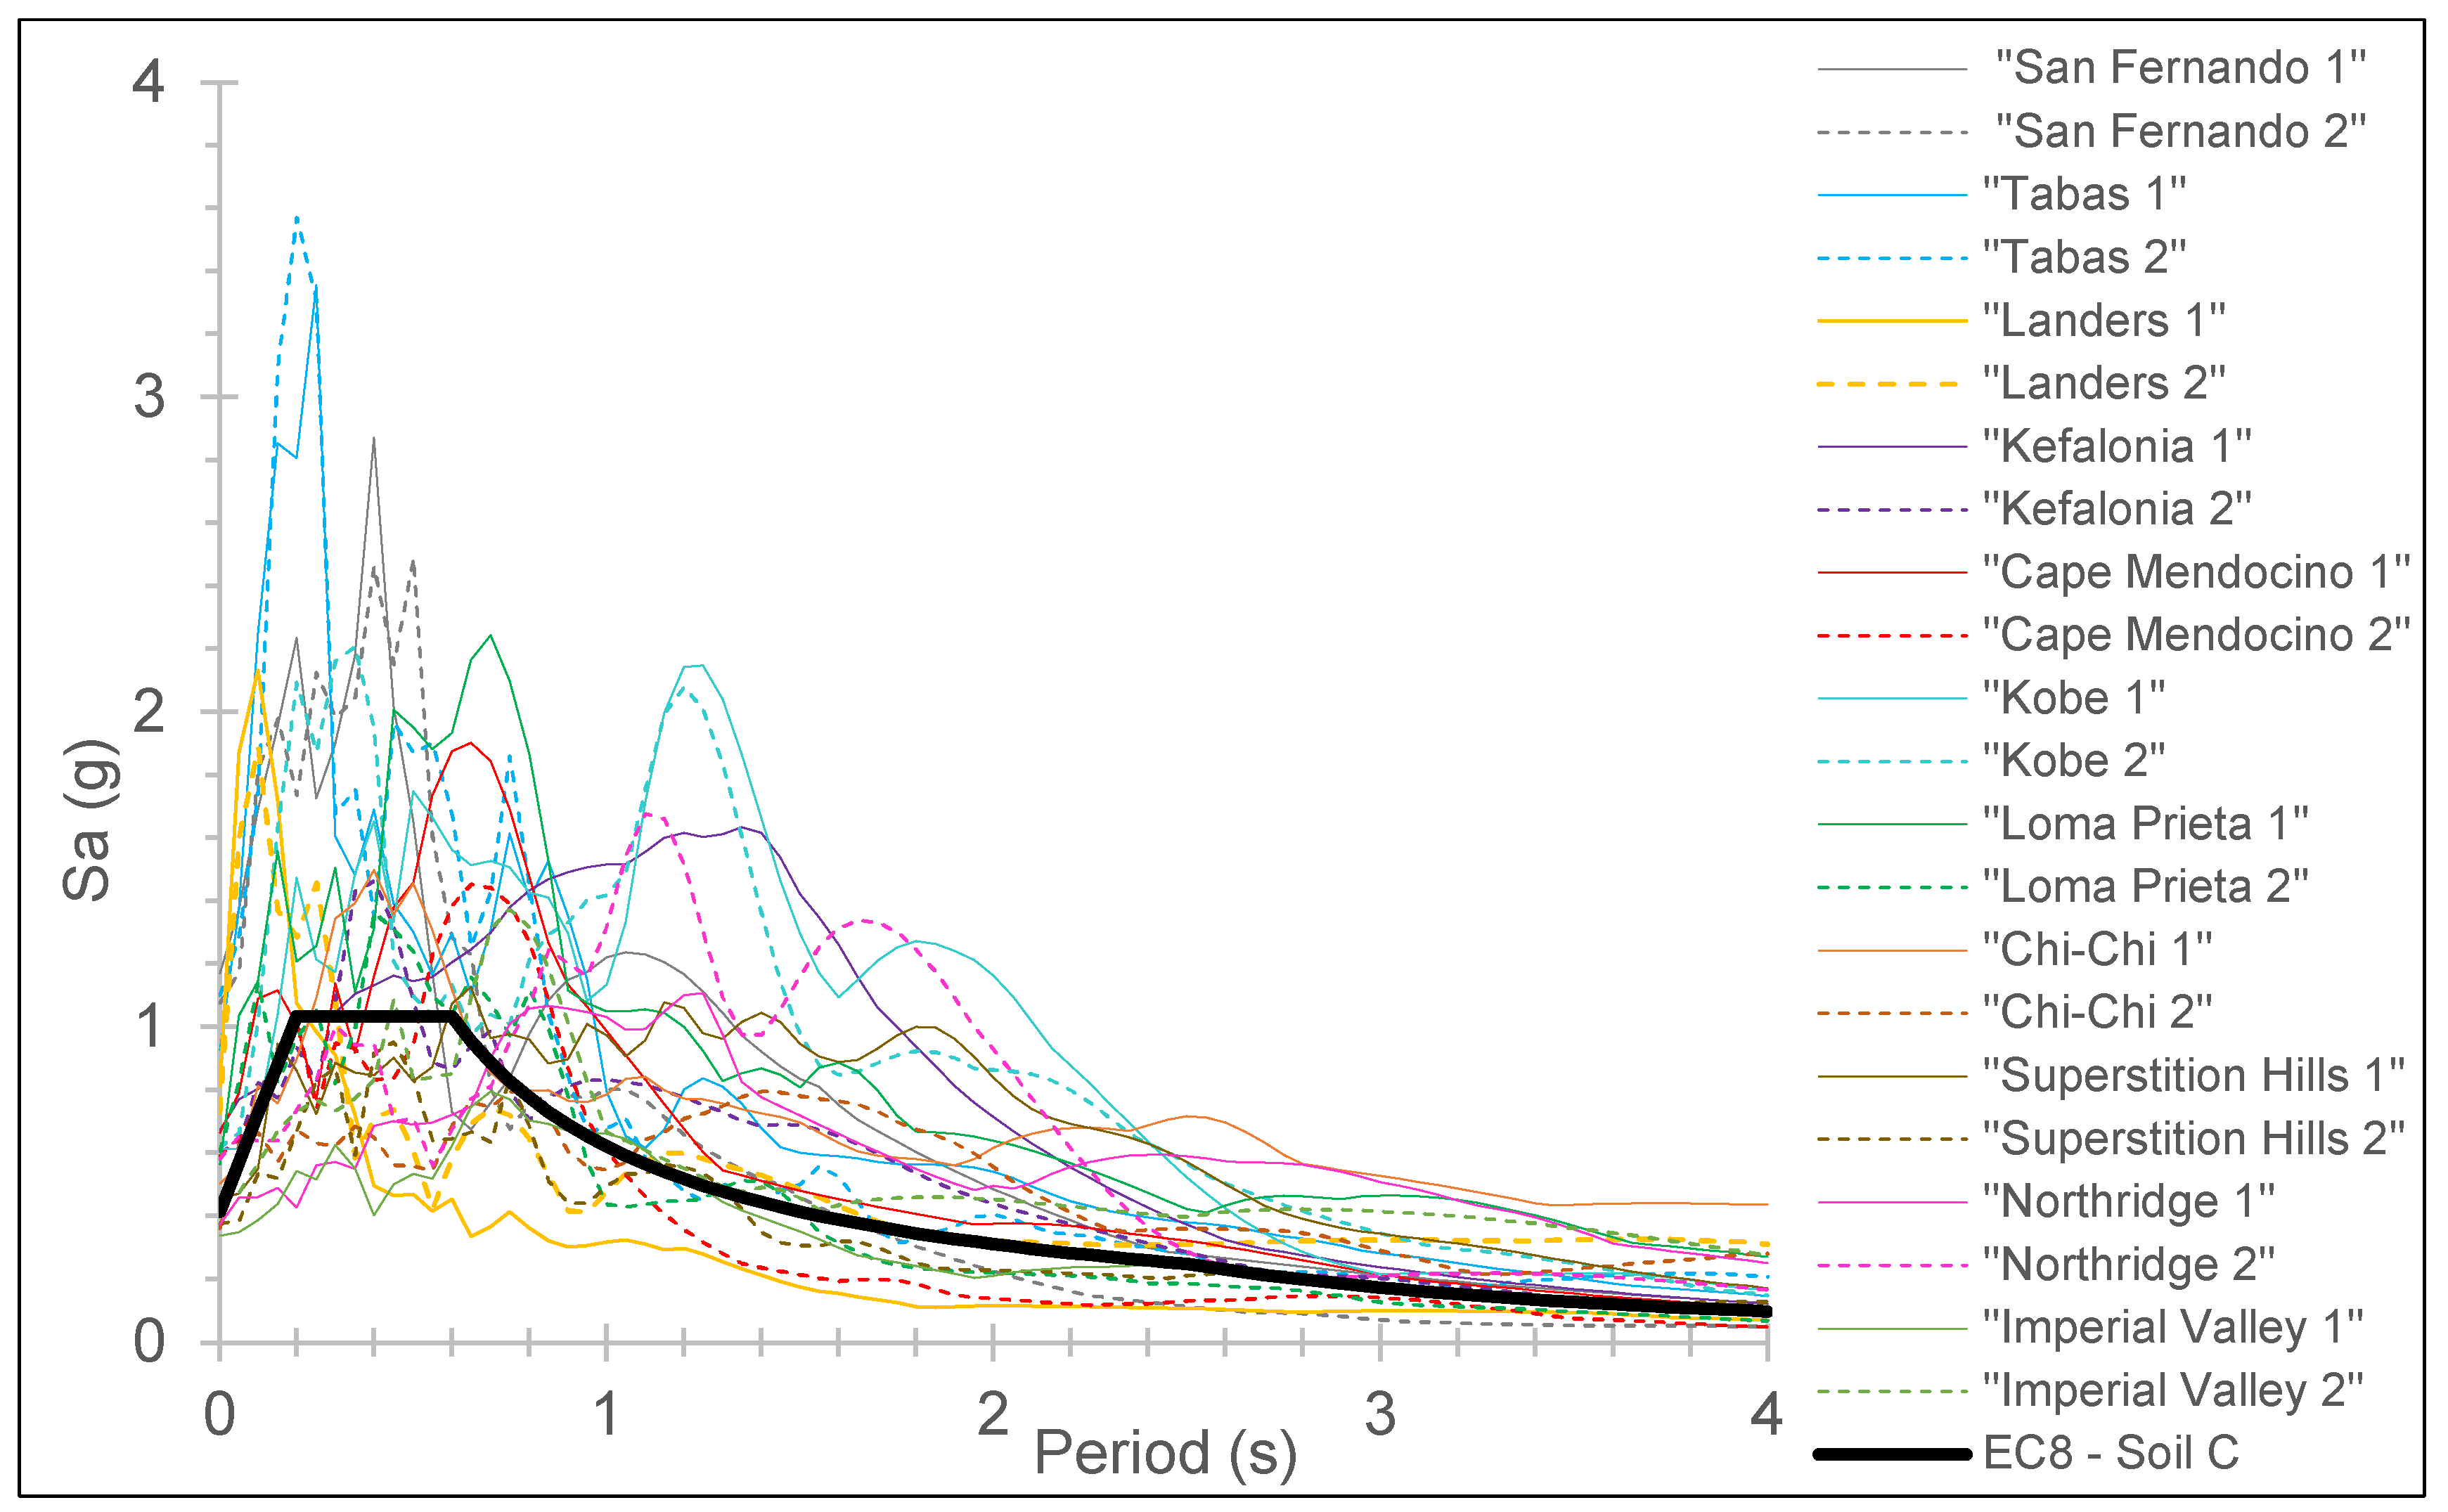
| Plotline Number | Location of the Seismic Event | Year | Recording Station | Seismic Event Duration (S) | Mw | PGA (g) |
|---|---|---|---|---|---|---|
| 1 | “San Fernando”—USA | 1971 | Pacoima Dam | 20.48 | 6.6 | 1.17/1.08 |
| 2 | “Tabas”—Iran | 1978 | Tabas | 63.48 | 7.1 | 0.93/1.10 |
| 3 | “Landers”—USA) | 1992 | Lucerne Valley | 48.05 | 7.3 | 0.81/0.73 |
| 4 | “Kefalonia”—Greece | 2014 | Lixouri | 67.74 | 6.1 | 0.67/0.60 |
| 5 | “Cape Mendocino”—USA | 1992 | Petrolia | 60.00 | 6.9 | 0.66/0.59 |
| 6 | “Kobe”—Japan | 1995 | Takatori | 41.15 | 6.9 | 0.61/0.62 |
| 7 | “Loma Prieta”—USA | 1989 | Los Gatos | 25.05 | 7.0 | 0.56/0.61 |
| 8 | “Chi-Chi”—Taiwan | 1999 | TCU 052 | 90.01 | 7.6 | 0.50/0.36 |
| 9 | “Superstition Hills”—USA | 1987 | Parachute Test Site | 22.40 | 6.5 | 0.45/0.38 |
| 10 | “Northridge”—USA | 1994 | Sylmar Converter St. | 28.48 | 6.7 | 0.37/0.58 |
| 11 | “Imperial Valley”—USA | 1979 | El Centro Array 6 | 36.90 | 6.5 | 0.34/0.46 |
Disclaimer/Publisher’s Note: The statements, opinions and data contained in all publications are solely those of the individual author(s) and contributor(s) and not of MDPI and/or the editor(s). MDPI and/or the editor(s) disclaim responsibility for any injury to people or property resulting from any ideas, methods, instructions or products referred to in the content. |
© 2025 by the author. Licensee MDPI, Basel, Switzerland. This article is an open access article distributed under the terms and conditions of the Creative Commons Attribution (CC BY) license (https://creativecommons.org/licenses/by/4.0/).
Share and Cite
Askouni, P.K. Seismic Comparison of Hybrid Steel–Reinforced Concrete and Conventional Frames. Appl. Sci. 2025, 15, 3772. https://doi.org/10.3390/app15073772
Askouni PK. Seismic Comparison of Hybrid Steel–Reinforced Concrete and Conventional Frames. Applied Sciences. 2025; 15(7):3772. https://doi.org/10.3390/app15073772
Chicago/Turabian StyleAskouni, Paraskevi K. 2025. "Seismic Comparison of Hybrid Steel–Reinforced Concrete and Conventional Frames" Applied Sciences 15, no. 7: 3772. https://doi.org/10.3390/app15073772
APA StyleAskouni, P. K. (2025). Seismic Comparison of Hybrid Steel–Reinforced Concrete and Conventional Frames. Applied Sciences, 15(7), 3772. https://doi.org/10.3390/app15073772