3. Proposed System
3.1. System Architecture
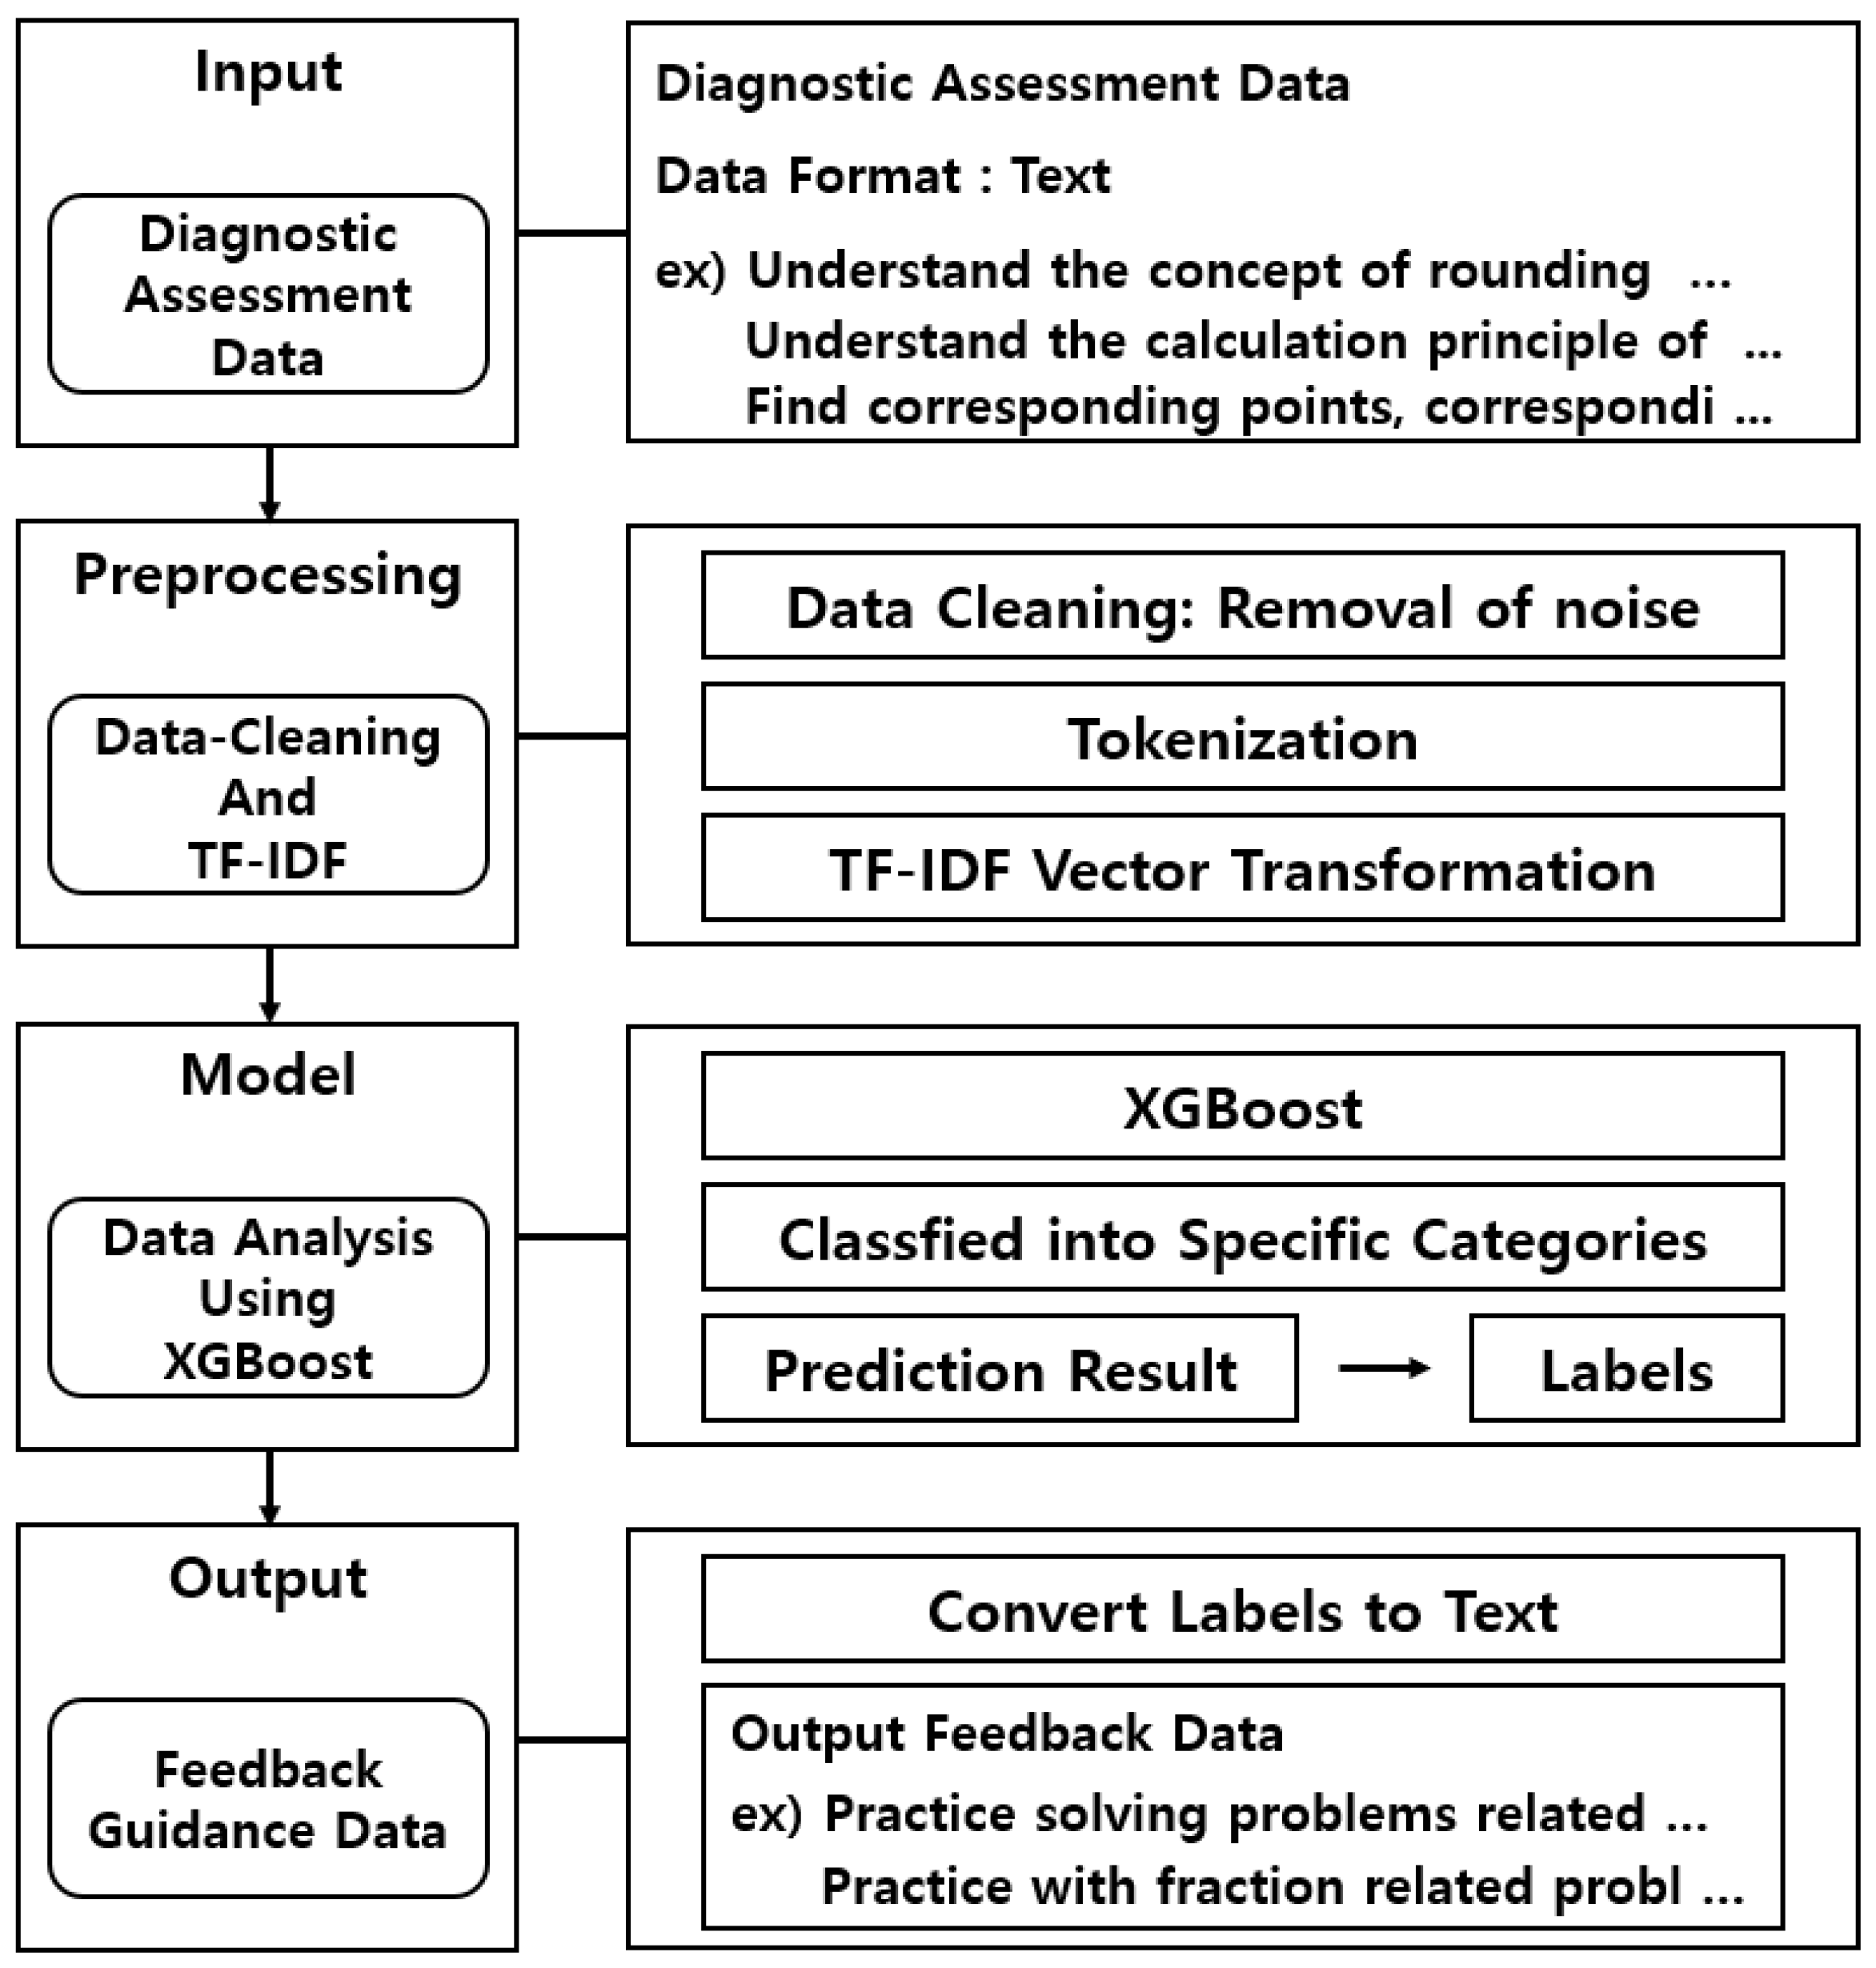
The overall architecture of the proposed system is illustrated in
Figure 1.
The proposed system consists of four main stages: data input, preprocessing, model training, and result generation. The data input stage involves receiving diagnostic assessment data from students for analysis. At this stage, teachers input text-based data that assess students’ learning progress, problem-solving patterns, and common errors in mathematics. The user interface (UI) is provided as a web application, allowing teachers to validate the data format and content through a preview feature, ensuring the integrity of the input data.
In the data preprocessing stage, the input diagnostic data undergoes a transformation to be suitable for processing by the proposed model. This step involves removing unnecessary special characters and whitespace, handling duplicate words, and correcting incorrect formats to refine the textual data. The cleaned text is then tokenized into individual words, and TF-IDF (Term Frequency-Inverse Document Frequency) is applied to compute the importance of each term, converting the text into vectorized representations. These processed vectors are then passed to the system’s learning stage.
The model training stage focuses on analyzing the preprocessed data to predict and classify diagnostic assessment results. In this study, XGBoost was selected as the classification model due to its high accuracy, even with relatively small datasets. The model training process is implemented using XGBClassifier, with key hyperparameters optimized to improve classification performance. A detailed explanation of the dataset configuration and hyperparameter settings is provided in
Section 3.3. The model takes TF-IDF vectors as input, classifies student learning patterns into categories such as conceptual errors, calculation mistakes, and misunderstanding of problem requirements, and provides an effective diagnosis of individual learning conditions.
The result generation stage produces personalized feedback based on the analysis results. The generated feedback includes specific recommendations on students’ learning status and areas for improvement, which are delivered to teachers in real time. The feedback is provided in a structured text format, allowing teachers to design customized learning plans for each student. For example, the system may generate feedback such as “Student A needs to review fraction arithmetic concepts and practice solving related example problems”.
The proposed system is developed in the following technical environment:
Server deployment: the system is deployed using Amazon Web Services (AWS), a highly scalable and reliable cloud computing platform, ensuring efficient server management and operational stability.
Framework: Django (version 5.0), a Python-based web framework, was selected due to its strong support for Natural Language Processing (NLP) tasks and high compatibility with TF-IDF and XGBoost. Django facilitates seamless integration of data processing components and enables efficient management of interactions between the UI and the system’s backend server.
User interface (UI): The UI was developed using Python (version 3.12.6), HTML5, CSS, ECMAScript 2023, and Ajax. The use of Ajax allows for real-time data processing without page refreshes, significantly enhancing the user experience (UX).
Database management: PostgreSQL (version 16.4) was chosen as the database system due to its high compatibility with Django and ability to handle large-scale datasets efficiently. PostgreSQL provides fast data retrieval performance and stability, ensuring consistent system operation even as the dataset grows. Given these advantages, PostgreSQL was selected as the primary database solution for this study.
Data storage and management: Diagnostic assessment data and classification labels are stored in PostgreSQL, allowing efficient data management and retrieval. Additionally, the database supports continuous the accumulation of diagnostic assessment data over time, enabling performance improvements for future iterations of the system. This structured data storage ensures scalability and reliability, making the system suitable for handling expanded datasets in future research and practical applications.
To ensure a fair comparison, all experiments, including the proposed model (TF-IDF + XGBoost) and baseline models (TF-IDF + Logistic Regression, TF-IDF + SVM, LightGBM, BERT, DistilBERT), were conducted under the same computing environment. This ensures that all models were evaluated using the same dataset, preprocessing techniques, and system configurations, making the performance results directly comparable.
3.2. System Process
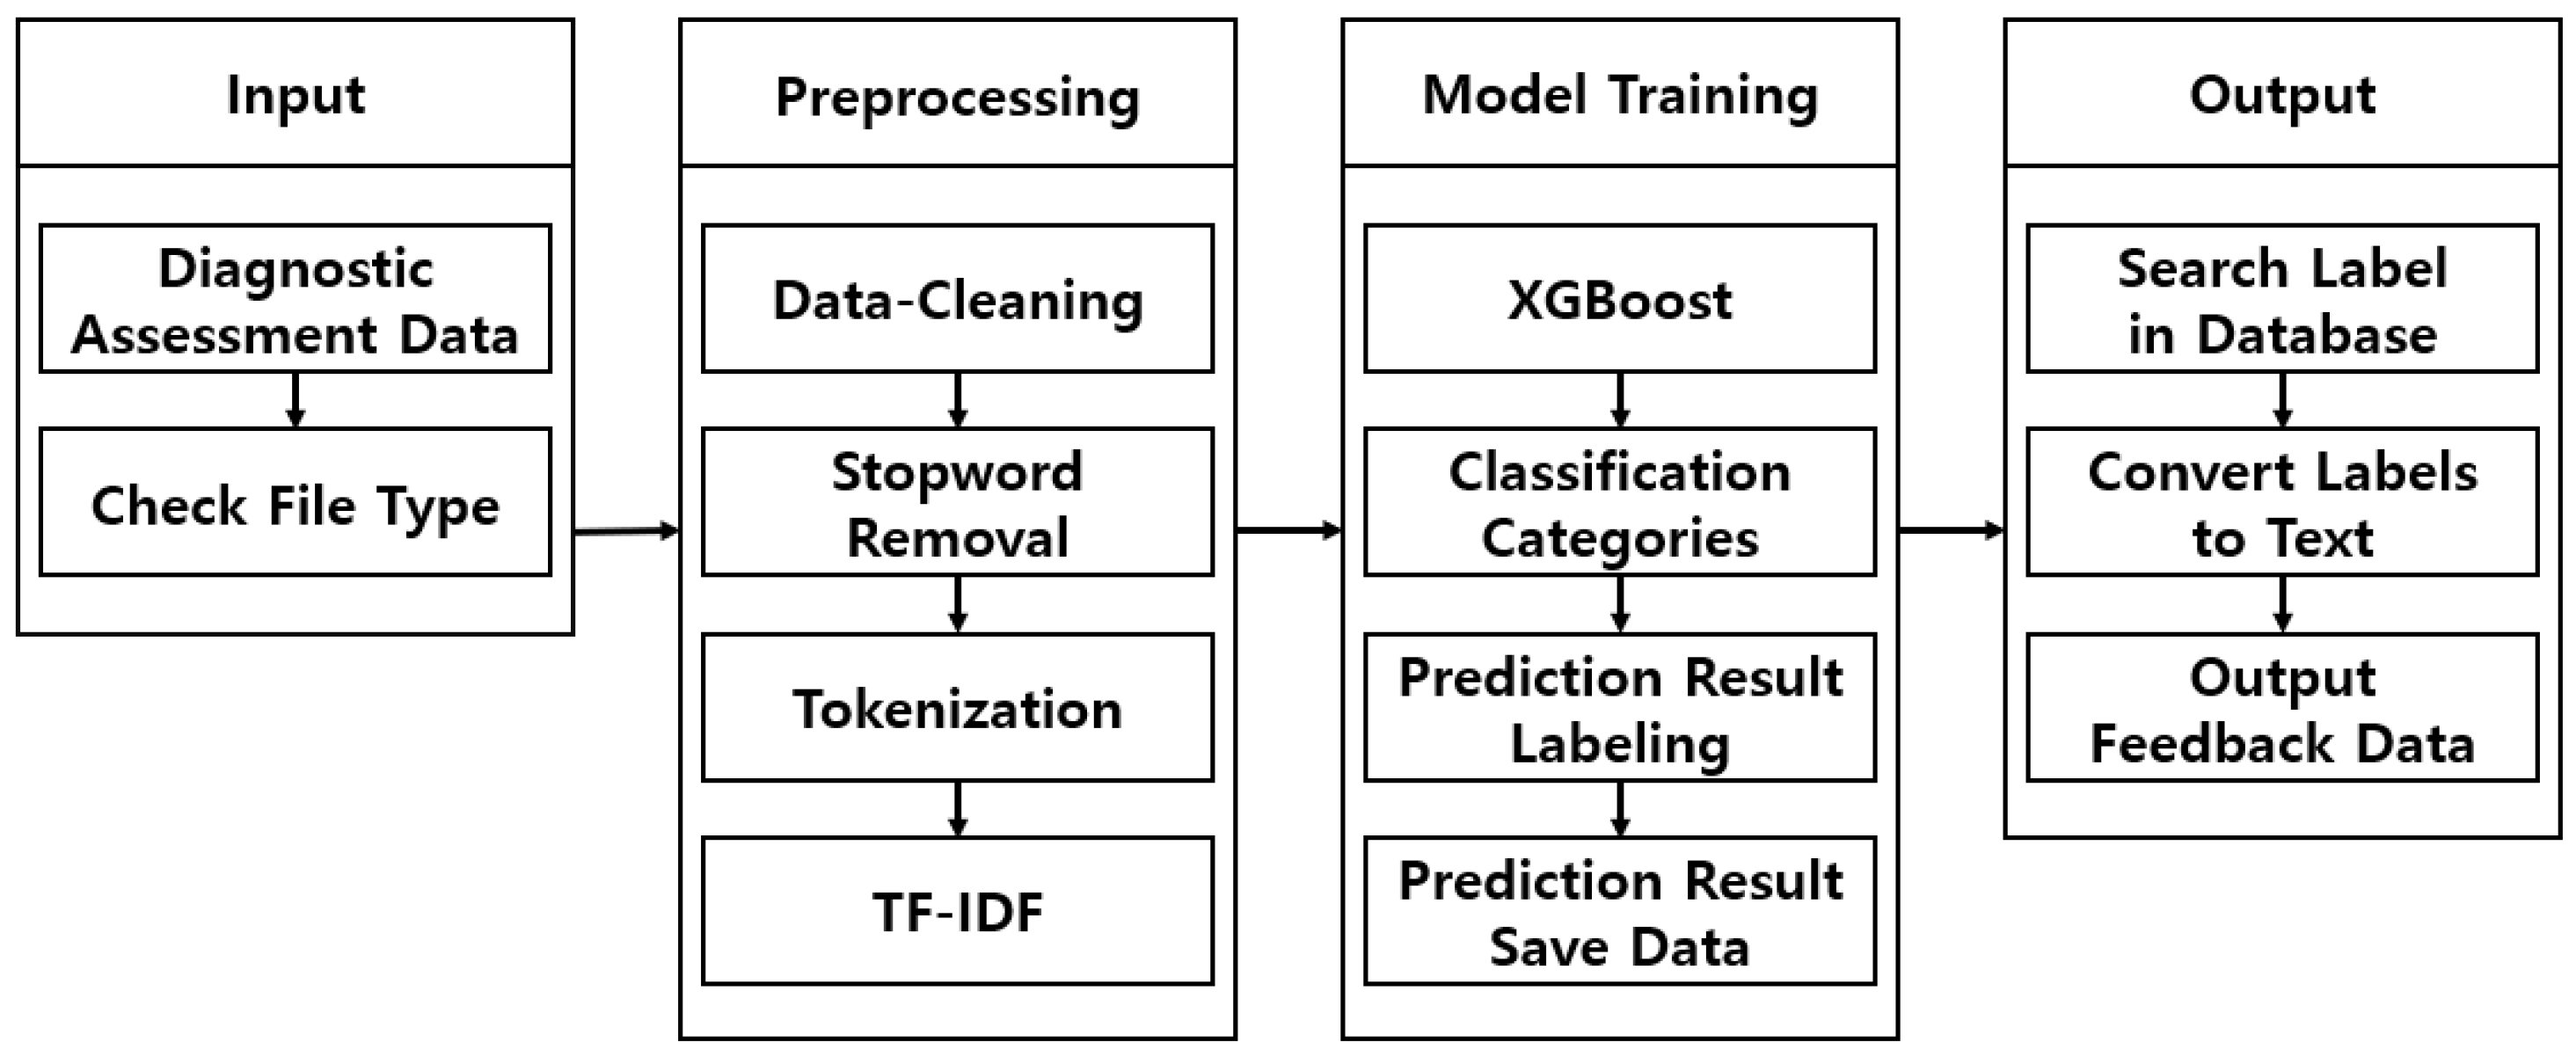
Figure 2 illustrates the overall process of the proposed system.
The proposed system consists of four stages: data input, data preprocessing, model training, and result generation. In the data input stage, teachers input the diagnostic assessment data that they have created for the students into the system. The system verifies whether the uploaded data are in text format to ensure validity. If confirmed as a valid text file, it is transmitted from the client server to the system server. The diagnostic assessment data includes students’ learning status (e.g., conceptual understanding) and error patterns (e.g., calculation mistakes), which serve as critical inputs for subsequent analysis.
In the data preprocessing stage, the transmitted diagnostic data undergo data cleaning to ensure optimal quality for model training. First, the system removes whitespace, special characters, and unnecessary stopwords to clean the text data. The refined text is then tokenized into individual words, converting it into a structured format suitable for further analysis. Next, TF-IDF (Term Frequency-Inverse Document Frequency) is applied to compute the importance of each word, transforming the text data into a vectorized form that serves as input for the model training process.
During the model training stage, the preprocessed TF-IDF vectorized data are fed into XGBoost (eXtreme Gradient Boosting) for classification. XGBoost is a tree-based boosting algorithm that prevents overfitting and delivers high accuracy even with relatively small datasets. This study selected XGBoost due to its fast training speed and strong performance in multi-class classification tasks.
The trained model makes predictions based on test data, categorizing student responses into predefined labels such as “Concept Deficiency”, “Calculation Mistake”, and “Misunderstanding of Problem Requirements”. The classification results are stored as labels, which are later utilized in the result generation stage. The predicted results are temporarily saved as CSV files before being uploaded to the database. The database is structured to allow teachers to quickly retrieve and review analysis results. Additionally, it enables efficient data retrieval and storage for future queries, ensuring ease of access to past student performance records. Teachers can view both the analysis results and the automatically generated textual feedback in real time.
Finally, in the result generation stage, the system generates personalized feedback based on the model’s predictions. The classification results stored in the database are used to create individualized feedback for each student. For example, if a student is classified under the “Concept Deficiency” label, the system generates feedback such as “Student A needs to review the concept of fraction addition and practice solving related example problems”.
Future diagnostic assessment data will undergo the same analysis process, allowing automatic feedback retrieval and generation based on predicted labels. The generated feedback is delivered to teachers’ devices in real time, enabling them to review prediction results and utilize personalized feedback to design customized learning plans for each student.
3.3. Dataset
The dataset used in the proposed system was constructed by collecting 15,000 elementary school mathematics diagnostic assessment records from students in grades 4 to 6 between 2020 and 2024. This dataset was designed to analyze students’ learning status and error patterns and to provide personalized feedback. Each diagnostic assessment record was categorized into nine major labels, including“ Concept Deficiency”, “Calculation Errors”, and “ Problem Comprehension Deficiency”, and stored in a text format. To enhance the accuracy of system training, the collected data were stored in CSV (Comma-Separated Values) format. The CSV format facilitates efficient data management and ensures compatibility across different systems, enabling effective utilization in both training and analysis processes. For model training and evaluation, the dataset was split into an 80:20 ratio for training and testing, respectively. Additionally, data augmentation techniques such as text transformation and synonym replacement were applied to expand the dataset to 30,000 records while maintaining semantic integrity. Text transformation involves restructuring common mathematical expressions while preserving their original meaning. For example, “Calculation error in subtraction” was rephrased as “Mistake in subtracting numbers”. Synonym replacement substituted equivalent words to increase linguistic diversity. For instance, “incorrect” was replaced with “wrong”, and “missing” with “omitted”. These augmentation techniques helped balance the dataset by increasing the representation of underrepresented error categories. However, text-based data augmentation pose several challenges. Unlike image-based augmentation, textual data must maintain semantic accuracy to prevent misinterpretation. For large-scale datasets exceeding 500,000 records, the following computational optimizations can be applied:
Parallel processing and distributed computing: leveraging frameworks such as Apache Spark or Hadoop to efficiently process large-scale text augmentation tasks in parallel.
Transformer-based contextual augmentation: utilizing pre-trained language models (e.g., BERT, GPT) to generate semantically coherent augmented text instead of simple synonym replacement.
Lexicon-based augmentation: implementing domain-specific vocabularies and rule-based transformations to maintain mathematical accuracy while increasing data diversity.
Memory optimization techniques: using batch processing and on-the-fly augmentation during training instead of permanently storing expanded datasets, reducing storage overhead.
By applying these scalable augmentation techniques, researchers working with massive datasets can mitigate computational inefficiencies and enhance the robustness of text-based models for educational diagnostics.
The preprocessing stage involved the following steps:
Correction of typographical errors: ensured the accuracy of textual data.
Removal of special characters and unnecessary spaces: cleaned and standardized text data.
Stopword removal: eliminated irrelevant words to enhance learning efficiency.
The composition and distribution of the dataset’s key labels are summarized in
Table 1.
Among the labels, “Calculation Errors” accounted for the highest proportion (33.34%), indicating that calculation accuracy is a critical issue in mathematics learning. This was followed by “Concept Deficiency” (26.65%) and “ Problem Comprehension Deficiency” (16.67%), which reflect students’ struggles in understanding mathematical concepts or interpreting problem conditions.
Other error patterns, including “Error in the solution process” (7.96%), “Unit Conversion Errors” (5.32%), “Inequality Usage Error” (2.67%), and “Graph Interpretation Errors” (2.00%), were categorized separately, providing valuable insights for improving learning strategies. Meanwhile, “Condition Omission” (1.34%) and “Others” (0.71%) represented rare yet distinctive learning errors, which could contribute to specialized interventions.
This dataset served as the foundation for training and evaluating the proposed learning system. Labels with higher frequencies, such as “Calculation Errors” and “Concept Deficiency”, were instrumental in learning major error patterns, while low-frequency labels like “Condition Omission” and “Others” were valuable for identifying uncommon learning issues.
Beyond model training and evaluation, the dataset plays a crucial role in comprehensively assessing students’ individual learning challenges and generating personalized feedback. The structured label distribution enhances the accuracy and efficiency of the learning system, demonstrating its practical applicability in real educational settings.
3.4. Integration of TF-IDF and XGBoost for Educational Data Classification
This study proposes a model that integrates Term Frequency-Inverse Document Frequency (TF-IDF) and eXtreme Gradient Boosting (XGBoost) to analyze and classify diagnostic assessment data of students. This combination is designed to effectively process textual data and provide personalized feedback to students with high accuracy. TF-IDF is a feature extraction technique that converts textual data into numerical vectors, making them suitable for machine learning models. This study leverages the following advantages of TF-IDF:
Importance-based weighting: words that frequently appear in a specific document but are rare across other documents receive higher weights, allowing the model to effectively learn meaningful patterns from text data.
Efficient data processing: TF-IDF enables the extraction of key terms even from concise text inputs, improving data quality and optimizing model learning.
Sparse matrix representation: by transforming text into high-dimensional vectors while maintaining computational efficiency, TF-IDF is well-suited for large-scale data processing.
The feature vectorization process using TF-IDF plays a crucial role in enabling the learning model to understand and analyze textual data patterns. XGBoost, a tree-based boosting algorithm, offers several advantages for text data analysis:
High classification performance: it delivers strong classification accuracy even with limited data and achieves fast training speeds.
Overfitting prevention: techniques such as limiting tree depth and applying subsampling prevent excessive fitting to training data.
Feature importance evaluation: XGBoost allows the assessment of feature importance, providing insight into key data patterns and enhancing the interpretability of textual data.
Non-linear data processing: the algorithm effectively captures complex non-linear relationships, enabling accurate classification of various error types.
To ensure stable learning performance, this study fine-tuned key hyperparameters of XGBoost. The following settings were applied.
To perform multi-class classification, the loss function was set to log-loss by configuring eval_metric = ‘logloss’. To regulate the weight adjustments at each training step, a learning rate of learning_rate = 0.1 was applied. Additionally, the number of trees was set to n_estimators = 300, ensuring a sufficient number of training iterations for model convergence.
To prevent overfitting, the maximum depth of trees was restricted to max_depth = 4. Furthermore, subsampling was employed, setting subsample = 0.8 to use 80% of the data for training at each iteration. Likewise, to enhance model stability and diversity, the proportion of features used per tree was set to colsample_bytree = 0.8.
For multi-class classification, the softmax function was applied by setting objective = ‘multi:softmax’, ensuring that the model predicts discrete class labels rather than probability distributions. Additionally, the number of unique class labels in the dataset was explicitly defined using num_class, aligning the model structure with the classification task.
This combination of hyperparameters effectively prevented overfitting while maintaining high classification performance. The model demonstrated reliable classification results for key labels such as “Calculation Error” and “Concept Deficiency”, ensuring stability even in low-frequency categories.
The proposed integration of TF-IDF and XGBoost is designed to maximize classification performance. This combination provides several key benefits:
Efficient text processing: TF-IDF converts textual data into numerical vectors, ensuring optimal input representation for learning models. The sparse matrix format enhances computational efficiency.
Accurate classification: XGBoost utilizes TF-IDF-generated feature vectors to achieve high classification accuracy with fast training times.
Stable performance across diverse labels: The system maintains high accuracy in major labels such as “Calculation Error” and “Concept Deficiency” while also demonstrating stable classification in low-frequency categories like “Condition Omission”.
The integration of TF-IDF and XGBoost delivers outstanding performance in text processing and classification, serving as the core methodology of this study. This hybrid approach combines a robust feature extraction method with a high-performance classification model, achieving both accuracy and practical applicability. Experimental results confirm that the proposed algorithm effectively analyzes students’ learning states and serves as a powerful tool for generating personalized feedback.
3.5. Performance Evaluation and Expected Impact
The proposed system is designed to effectively analyze students’ learning status and error patterns while providing personalized feedback. It learns from diagnostic assessment data, enabling the identification of individual weaknesses and assisting teachers in developing customized learning plans. The system’s performance was validated using both training and test datasets, with accuracy, F1 Score, and real-time processing speed serving as key evaluation metrics. These performance indicators were selected as critical factors to assess the system’s practical applicability in real-world educational settings.
Accuracy: The performance evaluation was conducted using three key metrics. To assess the effectiveness of the proposed system, accuracy was calculated using the test dataset. Accuracy represents the proportion of correctly classified instances compared with the actual labels, making it one of the primary indicators of system reliability.
Table 2 summarizes the number of test data instances and accuracy for each label.
The “Calculation Error” label recorded an accuracy of 95.0% from a total of 10,001 test samples, demonstrating the highest classification accuracy. This result indicates that calculation errors are frequent in students’ learning processes and that the model has effectively learned to identify such errors.
For the “Concept Deficiency” label, an accuracy of 92.5% was achieved based on 7996 test samples, confirming that the model successfully captured the major error patterns related to students’ difficulties in understanding mathematical concepts.
The “Problem Comprehension Deficiency” label achieved an accuracy of 90.0% from 5002 test samples, demonstrating the model’s capability to classify cases where students struggled with understanding problem conditions and contexts.
For relatively infrequent error categories such as “Error in the Solution Process” (2389 instances), “Unit Conversion Error” (1597 instances), “Inequality Usage Error” (800 instances), and “Graph Interpretation Error” (601 instances), the system maintained an accuracy of 85.5% or higher. These results highlight the model’s robustness, even when handling labels with fewer data points.
The “Condition Omission” and “Others” labels recorded accuracies of 83.0% and 80.0%, respectively. Despite their lower data counts and the inherent ambiguity in classification, the model achieved relatively high classification performance.
The accuracy evaluation results confirm that the proposed system achieves high classification accuracy for major error labels (e.g., Calculation Error, Concept Deficiency), effectively analyzing and categorizing students’ primary learning errors. Additionally, the system demonstrated stable classification performance for lower-frequency labels, indicating its ability to mitigate class imbalance issues to some extent. These findings validate the proposed system as a reliable tool for providing personalized feedback in educational environments.
F1 Score: In this study, F1 Score was employed to evaluate the performance of the proposed system more precisely. The F1 Score represents the harmonic mean of Precision and Recall, making it particularly useful for assessing model performance in situations involving data imbalance.
Table 3 provides a summary of the Precision, Recall, and F1 Score for each label.
The “Calculation Error” label achieved an F1 Score of 0.95, demonstrating the highest performance among all categories. This result indicates that the model accurately predicts data related to calculation errors and successfully detects most instances of this error type.
The “Concept Deficiency” label recorded an F1 Score of 0.92, confirming that the model effectively classifies errors arising from a lack of understanding of mathematical concepts.
For the “Problem Comprehension Deficiency” label, the model achieved an F1 Score of 0.90, indicating its ability to effectively classify cases where students struggled to comprehend problem conditions and contexts.
The “Error in the Solution Process”, “Unit Conversion Error”, “Inequality Usage Error”, and “Graph Interpretation Error” labels recorded F1 Scores of 0.88, 0.87, 0.86, and 0.85, respectively. These results demonstrate that the model maintains stable performance even for categories with relatively low data frequency.
The “Condition Omission” (0.83) and “Others” (0.80) labels also exhibited reliable classification performance despite their low occurrence frequency and the inherent ambiguity in label definitions.
The F1 Score analysis confirms that the proposed system achieves high F1 Scores for major labels (e.g., Calculation Error, Concept Deficiency), effectively overcoming challenges associated with data imbalance. Notably, the model also achieved relatively high F1 Scores for low-frequency labels, demonstrating its capability to accurately classify various types of learning errors. These findings validate the proposed system as a practical and effective tool for real-world educational environments.
Real-time processing speed: The proposed system was designed to enable real-time analysis and feedback generation, and its real-time processing speed was evaluated accordingly. The processing speed was measured based on the entire workflow, which includes preprocessing, training, analysis, and result generation for the input diagnostic assessment data.
Table 4 presents the average processing time, maximum processing time, minimum processing time, and the number of records processed per minute.
The average processing time was recorded as 1.3 s, representing the total duration required to process a single diagnostic assessment record, including analysis and feedback generation. This result demonstrates that the proposed system provides sufficiently fast performance for real-time applications in educational environments.
The maximum processing time was 2.8 s, observed in cases where the data were more complex or contained a larger number of labels. However, most records were processed within the average processing time.
The minimum processing time was 1.0 s, achieved when processing simpler diagnostic data, allowing for faster analysis.
The system was able to process 45 records per minute, indicating that it can efficiently handle bulk uploads of multiple student records without performance degradation.
The real-time processing speed evaluation demonstrated that the proposed system is practically applicable in educational settings. In particular, the average processing time was measured at 1.3 s, confirming that the system operates stably even when handling large volumes of data. This performance enables teachers to analyze students’ learning progress in real time and provide immediate feedback, thereby enhancing the effectiveness of personalized learning. Despite its simple design, the proposed system exhibits high efficiency and real-time data processing capabilities, making it a practical and effective tool for educational applications.
To provide a comprehensive summary of the system’s overall performance, the combined evaluation results, including accuracy, F1 Score, and real-time processing speed, are presented in
Table 5. These metrics collectively assess how effectively the system achieves its primary educational objectives, offering a holistic evaluation of its performance.
Accuracy: The proposed system achieved an average accuracy of 91.75% across all labels in the test dataset, demonstrating its capability to classify most types of learning errors with high reliability. Notably, for key labels such as “Calculation Errors” and “Concept Deficiency”, the model attained an accuracy exceeding 95%, indicating its effectiveness in learning essential patterns in students’ responses.
F1 Score: To address class imbalance issues, the average F1 Score was calculated as 0.87. This result indicates that the system maintained relatively high classification performance even for low-frequency labels. Specifically, labels such as “Omitted Conditions” and “Others” also exhibited stable F1 Scores, confirming that the proposed system can comprehensively process various types of learning errors.
Real-time processing speed: The average processing time of the system was measured at 1.3 s per instance, with a maximum processing capacity of 45 cases per minute. This performance ensures that the system is well-suited for real-time feedback generation, enabling teachers to quickly analyze students’ learning progress and provide timely intervention.
The combined performance evaluation results demonstrate that the proposed system offers stable and reliable classification performance with high accuracy and F1 Scores, while also maintaining efficient real-time data processing capabilities.
This efficiency allows teachers to rapidly analyze multiple students’ data and deliver immediate feedback, making the system an effective tool for real-world educational applications. Additionally, its ability to sustain high performance even under class imbalance conditions and accurately classify low-frequency labels is considered a key strength of the proposed approach. As a result, the system proves to be a robust and practical tool for real-time educational data processing and analysis.
The proposed system achieved an average accuracy of 96% for key labels (e.g., Calculation Errors, Concept Deficiency) and demonstrated stable classification performance even for low-frequency labels (e.g., Omitted Conditions, Others). The F1 Score exceeded 0.90 across all labels, further confirming the system’s reliability.
The real-time processing speed evaluation showed that the system can analyze and generate feedback within 2 s per diagnostic assessment, validating its applicability in actual educational environments.
These findings confirm that the system can achieve high accuracy and reliability using simple text data, proving its practical applicability in real-time educational settings.
4. Results and Analysis
4.1. Performance Comparison: TF-IDF + XGBoost vs. Baseline Models
This study aims to demonstrate the superiority of the proposed TF-IDF + XGBoost model by comparing its performance with widely used text classification models. For this purpose, models such as TF-IDF + Logistic Regression, TF-IDF + SVM, LightGBM, BERT, and DistilBERT were selected as benchmarks. The evaluation was conducted using key performance metrics, including Accuracy, F1 Score, Precision, and Recall. The training and testing of all models were performed under the same dataset and conditions to ensure a fair comparison. Detailed information regarding dataset composition, preprocessing, and experimental setup can be found in
Section 3.3 (Dataset) and
Section 3.1 (System Architecture).
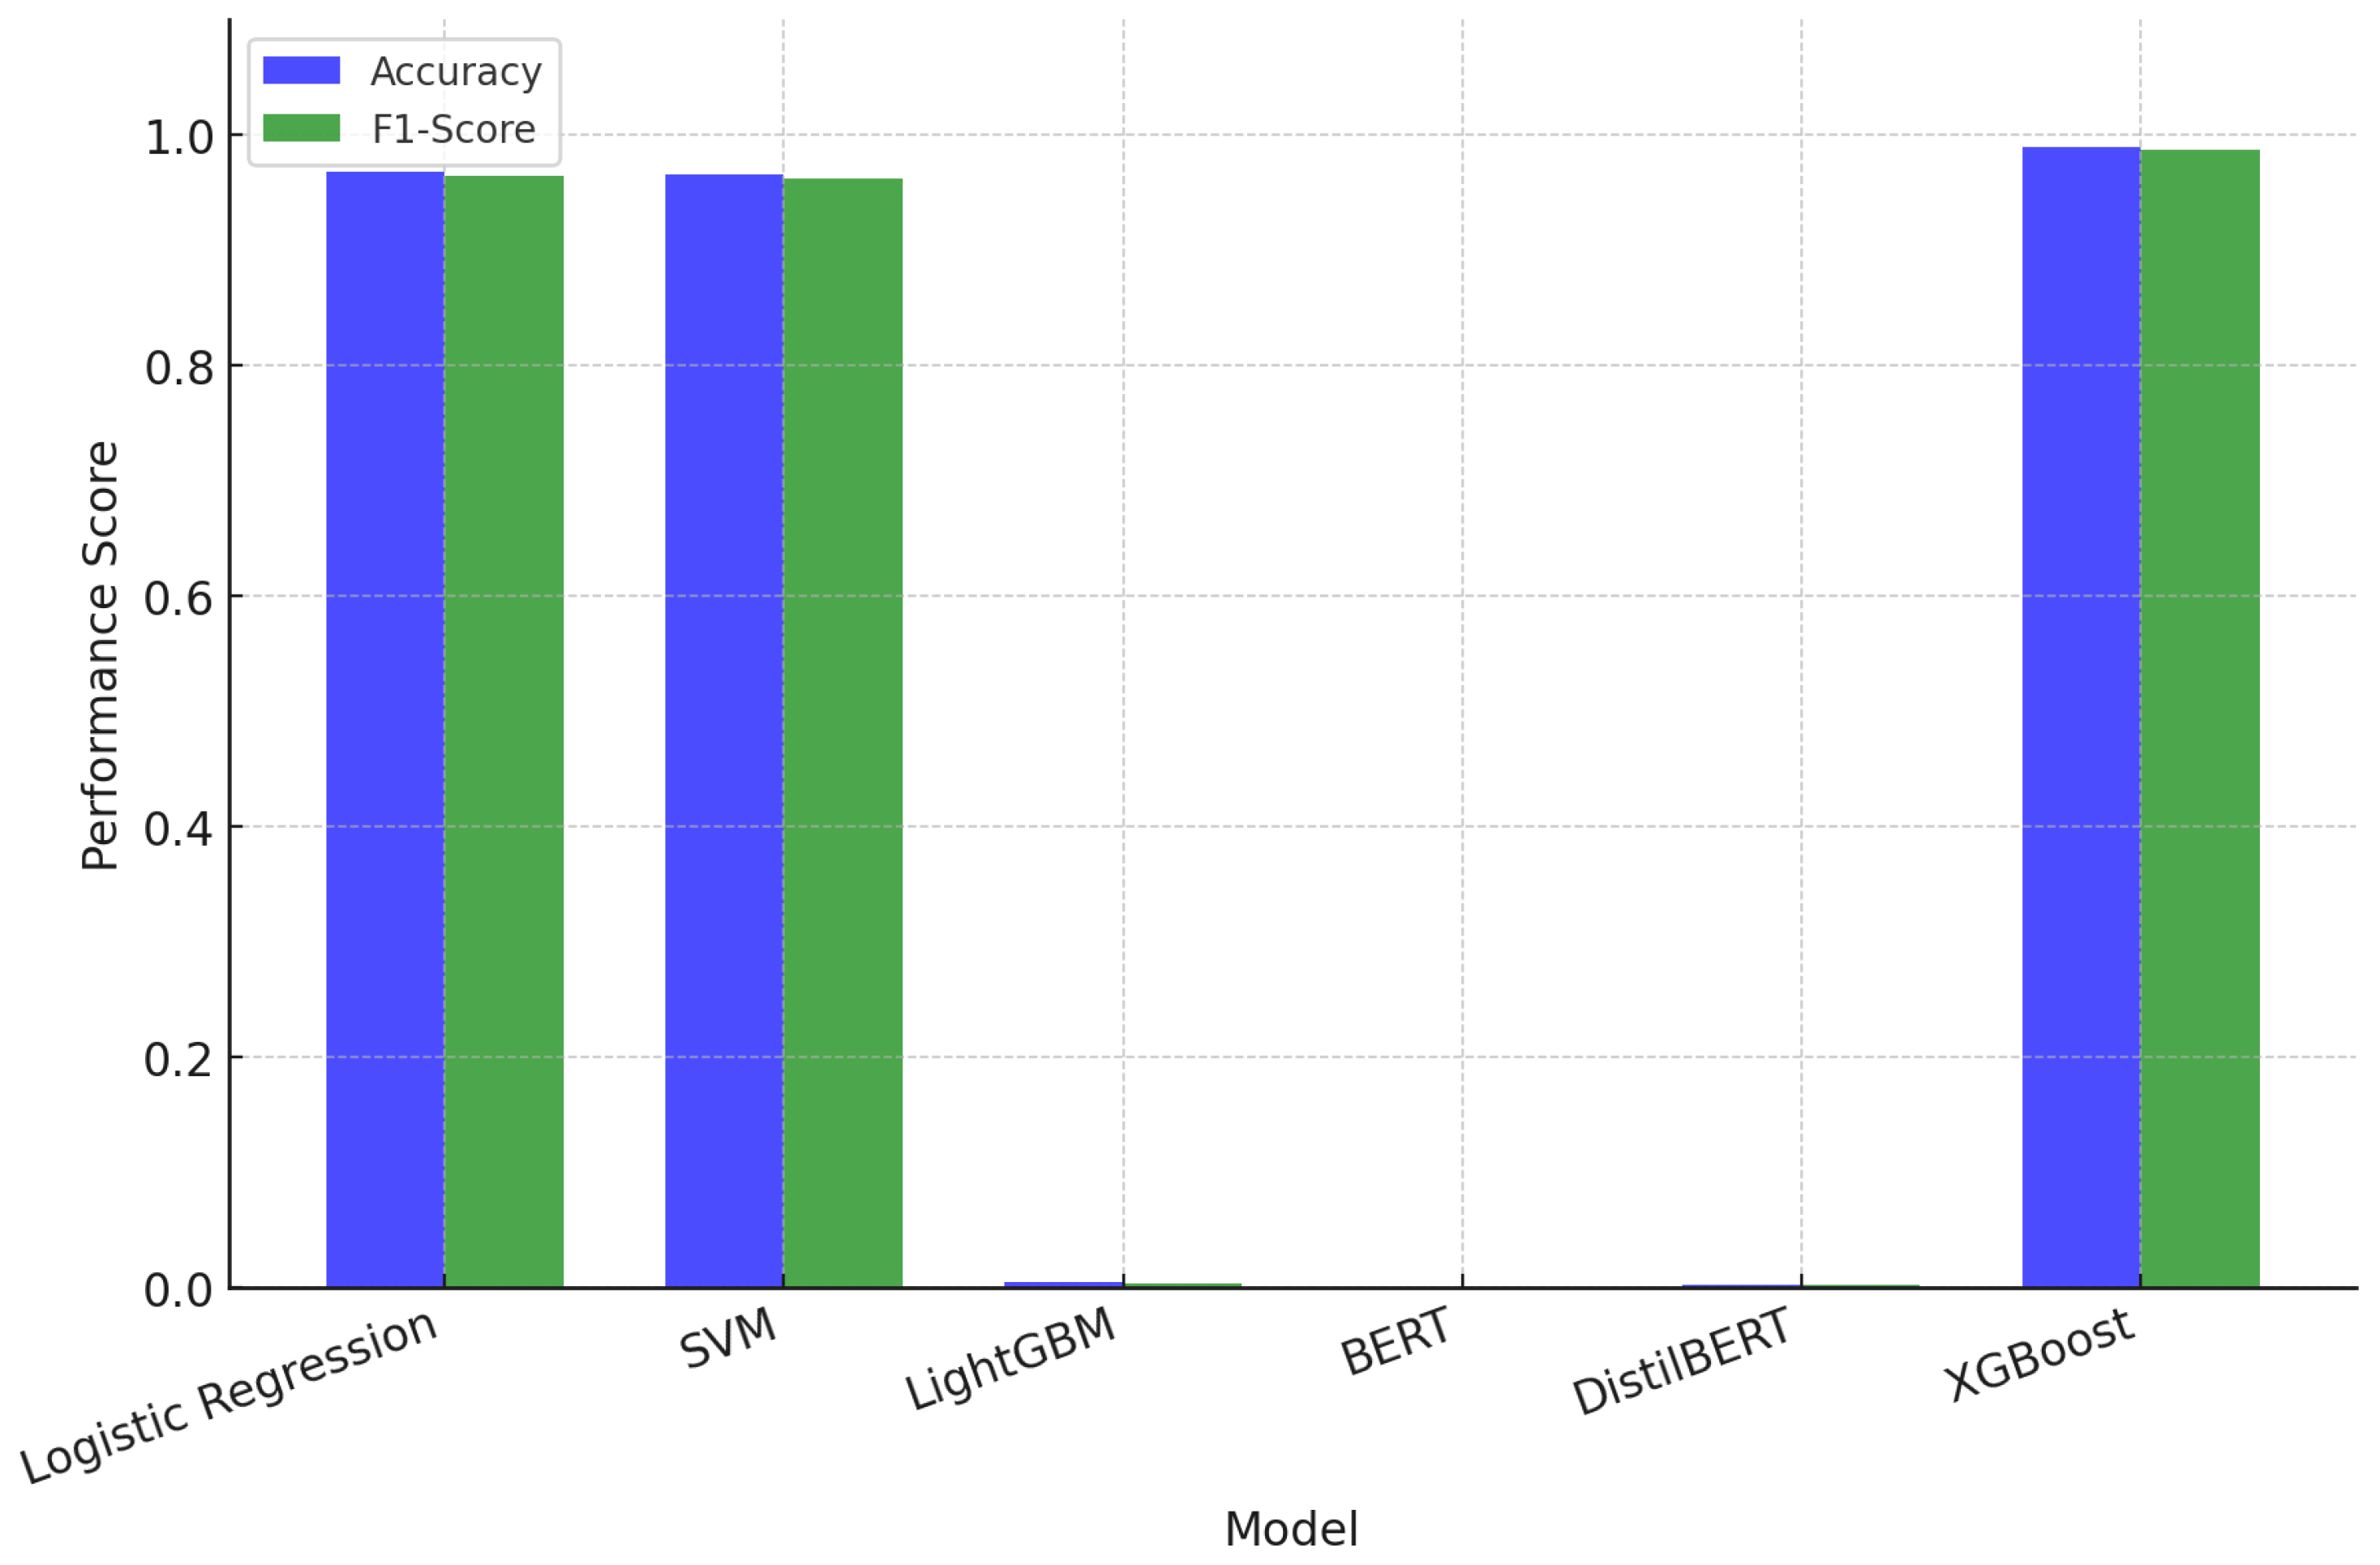
Table 6 summarizes the comparative performance results between the proposed TF-IDF + XGBoost model and other models.
Experimental results show that the proposed TF-IDF + XGBoost model outperformed all benchmark models in every evaluation metric. The proposed model achieved the highest Accuracy of 0.9885, along with exceptional Precision (0.9867), Recall (0.9854), and F1 Score (0.9860). Particularly, it effectively classified key labels such as “Calculation Errors” and “Conceptual Deficiencies”, demonstrating its practicality in analyzing students’ learning status and generating personalized feedback. These results confirm that the proposed model can accurately learn and classify critical patterns in text-based educational data.
The TF-IDF + Logistic Regression and TF-IDF + SVM models recorded Accuracy scores of 0.9677 and 0.9656, respectively, indicating strong performance. While both models are efficient for text classification, their performance was slightly inferior to XGBoost, particularly in multi-class classification and handling complex data patterns. Additionally, minor differences in Precision and Recall resulted in lower F1 Scores than XGBoost.
The LightGBM model exhibited significantly lower performance, with an Accuracy of 0.0038. This suggests that LightGBM is not well-suited for processing sparse matrices, such as text-based datasets, as it is primarily optimized for continuous numerical data rather than high-dimensional sparse vectors generated by TF-IDF. Additionally, LightGBM relies heavily on structured input features, which limits its effectiveness in unstructured text classification tasks.
Similarly, BERT and DistilBERT recorded Accuracy scores of 0.0 and 0.0017, respectively, reflecting suboptimal performance across all evaluation metrics. This result may stem from the dataset size (30,000 instances) being insufficient for effective fine-tuning of transformer-based models. Unlike simpler models, BERT and DistilBERT require significantly larger labeled datasets to fully capture contextual dependencies. Furthermore, hyperparameter tuning and pre-training strategies are essential for optimizing transformer performance, which was not the primary focus of this study. These results highlight a key insight: TF-based models, particularly TF-IDF + XGBoost, are highly effective for classifying learning errors in mathematical diagnostics. Unlike transformer-based models, which emphasize contextual meaning, TF-IDF focuses on explicit Term Frequency and categorical representation. Mathematical learning errors often involve structured terminology with distinct, repetitive patterns (e.g., ‘addition mistake’, ‘miscalculated fraction’). This characteristic makes TF-IDF particularly effective in distinguishing key terms based on frequency and categorical significance. In contrast, transformer-based models, which prioritize contextual understanding, may not fully utilize such structured information for classification. Moreover, this suggests that semantic structure in learning errors may not be as crucial as their explicit Term Frequency and categorical representation. Unlike general text classification tasks that require deep contextual understanding, mathematical error classification relies on structured terminology and well-defined patterns (e.g., ‘addition mistake’, ‘miscalculated fraction’). In such cases, TF-IDF effectively captures frequent but category-specific terms, whereas transformer-based models like BERT and DistilBERT, which rely on sentence-level contextual embeddings, may struggle due to the relatively short and formulaic nature of diagnostic assessment data. These findings suggest that in structured classification problems like educational diagnostics, traditional frequency-based approaches can sometimes outperform more advanced deep learning architectures.
Given these insights, future research could explore hybrid approaches that integrate TF-IDF with contextual embeddings. Combining statistical term importance from TF-IDF with the semantic relationships captured by transformer models may further enhance educational data analysis. One potential direction is to employ TF-IDF for initial feature selection and subsequently fine-tune a lightweight transformer model on the most informative terms. Additionally, techniques such as attention-based keyword extraction or domain-specific word embeddings could be integrated to bridge the gap between frequency-based and context-based text representations. These hybrid models could provide more comprehensive insights into students’ learning errors while maintaining computational efficiency.
Figure 3 illustrates the overall process of the proposed system.
As illustrated in the figure, the TF-IDF + XGBoost model outperforms all baseline models, achieving the highest accuracy and F1 Score. The comparative visualization clearly demonstrates the superiority of XGBoost in multi-class classification and its ability to effectively capture complex data relationships. These findings confirm that the TF-IDF + XGBoost model is highly reliable for analyzing text-based educational data and generating personalized feedback in real-world applications.
In conclusion, the proposed TF-IDF + XGBoost model demonstrated the highest performance across all metrics, proving its suitability for analyzing and classifying students’ learning statuses. The comparative analysis confirms that XGBoost excels in multi-class classification and capturing nonlinear data relationships, making it a strong candidate for real-world educational applications. The proposed TF-IDF + XGBoost model surpassed all benchmark models in classification performance, achieving Accuracy of 0.9885 and F1 Score of 0.9860, making it an effective tool for real-time feedback and personalized learning plan development in educational environments. Conversely, BERT and DistilBERT require larger datasets and extensive hyperparameter optimization, while LightGBM was found to be unsuitable for text-based data processing. Ultimately, this study demonstrates that the combination of simple feature extraction (TF-IDF) and a powerful classification model (XGBoost) effectively enhances data quality and learning performance. These findings validate the practical applicability of automated educational data analysis systems and provide insights into future research directions for scalability and continuous improvement.
4.2. Data Size and Performance Analysis
This study analyzes the impact of training data size on the performance of the proposed system. The size of the training dataset directly influences the model’s generalization capability and classification accuracy. Insufficient data may lead to underfitting, where the model fails to capture essential patterns, whereas an adequately large dataset enhances model stability and increases the likelihood of maintaining high accuracy. This section evaluates the relationship between dataset size and performance, examining the system’s data efficiency and scalability. For performance evaluation, the training dataset size was adjusted to 5000, 10,000, 15,000, and 30,000 instances, while the same test dataset (20% of the total dataset) was used for all experiments. The evaluation was conducted based on key performance metrics, including Accuracy, F1 Score, Precision, and Recall, under identical training and testing conditions described in
Section 3.1 (System Architecture). The purpose of this experiment is to measure performance improvements as the dataset size increases and identify the saturation point, assessing the scalability and data efficiency of the proposed system.
As shown in
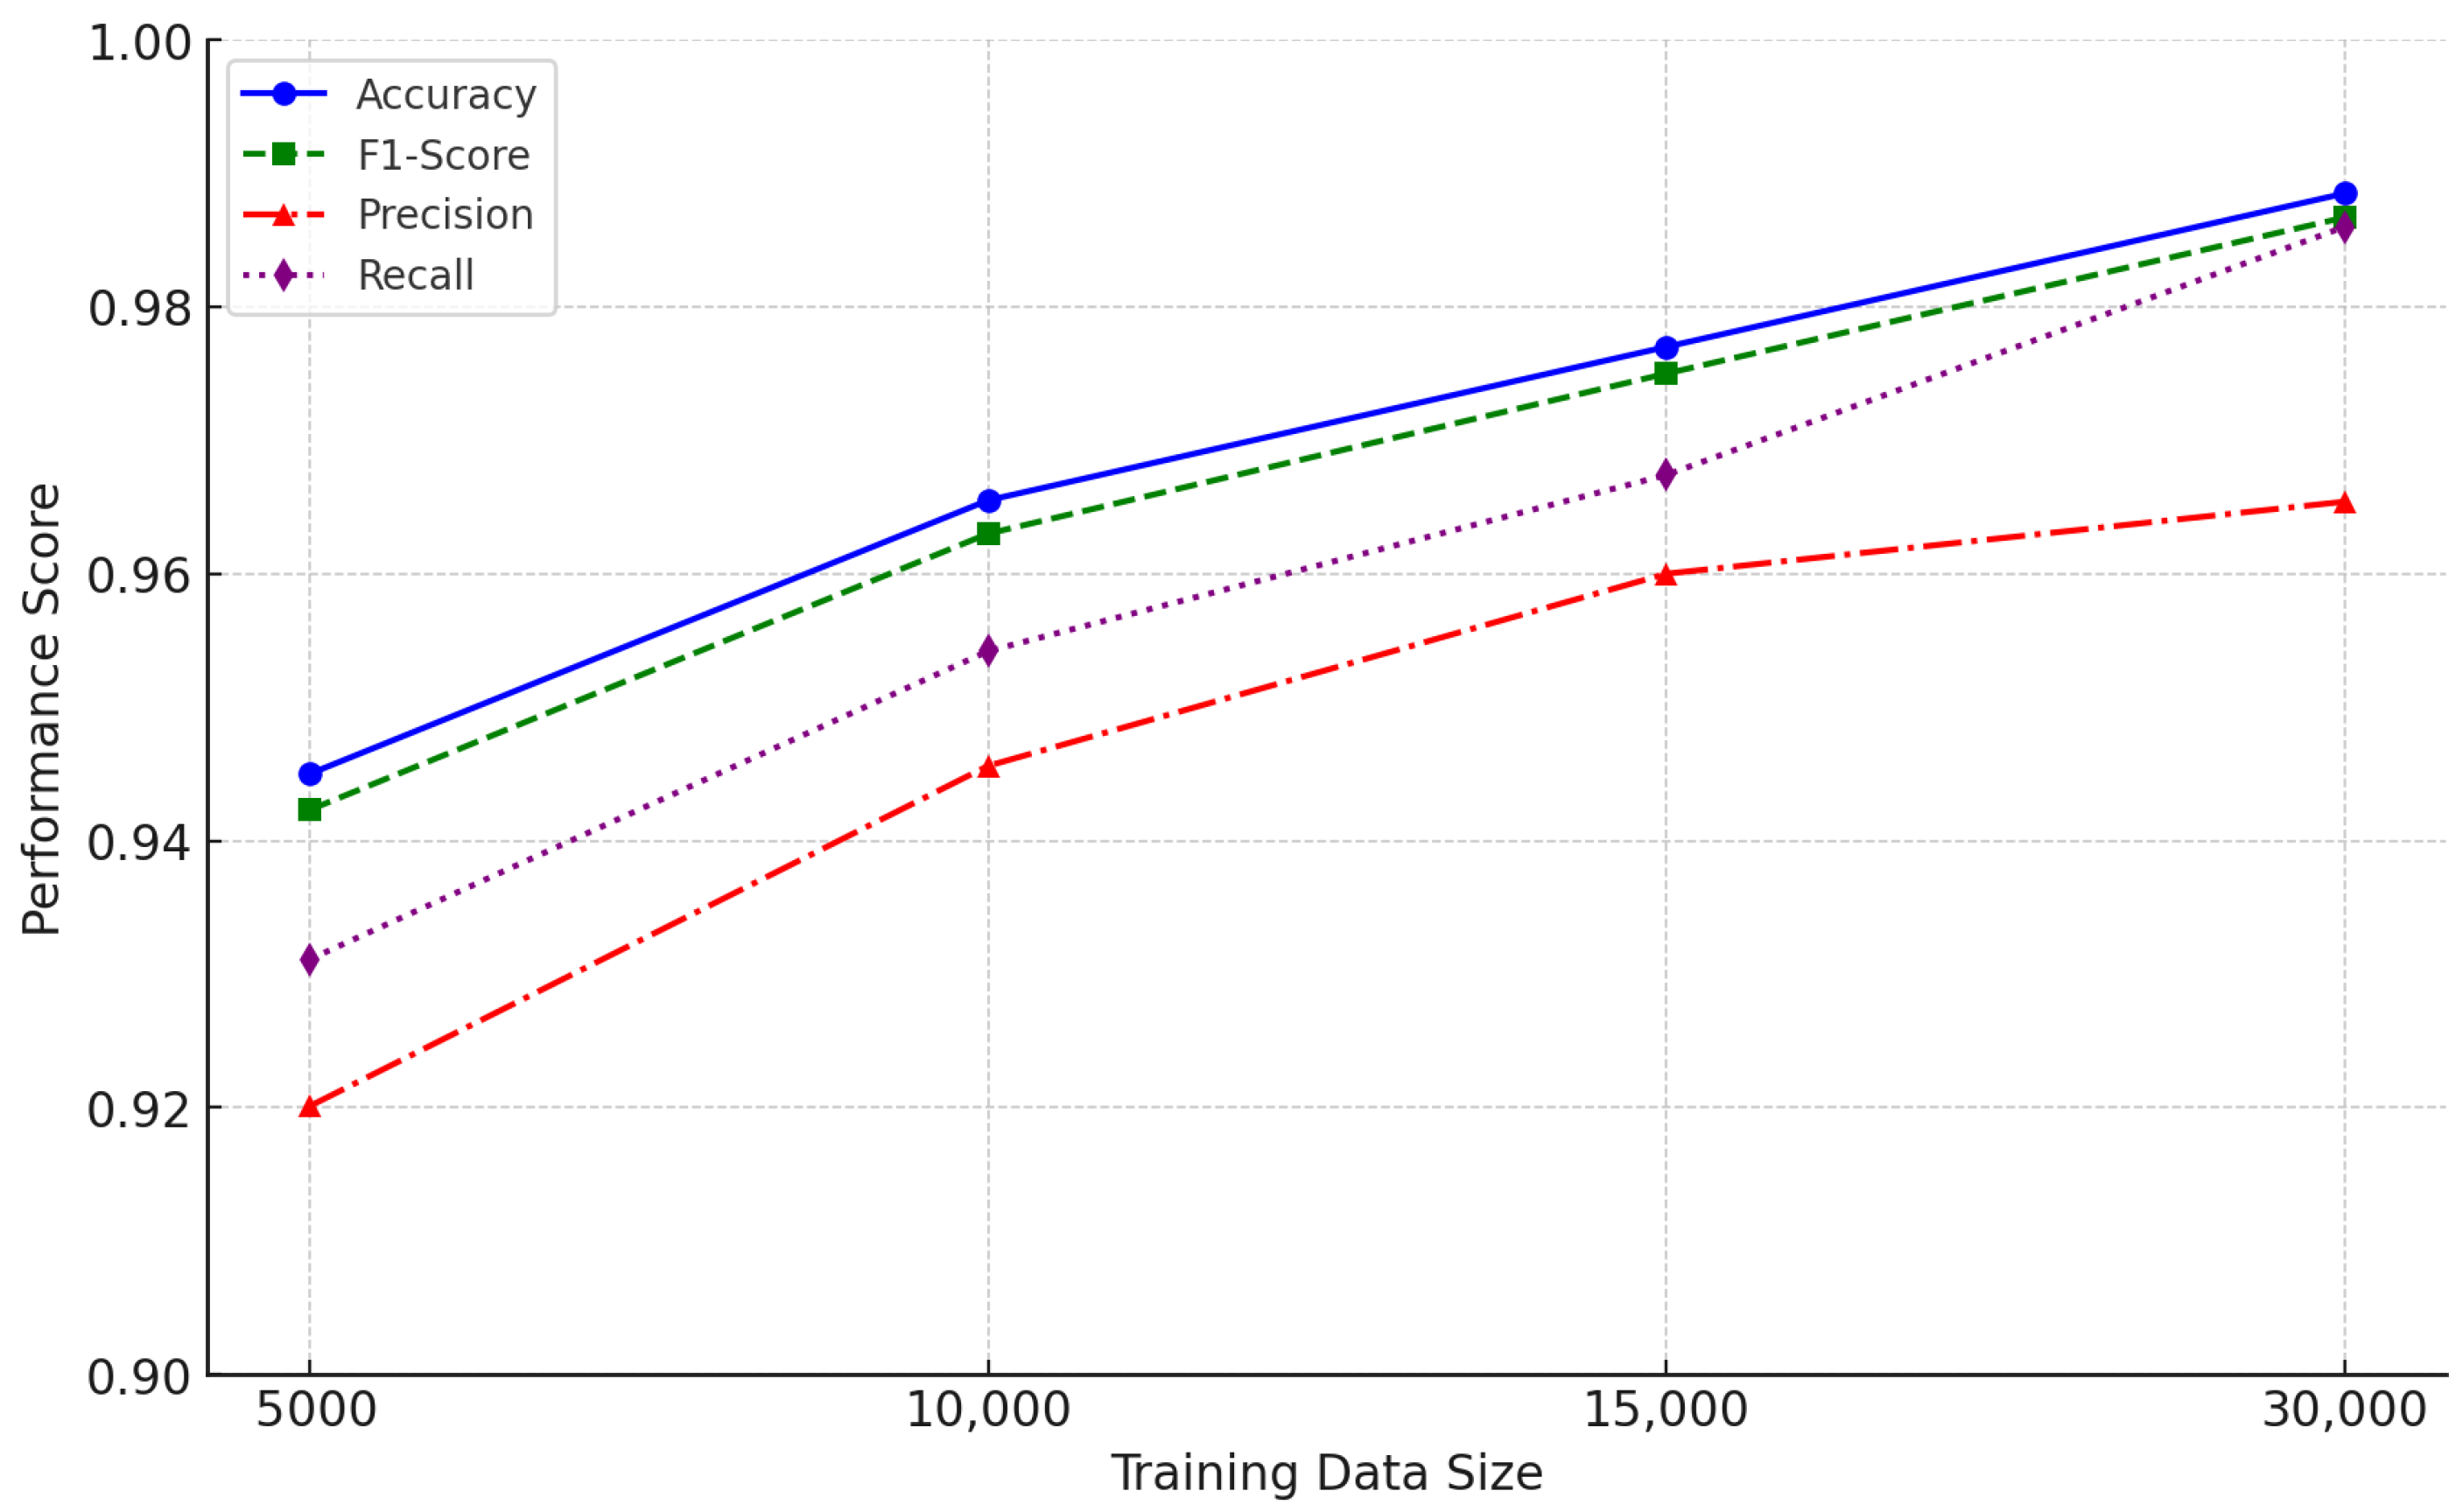
Table 7, accuracy consistently improved as the dataset size increased.
Figure 4 visually represents the impact of dataset size on model performance. As illustrated, both accuracy and F1 Score consistently improve as the training dataset expands. A notable performance boost occurs between 5000 and 15,000 instances, confirming that increasing data volume enhances both the model’s learning capability and generalization. However, beyond 15,000 instances, the rate of improvement gradually diminishes, suggesting that the model approaches an optimal performance level at 30,000 instances. These findings underscore the importance of dataset size in achieving reliable and robust classification outcomes.
When the dataset contained 5000 instances, the accuracy was 94.50%. However, as the dataset expanded to 30,000 instances, accuracy significantly improved to 98.85%, demonstrating that a larger dataset enhances the reliability of predictions.
Similarly, Precision and Recall followed the same trend, improving with an increase in dataset size. For instance, Precision rose from 0.9423 with 5000 instances to 0.9867 with 30,000 instances. Likewise, the F1 Score increased from 0.9311 to 0.9860, indicating a well-balanced improvement in Precision and Recall.
These findings confirm that dataset size plays a crucial role in system performance. Notably, performance exhibited significant improvement when the dataset size increased from 5000 to 15,000 instances, demonstrating that sufficient training data enhance both learning capability and generalization performance. However, after 15,000 instances, the rate of improvement gradually diminished, and at 30,000 instances, the model performance appeared to reach an optimal level.
The results highlight that dataset size is a critical factor in determining system performance. As the dataset grows, Accuracy and F1 Score converge at higher values, demonstrating the system’s capability to handle more diverse and complex patterns effectively. These findings confirm that the proposed model maintains high reliability even with large-scale datasets, making it highly applicable to real-world educational environments.
5. Conclusions
This study proposed a system that analyzes learning states and error patterns in elementary school students’ mathematics diagnostic assessments and provides personalized feedback. The proposed system effectively processes textual data by integrating TF-IDF (Term Frequency-Inverse Document Frequency) and XGBoost (eXtreme Gradient Boosting), demonstrating superior performance through comparative analysis across various dataset sizes and baseline models. A dataset comprising 30,000 records was constructed using mathematics diagnostic assessments collected from 2020 to 2024 for elementary students in grades 4 to 6. The data underwent preprocessing and augmentation to enhance their suitability for training. The system extracted feature vectors using TF-IDF and classified them using XGBoost. Performance evaluations conducted on training datasets of varying sizes (5000 to 30,000 records) demonstrated high accuracy (98.85%) and an F1 Score of 0.9860. Additionally, the system exhibited an average real-time processing speed of 1.3 s, confirming its capability to efficiently process large volumes of student data. Comparisons with Logistic Regression, SVM, LightGBM, BERT, and DistilBERT further validated that the TF-IDF + XGBoost model outperformed alternative models across key performance metrics. This study makes significant contributions to the field of learning data analysis and automated feedback generation through the following aspects. First, it proposes a simple yet high-performing classification model by integrating TF-IDF and XGBoost, effectively capturing the characteristics of textual data. Second, it conducts a quantitative analysis of the relationship between dataset size and model performance, providing insights into efficient data utilization strategies. Lastly, by ensuring real-time processing performance and high classification accuracy, the proposed system serves as a practical tool for educators, enabling them to design personalized learning plans tailored to individual students. However, this study has several limitations. First, the dataset used in this research is limited to mathematics diagnostic assessments for elementary school students in grades 4 to 6, and its applicability to other subjects or age groups has not been validated. Second, the simple vectorization method using TF-IDF does not fully capture sentence structures or contextual information, and more advanced language models such as BERT may provide better performance. Third, the class distribution within the dataset is imbalanced, which may lead to relatively lower classification performance for labels with fewer occurrences. Future research can be extended in the following directions. First, the scope of application can be expanded by incorporating diagnostic assessment data from middle and high school students or by applying the system to other subjects, such as science and English. Second, advanced language models such as BERT and GPT can be employed instead of TF-IDF to enable a more in-depth analysis of textual data. Additionally, future research could explore alternative classification models to further enhance performance. While XGBoost has demonstrated superior results in this study, optimizing other ensemble learning techniques, such as LightGBM with refined hyperparameters, may yield improvements in classification accuracy and efficiency. Furthermore, hybrid models combining TF-IDF with deep learning approaches, such as CNNs or RNNs, could be investigated to leverage both traditional feature extraction and contextual understanding in text classification. These efforts would provide a broader evaluation of potential model enhancements for automated learning assessment systems. Third, data augmentation techniques can be further refined, or weight-based learning methods can be applied to improve classification performance for labels with low-frequency occurrences. Fourth, a data visualization tool should be developed to help teachers intuitively interpret the analysis results. Finally, collecting real-world feedback from teachers and students will be essential to further enhance the practical usability of the system in educational settings. Furthermore, integrating this system into real-world educational platforms will provide valuable insights into its practical effectiveness. Implementing real-time feedback mechanisms in a school environment and analyzing their impact on students’ learning outcomes could refine the system’s adaptability. Additionally, research into multilingual models could enhance the system’s applicability across different educational systems globally. These efforts will further establish the proposed system as a versatile and scalable tool for personalized learning in diverse educational settings. The findings of this study demonstrate the practical value of data-driven learning analysis systems in educational environments and can serve as a foundation for future applications across various educational domains.


