Article

Deep Learning-Driven Molecular Generation and Electrochemical Property Prediction for Optimal Electrolyte Additive Design

by
Dongryun Yoon
,
Jaekyu Lee
and
Sangyub Lee
*
Energy IT Convergence Research Center, Korea Electronics Technology Institute, #25, Saenariro, Bundang-gu, Seongnam-si 13509, Gyeonggi-do, Republic of Korea
*
Author to whom correspondence should be addressed.
These authors contributed equally to this work.
Appl. Sci. 2025, 15(7), 3640; https://doi.org/10.3390/app15073640
Submission received: 24 February 2025 / Revised: 14 March 2025 / Accepted: 19 March 2025 / Published: 26 March 2025
(This article belongs to the Section Computing and Artificial Intelligence)

Abstract

:
Recently, generative models have rapidly advanced and are being applied to various domains beyond vision and large language models (LLMs). In the field of chemistry and molecular generation, deep learning-based models are increasingly utilized to reduce experimental exploration and research costs. In this study, we conducted research on Variational Autoencoder-based molecular generation and property prediction to screen for optimal molecules in the design of electrolyte additives for lithium-ion batteries. Using a dataset composed of promising electrolyte additive candidate molecules, we generated new molecules and predicted HOMO and LUMO values, which are key factors in electrolyte additive design. For approximately 1000 newly generated electrolyte additive candidate molecules, we performed DFT calculations to obtain HOMO and LUMO values and calculated the mean absolute error (MAE) between the predicted values from the trained model and the DFT-calculated values. As a result, the model demonstrated exceptionally low errors of approximately 0.04996 eV (HOMO) and 0.06895 eV (LUMO), respectively. This means that battery experts can receive recommendations for new molecules, refer to their predicted HOMO and LUMO values, and select potential electrolyte additives for further validation through experiments. By replacing the traditional electrolyte additive development process with deep learning models, this method has the potential to significantly reduce the overall development time and improve efficiency.

1. Introduction

In recent years, advanced deep learning techniques, such as generative models and graph neural networks, have significantly advanced research in various fields, including material discovery for semiconductors, biomedical compounds, and lithium-ion batteries [1,2,3,4,5,6]. Especially, graph neural network (GNN) models are well suited for representing molecules with the same structural form, as they utilize a graph-based input format, making them widely used for molecular property prediction [7,8,9,10,11]. In addition to GNNs, generative models, such as Variational Autoencoders (VAEs), Transformers, and Diffusion models, have been actively explored for molecular design and material discovery [12,13,14,15,16,17,18,19,20,21]. These models enable the generation of novel molecular structures while preserving crucial chemical properties, allowing for an efficient and systematic approach to discovering new materials. VAEs are widely used to capture the latent space representations of molecular structures, facilitating the interpolation and generation of chemically valid compounds [22,23,24,25,26,27,28]. Transformer-based models, which were originally developed for natural language processing tasks, have been successfully adapted to handle sequence-based molecular representations such as SMILES, enabling effective molecular generation [29,30,31,32,33,34]. By leveraging these generative models, researchers have significantly advanced the discovery of novel molecules in various fields, including drug development, organic electronics, and battery materials.
Recent studies have demonstrated the effectiveness of deep learning in diverse optimization problems, including biomechanics-based gait rehabilitation, reaction–diffusion modeling for micro-disk biosensors, and nonlinear autoregressive neural networks for predicting chemical absorption properties. Inspired by these advancements, our study applies deep generative models and molecular property prediction techniques to optimize electrolyte additive design for lithium-ion batteries. Battery research and development have also explored the application of machine learning and deep learning models [35,36]. This trend has led to substantial reductions in both the time and cost associated with battery materials discovery. However, previous studies have been limited to predicting battery properties, such as State of Charge (SoC) and battery cycle life, using classical machine learning algorithms or merely proposing new insights [37,38,39,40,41,42,43]. Although large-scale projects such as the Battery 2030+ project are conducting research over a mid-to-long-term period to advance secondary battery technology, their primary focus remains on broader advancements in materials and manufacturing rather than on the targeted development of electrolyte additives [44,45,46]. In contrast, this study focuses on the molecular-level design of electrolyte additives specifically for lithium-ion batteries, aiming to accelerate the development process.
The electrolyte solution in lithium-ion batteries is typically composed of organic solvents, lithium salts, and carefully selected electrolyte additives, which together determine the overall electrochemical characteristics of the battery system. Electrolyte additives, although present in small quantities, play a vital role in stabilizing the electrochemical environment and optimizing battery efficiency [47,48]. Specifically, electrolyte additives facilitate lithium-ion transport, expand the operational temperature range, improve electrolyte stability, and promote the formation of a solid electrolyte interphase (SEI) layer during the initial charge–discharge cycle. Among the various functions of electrolyte additives, this study focuses on their role in decomposing prior to the organic solvents during the initial charge of the battery, forming a SEI layer on the electrode surface to provide protection. The SEI layer is critical for preventing unwanted side reactions between the electrolyte and electrode, thereby ensuring long-term battery stability and performance [49,50]. However, the formation mechanism of the SEI layer remains unclear, and consequently, reverse engineering based on its principles is still considered an unattainable goal [51,52,53]. Therefore, before attempting to understand and reverse engineer the complex SEI layer, we aimed to generate novel candidate single molecules based on the HOMO (the highest occupied molecular orbital) and LUMO (lowest unoccupied molecular orbital) characteristics, which are referenced in the design of new electrolyte additives. In the current electrolyte additive development process, new molecules are proposed, synthesized, and tested based on previously used electrolyte additives, relying on the expertise and experience of skilled professionals. Since the synthesis of actual molecules and cell fabrication experiments require significant time and cost, this study aims to establish a virtual screening stage before the synthesis process by utilizing a Variational Autoencoder (VAE) model and molecular property predictive models. We utilized the Natural Product Variational Autoencoder (NPVAE) model, which employs a previously proposed VAE-based model to generate complex natural products while simultaneously predicting their Natural Product Score (NP score) characteristics [54].
We fine-tuned NPVAE using a dataset tailored to our objective of electrolyte additive development. This electrolyte additive dataset includes various molecules actually used in lithium-ion battery electrolytes and their associated information, such as 3D structural data, SMILES, molecular weight, energy values, and HOMO (highest occupied molecular orbital)/LUMO (lowest unoccupied molecular orbital) values. The details of the dataset are described in Section 2.1. To evaluate whether the trained model accurately predicts the HOMO and LUMO values of newly generated molecules, we performed Density Functional Theory (DFT) calculations and compared the results with the model’s predictions. Through this process, we confirmed that the trained model not only accurately predicts the HOMO and LUMO values of the molecules in the training dataset but also demonstrates strong predictive performance for the HOMO and LUMO values of newly generated molecules. This approach enables the construction of a virtual screening pre-process using deep learning models within the traditional electrolyte additive design workflow.

2. Materials and Methods

2.1. Electrolyte Additives Dataset

To achieve our goal of constructing a dataset for electrolyte additive design, we combined the Materials Project and Electrolyte Genome datasets from the Joint Center for Energy Storage Research (JCESR, Lemont, IL, USA) with our private dataset [55,56]. The JCESR dataset is constructed by extracting molecules with key electrolyte properties from the Materials Project dataset from the Lawrence Berkeley National Laboratory (Berkeley, CA, USA). From this dataset, we selected molecules with a neutral charge and 32 or fewer atoms to ensure compatibility for Density Functional Theory (DFT) calculations. After filtering out molecules that could not be processed through DFT calculations, we curated approximately 17,000 organic molecules along with their electrochemical properties and energy values. All DFT calculations were carried out using Q-Chem 5.4 (Q-Chem Inc., Pleasanton, CA, USA), employing the B3LYP functional with the 6-31++G(d,p) basis set. Figure 1 presents example samples from the constructed electrolyte additive dataset. Electrolyte additive molecules often contain functional groups that interact with electrodes. Given the importance of these functional groups, we determined that employing the NPVAE model, which is designed to handle tree-structured data, is an appropriate approach for this task.

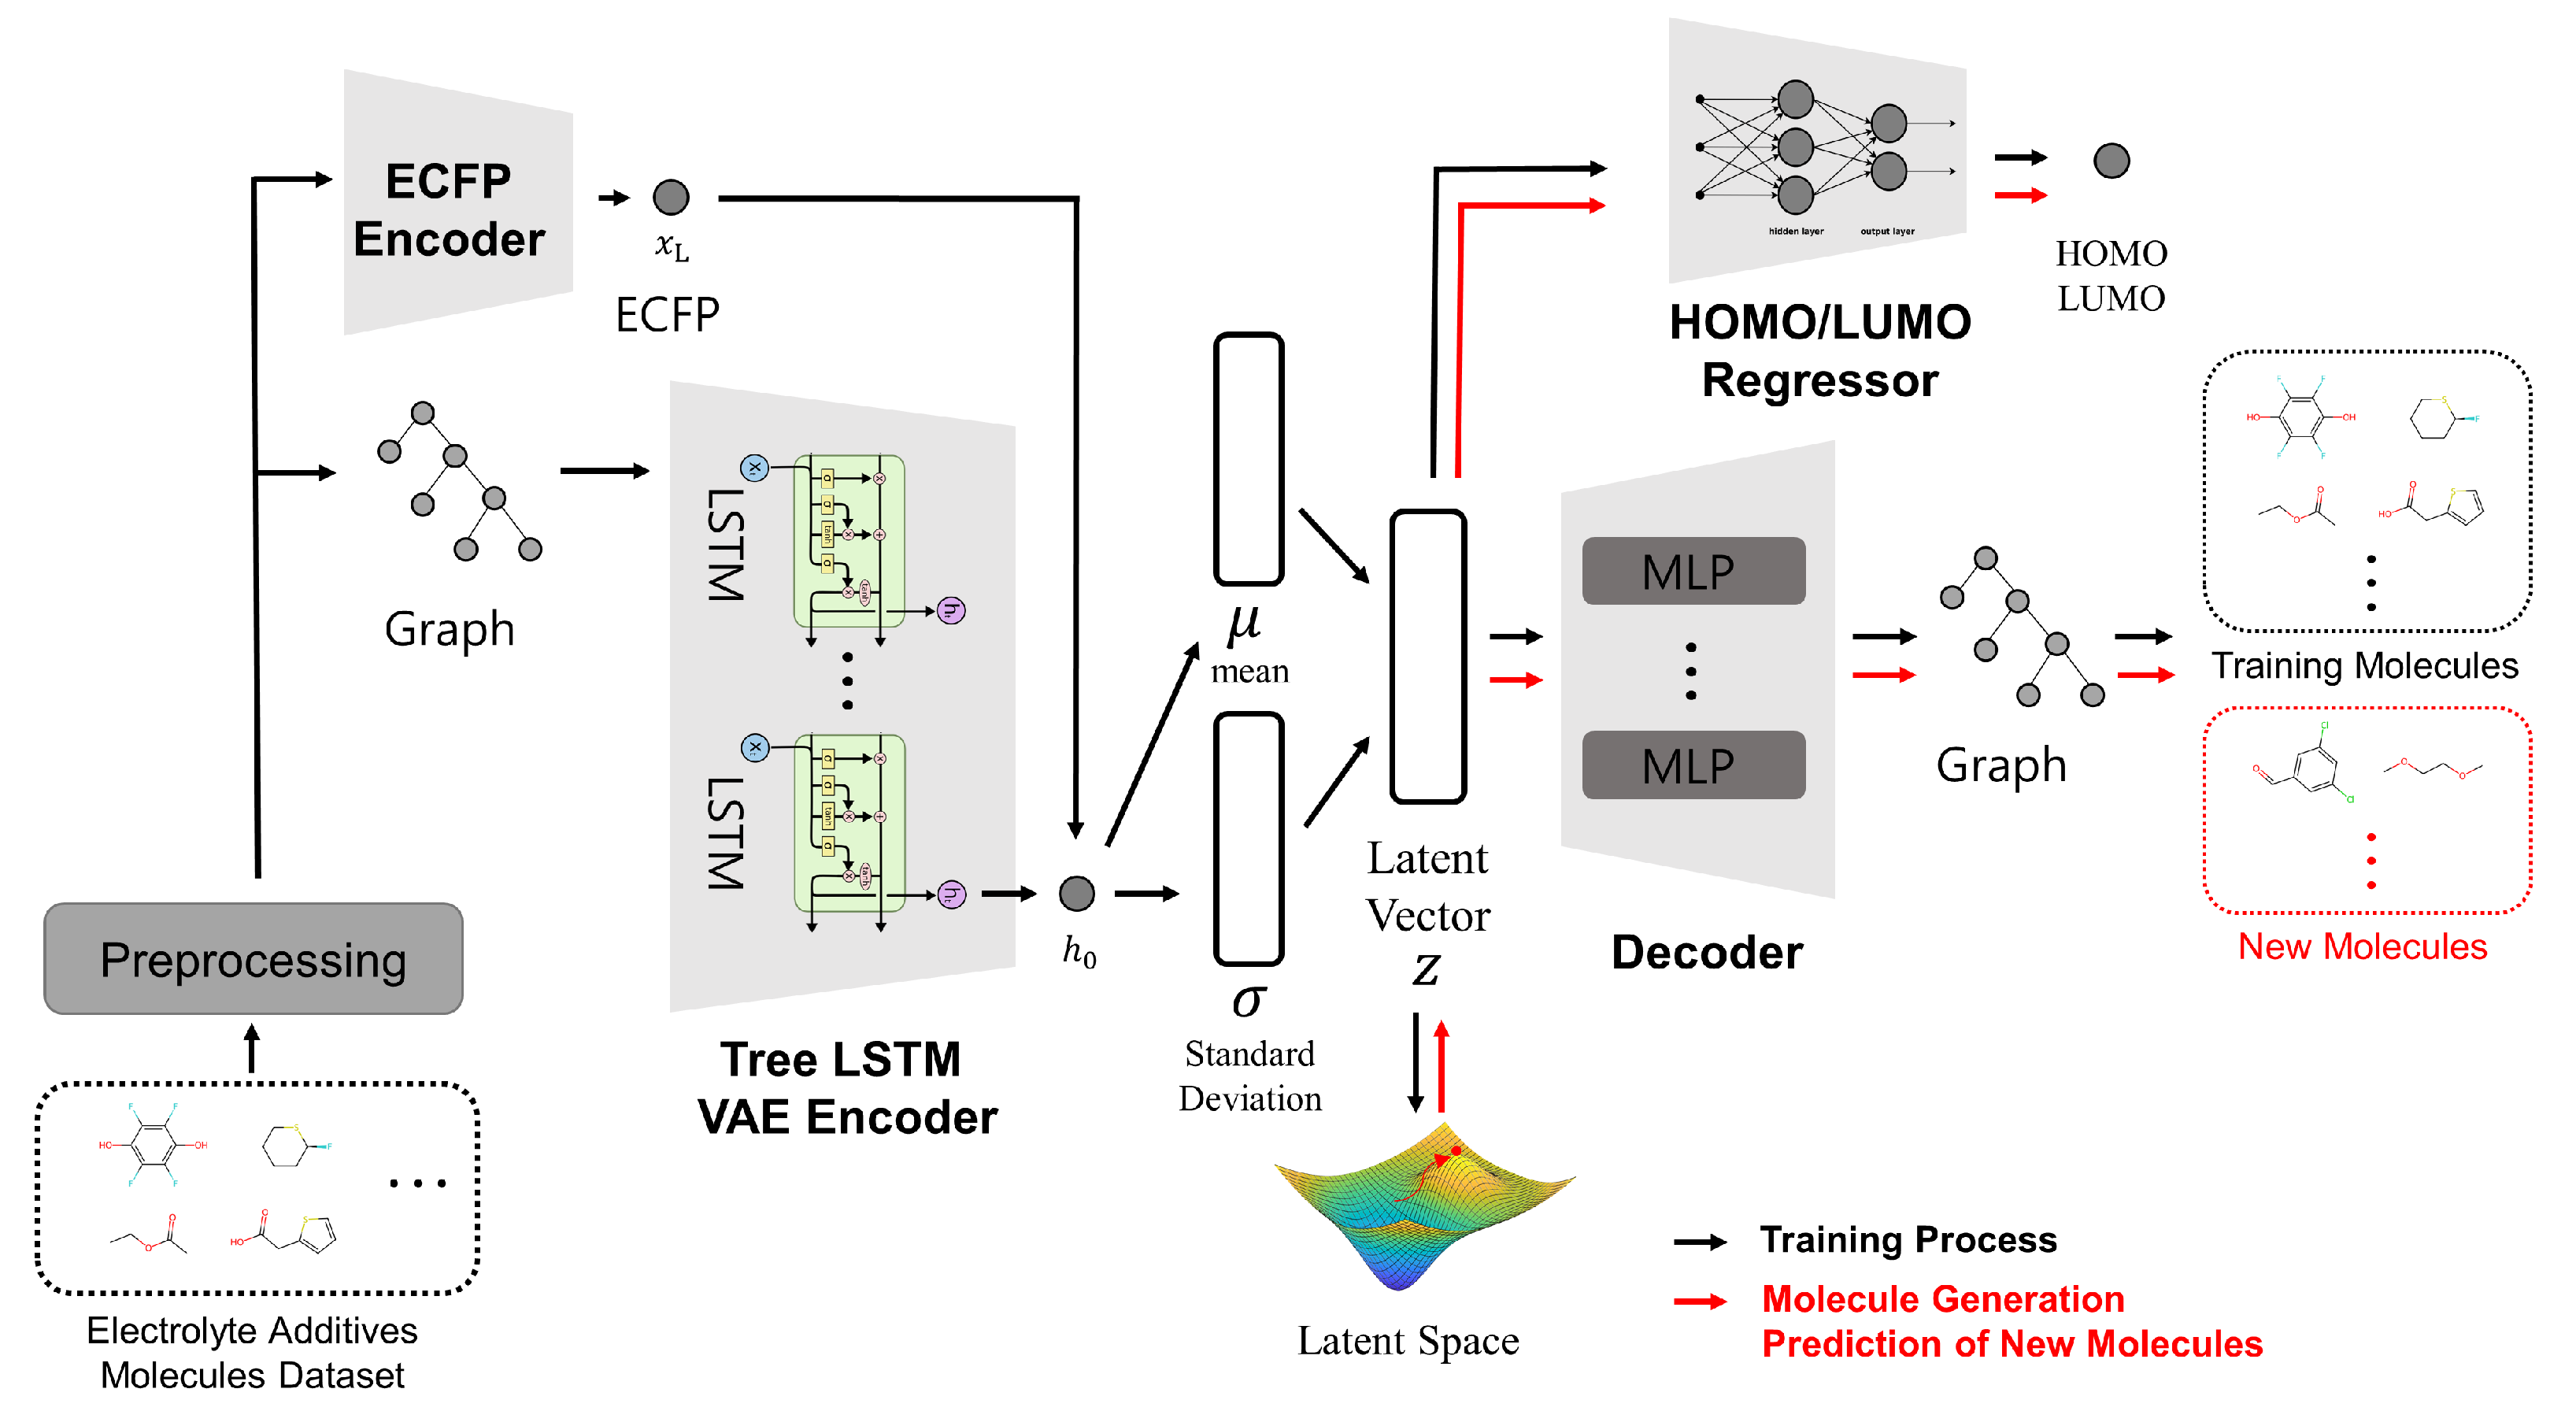
2.2. Model’s Architecture

In the field of 3D molecule generation, numerous architectures have been employed to generate new molecules. Among these, the NPVAE model was selected to generate optimal electrolyte additive molecules for lithium-ion batteries and predict their electrochemical properties for the following four reasons [54]:
  • Architecture aligned with our requirements and objectives. The dataset described in the following Section 2.1 includes significant candidate molecules used in lithium-ion battery electrolytes. We aim to extract meaningful and valuable information from this high-quality dataset to explore new molecules that could serve as potential electrolyte additives. Additionally, we require accurate predictions of electrochemical parameters such as HOMO/LUMO, which are critical for electrolyte additives. If new materials can be discovered and their HOMO/LUMO values predicted without direct experimentation, lithium-ion battery researchers would be able to anticipate experimental results quickly and efficiently. The VAE-based model with its continuous latent space representation fits these requirements and objectives, enabling us to explore the desired chemical space effectively.
  • Performance. Among the VAE-based 3D molecule generation models NPVAE demonstrates the best performance outperforming models such as ChemicalVAE, CG-VAE, JT-VAE, and HierVAE, with a 2D reconstruction accuracy of 0.813 [22,26,27,28]. Based on experimental results from the literature NPVAE was deemed the most suitable model for achieving our performance goals.
  • Utilization of structural information. Deep learning models that handle large sets of molecules typically employ various molecular representation methods. While SMILES is a simple and widely used format, it has limitations in capturing full structural information [29]. The NPVAE model overcomes this by converting SMILES inputs into graph-based representations, incorporating structural information through the use of a Tree-LSTM model.
  • Chirality handling. Chirality refers to the geometric property of a molecule where its mirror image cannot be superimposed on the original structure, which is crucial in many chemical applications including pharmaceuticals. The NPVAE model by utilizing 3D molecular structures can effectively incorporate chirality enabling more accurate modeling of stereochemical properties. In NPVAE, the model determines whether a molecule is chiral or not by incorporating chirality information from its ECFP.
The architecture of NPVAE comprises a Tree-LSTM-based encoder, an MLP-based decoder, and an additional MLP designed for molecular property prediction [57]. It is a graph-based VAE that integrates fragment-based decomposition, tree-structured representations, and a Tree-LSTM to effectively capture the structural information of compounds, showcasing strong performance in molecular design tasks. We trained the NPVAE model using the electrolyte additive dataset from Section 2.1, based on the HOMO and LUMO properties of each molecule. Figure 2 illustrates the flowchart representing the model’s training process and generation process.
During the training process, the model followed the black arrows, reconstructing the input molecules while simultaneously predicting their HOMO and LUMO properties. After training, during the generation process, the model followed the red arrows, exploring the latent space to obtain the latent vector z. Using the decoder and regressor, newly sampled molecules and their predicted property values were generated. The detailed preprocessing, encoding, and decoding processes can be found in Appendix A. By training the model to reconstruct the input data while simultaneously training a molecular property prediction model that takes the latent variable z as input, molecular properties are integrated into the latent space. This approach enables the latent space to jointly represent both structural and functional information of the molecules. In this study, the electrochemical properties HOMO and LUMO were utilized to enable each model to construct a latent space that represents these properties. The objective of this study is to generate new molecules with the desired HOMO and LUMO properties and to facilitate easy and accurate prediction of the HOMO and LUMO values for newly generated molecules. This summary outlines the purpose and functionality of each step, supporting the ability of NP-VAE to accurately reconstruct chemically valid and stereochemically consistent molecular structures.
The loss function is constructed as a weighted sum of individual components, following the approach used in previous studies. Each component includes the Cross-Entropy Loss ( C E ) of the decoder, the KL Loss ( D K L ) representing the difference between the Gaussian prior and the latent variable distribution, the Binary Cross-Entropy Loss ( B C E ) for three-dimensional structure prediction, and the Mean Squared Error ( M S E ) for molecular property prediction. Each of y r , y τ , y s , y b , y c , and y p represents the ground truth for Root Label prediction, Topological prediction, Label prediction, Bond prediction, ECFP prediction, and molecular property prediction (HOMO or LUMO), respectively. The loss function L is defined as follows:
L = α · C E ( y r , u L r ) + β · i C E ( y τ , i , u τ ) + γ · j C E ( y s , j , u L s ) + δ · j C E ( y b , j , u L b ) + ε · B C E ( y c , u L c ) + ϵ · M S E ( y p , u L p ) + ζ · D K L Q ( z | X ) P ( z )
C E ( y , y ^ ) = y log y ^
B C E ( y , y ^ ) = y log y ^ + ( 1 y ) log ( 1 y ^ )
M S E ( y , y ^ ) = ( y y ^ ) 2
D K L Q ( z | X ) P ( z ) = 1 2 d 1 + log σ d 2 μ d 2 σ d 2
where α , β , γ , δ , ε , ϵ , ζ are hyperparameters used to adjust the contribution of each term.

3. Results

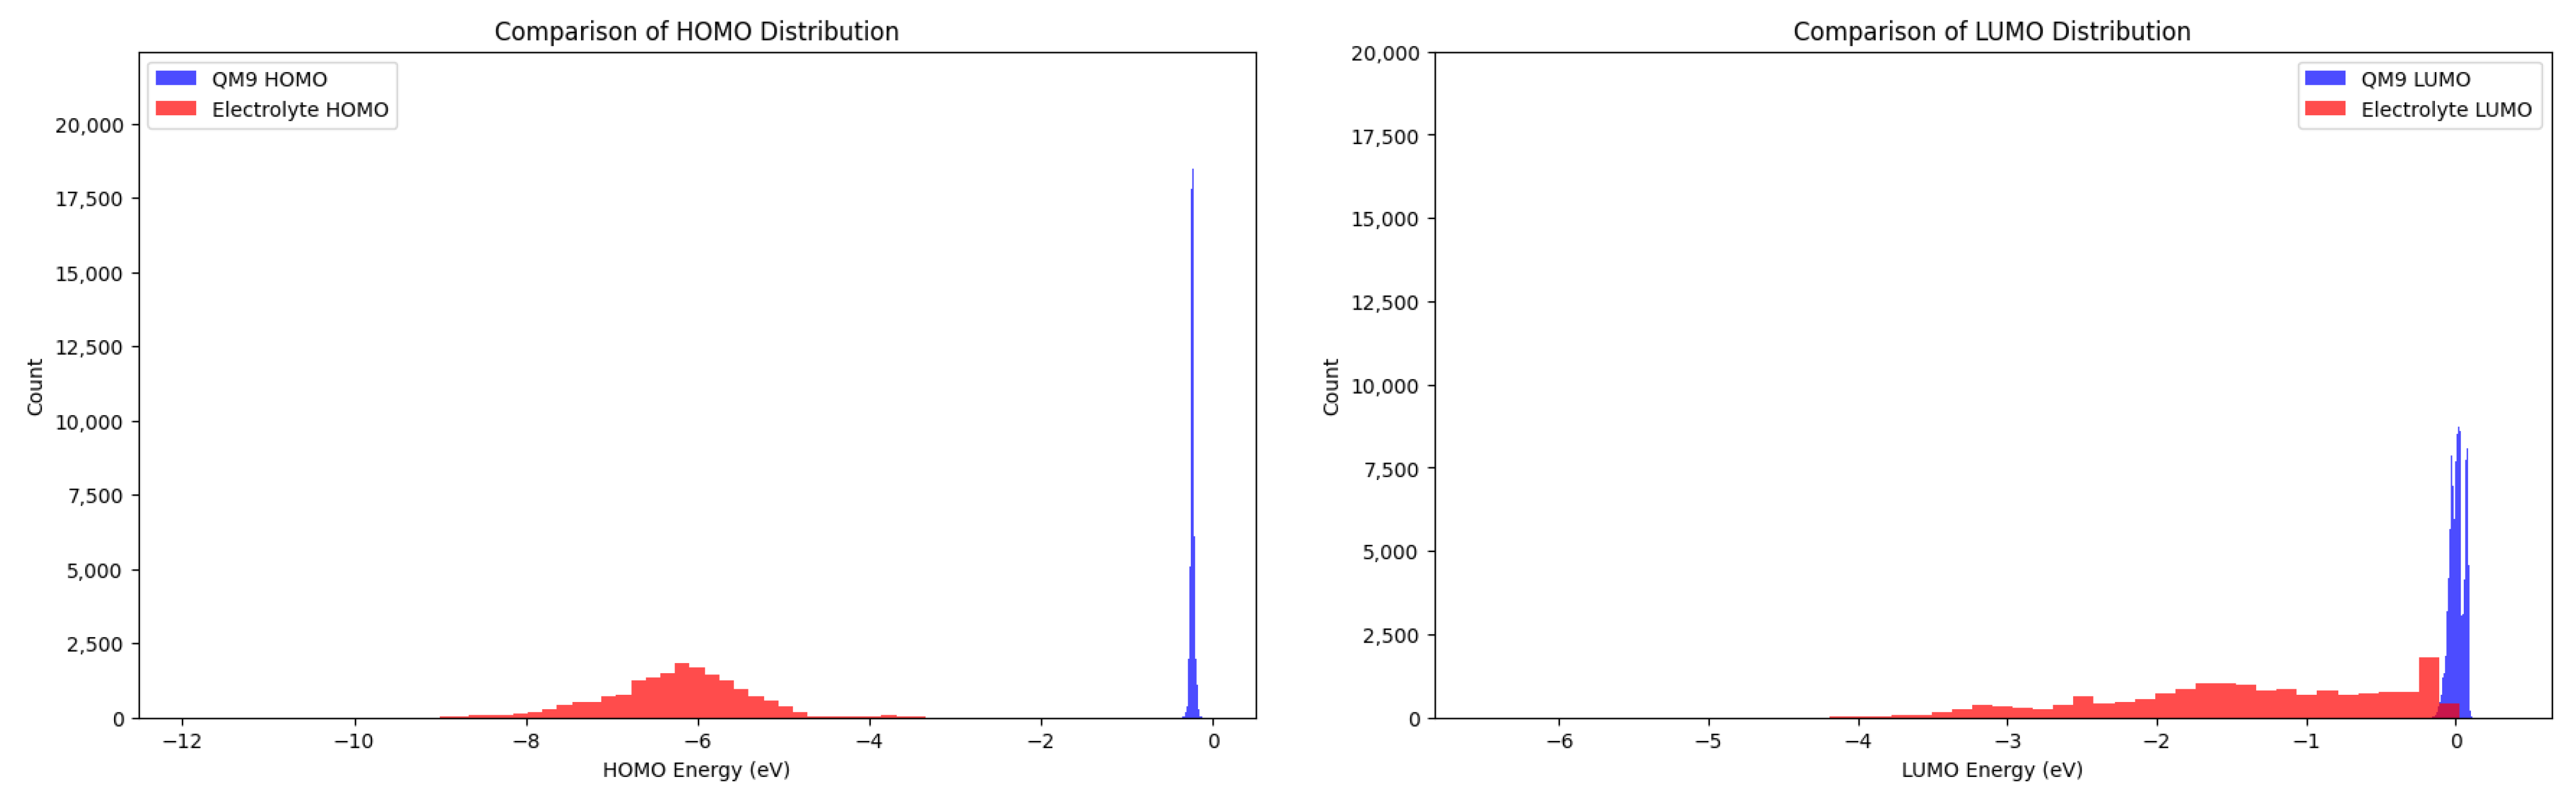
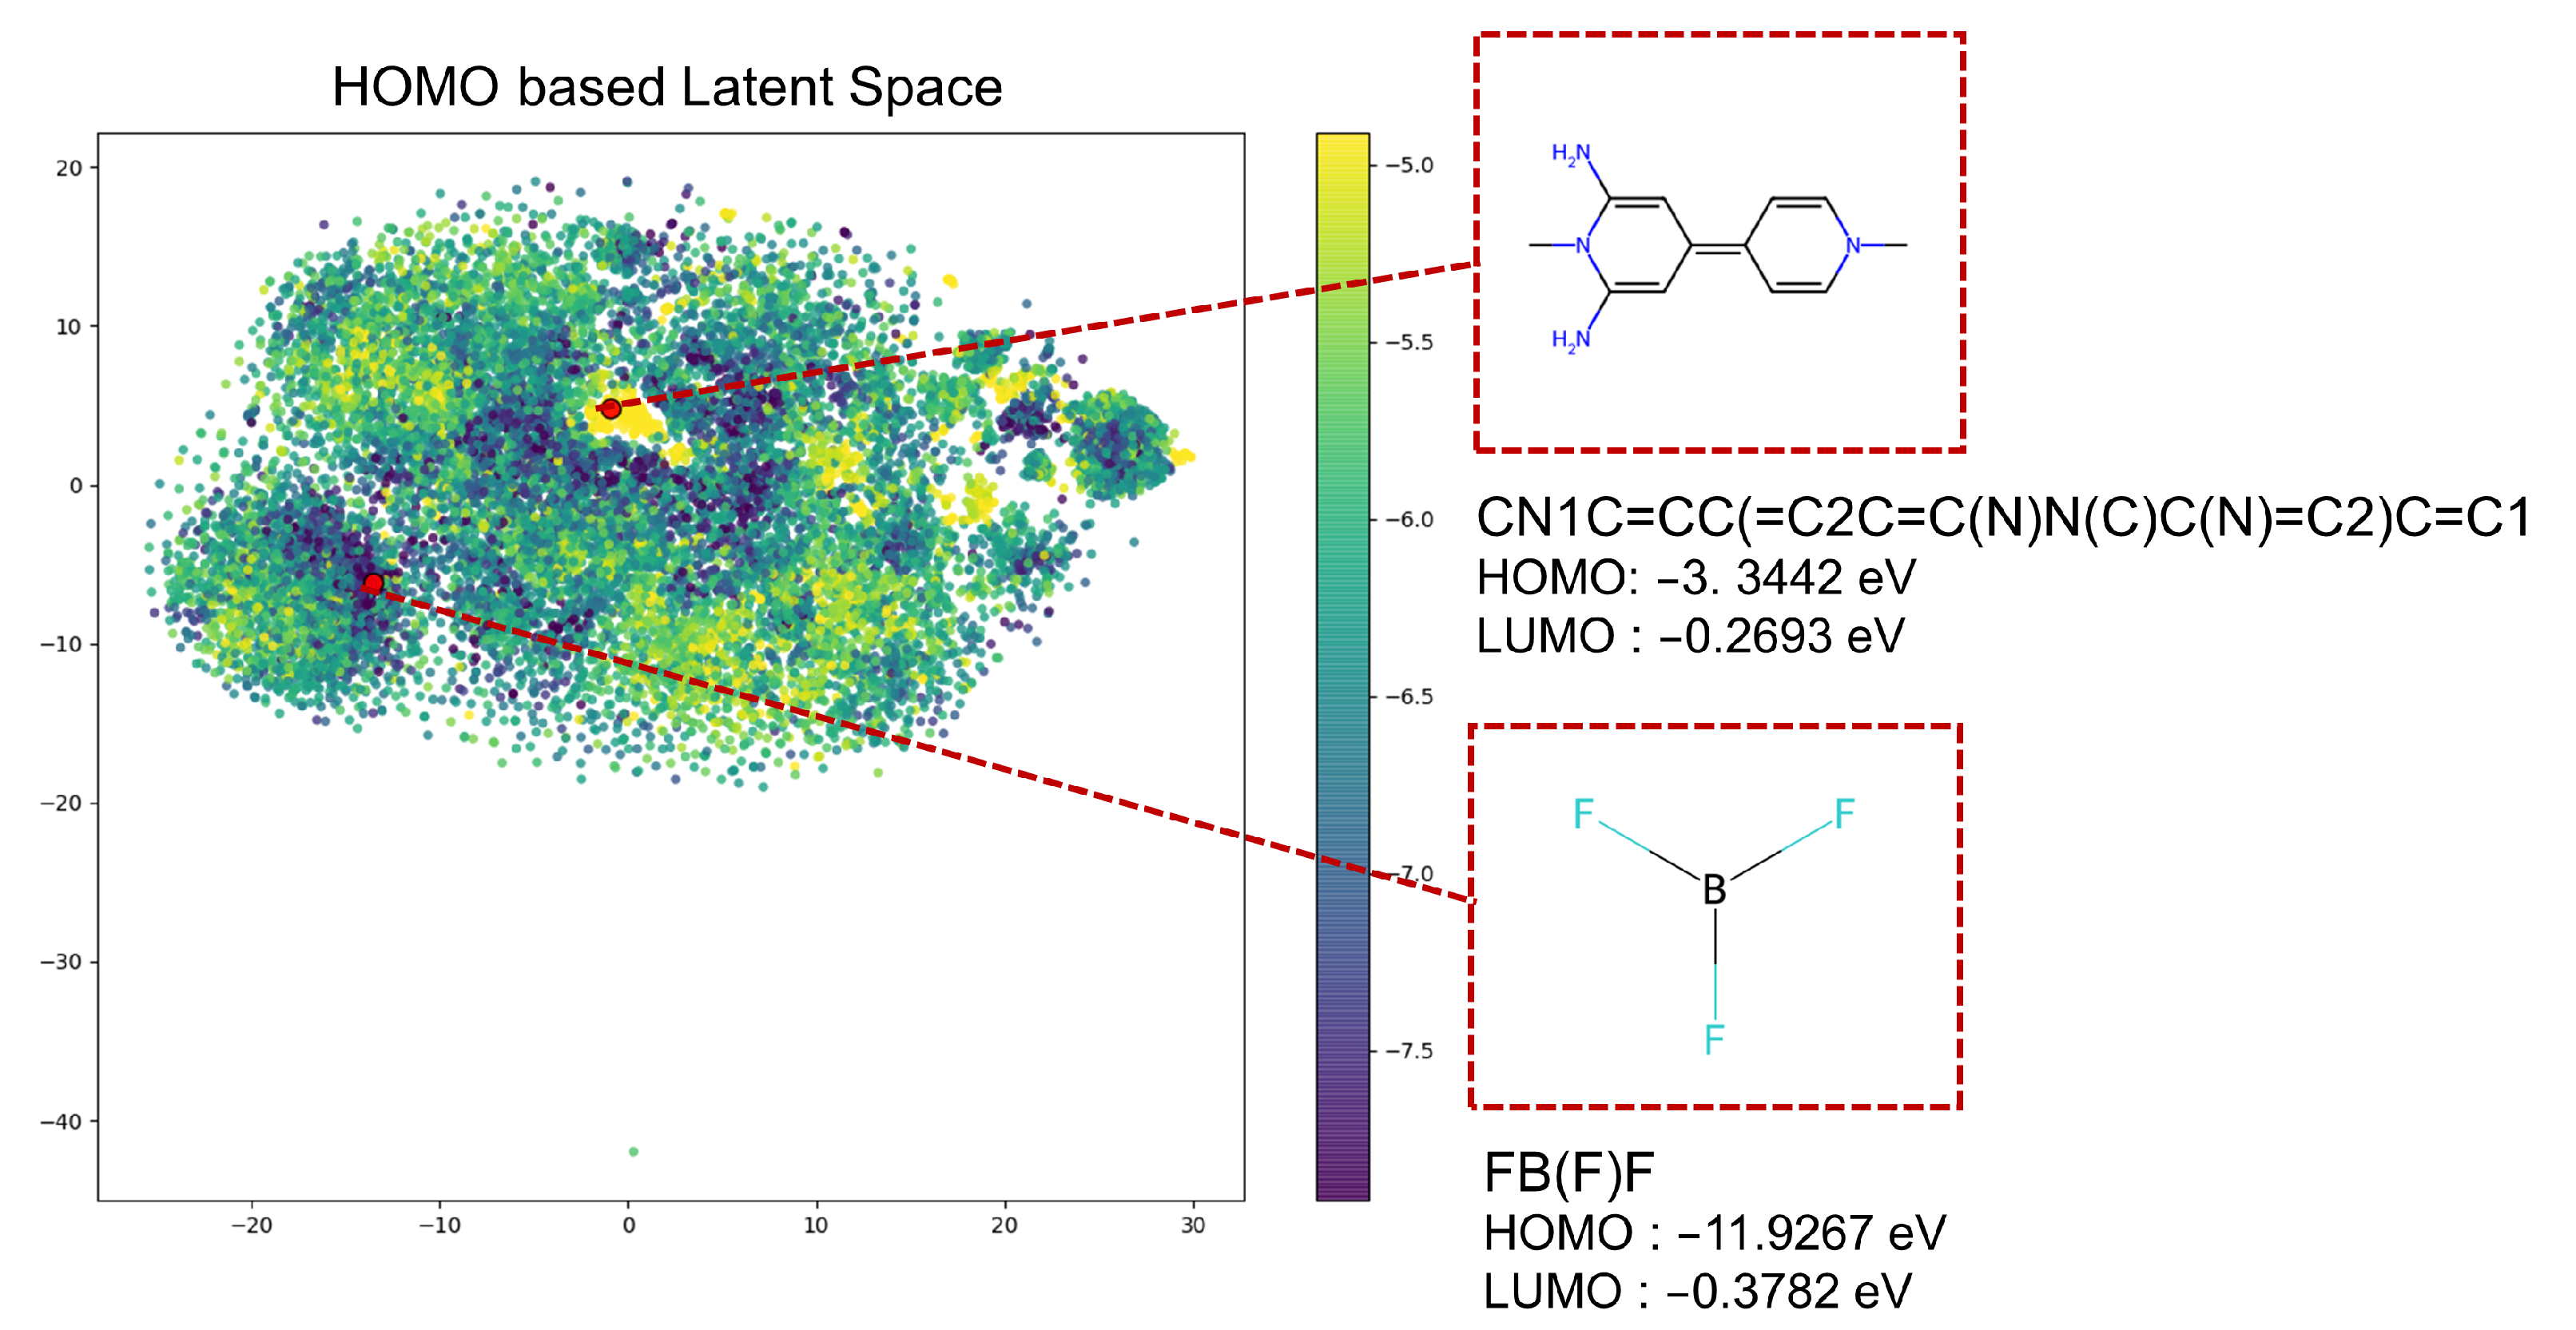
3.1. Dataset Analysis

Table 1 presents a comparative analysis between our target electrolyte dataset and datasets from other studies in different domains. The performance of the NPVAE model, which focuses on natural products, was validated in previous studies through experiments on two datasets: the Polymer Evaluation dataset and the Natural Product dataset [54,58]. The NPVAE model evaluated its reconstruction performance using the Polymer dataset and assessed its generative capability on more complex natural products by utilizing the Drugbank dataset along with a separately collected Drug-and-Natural-Product dataset. The Natural Product dataset and the Polymer dataset consist of relatively large and complex molecules compared to the organic molecule dataset QM9 [59], as presented in Table 1. This comparison helps identify differences in dataset size and the distribution of molecular complexity between the electrolyte dataset and those used in other studies. The molecular weight and HOMO/LUMO distributions of four datasets—the Natural Product dataset, the Polymer dataset, the QM9 dataset comprising large organic molecules, and the Custom Electrolyte dataset consisting of potential electrolyte candidates—were compared. The QM9 dataset contains organic molecules from a wide range of domains, the Polymer dataset focuses on novel materials for solar cell development, and the Drug-and-Natural-Product dataset is centered on drug and natural product molecules.
The QM9 dataset contains the largest number of molecular data points but has the narrowest molecular weight range. This suggests that, compared to the QM9 dataset, the other datasets include a smaller absolute number of molecular data points but encompass a more diverse range of molecules. However, the electrolyte dataset is specifically designed to include strong candidate molecules for the development of lithium-ion battery electrolytes, which is the primary objective of this study.
Figure 3 illustrates the distribution of HOMO/LUMO values for molecules in the QM9 dataset(blue) and the Electrolyte dataset(red). Although the QM9 dataset contains approximately 8 times more molecular data, the Electrolyte dataset demonstrates a greater diversity in the distribution of HOMO/LUMO values. The QM9 dataset has a larger number of data points compared to the red electrolyte dataset, but its distribution is concentrated within a narrower range. On the other hand, the electrolyte dataset is evenly distributed across a wider range. This indicates that the electrolyte dataset consists of more diverse molecules tailored to electrolyte characteristics compared to the QM9.

3.2. Results and Experimental Setup

The evaluation of the trained model was carried out in three aspects: reconstruction, generation, and molecular property prediction. The more accurately the input data are reconstructed with high probability, the more effectively the encoder and decoder of the Variational Autoencoder (VAE) can be evaluated as well trained. The evaluation of generation was conducted by generating new latent vectors through random sampling and exploration within the latent space of the generative model. To verify the chemical and physical validity of the generated molecules from a general molecular perspective, novelty and validity were evaluated [60]. The MOSES metric was used to compare the distribution of the generated molecules with that of the training dataset, confirming the generation of diverse molecular structures. Additionally, Posebuster and SA score calculations were performed to assess the chemical and physical feasibility as well as the synthetic accessibility of the generated molecules [61,62]. After evaluating the general validity from a molecular perspective using these computational metrics, molecular property prediction evaluation was conducted to assess how well the generated molecules predict the HOMO and LUMO properties specific to the electrolyte additive domain. The prediction performance was compared with Unimol, the state-of-the-art (SOTA) molecular property prediction model at the time of this study [63,64]. To evaluate the accuracy of HOMO and LUMO predictions for newly generated molecules, DFT calculations were performed on approximately 1000 generated molecules, and these DFT calculation values were used as the ground truth to compute the Mean Absolute Error (MAE) between the HOMO and LUMO predictions of the Unimol and NPVAE models.
Each model was trained separately for HOMO and LUMO properties, and the hyperparameters are as follows. The latent vector dimension was set to 256 (z_dim), and the hidden layer size was 512 (h_size), with an intermediate layer size of 256 (mid_size). The KL loss was weighted by 0.01 ( ζ , kl_magnification), the topology loss by 3.0 ( β , topology_magnification), the bond loss by 1.0 ( δ , bond_magnification), the root label loss by 2.0 ( α , root_magnification), the label loss by 1.0 ( γ , label_magnification), the property loss by 1.0 ( ε , prop_magnification), and the molecular (conformation) loss by 2.0 ( ϵ , mol_magnification). The model was trained for 40 epochs with a batch size of 1, utilizing four NVIDIA GeForce RTX 3070 GPUs in a CUDA-enabled multi-GPU environment.

3.2.1. Reconstruction

To assess the effectiveness of the Variational Autoencoder model in capturing the latent representations of electrolyte additives, we evaluated its reconstruction accuracy. Figure 4 and Figure 5 visualize the latent space of the trained model using the t-distributed Stochastic Neighbor Embedding (t-SNE) dimensionality reduction method. Each point in the scatter plot represents a molecular sample, where its latent vector, learned through the VAE, is mapped into a lower-dimensional space. The color bar on the right side of the figure represents the learned molecular property values (HOMO or LUMO), where the values increase in the order of dark purple, blue, green, and yellow (Note that all HOMO values are negative). To enhance visualization clarity and mitigate the influence of extreme outliers, we set the color mapping range based on the 3rd and 97th percentiles of the property values. It can be observed that the range of values for each HOMO and LUMO property shown in Figure 3 is similar to the range of values represented by the color bar.
Figure 4 presents the visualization of latent vectors learned by the VAE model for the HOMO property. The molecule located at the upper region in Figure 4, C12H16N4, is among the top 3% of molecules in the dataset with the highest HOMO values. This molecule has a relatively high HOMO value of −3.3442 eV, indicating poor oxidative stability and a potential risk of decomposition at high-voltage cathodes (>4 V). Meanwhile, its LUMO value of −0.2693 eV suggests good reductive stability, making it a potential electrolyte additive for lithium metal or graphite anodes. However, due to its limited electrochemical window, further structural optimization is required to enhance its stability and performance. Meanwhile, the BF3 molecule located at the lower part of Figure 4 has a very low HOMO value of −11.9267 eV, placing it among the bottom 3% of molecules in the dataset with the lowest HOMO values, indicating excellent oxidative stability. Thus, it can function as a stable Lewis acid and a potential electrolyte additive for lithium-ion batteries, particularly for improving SEI layer formation or modifying electrolyte properties. In Figure 4, these two extreme molecules are clustered together with molecules having relatively similar HOMO values. For these electrolyte additives, which are significant but require further structural exploration, our proposed approach can generate new molecules that share similar characteristics with existing electrolyte additive data while introducing various structures. The reconstruction accuracy, calculated by comparing the input SMILES with the reconstructed SMILES, is 97.898%.
Figure 5 presents the visualization of the latent space of the model trained on the LUMO property and reconstruction accuracy is 98.327%. The first molecule highlighted with a red dashed line at the top in Figure 5 is a bicyclic chiral molecule, potentially exhibiting high thermal stability and unique stereochemical properties. The second molecule is an aromatic compound containing strong electron-withdrawing groups (cyano and fluorine), exhibiting high oxidative stability and strong electrochemical reactivity. Considering that the 256-dimensional vectors were reduced to a lower dimension for visualization, it can be observed that molecules with relatively similar property values are well clustered together. By exploring the latent space based on these valuable electrolyte additive molecules, new molecules can be generated.

3.2.2. Generation

Generation was performed through random sampling within a radius of 1 around arbitrarily selected molecules in the latent space. To verify the chemical and physical validity of the generated molecules before the experimental stage and DFT calculations, the following metrics were selected. Finally, we evaluated the generated molecules using validation, novelty, fragment similarity (Frag), scaffold similarity (Scaff), internal diversity (IntDiv), PB Valid, and SA score metrics [61,62]. Table 2 presents the evaluation results of the generated molecules based on below metrics.
PB Valid is a measure of the probability that a generated molecule is chemically valid, considering polymer-based validity checks. A high PB Valid score indicates that most generated molecules adhere to fundamental chemical constraints.
Validity represents the proportion of generated molecules that are chemically valid according to standard valency rules. A score of 1.0 implies that all generated molecules conform to these constraints.
Novelty quantifies the proportion of generated molecules that are not present in the training dataset. A high novelty score, such as 1.0, indicates that all generated molecules are unique and not direct replicas of known structures.
Fragment similarity measures the similarity of generated molecular fragments to those found in the training dataset. This metric helps assess whether the generated molecules maintain meaningful substructures from known compounds.
Scaffold similarity evaluates how structurally similar the core scaffolds of generated molecules are to those in the training dataset. Lower scaffold similarity values suggest that the model generates more structurally diverse molecules.
Internal diversity (IntDiv) quantifies the diversity within the set of generated molecules. A high internal diversity score indicates that the generated molecules cover a broad range of structural variations rather than being highly redundant.
Synthetic accessibility score (SA score) is a heuristic estimate of how easily a molecule can be synthesized. It ranges from 1 (easily synthesizable) to 10 (very difficult to synthesize). Lower SA scores suggest that the generated molecules are more practical for real-world synthesis.
Since the MOSES framework can measure similarity by comparing with the training dataset, it can be observed from Table 2 that the generated molecules have low similarity to the training dataset while being easy to synthesize and composed of valid molecules. Figure 6 represents the distribution of properties, including HOMO, LUMO, and molecular weight, for approximately 1000 newly generated molecules. If the molecular weight of an electrolyte additive is too high, it becomes difficult to dissolve in organic solvents. Therefore, the molecular weight should not deviate significantly from the average (183; see Table 1) and the distribution of the electrolyte additive candidate dataset. Figure 6 shows that the molecular weight distribution of the generated molecules has a high frequency in the range of 50–200, while also exhibiting a diverse range of HOMO and LUMO values. This suggests that highly unrealistic molecules have been filtered out, and new molecules with characteristics suitable for electrolyte additives have been successfully generated. Examples of the generated molecules can be found in Appendix B.

3.2.3. Molecular Property Prediction

The evaluation of molecular property prediction was conducted by comparing the performance of the NPVAE model with the state-of-the-art (SOTA) model, UniMol, on the QM9 dataset [59,63,64]. The UniMol model is a deep learning model based on the SE(3) Transformer architecture for 3D molecular representation, and the trained 3D molecular representation model has been utilized to perform various downstream tasks, including molecular property prediction [65]. In its original study, the UniMol model was developed to predict molecular properties, including HOMO, LUMO, and the HOMO-LUMO gap. The UniMol model was fine-tuned for 10 epochs on the electrolyte dataset using the pre-trained model released by the authors, and its predictive performance was evaluated on the test set. Likewise, the NPVAE model was also trained separately for HOMO and LUMO, and its predictive performance was evaluated on the test set. The HOMO and LUMO prediction performance of the NPVAE model on the electrolyte dataset was then compared with that of the UniMol model (see Table 3). The HOMO and LUMO values obtained through DFT calculations were used as the ground truth, and the Mean Absolute Error (MAE) of the predictions from both the UniMol and NPVAE models was computed.
The ‘Test Molecules’ column represents the number of molecules in the test set for each dataset. These generated molecules (*Generated) were sampled from the latent space of the trained NPVAE model. Since *Generated did not have HOMO and LUMO values, DFT calculations were conducted to obtain the HOMO/LUMO ground truth values. The NPVAE model trained on the electrolyte dataset predicted the molecular properties of the *Generated, and these predictions were compared with the DFT-derived HOMO/LUMO ground truth values to compute the Mean Absolute Error (MAE).
Table 3 presents the results of molecular property prediction, where the NPVAE model, fine-tuned on the electrolyte additive dataset, showed the lowest performance in predicting LUMO properties with a Mean Absolute Error (MAE) of 0.00158 for 1000 molecules in the test set. Furthermore, excluding the generated molecules, the molecules with high reliability that were already present in the dataset demonstrated relatively lower error rates for LUMO properties compared to HOMO properties. This also suggests that, as observed in Figure 4 and Figure 5, the latent space for LUMO is better clustered compared to HOMO.

4. Conclusions

We aimed to replace the conventional expert intuition-driven process of developing new electrolyte additives with a deep learning-based approach through this study. This research enables the proposal of a more diverse range of molecular candidates, including those that may be challenging for human researchers to explore, while predicting their HOMO and LUMO properties. It is evident that HOMO and LUMO are important factors in electrolyte additive design, but they are not the only determining elements. However, simulating the chemical reactions and interactions among various molecules remains an extremely complex task and continues to be a significant challenge for many researchers [66]. Therefore, as a practical and widely recognized approach, we focused on generating new candidate molecules based on their HOMO and LUMO characteristics [67,68,69]. To obtain the HOMO and LUMO values of a molecule, DFT calculations must be performed, which require a significant amount of time. However, through this study, we confirmed that the trained model not only accurately predicts the HOMO and LUMO values of the electrolyte additive dataset but also demonstrates strong predictive performance for the HOMO and LUMO values of newly generated molecules (see Table 3). Therefore, domain experts can leverage generative models to explore novel molecular structures for electrolyte additives. This enables the design and synthesis of new electrolyte additives based on the predicted HOMO and LUMO values while eliminating the need for computationally expensive DFT calculations in the initial screening process. This suggests that the proposed approach has the potential to accelerate the efficient development and design of electrolyte additives [70,71].

Author Contributions

Conceptualization, J.L.; Methodology, D.Y.; Software, D.Y.; Validation, D.Y. and J.L.; Writing—original draft, D.Y.; Writing—review & editing, J.L.; Supervision, S.L.; Project administration, J.L. and S.L.; Funding acquisition, S.L. All authors have read and agreed to the published version of the manuscript.

Funding

This work was funded by Institute of Information & Communications Technology Planning & Evaluation (IITP) grant funded by the Korea government(MSIT) (No. RS-2023-00221723, Development of AI simulator for electrolyte development for improving performance and solving problems of next-generation secondary battery).

Institutional Review Board Statement

Not applicable.

Informed Consent Statement

Not applicable.

Data Availability Statement

Publicly available datasets from the Materials Project https://next-gen.materialsproject.org, accessed on 13 March 2025, and the Electrolyte Genome Project https://www.jcesr.org/research/electrolyte-genome/, accessed on 13 March 2025, were used in this study. The additional private dataset generated during the study is not publicly available due to institutional restrictions but may be made available from the corresponding author upon reasonable request.

Conflicts of Interest

The authors declare no conflicts of interest.

Abbreviations

The following abbreviations are used in this manuscript:
HOMOHighest occupied molecular orbital
LUMOLowest unoccupied molecular orbital
DFTDensity Functional Theory
SEI layerSolid electrolyte interphase
GNNGraph neural network
VAEVariational Autoencoder

Appendix A

Appendix A.1. Preprocessing

The fragment-based decomposition preprocessing process follows these steps:
  • Initial fragmentation: The molecular structure is represented as a graph G = ( V , E ) , where V denotes atoms and E denotes bonds. Bonds that are not part of ring structures but connect ring atoms are identified and removed, breaking the structure into subgraphs G 1 , G 2 , , G N .
  • Frequency-based filtering: Among the fragmented substructures, those that do not contain ring structures and appear infrequently (below a set frequency threshold, f c ) are selected. These substructures become unique labels in the vocabulary, denoted as G 1 , G 2 , , G n .
  • Functional group decomposition: Further decomposition focuses on specific functional groups. For instance:
    -
    Amide groups: Substructures containing amide groups are identified, and bonds involving the amide C(=O)N are broken to create individual labels.
    -
    Carboxyl and ester bonds: Substructures with carboxyl or ester groups are similarly decomposed of separating bonds involving C(=O)O.
    -
    Aldehyde and ketone groups: Bonds within aldehyde or ketone groups C(=O) are also separated to generate labeled substructures.
    -
    Hydroxyl and ether bonds: Finally, bonds between oxygen and carbon in hydroxyl or ether groups are broken, adding further meaningful labels to the vocabulary.

Appendix A.2. NP-VAE Encoder Process

The encoder of the NP-VAE consists of two main steps:
Step 1: After preprocessing, the dataset is segmented into graphs and labels, which are subsequently input into the Child-Sum Tree-LSTM encoder [57]. The Extended Connectivity Fingerprints (ECFPs) of each tree’s nodes serve as inputs to this encoder, allowing it to capture local structural information. Using this information, the encoder computes the hidden vector h 0 at the root node.
Step 2: The overall ECFP x l is computed for the entire graph. The latent vector is then obtained by combining h 0 and x l . Finally, the reparameterization trick is applied to sample from the latent distribution, ensuring differentiability during the training process.

Appendix A.3. NP-VAE Decoder Process

In the NP-VAE model, the decoder generates a compound structure from the input latent variable z t by sequentially building a tree structure using a depth-first algorithm. The decoding process comprises seven key stages: Root label prediction, Topological prediction, Bond prediction, Label prediction, Latent variable update (z), Conversion to compound structure, and Chirality assignment.
  • Root label prediction: Predicts a substructure label for the root node by applying L r fully connected layers to the latent variable z. This multi-class classification selects a substructure label from those generated during preprocessing. Specifically, transformations are applied to z through fully connected layers, with a softmax operation at the final layer to determine the most likely root label.
  • Topological prediction: Determines whether a child node should be generated under the current node. Binary classification is performed to decide on generating a child node. If a child node is created, bond and label prediction steps follow. Otherwise, the process either terminates (at the root) or backtracks to the parent node for further structure generation.
  • Bond prediction: Predicts the type of bond (single, double, or triple) between the current node’s substructure and the child node’s substructure. A ternary classification is applied through L b -layer fully connected transformations to z t .
  • Label prediction: Predicts the substructure label for the newly generated child node. L s -layer fully connected layers are applied to z t for multi-class classification. The predicted substructure label is validated for chemical plausibility. If invalid, bond prediction attempts are adjusted until a valid connection is achieved.
  • Latent variable update (z): Updates the latent variable z t to z t + 1 after label prediction or backtracking. z t is updated using a fully connected layer that integrates the feature vector h i , derived from Child-Sum Tree-LSTM. Node-specific features propagate to enrich feature representation.
  • Conversion to compound structure: Constructs the compound structure from the generated substructure labels. The tree structure is converted to the final compound structure by linking substructure labels, with bonding information uniquely defining the compound.
  • Chirality assignment: Assigns stereochemistry to ensure correct 3D structural representation. L c -layer fully connected transformations produce an ECFP value, and stereoisomers are generated. The final structure is chosen based on the smallest Euclidean distance between predicted and calculated ECFP.

Appendix B

In this section, we present the results of latent space exploration conducted using the Variational Autoencoder model trained on the HOMO property. The model was used to generate molecules through approximately 10,000 random samplings. This random sampling process is as follows. As a reference molecule, we selected ‘CC(=O)C1=CSC(C2=[S]C(N+[O-])=CS2)=[S]1’, which is visualized in Figure A1.
This molecule was chosen arbitrarily and its latent space coordinates were used as a starting point for exploration. We performed a search within a radius of 1 around its latent space position to generate new molecular structures. By sampling within this defined radius in the latent space, our model generated structurally diverse molecules while maintaining similarity to the reference molecule. The visualization of these generated molecules is presented in Figure A2.
The generated structures exhibit variations in functional groups and molecular backbones, demonstrating the ability of the model to explore the diversity of chemical structures within the latent space. This analysis provides insights into the molecular generation potential of the trained model, particularly in designing novel electrolyte additives. Through this process, new molecules can potentially be used as electrolyte additives.
Figure A1. Reference molecule ‘CC(=O)C1=CSC(C2=[S]C([N+](=O)[O-])=CS2)=[S]1’ structure.
Applsci 15 03640 g0a1
Figure A2. Generated molecular structures from latent space exploration.
Applsci 15 03640 g0a2

References

  1. Reiser, P.; Neubert, M.; Eberhard, A.; Torresi, L.; Zhou, C.; Shao, C.; Metni, H.; van Hoesel, C.; Schopmans, H.; Sommer, T.; et al. Graph neural networks for materials science and chemistry. Commun. Mater. 2022, 3, 93. [Google Scholar] [CrossRef] [PubMed]
  2. Khemani, B.; Patil, S.; Kotecha, K.; Tanwar, S. A review of graph neural networks: Concepts, architectures, techniques, challenges, datasets, applications, and future directions. J. Big Data 2024, 11, 18. [Google Scholar] [CrossRef]
  3. Liu, Z.; Wan, G.; Prakash, B.A.; Lau, M.S.; Jin, W. A Review of Graph Neural Networks in Epidemic Modeling. In Proceedings of the 30th ACM SIGKDD Conference on Knowledge Discovery and Data Mining (KDD ’24), Barcelona, Spain, 25–29 August 2024; pp. 6577–6587. [Google Scholar] [CrossRef]
  4. Vora, L.K.; Gholap, A.D.; Jetha, K.; Thakur, R.R.S.; Solanki, H.K.; Chavda, V.P. Artificial Intelligence in Pharmaceutical Technology and Drug Delivery Design. Pharmaceutics 2023, 15, 1916. [Google Scholar] [CrossRef] [PubMed]
  5. Tran, H.; Gurnani, R.; Kim, C.; Pilania, G.; Kwon, H.K.; Lively, R.P.; Ramprasad, R. Design of functional and sustainable polymers assisted by artificial intelligence. Nat. Rev. Mater. 2024, 9, 866–886. [Google Scholar] [CrossRef]
  6. Xu, K. Silicon electro-optic micro-modulator fabricated in standard CMOS technology as components for all silicon monolithic integrated optoelectronic systems. J. Micromech. Microeng. 2021, 31, 054001. [Google Scholar] [CrossRef]
  7. Merchant, A.; Batzner, S.; Schoenholz, S.S.; Aykol, M.; Cheon, G.; Cubuk, E.D. Scaling deep learning for materials discovery. Nature 2023, 624, 80–85. [Google Scholar] [CrossRef]
  8. Wu, X.; Wang, H.; Gong, Y.; Fan, D.; Ding, P.; Li, Q.; Qian, Q. Graph neural networks for molecular and materials representation. J. Mater. Inform. 2023, 3, 12. [Google Scholar] [CrossRef]
  9. Zhou, J.; Cui, G.; Hu, S.; Zhang, Z.; Yang, C.; Liu, Z.; Wang, L.; Li, C.; Sun, M. Graph neural networks: A review of methods and applications. AI Open 2020, 1, 57–81. [Google Scholar] [CrossRef]
  10. Li, J.; Lim, K.; Yang, H.; Ren, Z.; Raghavan, S.; Chen, P.Y.; Buonassisi, T.; Wang, X. AI applications through the whole life cycle of material discovery. Matter 2020, 3, 393–432. [Google Scholar] [CrossRef]
  11. Liu, R.L.; Wang, J.; Shen, Z.H.; Shen, Y. AI for dielectric capacitors. Energy Storage Mater. 2024, 71, 103612. [Google Scholar] [CrossRef]
  12. Bilodeau, C.; Jin, W.; Jaakkola, T.; Barzilay, R.; Jensen, K.F. Generative models for molecular discovery: Recent advances and challenges. WIREs Comput. Mol. Sci. 2022, 12, e1608. [Google Scholar] [CrossRef]
  13. Pang, C.; Qiao, J.; Zeng, X.; Zou, Q.; Wei, L. Deep Generative Models in De Novo Drug Molecule Generation. J. Chem. Inf. Model. 2024, 64, 2174–2194. [Google Scholar] [CrossRef] [PubMed]
  14. Meyers, J.; Fabian, B.; Brown, N. De novo molecular design and generative models. Drug Discov. Today 2021, 26, 2707–2715. [Google Scholar] [CrossRef] [PubMed]
  15. Xue, D.; Gong, Y.; Yang, Z.; Chuai, G.; Qu, S.; Shen, A.; Yu, J.; Liu, Q. Advances and challenges in deep generative models for de novo molecule generation. WIREs Comput. Mol. Sci. 2019, 9, e1395. [Google Scholar] [CrossRef]
  16. Hu, W.; Liu, Y.; Chen, X.; Chai, W.; Chen, H.; Wang, H.; Wang, G. Deep Learning Methods for Small Molecule Drug Discovery: A Survey. IEEE Trans. Artif. Intell. 2024, 5, 459–479. [Google Scholar] [CrossRef]
  17. Walters, W.P.; Barzilay, R. Applications of Deep Learning in Molecule Generation and Molecular Property Prediction. Acc. Chem. Res. 2021, 54, 263–270. [Google Scholar] [CrossRef]
  18. Xu, Y.; Lin, K.; Wang, S.; Wang, L.; Cai, C.; Song, C.; Lai, L.; Pei, J. Deep Learning for Molecular Generation. Future Med. Chem. 2019, 11, 567–597. [Google Scholar] [CrossRef]
  19. Elton, D.C.; Boukouvalas, Z.; Fuge, M.D.; Chung, P.W. Deep learning for molecular design—A review of the state of the art. Mol. Syst. Des. Eng. 2019, 4, 828–849. [Google Scholar] [CrossRef]
  20. Sousa, T.; Correia, J.; Pereira, V.; Rocha, M. Generative Deep Learning for Targeted Compound Design. J. Chem. Inf. Model. 2021, 61, 5343–5361. [Google Scholar] [CrossRef]
  21. Lim, J.; Ryu, S.; Kim, J.W.; Kim, W.Y. Molecular generative model based on conditional variational autoencoder for de novo molecular design. J. Cheminform. 2018, 10, 31. [Google Scholar] [CrossRef]
  22. Gómez-Bombarelli, R.; Wei, J.N.; Duvenaud, D.; Hernández-Lobato, J.M.; Sánchez-Lengeling, B.; Sheberla, D.; Aguilera-Iparraguirre, J.; Hirzel, T.D.; Adams, R.P.; Aspuru-Guzik, A. Automatic Chemical Design Using a Data-Driven Continuous Representation of Molecules. ACS Cent. Sci. 2018, 4, 268–276. [Google Scholar] [CrossRef] [PubMed]
  23. Gómez-Bombarelli, R.; Aguilera-Iparraguirre, J.; Hirzel, T.D.; Duvenaud, D.; Maclaurin, D.; Blood-Forsythe, M.A.; Chae, H.S.; Einzinger, M.; Ha, D.G.; Wu, T.; et al. Design of efficient molecular organic light-emitting diodes by a high-throughput virtual screening and experimental approach. Nat. Mater. 2016, 15, 1120–1127. [Google Scholar] [CrossRef] [PubMed]
  24. Kusner, M.J.; Paige, B.; Hernández-Lobato, J.M. Grammar variational autoencoder. In Proceedings of the 34th International Conference on Machine Learning, PMLR 70, Sydney, NSW, Australia, 6–11 August 2017; pp. 1945–1954. [Google Scholar]
  25. Dai, H.; Tian, Y.; Dai, B.; Skiena, S.S.; Song, L. Syntax-Directed Variational Autoencoder for Molecule Generation. In Proceedings of the 31st Conference on Neural Information Processing Systems (NIPS 2017), Long Beach, CA, USA, 4–9 December 2017. [Google Scholar]
  26. Liu, Q.; Allamanis, M.; Brockschmidt, M.; Gaunt, A.L. Constrained graph variational autoencoders for molecule design. In Proceedings of the 32nd International Conference on Neural Information Processing Systems (NIPS’18), Montreal, QC, Canada, 2–8 December 2018; pp. 7806–7815. [Google Scholar]
  27. Jin, W.; Barzilay, R.; Jaakkola, T. Junction Tree Variational Autoencoder for Molecular Graph Generation. arXiv 2019, arXiv:1802.04364. [Google Scholar]
  28. Jin, W.; Barzilay, R.; Jaakkola, T. Hierarchical generation of molecular graphs using structural motifs. In Proceedings of the 37th International Conference on Machine Learning (ICML’20), Virtual, 13–18 July 2020. [Google Scholar]
  29. Raghunathan, S.; Priyakumar, U.D. Molecular representations for machine learning applications in chemistry. Int. J. Quantum Chem. 2022, 122, e26870. [Google Scholar] [CrossRef]
  30. Wigh, D.S.; Goodman, J.M.; Lapkin, A.A. A review of molecular representation in the age of machine learning. WIREs Comput. Mol. Sci. 2022, 12, e1603. [Google Scholar] [CrossRef]
  31. Chang, J.; Ye, J.C. Bidirectional generation of structure and properties through a single molecular foundation model. Nat. Commun. 2024, 15, 2323. [Google Scholar] [CrossRef]
  32. Xu, Z.; Lei, X.; Ma, M.; Pan, Y. Molecular Generation and Optimization of Molecular Properties Using a Transformer Model. Big Data Min. Anal. 2023, 7, 142–155. [Google Scholar]
  33. Mswahili, M.E.; Jeong, Y.S. Transformer-based models for chemical SMILES representation: A comprehensive literature review. Heliyon 2024, 10, e39038. [Google Scholar] [CrossRef]
  34. Sadeghi, S.; Bui, A.; Forooghi, A.; Lu, J.; Ngom, A. Can large language models understand molecules? BMC Bioinform. 2024, 25, 225. [Google Scholar] [CrossRef]
  35. Liu, Y.; Guo, B.; Zou, X.; Li, Y.; Shi, S. Machine learning assisted materials design and discovery for rechargeable batteries. Energy Storage Mater. 2020, 31, 434–450. [Google Scholar] [CrossRef]
  36. Lombardo, T.; Duquesnoy, M.; El-Bouysidy, H.; Årén, F.; Gallo-Bueno, A.; Jørgensen, P.B.; Bhowmik, A.; Demortière, A.; Ayerbe, E.; Alcaide, F.; et al. Artificial Intelligence Applied to Battery Research: Hype or Reality? Chem. Rev. 2022, 122, 10899–10969. [Google Scholar] [CrossRef] [PubMed]
  37. Severson, K.A.; Attia, P.M.; Jin, N.; Perkins, N.; Jiang, B.; Yang, Z.; Chen, M.H.; Aykol, M.; Herring, P.K.; Fraggedakis, D.; et al. Data-driven prediction of battery cycle life before capacity degradation. Nat. Energy 2019, 4, 383–391. [Google Scholar] [CrossRef]
  38. Hu, X.; Li, S.E.; Yang, Y. Advanced Machine Learning Approach for Lithium-Ion Battery State Estimation in Electric Vehicles. IEEE Trans. Transp. Electrif. 2016, 2, 140–149. [Google Scholar] [CrossRef]
  39. Zahid, T.; Xu, K.; Li, W.; Li, C.; Li, H. State of charge estimation for electric vehicle power battery using advanced machine learning algorithm under diversified drive cycles. Energy 2018, 162, 871–882. [Google Scholar] [CrossRef]
  40. Chemali, E.; Kollmeyer, P.J.; Preindl, M.; Emadi, A. State-of-charge estimation of Li-ion batteries using deep neural networks: A machine learning approach. J. Power Sources 2018, 400, 242–255. [Google Scholar] [CrossRef]
  41. Lv, C.; Zhou, X.; Zhong, L.; Yan, C.; Srinivasan, M.; Seh, Z.W.; Liu, C.; Pan, H.; Li, S.; Wen, Y.; et al. Machine Learning: An Advanced Platform for Materials Development and State Prediction in Lithium-Ion Batteries. Adv. Mater. 2022, 34, 2101474. [Google Scholar] [CrossRef]
  42. Ling, C. A review of the recent progress in battery informatics. NPJ Comput. Mater. 2022, 8, 33. [Google Scholar] [CrossRef]
  43. Zheng, F.; Zhu, Z.; Lu, J.; Yan, Y.; Jiang, H.; Sun, Q. Predicting the HOMO-LUMO gap of benzenoid polycyclic hydrocarbons via interpretable machine learning. Chem. Phys. Lett. 2023, 814, 140358. [Google Scholar] [CrossRef]
  44. Amici, J.; Asinari, P.; Ayerbe, E.; Barboux, P.; Bayle-Guillemaud, P.; Behm, R.J.; Berecibar, M.; Berg, E.; Bhowmik, A.; Bodoardo, S.; et al. A Roadmap for Transforming Research to Invent the Batteries of the Future Designed within the European Large Scale Research Initiative BATTERY 2030+. Adv. Energy Mater. 2022, 12, 2102785. [Google Scholar] [CrossRef]
  45. Fichtner, M.; Edström, K.; Ayerbe, E.; Berecibar, M.; Bhowmik, A.; Castelli, I.E.; Clark, S.; Dominko, R.; Erakca, M.; Franco, A.A.; et al. Rechargeable Batteries of the Future—The State of the Art from a BATTERY 2030+ Perspective. Adv. Energy Mater. 2022, 12, 2102904. [Google Scholar] [CrossRef]
  46. Vegge, T.; Tarascon, J.M.; Edström, K. Toward Better and Smarter Batteries by Combining AI with Multisensory and Self-Healing Approaches. Adv. Energy Mater. 2021, 11, 2100362. [Google Scholar] [CrossRef]
  47. Haregewoin, A.M.; Wotango, A.S.; Hwang, B.J. Electrolyte additives for lithium ion battery electrodes: Progress and perspectives. Energy Environ. Sci. 2016, 9, 1955–1988. [Google Scholar] [CrossRef]
  48. Chen, X.; Zhang, Q. Atomic Insights into the Fundamental Interactions in Lithium Battery Electrolytes. Acc. Chem. Res. 2020, 53, 1992–2002. [Google Scholar] [CrossRef]
  49. Jankowski, P.; Wieczorek, W.; Johansson, P. SEI-forming electrolyte additives for lithium-ion batteries: Development and benchmarking of computational approaches. J. Mol. Model. 2016, 23, 6. [Google Scholar] [CrossRef] [PubMed]
  50. Borodin, O. Challenges with prediction of battery electrolyte electrochemical stability window and guiding the electrode—Electrolyte stabilization. Curr. Opin. Electrochem. 2019, 13, 86–93. [Google Scholar] [CrossRef]
  51. Atkins, D.; Ayerbe, E.; Benayad, A.; Capone, F.G.; Capria, E.; Castelli, I.E.; Cekic-Laskovic, I.; Ciria, R.; Dudy, L.; Edström, K.; et al. Understanding Battery Interfaces by Combined Characterization and Simulation Approaches: Challenges and Perspectives. Adv. Energy Mater. 2022, 12, 2102687. [Google Scholar] [CrossRef]
  52. Bhowmik, A.; Castelli, I.E.; Garcia-Lastra, J.M.; Jørgensen, P.B.; Winther, O.; Vegge, T. A perspective on inverse design of battery interphases using multi-scale modelling, experiments and generative deep learning. Energy Storage Mater. 2019, 21, 446–456. [Google Scholar] [CrossRef]
  53. Sanchez-Lengeling, B.; Aspuru-Guzik, A. Inverse molecular design using machine learning: Generative models for matter engineering. Science 2018, 361, 360–365. [Google Scholar] [CrossRef]
  54. Ochiai, T.; Inukai, T.; Akiyama, M.; Furui, K.; Ohue, M.; Matsumori, N.; Inuki, S.; Uesugi, M.; Sunazuka, T.; Kikuchi, K.; et al. Variational autoencoder-based chemical latent space for large molecular structures with 3D complexity. Commun. Chem. 2023, 6, 249. [Google Scholar] [CrossRef]
  55. Qu, X.; Jain, A.; Rajput, N.N.; Cheng, L.; Zhang, Y.; Ong, S.P.; Brafman, M.; Maginn, E.; Curtiss, L.A.; Persson, K.A. The Electrolyte Genome project: A big data approach in battery materials discovery. Comput. Mater. Sci. 2015, 103, 56–67. [Google Scholar] [CrossRef]
  56. Jain, A.; Ong, S.P.; Hautier, G.; Chen, W.; Richards, W.D.; Dacek, S.; Cholia, S.; Gunter, D.; Skinner, D.; Ceder, G.; et al. Commentary: The Materials Project: A materials genome approach to accelerating materials innovation. APL Mater. 2013, 1, 011002. [Google Scholar] [CrossRef]
  57. Tai, K.S.; Socher, R.; Manning, C.D. Improved Semantic Representations From Tree-Structured Long Short-Term Memory Networks. arXiv 2015, arXiv:1503.00075. [Google Scholar]
  58. St. John, P.C.; Phillips, C.; Kemper, T.W.; Wilson, A.N.; Guan, Y.; Crowley, M.F.; Nimlos, M.R.; Larsen, R.E. Message-passing neural networks for high-throughput polymer screening. J. Chem. Phys. 2019, 150, 234111. [Google Scholar] [CrossRef] [PubMed]
  59. Ramakrishnan, R.; Dral, P.O.; Rupp, M.; von Lilienfeld, O.A. Quantum chemistry structures and properties of 134 kilo molecules. Sci. Data 2014, 1, 140022. [Google Scholar] [CrossRef]
  60. Polykovskiy, D.; Zhebrak, A.; Sanchez-Lengeling, B.; Golovanov, S.; Tatanov, O.; Belyaev, S.; Kurbanov, R.; Artamonov, A.; Aladinskiy, V.; Veselov, M.; et al. Molecular Sets (MOSES): A Benchmarking Platform for Molecular Generation Models. Front. Pharmacol. 2020, 11, 565644. [Google Scholar] [CrossRef]
  61. Buttenschoen, M.; Morris, G.M.; Deane, C.M. PoseBusters: AI-based docking methods fail to generate physically valid poses or generalise to novel sequences. Chem. Sci. 2024, 15, 3130–3139. [Google Scholar] [CrossRef]
  62. Ertl, P.; Schuffenhauer, A. Estimation of synthetic accessibility score of drug-like molecules based on molecular complexity and fragment contributions. J. Cheminform. 2009, 1, 8. [Google Scholar] [CrossRef]
  63. Zhou, G.; Gao, Z.; Ding, Q.; Zheng, H.; Xu, H.; Wei, Z.; Zhang, L.; Ke, G. Uni-Mol: A Universal 3D Molecular Representation Learning Framework. In Proceedings of the Eleventh International Conference on Learning Representations (ICLR 2023), Kigali, Rwanda, 1–5 May 2023. [Google Scholar]
  64. Lu, S.; Gao, Z.; He, D.; Zhang, L.; Ke, G. Data-driven quantum chemical property prediction leveraging 3D conformations with Uni-Mol+. Nat. Commun. 2024, 15, 7104. [Google Scholar] [CrossRef]
  65. Rong, Y.; Bian, Y.; Xu, T.; Xie, W.; Wei, Y.; Huang, W.; Huang, J. Self-Supervised Graph Transformer on Large-Scale Molecular Data. arXiv 2020, arXiv:2007.02835. [Google Scholar]
  66. Pyzer-Knapp, E.O.; Suh, C.; Gómez-Bombarelli, R.; Aguilera-Iparraguirre, J.; Aspuru-Guzik, A. What Is High-Throughput Virtual Screening? A Perspective from Organic Materials Discovery. Annu. Rev. Mater. Res. 2015, 45, 195–216. [Google Scholar] [CrossRef]
  67. Bolloju, S.; Vangapally, N.; Elias, Y.; Luski, S.; Wu, N.L.; Aurbach, D. Electrolyte additives for Li-ion batteries: Classification by elements. Prog. Mater. Sci. 2025, 147, 101349. [Google Scholar] [CrossRef]
  68. Han, Y.K.; Lee, K.; Jung, S.C.; Huh, Y.S. Computational screening of solid electrolyte interphase forming additives in lithium-ion batteries. Comput. Theor. Chem. 2014, 1031, 64–68. [Google Scholar] [CrossRef]
  69. Zhang, W.; Zhang, S.; Fan, L.; Gao, L.; Kong, X.; Li, S.; Li, J.; Hong, X.; Lu, Y. Tuning the LUMO Energy of an Organic Interphase to Stabilize Lithium Metal Batteries. ACS Energy Lett. 2019, 4, 644–650. [Google Scholar] [CrossRef]
  70. Oliveira, A.F.; Da Silva, J.L.F.; Quiles, M.G. Molecular Property Prediction and Molecular Design Using a Supervised Grammar Variational Autoencoder. J. Chem. Inf. Model. 2022, 62, 817–828. [Google Scholar] [CrossRef]
  71. Cheng, L.; Assary, R.S.; Qu, X.; Jain, A.; Ong, S.P.; Rajput, N.N.; Persson, K.; Curtiss, L.A. Accelerating Electrolyte Discovery for Energy Storage with High-Throughput Screening. J. Phys. Chem. Lett. 2015, 6, 283–291. [Google Scholar] [CrossRef]
Figure 1. Example samples from the constructed dataset for electrolyte additives. Each sample includes the 2D visualization of the molecule, along with its properties such as SMILES, HOMO, LUMO, E 0 Energy, and Zero Point Energy.
Applsci 15 03640 g001
Figure 2. Example samples from the constructed dataset for electrolyte additives. Each sample includes the 2D visualization of the molecule, along with its properties such as SMILES, HOMO, LUMO, E 0 Energy, and Zero Point Energy.
Applsci 15 03640 g002
Figure 3. Histograms showing the HOMO/LUMO distributions of the QM9 dataset and the Custom Electrolyte dataset. HOMO histogram (left) and LUMO histogram (right).
Applsci 15 03640 g003
Figure 4. Figure of the latent space visualization for the model trained on each HOMO property. The molecules marked with red dashed lines represent two example molecules from the dataset that fall within the top and bottom 3% extremes of HOMO values.
Applsci 15 03640 g004
Figure 5. Figure of the latent space visualization for the model trained on each LUMO property. As the LUMO values increase, they appear more yellow, while lower values are represented by a deep purple color.
Applsci 15 03640 g005
Figure 6. Histogram of the HOMO, LUMO, and molecular weight distributions of the generated molecules.
Applsci 15 03640 g006
Table 1. Comparison of molecular weight distributions across datasets.
DatasetMinimum (Min)Maximum (Max)Average (Avg)Molecules
QM916152122133,885
Polymer83176876617,124
Drug-and-Natural-Product3827237910,597
Electrolyte970518317,271
Table 2. Evaluation metrics of the generated molecules.
MetricValue
PBValid0.995
Validity1.000
Novelty1.000
Frag Similarity0.445
Scaffold Similarity0.239
IntDiv0.869
SA Score0.4253
Table 3. Molecular property prediction accuracy.
ModelDatasetTest MoleculesPropertyMAE (eV)
UnimolElectrolyte1000HOMO0.22385
LUMO0.04176
*Generated110HOMO0.10706
LUMO0.16052
NPVAEElectrolyte1000HOMO0.02099
LUMO0.00158
*Generated1060HOMO0.04996
LUMO0.06895
Disclaimer/Publisher’s Note: The statements, opinions and data contained in all publications are solely those of the individual author(s) and contributor(s) and not of MDPI and/or the editor(s). MDPI and/or the editor(s) disclaim responsibility for any injury to people or property resulting from any ideas, methods, instructions or products referred to in the content.

