Article

Thermo-Mechanical Identification of Orthotropic Engineering Constants of Composites Using an Extended Non-Destructive Impulse Excitation Technique

1
Department Mechanics of Materials and Constructions, Faculty of Engineering Sciences, Vrije Universiteit Brussel, Pleinlaan 2, 1050 Brussels, Belgium
2
Department Sustainable Materials Engineering, Faculty of Engineering Sciences, Vrije Universiteit Brussel, Pleinlaan 2, 1050 Brussels, Belgium
3
Bytec BV, Stoopsstraat 4, 2330 Merksplas, Belgium
*
Author to whom correspondence should be addressed.
Appl. Sci. 2025, 15(7), 3621; https://doi.org/10.3390/app15073621
Submission received: 18 February 2025 / Revised: 17 March 2025 / Accepted: 21 March 2025 / Published: 26 March 2025

Abstract

:

Featured Application

The newly developed instrument and innovative mixed numerical–experimental technique in this work aim to identify the orthotropic engineering constants of composite materials as a function of temperature. The approach accounts for the specific local heterogeneity of composites by averaging the results over the test plate area.

Abstract

Composite materials are increasingly used in various vehicles and construction parts, necessitating a comprehensive understanding of their behavior under varying thermal conditions. Measuring the thermo-mechanical properties with traditional methods such as tensile testing or dynamical mechanical analysis is often time-consuming and requires costly apparatus. This paper introduces an innovative non-destructive method for identifying the orthotropic engineering constants of composite test sheets as a function of temperature. The proposed technique represents an advancement of the conventional impulse excitation technique, incorporating an automated pendulum exciting mechanism and creating digital twins of the test sheets. The automated measurement of the impulse response function yields resonance frequencies and damping ratios at specified temperatures. These values are subsequently utilized in digital twins for identification of the engineering constants. The method is fully automated across predefined temperature intervals and can be seamlessly integrated into existing climate chambers equipped with remote control facilities. The results obtained from the described measurement technique were applied to a bi-directionally glass-reinforced thermoplastic PA6 matrix in a tested temperature range of −20 °C to 60 °C, revealing that the complex engineering constants are significantly affected by temperature.

1. Introduction

Composite materials have revolutionized the way vehicles, construction parts, and consumer goods are designed. They are replacing more and more traditional materials, like steel, wood, and aluminum. Composite materials are utilized successfully in dynamically loaded structures like satellites, military aircraft, expensive cars, boats, sports, and many consumer goods. The success of composites is attributed to their mechanical properties, including a high stiffness-to-weight ratio, high strength-to-weight ratio, and good fatigue resistance. Furthermore, they offer design flexibility, allowing for tailoring of mechanical properties and the creation of new shapes. However, composites also exhibit complex mechanical behavior, posing challenges for design and testing, as discussed by Jones [1].
The elastic material properties of composite components are crucial in determining how these parts deform under static and dynamic loads. Their vibration and acoustic behavior are influenced by the elastic and damping properties. Temperature variations modify the elastic and damping properties of these composite parts. This is especially relevant for modern recyclable thermoplastic composites, studied by, e.g., Ozturk et al. [2]. Change of resonance frequencies, mode shapes, and the transient response of the structure can affect the functional behavior of vehicles, construction parts, and consumer goods. Understanding the temperature-dependent elastic and damping properties is essential for reliable composite structure design.
Orthotropic materials have elastic properties that are symmetrical with respect to a Cartesian coordinate system. Most composites exhibit orthotropic behavior due to stiffer fiber reinforcement compared to the matrix material, which is particularly evident in unidirectionally reinforced layers. Four engineering constants are required to describe the orthotropic in-plane stiffness behavior of thin sheets. In a plane with two perpendicular orthotropic material directions 1 and 2 (see, e.g., Figure 1), the relationship between stresses and strains is given by the stiffness matrix C:
σ i * = C i j * ε j * i , j = 1,2 , 3
σ 1 * σ 2 * τ 12 * = E 1 * 1 υ 12 * υ 21 * υ 21 * E 1 * 1 υ 12 * υ 21 * 0 υ 12 * E 2 * 1 υ 12 * υ 21 * E 2 * 1 υ 12 * υ 21 * 0 0 0 G 12 * ε 1 * ε 2 * γ 12 *
The quantities in (1) are all complex numbers with real and imaginary parts. C* is the complex in-plane stiffness matrix; ε 1 * , ε 2 * are normal strains; σ 1 * , σ 2 * are normal stresses, respectively in the 1- and 2-directions. γ 12 * , τ 12 * are the in-plane shear strains and stresses. E 1 * , E 2 * are the complex dynamic Young’s moduli; υ 12 * , υ 21 * are the major and minor Poisson’s ratios; G 12 * is the complex in-plane shear modulus. For a given circular frequency ω and assumed linear behavior, the values E 1 * , E 1 * , υ 12 * , υ 21 * , G 12 * are constant and called the complex dynamic engineering constants. Because of the symmetry of the relationships υ 12 * E 2 * = υ 21 * E 1 * , there are only four independent complex engineering constants in C*, as shown in Equation (2):
E 1 * = E 1 + i · E 1 = E 1 1 + i · tan δ E 1
E 2 * = E 2 + i · E 2 = E 2 1 + i · tan δ E 2
v 12 * = v 12 + i · v 12 = v 12 ( 1 + i · tan δ ( υ 12 ) )
G 12 * = G 12 + i · G 12 = G 12 ( 1 + i · tan δ ( G 12 ) )
The real parts in the Equation (2) represent the elastic behavior, while the imaginary “tangents delta” parts govern the damping contribution of the complex engineering constants. The complex Young’s modulus E* (sometimes called the dynamic modulus) is the ratio of the normal stress to the strain amplitude under vibratory conditions (calculated from data obtained from either free or forced vibration tests). The phase angle between the stress and strain signal is the tangent delta. The complex shear modulus G12 is the ratio of the shear stress to strain amplitude. Poisson ratio v*12 is the negative ratio of the transverse strain in the 2-direction to the longitudinal strain in the 1-direction.
Engineering constants of composites are intrinsic material properties, critical for engineering design and materials development. They can be computed using micromechanical models or measured through experiments. Examples of micromechanical models can be found, e.g., in Raju et al. [3]. However, the accuracy of micromechanical formulations depends on the prior knowledge of the properties and percentage of the constituent materials as well as the application of suitable numerical models. If possible, it is safer to measure the engineering constants with experiments on test samples. Various test methods exist for measuring engineering constants, divided into static and dynamic methods. Tensile, bending, shear, and torsion tests are well-known static methods. The engineering constants are determined based on measured forces, namely longitudinal and transverse deformations, e.g., ASTM D3039 [4] and ASTM D70788 [5]. Traditionally, moduli based on tensile testing are determined by eye from a straight line drawn on the linear part of the stress–strain curve, but more recently, automatic testing machines using computer control and data acquisition can apply some form of curve fitting to obtain a best fit to the data, e.g., ASTM D3039 [4]. Flexural testing in three- or four-point bending is an alternative to tensile testing. Much smaller forces are applied, and larger displacements are achieved. Calculations are usually based on thin-beam flexure equations, such as those developed by Timoshenko [6].
Experimental results always come with a level of uncertainty. Factors that affect the uncertainty by static testing are discussed in, e.g., Kostic [7]. The most influential source of uncertainty in the determination of the engineering constants of composite materials via static testing is the test system (dimensional measurement device, gauge determination system, extensometer type, alignment system, test machine stiffness, force measurement accuracy, and extensometer accuracy), detailed, e.g., in Lord and Morrell [8]. Due to inevitable imperfections in the sensors, the force and displacements measurements at low stresses and strains values have high relative uncertainty bounds (theoretically nearly infinite for nearly zero values). Therefore, the found engineering constants near the origin of the stress–strain curve have high uncertainty values. The procedures for obtaining temperature-dependent elastic properties by using tensile and flexural tests are complex and time-consuming. A similar set of requirements as those for the room temperature modulus test is necessary, with the added complication of strain and displacements measurements at elevated temperatures.
Dynamic testing methods are indirect methods. The impulse excitation technique (IET) (e.g., ASTM C 1259–98 [9]), experimental modal analysis (EMA) and operational modal analysis (OMA) (e.g., He and Fu [10]), and dynamic measurement analysis (DMA) (e.g., Schalnak [11]) are the most used dynamic methods. Dynamic testing methods are more difficult to understand intuitively but are easier to execute and provide more accurate engineering constants at low stress and strain amplitudes (see, e.g., Lord and Morell [8]). DMA uses forced excitation to measure the elastic and damping properties of composite lamina within a limited frequency range. DMA allows the identification of temperature and frequency dependent elastic and damping properties. DMA is conducted using small beam samples. Peel stresses at the free boundaries, induced by machining the composite beam specimens, can therefore have considerable influence on the test results.
EMA, OMA, and IET address this issue with larger test samples. IET is easy to perform and requires less complex equipment than EMA or OMA. Simply tapping the test sample causes a vibration response with low amplitude. This vibration response can be measured with a sensor and is called “The impulse response function” (IRF). The IRF is composed of the decaying excited modes of vibration of the test sample (for visualization, see also Figure 2). Resonance frequencies and damping ratios can be extracted from the measured IRF (see, e.g., Heritage [12]). Since IET is non-destructive, the method is suitable for testing at different temperatures (see, e.g., Brebels [13]). IET was selected for the current study because of these advantages.
Standard IET uses analytical and empirical formulas to derive the elastic properties from measured vibration quantities. Unfortunately, there are no formulas available for freely suspended orthotropic plates. In 1986, Sol [14] demonstrated the possibility of replacing standard IET formulas with special-purpose finite element (FE) models. He used a mixed numerical experimental technique (MNET) for the identification of the engineering constants. The engineering constants in the numerical model were iteratively tuned in such a way that computed resonance frequencies match the measured values. The resulting identification method, called the Resonalyser procedure, can simultaneously identify the four engineering constants of an orthotropic material from measured resonance frequencies of a test plate by IET. Validation of the results obtained by the Resonalyser procedure was presented in several publications [15,16,17]. De Visscher [18] presented an extension of the Resonalyser procedure including the identification of the damping part of complex orthotropic engineering constants.
During previous decades, various authors have presented related MNET approaches for the identification of orthotropic elastic constants [19,20,21,22,23,24,25,26,27,28,29,30,31,32,33,34,35,36]. Most authors have agreed that testing freely suspended samples provides better agreement with the numerical model than other types of boundary conditions. Clamping or simply supporting samples influences the damping behavior especially. Some studies worked with a large series of resonance frequencies on freely suspended test plates without special requirements for the aspect ratio of the test plates. However, these large series of frequencies on test plates with an arbitrary aspect ratio poses several problems. First, EMA or OMA are necessary to couple the measured frequencies with the correct sequence of computed resonance frequencies. Secondly, higher vibration modes are influenced more by transverse shear deformation, making thin plate theory increasingly inaccurate. Adapting a thick plate theory, on the other hand, requires knowledge of the transverse shear modulus, which is difficult to identify. The potential to run more complex numerical models on faster computers opened the way to develop more elaborate material identification methods. Among others, Ayorinde [21] and Frederiksen [23] used thick plate models in which the transverse shear modulus was estimated using an empirical formula. Cunha [25] presented mixed numerical experimental techniques for the identification of layered materials and laminates. EMA and OMA are the most applied methods in numerical experimental procedures for the identification of engineering constants. They both need the measurement of modal shapes associated with resonance frequencies. Non-contact EMA and EMO require laser scanners. This is difficult to execute with temperature control. The Resonalyser procedure needs only resonance frequencies and damping ratios, which can be solved with IET and allows easier temperature control.
An early attempt to include the temperature dependency of the engineering constants of thin orthotropic plates was published by M. Bottiglieri in 2010 [37]. He used IET with manual excitation of the test samples in a temperature-controlled cavity. The Resonalyser procedure was used for the identification of the elastic engineering constants. In a more recent paper, Chandra et al. [38] investigated the dynamic behavior of several carbon-fiber–epoxy laminated composite plates at different temperatures, using OMA. The modal contributions were selected as a function of the targeted frequency. The temperature-dependent elastic and damping parameters were estimated by a genetic algorithm-based parameter identification scheme for different sets of modal contribution. The study found that both the elastic and damping properties of the carbon–epoxy composites vary significantly with temperature. This information is vital for designing and optimizing composite structures for specific thermal conditions
This paper describes an extended IET procedure with automated excitation for continuous identification of engineering constants across different temperatures, aiming to make the process straightforward and cost effective. The major cost is the climate chamber, which, in many laboratories, is already available for other scientific experiments. The Resonalyser procedure was used for the identification of the complex engineering constants at each temperature step. The next paragraphs describe first the theory and background of the Resonalyser procedure. Next, the automated excitation procedure and execution in a climate chamber are highlighted. At the end of this paper, an example is given of the identification of a bidirectionally glass-fiber-reinforced thermoplastic PA6/Organo composite sample between −20 °C and 60 °C.

2. Experimental Methods

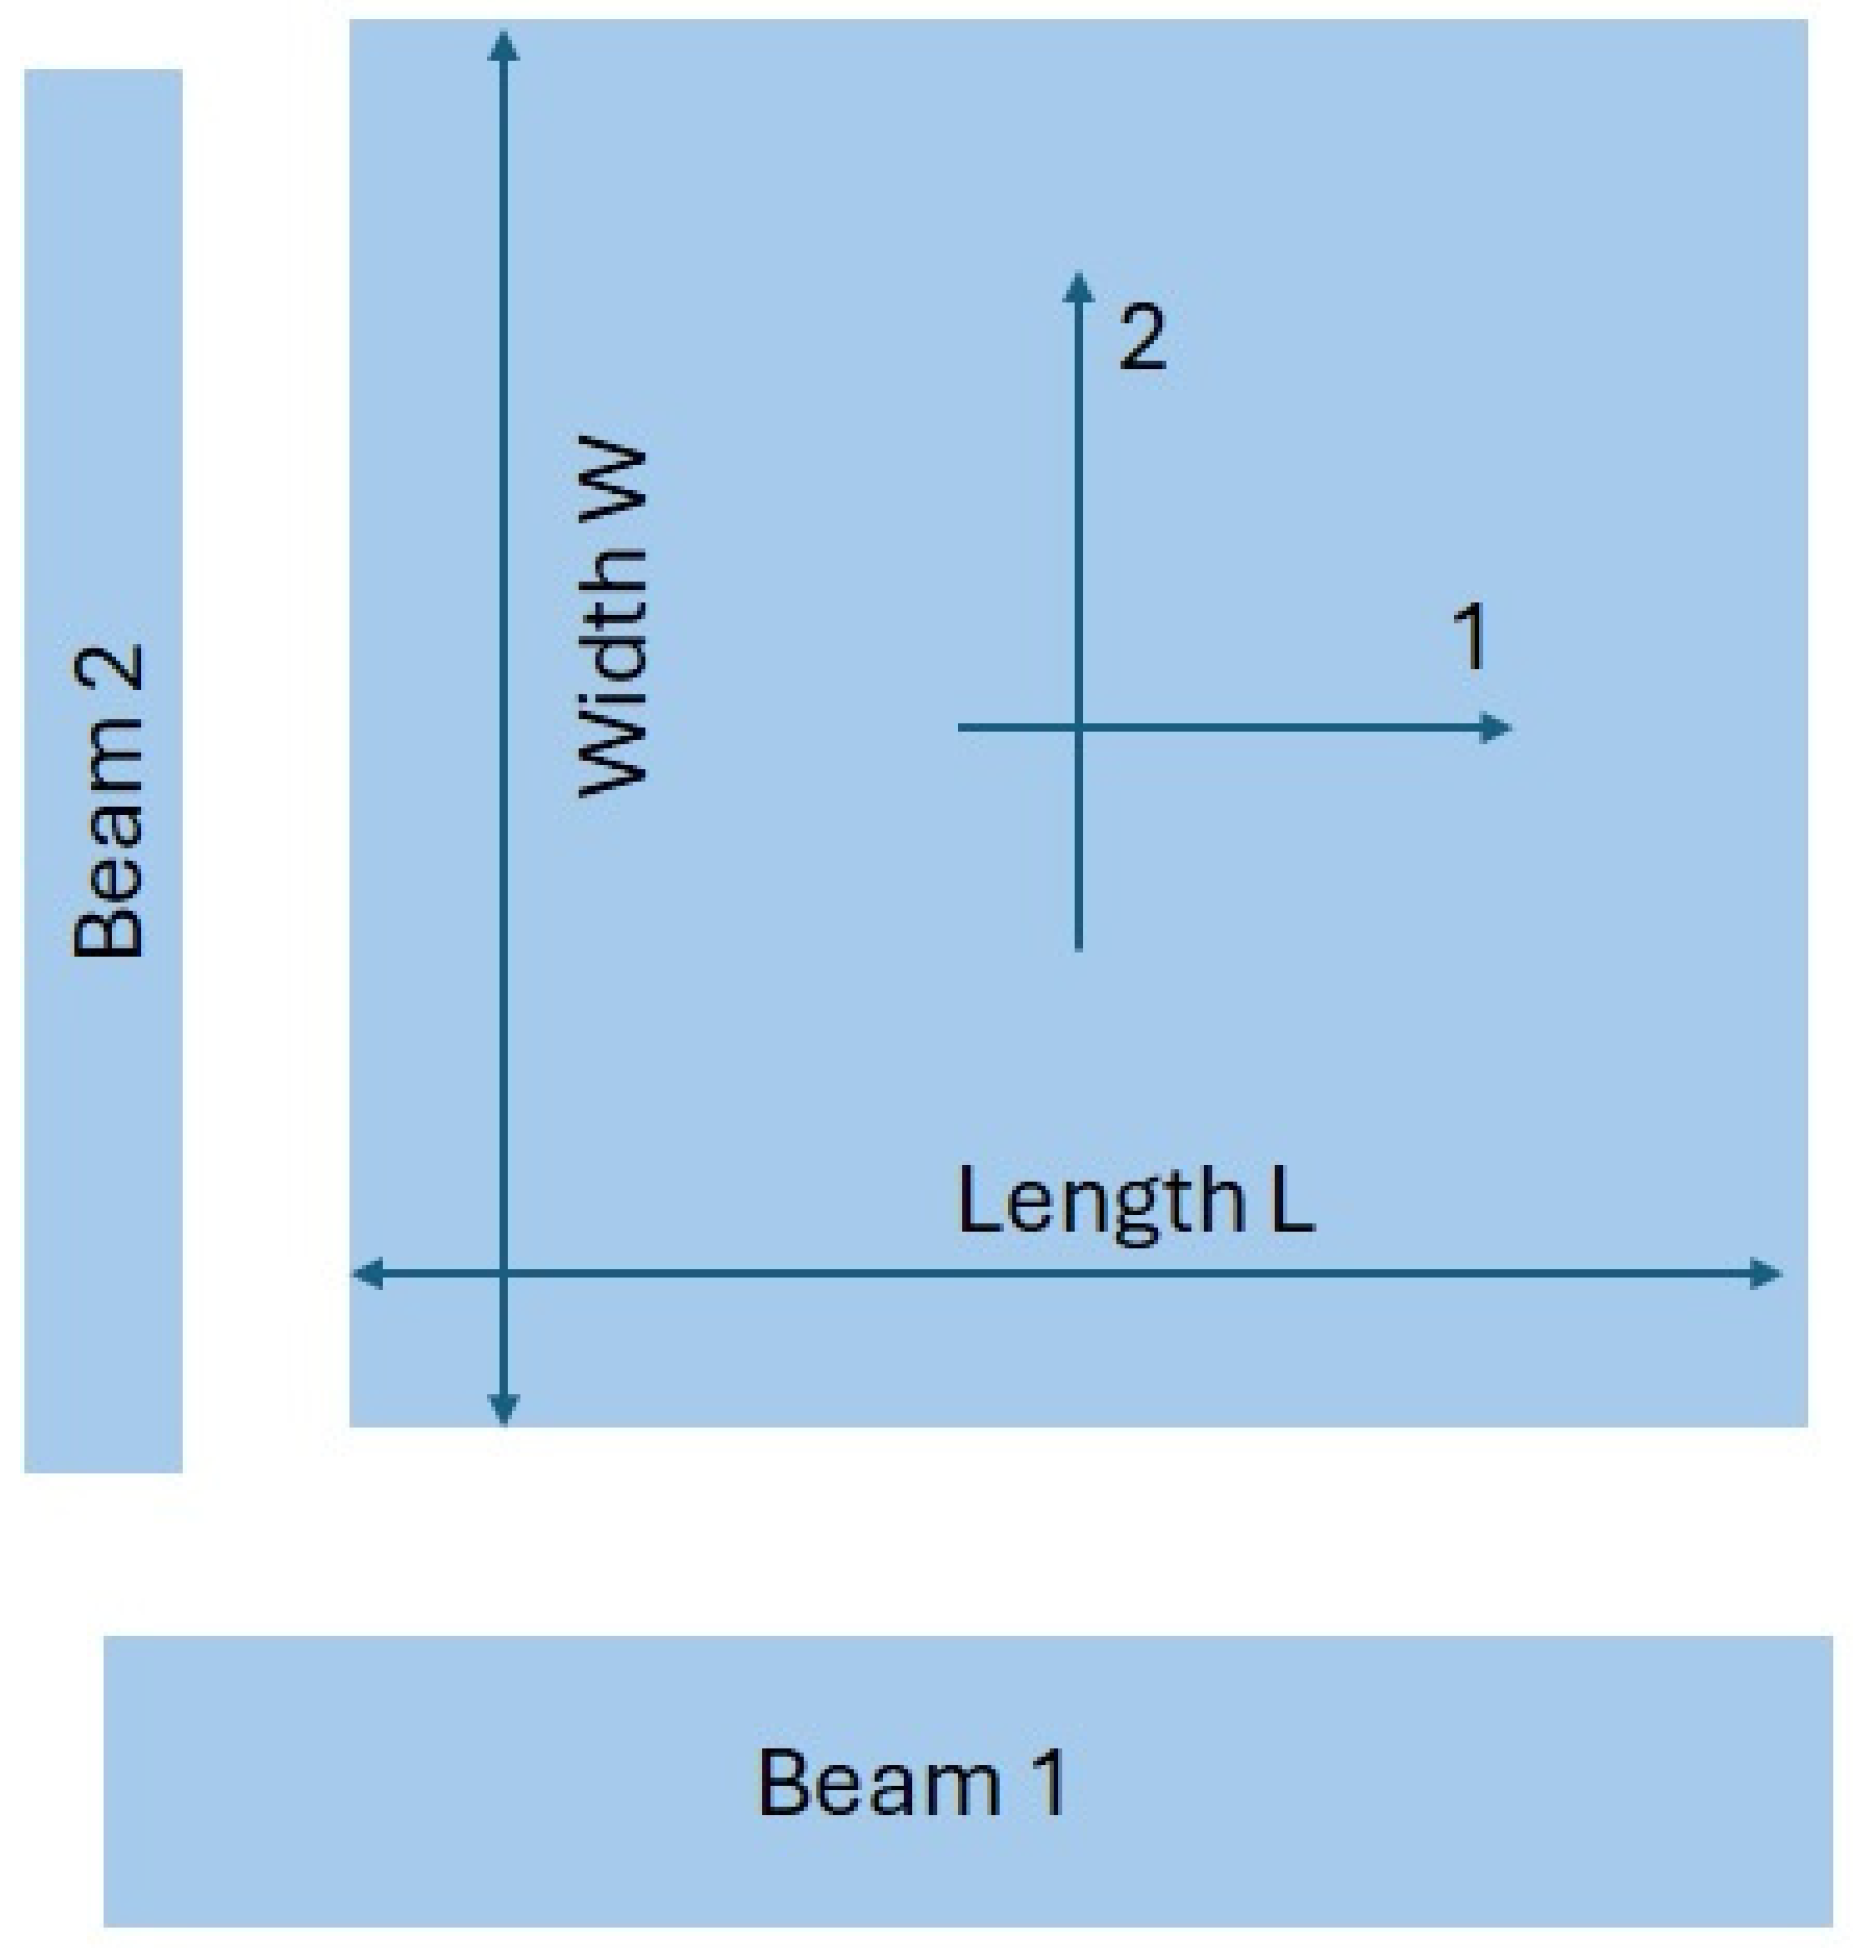
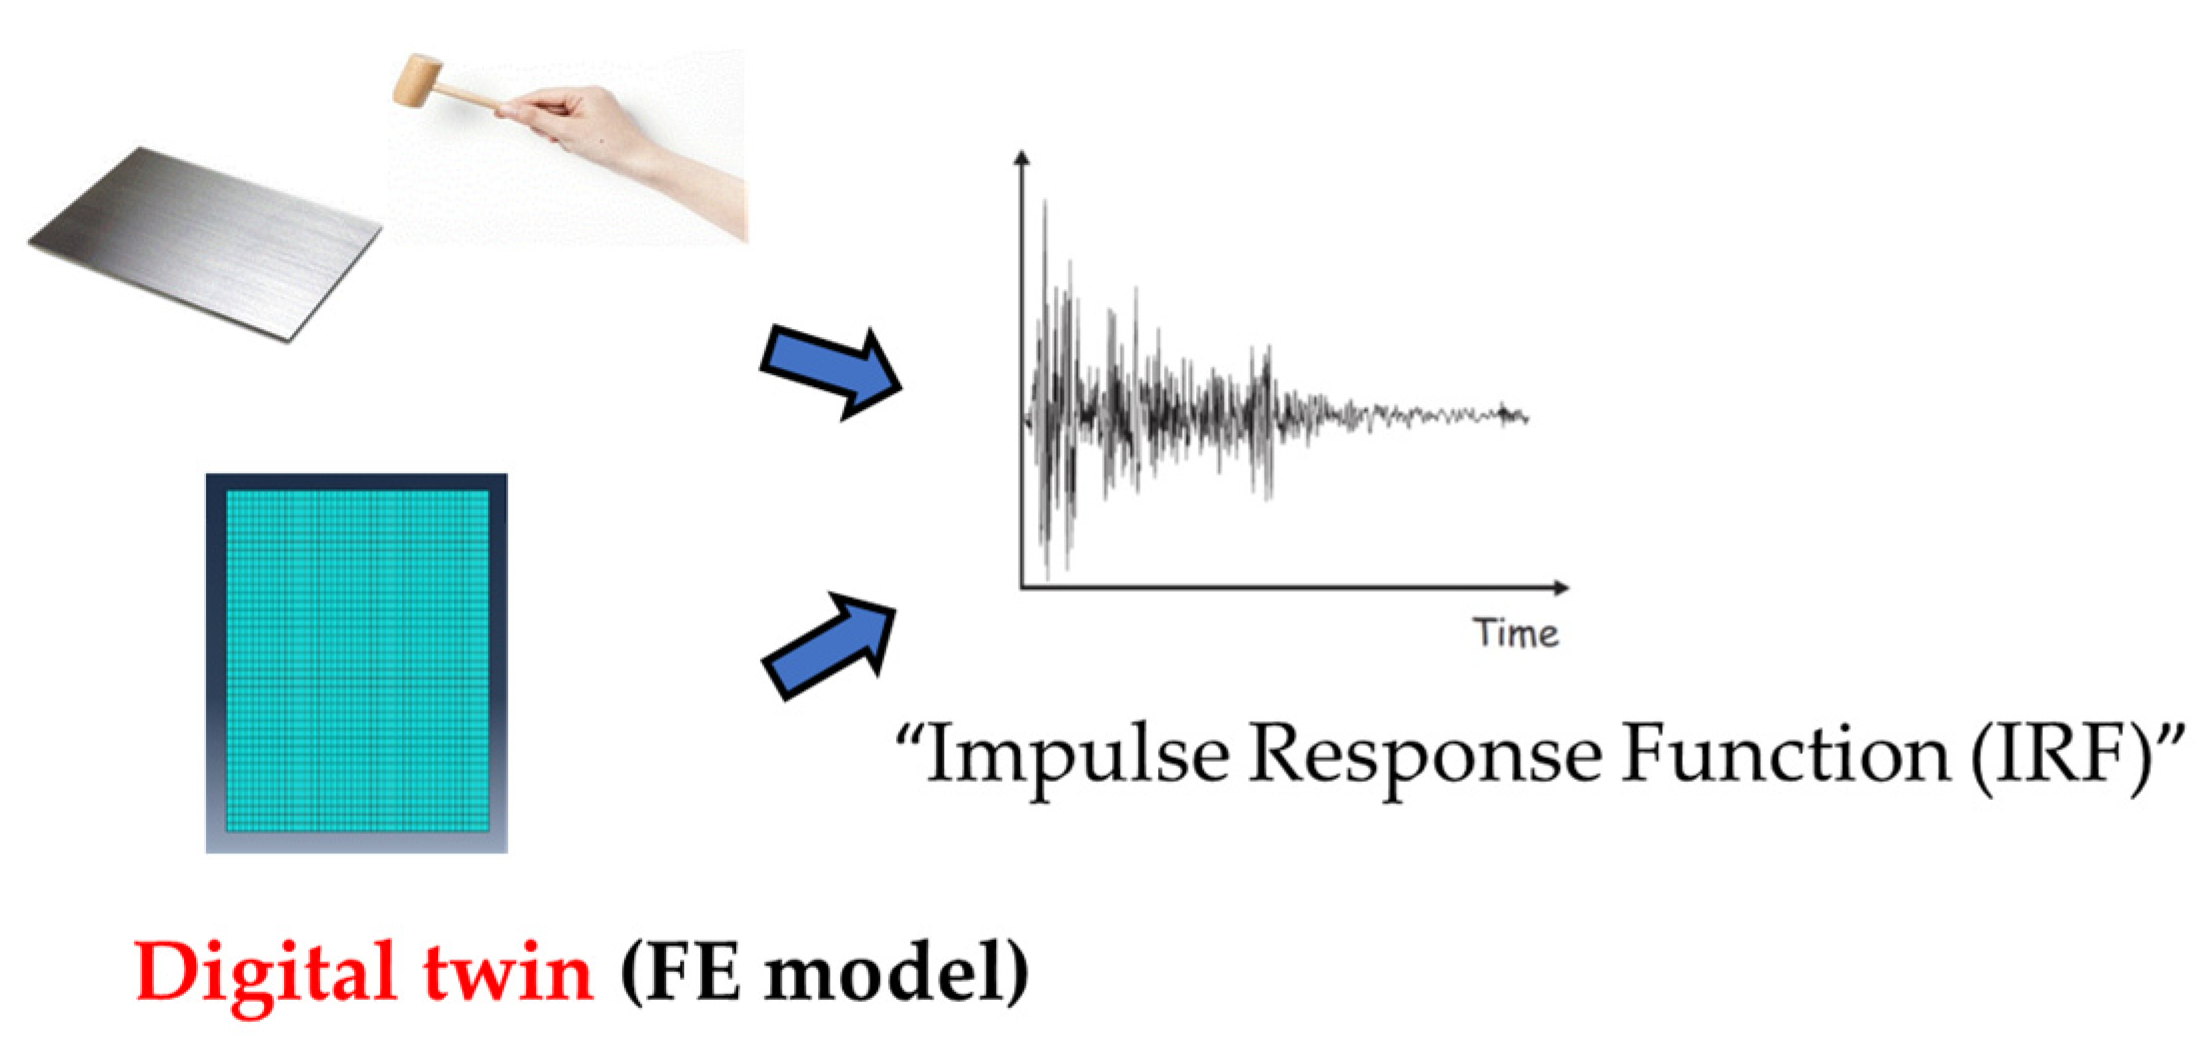
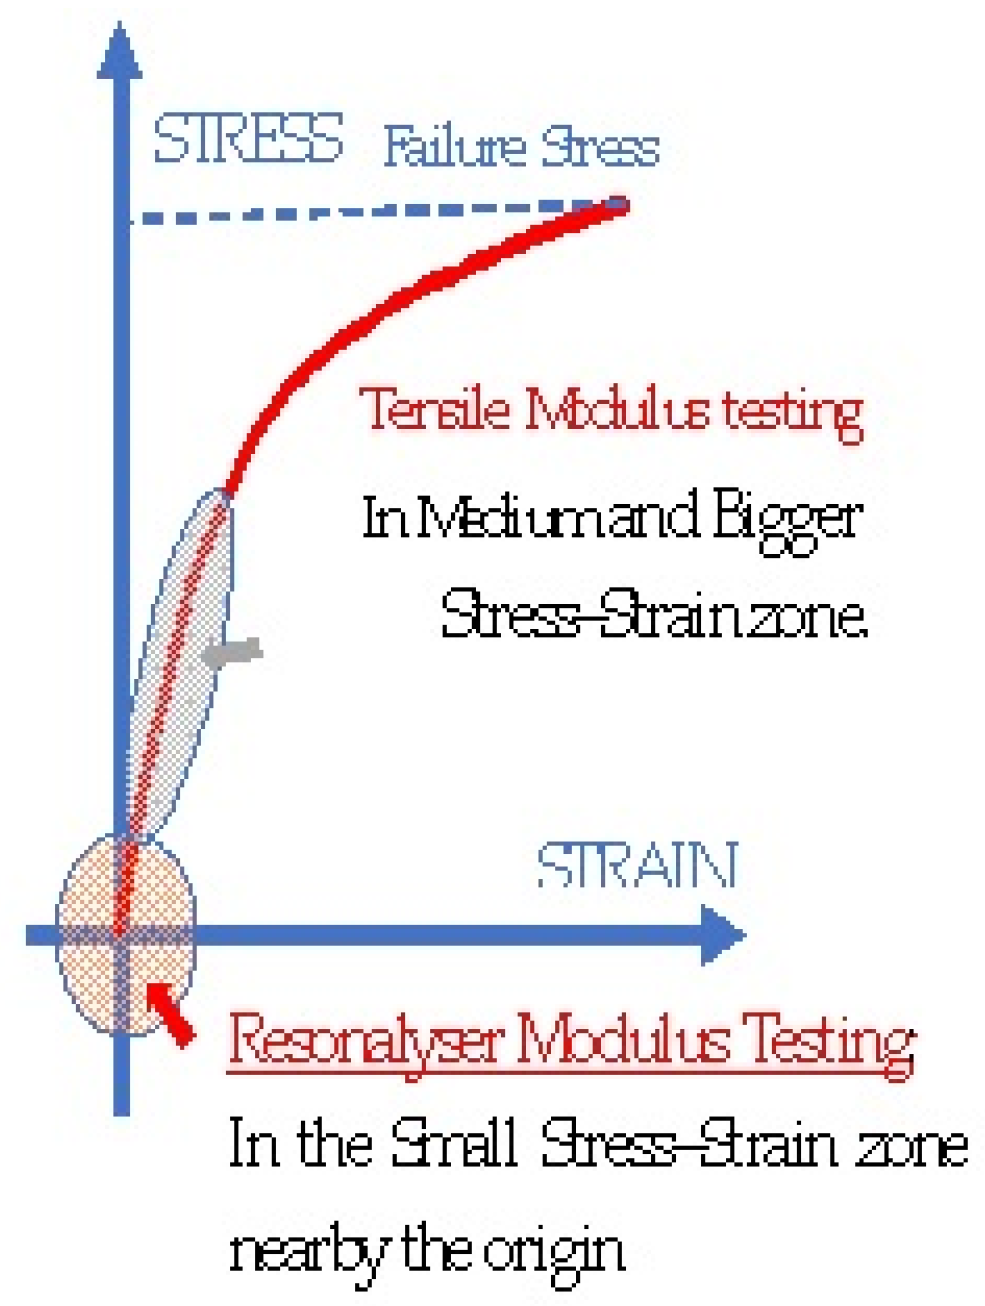
2.1. The Resonalyser Procedure

The Resonalyser procedure is a multi-sample IET that extracts the resonance frequencies and damping ratios from the IRF measured on a thin rectangular test plate and two test beams. The orthotropic engineering constants are parameters in numerical models. The parameters are iteratively updated till the numerical models become digital twins of the test samples. The test beams are cut along two in-plane orthotropic directions (Figure 1). The length/width aspect ratio of the actual test plate L/W is adjusted according to the following formula (3):
L W = f 1 L 2 f 2 L 1 2
The frequencies f1 and f2 are associated with the fundamental bending vibration modes of the two test beams. L1 and L2 are the lengths of the beams. The aspect ratio L/W creates a so-called “Poisson” plate. The first three resonance frequencies of the Poisson plate are always associated with torsion, saddle, and breathing vibration modes (see Figure 3).
If the length-to-thickness ratio of the plate is higher than 50, the vibration modes are nearly not influenced by transverse shear deformations. Since the vibration modes of the first three resonance frequencies are known, no OMA or EMA to identify the type of vibration mode sequence is necessary. An interesting property of a Poisson plate is that the saddle and breathing vibration modes are very sensitive to variations in Poisson’s ratio, as shown by Lauwagie [39]. The knowledge of the type of vibration mode, together with the measured resonance frequencies, allows generating good starting values for the engineering constants G12 and v12 with the virtual field method (see, e.g., Pierron [40]). Detailed mathematical derivation can be found in Sol et al. [41]. Good starting values for E1 and E2 are obtained by applying IET on the two test beams. After obtaining good starting values, further convergence to the final values can be performed using a sensitivity-based gradient method, as shown by De Baer [15].
The same three test specimens (two beams and one Poisson plate) used for the identification of the elastic part of the engineering constants are used for identification of the imaginary part. The IET provides the modal damping ratios associated with the fundamental bending vibration modes of the test beams and the modal damping ratios of the first three vibration modes of the Poisson plate. The decaying signal after impact (see Figure 2) is curve-fitted in the time domain with the formula:
x ( t ) = X sin ( ω t φ ) · e ξ ω t
with vibration amplitude X, circular frequency ω, phase φ , and the modal damping ratio ξ .
The tangents δ of the Young’s moduli E1 and E2 are found from the measured damping ratios of the freely suspended beam bending modes.
2 ξ B e a m 1 2 ξ B e a m 2 = 1 0 0 1 tan δ ( E 1 ) tan δ ( E 2 )
A second set of Equation (6) yields the tangents δ of the orthotropic stiffness matrix C i j * using the weighting coefficients G for the three first-plate vibration modes.
2 ξ T o r s i o n 2 ξ S a d d l e 2 ξ B r e a t h i n g = G 11 G 12 G 13 G 14 G 21 G 22 G 23 G 24 G 31 G 32 G 33 G 34 tan δ ( C 11 ) tan δ ( C 22 ) tan δ ( C 12 ) tan δ ( C 66 )
The detailed mathematical derivation of components G can be found in Sol et al. [41]. The knowledge of tan δ ( E 1 ) and tan δ ( E 2 ) and relationship (1) allows solving for tan δ ( v 12 ) and tan δ ( G 12 ) .
For room temperature measurements, the test plates and beams and beams are freely suspended on a frame. A small accelerometer fixed on the test samples with bee wax is connected to a signal conditioner box and a data acquisition card through a USB connection with a PC (see Figure 4).
The Resonalyser software guides the measurement of the IRF and the creation of the digital twins (see Figure 5).
The numerical models of the beams and plate are based on the finite element method. These models must replicate the geometry and mass of the physical specimens. The sole unknown parameters within the models are the engineering constants, which are iteratively refined until the computed resonance frequencies, derived from solving an eigenvalue problem, match with the experimentally measured values. The models that possess the accurate engineering constants at the conclusion of the iterative process are referred to as digital twins.
Due to the low excitation level of the IET, the obtained values for the engineering constants of the Resonalyser are situated near the origin of the stress–strain curve (Figure 6).
The global uncertainty of the results for a mixed numerical experimental method (MNET) receives contributions from the measurement errors and inaccuracies of the numerical model (digital twin). Even with simple affordable equipment, the measured frequencies with the IET are typically accurate within 0.1%. The accuracy of a finite element model (FEM) of a thin beam or a thin plate can also be kept easily lower than 0.1%. The real source of uncertainties of an MNET for composite materials is the sample heterogeneities (thickness, material stiffness, density, and local anisotropies). The Resonalyser is a multi-sample method and therefore can estimate the uncertainty caused by heterogeneities in the different samples. The digital twins use the same engineering constants for the computation of the resonance frequencies of the beams and the plate. Perfect sample homogeneity would lead to perfect agreement between experimental and computed resonance frequencies (within the limit of the 0.1% experiment and 0.1% model uncertainty). The software gives high confidence to the plate measurements and less to the beam measurements, resulting in nearly perfect matches for the plate and—in case of heterogeneities—lesser-quality matches for the beams. The deviations for the beams in the Resonalyser software are used to estimate the uncertainties of the identified engineering constants using the sensitivity matrix method [16]. All isotropic and orthotropic materials can be tested. The precision of the test outcomes is critically dependent on the quality of the test specimens, which must exhibit flat, homogeneous material properties and maintain a consistent thickness. The plates and beams are modeled as thin samples, necessitating a length-to-thickness ratio preferably exceeding 50.
Identification with the Resonalyser procedure can be carried out with three plate frequencies (torsion, saddle, and breathing modal shapes) or with only two (torsion and breathing). An example of an output screen of the Resonalyser software is given below (Figure 7). More examples and illustrations can be found on the Resonalyser website [42]. Processing three frequencies is recommended in case the heterogeneity of the plate is high. Two frequencies are sufficient for good-quality plates (see Figure 7). Figure 7 shows the identification results of a PA6/Organo glass composite at 20 °C using two plate frequencies and two beam frequencies.
The engineering constants obtained are averaged mainly over the plate area. Since the IET is non-destructive, the beam and plate samples can be used afterwards for additional tensile testing to measure failure stress, without the need of recording strains. This makes tensile tests faster and cheaper [43]. The same beam specimens are used for validation of the Young’s modulus E1 of beam 1 and Young’s modulus E2 of beam 2 with a three-point bending test. The results are shown in Table 1.
The Young’s modulus for three-point bending is calculated according to ASTM D790 [44]. The formula used in D790 is shown in Equation (7).
E = m L 3 4 b d 3
With a test uncertainty of 5%, the values of the Young’s modulus of the test beams match the Resonalyser values for E1 and E2 that can be found in Figure 7.
The problems and solutions for automated IET testing in a climate chamber are discussed in the next paragraph.

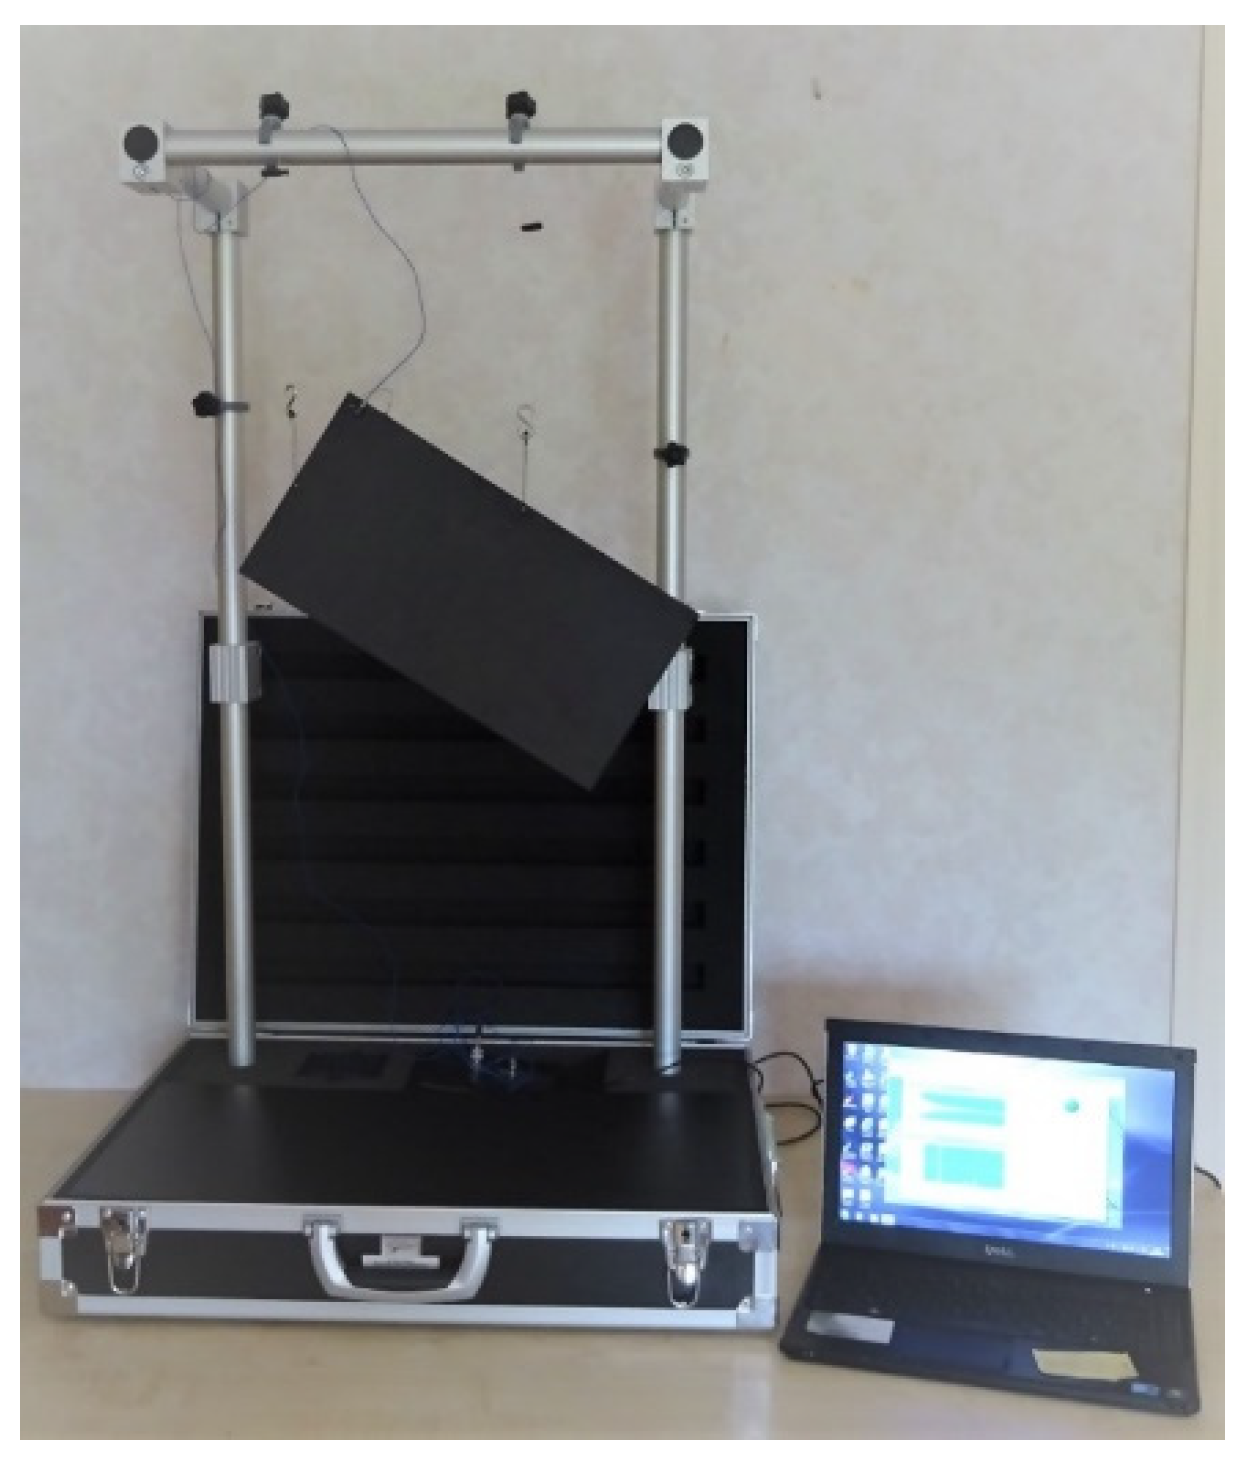
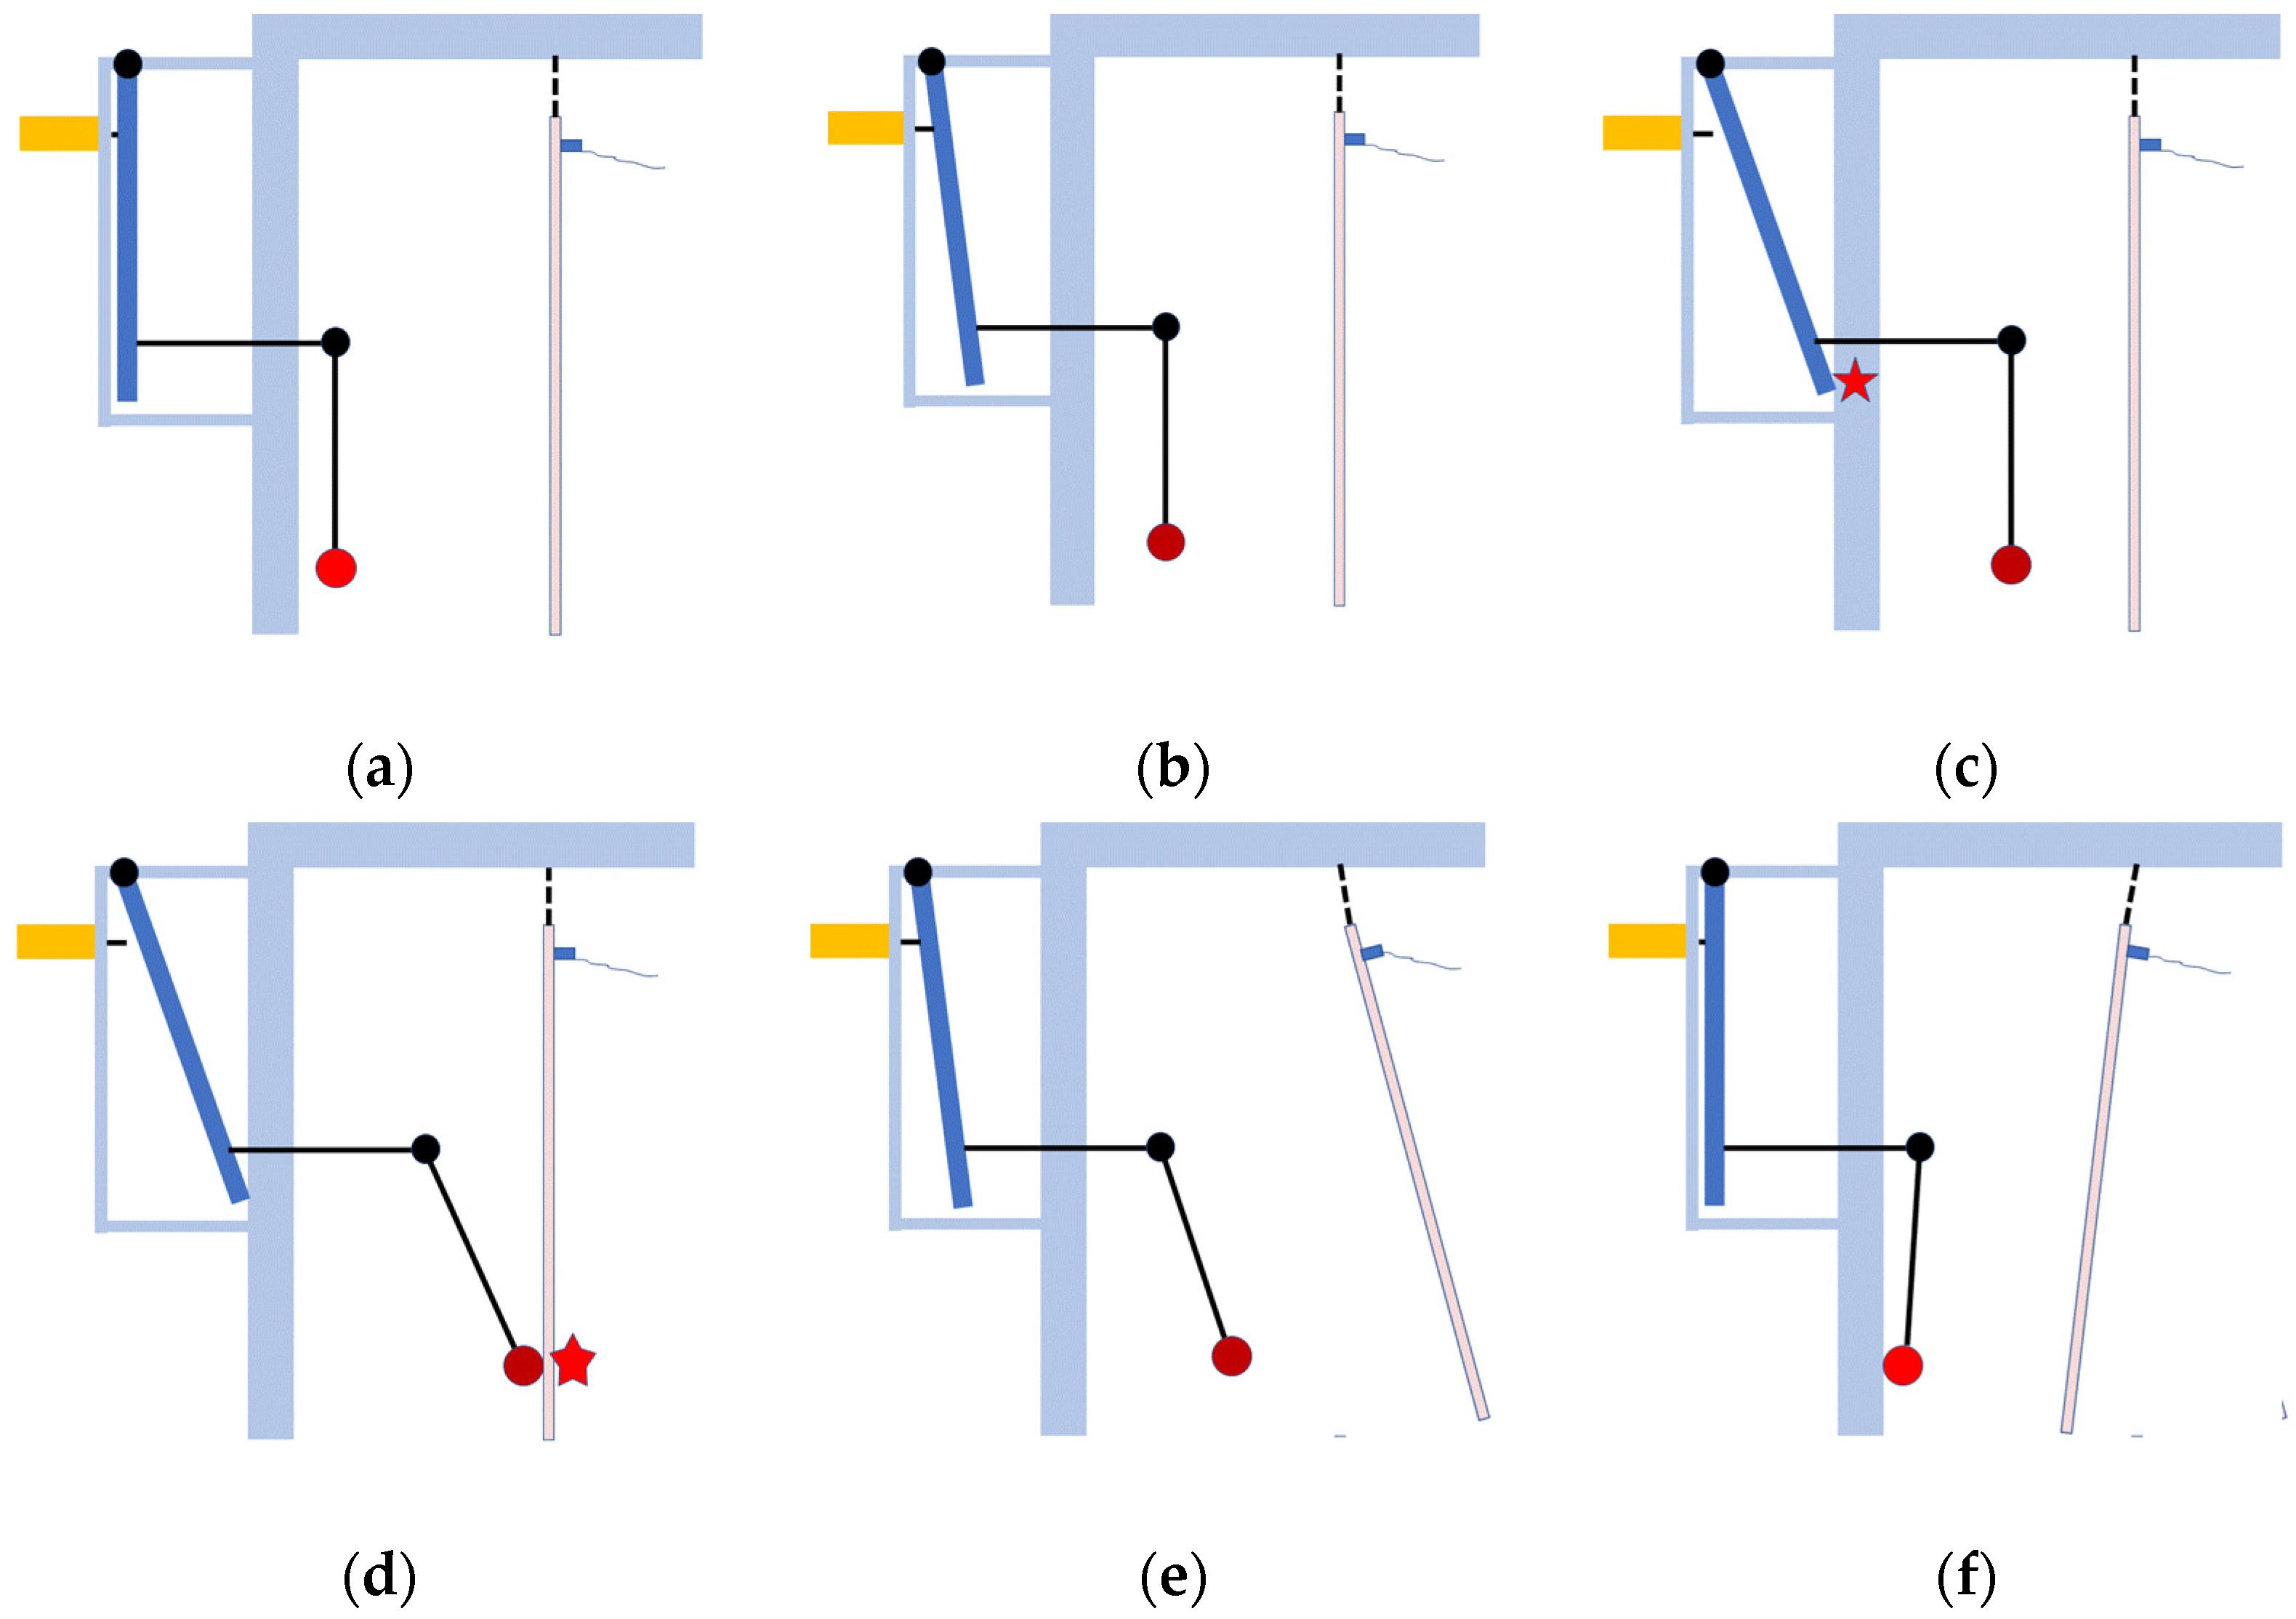
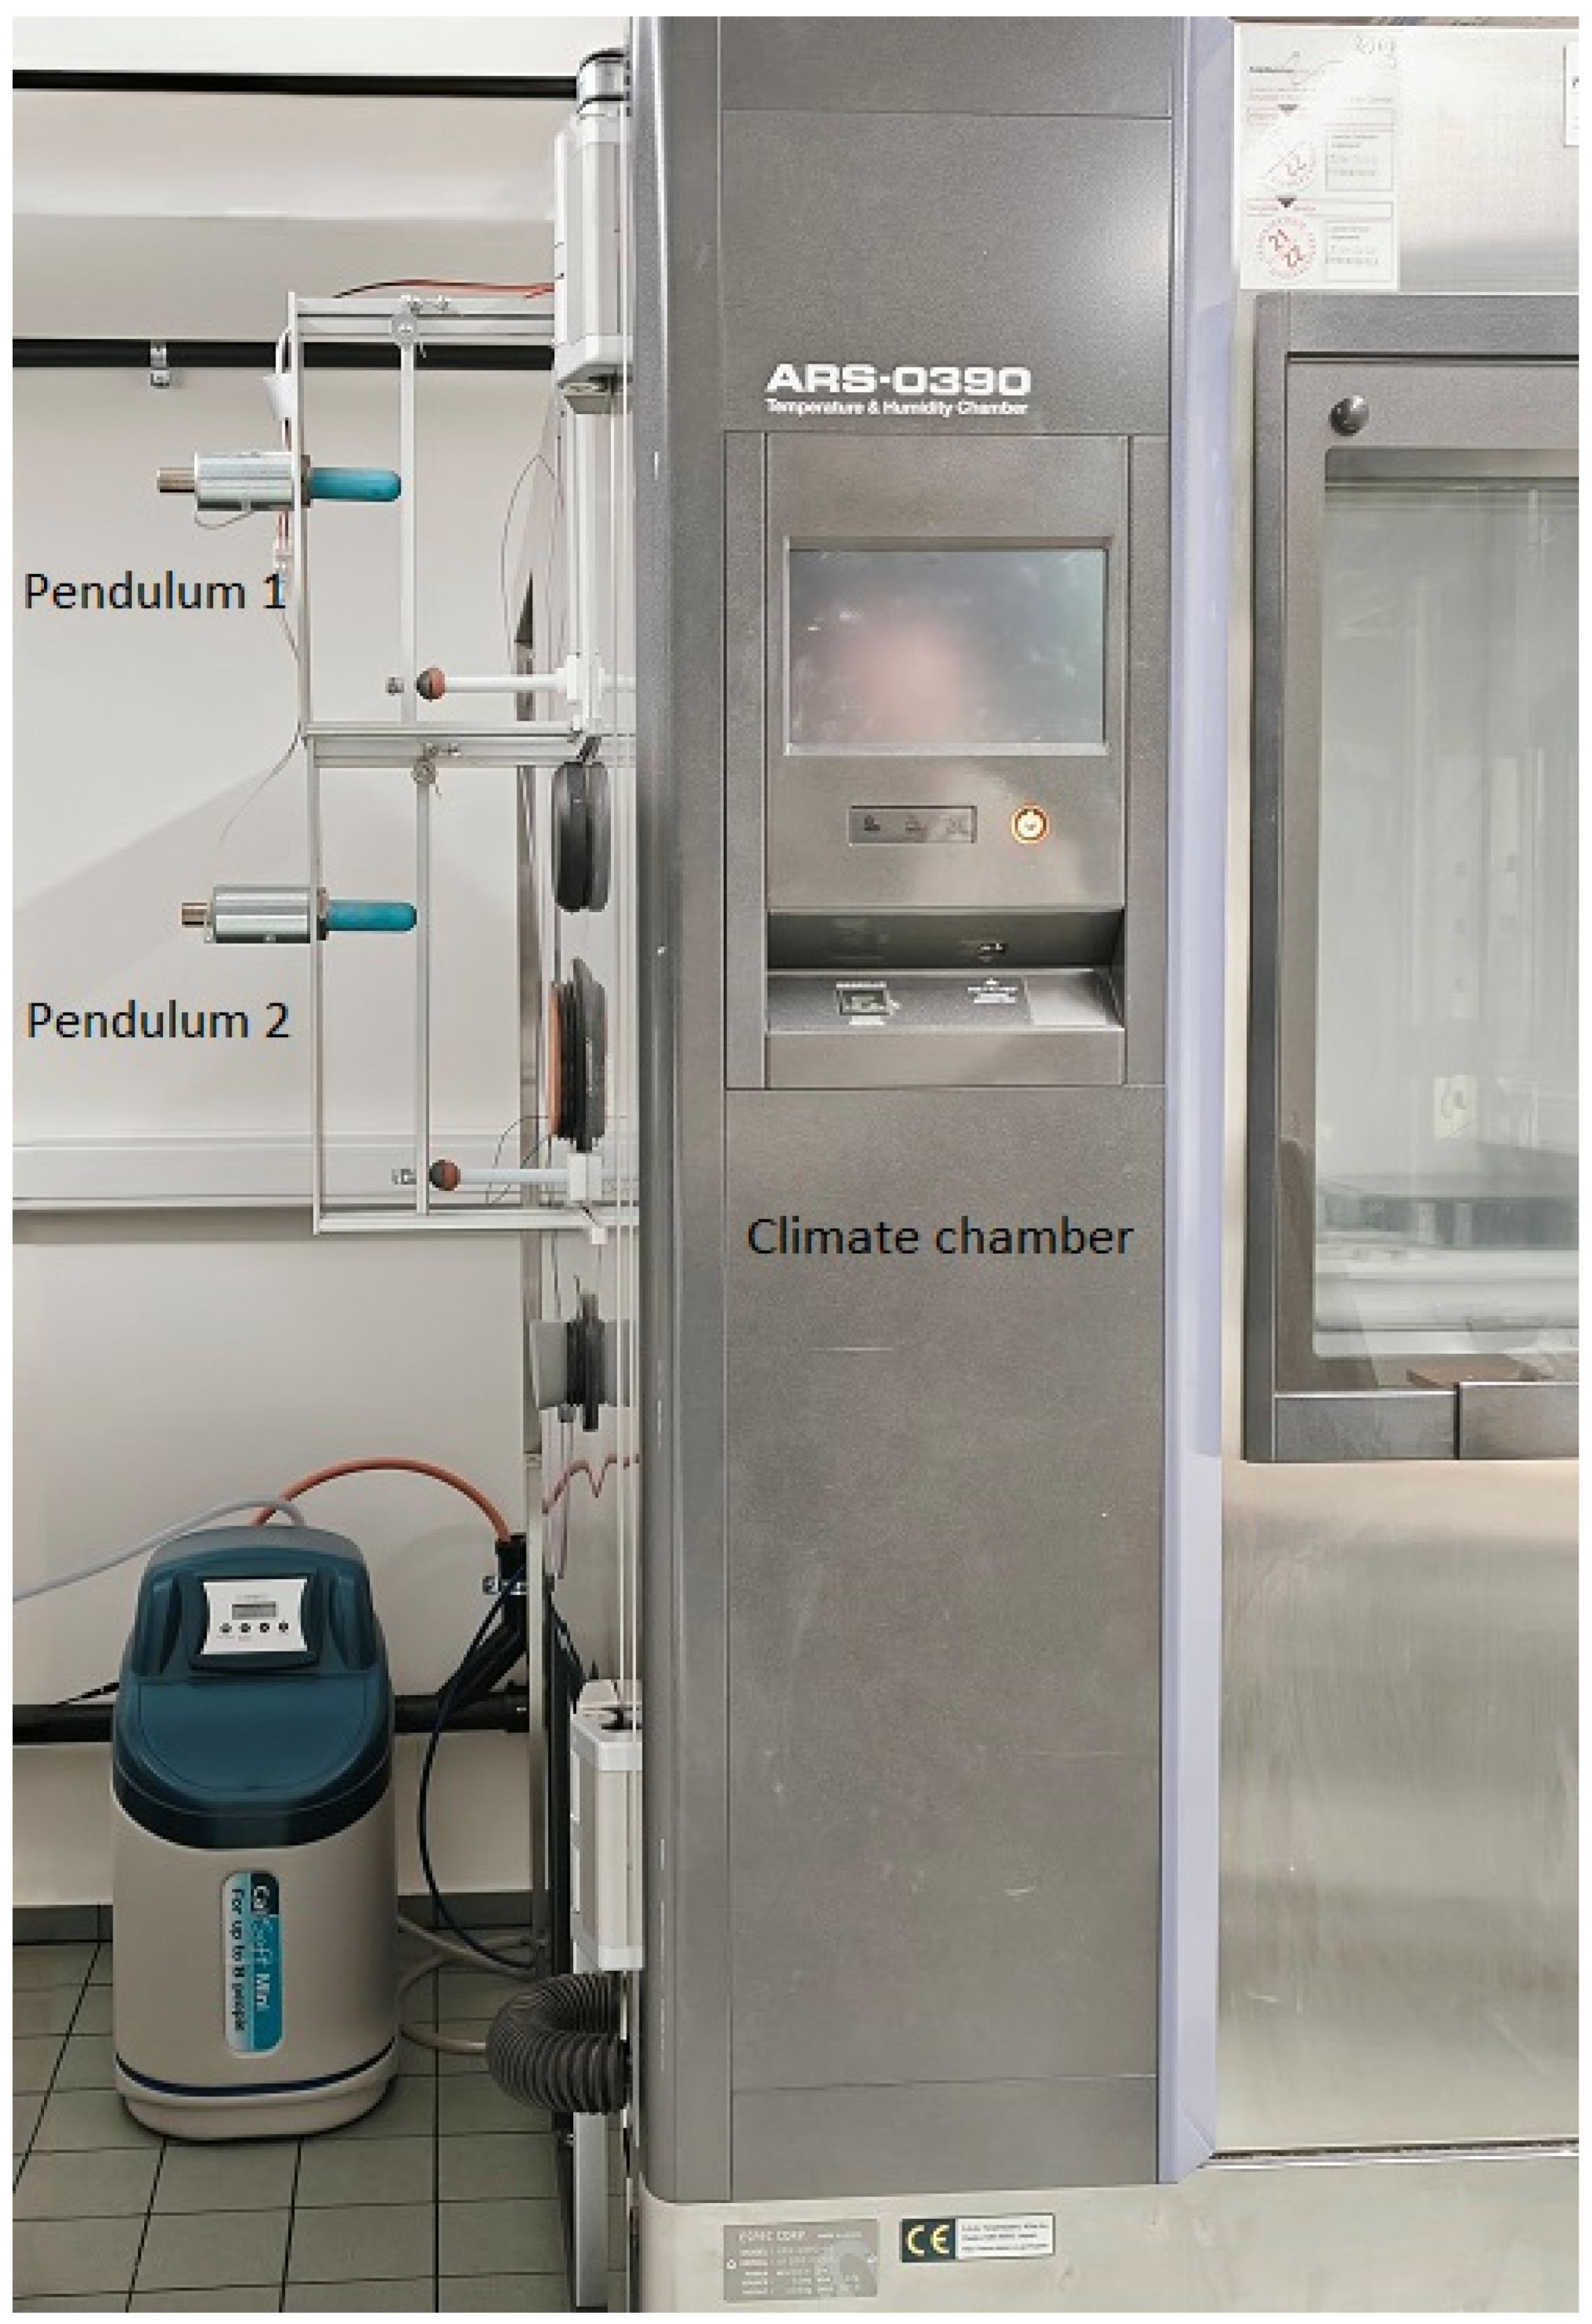
2.2. The Automated Pendulum Excitation

Applying an impact using a lateral stick driven by pneumatic or electromechanical force may seem straightforward. However, delivering a controlled impulse to a freely suspended sample is challenging due to the rigid body oscillations of the suspended samples. These oscillations are inevitable in a climate chamber or temperature cavity as the air fans distribute air to achieve a uniform temperature. Consequently, the exact position of the sample is uncertain, leading to impacts that may occur too early or too late, with excessive or insufficient force. As a result of the impulse, the suspended sample oscillates considerably. To prevent multiple impacts, the lateral stick must be retracted swiftly immediately after the impulse, which is cumbersome to realize practically. A straightforward solution to these issues is pendulum excitation (Figure 8). Figure 8 shows a freely suspended sample inside a climate chamber, with the pendulum mechanism externally mounted on the chamber. The pendulum is connected through a small aperture in the chamber wall.
The pendulum mechanism is actuated by a solenoid (yellow in Figure 8a). Upon activation by a voltage, the solenoid propels a lever (dark blue in Figure 8b), which strikes the wall of the climate chamber (light blue in Figure 8c). Due to inertia, the pendulum is set in motion until it impacts the sample (Figure 8d). The sample receives an impulse and oscillates away, while the pendulum mass rebounds. Gravity pulls the lever back to the initial position (Figure 8e). All components of the pendulum mechanism return to their starting positions, while the sample continues to oscillate (Figure 8f). There is only a single impulse, with no multiple impacts.
The voltage on the solenoid can be adjusted to tune the launching force. The size of the ball on the pendulum can be chosen to ensure it rebounds after impact. The material of the ball can be chosen to achieve the desired spectrum of excited frequencies (hard materials excite higher frequencies, while soft materials transfer more energy in lower frequencies). The length of the pendulum can be adapted to ensure the impulse occurs at the correct location.
The identification of the engineering constants can be performed using four measured frequencies and damping ratios: the two test beams and the torsion and breathing vibrations modes of the Poisson plate. To accurately measure the damping ratio, the suspension must not add external influences. Therefore, the beams are suspended at the location of their nodal lines (Figure 9a). The nodal line of the breathing vibration mode forms an ellipse, while the nodal lines of the torsion form a cross. A suitable suspension position is at the intersection of these nodal lines (Figure 9b). The excitation position for the beams is at the center, while the excitation position for the plate is in the lower corner (see Figure 9b).

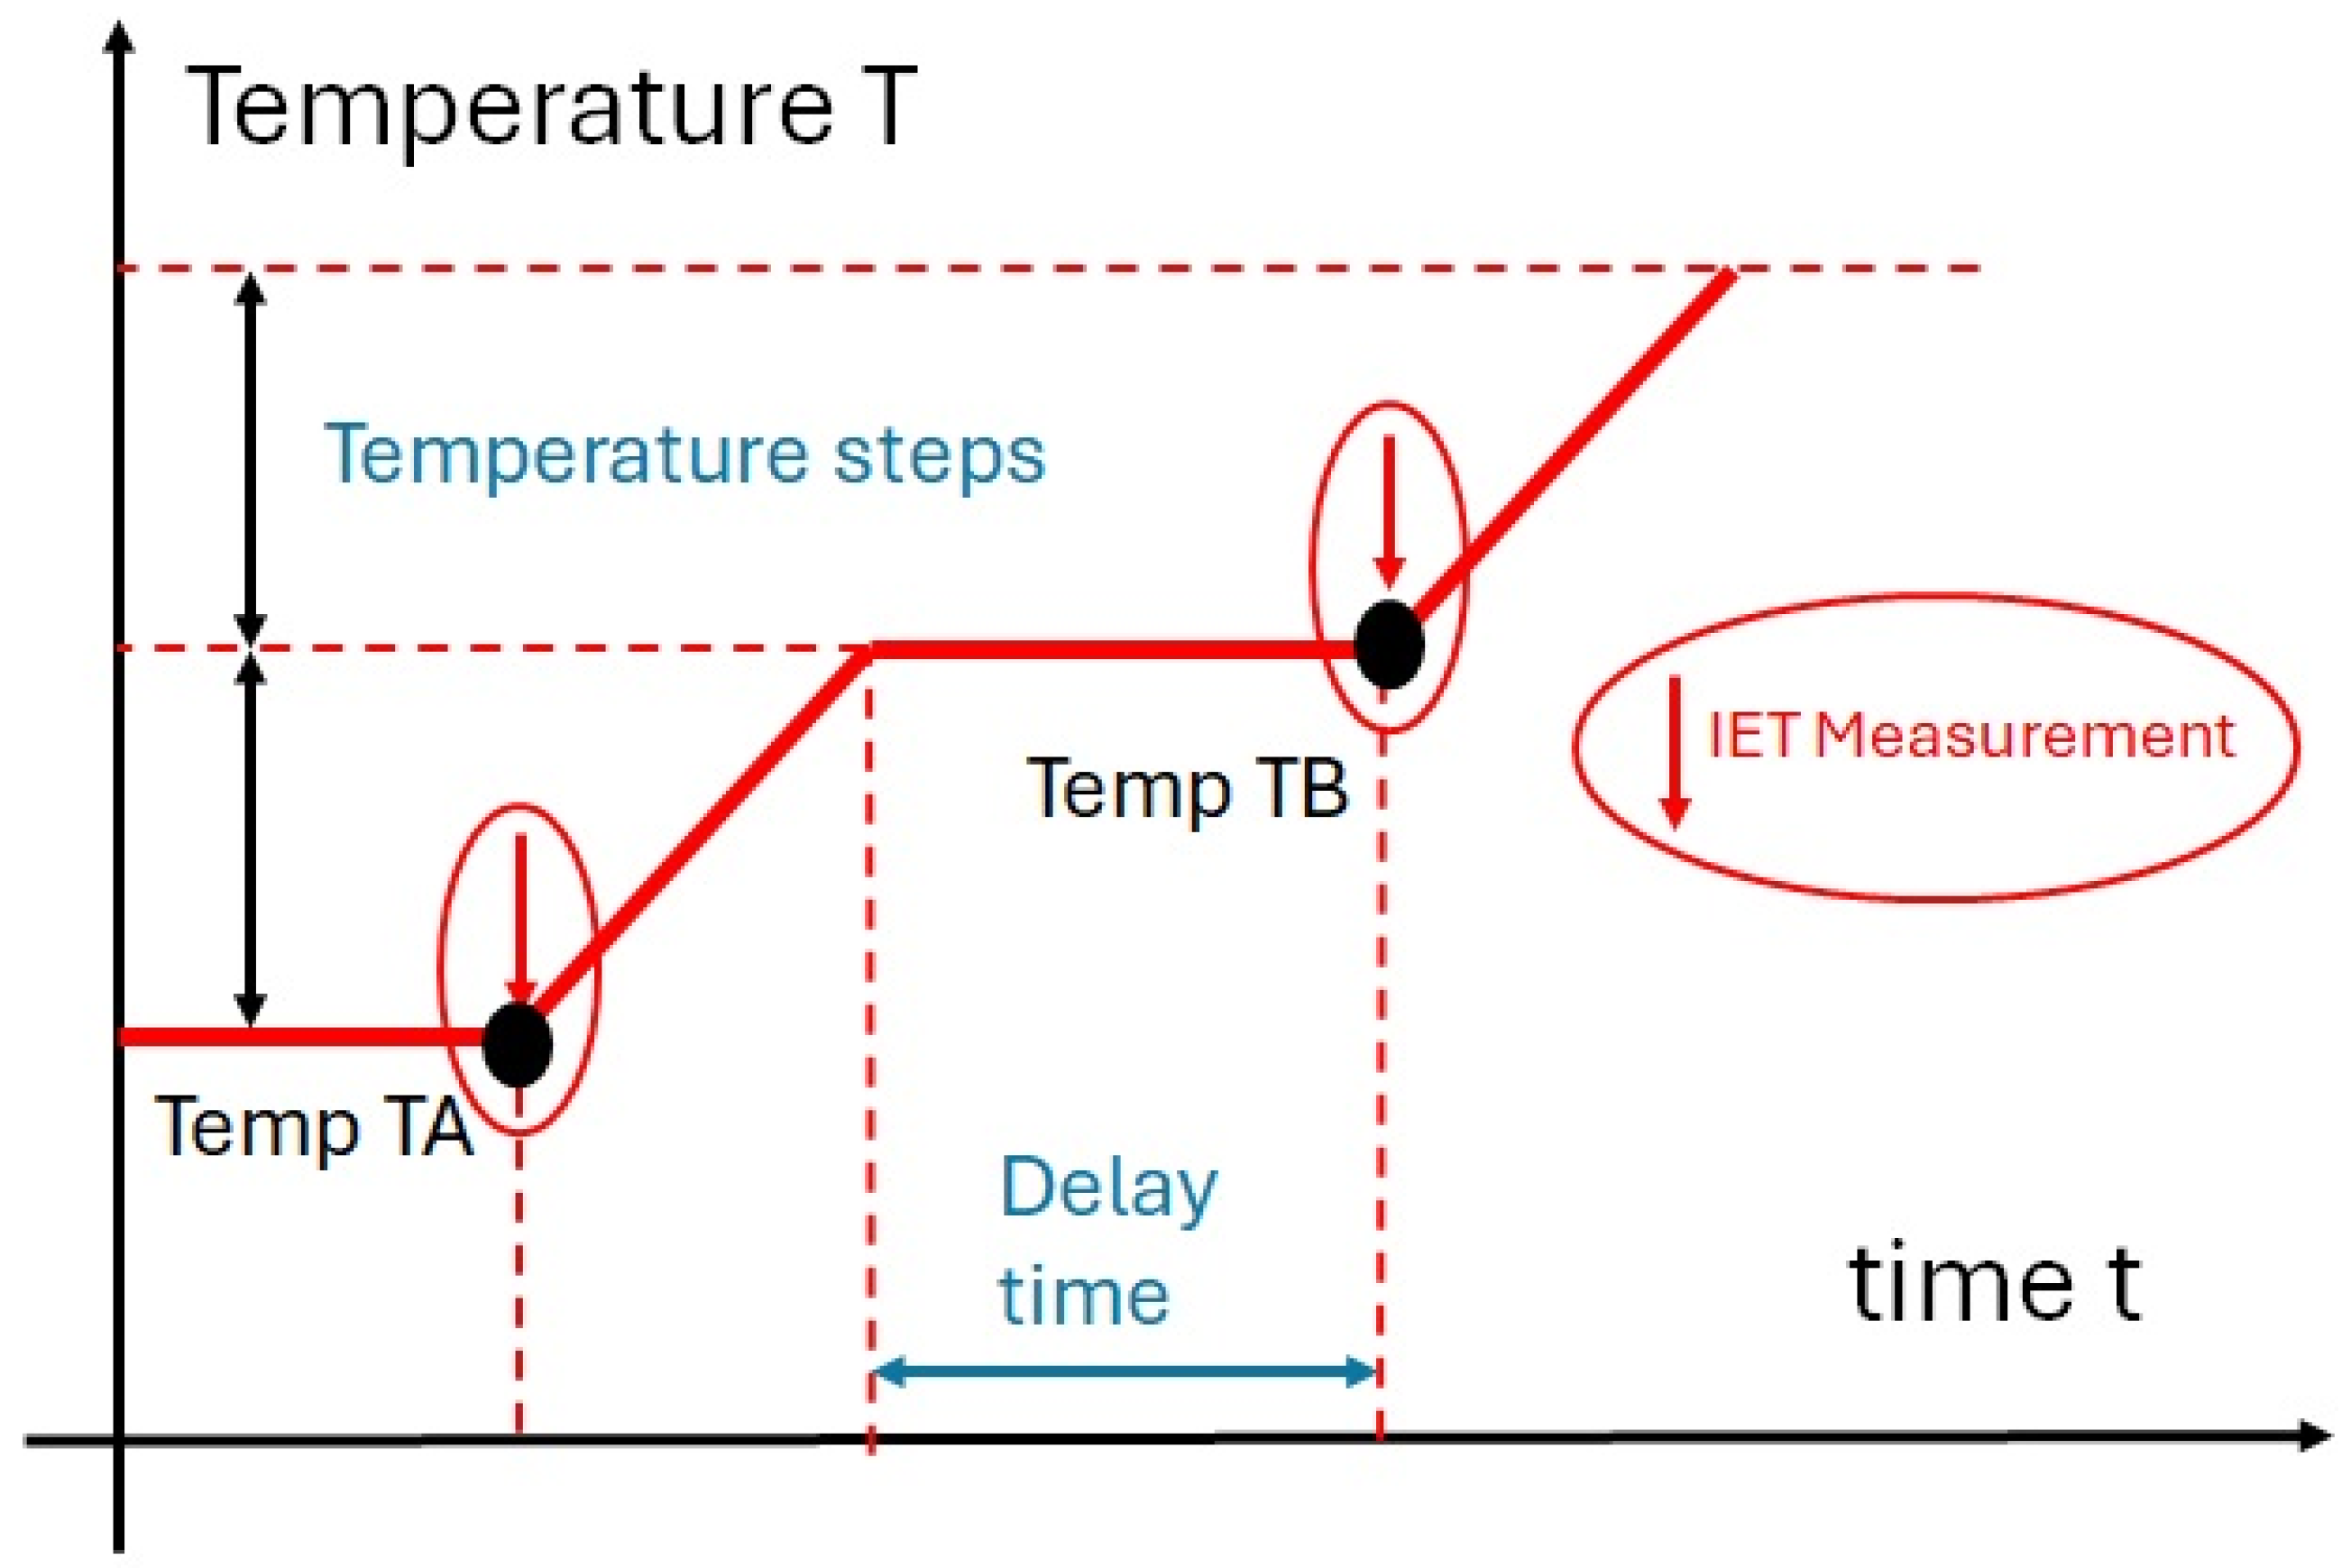
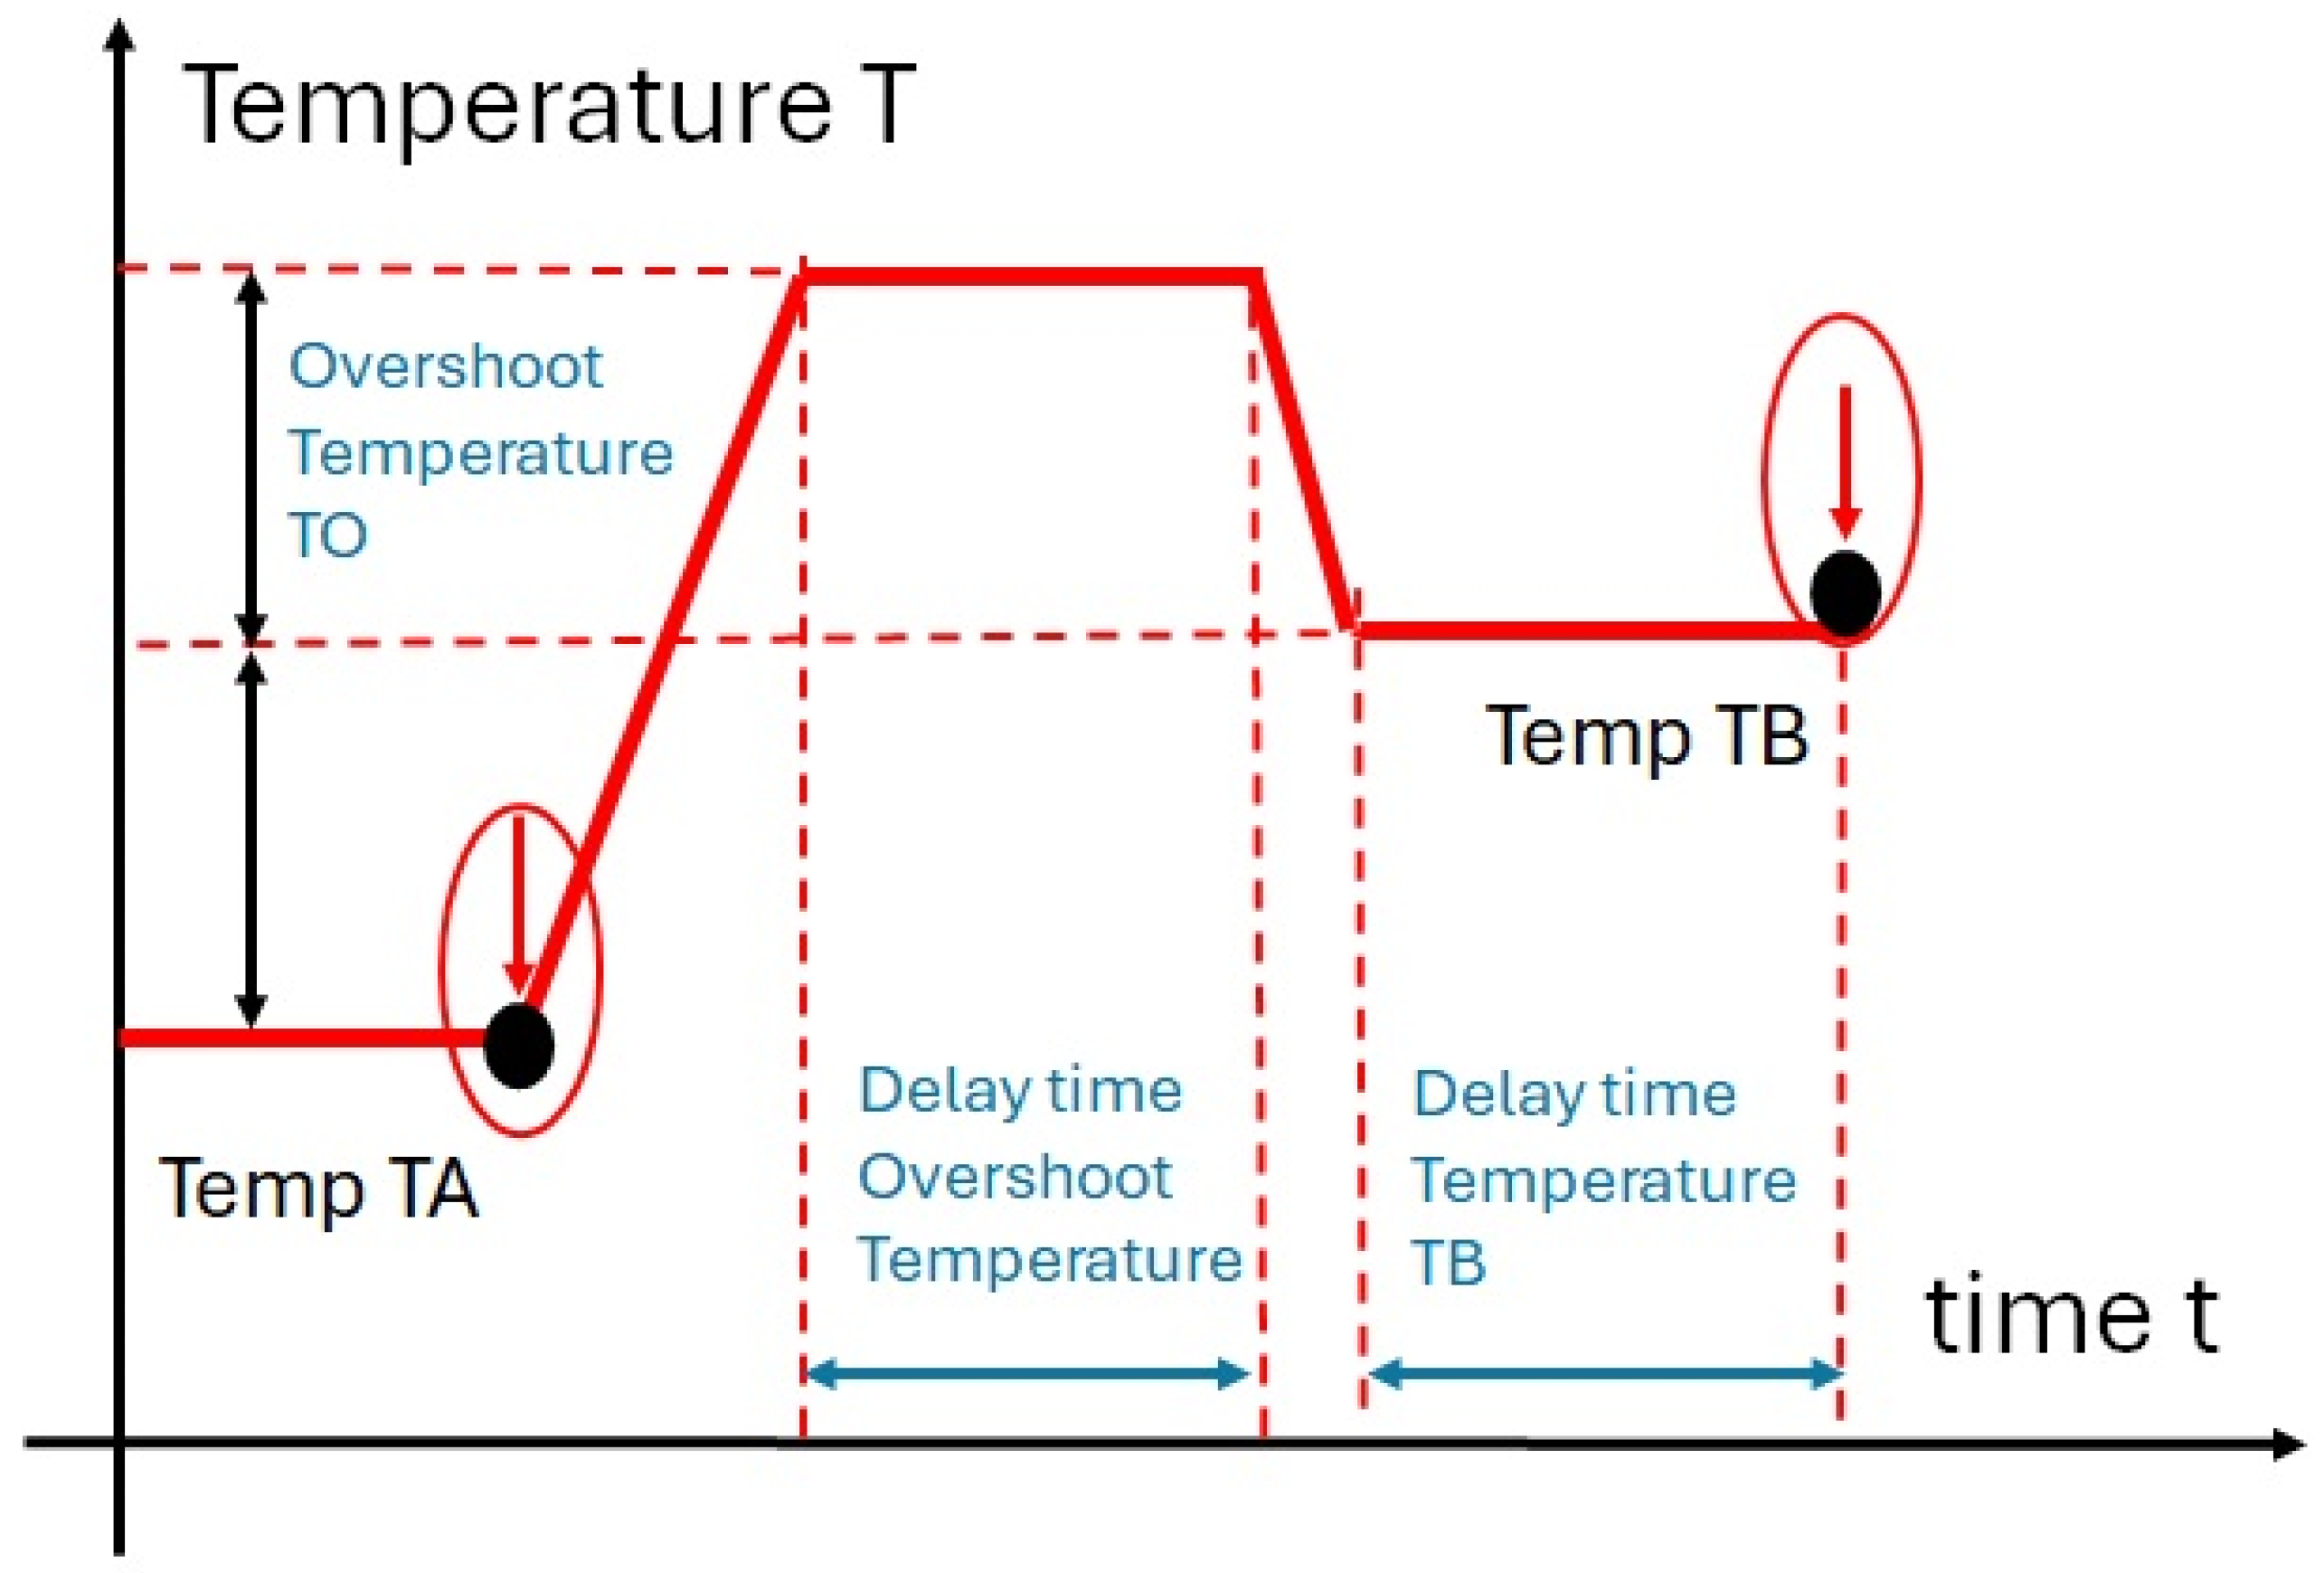
2.3. Temperature Control

The objective of the extended IET on beams and plates is to automatically measure the IRF at specified temperatures and programmed time intervals. It is essential that the temperature distribution within the sample remains homogeneous across all temperature steps. Heat conduction in composite material is a complex phenomenon. In a review article by Delouei et al. [45], different existing analytical solutions for heat conduction in multi-layer and composite materials were reviewed and classified in rectangular, cylindrical, spherical, and conical coordinates. This review highlights that despite decades of research, new studies continue to emerge, offering deeper insights into heat conduction in multi-layer composites. This emphasizes the challenges and shortcomings in current research, guiding future investigations.
In this study, a challenge arises in transitioning the isothermal temperature distribution of a freely suspended sample from one value to another, as this process requires time. The transient heat conduction in a thin plate is influenced by the convection occurring at the surfaces. The temperature profile varies over time at different internal positions, with the surface temperature changing relatively quickly, while the temperature at the sample’s mid-plane changes more slowly. Key control parameters include the convection heat transfer coefficient h, the thermal conductivity k, the specific heat capacity Cp, and the density ρ of the composite material of the sample [46]. The practical question is estimating the duration required to transition from an isothermal state at an initial temperature (Ti) to an isothermal state at another temperature (T).
The time evolution of the temperature T at the center of a sample exposed to a surface temperature TS is described by Formula (7):
T = T S + T i T S A e 4 α λ 2 D 2 t
In (8), T represents the temperature at the center of the sample, t is time, D is the sample’s thickness, TS is the surface temperature, and α is the thermal diffusivity. Coefficients A and λ are functions of the Biot number Bi:
B i = h D 2 k
α = k ρ C p
The coefficients A and λ for specific Biot number values can be found in tables or computed using numerical finite element models [46]. The Resonalyser software incorporates such thermal numerical models. When the value of center temperature T approaches TS, the sample can be considered isothermal. The resonance frequencies and damping ratios of the beams and plate can be measured by IET at the subsequent isothermal states. After measuring and identifying the engineering constants at this state, a new temperature step can be set. Before setting the temperature steps and timing values for the automated procedure, the delay time (see Figure 10) required to reach an isothermal state at different steps must be computed based on the assumed known thermal parameters of the sample. For given thermal properties of the test samples, the temperature in the climate chamber at different temperature steps and the time durations can be set by the automated control program. Figure 10 illustrates a simple temperature and time-stepping program starting at an isothermal state with temperature TA and progressing towards temperature TB.
Theoretically, it takes an infinite amount of time to reach the new isothermal state. Therefore, a more elaborate approach with an overshoot temperature step is convenient (see Figure 11).
With an overshoot temperature (TO) at the sample surfaces, the temperature at the center T will more quickly reach or even surpass the desired temperature TB. Subsequently, with the desired temperature TB at the surface, the samples will evolve faster to an isothermal state at TB. The delay times for the overshoot and temperature TB together with the value of the temperature steps must be set before starting the automated measurement procedure.

2.4. Measurement Procedure
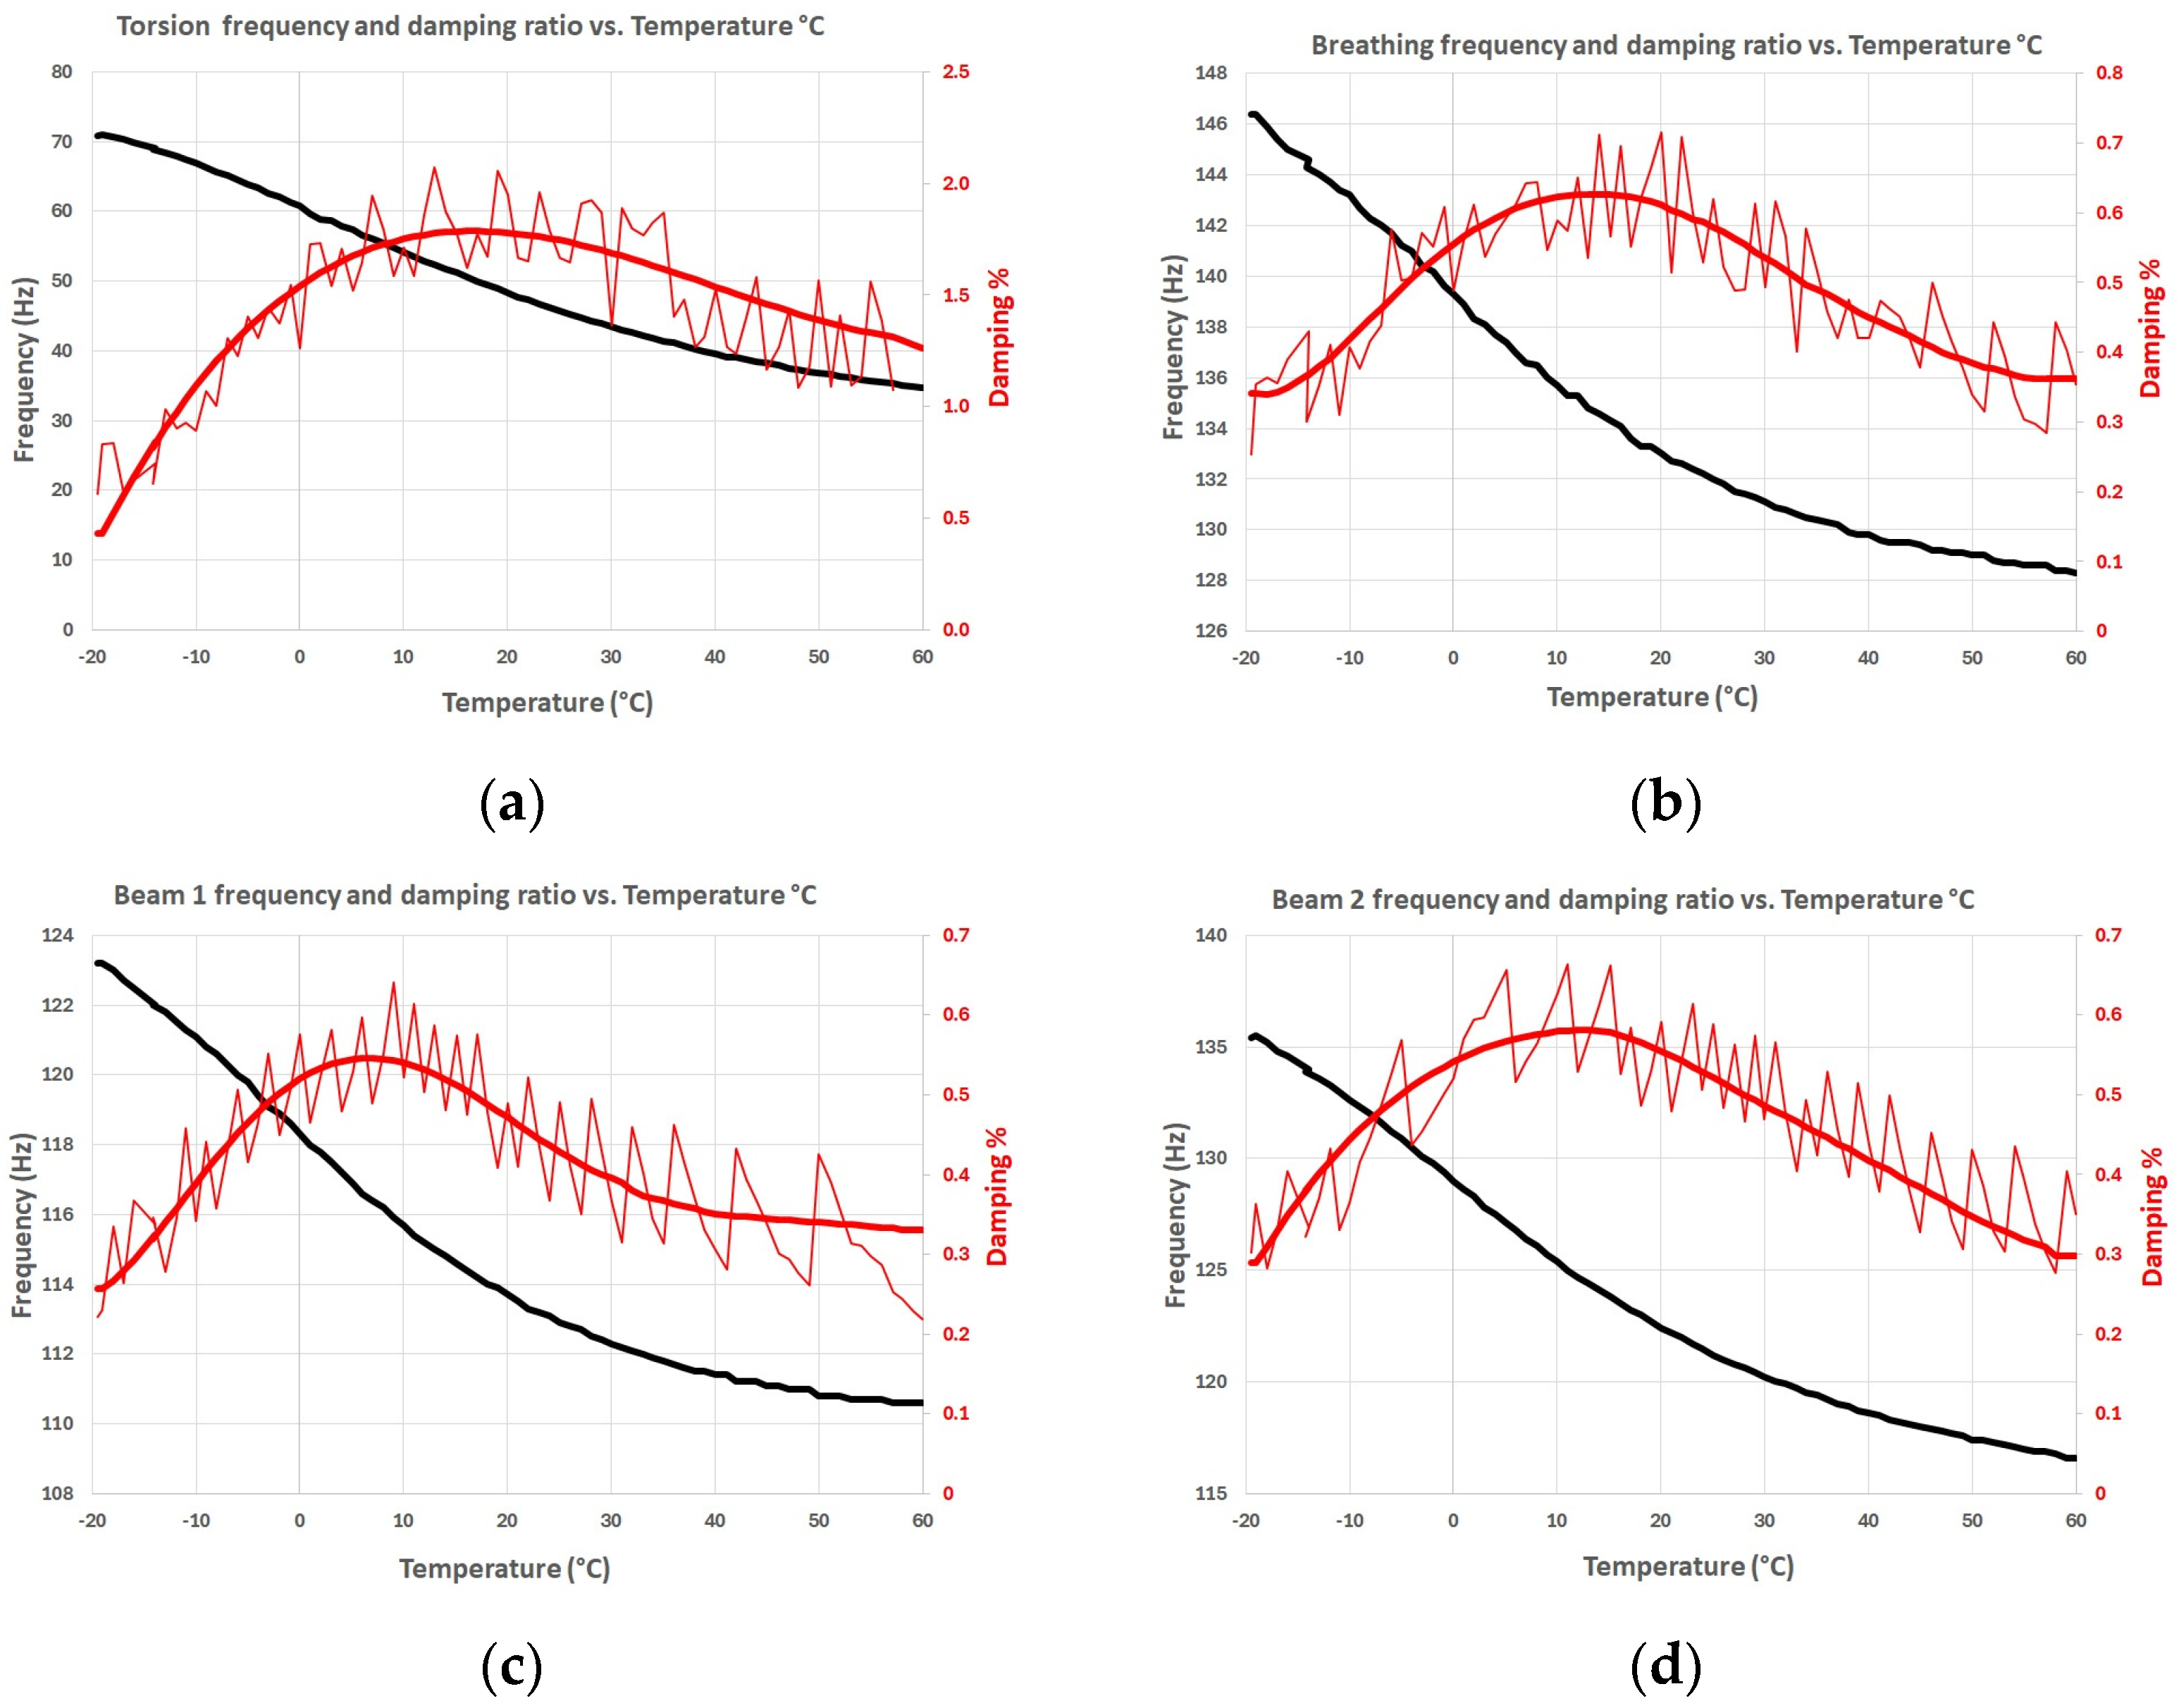
A climate chamber is outfitted with three pendulum excitation units corresponding to three measurement channels. The two test beams and the test plate are freely suspended within the climate chamber cavity. Each test sample is equipped with a 0.19 g solid DJB company Micro Miniature Piezo-Tronic IEPE Accelerometer-A/128/V.
Pendulum unit 1 excites the suspended test plate on channel 1, while pendulum units 2 and 3 excite suspended beam 1 and beam 2 on channels 2 and 3, respectively. Figure 12 illustrates the left side of the climate chamber with pendulum units 1 and 2 attached. The frequencies and damping ratios of the torsion and breathing modal shapes are derived from the measured impulse response function (IRF) of the test plate on channel 1. Similarly, the frequencies and damping ratios of beams 1 and 2 are derived from the IRFs measured on channels 2 and 3. The measurement interval, including the initial and final temperatures, is set along with the required temperature steps and delay times. Following the measurement of the IRFs on the three channels, the identification of the engineering constants is performed using the Resonalyser software. The frequencies and damping ratios at each temperature step, along with the four engineering constants, can be monitored in real time on graphs displayed on a computer screen.

3. Results

The above-described measurement procedure was applied on a plate comprising six layers of thermoplastic NeomeraTM Polyamide-6 reinforced with Organo glass fabric. Figure 13 shows the original plate. The test beams and test plate were cut out of the original plate.
The size and mass of the prepared test samples are given in Table 2.
The values for the parameters describing the heat transfer of PA6 are as follows:
  • Convection heat transfer coefficient h = 30 W/m2 °C;
  • Specific heat Cp = 1800 J/kg°C;
  • Thermal conduction coefficient k = 0.29 W/m °C;
  • Density rho = 1145 kg/m3.
A temperature step of 1 °C and an overshoot temperature of 1 °C were selected. The delay time for each step was set equal to 2 min. These settings ensured an isothermal temperature distribution in the sample at each step within a 1% margin. The temperature interval had a starting value of −20 °C and a final temperature of 60 °C. Figure 14 shows the result for the measured resonance frequencies and the damping ratios.
It can be observed in Figure 14 that the frequency curves (black lines) are smooth, while the damping curves (thin red lines) show more noise. The damping curves were therefore smoothed with cubic splines before the identification of the engineering constants (thick red lines).
Figure 15 shows the identification results.
The automated measurement cycle started at −20 °C and continued till 60 °C. Comparison between the room temperature results of the Resonalyser at 20 °C (see Figure 7) and the results in the curves at 20 °C (see Figure 15) revealed that the temperature distribution was sufficiently homogeneous. Table 3 shows the comparison of both results at 20 °C.

4. Discussion

Measuring damping is more challenging compared to resonance frequencies. Damping is associated with energy dissipation during a vibration cycle, whereas frequency is related to potential energy. Since the amount of dissipative energy per cycle is significantly lower than the potential energy, the measurement uncertainty for damping is higher, as illustrated in graphs (a–d) in Figure 14. The noise at each temperature step is also influenced by variations in the temperature settings of the climate chamber. At each temperature step, the climate chamber must rapidly achieve and uniformly maintain the new temperature within the cavity. The graphs indicate that damping is more sensitive to temperature variations than resonance frequencies. Damping is mainly related to the matrix, while stiffness is more dominated by the fibers. Temperature influences the matrix more than the fibers. An extensive review on damping in composites was presented by Treviso et al. [47]
The resonance frequencies of the torsional, breathing, and bending modal shapes of the two test beams peaked at −20 °C and decreased continuously to a minimum at 60 °C, which is typical for composites with a thermoplastic matrix. The damping ratios of these modal shapes exhibited maximum values between 5 °C and 20 °C, related to physical phenomena in polymers such as the glass transition temperature.
After smoothing the damping ratio curves, the orthotropic engineering constants were identified using the Resonalyser procedure. The results are presented in the graphs of Figure 15. As the measured resonance frequencies decreased continuously with increasing temperature and since modulus values E1, E2, and G12 are directly related to the frequencies, the modulus values also decreased continuously with increasing temperature. Young’s modulus E1 evolved from 20.5 GPa at −20 °C to 16.5 GPa at 60 °C (20% reduction). Young’s modulus E2 showed comparable values typical for bidirectionally reinforced composites and evolved from 19 GPa to 14 GPa (26% reduction). The in-plane shear modulus in bidirectionally reinforced composites G12 is primarily dependent on the matrix, showing a dramatic reduction from 5 GPa at −20 °C to 1 GPa at 60 °C (divided by a factor five!). Poisson’s ratio remained low and nearly constant across all observed temperatures. The tangent deltas of the modulus values were mainly determined by the measured damping ratios of the test samples, with maximum values observed between 5 °C and 15 °C. Tangent delta measures the phase delay between the sinusoidally varying stresses and strains at each point of the sample. This value was averaged out over the area of the samples, similarly to the modulus values obtained by the Resonalyser procedure. The tangent delta of Poisson’s ratio represents the phase angle between the strains in the two orthotropic directions for a sinusoidal vibration at the associated frequency. The developed measurement instrument will enable us to study material behavior in future research on different composite material types. The primary benefit of the proposed extension of IET over conventional IET is its capability to concurrently identify all orthotropic engineering constants.

5. Conclusions

The developed method aims at the automated identification of the orthotropic engineering constants of composite materials as a function of temperature. Relatively large thin plate and beam samples are suitable for the analysis of composite materials. Only minimal preparation of the test sample was required (cutting beams and adjusting the sizes of the Poisson plate). The results were averaged over the area of the test samples. The simple yet accurate impulse excitation technique (IET) was chosen for measuring resonance frequencies and damping ratios. IET is a non-destructive technique, allowing measurements at different temperature steps. The developed pendulum mechanism is easily implemented in existing climate chambers. Pendulum excitation avoids multiple hits, and the position and quality of the impact can be adjusted according to sample requirements. The Resonalyser procedure is a mixed numerical–experimental method that requires only resonance frequencies and damping ratios. No modal shape values are required; thus, full operational modal analysis or experimental modal analysis is unnecessary. Identification of the complex engineering constants with the Resonalyser procedure takes less than a second and can be executed in real time after each completed measurement step. However, measurement of the damping ratios exhibits considerable noise, so identification should preferably be carried out as postprocessing after smoothing with spline polynomials. The test performed on a bidirectionally glass-reinforced composite material with a thermoplastic matrix PA6 revealed significant variation of all engineering constants within the tested temperature range of −20 °C to 60 °C. Given the novelty of the method, numerous issues require more detailed investigation across various materials in future research.

Author Contributions

Conceptualization, H.S. and J.G.; methodology, H.S.; software, H.S.; validation, J.G., G.N. and G.M.H.; formal analysis, H.R. and G.M.H.; investigation, J.G., G.M.H. and G.N.; resources, J.G. and G.N.; data curation, G.N.; writing—original draft preparation, H.S.; writing—review and editing, H.S.; visualization, J.G.; supervision, H.R.; project administration, H.R.; funding acquisition, H.S. All authors have read and agreed to the published version of the manuscript.

Funding

This research was funded by the Flemish government institute VLAIO with grant number HBC 2019.0120 (2020–2024).

Data Availability Statement

Data is contained within the article.

Acknowledgments

The authors thank the Flemish government institute VLAIO for their financial support in the ICON research project HBC 2019.0120 (2020–2024), in which a functional prototype instrument was developed. VLAIO will also support the authors in finding industrial partnerships for further development of the prototype.

Conflicts of Interest

Co-author Jun Gu was employed by BYTEC BV., the remaining authors declare that the research was conducted in the absence of any commercial or financial relationships that could be construed as a potential conflict of interest.

Abbreviations

The following abbreviations are used in this manuscript:
IETImpulse excitation technique
IRFImpulse response function
DMADynamic mechanical analysis
EMAExperimental modal analysis
OMAOperational modal analysis
FEFinite element
ASTMAmerican Standard Testing Materials

References

  1. Jones, R. Mechanics of Composite Materials; McGraw-Hill: New York, NJ, USA, 1975; ISBN 0-07-032790-40. Available online: https://books.google.be/books?hl=nl&lr=&id=oMph2kNG3yAC&oi=fnd&pg=PR13&dq=Mechanics+of+composite+materials&ots=kaM_KLDJZh&sig=GPwF1HyGMQnDCdhyG2IiB_XprXY#v=onepage&q=Mechanics%20of%20composite%20materials&f=false (accessed on 20 March 2025).
  2. Ozturk, F.; Cobanoglu, M.; Ece, R.E. Recent advancements in thermoplastic composite materials in aerospace industry. J. Thermoplast. Compos. Mater. 2023, 37, 3084–3116. [Google Scholar] [CrossRef]
  3. Raju, B.; Hiremath, S.R.; Mahapatra, D.R. A review of micromechanics-based models for effective elastic properties of reinforced polymer matrix composites. Compos. Struct. 2018, 204, 607–619. [Google Scholar] [CrossRef]
  4. ASTM D3039; Standard Test Method for Tensile Properties of Polymer Matrix Composite Materials. ASTM: West Conshohocken, PA, USA, 2014. Available online: https://www.sciencedirect.com/science/article/abs/pii/S014294181100078X (accessed on 20 March 2025).
  5. ASTM D7078; Standard Test Method for Shear Properties of Matrix Composite Materials. ASTM: West Conshohocken, PA, USA, 2012. Available online: https://link.springer.com/chapter/10.1007/978-3-030-57729-2_7 (accessed on 20 March 2025).
  6. Timoshenko, S. Vibration Problems Is Engineering; John Wiley & Sons: New York, NY, USA, 1937; Available online: https://books.google.be/books?hl=nl&lr=&id=YZ7t8LgRqi0C&oi=fnd&pg=PR11&dq=S.+Timoshenko:+Vibration+Problems+is+Engineering&ots=N4lCLnFjxG&sig=WSdLXxC2vTpTOILvlTIyilU-Rfg&redir_esc=y%23v=onepage&q=S.%20Timoshenko%3A%20Vibration%20Problems%20is%20Engineering&f=false (accessed on 20 March 2025).
  7. Kostic, S.; Miljojkovic, J.; Simunovic, G.; Vukelic, D.; Tadic, B. Uncertainty in the determination of elastic modulus by tensile testing. Eng. Sci. Technol. Int. J. 2022, 25, 100998. [Google Scholar] [CrossRef]
  8. Lord, J.D.; Morrell, R.M. Elastic Modulus Measurement; Good Practice Guide No.98; National Physical Laboratory: London, UK, 2006; Available online: https://eprintspublications.npl.co.uk/3782/ (accessed on 20 March 2025).
  9. ASTM C1259-98; Standard Test Methods for Dynamic Young’s Modulus, Shear Modulus and Poisson’s Ratio for Advanced Ceramics by Impulse Excitation of Vibration. ASTM: West Conshohocken, PA, USA, 2001. Available online: https://www.mdpi.com/2076-3417/11/22/10802 (accessed on 20 March 2025).
  10. He, J.; Fu, Y. Modal Analysis; Butterworth-Heineman: Oxford, UK, 2001; ISBN 0750650796. Available online: https://books.google.be/books?hl=nl&lr=&id=ElwhqUtJUj8C&oi=fnd&pg=PP1&dq=he+fu+modal+analysis&ots=Vf3DYs53Ey&sig=iLqe957_1xyXInwsGyR2oG0UlsM#v=onepage&q=he%20fu%20modal%20analysis&f=false (accessed on 20 March 2025).
  11. Schalnat, J.; Gómez, D.G.; Daelemans, L.; De Baere, I.; De Clerck, K.; Van Paepegem, W. Influencing parameters on measurement accuracy in dynamic mechanical analysis of thermoplastic polymers and their composites. Polym. Test. 2020, 91, 106799. [Google Scholar] [CrossRef]
  12. Heritage, K.; Frisby, C.; Wolfenden, A. Impulse excitation technique for dynamic flexural measurements at moderate temperature. Rev. Sci. Instrum. 1988, 59, 973–974. [Google Scholar] [CrossRef]
  13. Brebels, A.; Bollen, B. Non-Destructive Evaluation of Material Properties as Function of Temperature by the Impulse Excitation Technique. e-J. Non-Destr. Test. 2015, 20, 6. Available online: https://www.ndt.net/article/nde-india2014/papers/CP0023_full.pdf (accessed on 20 March 2025).
  14. Sol, H. Identification of Anisotropic Plate Rigidities Using Free Vibration Data. Ph.D. Thesis, Vrije Universiteit Brussel, Brussels, Belgium, 1986. Available online: https://researchportal.vub.be/en/publications/identification-of-anisotropic-plate-rigidities-by-vibration-analy (accessed on 20 March 2025).
  15. De Baer, I. Experimental and Numerical Study of Different Setups for Conducting and Monitoring Fatigue Experiments of Fibre-Reinforced Thermoplastics. Ph.D. Thesis, University Ghent, Ghent, Belgium, 2008. Available online: https://biblio.ugent.be/publication/470995 (accessed on 20 March 2025).
  16. Lauwagie, T.; Sol, H.; Heylen, W. Handling uncertainties in mixed numerical-experimental techniques for vibration-based material identification. J. Sound Vib. 2006, 291, 723–739. [Google Scholar] [CrossRef]
  17. Lauwagie, T.; Sol, H.; Roebben, G.; Heylen, W.; Shi, Y. Validation of the Resonalyser method: An inverse method for material identification. In Proceedings of the ISMA 2002, International Conference on 734 Noise and Vibration Engineering, Leuven, Belgium, 16–18 September 2002; pp. 687–694. Available online: http://resonalyser.com/wp-content/uploads/Validation-of-the-resonalyser-method-ISMA.pdf (accessed on 20 March 2025).
  18. De Visscher, J. Identification of the Complex Stiffness Matrix of Orthotropic Materials by a Mixed Numerical Experimental Method. Ph.D. Thesis, Vrije Universiteit Brussel, Brussel, Belgium, 1995. Available online: https://researchportal.vub.be/en/publications/identification-of-the-complex-stiffness-matrix-of-orthotropic-mat (accessed on 20 March 2025).
  19. Deobald, L.R.; Gibson, R.F. Determination of elastic constants of orthotropic plates by a modal analysis/Rayleigh-Ritz technique. J. Sound Vib. 1988, 124, 269–283. [Google Scholar] [CrossRef]
  20. Pederson, P.; Frederiksen, P.S. Identification of orthotropic material moduli by a combined experimental/numerical approach. Measurement 1992, 10, 113–118. [Google Scholar] [CrossRef]
  21. Ayorinde, E.O.; Gibson, R.F. Elastic constants of orthotropic composite materials using plate resonance frequencies, classical lamination theory and an optimized three mode Rayleigh formulation. Compos. Eng. 1993, 3, 395–407. [Google Scholar] [CrossRef]
  22. Moussu, F.; Nivoit, M. Determination of the elastic constants of orthotropic plates by a modal analysis method of superposition. J. Sound Vib. 1993, 165, 149–163. [Google Scholar] [CrossRef]
  23. Frederiksen, P.S. Estimation of elastic moduli in thick composite plates by inversion of vibrational data. In Proceedings of the Second International Symposium on Inverse Problems, Paris, France, 2–4 November 1994; pp. 111–118. Available online: https://journals.sagepub.com/doi/abs/10.1177/002199839703100403 (accessed on 20 March 2025).
  24. Ayorinde, E.O. Elastic constants of thick orthotropic composite plates. J. Compos. Mater. 1995, 29, 1025–1039. [Google Scholar] [CrossRef]
  25. Cunha, J. Application des Techniques de Recalage en Dynamique a L’identification des Constantes Elastiques des Materiaux Composites. Ph.D. Thesis, Université de Franche-Comté, Besançon, France, 1997. Available online: https://theses.fr/1997BESA2007 (accessed on 20 March 2025).
  26. Qian, G.-L.; Hoa, S.V.; Xiao, X. A vibration method for measuring mechanical properties of composite, theory and experiment. Compos. Struct. 1997, 39, 31–38. [Google Scholar] [CrossRef]
  27. Barkanov, E.; Akishin, P.; Lvov, G.; Chate, A. An influence of hypotheses used for a material description on identified mechanical properties of laminated composites. Mech. Compos. Mater. 2025, 61, 41–52. [Google Scholar] [CrossRef]
  28. Li, J.; Narita, Y. Analysis and optimal design for the damping property of laminated viscoelastic plates under general edge conditions. Compos. Part B 2013, 45, 972–980. [Google Scholar] [CrossRef]
  29. Hwang, S.-F.; Chang, C.-S. Determination of elastic constants of materials by vibration testing. Compos. Struct. 2000, 49, 183–190. [Google Scholar] [CrossRef]
  30. Liu, G.R.; Lam, K.Y.; Han, X. Determination of elastic constants of anisotropic laminated plates using elastic waves and a progressive neural network. J. Sound Vib. 2002, 52, 239–259. [Google Scholar] [CrossRef]
  31. Muthurajan, K.G.; Sanakaranarayanasamy, K.; Rao, B.N. Evaluation of elastic constants of specially orthotropic plates through vibration testing. J. Sound Vib. 2004, 272, 413–424. [Google Scholar] [CrossRef]
  32. Ayorinde, E.O.; Yu, L. On the elastic characterization of composite plates with vibration data. J. Sound Vib. 2005, 283, 243–262. [Google Scholar] [CrossRef]
  33. Alfano, M.; Pagnotta, L. Determining the elastic constants of isotropic materials by modal vibration testing of rectangular thin plates. J. Sound Vib. 2006, 293, 426–439. [Google Scholar] [CrossRef]
  34. Caillet, J.; Carmona, J.C.; Mazzoni, D. Estimation of plate elastic moduli through vibration testing. Appl. Acoust. 2007, 68, 334–349. [Google Scholar] [CrossRef]
  35. Bledzki, K.; Kessler, A.; Rikards, R.; Chate, A. Determination of elastic constants of glass/epoxy unidirectional laminates by the vibration testing of plates. Compos. Sci. Technol. 1999, 59, 2015–2024. [Google Scholar] [CrossRef]
  36. Lauwagie, T.; Sol, H.; Heylen, W.; Roebben, G. Determination of the in-plane elastic properties of the different layers of laminated plates by means of vibration testing and model updating. J. Sound Vib. 2004, 274, 529–546. [Google Scholar] [CrossRef]
  37. Bottiglieri, M.; Sol, H. Identification of the elastic properties on composite materials as a function of temperature. In Proceedings of the PACAM XI 11th Pan-American Congress of Applied Mechanics, Foz do Iguaçu, PR, Brazil, 4–8 January 2010; Available online: https://researchportal.vub.be/en/publications/identification-of-the-elastic-properties-on-composite-materials-a (accessed on 20 March 2025).
  38. Chandra, S.; Maeder, M.; Bienert, J.; Beinersdorf, H.; Jiang, W.; Matsagar, V.A.; Marburg, S. Identification of temperature-dependent elastic and damping parameters of carbon-epoxy composite plates based on experimental modal data. Mech. Syst. Signal Process. 2023, 187, 109945. [Google Scholar] [CrossRef]
  39. Lauwagie, T.; Lambrinou, K.; Sol, H.; Heylen, W. Resonant-Based Identification of the Poisson’s Ratioof Orthotropic Materials. Exp. Mech. 2010, 50, 437–447. [Google Scholar] [CrossRef]
  40. Pierron, F.; Grediac, M. The Virtual Fields Method; Springer: Berlin/Heidelberg, Germany, 2012; ISBN 9781761418258. Available online: https://books.google.be/books?hl=nl&lr=&id=GGGQ6OVLSc8C&oi=fnd&pg=PR3&dq=the+virtual+fields+method+&ots=9cQLIzcR26&sig=IDIMfwpNIF9KN8OHtY_hSiK9PTc#v=onepage&q=the%20virtual%20fields%20method&f=false (accessed on 20 March 2025).
  41. Sol, H.; Rahier, H.; Gu, J. Prediction and Measurement of the Damping Ratios of Laminated Polymer Composite Plates. Materials 2020, 13, 3370. [Google Scholar] [CrossRef]
  42. Bytec, B.V. Theoretical Background and Examples of the Resonalyser Procedure. Available online: https://resonalyser.com/ (accessed on 20 March 2025).
  43. Sol, H.J.B.; Gu, J. Combined tensile and dynamic testing for the accurate measurement of mechanical properties of composite materials. In Proceedings of the SAMPE Europe Conference 2022, Hamburg, Germany, 15–17 November 2022; Available online: https://www.nasampe.org/store/viewproduct.aspx?id=23970522 (accessed on 20 March 2025).
  44. ASTM D790; Standard Test Methods for Flexural Properties of Unreinforced and Reinforced Plastics and Electrical Insulating Materials. ASTM: West Conshohocken, PA, USA, 2017. Available online: https://store.astm.org/standards/d790 (accessed on 20 March 2025).
  45. Delouei, A.A.; Emamian, A.; Sajjadi, H.; Atashafrooz, M.; Li, Y.; Wang, L.-P.; Jing, D. A Comprehensive Review on Multi-Dimensional Heat Conduction of Multi-Layer and Composite Structures: Analytical Solutions. J. Therm. Sci. 2021, 30, 1875–1907. [Google Scholar] [CrossRef]
  46. Cengel, Y. Heat Transfer, a Practical Approach; McGraw-Hill: New York, NJ, USA, 1998; ISBN 0-07-011505-2. Available online: https://cir.nii.ac.jp/crid/1130573936331734035 (accessed on 20 March 2025).
  47. Treviso, A.; Van Genechten, B.; Mundo, D.; Tournour, M. Damping in composite materials: Properties and models. Compos. Part B 2015, 78, 144–152. [Google Scholar] [CrossRef]
Figure 1. Two test beams cut along the two orthotropic directions 1 and 2 and a rectangular test plate with edges parallel to the orthotropic material directions.
Applsci 15 03621 g001
Figure 2. Decaying sinusoidal time domain signal after impulse excitation.
Applsci 15 03621 g002
Figure 3. Torsion (a), saddle (b), and breathing (c) vibration modes of a Poisson plate. The frequencies associated with these modes are mainly sensitive to the indicated engineering constants below the figures.
Applsci 15 03621 g003
Figure 4. Resonalyser room temperature setup: portable flight case with an adjustable aluminum suspension frame and a PC with automated measuring and identification software (USB connection with signal conditioning box).
Applsci 15 03621 g004
Figure 5. The created digital twin can reproduce the IRF.
Applsci 15 03621 g005
Figure 6. Different stress–strain values for modulus testing with a tensile bench and with IET.
Applsci 15 03621 g006
Figure 7. Results screenshot of the Resonalyser software_version_2025.
Applsci 15 03621 g007
Figure 8. Different stages of pendulum impact.
Applsci 15 03621 g008
Figure 9. Position for suspension wires and excitation position (red stars) for the flexural vibration of a beam and the torsion and breathing vibration modes of a Poisson plate.
Applsci 15 03621 g009
Figure 10. A simple temperature and time-stepping program starting at an isothermal state with temperature TA towards temperature TB. An IET measurement is executed at the end of each temperature step (red circle).
Applsci 15 03621 g010
Figure 11. A temperature and time-stepping program with an overshoot temperature.
Applsci 15 03621 g011
Figure 12. Climate chamber with pendulum units on channels 1 and 2.
Applsci 15 03621 g012
Figure 13. The thermoplastic PA6 plate is bidirectionally reinforced with Organo glass fabric. The two in-plane orthotropic directions are indicated as 1 and 2.
Applsci 15 03621 g013
Figure 14. Measured resonance frequencies and damping ratios in a temperature interval starting at −20 °C and ending at 60 °C. (a) Graphs for the torsion modal shapes, (b) for the breathing modal shape, (c) for beam 1, and (d) for beam 2.
Applsci 15 03621 g014
Figure 15. Orthotropic engineering constants as a function of temperature: (a) Young’s modulus E1 and tangents delta E1, (b) Young’s modulus E2 and tangents delta E2, (c) Poisson’s ratio v12 and tangents delta v12, (d) Shear modulus G12 and tangents G12.
Applsci 15 03621 g015
Table 1. Three-point bending results on PA6/Organo glass composite beams at 20 °C.
Span Length
Support L
[m]
Width
b
[m]
Thickness
t
[m]
Slope m = F/d
[N/m]
Young’s
Modulus E
[N/m2]
Beam 10.2500.01930.003150.021317.0 GPa
Beam 20.2500.02060.003150.031314.9 GPa
Table 2. Sizes and mass of the tested test samples.
Length
[m]
Width
[m]
Thickness
[m]
Mass
[kg]
Plate0.2820.27600.003150.4198
Beam 10.3000.01930.003150.0213
Beam 20.2810.02060.003150.0313
Table 3. Comparison of results at 20 °C.
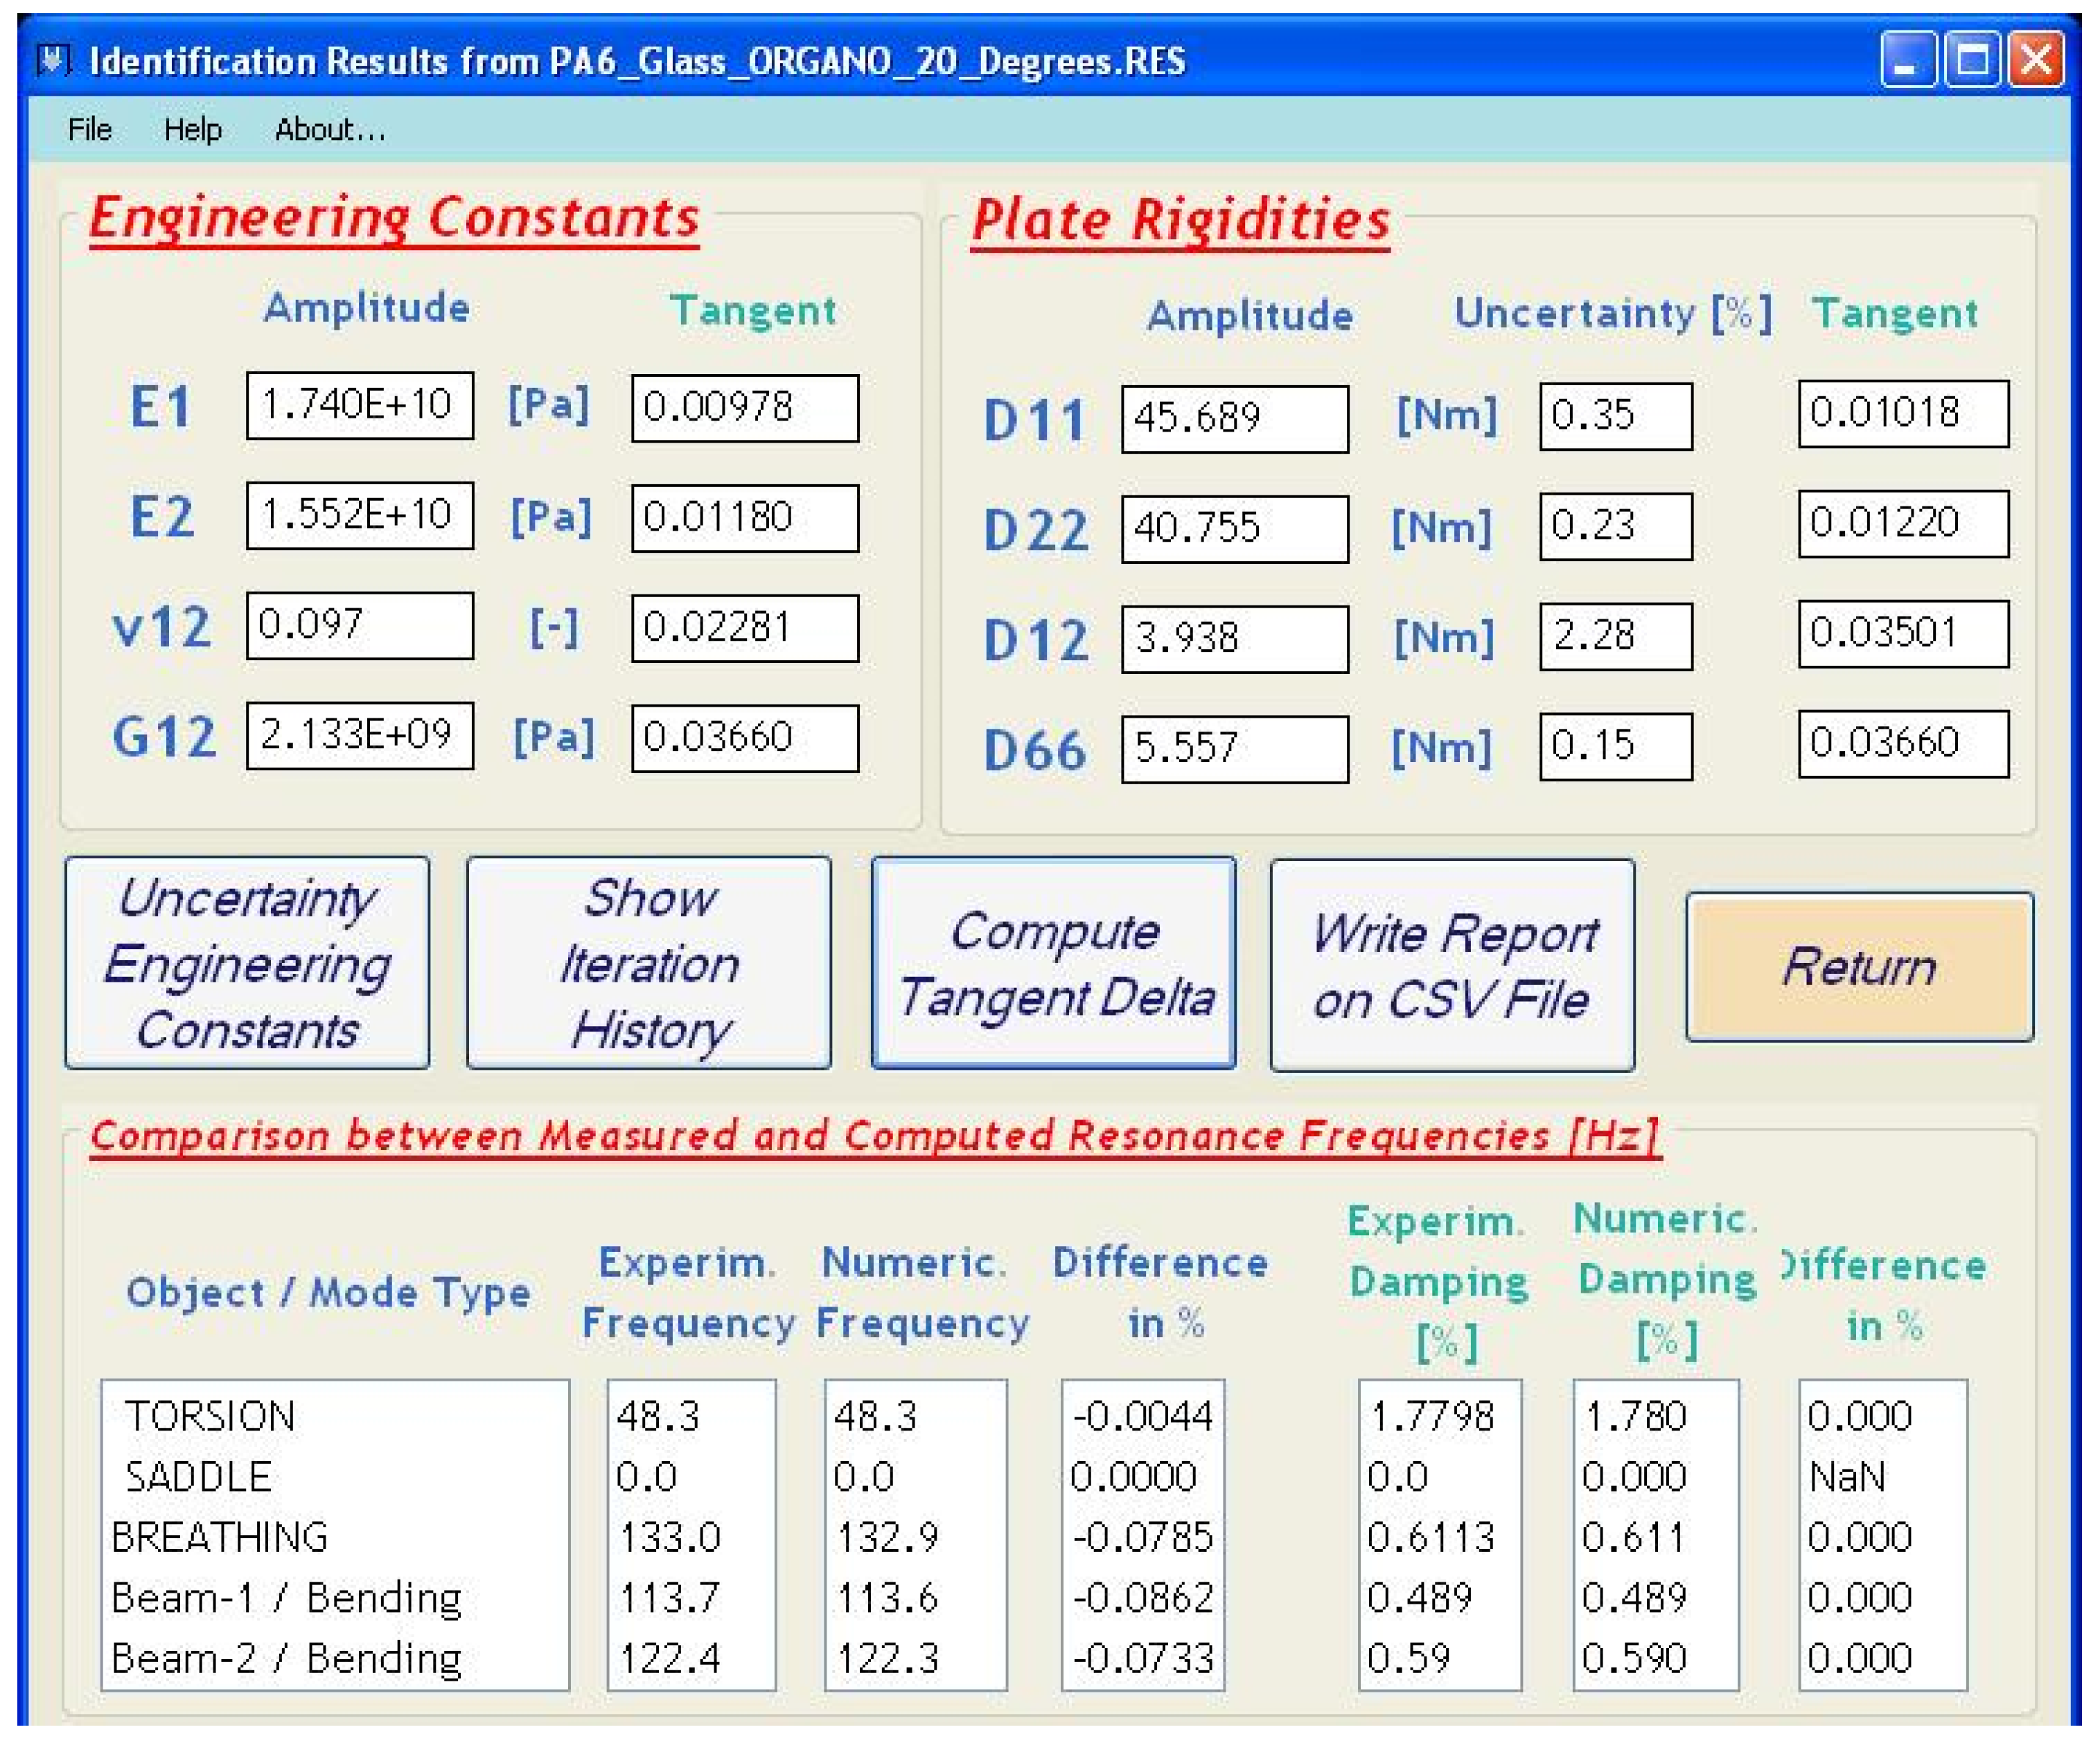
Resonalyser Results at 20 °C
(see Figure 7)
Results of Automated
Measurement at 20 °C
Young’s modulus E117.4 GPa17.4 GPa
Young’s modulus E215.5 GPa15.5 GPa
Poisson’s ratio0.0970.10
Shear modulus G122.13 GPa2.10 GPa
Disclaimer/Publisher’s Note: The statements, opinions and data contained in all publications are solely those of the individual author(s) and contributor(s) and not of MDPI and/or the editor(s). MDPI and/or the editor(s) disclaim responsibility for any injury to people or property resulting from any ideas, methods, instructions or products referred to in the content.

