1. Introduction
As intelligent mining technologies are promoted and implemented, conventional mining sites progressively evolve toward automation and uncrewed operations. Using intelligent machinery, low-carbon methodologies, and automated operations has markedly enhanced mining productivity and safety [
1]. Open-pit mines present significant challenges to current robotic localization methods. These challenges include intricate topography, areas with minimal texture, and constantly changing lighting conditions. Conventional sparse point cloud mapping techniques, particularly in intricate large-scale mining regions, are hindered by their limited informational capacity, rendering them inadequate at adapting to dynamic mining environments and leading to their failure to deliver detailed maps for navigation and decision making. As a result, dense mapping technology has emerged as a vital developmental trajectory in the domain of SLAM (Simultaneous Localization and Mapping) in recent years. Dense mapping [
2] produces more intricate and comprehensive environmental models by leveraging extensive data acquired from sensors, hence improving map precision and detail representation capabilities.
Mining mapping robots are sophisticated systems that seamlessly combine environmental sensing, target recognition, navigation positioning, and motion control technologies, with accurate localization and dense mapping as significant problems. Commonly employed positioning techniques encompass Global Navigation Satellite Systems (GNSS), Light Detection and Ranging (LIDAR), and optical positioning. GNSS is predominantly utilized outdoors, with centimeter-level precision in unobstructed conditions [
3]. In open-pit mines, elevated, uneven mining slopes, machinery, and structures can impede or reflect GNSS signals, compromising location accuracy [
4]. LIDAR placement provides high precision and robust anti-interference features, yet it is susceptible to point cloud distortion and mismatching during movement and is comparatively costly. Visual positioning with monocular, stereo, or RGB-D cameras offers comprehensive positional data. At the same time, its affordability, energy efficiency, and compactness render it exceptionally appropriate for extensive operational environments, particularly in mobile robot navigation [
5].
Vision-based SLAM systems such as the ORB-SLAM series [
6,
7] have achieved considerable advancements in feature point extraction and matching. The ORB-SLAM2, a sophisticated visual SLAM system, accommodates monocular, stereo, and RGB-D cameras, facilitating effective localization and mapping. ORB-SLAM3 enhances localization precision and resilience using feature-based, tightly coupled inertial visual odometry, improving dynamic performance [
8]. Nonetheless, ORB-SLAM3 continues to employ brute-force descriptor distance searching to acquire multiple matching point pairs during tracking, supplemented by ratio tests to eliminate low-confidence matches or by projecting previously tracked map points onto the current frame to generate rotation histograms for assessing rotational consistency. The two methods of feature point matching are susceptible to mismatches in scenarios with significant camera transformation angles.
Moreover, the ORB-SLAM3 predominantly produces sparse maps solely via feature points, lacking comprehensive environmental and structural information, which complicates the inference of spatial structures between feature points and precludes advanced applications, such as navigation, obstacle avoidance, and reconstruction [
9]. The intricate operational context of open-pit mines renders ORB feature-based sparse mapping techniques susceptible to failure, compromising positioning precision and navigation efficacy. Consequently, detailed mapping technology is essential for addressing these issues.
RGB-D cameras have provided new developmental options for dense SLAM technology. Microsoft’s Kinect [
10] offered an innovative approach for real-time dense reconstruction systems with RGB-D cameras. KinectFusion employs the TSDF (Truncated Signed Distance Function) model for real-time integration of RGB-D pictures, facilitating dense surface reconstruction of the environment [
11]. As the span of the reconstruction scene develops, the storage space needs of the TSDF model increase substantially. Researchers have suggested enhanced algorithms to tackle this issue. Kintinuous [
12] employs a cyclical storage-space-use strategy to improve the reconstruction scene range, whereas ElasticFusion [
13] utilizes a Surfel element model for dense map reconstruction. While these methods excel in small-scale scenarios, they encounter limitations in storage and computational resources and exhibit inadequate adaptability in large-scale, dynamic contexts. Another approach, BundleFusion, utilizes conventional Structure from Motion (SFM) technology to align each frame with all previous frames. This approach effectively reconstructs small-scale scenes but necessitates two high-performance GPUs to attain real-time processing speed [
14]. Matsuki et al. [
15] introduced a dense mapping framework to enhance sparse visual SLAM systems, attaining globally consistent, dense three-dimensional reconstruction with TSDF fusion technology, utilizing camera poses, keyframes, and sparse points produced by the SLAM system as inputs. These studies offer efficient technical solutions for dense mapping; however, selecting suitable approaches is complex, as many map types are helpful for distinct application circumstances.
Conversely, current research emphasizes enhancing feature-matching techniques to bolster the resilience of SLAM systems. Researchers have implemented sparse optical flow, Convolutional Neural Networks (CNNs), and line characteristics to enhance the matching stability [
16,
17]. Despite the potential of these strategies to improve matching efficacy, they encounter considerable difficulties in low-texture settings and frequently result in prolonged matching durations [
18]. To boost the matching precision and efficiency, the literature [
19,
20] presents solutions that integrate point and line segment features to improve robustness in low-texture situations. The literature [
21,
22] presents enhanced matching accuracy by superior matching algorithms and outlier rejection techniques; nevertheless, these approaches generally necessitate extended calculation durations. Consequently, enhancing the matching speed while maintaining the matching accuracy is a significant research focus in contemporary SLAM technology.
In recent years, many studies have focused on enhancing SLAM system performance through multi-feature fusion and deep learning techniques. For instance, EPLF-VINS [
23] improves the line feature quality through short-line fusion and adaptive threshold extraction, proposing a line optical flow tracking method based on gray-level invariance and colinear constraints, significantly accelerating the line feature matching. The UPLP-SLAM [
24] introduces an RGB-D visual SLAM method based on point, line, and plane feature fusion, designing a mutual association scheme for these features to unify and jointly optimize matching and association errors, thereby improving the accuracy and consistency of the camera pose estimation and map building. Additionally, a semantic SLAM-based dense mapping approach [
25] reduces the impact of moving objects on pose estimation through multi-view projection and optimizes feature points via depth local contrast, generating multiple dense 3D maps for advanced robot navigation. In the agricultural field, a real-time RGB-D SLAM method based on point-line feature fusion [
26] constructs 3D scene maps by optimizing the joint poses of point-line features and designs a joint point cloud filtering method based on keyframe optimization, achieving high-quality dense map reconstruction. The HI-SLAM [
27] proposes a real-time monocular dense mapping framework based on neural implicit fields, constructs neural field maps through multi-resolution grid encoding and Signed Distance Function (SDF) representation, and enhances depth accuracy with monocular depth priors, achieving high-precision real-time SLAM.
This work offers an enhanced ORB-SLAM3 technique to increase positioning accuracy and dense map creation in difficult open-pit mining situations. This article improves the feature-matching process inside the ORB-SLAM3 framework by implementing point-line feature fusion, increasing matching resilience in low-texture and low-contrast settings. Moreover, it integrates a dense point cloud mapping component that produces intricate dense maps by amalgamating camera depth data and converting them into effectively stored octree maps, substantially minimizing storage demands and enhancing three-dimensional query efficiency. The experimental results indicate that the enhanced algorithm outperforms existing approaches in positioning accuracy, map creation quality, and navigation performance, exhibiting significant robustness, especially in complicated terrains and open-pit mining situations.
2. System Architecture Framework
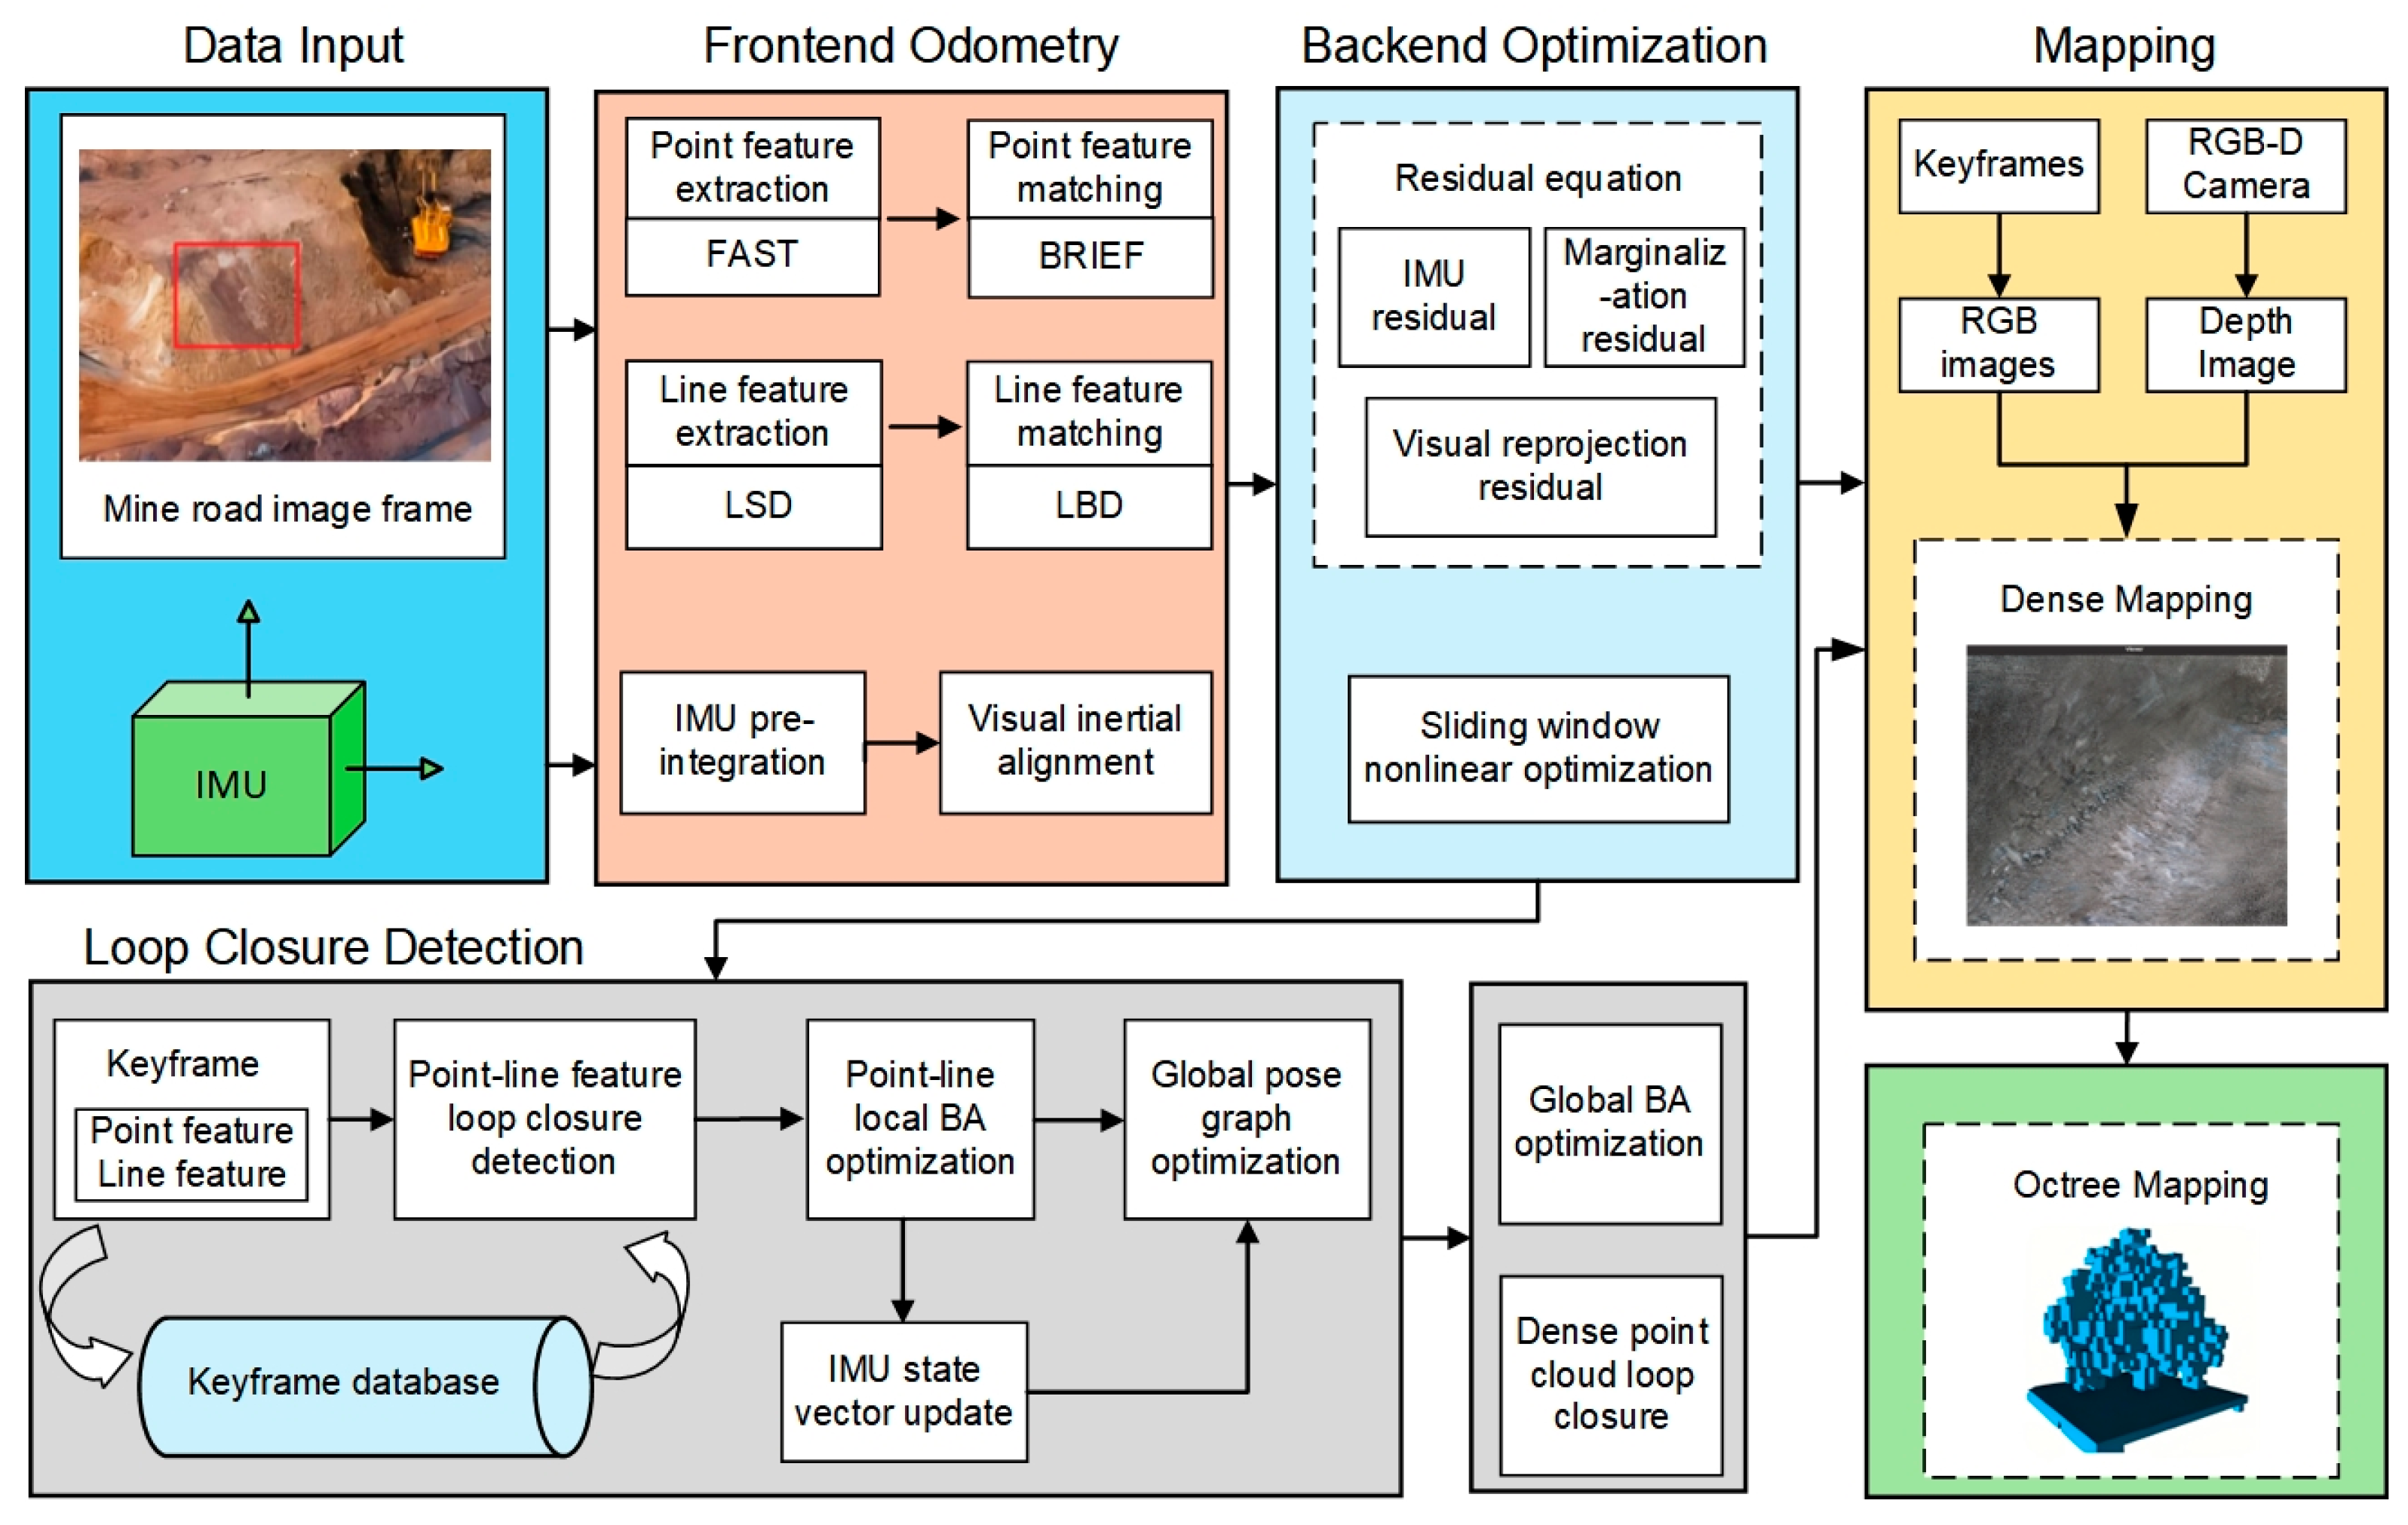
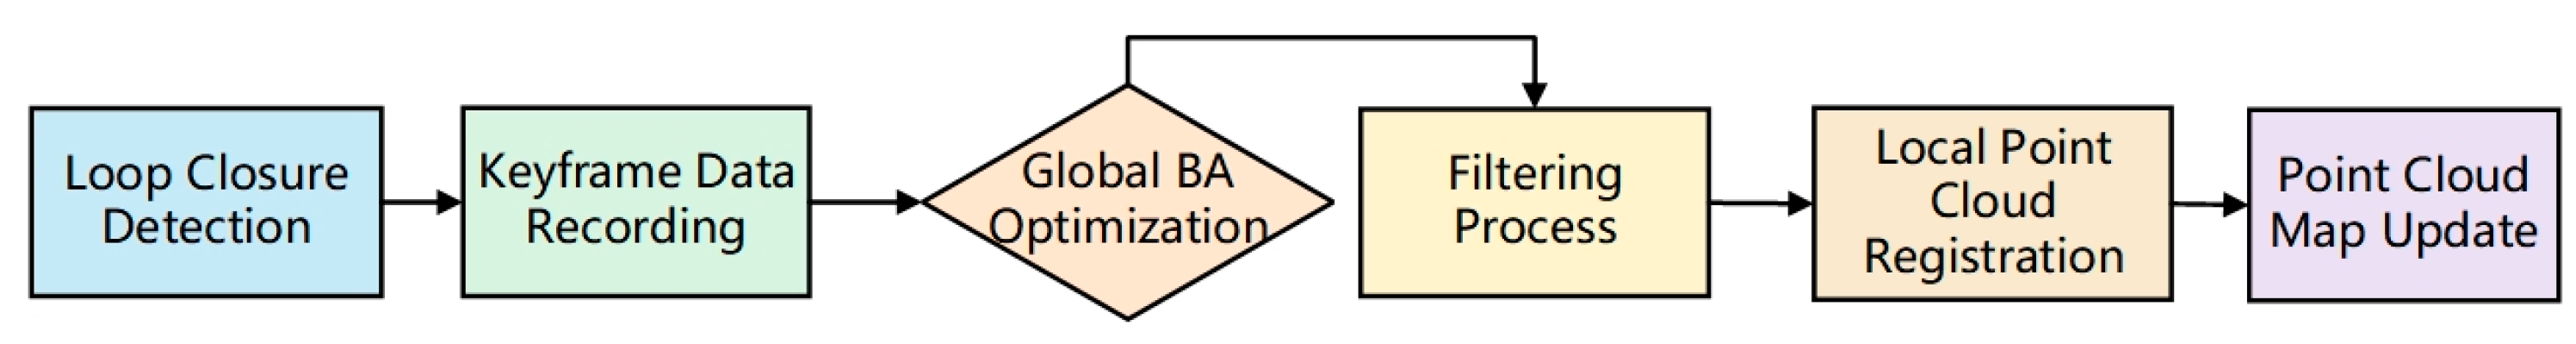
This research presents an enhanced ORB-SLAM3 algorithm architecture designed to tackle the issues encountered by localization and mapping robots in operational mining settings. This study enhances the original ORB-SLAM3 framework by integrating a line feature extraction module and a dense mapping thread while proposing an octree data structure to improve map representation. This research utilizes depth information from RGB-D cameras to convert sparse point clouds into dense point cloud maps, thereby considerably improving map accuracy and representative capacity in intricate mining situations. As illustrated in
Figure 1, The proposed enhanced framework generates high-precision dense maps via optimized frontend odometry, improved loop closure detection accuracy, and integrated nonlinear backend optimization, thereby equipping robots with more dependable navigation and path planning abilities, especially in demanding mining environments.
2.1. Frontend Visual–Inertial Odometry
Frontend odometry is a core module in the SLAM system that is responsible for real-time device pose estimation. In this research, we maintain the classical ORB feature point extraction method from ORB-SLAM3 while introducing a line feature extraction module to better handle sparse textures and prominent geometric features in mining environments. The introduction of line features compensates for the limitations of solely relying on point features, providing additional geometric constraints for the system and enhancing adaptability to complex scenes. By incorporating IMU (Inertial Measurement Unit) data, the frontend odometry achieves a fusion of visual and inertial information, thereby improving pose estimation accuracy across multiple sensor modes and providing more accurate initial poses for subsequent local and global optimizations.
2.2. Backend Nonlinear Optimization
The backend optimization module employs classical local and global BA (Bundle Adjustment) optimization methods to reduce accumulated errors and improve localization accuracy. Local optimization uses a sliding window strategy to fine-tune keyframe poses and map point coordinates within the regional map. Global optimization combines IMU residual information to comprehensively optimize visual reprojection errors and inertial residuals, ensuring map consistency at a worldwide level. This optimization process effectively reduces error accumulation caused by unstable visual information in mining environments, providing a reliable foundation for dense mapping and global map stitching.
2.3. Loop Closure Detection
The loop closure detection module identifies loops when the device returns to previously observed areas and triggers global optimization. To improve loop detection accuracy, this paper proposes a loop detection method combining point and line features. The detection process first searches for potential loop candidate frames in the keyframe database and verifies the loop’s existence through point and line feature matching. Once a loop is detected, the system performs local and global optimizations, adjusting relevant keyframe poses and map point coordinates, thereby ensuring system robustness in large-scale environments.
2.4. Dense Mapping and Octree Mapping
This research incorporates a dense mapping thread into the ORB-SLAM3 architecture to attain high-precision dense mapping. This thread employs depth data from RGB-D cameras to produce dense point clouds with the addition of new keyframes, delivering high-resolution, three-dimensional representations of all pixels using spatial coordinate computations. Furthermore, point cloud data are tinted with RGB information to maintain visual environmental characteristics. The system employs an octree data format to enhance the storage and management of dense point clouds. The octree efficiently compresses dense point cloud data by hierarchical voxel partitioning, preserving high-precision spatial representation and markedly enhancing system adaptability and real-time performance in intricate situations.
3. Pose Optimization Based on Point-Line Features
3.1. Line Feature Tracking and Outlier Rejection
Line features are essential in visual SLAM, especially for sparse situations, as they offer more comprehensive geometric information than point features. This article utilizes the LSD (Line Segment Detector) algorithm for line feature extraction, ensuring high precision and a robust real-time performance, which is essential for SLAM systems in dynamic situations. In contrast to point features, line features are higher-dimensional geometric entities encompassing attributes such as length and angle, which are crucial for target tracking and map generation.
This research improves the accuracy and reliability of in-line feature matching by utilizing geometric restrictions. To maintain angular consistency between matched line segments, we impose an angular constraint stipulating that the angle difference between two potential matching line segments must not be above a certain threshold,
α, as follows:
This constraint ensures spatial directional similarity between the corresponding line segments, thus enhancing the matching accuracy. This study adds a length similarity constraint to ensure consistency in line segment lengths, stipulating that the length ratio of matched line segments must surpass a predetermined threshold,
β. This constraint efficiently prevents false matches due to scale discrepancies, hence improving the stability and reliability of line feature matching.
This limitation efficiently mitigates discrepancies arising from scale variances. The location of line segment midpoints is a crucial geometric constraint, necessitating that the distance between the midpoints of corresponding line segments remains below a predetermined threshold,
γ, as follows:
The previously specified geometric limitations for minor camera motions often guarantee dependable matching. In significant camera movements, such as transitions between keyframes, geometric constraints may prove inadequate for ensuring stable matching. This study introduces the Line-Based Descriptor (LBD) to improve matching reliability and robustness. This study utilizes the MAD (Median Absolute Deviation) approach to mitigate accuracy degradation resulting from mismatches by eliminating potential false matches. Initially, we compute the rotation angle,
φi, for each corresponding pair of aligned line segments, as follows:
Subsequently, we employ the MAD approach to compute the divergence of the rotation angles for each pair of corresponding line segments to detect and eliminate possible mismatches. The Mean Absolute Deviation (MAD) is delineated as follows:
If the rotation angle of a pair of line segments deviates from the mean by more than the standard deviation, δ, this match is deemed a mismatch and is discarded. This strategy has significantly enhanced the resilience of line feature matching in practice, mitigating the effects of mismatches.
3.2. Line Feature Reprojection Error
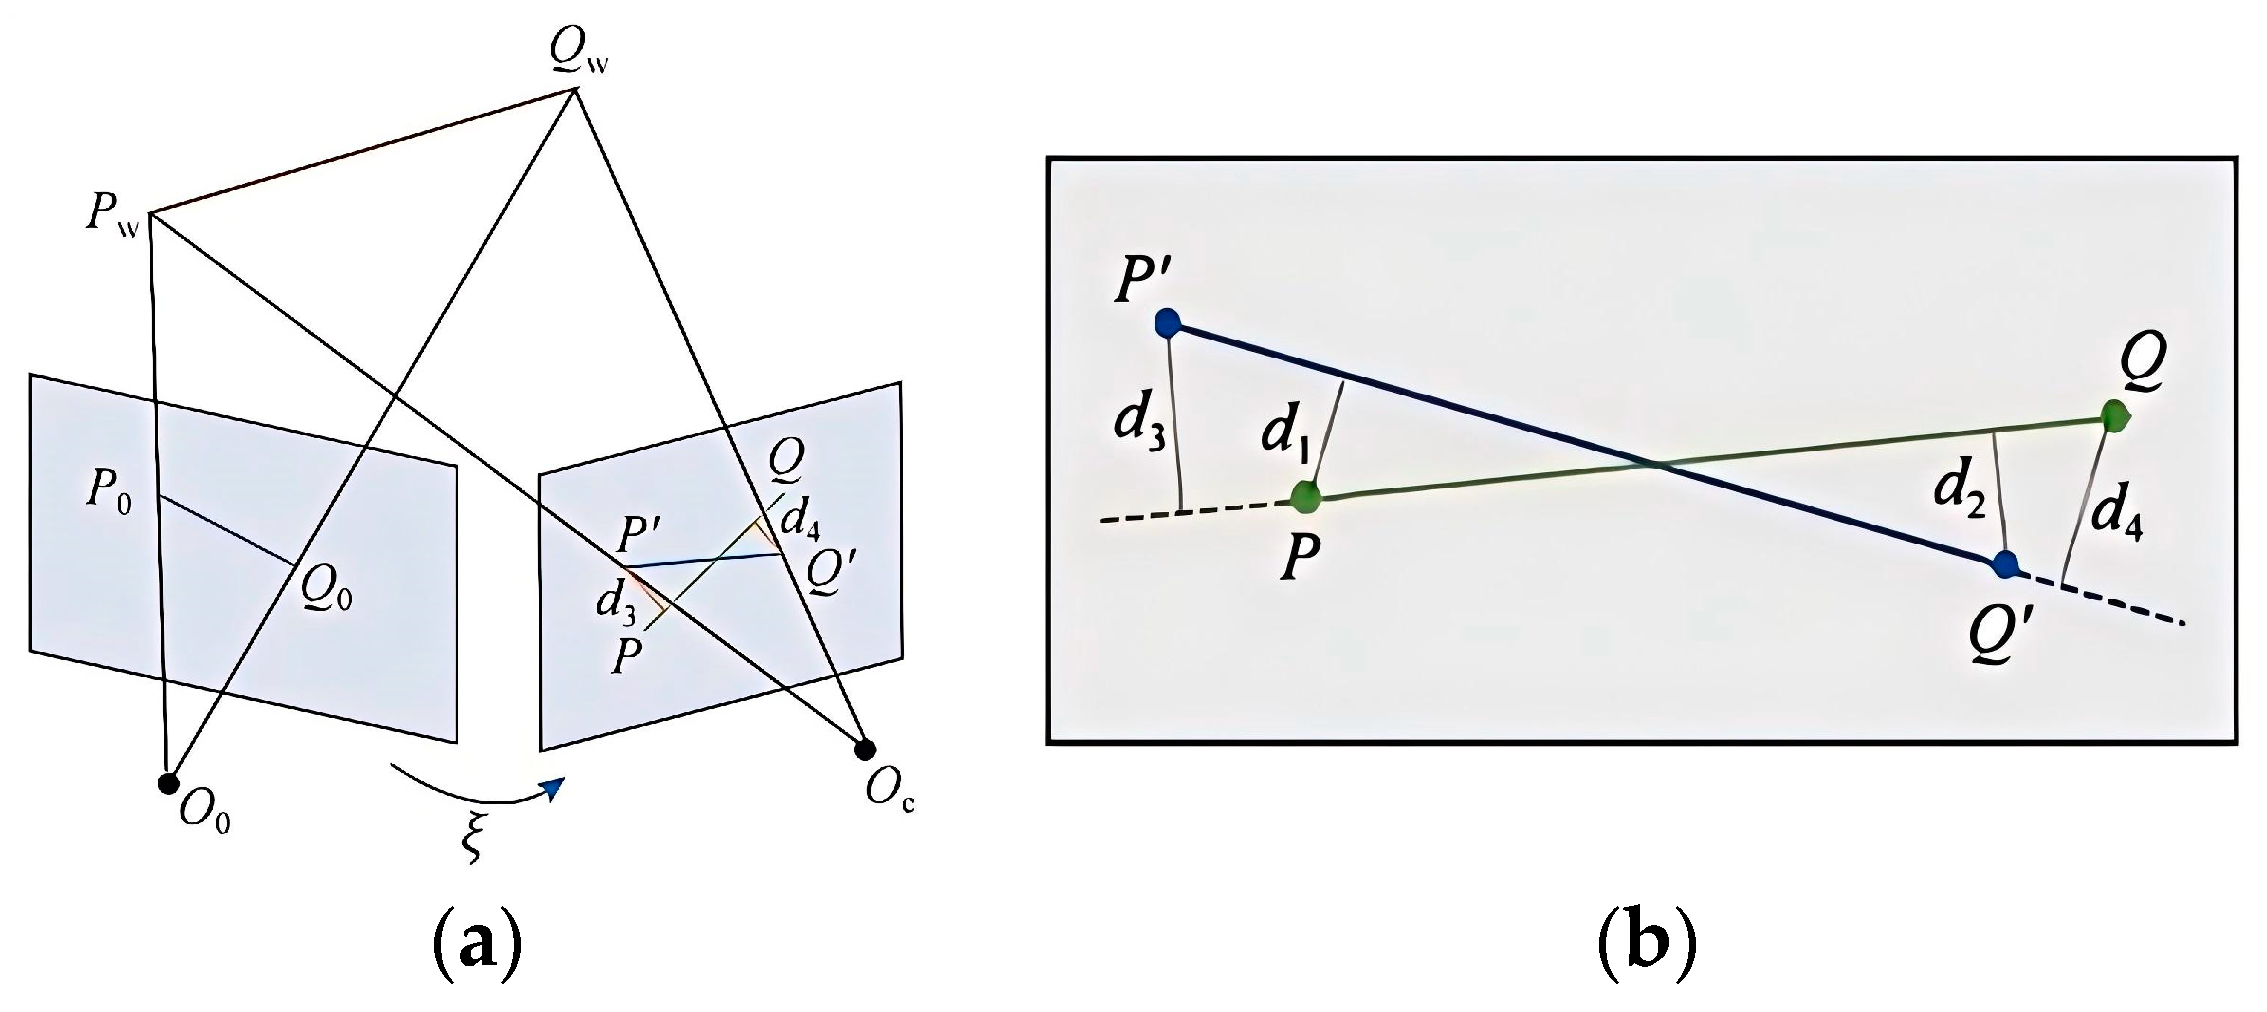
The representation of spatial line segments can adopt various parameterization methods, such as Plücker coordinates or parameterization through two endpoints. Nevertheless, owing to intrinsic errors in inline feature extraction, the endpoints of corresponding line features frequently fail to align precisely. Consequently, the computation of the line feature reprojection error diverges from conventional point feature methodologies. The geometric distance between the projected points and the corresponding line segment endpoints cannot accurately assess the reprojection error for line segment endpoints. Indeed, for a given spatial line segment, points along it retain collinearity from various perspectives, adhering to the collinearity constraint requirement. Despite potential misalignment of the ends of the matched line features, their projected points from multiple perspectives must reside on the same line to maintain geometric consistency.
Figure 2 illustrates the spatial line segment
PWQW, which is projected onto the picture plane, with the homogeneous coordinates of the ends represented as
P′ = [
u1,
v1,1]
T and
Q′ = [
u2,
v2,1]
T, respectively. In the picture plane, the homogeneous coordinates of the two ends of the corresponding two-dimensional matched line feature of the spatial line segment
PWQW are
P and
Q, where
P,
Q ∈
R. In the two-dimensional image plane, assuming the line coefficients of this line equation are
l0 = [
a,
b,
c]
T, we define the normalized line coefficients as follows:
The overall reprojection error can be represented by computing the error of the endpoints of the line segments based on the line feature reprojection error. Assuming that the two endpoints of the line segment in the image plane are
P′ and
Q′, then the total reprojection error of the line feature can be expressed as the sum of the squared endpoint errors. The precise formula is as follows:
Epl (P′,
l) denotes the distance error from the point to the line, defined as follows:
This error computation approach accurately represents the reprojection consistency of line features from various perspectives. Integrating depth information from an RGB-D camera enhances the optimization of reprojection error, resulting in more precise projections of line features in multi-view settings. The depth data from the RGB-D camera assign an accurate depth value to each pixel, enabling the reprojection error calculation to incorporate the geometric relationships in the 2D image and the depth information from the 3D space, thus improving the precision of line feature matching.
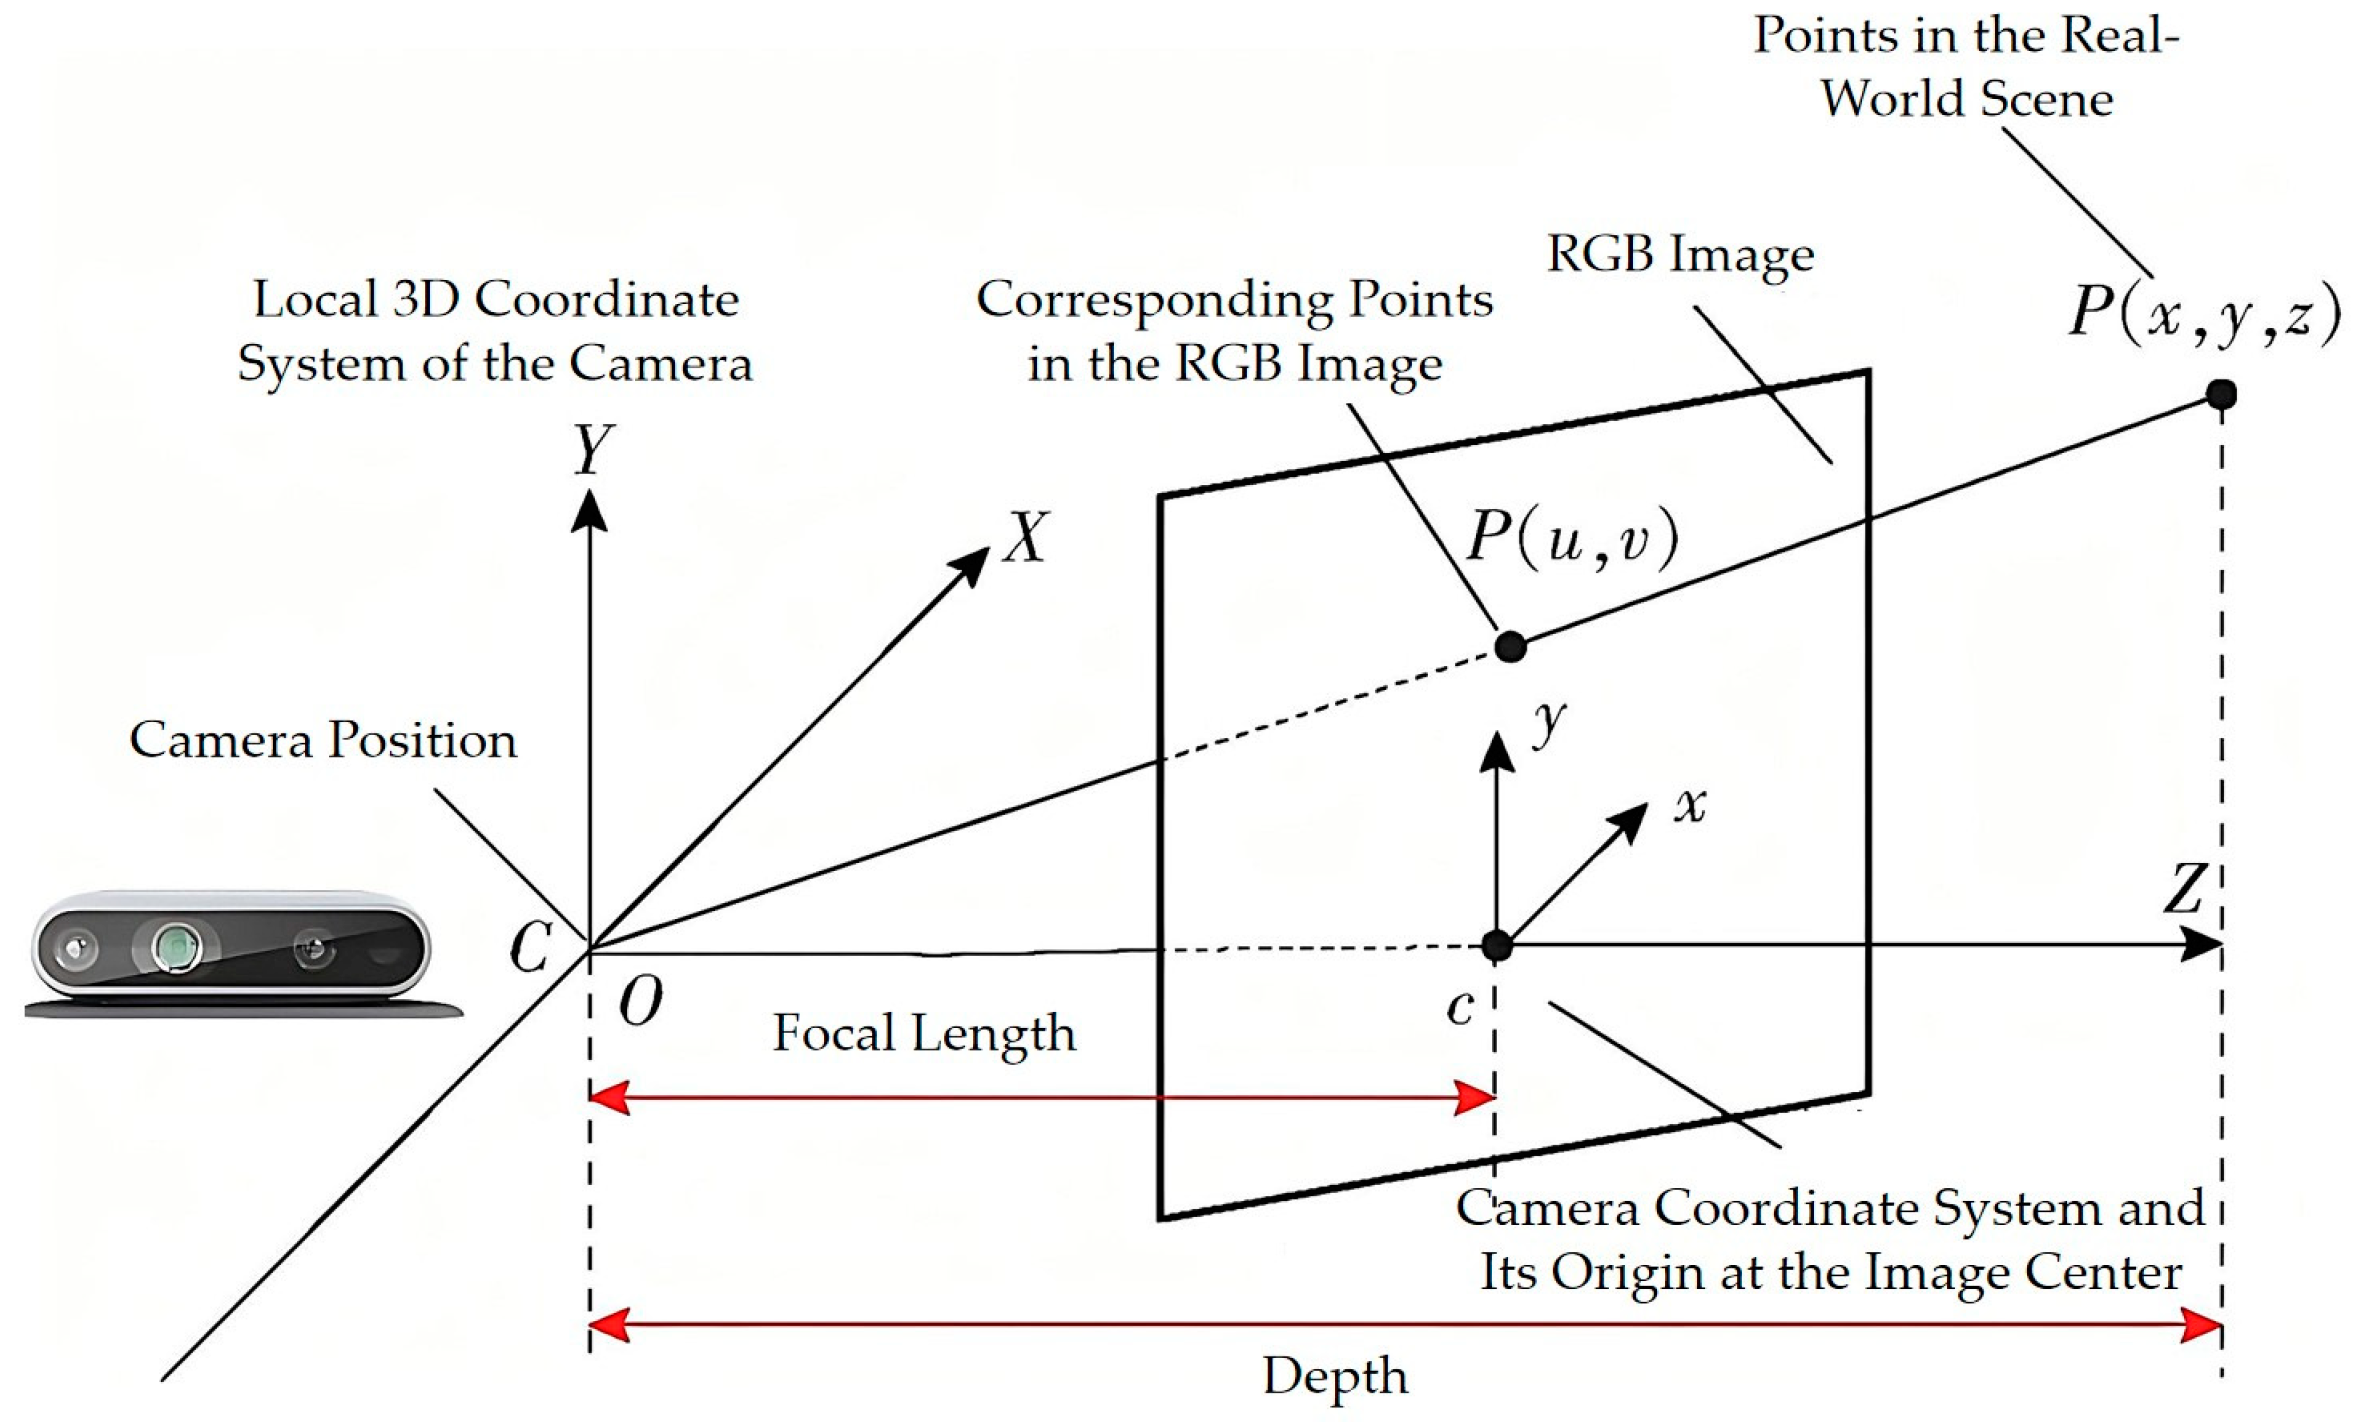
3.3. Line Feature Reprojection with Depth Information Fusion
The RGB-D cameras provide the acquisition of color images alongside appropriate depth maps, offering comprehensive depth measurement data for pixel points on line features. This research explicitly integrates line segment depth data to create line feature reprojection errors for optimal utilization of the information.
Figure 3 illustrates that when a color image frame is regarded as the left camera image in a stereo camera model (i.e., the present frame), the line feature retrieved from this image is
SLEL. Assume that the corresponding spatial line segment is
SWEW. In the process of building the virtual right camera image frame, if the pixel coordinates of the left camera are (
u,
v) with a depth measurement of
d, the corresponding coordinates for the right camera are as follows:
The equation mentioned earlier allows for calculating the associated right camera pixel locations SR and ER. According to the principles of multi-view geometry, when depth measurements are precise, the corresponding pixel positions in the right camera picture for the pixel points on the left camera line segment should align with the line segment SRER. Analogous to the building approach of the line feature reprojection error in the left camera picture, we can similarly generate the reprojection error of the identical spatial line segment in the right camera image. The depth observation data from the left camera line segment SLEL can be incorporated into the reprojection error of the right camera line segment.
In a stereo vision system, for a three-dimensional line segment,
SWEW, the homogeneous coordinates of its projected endpoints in the left camera image are
S′
L and
E′
L (predicted values in the optimization problem). In contrast, the homogeneous coordinates of the projected endpoints in the right camera image are
S′
R and
E′
R. The observed matched line segment in the original image is
SLEL (i.e., the measured values in the optimization problem) with the matching normalized line coefficients,
LL. Simultaneously, utilizing depth information, we compute the virtual right camera line segment observation,
SRER, and its associated normalized line coefficients,
LR. The ultimate reprojection error of the spatial line segment,
SWEW, in the present frame is defined as follows:
This study enhances the precision of line feature localization by integrating multi-view depth data. To enhance the error measurement, we propose employing a virtual right camera image method that integrates depth data to generate virtual images, ensuring error consistency between the left and right images. This depth-information-driven optimization significantly mitigates localization drift and improves the resilience of the SLAM system in dynamic settings. The final reprojection error calculation enhances the system’s accuracy and efficiency by integrating depth data from numerous frames and minimizing errors to refine the camera poses and three-dimensional coordinates of line features. This offers dependable assistance for later 3D reconstruction and path planning, improving the system’s efficacy in intricate environments.
3.4. IMU Data Fusion Mechanism
To enhance the robustness of the system in complex mining environments, this paper improves the visual–inertial odometry (VIO) framework of the ORB-SLAM3, focusing on optimizing the fusion mechanism between IMU data and visual data. Specific improvements include an adaptive weight-allocation strategy, enhancements to the visual–inertial optimization framework, and a time synchronization compensation mechanism.
In the visual–inertial fusion process, the weight allocation of IMU data significantly impacts system performance. This paper proposes an adaptive weight allocation method that dynamically adjusts the weight ratio between visual and inertial information based on the current camera motion state. During rapid motion, such as severe vibration or high-speed movement, the weight of IMU data increases, with the weight coefficient raised to 0.7–0.8, to compensate for the feature loss caused by motion blur in visual data. Conversely, during stationary or low-speed motion, the weight of IMU data reduces, with the weight coefficient lowered to 0.3–0.4, to minimize the impact of the IMU noise on the system’s accuracy.
This paper also makes targeted improvements to the visual–inertial optimization framework of the ORB-SLAM3. In the marginalization process, information matrix analysis is introduced to retain critical visual–inertial constraints, avoiding constraint loss due to marginalization. A sliding window strategy is used to dynamically adjust the optimization range, ensuring high accuracy during long-term operation. For global bundle adjustment (BA) optimization, IMU pre-integration residuals are integrated into the global bundle adjustment process, enabling multi-objective joint optimization of visual reprojection errors and inertial residuals.
The joint objective function is minimized using nonlinear optimization methods, as follows:
where
Evisual is the visual reprojection error,
EIMU is the IMU residual, and
wIMU is the adaptive weight coefficient.
5. Experimental Design and Results Analysis
This research assesses the efficacy and practicality of the suggested method through a combination of simulated trials and real-world validation. For the simulation, we utilized the TUM dataset from the Technical University of Munich, Germany, which comprises visual and inertial data from diverse contexts and is extensively employed for the performance assessment of visual SLAM and visual–inertial odometry (VIO) algorithms. Utilizing standard trajectories from the TUM dataset and comparing them with the ORB-SLAM3, we concentrated on evaluating the benefits of the proposed technique in terms of localization precision and dense mapping. Furthermore, comprehensive performance evaluations and three-dimensional mapping simulation tests were executed utilizing the RCBD trajectory data from the TUM dataset to validate the algorithm’s enhancements further.
5.1. System Accuracy Experimental Evaluation
This research employed the freiburg2_desk_with_person sequence from the TUM dataset to assess the efficacy of the proposed approach. This series was acquired using a Kinect sensor and comprises RGB images, depth images, and ground truth trajectory data. This sequence presents formidable challenges including extensive scenes, intricate environments, dynamic objects, and motion loops. These characteristics make it an ideal testing platform for evaluating a SLAM system’s pose estimation accuracy and loop closure detection effectiveness.
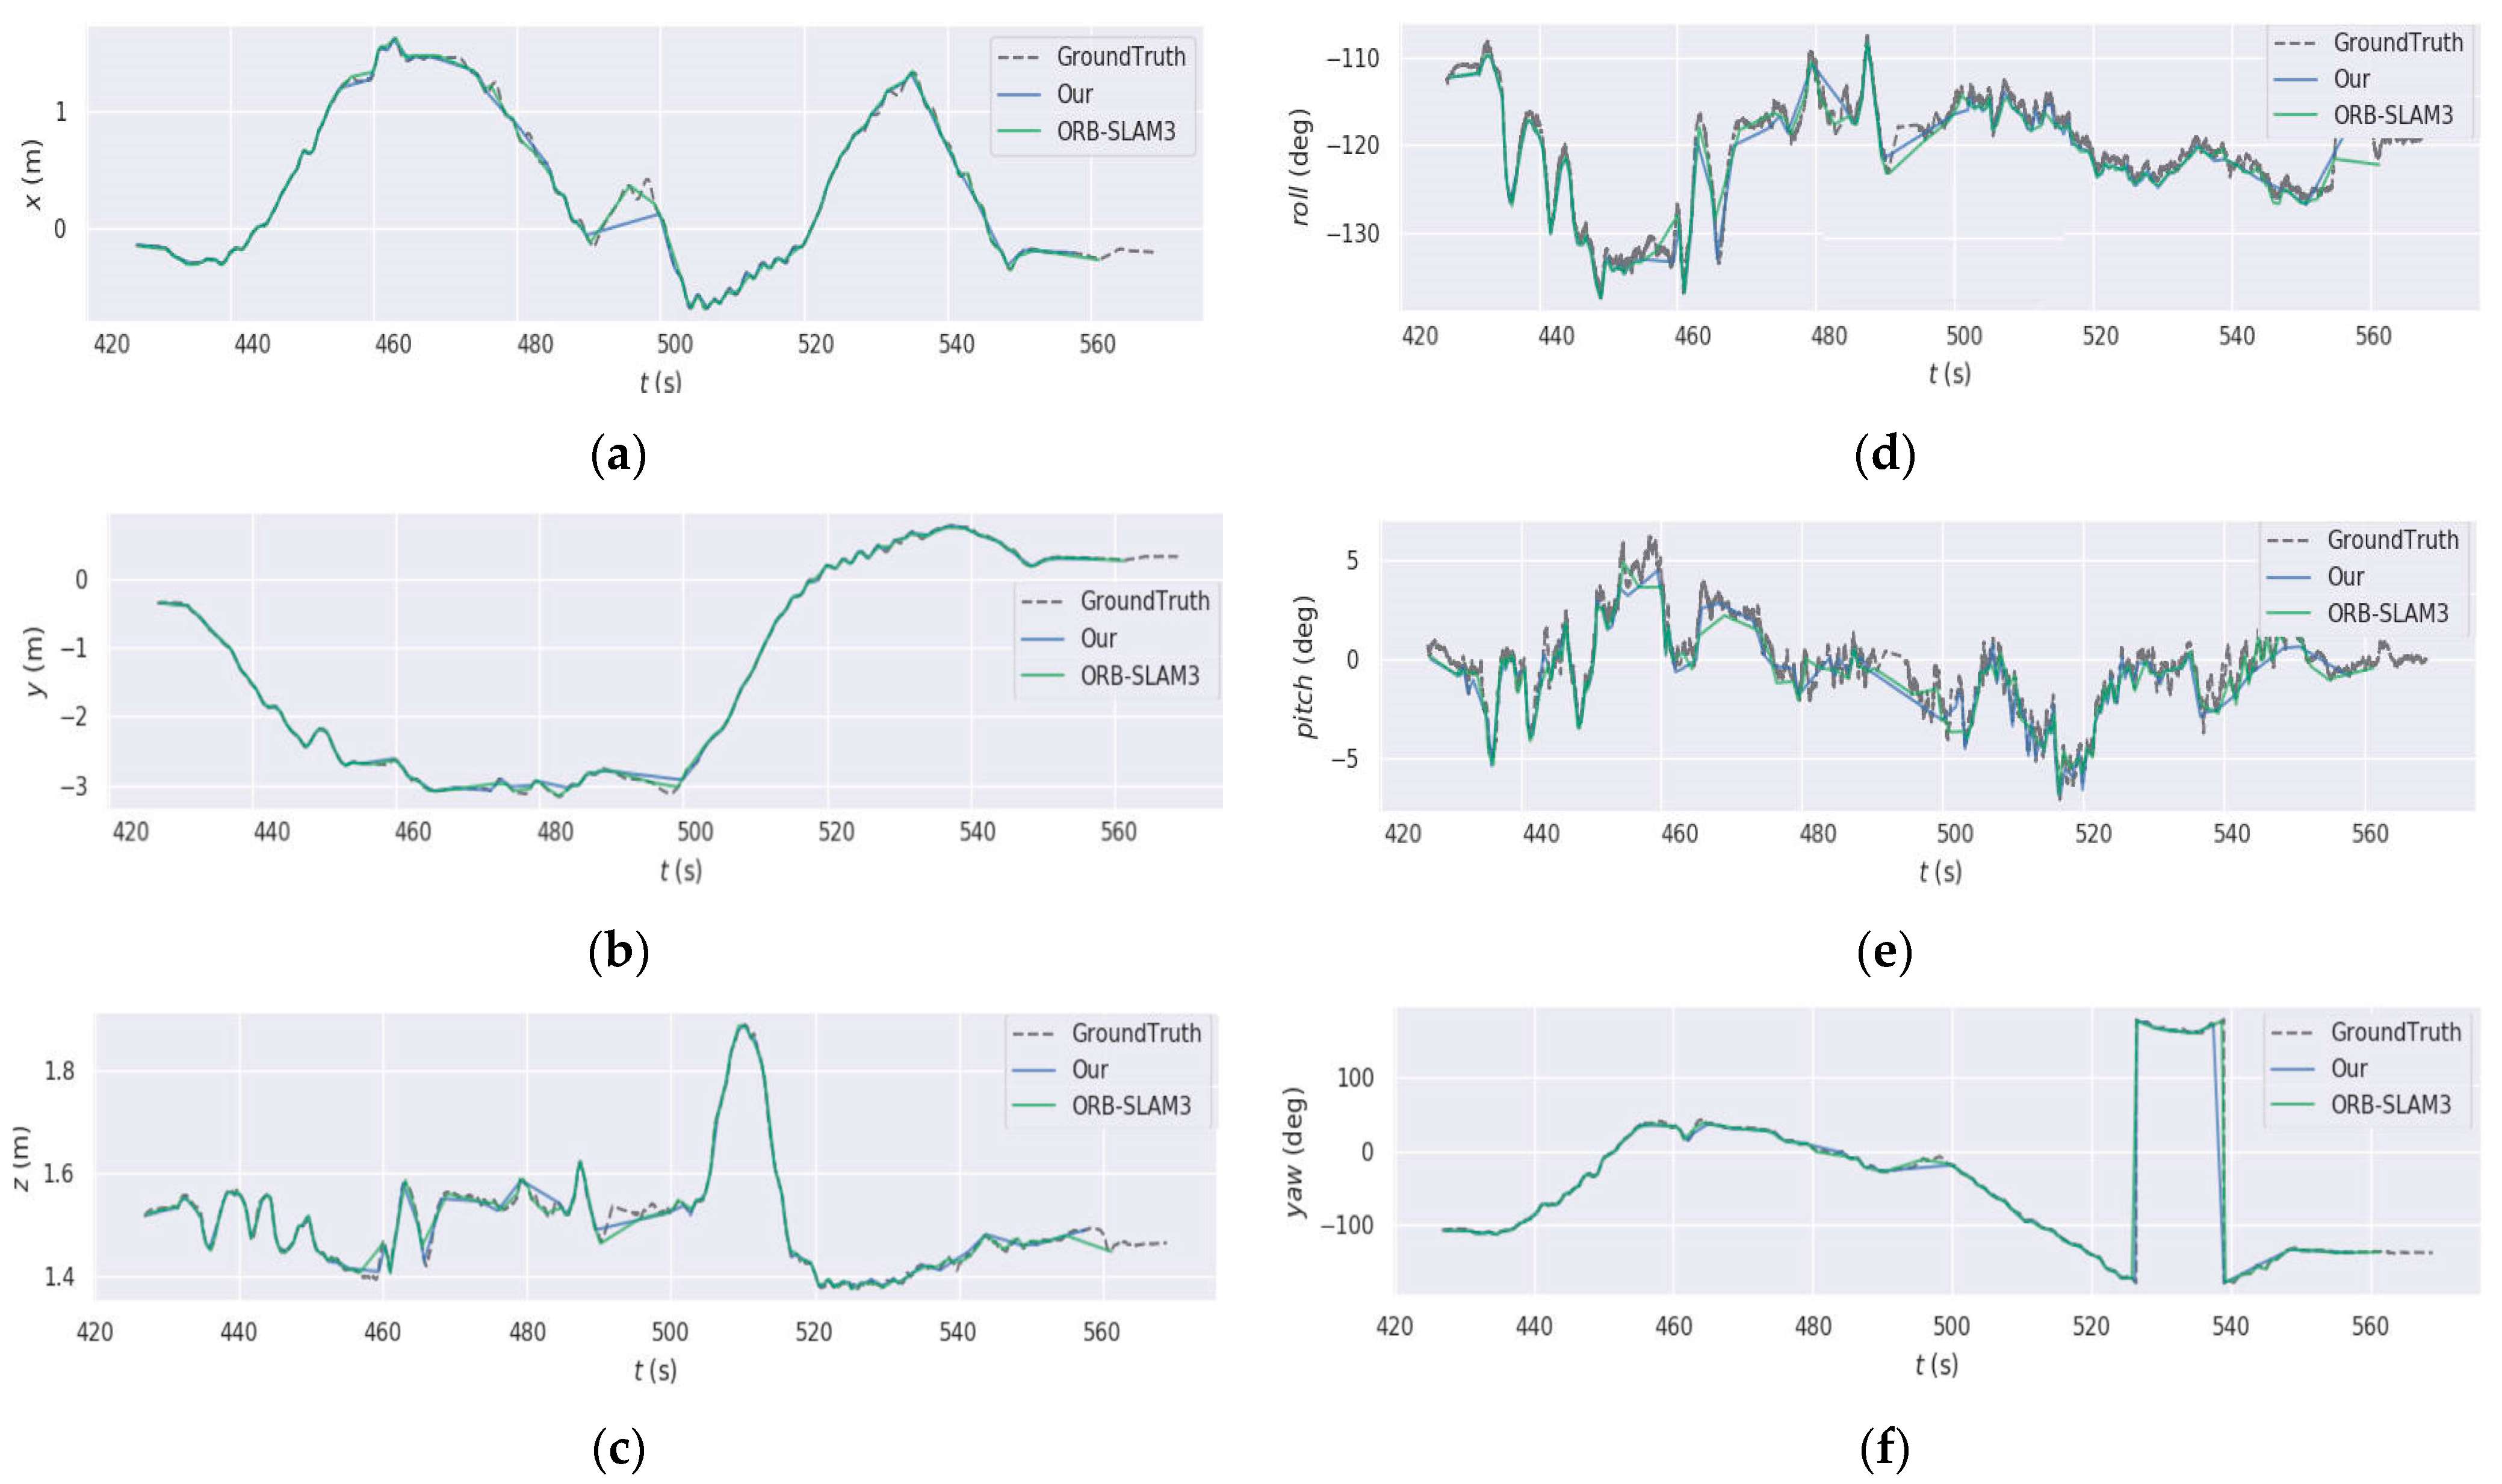
Figure 9 illustrates the enhanced algorithm’s posture estimation outcomes compared to ORB-SLAM3 under six degrees of freedom (6-DoF). The figure demonstrates that, in the translational direction, the enhanced algorithm’s trajectory aligns considerably better with the ground truth trajectory than the ORB-SLAM3. Notably, the enhanced algorithm exhibits reduced error variations throughout the vigorous motion period from 420 s to 560 s, indicating robust stability. The improved method demonstrates a more accurate assessment of attitude angles in the rotational direction, particularly during significant pose alterations like abrupt turns, showcasing greater robustness. Our algorithm produces smoother and more continuous trajectories than the ORB-SLAM3, with better handling of sensor noise and motion uncertainty.
Two principal metrics—Absolute Pose Error (APE) and Relative Pose Error (RPE)—were computed utilizing the EVO tool to assess the algorithm’s effectiveness further.
Figure 10 juxtaposes the APE time series of the two algorithms. The figure illustrates that the enhanced algorithm’s error curve exhibits consistently reduced variations, with errors predominantly remaining below 0.0075 m and a maximum error peak of roughly 0.0175 m, considerably lower than the ORB-SLAM3’s 0.025 m. The enhanced algorithm’s mean and median error values were also around zero, signifying high consistency between the estimated and actual trajectories.
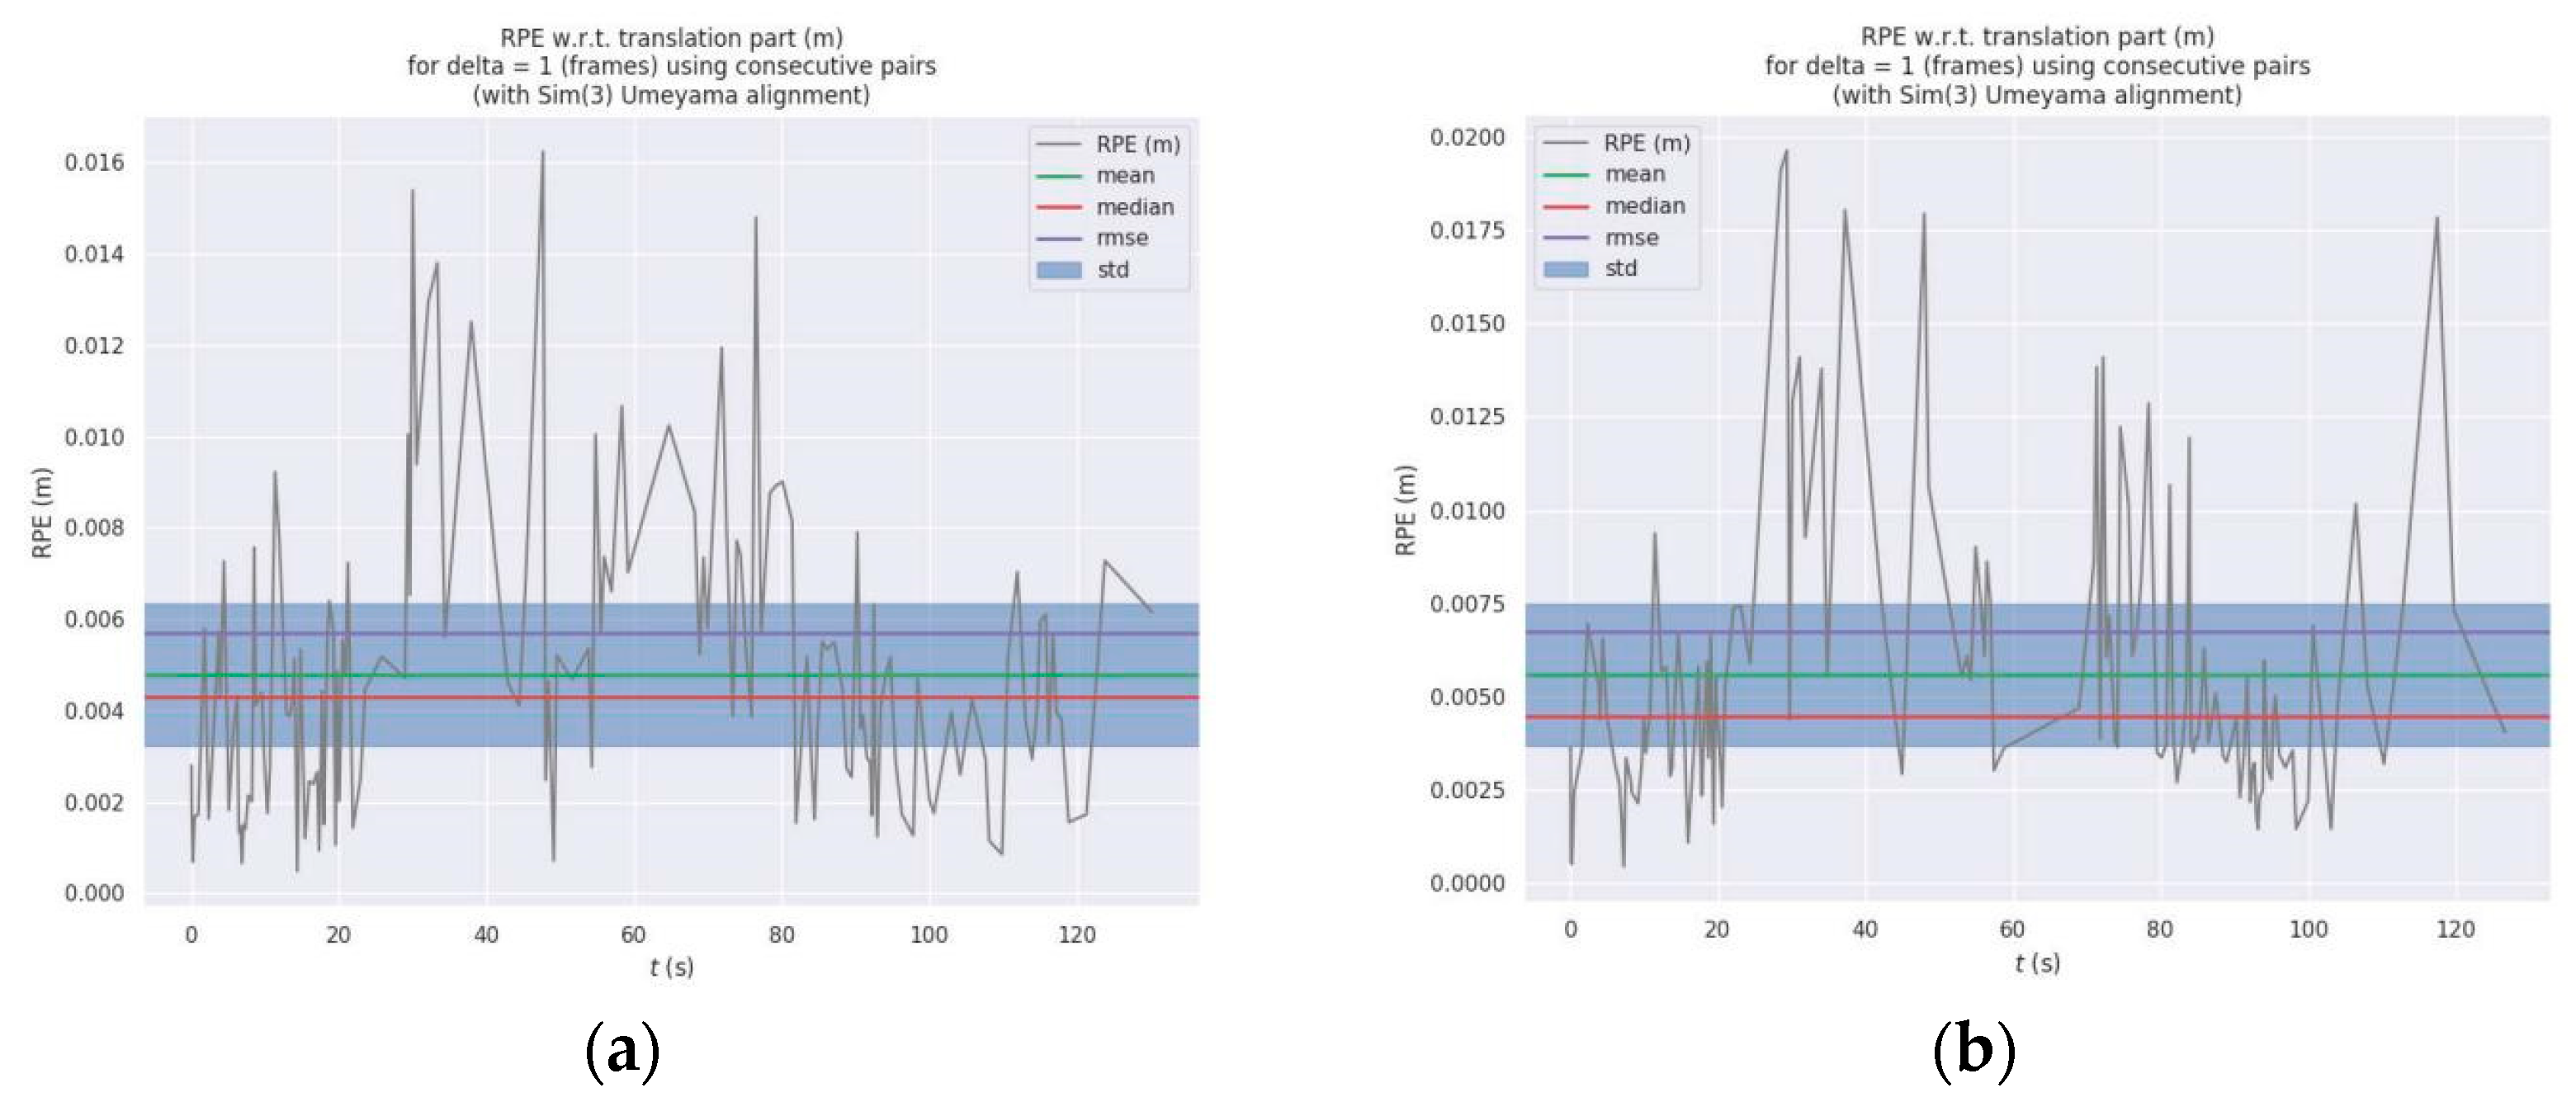
Figure 11’s RPE comparison results indicate that the enhanced algorithm exhibits a more concentrated distribution of relative errors between consecutive frames, with the error fluctuations typically remaining below 0.01 m. Additionally, the envelope area of the error curve is significantly smaller than that of the ORB-SLAM3, accompanied by a narrower standard deviation range, thereby illustrating the algorithm’s superiority in local consistency and reliability.
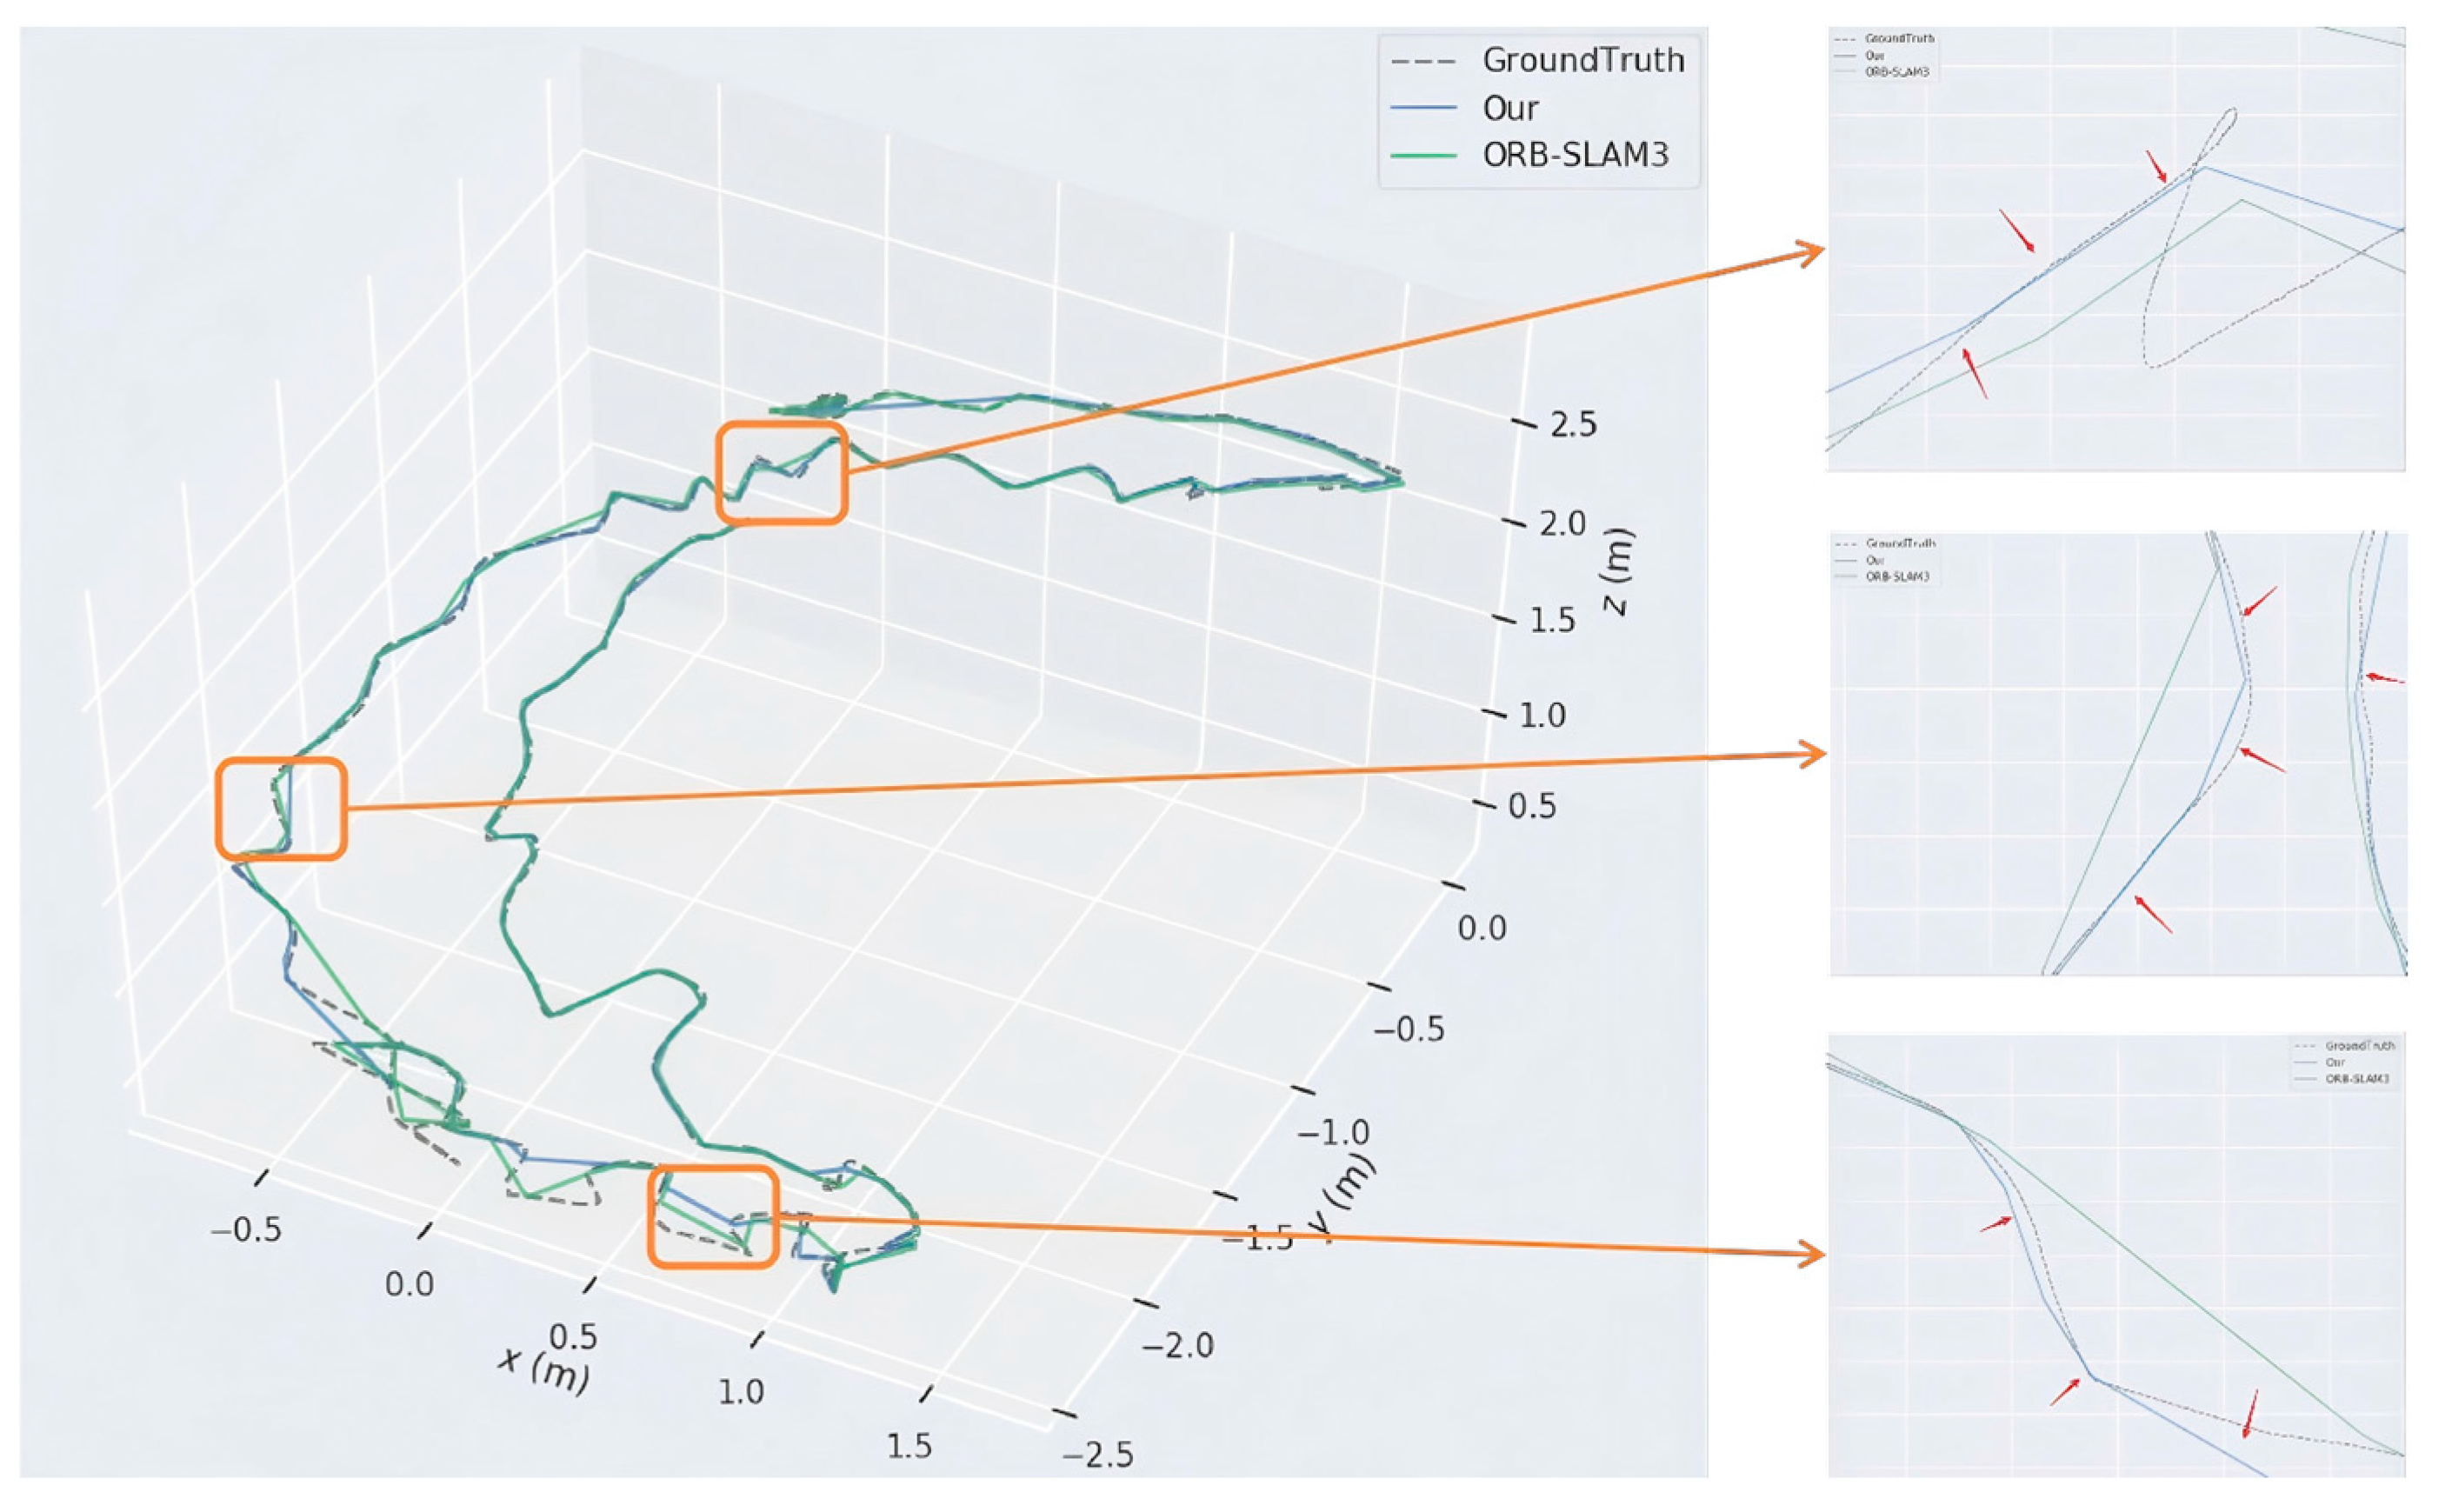
Figure 12 effectively illustrates the comprehensive trajectory comparison results. The primary view distinctly illustrates the trajectory variations between the two algorithms during the complete motion process. In contrast, three localized enlarged views concentrate on trajectory specifics at the corners and straight portions. In all critical domains, the trajectory of the enhanced algorithm (blue line) exhibits strong alignment with the ground truth trajectory, particularly at corners where the enhanced algorithm’s trajectory shifts seamlessly and organically. In contrast, the ORB-SLAM3’s trajectory (green line) exhibits significant offsets and distortions in these regions.
Table 1 and
Table 2 display error metrics derived from 15 iterations of both techniques. The enhanced algorithm diminished the absolute trajectory error, reducing the mean error from 0.010691 m to 0.005951 m, a 44.33% decline; the root mean square error (RMSE) fell from 0.011777 m to 0.006580 m, a 44.15% reduction; the maximum error decreased from 0.027522 m to 0.018487 m, a 32.83% decrease; and the standard deviation was lowered from 0.004938 m to 0.002808 m, a 43.13% reduction. The enhanced algorithm reduced the mean error by 14.34% and the RMSE by 15.64% for the relative trajectory error, with a notable improvement in standard deviation, highlighting the method’s advancements in stability and consistency.
The thorough research confirms that the enhanced approach improves posture estimation accuracy and robustness. The enhanced algorithm substantially improves pose estimate accuracy by incorporating point-line feature extraction, optimizing reprojection error computation, and refining feature matching techniques, all while preserving real-time speed. The enhanced algorithm demonstrates greater resilience and reliability, especially when managing challenging scenarios with intricate scenes and dynamic movements. These performance enhancements offer robust fundamental support for later three-dimensional reconstruction, autonomous navigation, and other sophisticated applications.
5.2. Construction of Dense Point Cloud Map and OctoMap
This paper conducted experiments to validate the efficacy and applicability of the proposed algorithm in dense mapping and OctoMap construction, utilizing six representative RGB-D sequences from the TUM dataset (fr1_xyz, fr2_xyz, fr1_desk, fr2_desk, fr3_long_office, and fr3_walk_rpy), with
Table 3 detailing the parameters of the selected sequences. These datasets encompass several environmental categories, including dynamic settings, static scenes, and varying trajectory lengths and motion attributes. Building upon the conventional ORB-SLAM3 technique, dense point cloud maps and octree maps were developed. The performances of the dense point cloud maps and octree maps generated under various scenarios were meticulously assessed by examining essential variables, including the point cloud dispersion, scene geometric completeness, and storage efficiency.
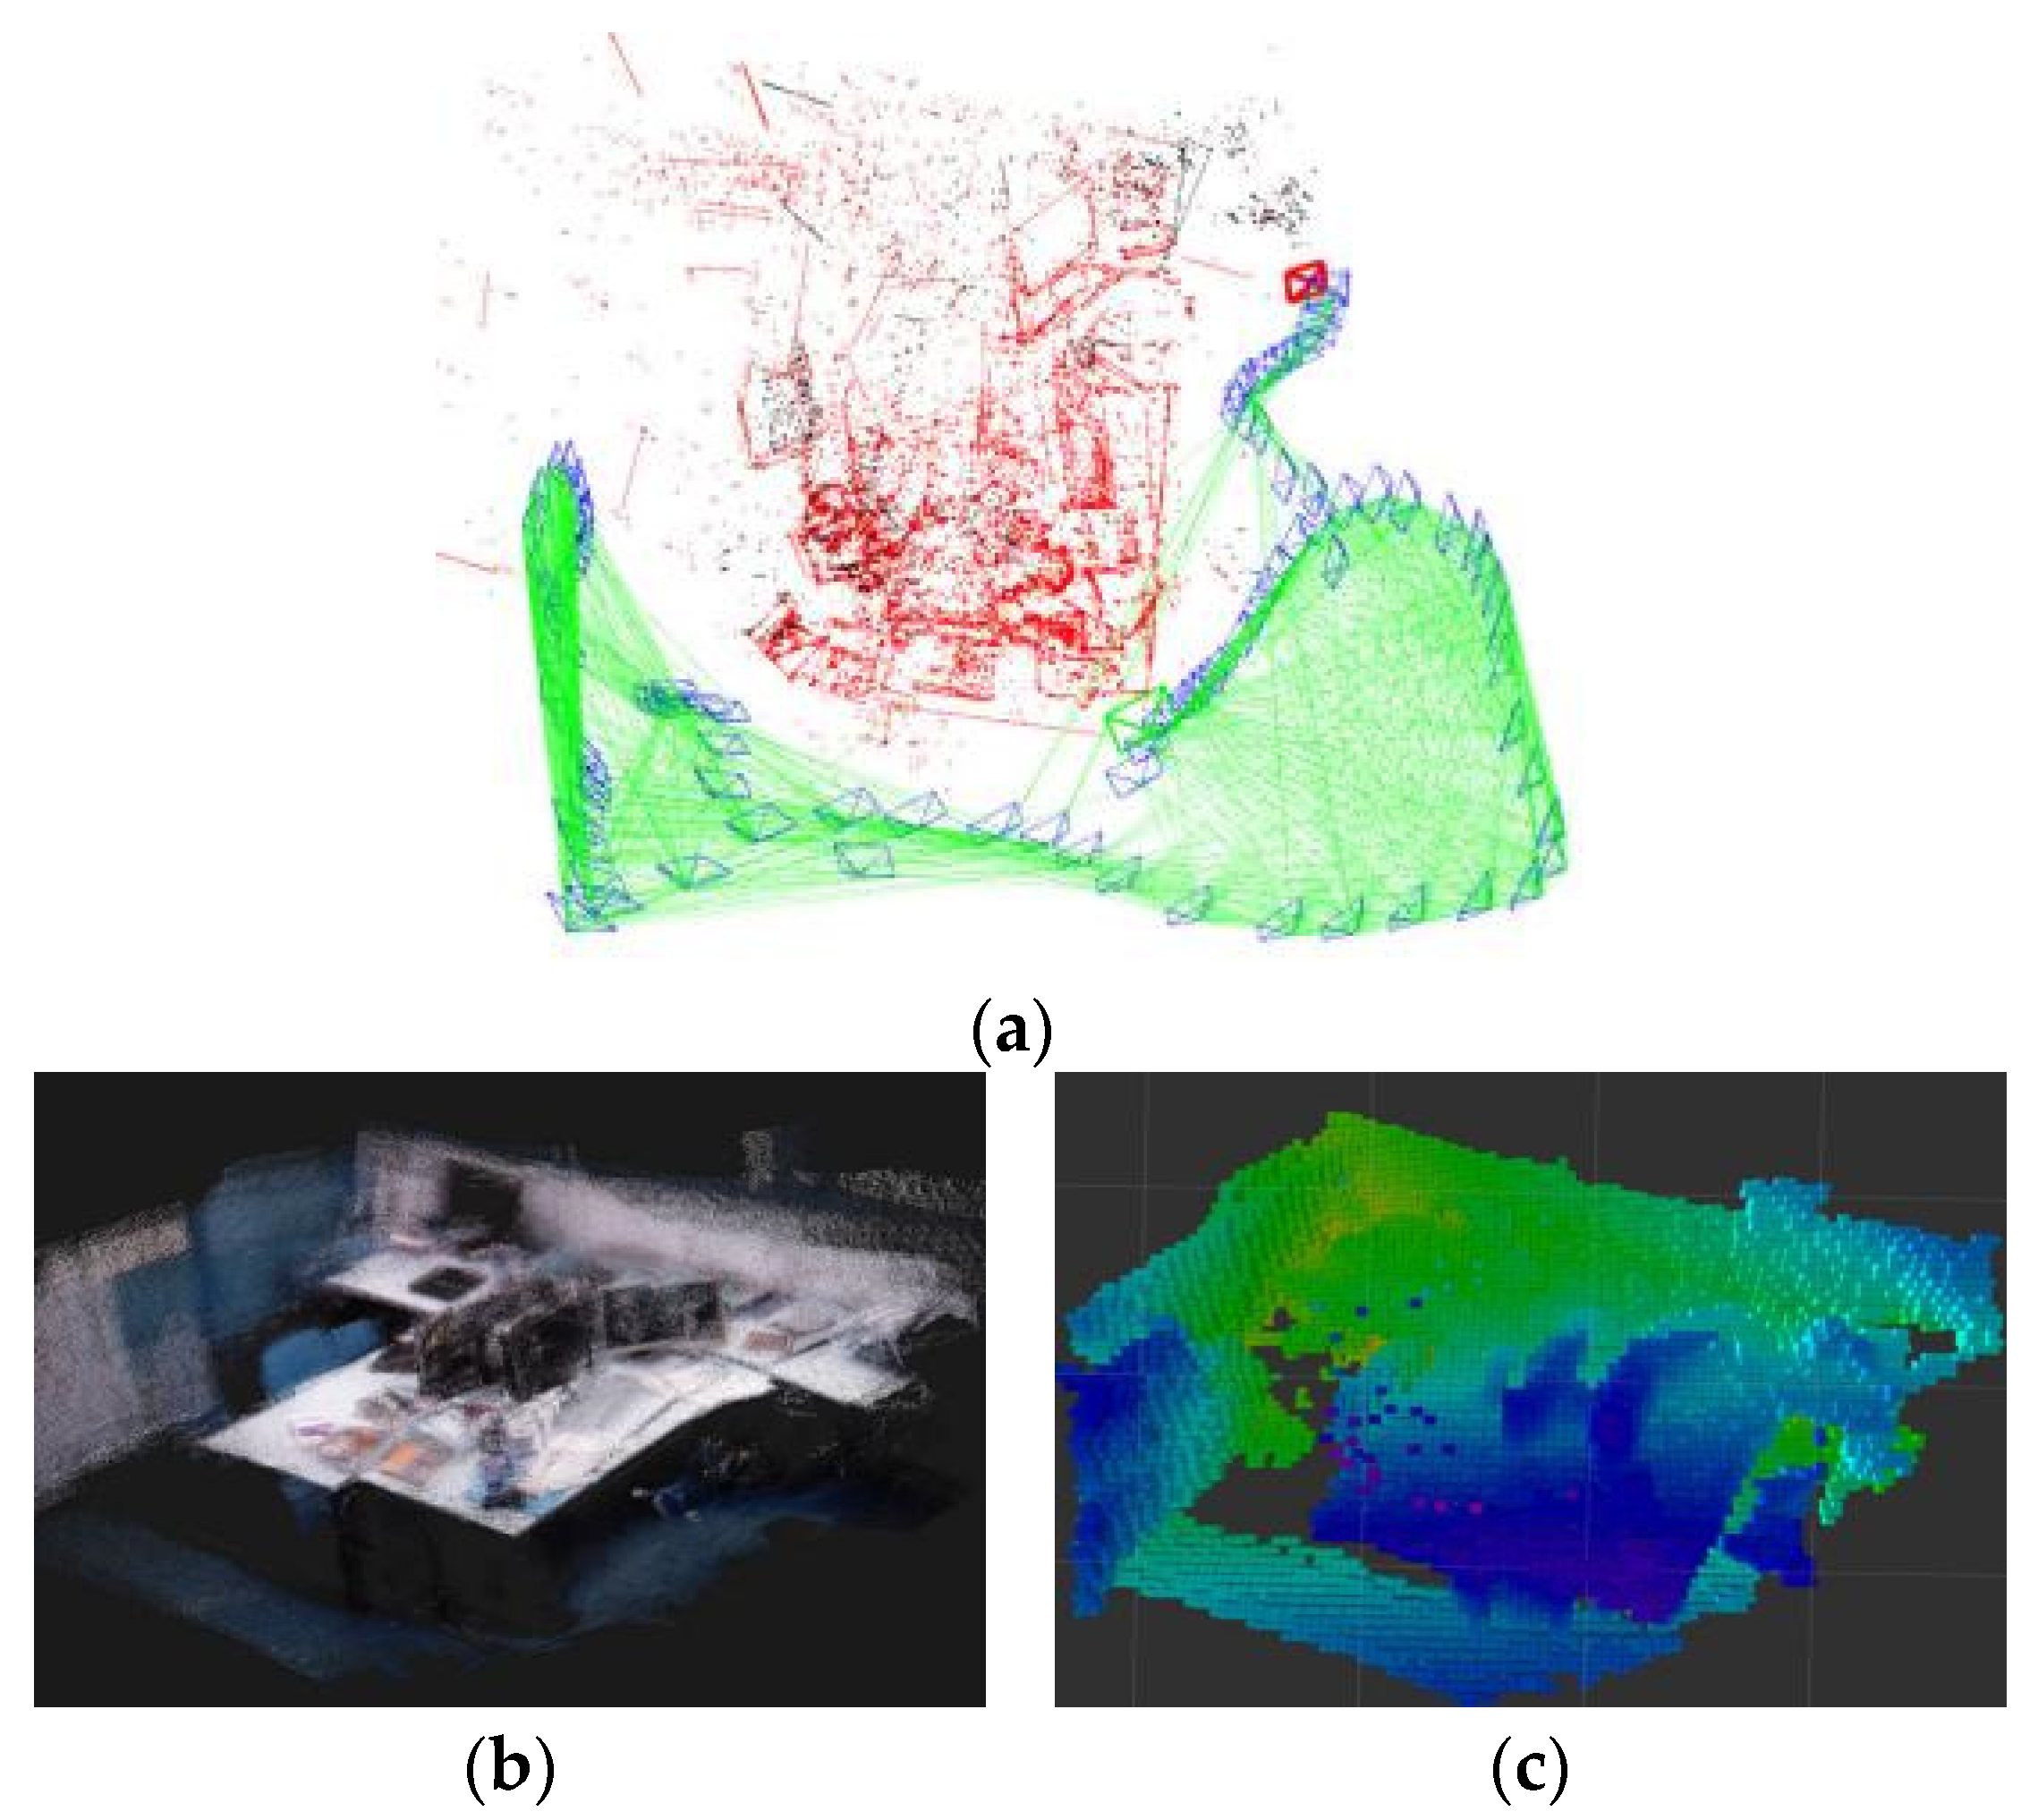
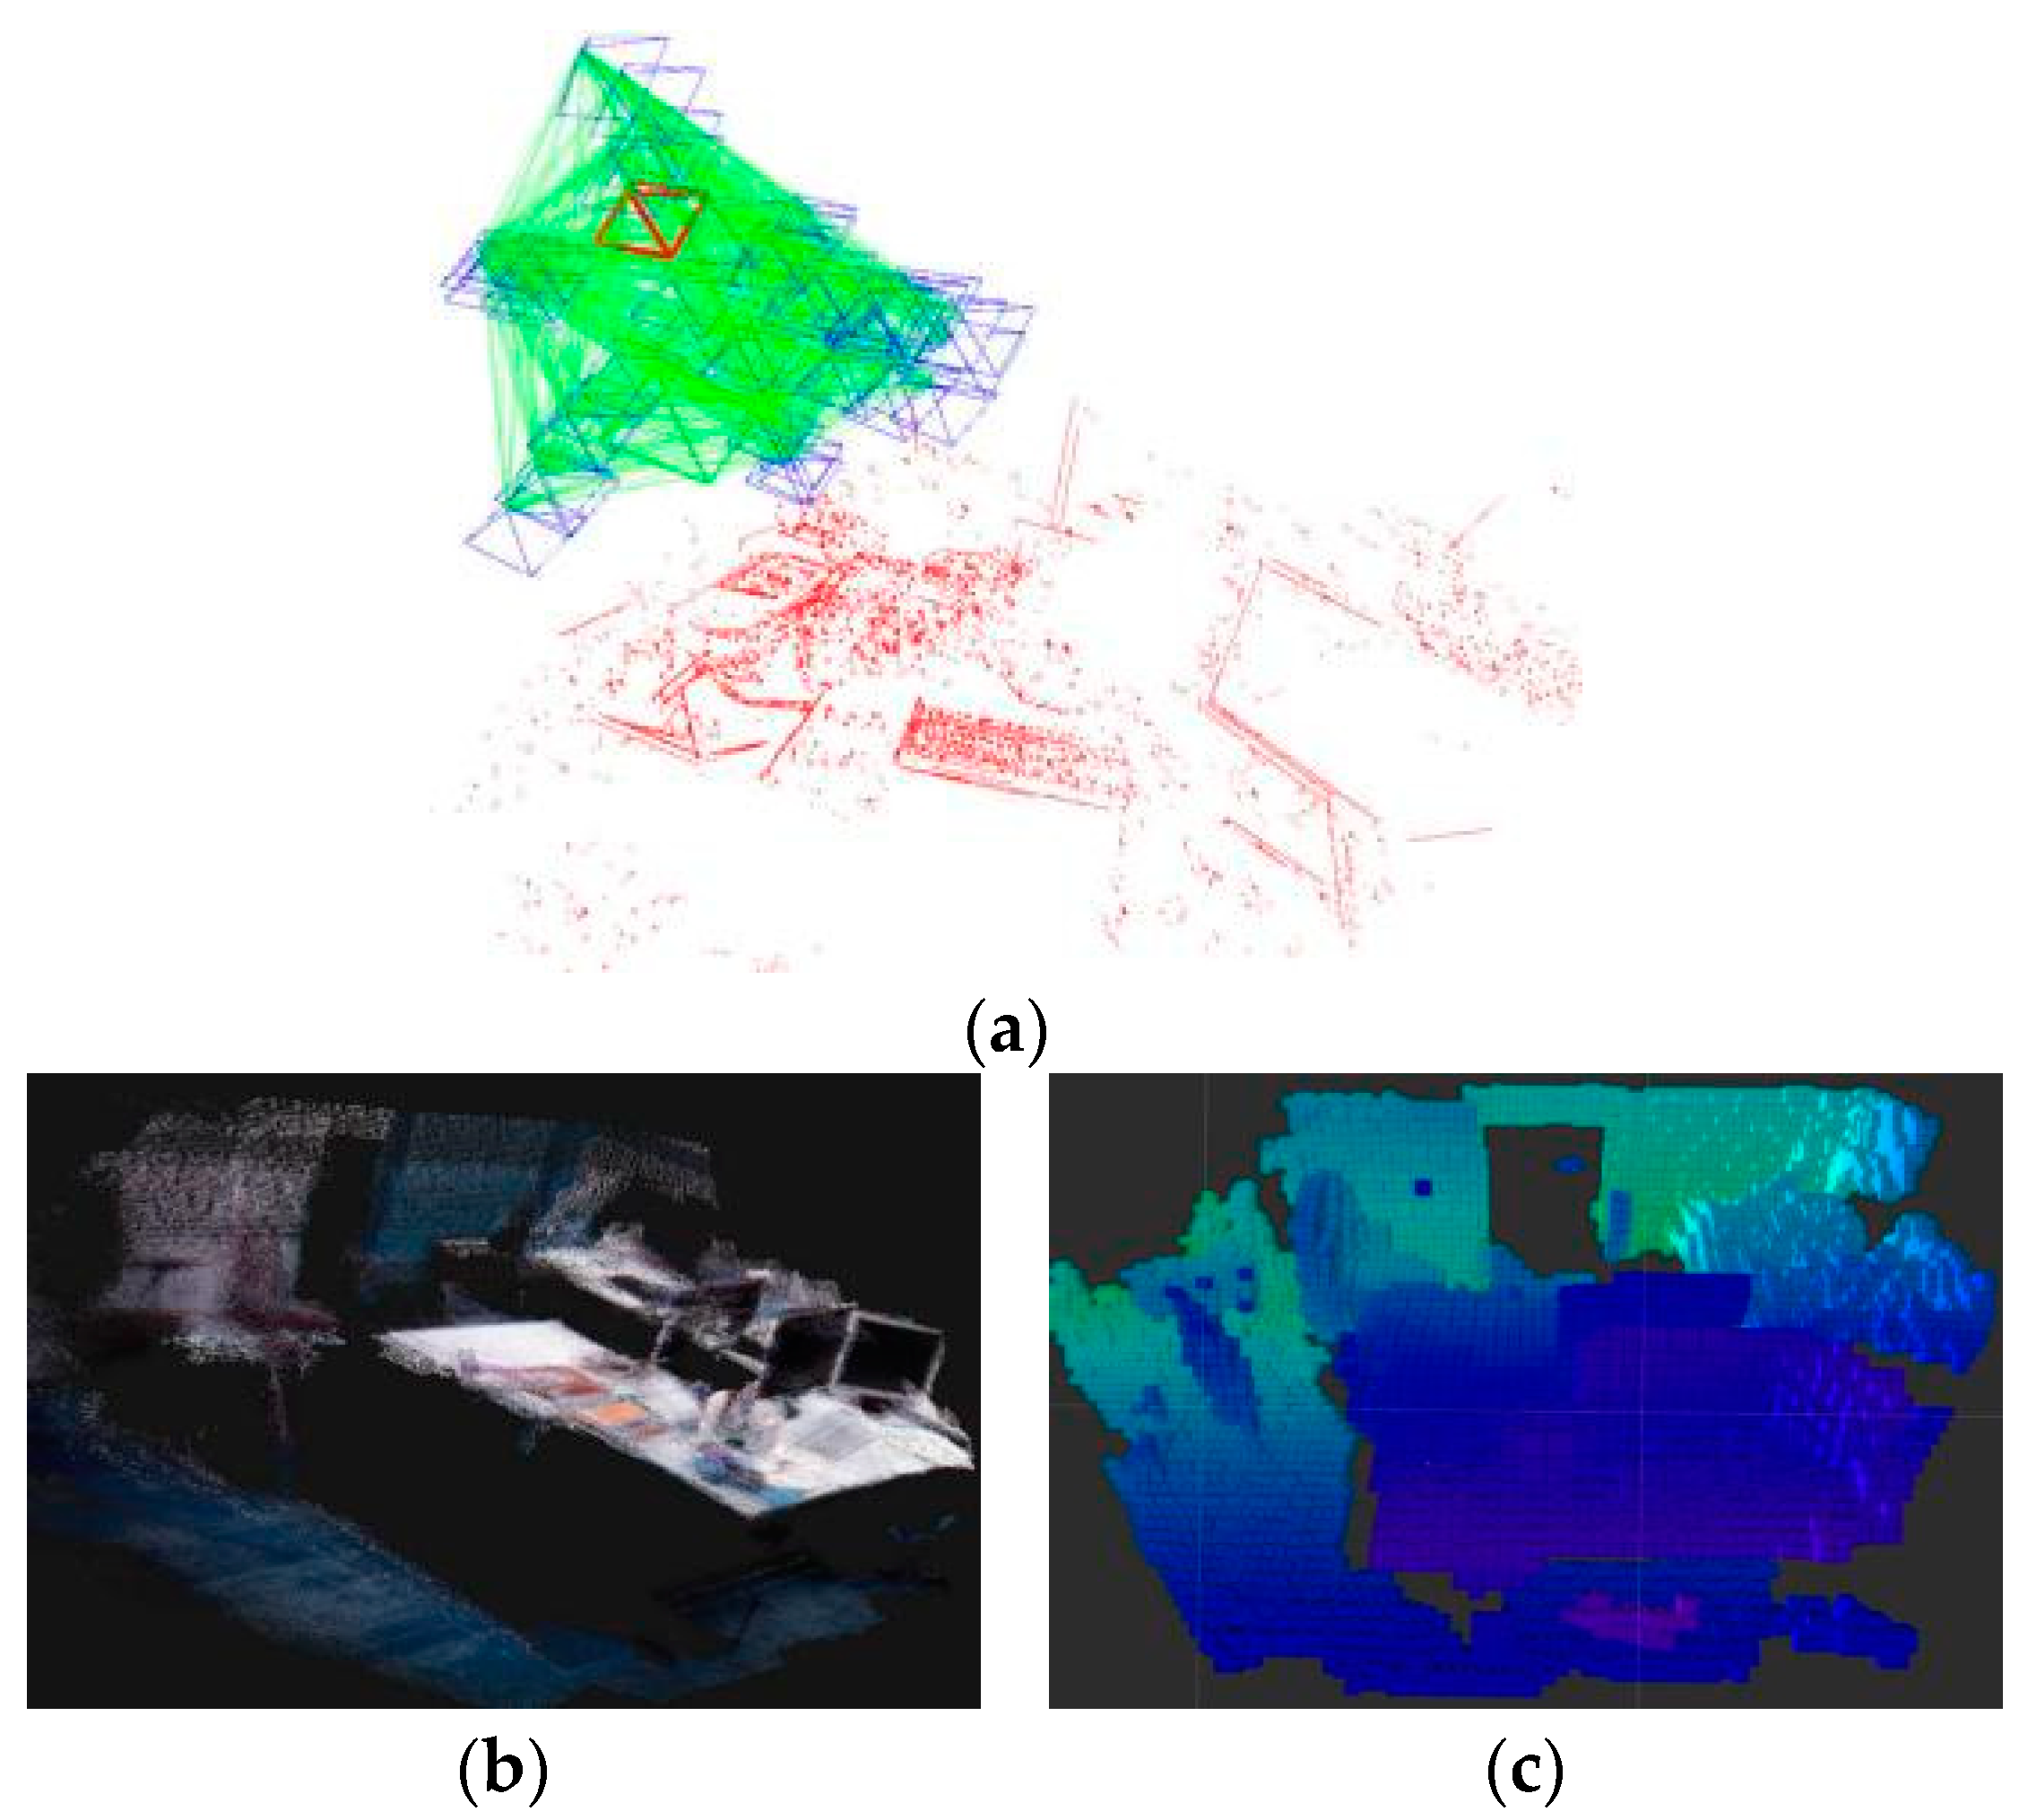
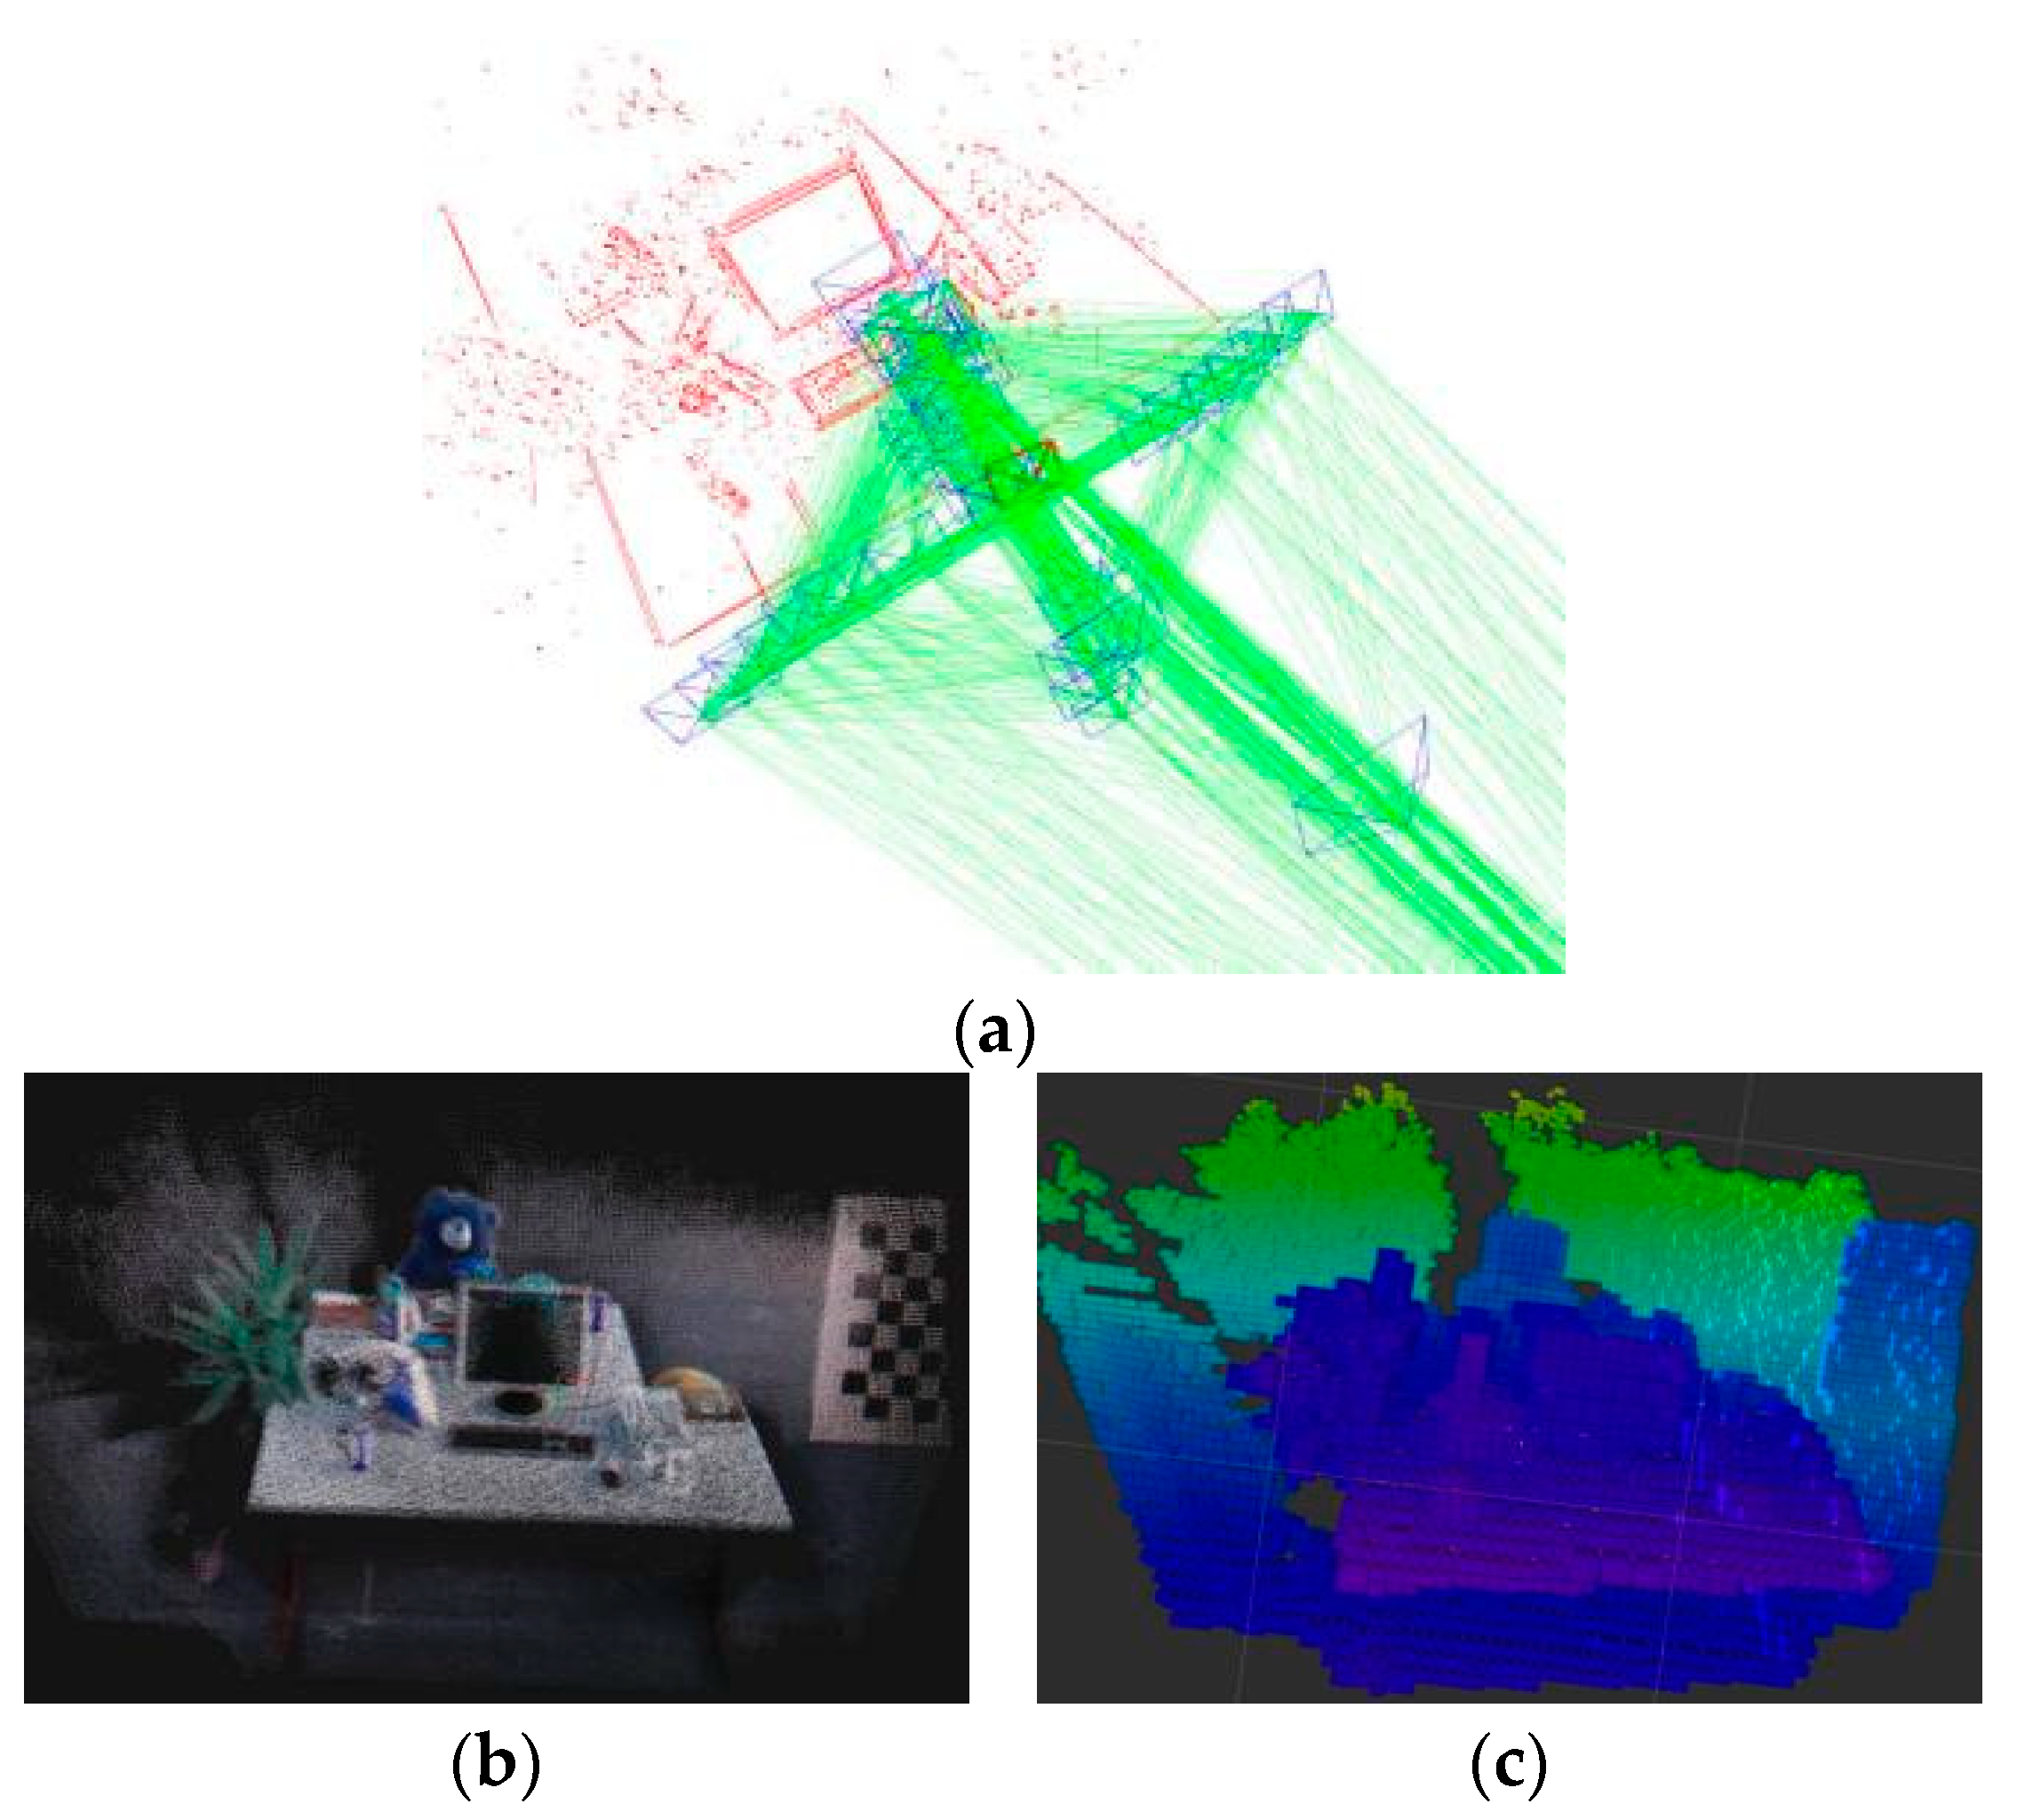
This paper investigated the performances of several map representation approaches by comparing their mapping results on the TUM dataset, as illustrated in
Figure 13,
Figure 14,
Figure 15,
Figure 16,
Figure 17 and
Figure 18. The experimental results indicate that the proposed approach effectively produces high-quality environmental maps across various situations, exhibiting notable benefits in dense reconstruction and spatial representation.
Sparse maps for small-scale indoor scenes (such as fr1_desk and fr1_xyz) consist solely of essential feature points, which, although they can represent fundamental spatial patterns, have limitations in detail representation. Conversely, dense point cloud maps may fully rebuild rigid entities such as desktops and keyboards and precisely depict extensive planar structures like walls and floors. Moreover, the voxelized representation post-OctoMap conversion enhances the spatial structure, distinctly illustrating variations across different height strata, with color gradients rendering spatial elevation changes readily observable. In more extensive scenarios (such as fr2_desk and fr2_xyz), despite heightened scene complexity, the system sustains a consistent mapping performance. Dense point cloud maps have considerable advantages over sparse maps in geometric completeness and feature retention, effectively reproducing multi-level structures in office settings. In the fr2_desk sequence, the dense map effectively illustrates the spatial arrangement of desks and chairs and their positional relationships. Conversely, the feature points in sparse maps are more scattered, hindering the accurate representation of the scene’s structural information.
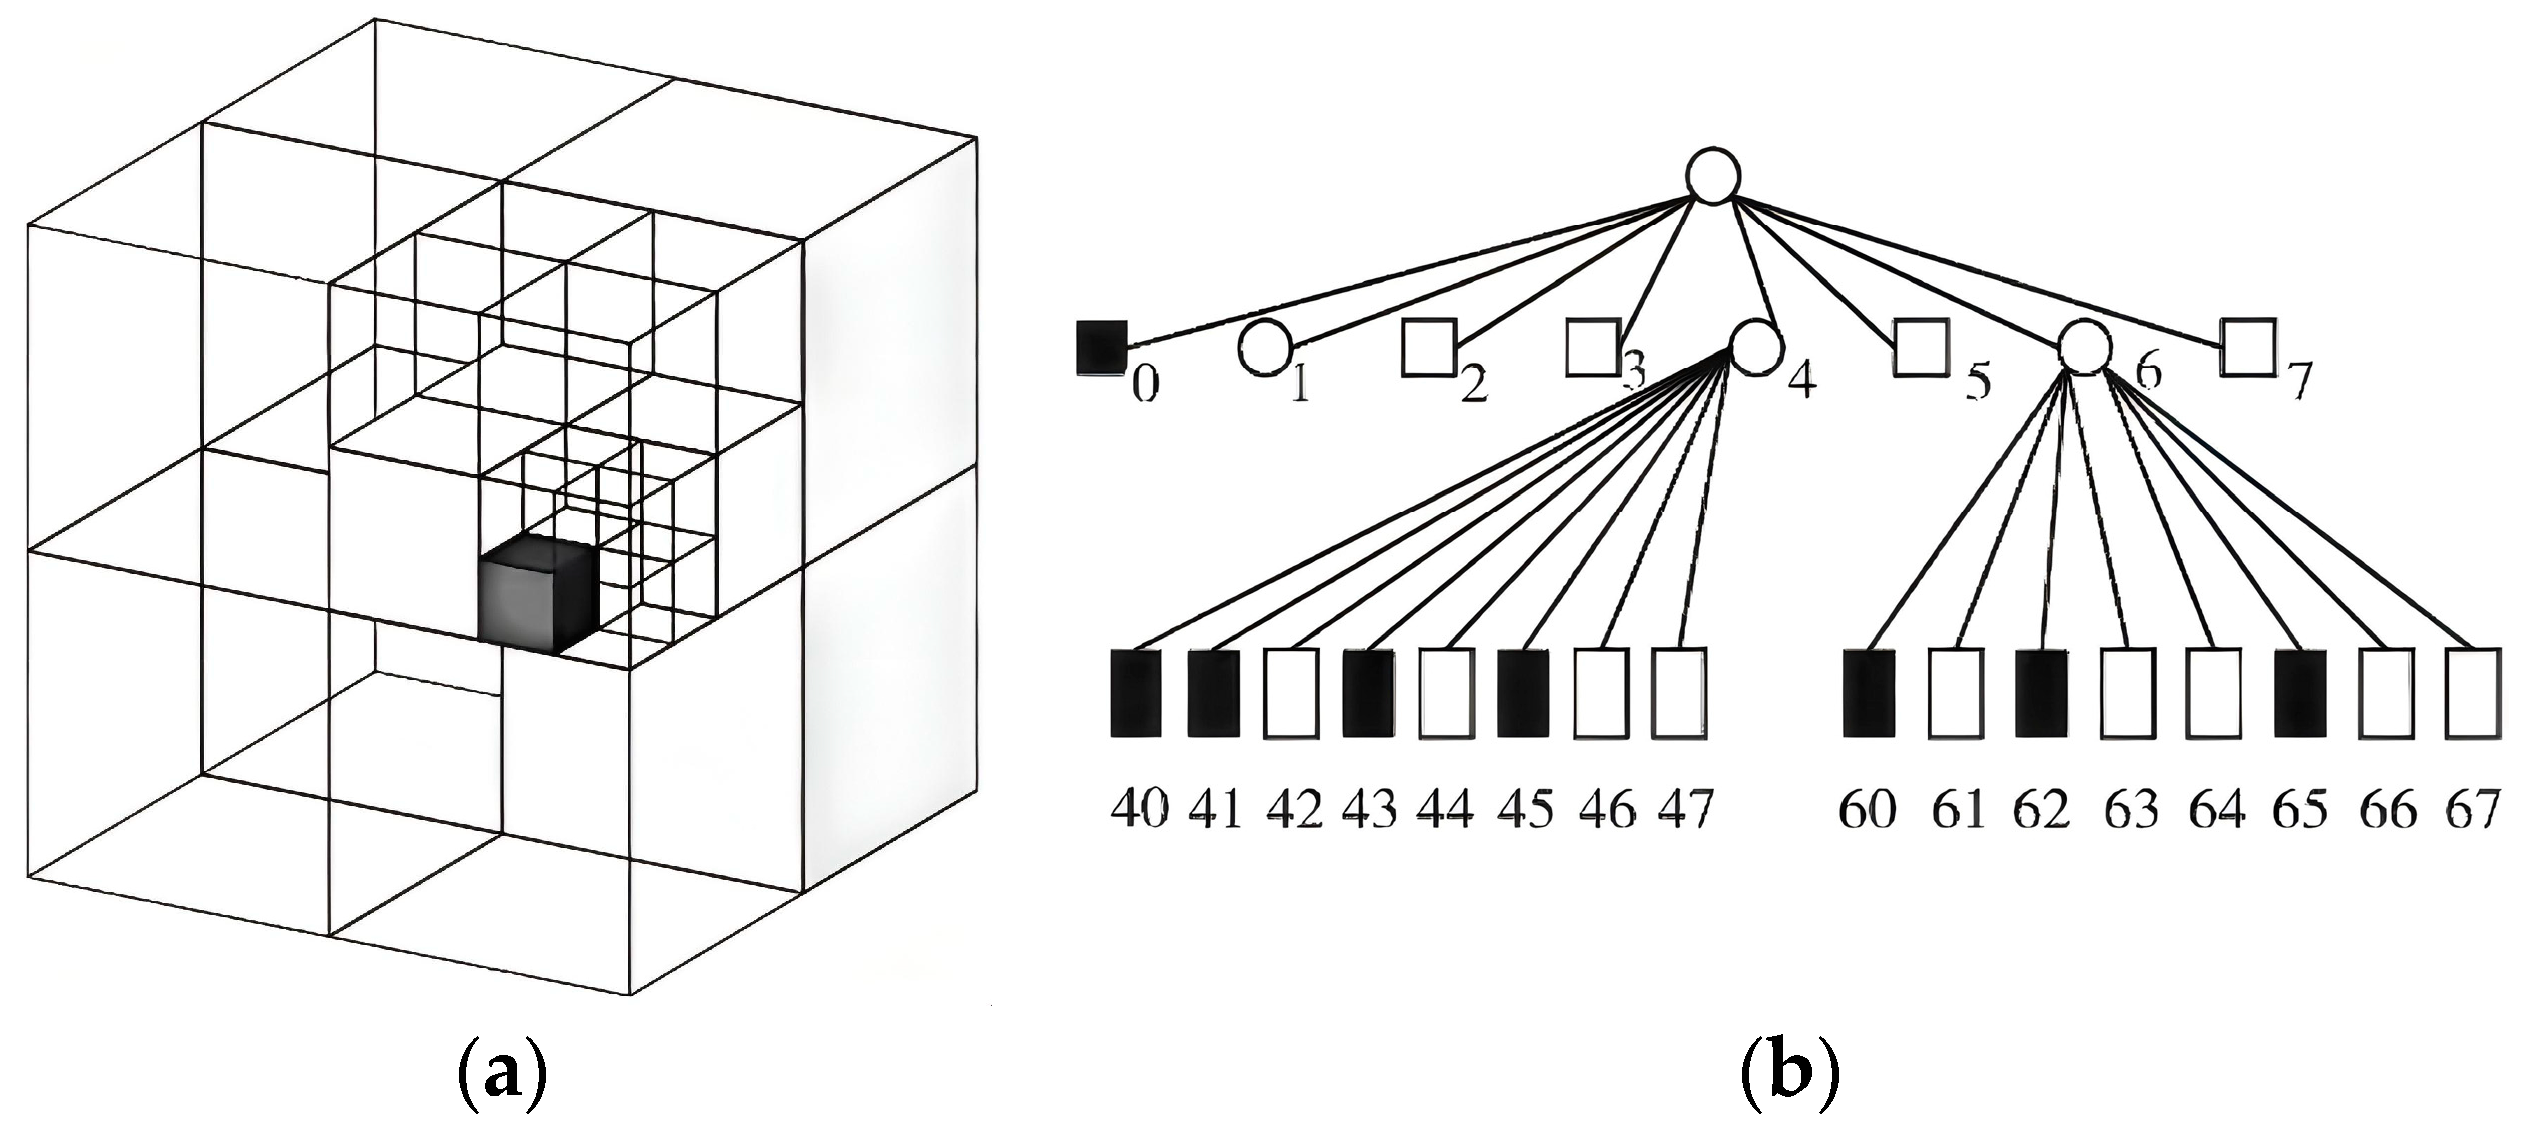
The algorithm exhibits exceptional environmental sensing abilities in more demanding scenarios (such as fr3_long_office and fr3_walk_rpy). The fr3_long_office sequence, featuring extensive office environments, effectively reconstructs comprehensive spatial structures through a dense point cloud map, encompassing intricate arrangements of corridors and office desks. The fr3_walk_rpy sequence, which includes dynamic objects, demonstrates the algorithm’s high mapping accuracy due to efficient feature screening techniques that substantially mitigate interference from dynamic elements, showcasing its robustness in dynamic contexts.
Furthermore, maps produced post-octree conversion achieve effective spatial encoding while preserving the structural integrity of the environment. Color coding at varying altitudes quickly illustrates variations in scene elevation, offering an optimal environmental representation for robotic 3D navigation planning. In extensive environments, such as fr3_long_office, octree maps proficiently manage sensor noise by probabilistic modeling, producing distinctly layered and organized spatial representations.
The resulting octree maps, derived from dense point cloud maps, enhance map storage efficiency via voxelized representation.
Table 4 illustrates the variations in storage space across six distinct scene sequences utilizing the enhanced SLAM system.
In indoor scenes fr1_desk and fr1_xyz, point cloud maps require 6.5 M and 7.3 M storage, respectively, compressed to 43.5 k and 45.7 k after conversion to octree maps. In more significant scenes, fr2_desk and fr3_long_office, point cloud maps occupy 29.8 M and 53.2 M of storage, with their corresponding octree maps necessitating only 203.2 k and 314.6 k. In the dynamic scene fr3_walk_rpy, the point cloud map occupies 5.5 M, reducing to 36.8 k after octree representation. The experimental data indicate that octree maps substantially minimize storage overhead via effective spatial encoding. Their hierarchical spatial partition structure exhibits distinct advantages in various aspects. In contrast, the normalized spatial representation structure offers an efficient computational framework for complex tasks, including environmental perception, path planning, and dynamic obstacle avoidance for mobile robots.
The experimental results confirm the robustness and applicability of the enhanced approach across many contexts. The complete procedure, encompassing sparse characteristics, dense reconstruction, and subsequent octree representation, exhibits exceptional environmental awareness and modeling proficiency. This organized environmental representation technique renders octree maps especially appropriate for autonomous robotic navigation in intricate dynamic settings, indicating extensive application potential.
5.3. Simulated Mining Environment Experiment
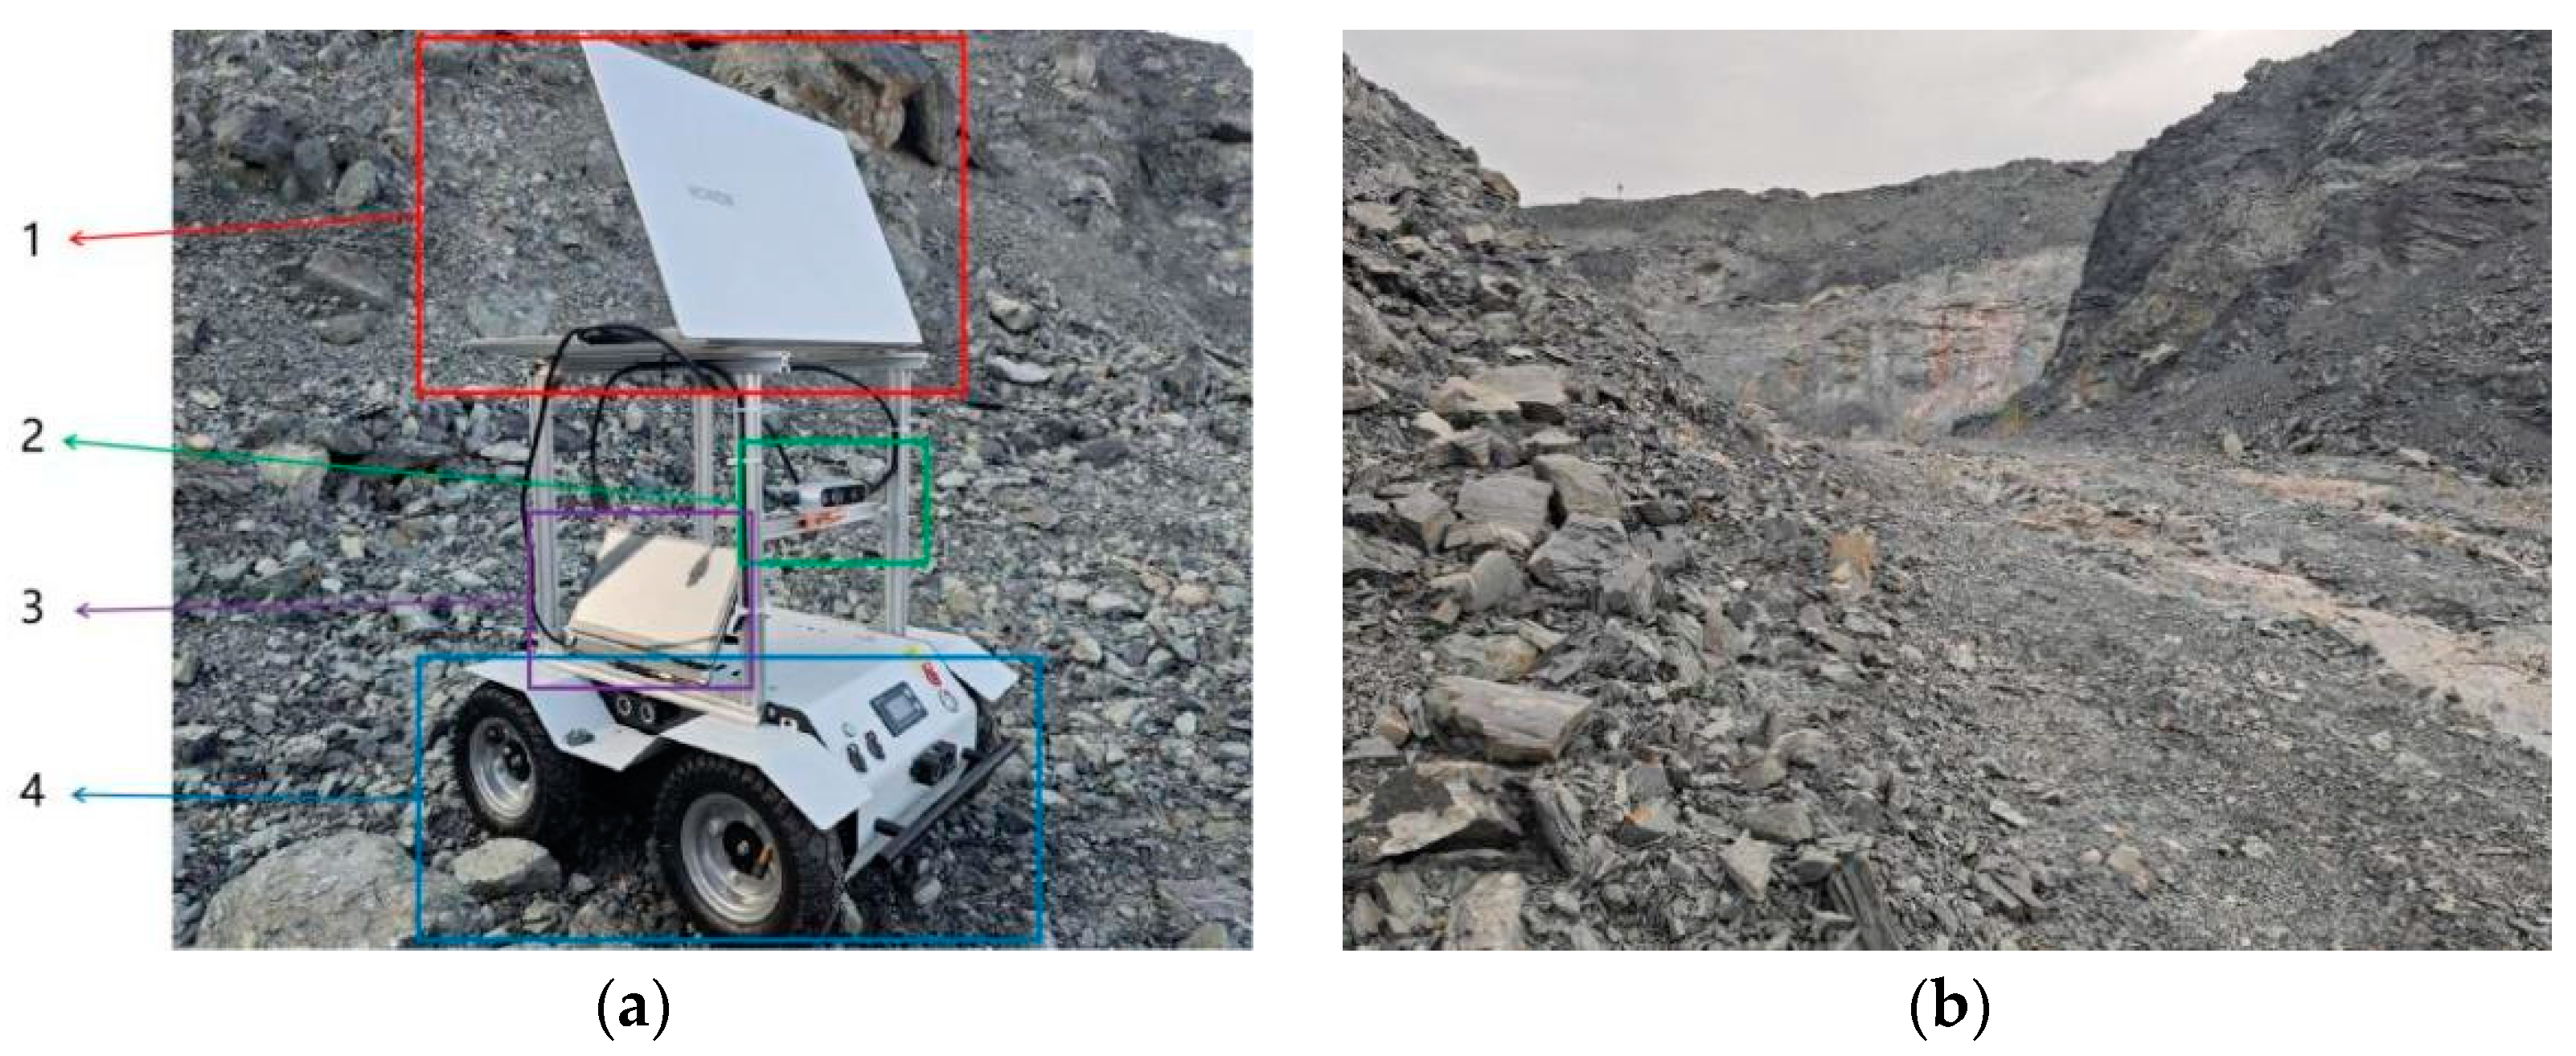
To validate the proposed system’s applicability in real-world scenarios and to replicate actual application environments, the experiment utilized a construction site that emulates a genuine open-pit mining construction setting, as depicted in
Figure 19b. A mining mapping robot prototype, illustrated in
Figure 19a, was employed for field testing. This experiment aimed to validate the dense point cloud map and octree map construction capabilities of the enhanced algorithm in real-world settings. The experimental design chose a standard open-pit mining construction road section for testing, which encompasses typical open-pit mining environmental factors, including gravel rock walls and uneven terrain, to assess the algorithm’s dense mapping accuracy and mapping expression capability in complex environments. The experimental hardware platform comprised an Intel Core i7-10510U processor (4 cores), 8 GB of RAM, and an Intel RealSense Depth Camera D435i for data acquisition. The system operated within the Ubuntu 20.04 environment, utilizing an algorithm implemented on the ROS Noetic version.
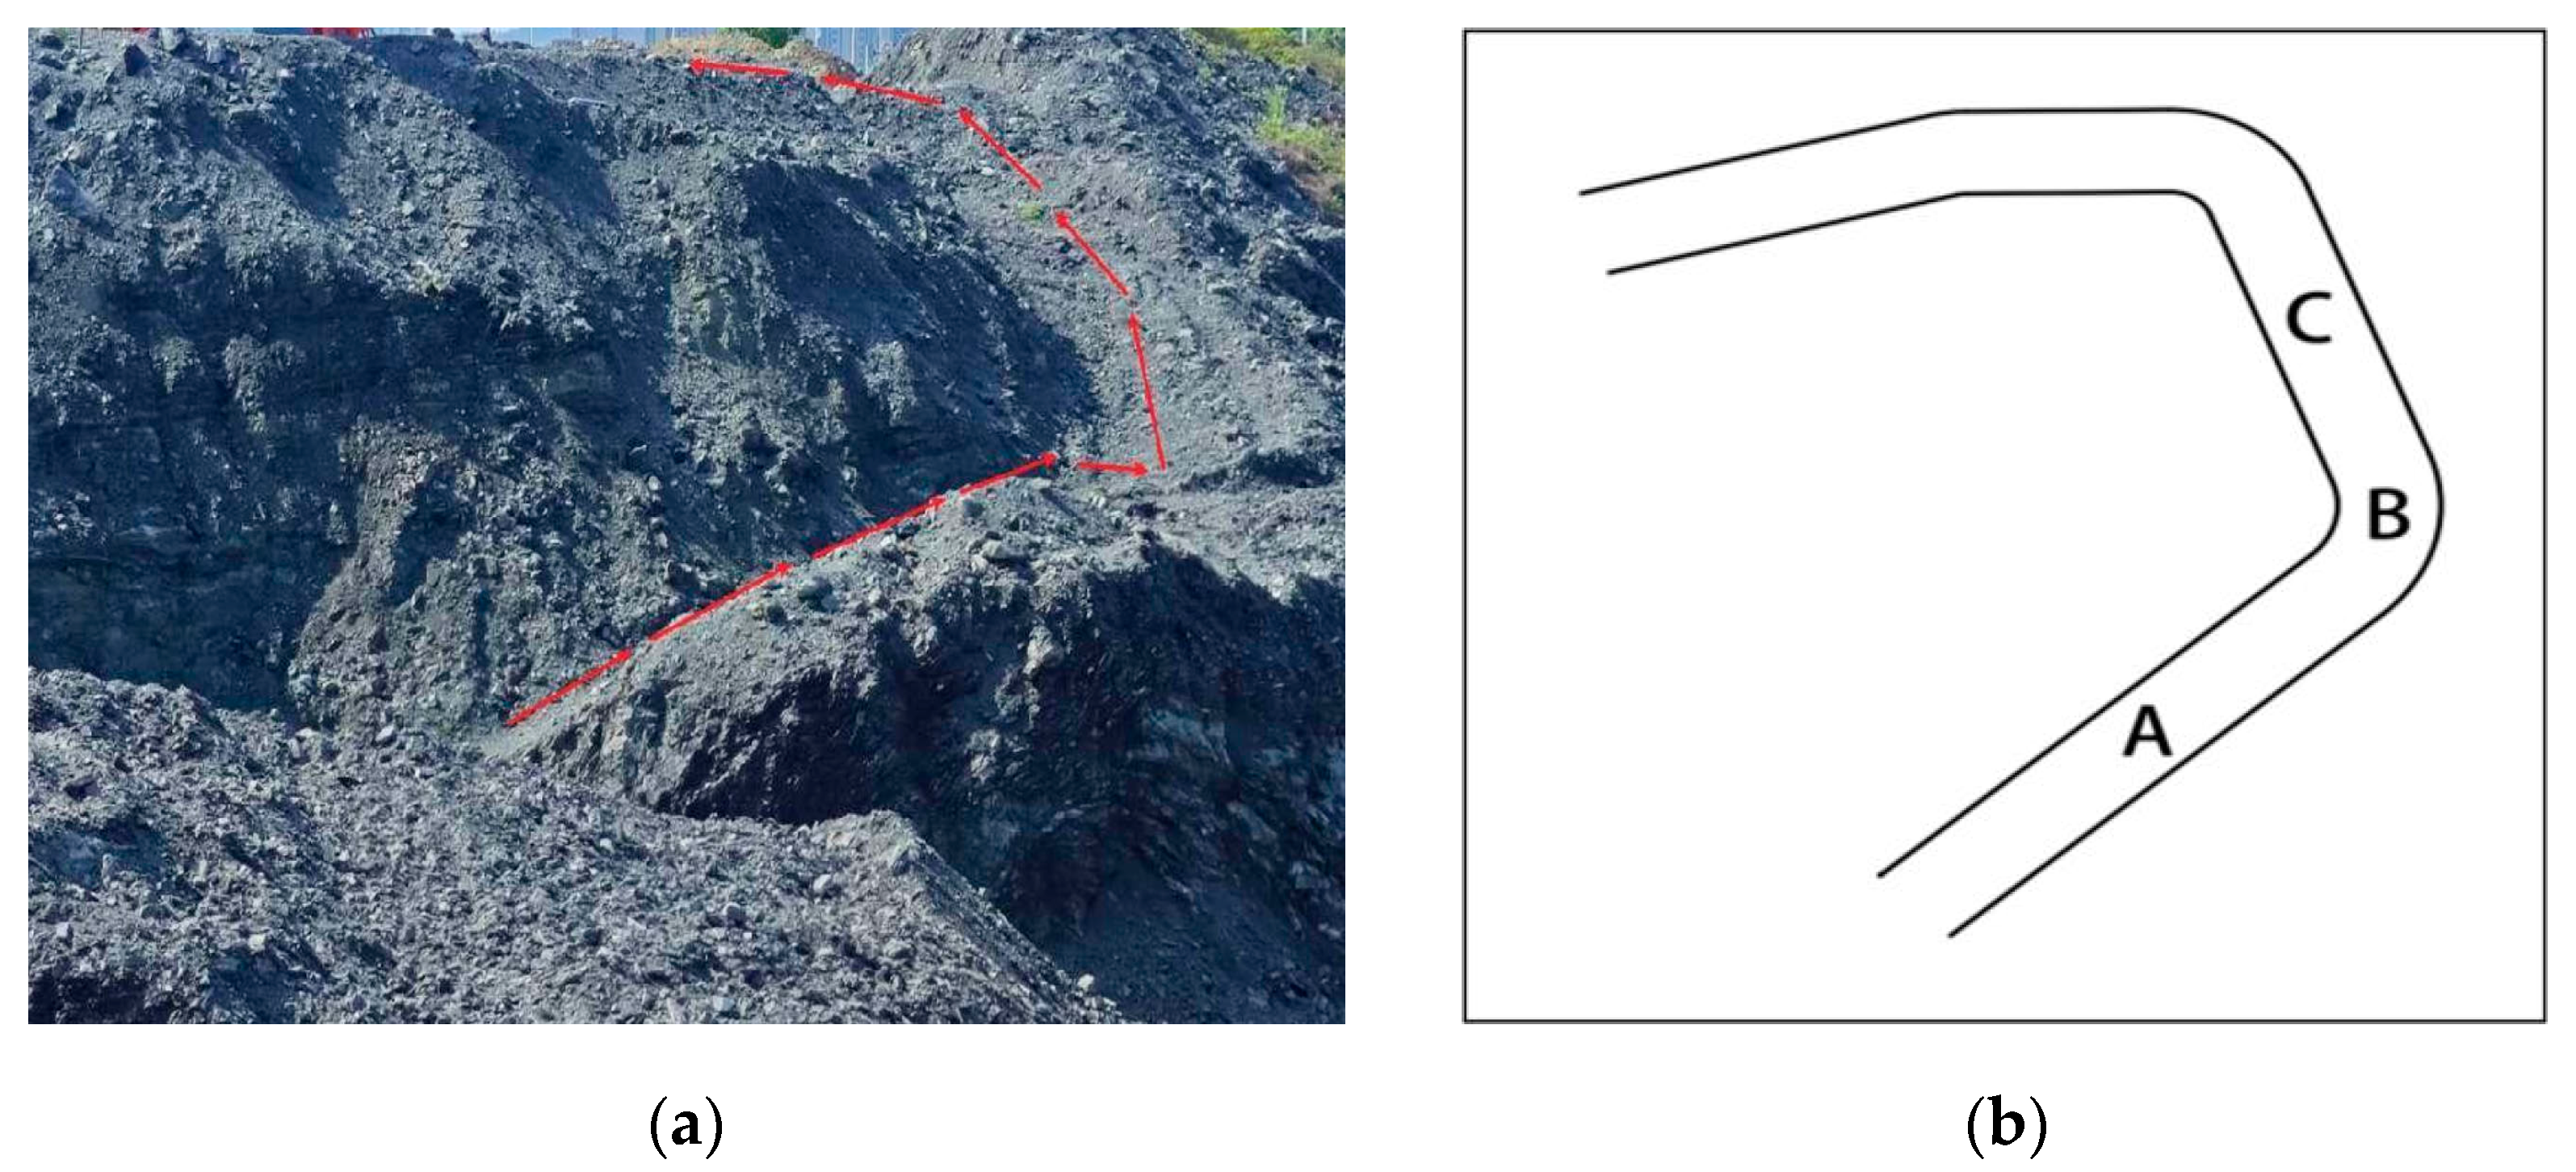
This research selected a representative stretch of a mining machinery operation route to assess the dense mapping performance of the proposed algorithm in open-pit mining situations.
Figure 20 illustrates that the test scenario encompasses characteristic aspects of a mining area, including uneven terrain variations and gravel deposits. To guarantee the trustworthiness of experimental results, the test platform traversed the designated path ABC at a constant velocity of 0.6 m/s, as illustrated in
Figure 20b. This path design incorporates linear and curved segments, efficiently assessing the algorithm’s efficacy under varying motion situations.
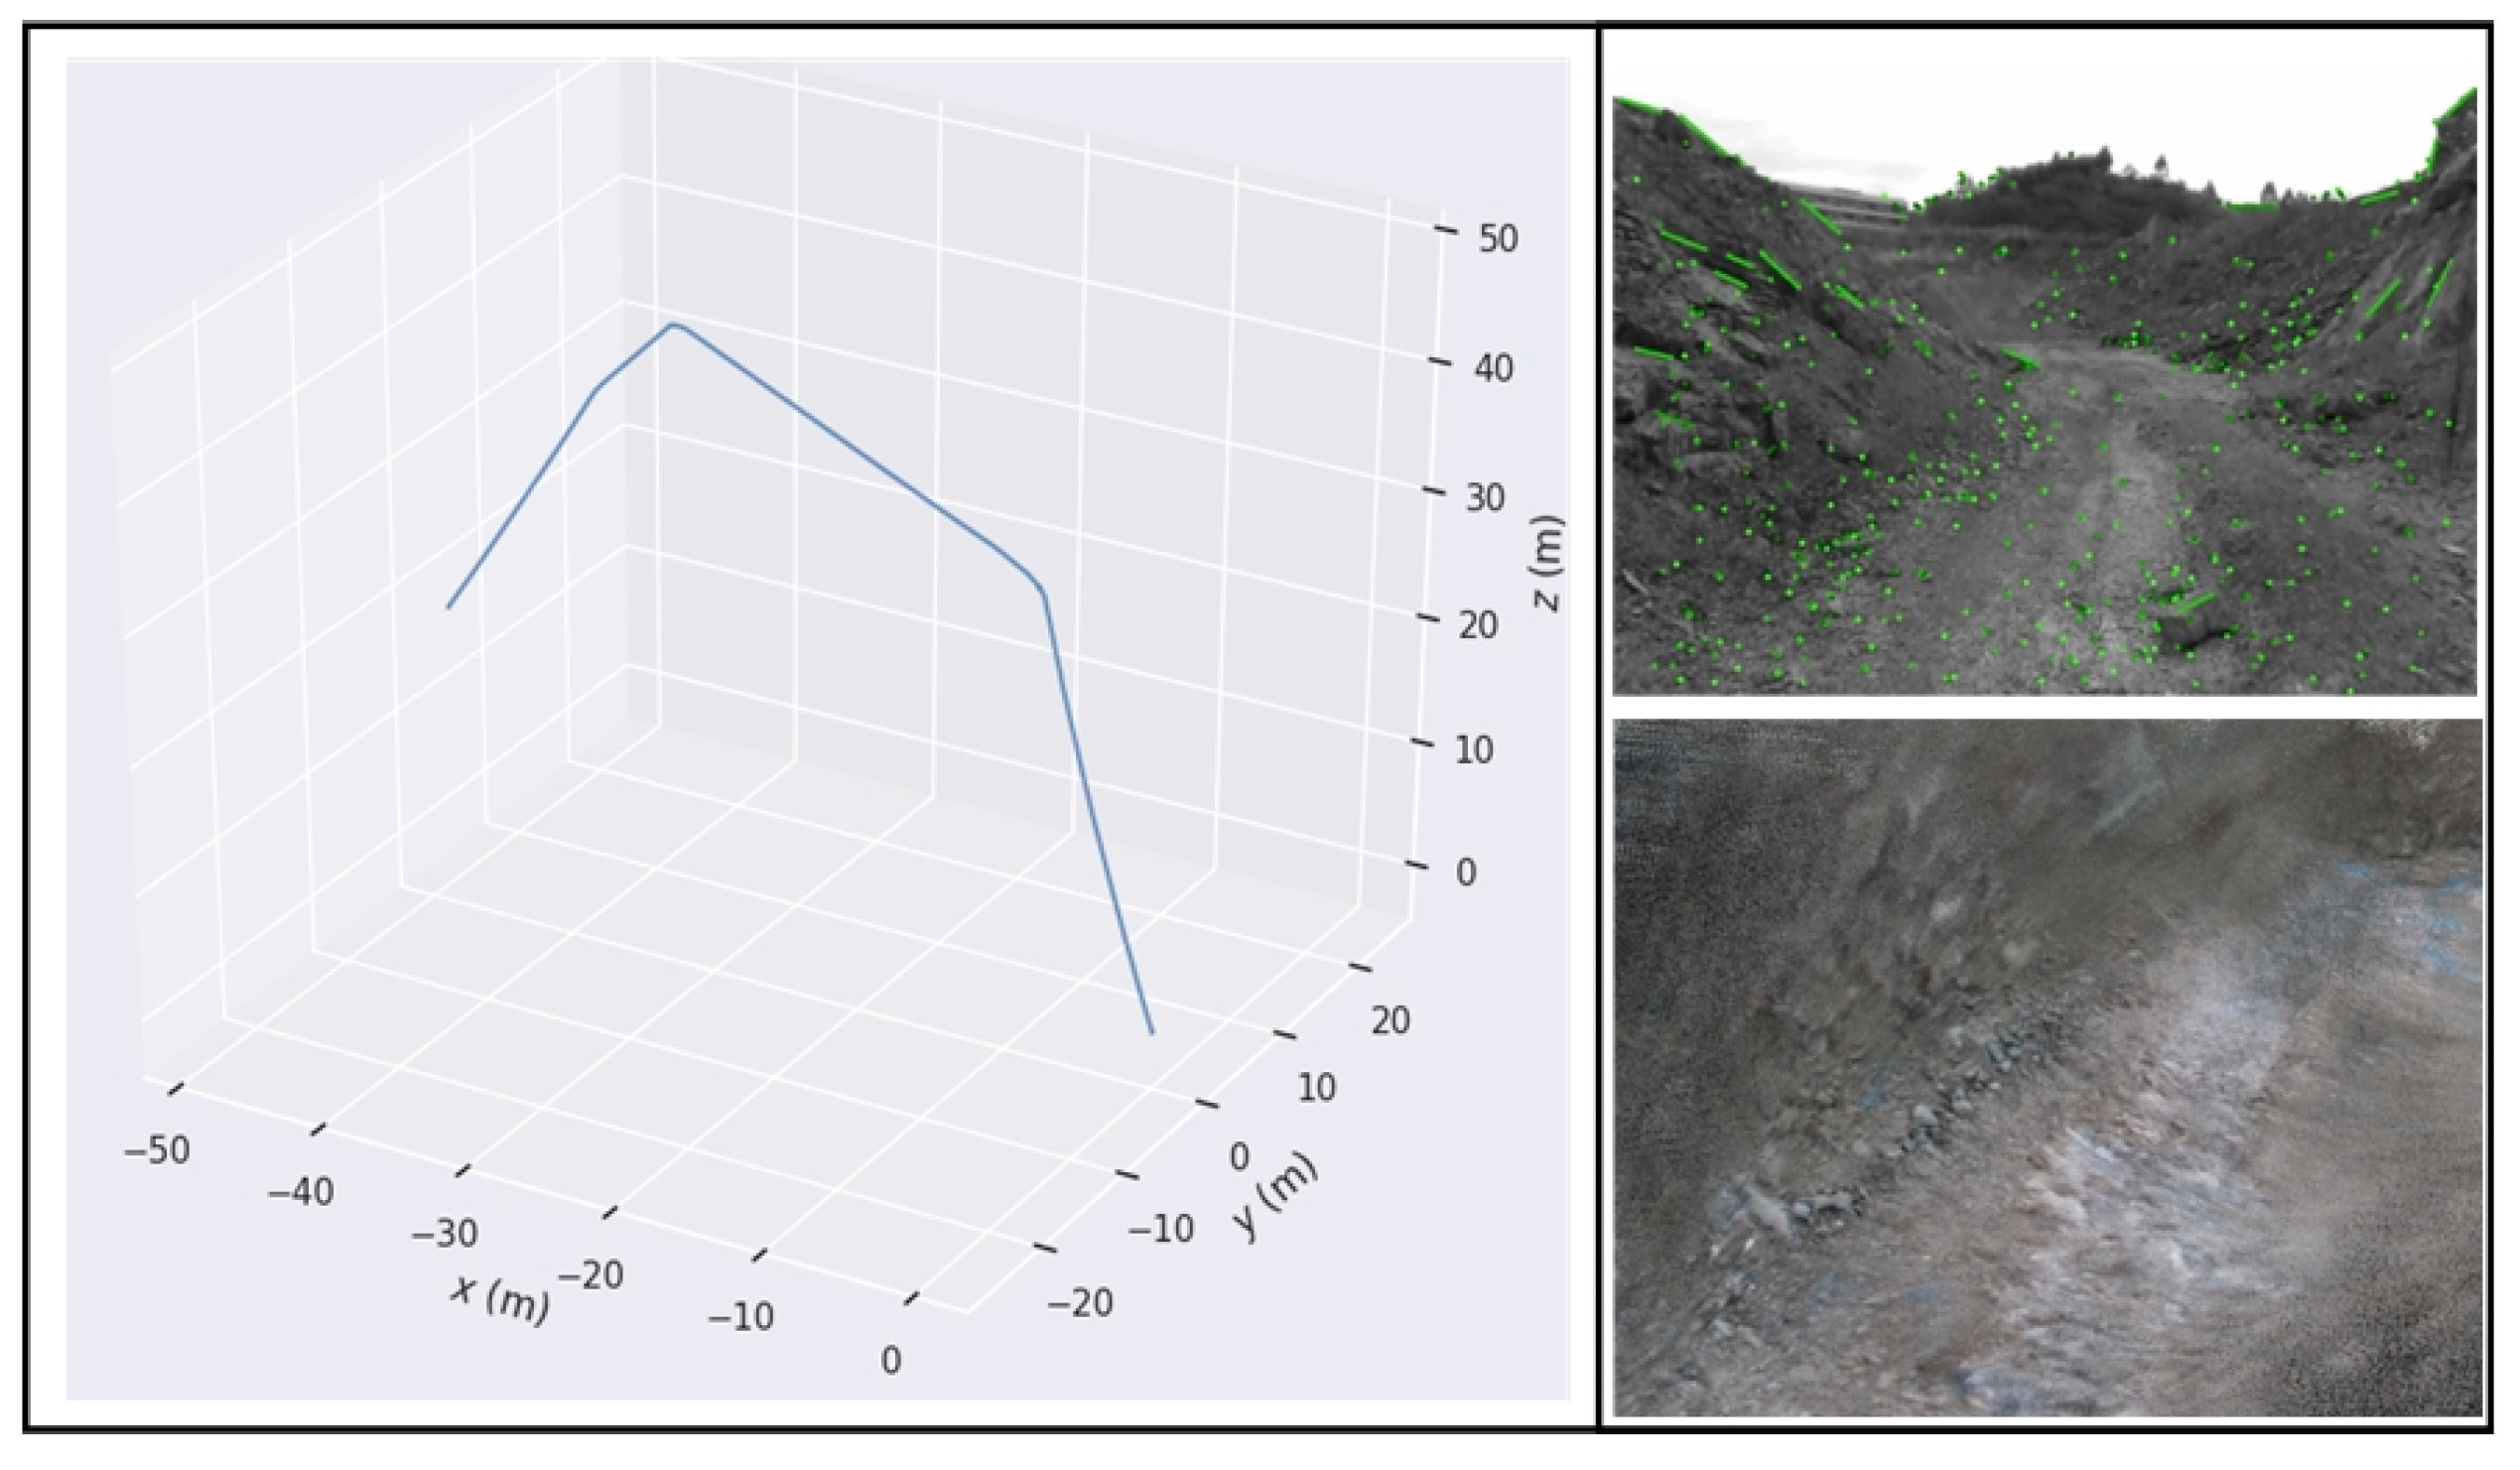
Figure 21 presents the comprehensive experimental outcomes for this test scenario. The left picture illustrates the three-dimensional trajectory reconstruction results, with coordinate axes indicating a maximum elevation variation of around 40 m and a lateral displacement range of about 50 m. The rebuilt trajectory distinctly illustrates the platform’s travel pattern in intricate terrain. Trajectory analysis demonstrates that, despite substantial height variations, the algorithm ensures continuous and stable pose estimation, with reconstructed trajectories closely aligning with actual path elevations. The right image in
Figure 21 illustrates the outcomes of feature extraction, with green points and lines denoting successfully extracted and matched feature points and lines. Notwithstanding inconsistent illumination and disordered rock distribution in the surroundings, the method reliably recovers adequate valid feature points, yielding dependable observational data for future posture estimation.
A subsequent examination of the experimental procedure reveals considerable benefits of this method in addressing difficulties in the mining environment. Initially, integrating point-line characteristics during feature extraction significantly improves the algorithm’s flexibility in poorly textured areas. Secondly, the enhanced feature matching method in the motion estimation process markedly decreases mismatching rates, ensuring steady tracking in regions with significant terrain variations. The algorithm effectively consolidates disparate local observations into a coherent environmental representation in the mapping step. The results of the dense reconstruction precisely represent the spatial configuration of the mining environment, encompassing critical details such as terrain variations and rock distribution, and are devoid of noticeable point cloud distortion or overlap issues.
Furthermore, the experimental findings confirm the algorithm’s resilience in managing extensive contexts. The method reliably upholds constant localization precision within the testing zone without substantial cumulative errors. In regions susceptible to tracking failures, such as turns, the algorithm effectively sustains continuous system functioning using proficient feature management and posture optimization techniques. The experimental findings unequivocally illustrate the resilience and precision of the proposed method in intricate open-pit mining situations, establishing a strong basis for its practical application deployment.
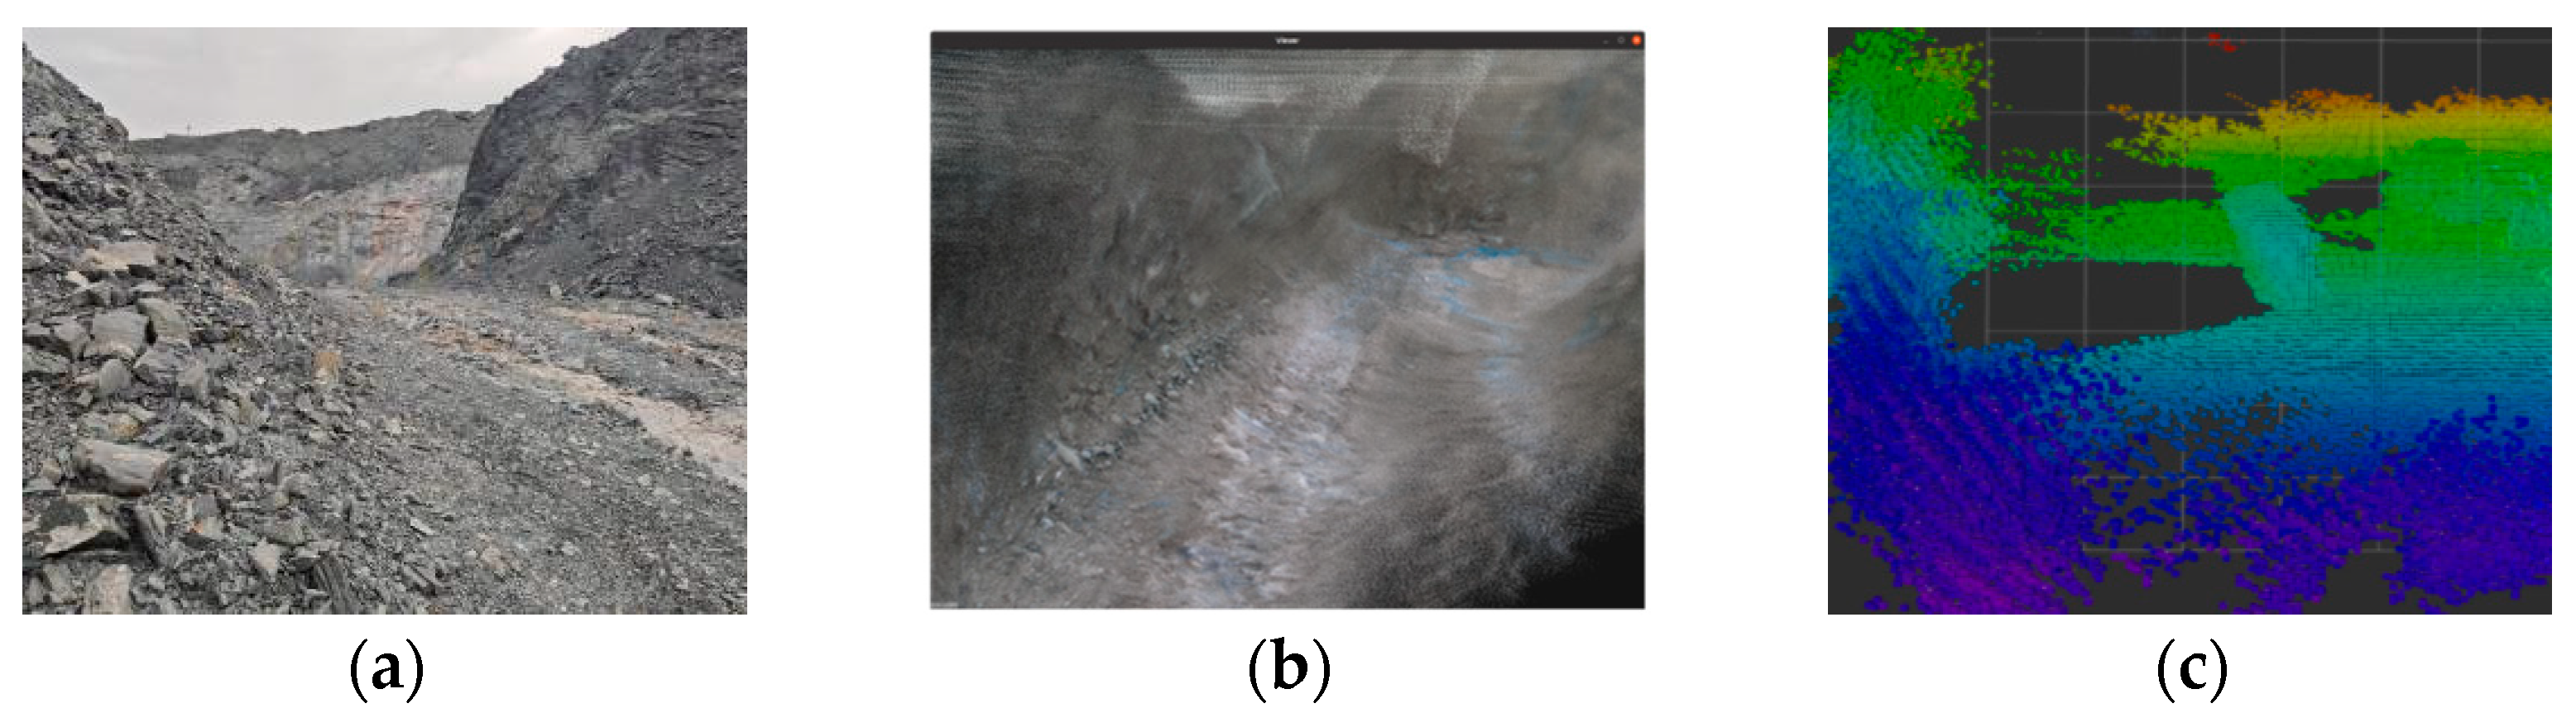
The experiment in the simulated open-pit mining environment utilized a standard mining road as the test scenario, with site dimensions measuring 20 m long and 4.4 m wide. The experimental platform traversed the mining operation route at a steady velocity of 0.6 m/s, employing the SLAM technique introduced in this research to generate real-time three-dimensional dense maps. The testing findings illustrate the produced three-dimensional point cloud map, as depicted in
Figure 22. The efficacy of the algorithm presented in this study for dense mapping can be effectively validated by juxtaposing the generated dense point cloud map with actual photos of the mining site.
The photos demonstrate that the dense map produced by this algorithm effectively reconstructs the spatial distribution of rocks, mining tunnels, and other natural terrain features in the open-pit mining environment. In portraying environmental details, the point cloud map exhibits no discernible overlap, distortion, or deformation and precisely reconstructs elements such as terrain undulations. The geometric characteristics closely align with the landscape, suggesting the system exhibits robust three-dimensional mapping skills in mining contexts.
Upon further analysis of the algorithm’s performance, the proposed SLAM algorithm demonstrates substantial decreases in both absolute and relative trajectory errors compared to the ORB-SLAM3. This signifies that the method enhances localization precision, particularly in intricate environments, such as open-pit mines, facilitating more efficient long-term stable localization and map development. Moreover, incorporating line feature extraction and matching techniques significantly improves mapping precision in dynamic mining contexts. In simulated open-pit mining scenarios, the algorithm reliably produces high-quality three-dimensional dense point cloud maps, even amidst intricate terrain and environmental variations, offering dependable technical support and a foundation for the navigation and localization of mining operation robots in complex settings.
6. Conclusions
This study presents an enhanced ORB-SLAM3 method to tackle the difficulties visual SLAM systems face in open-pit mining settings. Dense mapping is accomplished by integrating point-line feature extraction and improved reprojection error computation, utilizing RGB-D camera depth data. Experimental validation utilizing the TUM dataset and authentic mining environments demonstrate that, in comparison to the ORB-SLAM3, the enhanced algorithm decreased the absolute trajectory error (APE) by an average of 44.33% and the root mean square error (RMSE) by 44.15%. Regarding relative trajectory error (RPE), it reduced the average by 14.34% and the RMSE by 15.64%. The algorithm in dense reconstruction effectively creates environmental representations with intricate geometric details by implementing dense point cloud mapping threads while markedly enhancing the storage efficiency via octree structures. In simulated assessments within authentic open-pit mining settings, the algorithm can precisely replicate intricate terrain characteristics, such as gravel rock walls and undulating surfaces, thereby offering dependable environmental perception assistance for the autonomous navigation of mining robots.
Despite the enhanced algorithm exhibiting superior performance in various dimensions, certain limitations remain. Drift issues persist during the dense point cloud map’s construction for large-scale scenes. Additionally, because of experimental constraints, validation using real mining scenarios was not conducted. Factors such as dust, lighting variations, and irregular terrain in actual mining environments, which are difficult to replicate in simulations, may significantly impact performance. Future work will address these issues, improve its robustness in dynamic settings, optimize cumulative errors, enhance real-time dense mapping, and validate the method in real mining scenarios.


