Article

Mechanical Properties of Marble Under Triaxial and Cyclic Loading Based on Discrete Elements

1
Key Laboratory of Intelligent Health Perception and Ecological Restoration of Rivers and Lakes, Ministry of Education, Hubei University of Technology, Wuhan 430068, China
2
State Key Laboratory of Geomechanics and Geotechnical Engineering, Institute of Rock and Soil Mechanics, Chinese Academy of Sciences, Wuhan 430071, China
*
Author to whom correspondence should be addressed.
Appl. Sci. 2025, 15(7), 3576; https://doi.org/10.3390/app15073576
Submission received: 26 February 2025 / Revised: 16 March 2025 / Accepted: 20 March 2025 / Published: 25 March 2025

Abstract

:
The excavation process for a deeply buried chamber in a high ground stress area is often dynamic. The design of reasonable excavation methods for differing geological conditions and surrounding pressure environments is of great engineering significance in order to improve the stability of surrounding rocks during construction. Based on the findings from conventional triaxial and cyclic loading laboratory tests on marble, this paper obtains a set of mesoscopic parameters that accurately represent the macro-mechanical characteristics of marble, uses the discrete element method (DEM) to establish a numerical model, and carries out numerical tests of triaxial and cyclic loading under varying circumferential pressures. The mechanical parameter evolution, crack propagation mechanism and mesoscopic force field distribution of marble under conventional triaxial stress and cyclic load-reversal conditions are compared and analyzed. The findings suggest that the peak strength, residual strength, peak axial strain, elastic modulus, and Poisson’s ratio of marble increase as the circumferential pressures rises for both stress paths. The peak strength and elastic modulus under cyclic loading at different circumferential pressures are lower than those observed under conventional triaxial conditions, while the Poisson’s ratio is higher compared to conventional triaxial conditions. The cumulative total number of microcracks in marble damage under cyclic loading is higher and the damage is more complete compared to conventional triaxial loading. The rock specimens in both stress paths are dominated by tension cracks. Nevertheless, a greater number of shear cracks are exhibited by the specimens subjected to cyclic loading conditions. The proportion of tension cracks in the rock specimens gradually decreases with increasing circumferential pressure, while the proportion of shear cracks gradually increases. For both stress paths, the angular distribution of microcracks following rock specimen failure is similar, and the force chain becomes progressively denser as the circumferential pressures increase. The force chain distribution within the rock specimens is more heterogeneous under cyclic loading conditions than under conventional triaxial conditions.

1. Introduction

With the continued promotion of the “dual-carbon” strategic goal, the scale of hydropower plant construction in the south-western region of China is expanding and the construction of hydraulic tunnel groups under deeply buried high ground stress has become a normal state [1,2,3]. During the excavation, construction and operation of a deep hard rock underground cavern, the surrounding rock of the cavern often exhibits significant nonlinear characteristics under high stress, particularly under conditions of repeated loading and unloading, where the internal damage behavior of the rock mass is not clearly evident [4]. Once the surrounding rock experiences damage and instability, such as collapse, rock burst and other disasters, it will bring great risks to the personal safety of site construction personnel and the sustainability of underground engineering. Therefore, studying the mechanical properties of the damage process in deeply buried hard rock under cyclic loading is of critical importance for guiding the safe construction of underground caverns.
Recent years have seen a growing focus on the mechanical properties of rock materials under cyclic loading. Zhu et al. [5] conducted uniaxial cyclic loading tests on rocks with vein defect structures and studied their failure and damage mechanism according to the internal defect area of rock specimens. The results showed that the larger the defect area ratio, the larger the Poisson’s ratio, the larger the cyclic cumulative irreversible strain, and the more obvious the reduction of peak strength. Li et al. [6] used a shear rheometer to carry out low-frequency uniaxial cyclic loading tests on red sandstone to study its fatigue deformation and damage characteristics. The results indicated that the upper stress fatigue failure threshold of red sandstone ranged from a 75% to 85% stress ratio. The axial strain followed a pattern of rapid initial increase, which was then followed by a more gradual rise and then rapid increase again. The higher the upper stress limit, the more rapidly the damage progressed. Liu et al. [7] investigated the deformation and failure behaviors of bedding coal under cyclic loading by performing graded uniaxial cyclic loading tests with varying upper stress thresholds. The findings demonstrated that, under low-stress cyclic loading, the elastic modulus of both vertical and parallel bedding coal increases in proportion to the number of cycles. However, a rise in the upper stress limit ultimately results in a decrease in the elastic modulus, accompanied by an increase in fatigue damage. Wang et al. [8] performed a cyclic loading acoustic emission test on sandstone under circumferential pressures of 10, 20, and 30 MPa, obtaining the acoustic emission and fractal characteristics of sandstone under cyclic loading conditions. They also thoroughly analyzed the evolution of microcrack growth and damage progression during the rock’s progressive failure process. Chen et al. [9] conducted conventional triaxial and multistage constant amplitude cyclic loading triaxial tests on sandstone under 10, 15, 20, and 25 MPa circumferential pressures and compared the deformation and failure behaviors of sandstone under two distinct stress paths, focusing on the evolution of permeability and the acoustic emission characteristics resulting from damage. Meng et al. [10] conducted cyclic loading tests on limestone under six different circumferential pressures (1, 5, 10, 15, 20, and 25 MPa). The findings revealed that as the number of cycles increased, the elastic modulus of the rock specimens initially increased before decreasing, while the Poisson’s ratio increased accordingly. With rising circumferential pressures, the elastic modulus also increased, whereas the Poisson’s ratio decreased. Shirani Faradonbeh et al. [11] proposed a two-criteria damage control test method and combined it with the results of uniaxial cyclic loading indoor tests on sandstone at different stress levels. The strength hardening before peak and the destabilizing damage behavior after peak under cyclic loading were analyzed. The results showed that the rock samples did not destabilize when the cyclic loading stress was below the fatigue threshold stress, while the peak strength increased by 8% and the degree of post-peak damage decreased with increasing stress levels. Geranmayeh Vaneghi et al. [12] compared and analyzed the differences in the damage response during cyclic fatigue in two different mineralogical compositions and microstructural rocks (granite and sandstone) by conducting uniaxial multistage cyclic loading tests. The results of the study showed that high-frequency loading can increase the fatigue life of rock samples. The loading frequency has a significant effect on the damage pattern of the rock and the effect is different for hard and soft rocks. Combining indoor tests and numerical simulations, Naderloo et al. [13] analyzed the mechanical characteristic response of red sandstone under cyclic loading with different loading conditions (frequency, amplitude and stress). The results showed that the higher the mean stress and amplitude and the lower the frequency, the higher the plastic strain of cyclic loading of the rock samples. The established Nishihara model is able to describe the plastic deformation of the rock samples better and agrees with the results of the indoor tests.
Natural defects such as cracks and holes in rock are constantly changing under load, which affects the mechanical properties. However, traditional mechanical tests are insufficient to uncover the microscopic mechanisms underlying the progressive damage and failure of rock. At present, the numerical simulation of the rock failure process has been gradually carried out, mainly concentrating on the DEM and FEM. Based on the indoor triaxial compression test of Three Gorges granite, Zhang et al. [14] employed PFC3D software to perform triaxial cyclic loading tests under various circumferential pressures, determined the position of the stress threshold value from the stress–strain curve, analyzed the influence of circumferential pressures on the stress threshold value, and demonstrated the development of microcracks in the rock specimen from the microscopic level. Zhou et al. [15] used the particle flow software PFC2D to study the propagation and failure mechanism of internal cracks in double-fracture marble with different prefabrication angles under the action of triaxial cyclic loading. The findings indicated that both the prefabrication angles and circumferential pressures influenced the propagation of internal microcracks in rock specimens, with the number of microcracks increasing as the circumferential pressures rose. At the same time, the angle of inclined fracture also affects the peak strength of rock specimen. Zhao et al. [16] incorporated a stress corrosion model into the particle flow numerical method to simulate the fatigue damage process of rocks subjected to cyclic loading with varying upper and lower stress ratios. The results showed that under fatigue loads, the hysteresis curve presents a tendency of “thinning-dense-thinning”, and the upper and lower stress levels will affect the area and spacing of the hysteresis ring. The upper stress limit significantly affects the fatigue life of rock. Lee et al. [17] used the particle flow software PFC2D and the discrete element method (DEM) to establish numerical specimens of granite with defects in two different orientations, studied the emergence and expansion of tensile and shear cracks in single-serrate versus double-serrate samples, and comparatively analyzed the crack initiation stresses and penetration stresses of both cracks. The results showed that the simulations are consistent with the experimental results and provide a theoretical basis for exploring the structural stability of rock samples containing prefabricated fractures. Zhou et al. [18] employed the finite element numerical method, coupled with the Drucker–Prager yield criterion and subloading surface theory, to develop a dynamic constitutive model for the deformation and failure characteristics of rock materials under cyclic loading. This model was validated against the results of indoor uniaxial cyclic loading tests. Wang et al. [19] performed indoor triaxial cyclic loading tests on granite to investigate the fatigue characteristics of rock specimens. Concurrently, a constitutive model for describing rock fatigue damage was developed based on the test results and in conjunction with the FEM, and the hydrodynamic effects of underground crude oil storage measures subjected to cyclic load during operation were simulated and analyzed. Cerfontaine et al. [20] established an intrinsic model based on the concept of the boundary surface and simulated three different cyclic loading tests of rock materials in combination with the finite element method to study the variation rule of the volumetric strain of rock with the number of cycles.
Significant scientific research has been conducted both domestically and internationally on the mechanical properties of rocks under indoor cyclic loading tests. Scholars have systematically examined the influence mechanisms of circumferential pressures, the cycle count, and other factors on the mechanical characteristics of rocks. However, most existing studies focus on soft rock with low strength and focus on uniaxial cyclic loading tests, while the circumferential pressures settings in triaxial cyclic loading tests are generally low, and there is a lack of understanding of the differences in rock fracture processes between conventional triaxial testing and cyclic loading, making it difficult to truly simulate the complex stress path adjustment environment during different excavation methods for deep rock mass. Additionally, the application of the FEM based on the continuum hypothesis is restricted by the presence of common discontinuous structural features in natural rock masses. In contrast, the DEM has become an effective tool for studying the micromechanical behavior of rock and soil materials due to its unique advantages in characterizing the progressive failure process of discontinuous media. Based on this, the discrete element software PFC2D is used to establish a discrete element numerical model on the basis of marble laboratory tests, and conventional triaxial and cyclic loading numerical tests are carried out. The evolution of the mechanical parameters, the number and angle of the microcracks and the distribution of the microscopic force field of marble under high circumferential pressures are compared and studied. The research findings offer an experimental foundation for the analysis of the stability of underground caverns, disaster prediction, and the development of support measures for surrounding rock.

2. Laboratory Tests on Marble

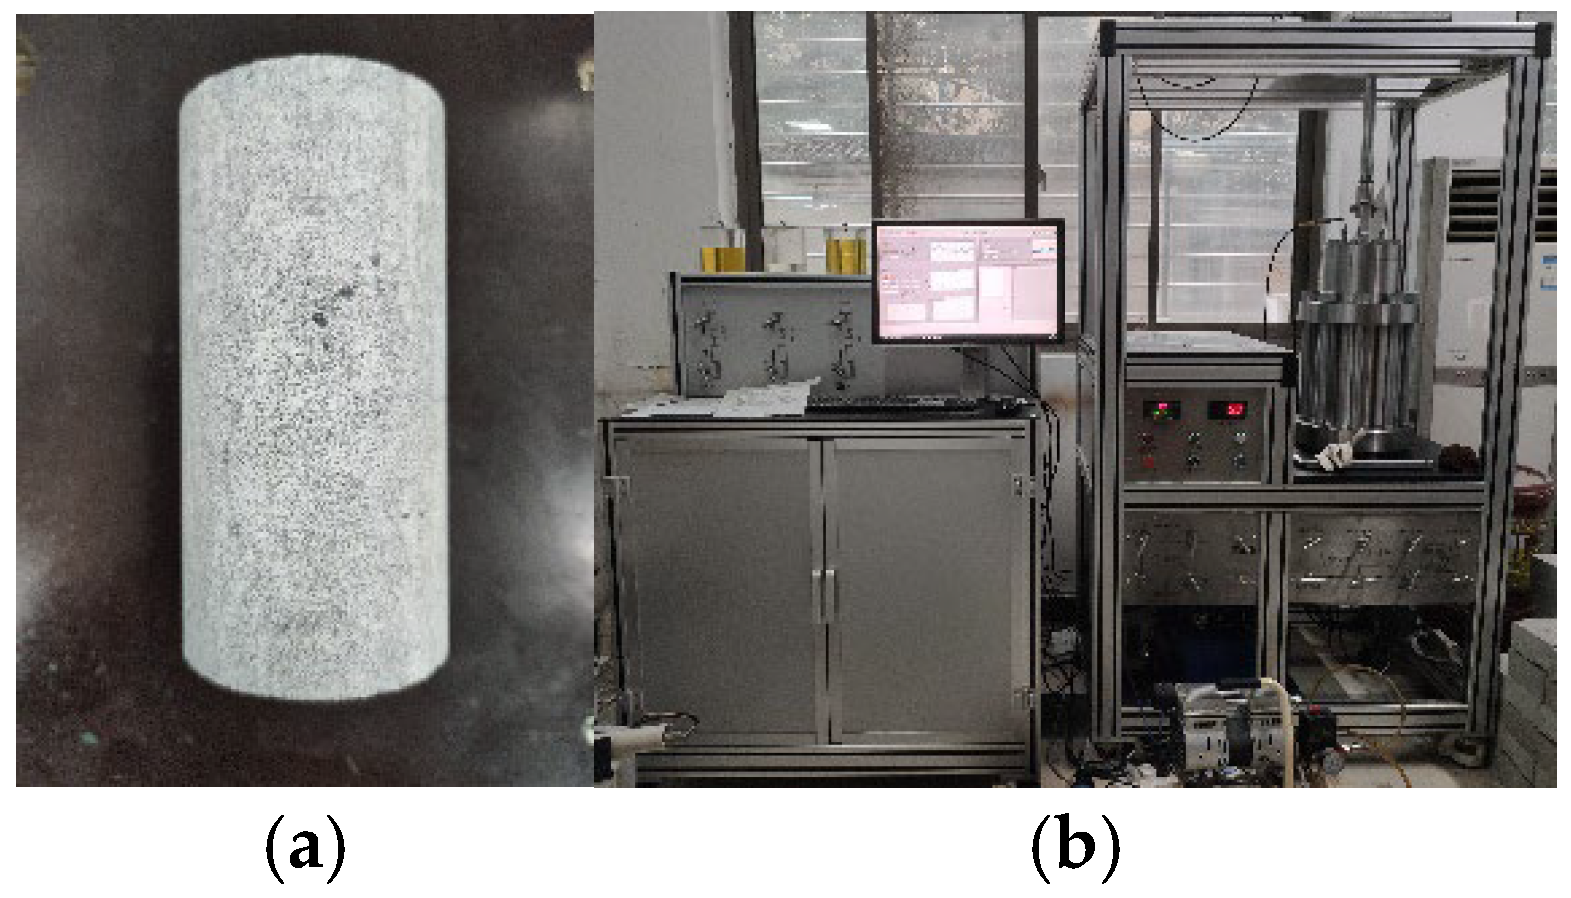
2.1. Test Materials and Equipment
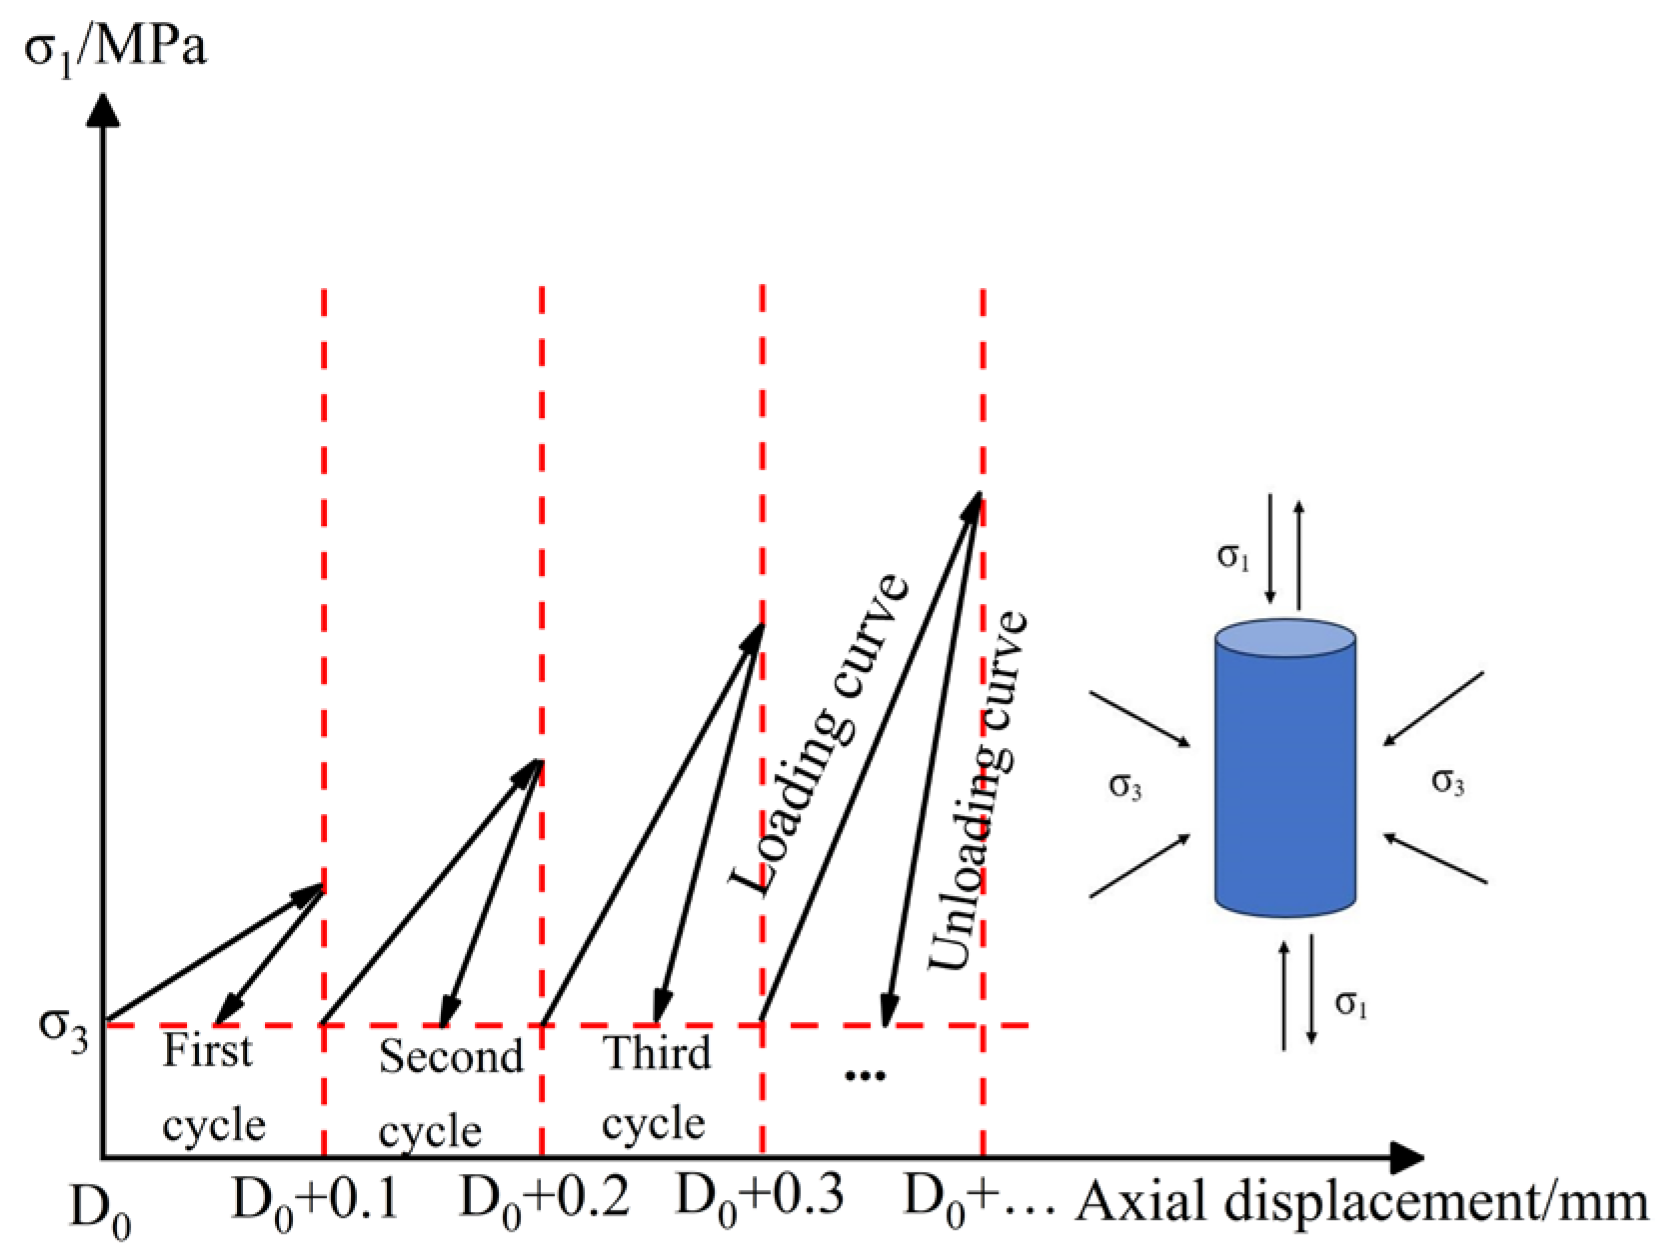
The test was performed on Jinping secondary hydropower station marble, a hard rock. According to SL/T264-2020 “Rock Test Regulations for Water Conservancy and Hydropower Engineering”, a standard cylinder specimen with a diameter of 50 mm and a height of 100 mm was prepared [21]. The finished standard parts are shown in Figure 1a below. The test equipment was the THMC rock mechanics multi-functional triaxial test system developed by the Wuhan Institute of Geotechnics, Chinese Academy of Sciences. The triaxial test system consists of a triaxial pressure chamber, a high-strength reaction frame, a high-pressure electrohydraulic servo pump, a microcomputer system, a strain-monitoring acquisition system, and ancillary devices. The tests of uniaxial compression, conventional triaxial compression, unloading and cyclic loading can be completed under the condition of full or partial coupling. The pressure chamber is equipped with high-precision axial and circumferential differential displacement transducers (LVDTs), which can measure circumferential deformation in the range of 0 to 4 mm and axial deformation in the range of 0 to 10 mm, and the deformation can be measured with an accuracy of up to 0.01 mm. The high-precision electro-hydraulic servo pump pressure accuracy of up to 0.01 MPa can be controlled under axial and circumferential stress loading and a displacement load, with maximum axial pressure and circumferential pressure design values of 380 MPa and 60 MPa, so the test system can meet the test requirements, as illustrated in Figure 1b.

2.2. Test Scheme

In order to better simulate the indoor cyclic loading test, in addition to the conventional triaxial test with the circumferential pressures of 10, 30, and 50 MPa, another set of cyclic loading tests with the circumferential pressures of 10 MPa were conducted. The axial pressure was controlled by displacement loading, and the loading and unloading rate was 0.02 mm/min. The axial displacement was 0.1 mm as a single cycle of the value of the load gradient, and once the axial displacement reached the design value, axial stress was removed, and the test continued until the rock specimens entered the residual phase at the end of the loading cycle. In order to avoid the detachment of the rock specimen end face from the tester indenter, unloading was stopped at an axial stress of 5 MPa [22], and the unloading proceeded to the next cycle. Figure 2 shows the stress path for the designed cyclic loading test.

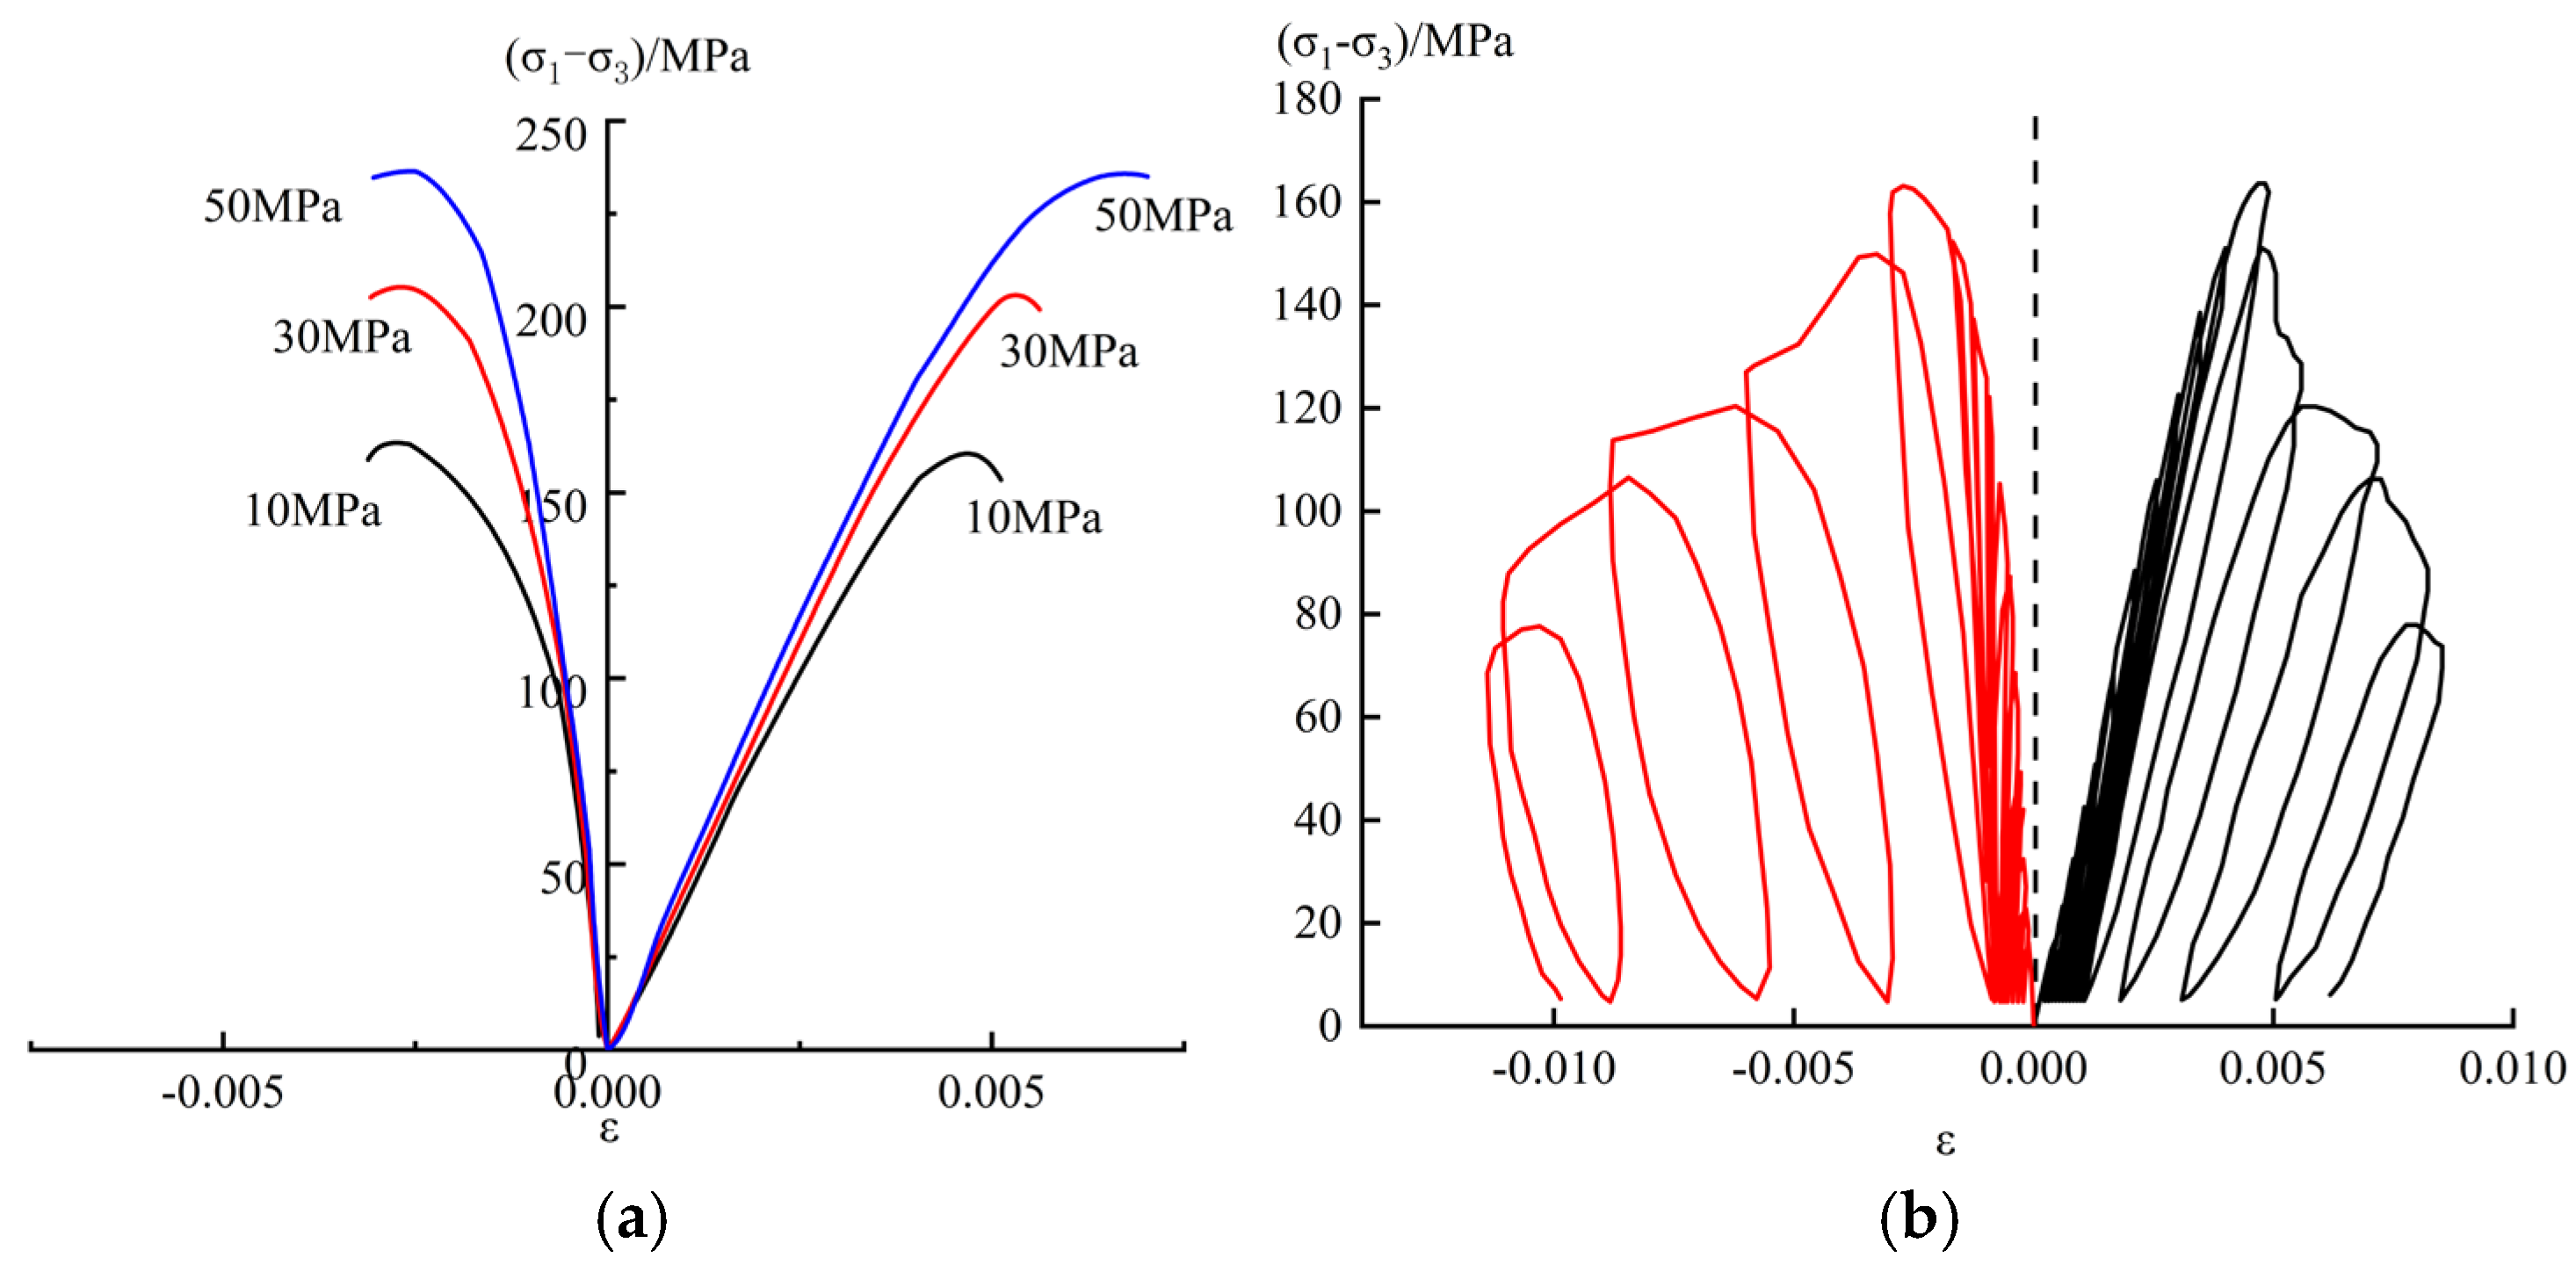
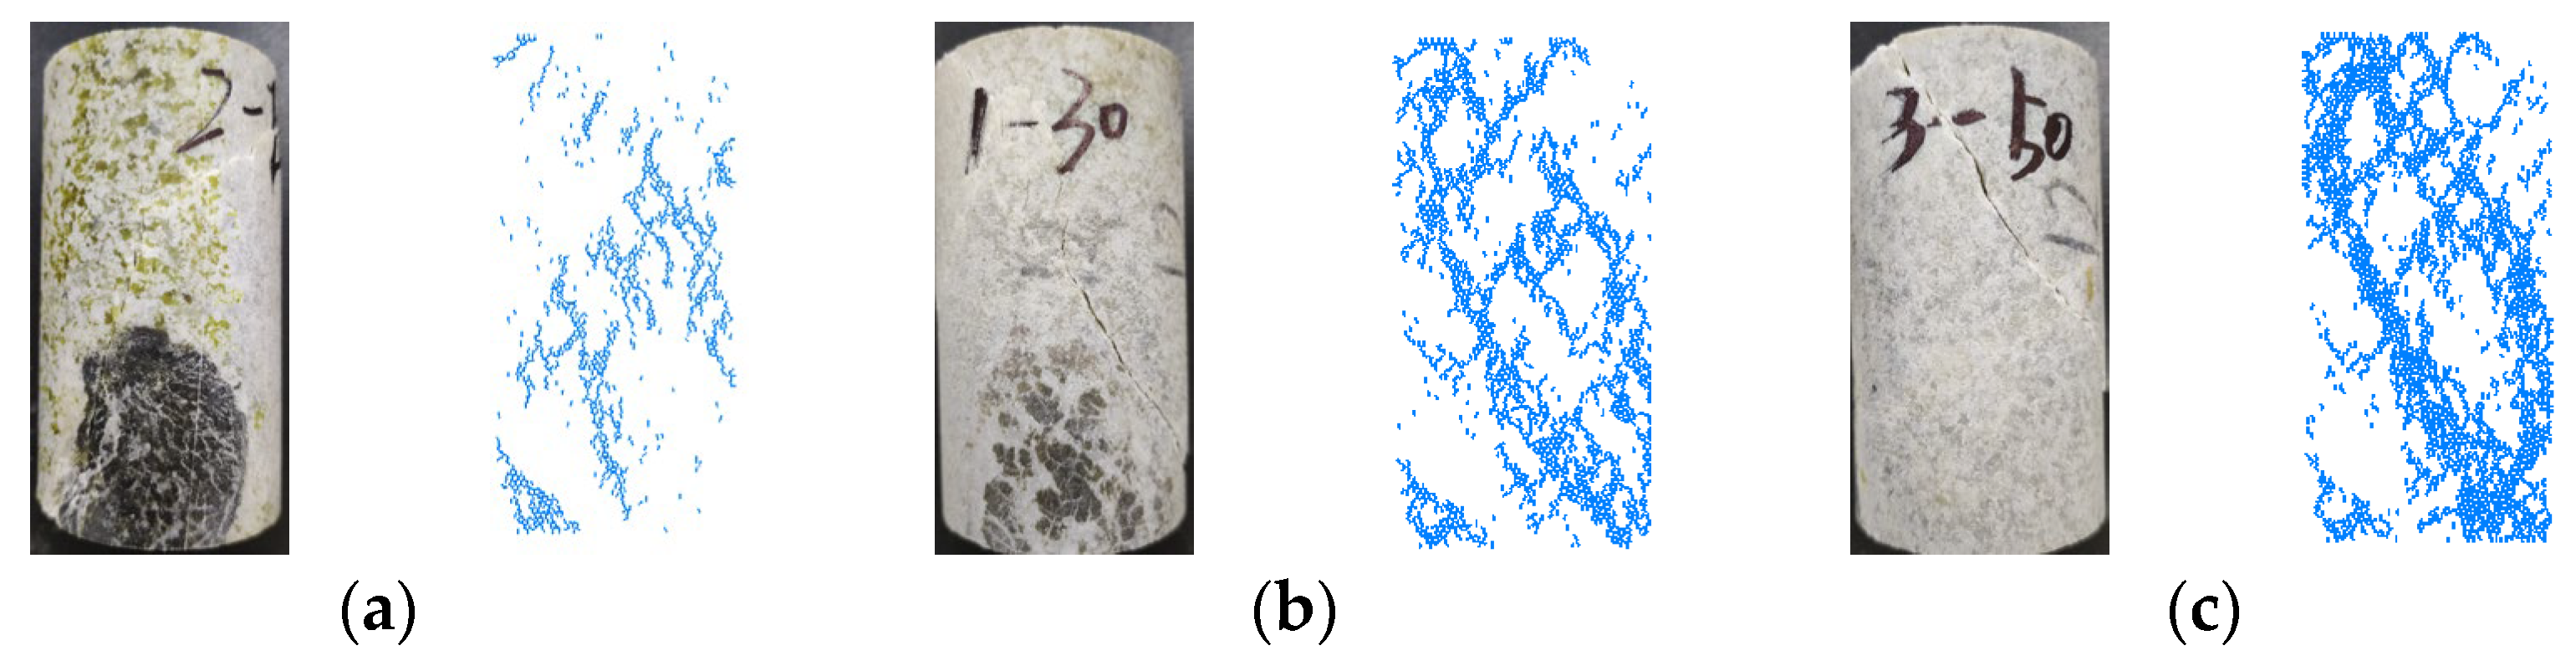
2.3. Experimental Results

Figure 3a,b show the stress–strain curves for conventional triaxial and cyclic loading of marble. As illustrated in Figure 3a, at the compaction stage, the natural pores and microcracks within the rock samples close and the formation of early non-linear deformation occurs; into the linear elasticity stage, the stress–strain curve is approximately linear, and deformation is dominated by elastic deformation; and from the elastic deformation stage into the plastic deformation stage, the boundary point called the yield point, corresponding to the yield stress, is about two-thirds of the peak strength. After loading to the stage of plastic deformation, new cracks are generated and expand, making the rock sample irrecoverably deformed; the upper limit stress is the peak strength, and the internal structure of the rock sample is destroyed after reaching the peak strength point. As the circumferential pressures increase, the peak strength and peak strain increase. As can be seen from Figure 3b, the cyclic loading stress–strain outer envelope curve has similarity to the conventional triaxial test full-process curve, which also includes the four phases mentioned above [23]. The boundary between the elastic and plastic deformation phases of a rock sample under cyclic loading can be determined by the inflection point of volumetric strain–axial strain, while the upper limit of the plastic deformation phase is likewise the peak strength [24]. The cyclic loading stress–strain curves show an obvious hysteresis effect, forming multiple hysteresis loops. The loading and unloading curves largely overlap prior to reaching the peak, indicating elastic behavior. The hysteresis loop area first increases and then decreases as the number of cycles increases, with the maximum area occurring after the peak. These observations are consistent with the findings of Zhang et al. [25].

3. Model Building and Parameter Verification

3.1. Numerical Modeling

In the PFC numerical simulation software, there are many contact models and the parallel bonding model is usually considered to establish rock specimens [26]. The numerical model is based on the dimensions of the indoor test rock specimens (50 mm diameter and 100 mm height), while the wall command is written to simulate the boundary conditions to apply the external load. The reciprocating motion of the upper and lower walls simulates the axial loading and unloading process. Based on the laboratory test results of marble, the BP neural network inversion method was used to calibrate the mesoscopic parameters [27]. The laboratory test results were compared with the macro-mechanical parameters obtained from the simulation, and the mesoscopic parameters were iteratively adjusted. Finally, a set of optimal mesoscopic parameters was determined for the numerical model, as shown in Table 1.

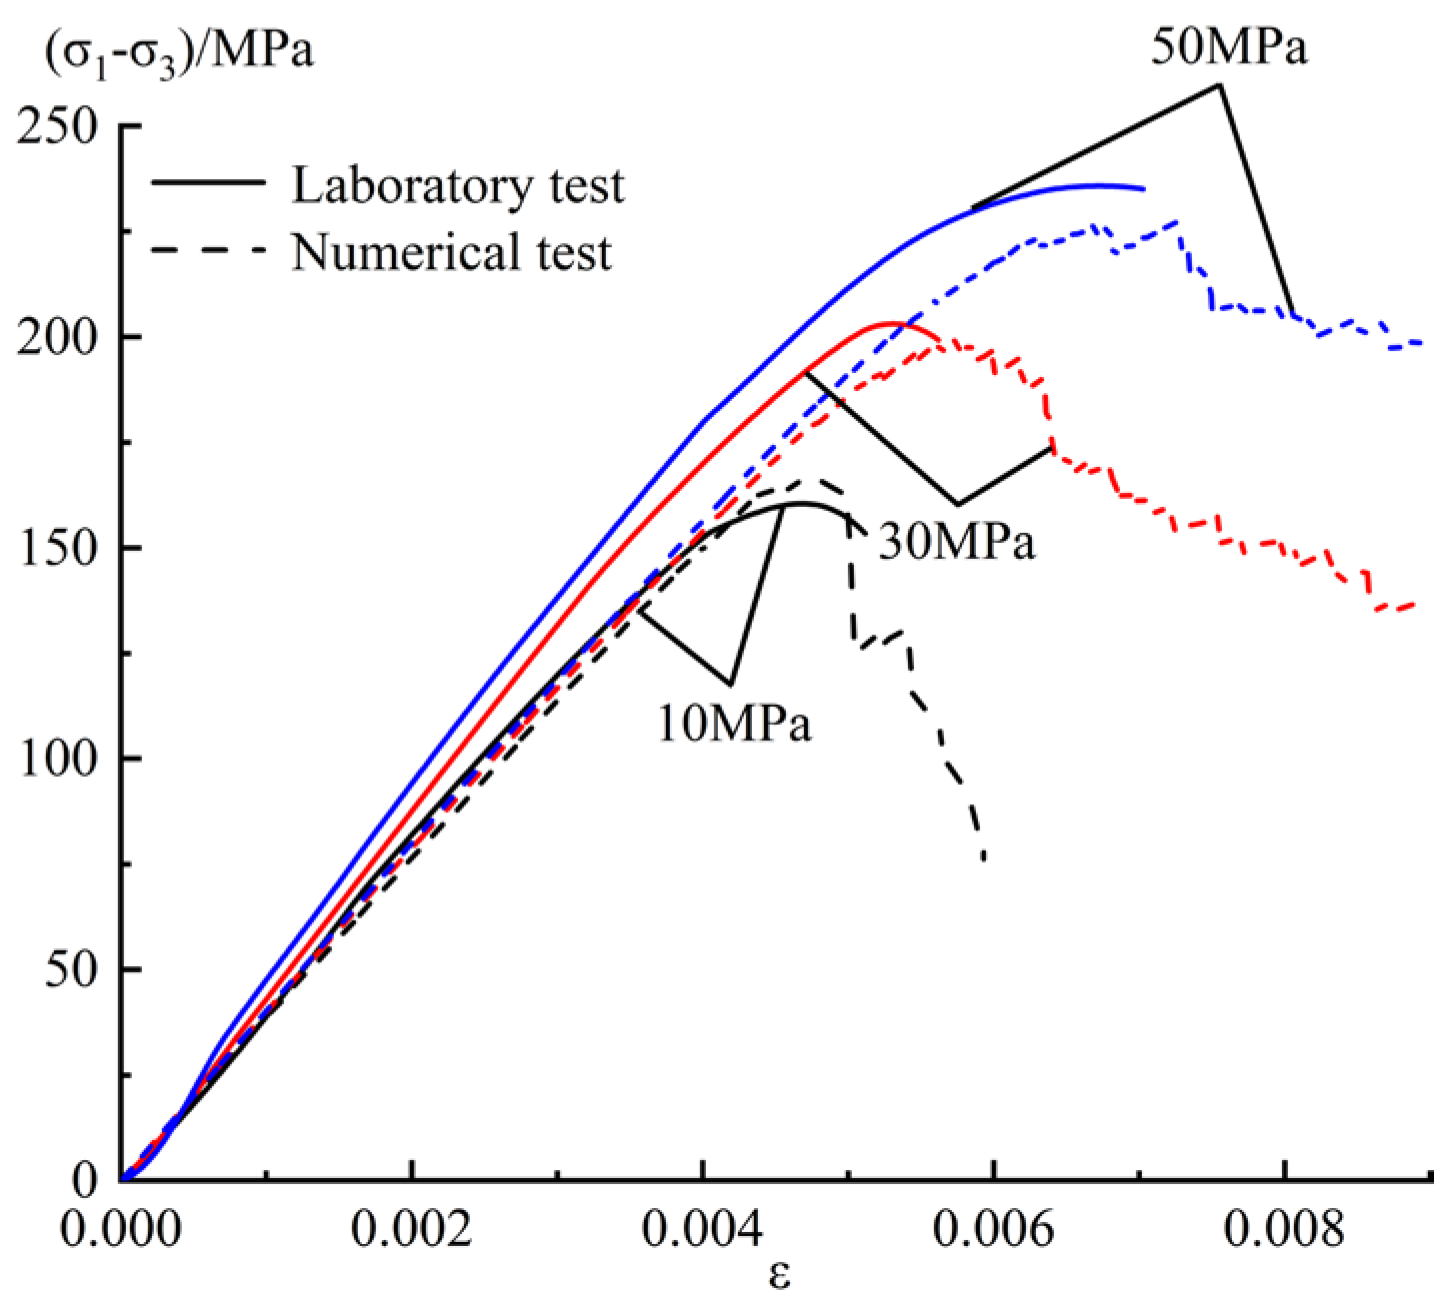
3.2. Parameter Verification

In order to ensure that the numerical model of marble established can be used to simulate the loading test, the stress–strain curves under the circumferential pressures of 10, 30 and 50 MPa in the indoor triaxial compression test were first selected for calibration. The calibration results are shown in Figure 4, where the indoor test curves approximately fit the numerical test curves. Table 2 presents a comparison of the macroscopic mechanical parameters obtained from the laboratory and numerical tests. It can be seen that the mechanical parameters of the two tests are similar to each other. Figure 5 illustrates a comparison of the failure patterns between the laboratory and numerical tests under varying circumferential pressures. It can be observed that the failure patterns in both the laboratory and numerical tests are similar, with obvious macroscopic shear fracture zones appearing in both. Based on the comparison of the stress–strain curves, macroscopic mechanical parameters, and failure patterns between the laboratory and numerical tests, it is justified to use this numerical model for conventional triaxial numerical simulations of marble [28].
Figure 6a–c present a comparison of the stress–strain curves for cyclic loading under different circumferential pressures (10, 30, and 50 MPa) with those from the conventional triaxial numerical tests. It can be observed that the outer envelope of the stress–strain curve for rock specimens under cyclic loading closely aligns with the overall trend of the conventional triaxial stress–strain curve.
Figure 6d presents the stress–strain curve of the marble numerical specimen under cyclic loading at a circumferential pressure of 10 MPa. Comparing with the laboratory test results, it is evident that the numerical simulation stress–strain curve for cyclic loading closely mirrors the mechanical characteristics observed in the laboratory tests to some extent. Additionally, the cyclic loading curves in the numerical simulation exhibit similar trends to the conventional triaxial curves, with the peak stress points showing closer alignment. This demonstrates that numerical simulations can effectively capture the stress–strain behavior of rocks under cyclic loading. Therefore, it is justified to use the numerical model for simulating cyclic loading tests on marble [29].

4. Numerical Simulation

4.1. Numerical Test Loading Scheme

The numerical simulation numerical tests were set up with two loading paths, conventional triaxial and cyclic loading, and the circumferential pressures were set to 10, 20, 30 and 40 MPa. The loading mode was consistent with the laboratory test, and the control loading and unloading rate was stable at 0.2 m/s [30]. A cyclic loading point was set for every 0.001 increase in strain [31], and the termination stress was set to 5 MPa. This cycle stopped the simulation test when the residual strength of the rock specimen was reached.

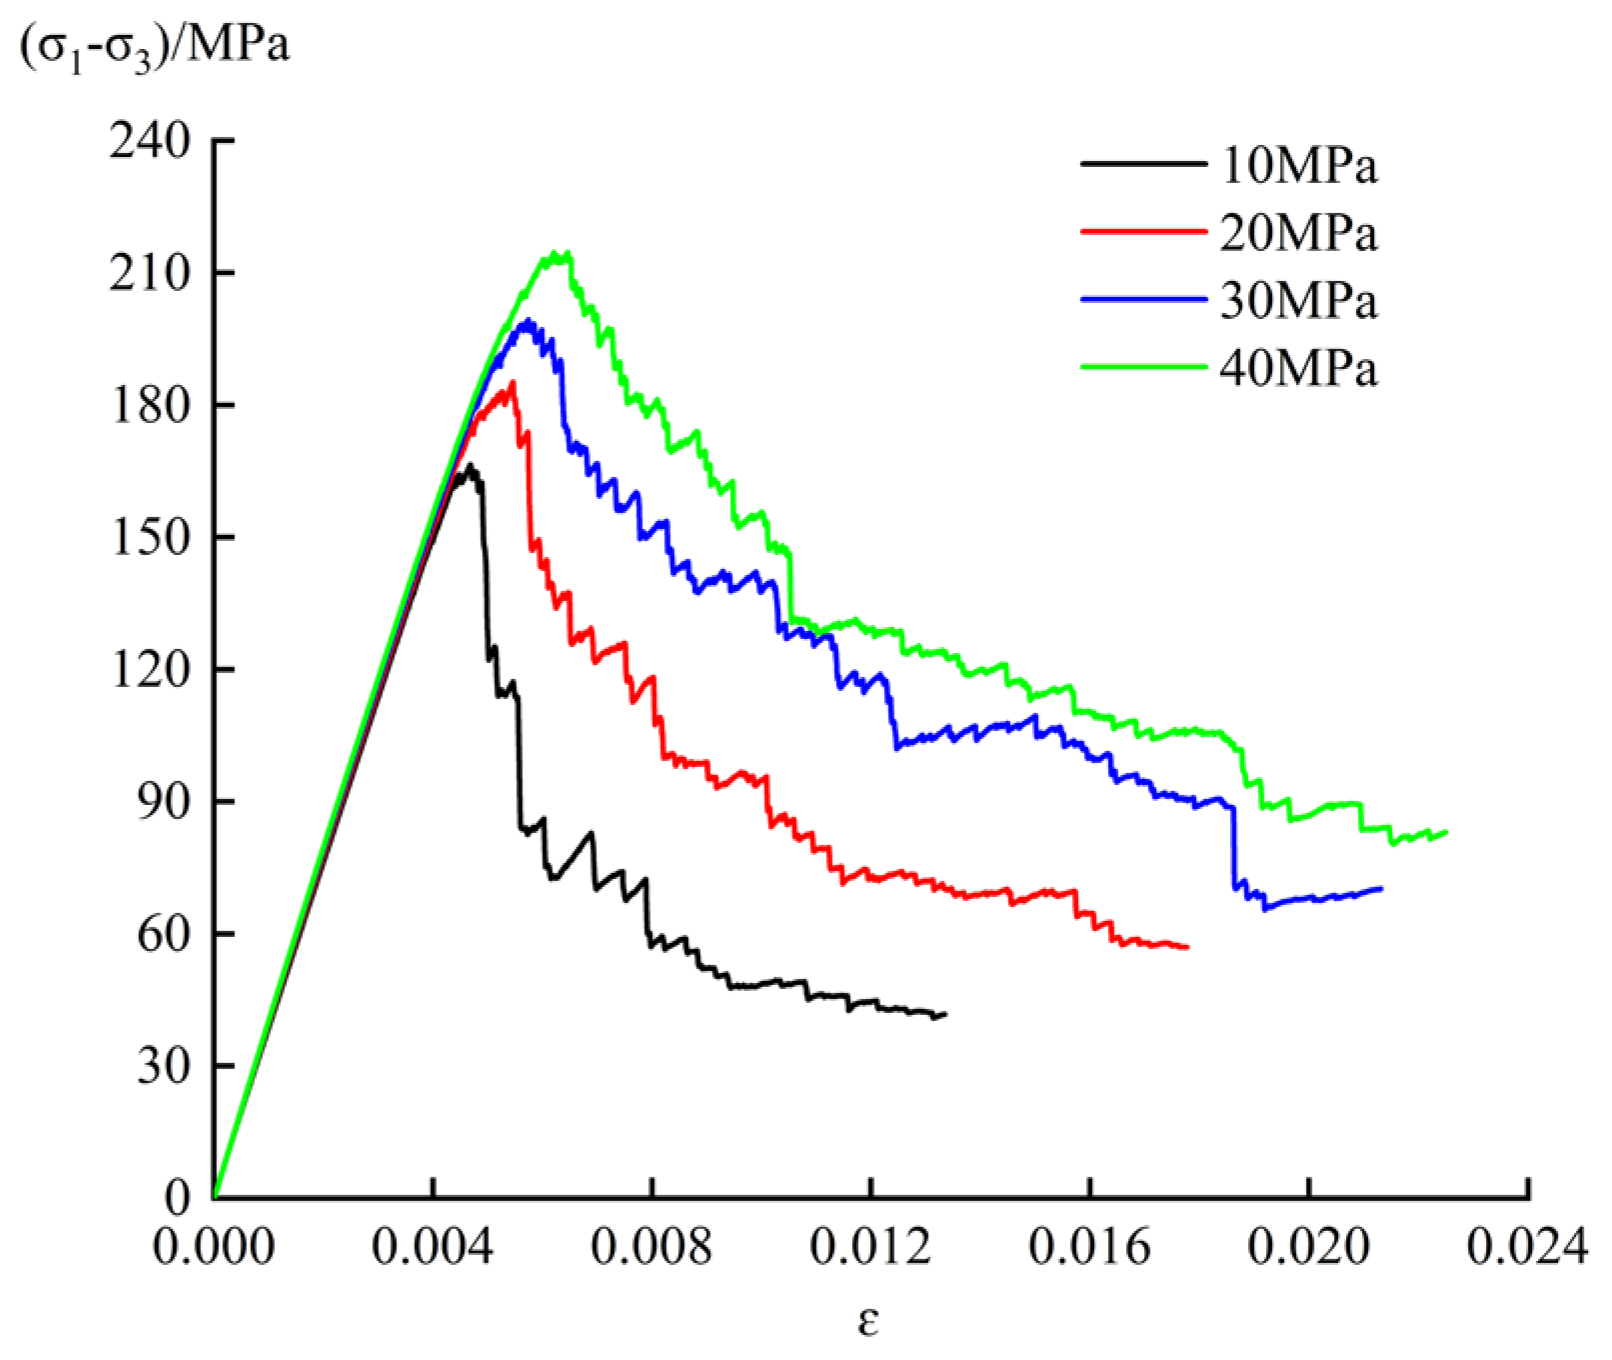
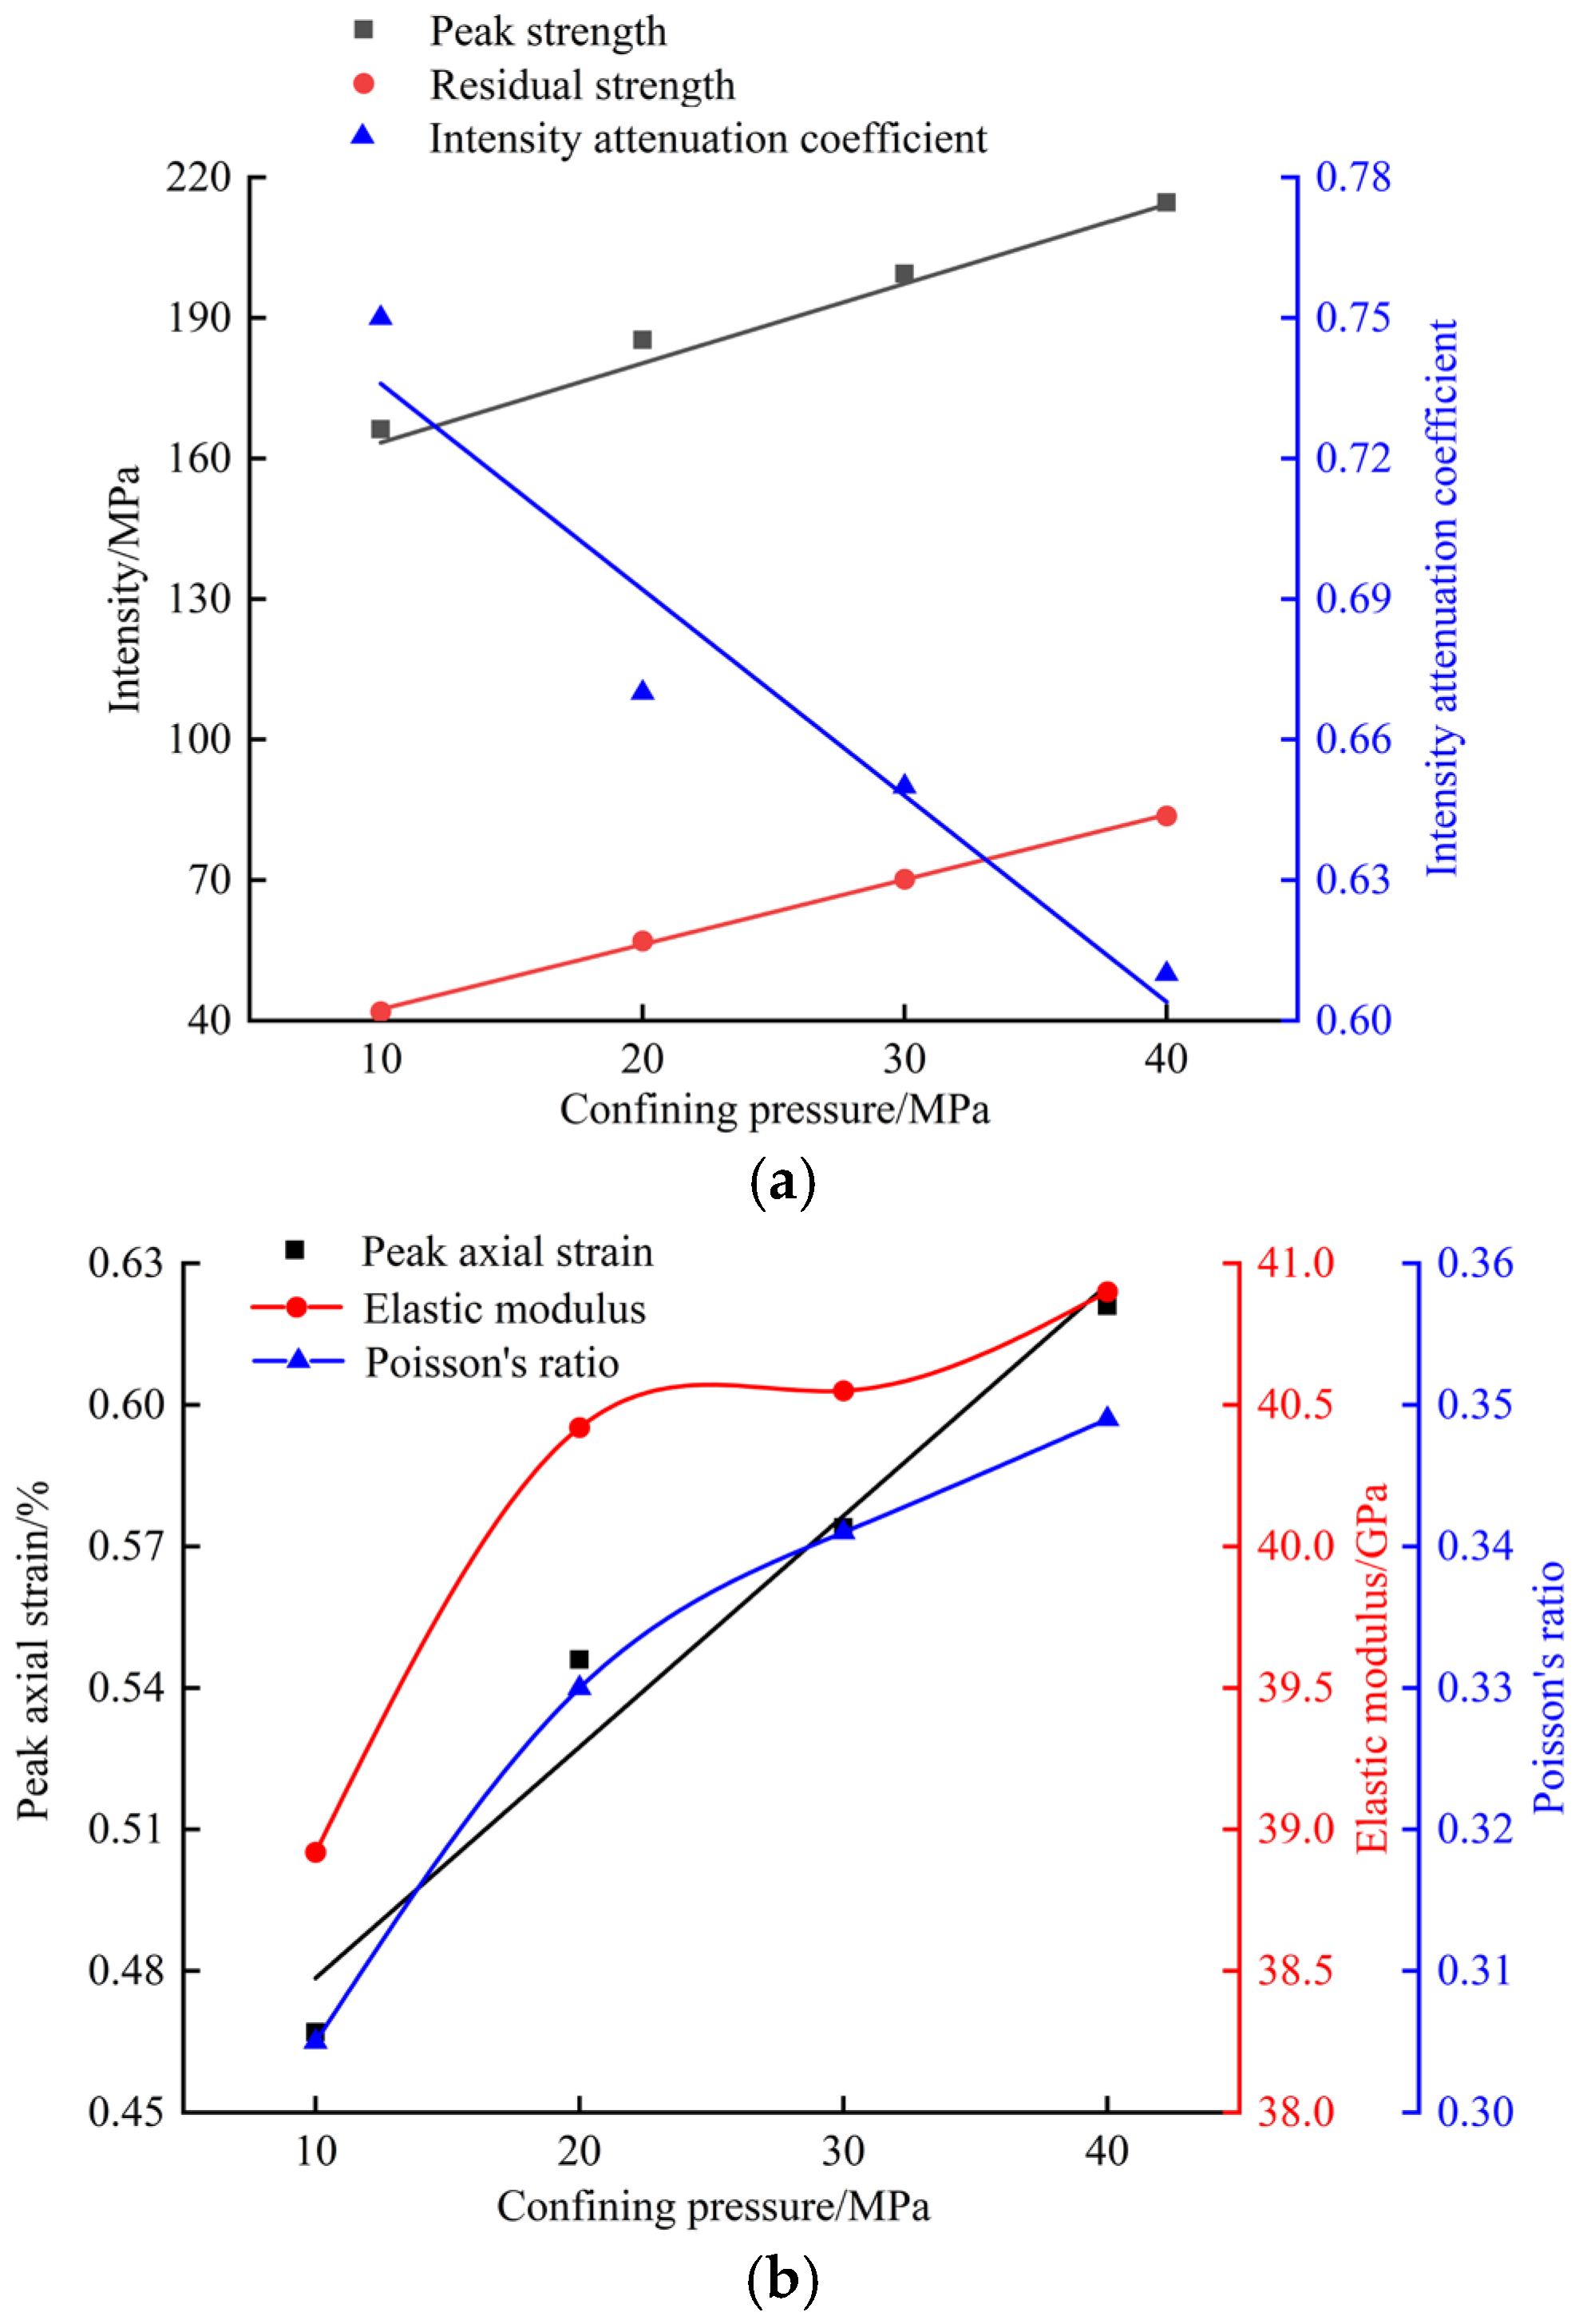
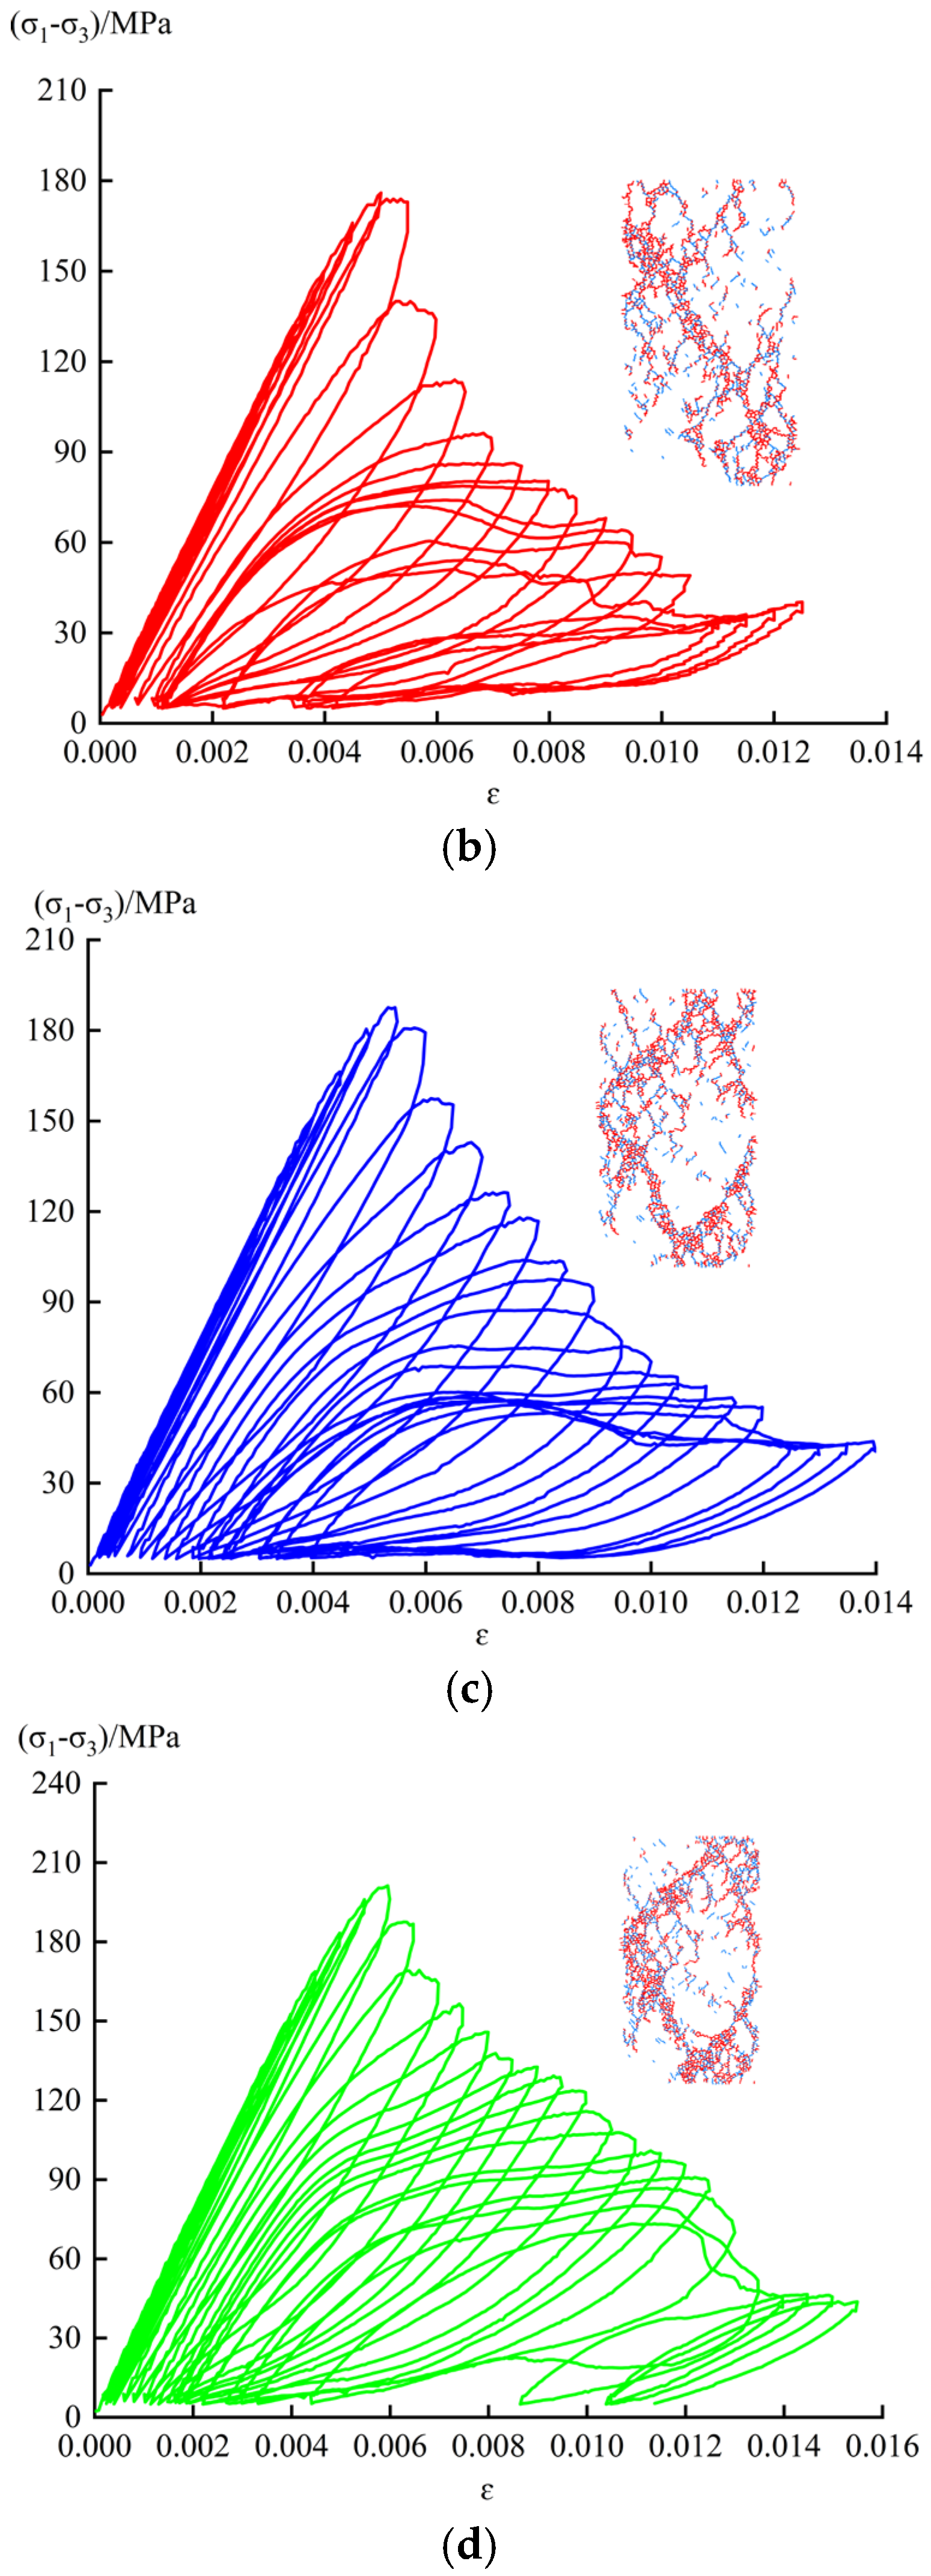
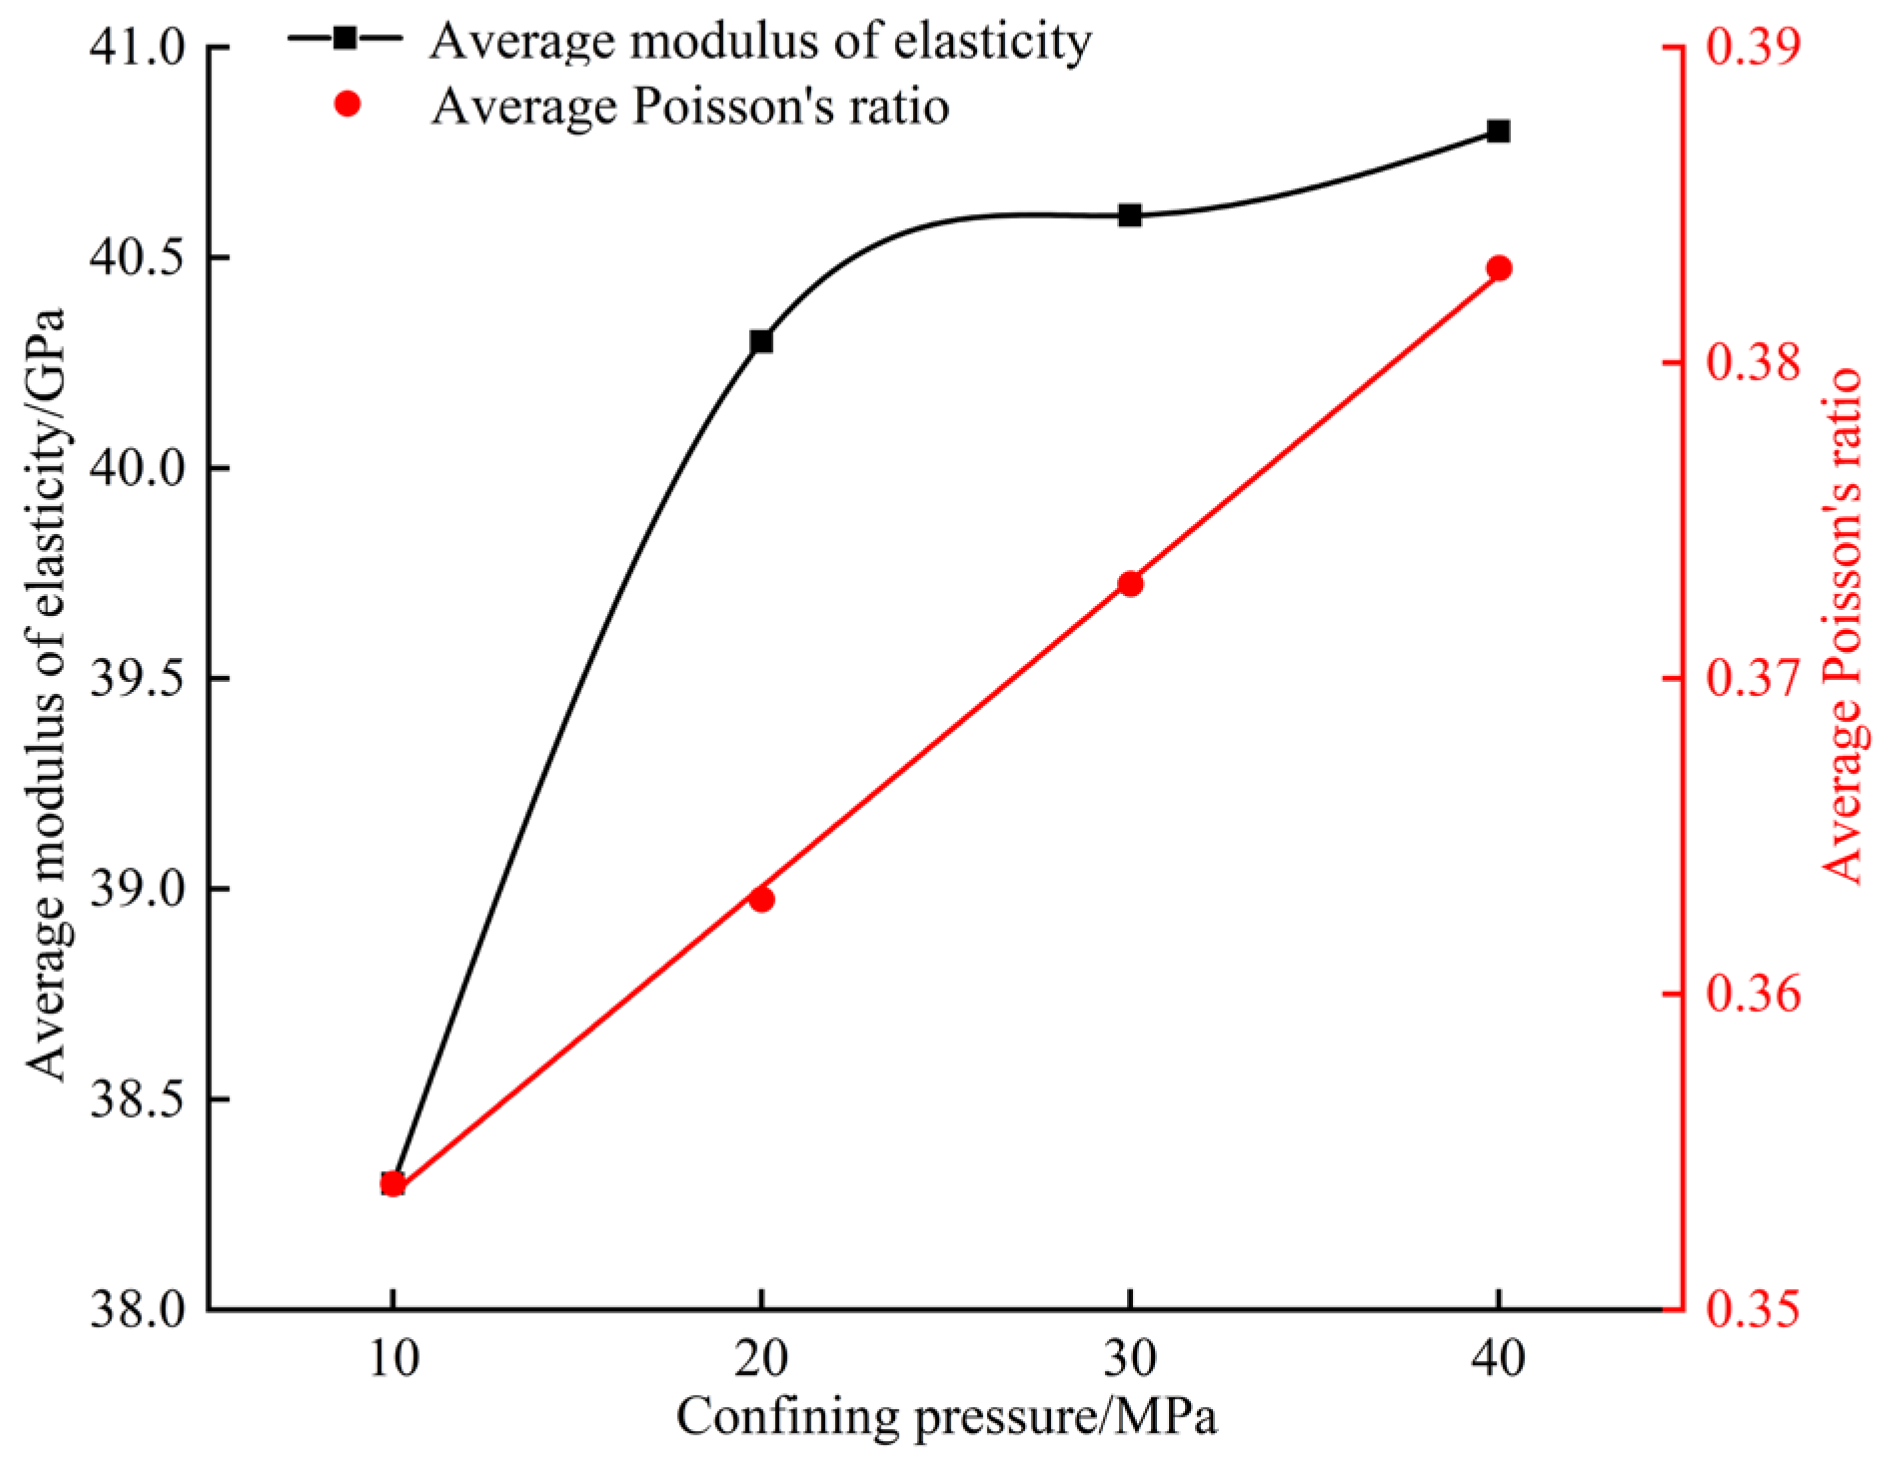
4.2. Strength and Deformation Characteristics

Figure 7 shows the results of the conventional triaxial simulation tests, from which the mechanical parameters of the rock specimens under varying circumferential pressures were derived, as shown in Table 3. It can be observed that the axial stress increases with the axial strain under varying circumferential pressures conditions, and because there are no primary defects in the numerical model, the curve cannot reflect the compaction process in the laboratory test [32]. Figure 8 shows the relationship curves between the strength parameters and deformation parameters and the circumferential pressures. It can be observed that the peak strength, residual strength, and peak axial strain of the rock specimens increase linearly with the rise in the circumferential pressures, when the circumferential pressures increases from 10 MPa to 40 MPa, the peak strength increases from 166.27 MPa to 214.64 MPa, the residual strength increases from 41.93 MPa to 83.70 MPa, and the peak axial strain increases from 0.467% to 0.621%. The strength attenuation coefficient (ratio of strength attenuation value to peak strength) can be used as an effective index to characterize the brittleness characteristics of rocks [33]. It is noteworthy that this coefficient exhibits a linear decrease as the circumferential pressures increase, suggesting a gradual reduction in the brittleness of the rock specimens with rising circumferential pressures (Figure 8a). Simultaneously, both the Poisson’s ratio and the elastic modulus show an overall increasing trend with the increase in the circumferential pressures. Specifically, the elastic modulus ranges from 38.92 GPa to 40.9 GPa, and the Poisson’s ratio ranges from 0.305 to 0.349.
The elastic modulus of the rock under cyclic loading can be represented by the elastic modulus of the unloading section, while the Poisson’s ratio can be determined by the ratio of the absolute value of the lateral strain increment to the axial strain increment in each cycle [34]. The stress–strain curves of the cyclic loading tests under various circumferential pressures are shown in Figure 9. According to the stress–strain curve, the peak strength, residual strength and peak axial strain of the rock specimens under varying circumferential pressures are obtained, as shown in Table 4. In conjunction with Figure 10, it can be seen that the three factors have a linearly positive correlation with the circumferential pressures. When the circumferential pressure increases from 10 MPa to 40 MPa, the peak strength increases from 161.57 MPa to 201.26 MPa, the residual strength increases from 30.55 MPa to 46.22 MPa, and the peak axial strain increases from 0.449% to 0.595%, increasing from 10 to 12 cycles to achieve peak strength. Figure 11 presents the variation curves of the elastic modulus and the Poisson’s ratio with the number of cycles under varying circumferential pressures. After the rock specimens are damaged, the Poisson’s ratio increases sharply, even exceeding 0.5, so the variation curves of the Poisson’s ratio are only calculated and analyzed in the pre-peak stage. Figure 11a,b show that the loading and unloading modulus variation patterns are similar under varying circumferential pressures. During the initial loading phase, the elastic modulus of the loading section increases significantly, reaching its maximum value after the second loading. This suggests that fracture closure improves the bearing capacity and reduces the deformation of the rock specimen under an external load. In contrast, the elastic modulus of the unloading section does not exhibit a rapid increase at the beginning of the loading process, as the fractures in the rock specimen are closed after the first loading. This leads to enhanced stiffness, resulting in the minimal influence of the unloading process on the internal fractures. With increasing cycles, the elastic modulus gradually decreases, with a rapid decline occurring near the peak strength. Once the rock specimen enters the residual strength stage, the elastic modulus stabilizes. Overall, with the increase in the circumferential pressures, the elastic modulus increases; however, the rate of the increase becomes less pronounced at higher circumferential pressures. Specifically, taking the sixth cycle as an example, when the circumferential pressures increases from 10 MPa to 20 MPa, the loading elastic modulus increases from 37.78 GPa to 39.55 GPa, an increase of 4.69%, and the unloading elastic modulus increases from 38.30 GPa to 39.62 GPa, an increase of 3.45%. When the circumferential pressures increases from 30 MPa to 40 MPa, the loading elastic modulus increases from 39.95 GPa to 40.30 GPa, with an increase of 0.88%, and the unloading elastic modulus increases from 40.04 GPa to 40.38 GPa, with an increase of 0.85%. From the overall trend of the post-peak elastic modulus, it can be seen that the decrease in the modulus of elasticity under loading and unloading is significantly reduced at higher circumferential pressures, indicating that an increase in the circumferential pressures effectively mitigates the damage to the rock specimens. Additionally, the Poisson’s ratio increases with the number of cycles under varying circumferential pressures (Figure 11c). To further investigate the influence of the circumferential pressures on the elastic modulus and Poisson’s ratio, the average values of these parameters were calculated, as shown in Figure 12. It can be observed that the average elastic modulus increases with the rise in the circumferential pressures, while the average Poisson’s ratio increases linearly with increasing circumferential pressure.
Figure 13 presents a comparison of the peak strength, Poisson’s ratio, and elastic modulus between conventional triaxial and cyclic loading at various circumferential pressures. It can be seen that the difference in peak strength between conventional triaxial and cyclic loading under the same circumferential pressure conditions is not significant, being higher under conventional triaxial. During the cyclic loading process, the rock specimens are continuously compacted and the peak strength is improved to some extent, However, a higher cyclic stress level will cause damage to the rock specimen and decrease the peak strength, so the peak strength under the two loading methods is relatively close (Figure 13a). As shown in Figure 13b, the Poisson’s ratio under cyclic loading is higher at each circumferential pressure compared to conventional triaxial loading. This is primarily due to the repeated loading and unloading, which facilitates the formation and propagation of new cracks within the rock specimen, leading to greater lateral deformation than in conventional triaxial testing. When the rock specimen circulates to the peak strength, the internal microcracks increase rapidly, expand and penetrate, forming a macroscopic failure surface, and the elastic modulus decreases instantaneously. Therefore, the elastic modulus of cyclic loading is generally smaller than that of conventional triaxial loading (Figure 13c). It is worth noting that when the circumferential pressures is 10 MPa, the difference between the elastic modulus of the two loading paths is 0.62 GPa, while when the circumferential pressures is increased to 20,30 and 40 MPa, the difference is only 0.12 GPa, 0.05 GPa and 0.1 GPa, At higher circumferential pressures, the elastic modulus of both loading paths becomes approximately equal, and the effects of cyclic loading on the elastic modulus of the rock specimens are negligible. This is primarily because the internal porosity of the rock specimen decreases as the circumferential pressure increases, and the supportive structure no longer experiences significant reinforcement [35]. In conclusion, the cumulative damage resulting from cyclic loading significantly influences the mechanical properties of rock, highlighting the need to account for the deterioration of the mechanical parameters in rock masses due to partial excavation when designing underground caverns under high ground stress. As a process of progressive rock disturbance, partial excavation can be used to evaluate the construction risk through gradual displacement monitoring and stress monitoring, so as to provide the necessary time and space for the design of timely support measures, which is suitable for complex geological conditions or large-scale rock mass engineering. For projects with favorable geological conditions, the full-section excavation method can significantly improve construction efficiency and reduce costs, and it is a more suitable choice.

5. Micromechanical Response and Analysis

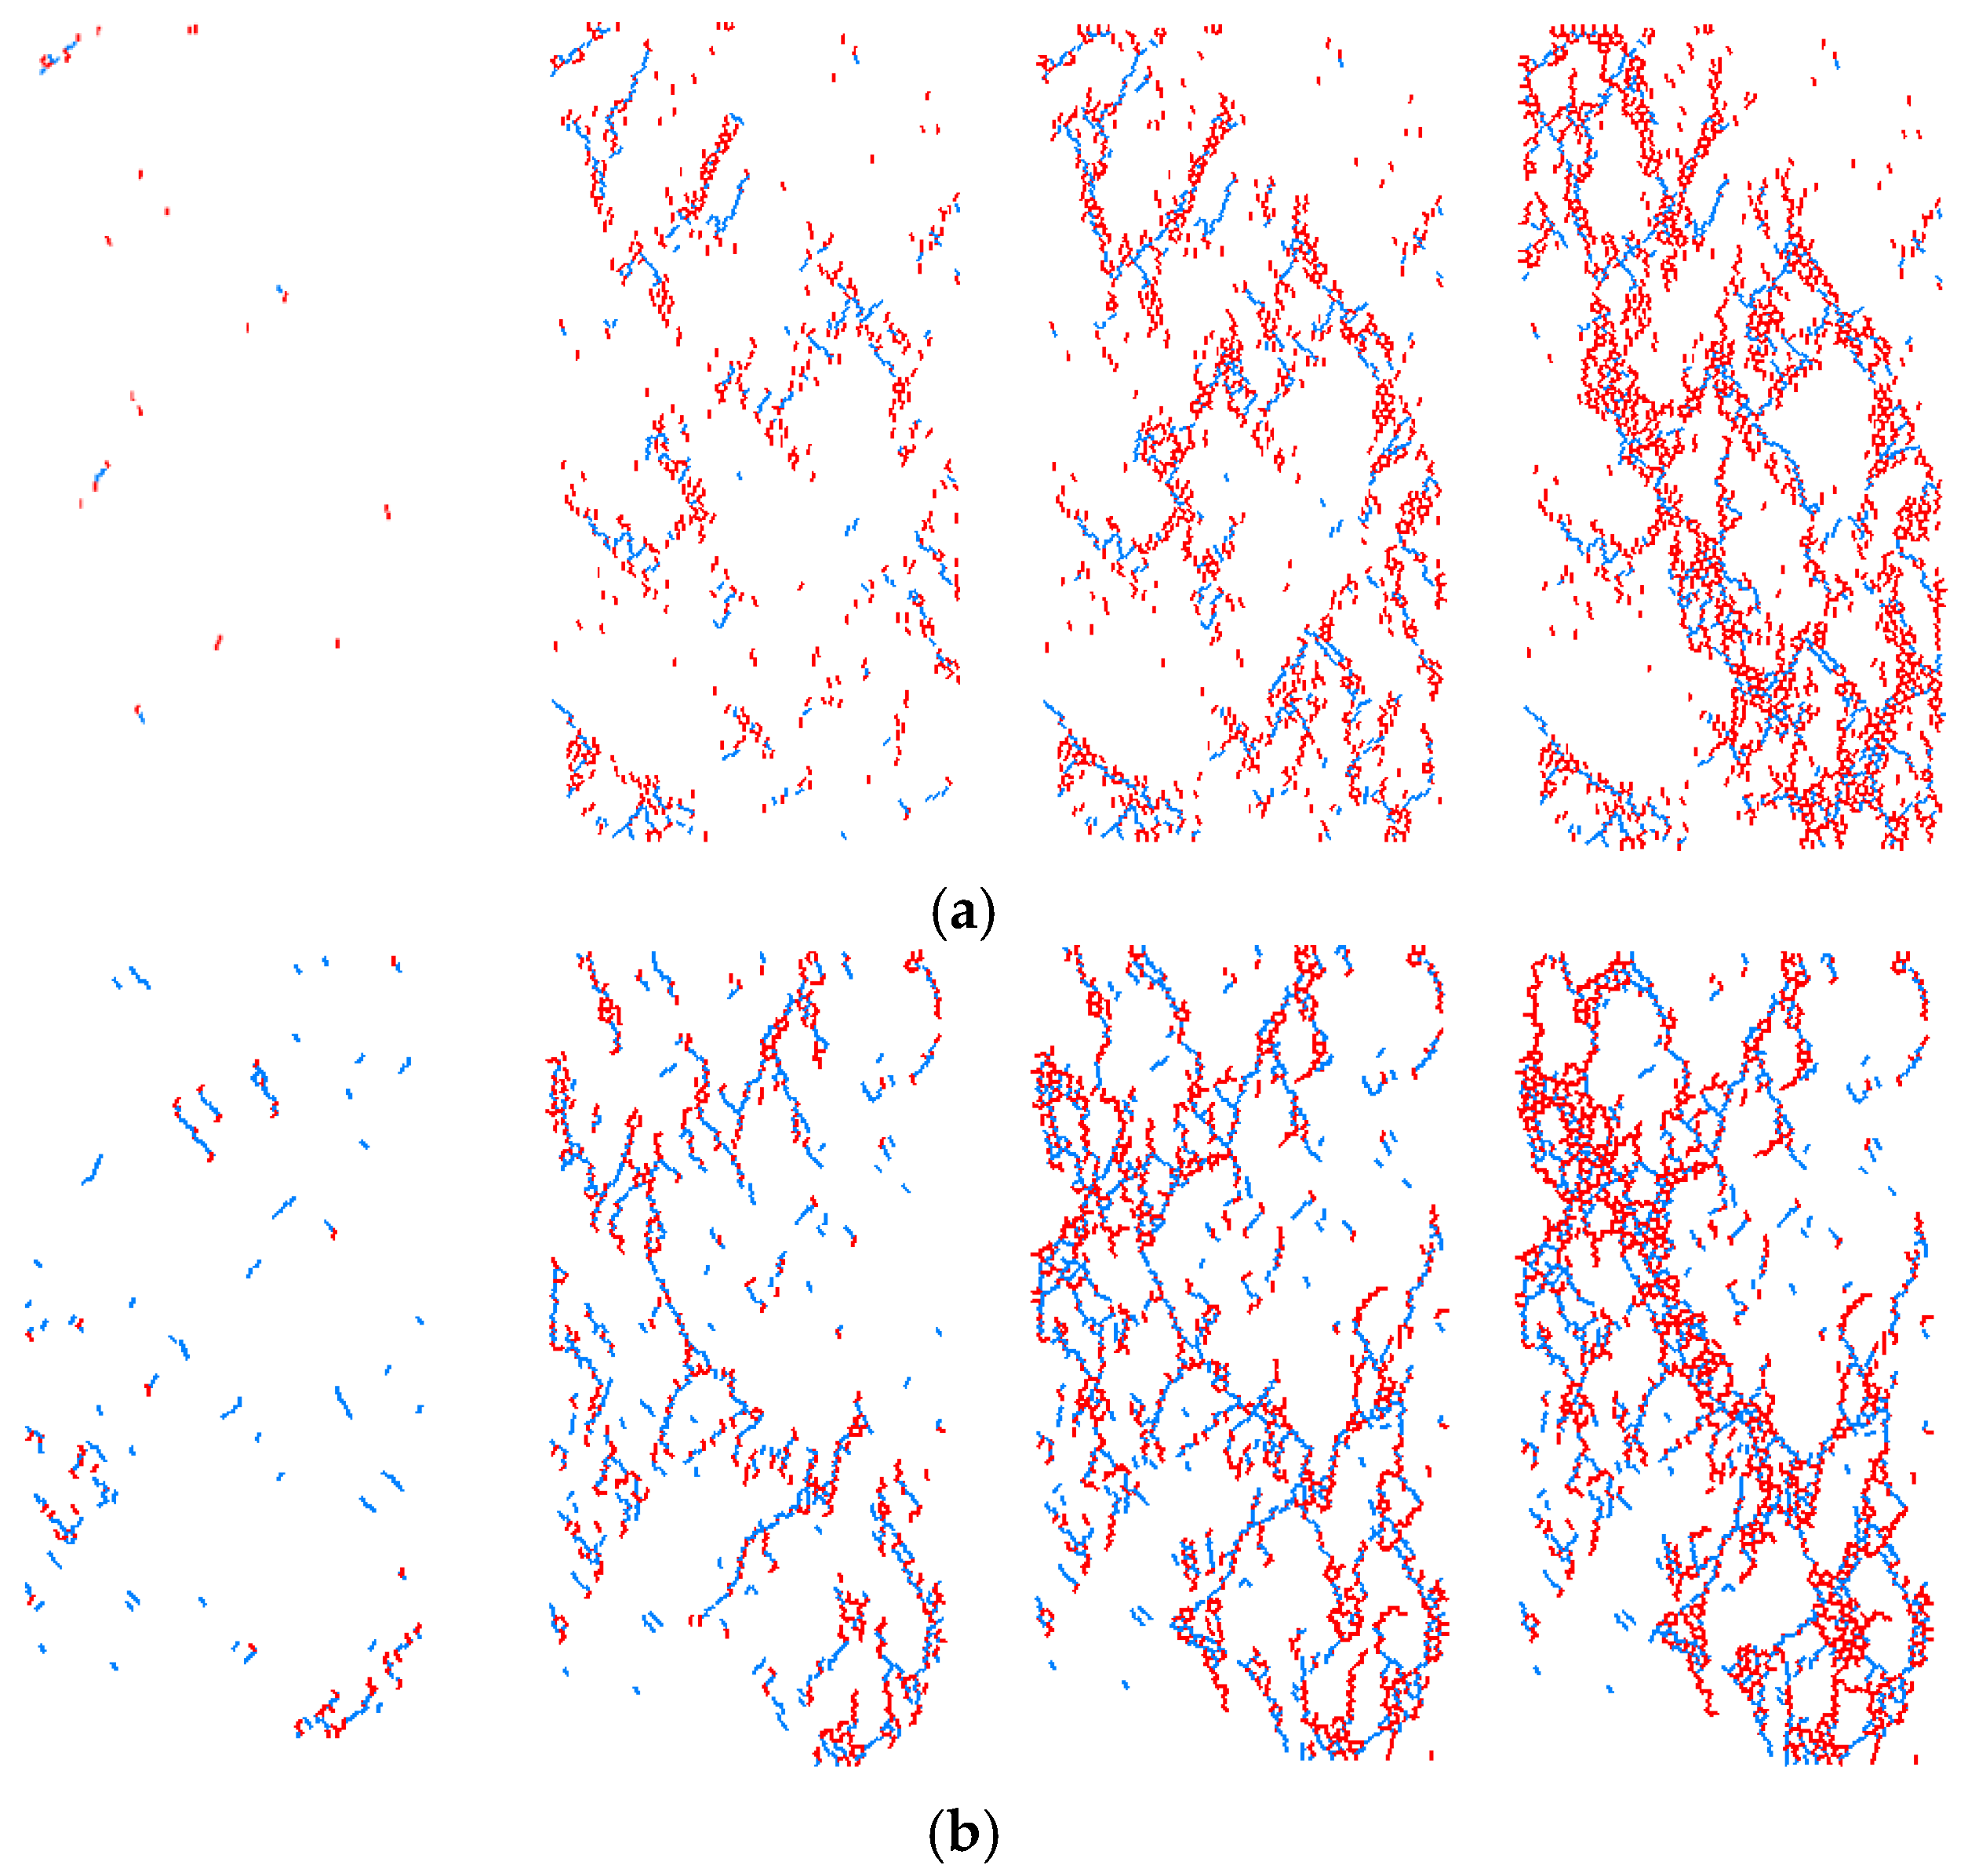
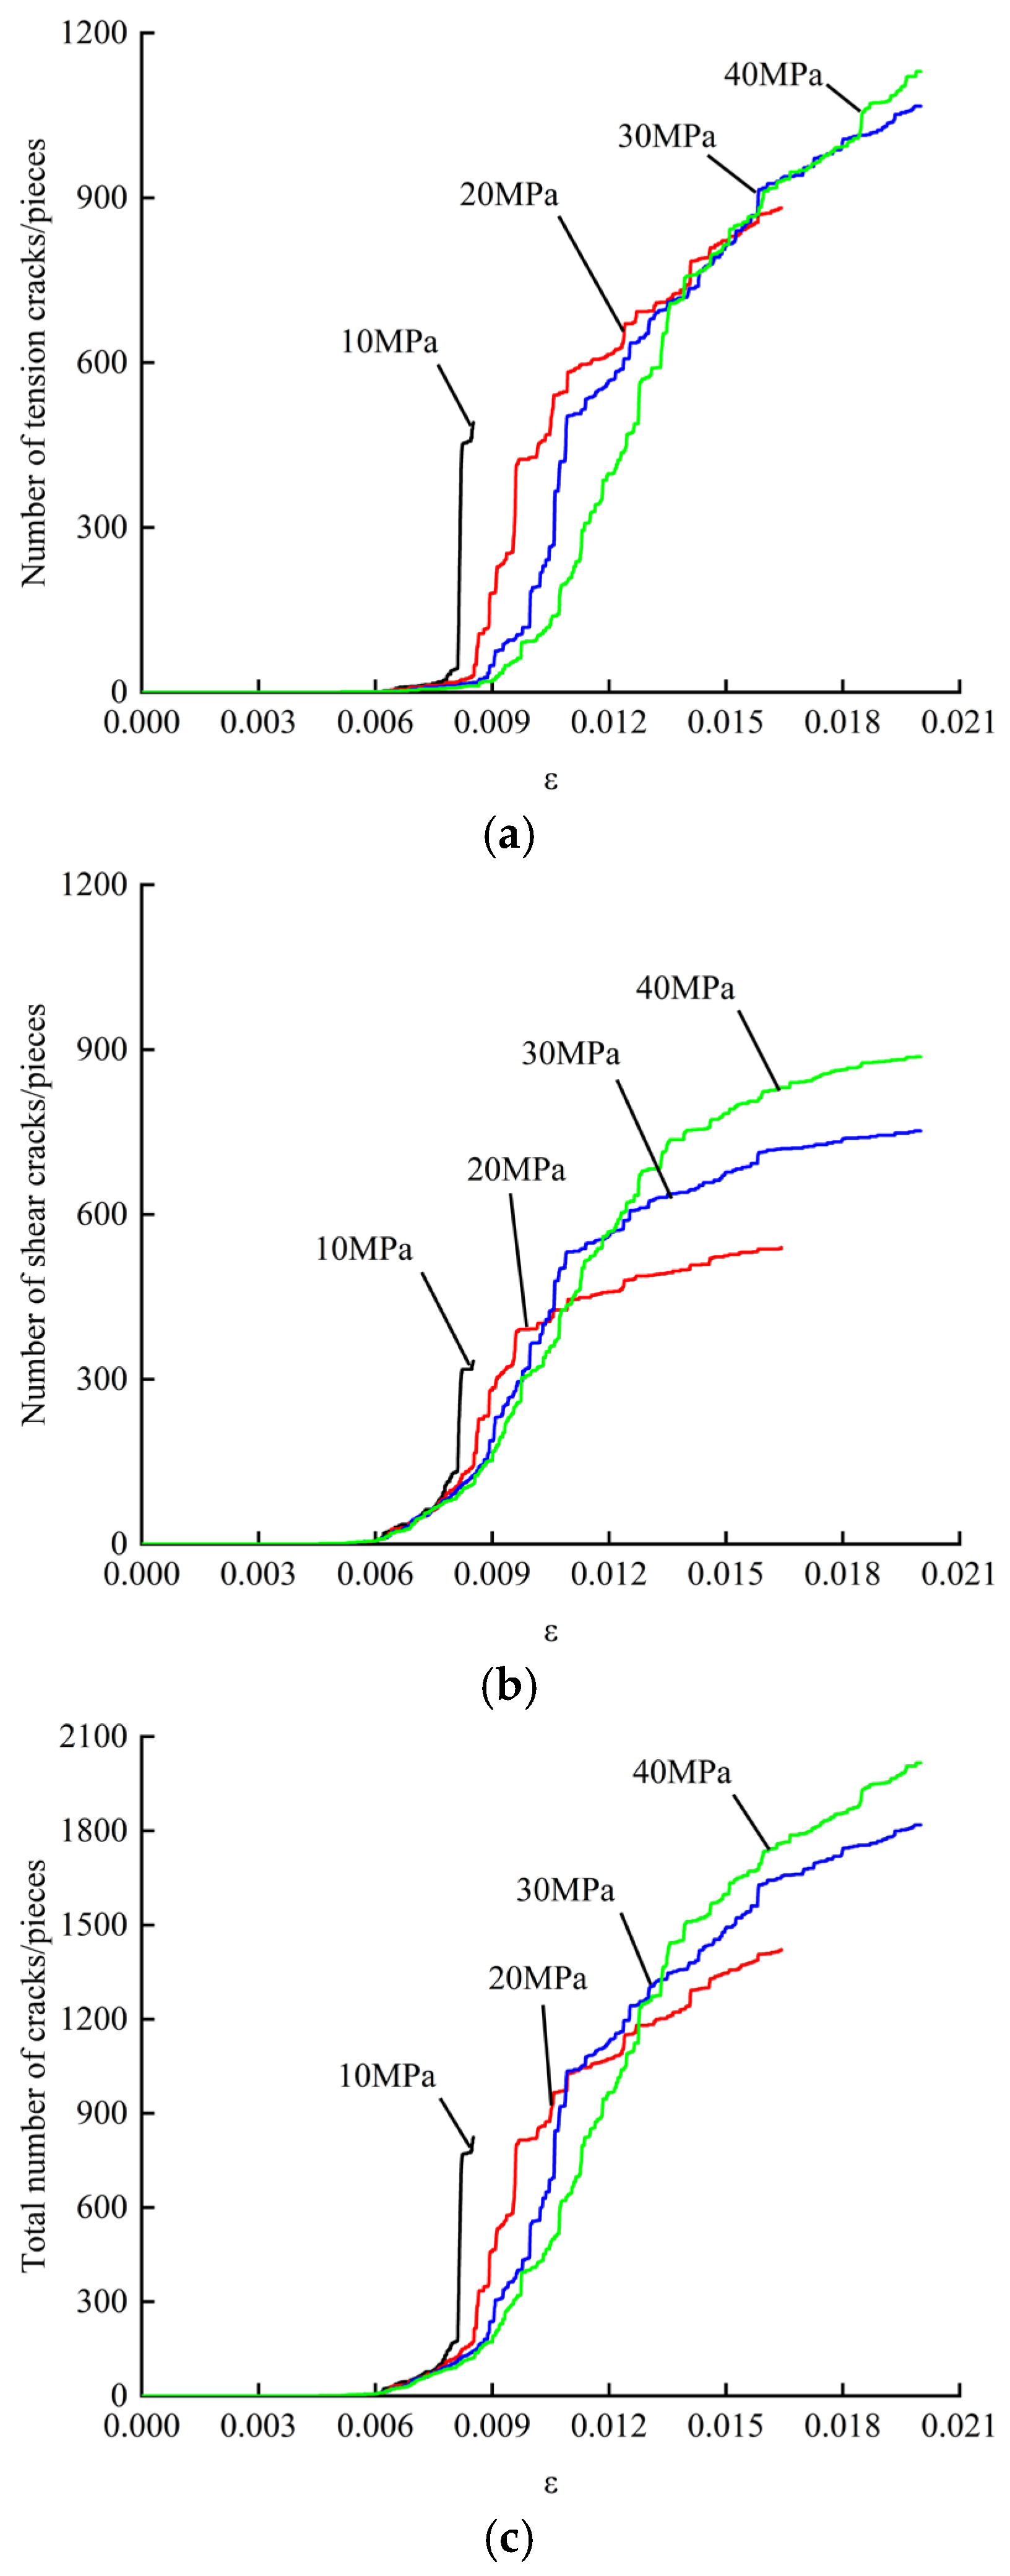
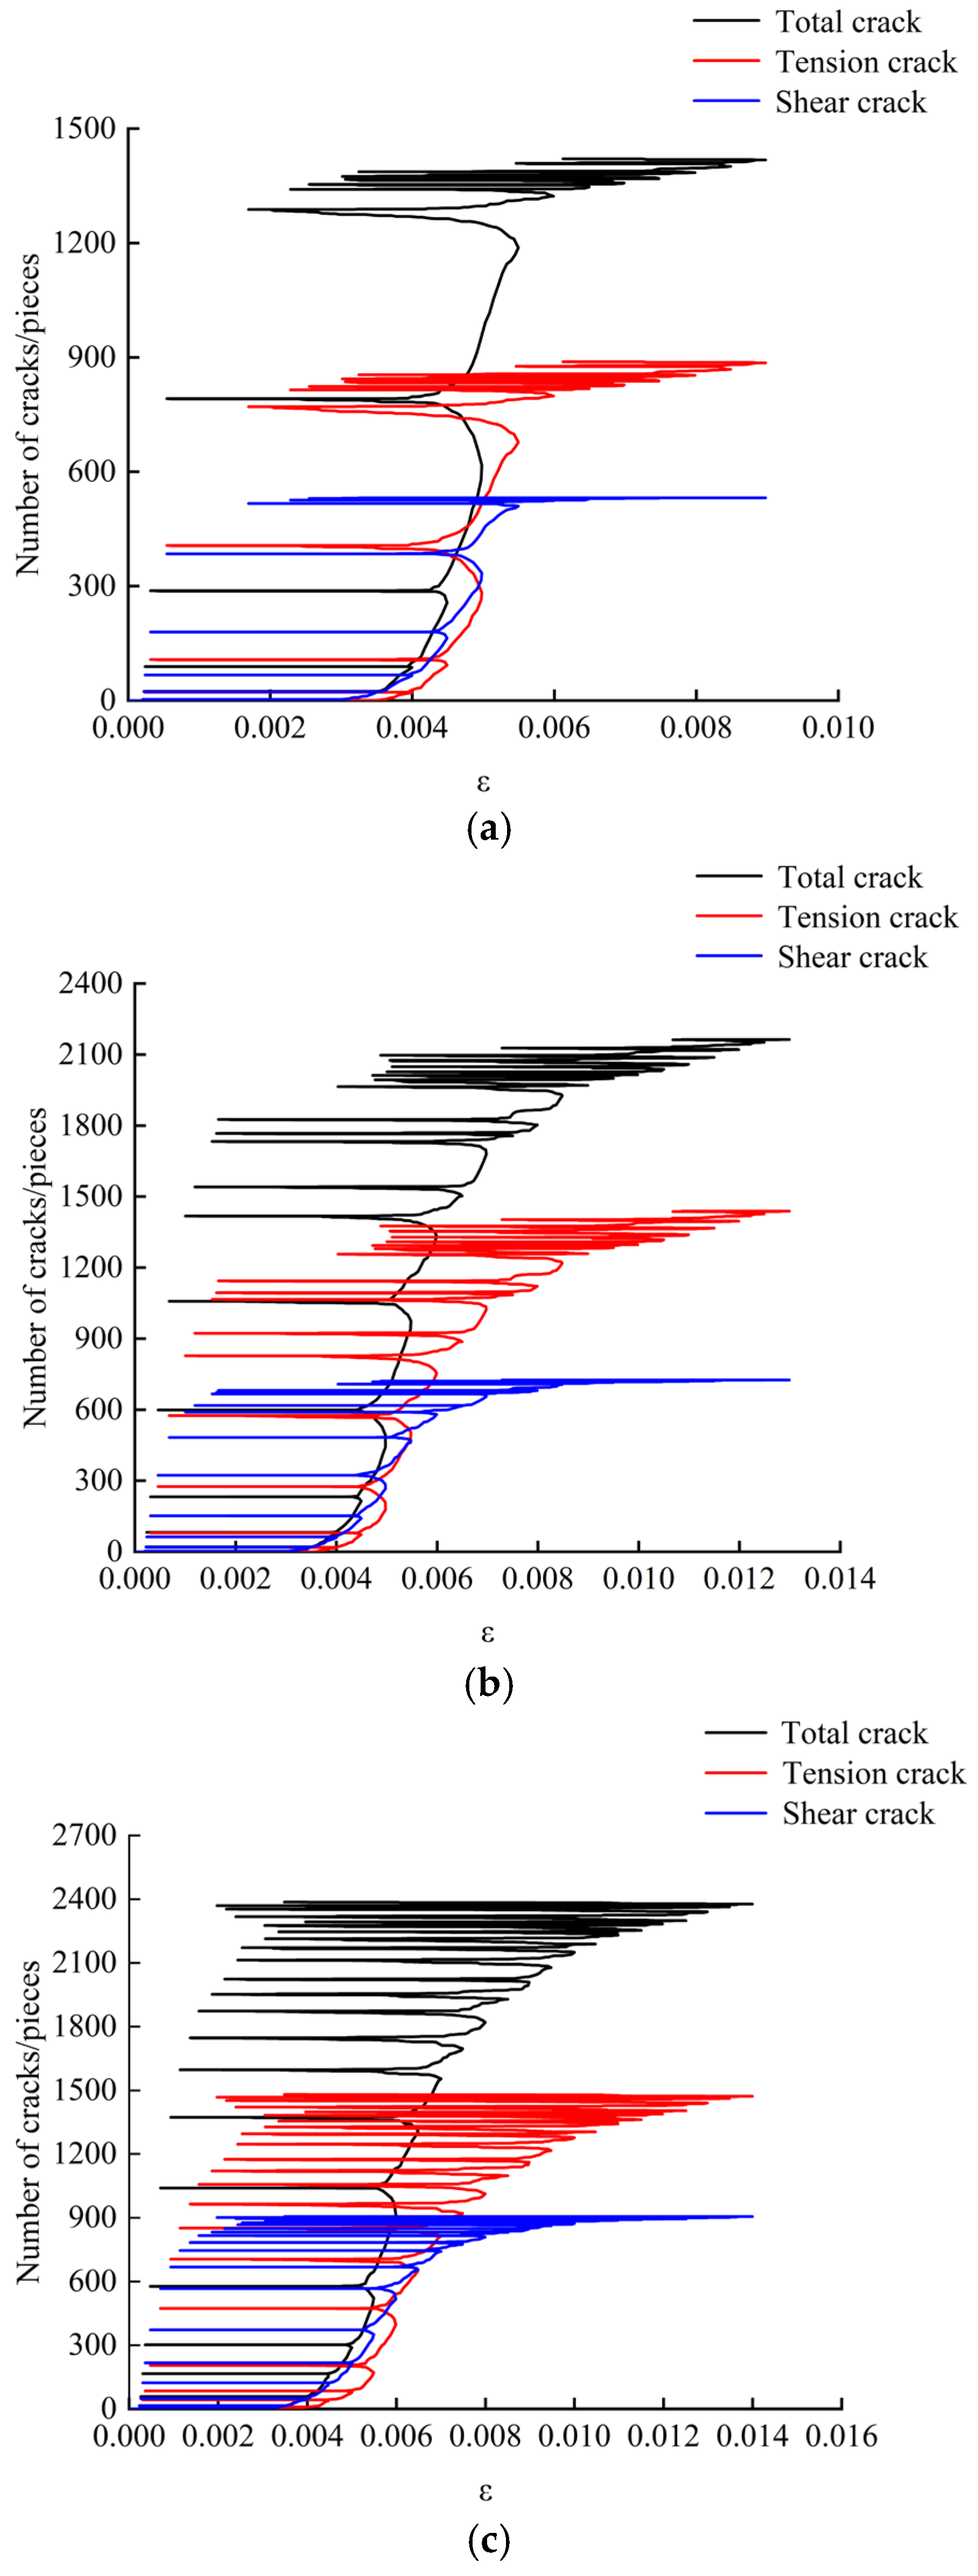
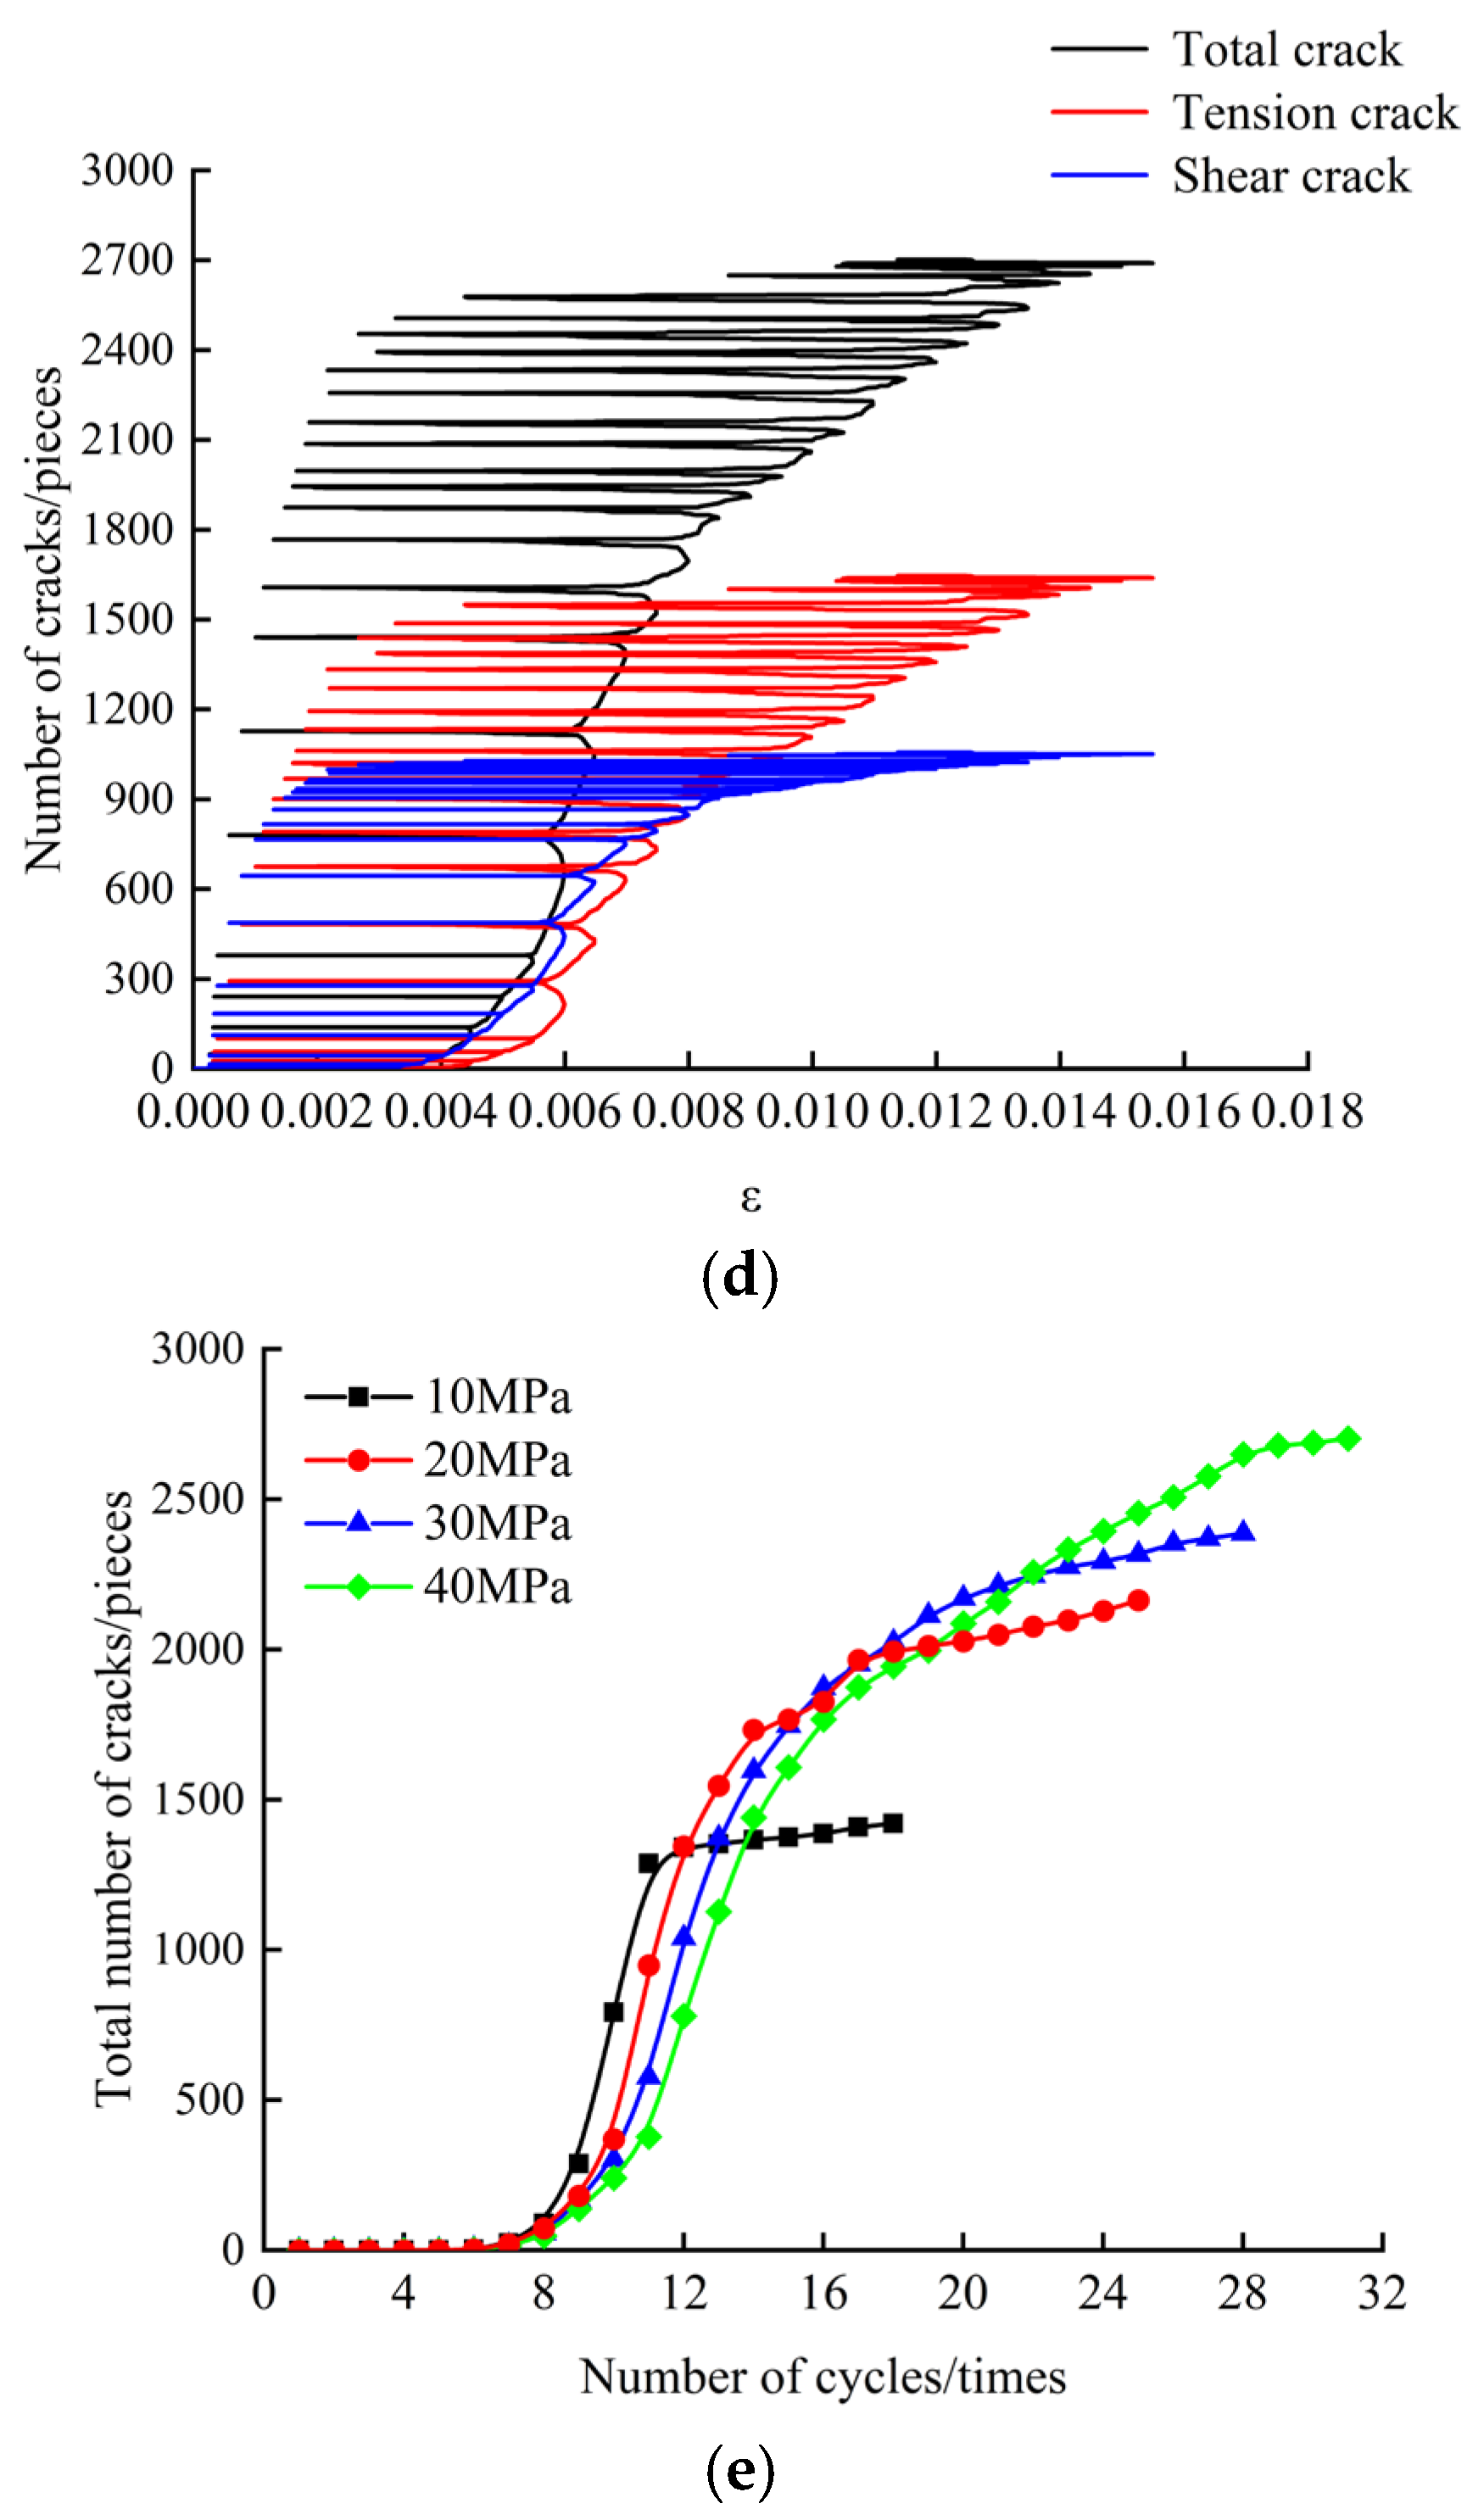
5.1. Microcrack Number Evolution

During the loading process, rock materials undergo complex deformation and damage, with the generation and propagation of microcracks playing a crucial role in influencing the mechanical properties and failure mechanisms of the rock. DEM is used to track and record cracks, and the change in the number of microcracks is monitored in real time to analyze the law of the evolution of damage in rock specimens. In the parallel bonding model, when the normal stress or tangential stress applied during compression exceeds its corresponding bonding strength, the contact bond between particles will break, and this fracture process leads to the formation of microcracks. These fractures can be classified into tensile cracks and shear cracks based on the dominant stress direction, as illustrated in Figure 14 below [36].
The development of the number of microcracks under conventional triaxial is shown in Figure 15a. Based on Figure 16, it can be observed that the evolution of the number of microcracks in rock specimens under varying circumferential pressures follows a similar pattern. The development curves for the total number of cracks, tensile cracks, and shear cracks exhibit an “S”-shaped growth trend, with their abrupt changes correlating well with the elastic, plastic, and failure phases of the stress–strain curve. At the beginning of loading, the rock specimens are in the elastic phase and the number of microcracks is low; the number of microcracks gradually increases as the rock specimen is loaded until it enters the plastic phase. When the axial strain exceeds the peak strain, the microcracks grow dramatically and penetrate each other, leading to macroscopic damage to the rock specimen. After entering the residual stage, the number of microcracks gradually becomes stable. In the pre-peak stage, the higher circumferential pressures correspond to fewer microcracks, indicating that the circumferential pressures can inhibit the propagation of microcracks during this phase. Additionally, as the circumferential pressures increase, the stage of rapid microcrack growth is progressively delayed, suggesting that the circumferential pressures moderate the rapid development of cracks to some extent. When the rock specimens are loaded to the residual stage, the cumulative number of microcracks increases with the increase in the circumferential pressures, and at the end of the test, the total number of cumulative microcracks under each circumferential pressures is 824, 1412, 1819, and 2017, which is primarily due to the circumferential pressures exerting a limiting effect on the lateral deformation of the rock specimen, which hinders its destruction. As a result, the accumulation of microcracks in the rock specimen increases by the end of the test.
The evolution of microcracks under cyclic loading is depicted in Figure 15b. As shown in Figure 17, the number of internal microcracks in the rock specimens increases in a stepwise fashion with the increase in axial strain under varying circumferential pressures. In the pre-peak stage, there are few microcracks, and the number development shows obvious “memory” characteristics; in other words, the number of microcracks remains stable in a horizontal line before the axial strain reaches the maximum strain of the last cycle when the axial stress is reloaded after unloading. When cyclic loading reaches near to the peak strength, the microcrack number curve shows a non-“memory” behavior, and the number of microcracks begins to increase before the axial strain reaches the previous maximum. This is mainly due to the continuous accumulation of damage inside the rock specimens and the constant adjustment of the position arrangement between the particles. When the cycle to post-peak failure occurs, the slope of the number of microcracks decreases with the rise in the number of cycles, indicating that the generation rate of microcracks slows down and the macroscopic cracks form shear bands. After entering the residual stage, microcracks are mainly generated by the repeated friction of the macroscopic fracture surface, and the increase rate of the microcracks is very small. Figure 17e shows that during the cyclic loading process, the variation trend of the total number of microcracks with the number of cycles under varying circumferential pressures is similar to that observed in conventional triaxial tests. In the pre-peak loading stage, a higher circumferential pressure results in fewer microcracks at the same number of cycles. At the eighth cycle, the number of microcracks at 10, 20, 30 and 40 MPa under varying circumferential pressures is 89, 74, 58, and 48, respectively, showing a decreasing trend. At the conclusion of the test, the total cumulative number of microcracks is 1421, 2232, 2386, and 2702, respectively, demonstrating an increasing trend with higher circumferential pressures. This is consistent with the variation in the total number of microcracks in rock specimens as a function of the circumferential pressures observed under conventional triaxial conditions. In the deep underground engineering construction process, the rock body in the stress adjustment will not immediately rupture and collapse, but after a period of time, the sudden rock burst phenomenon is known as a time-lagged rock explosion [37]. It is worth noting that, in combination with Figure 9 and Figure 17, it can be seen that the rock samples under low peripheral pressure conditions undergo damage immediately after the peak stress is reached. In contrast, the rock samples under high circumferential pressure need to undergo one to two cycles before damage occurs after reaching the peak stress, and the damage process shows an obvious hysteresis. This phenomenon explains the fact that time-lagged rock bursts are more likely to occur in regions of high geostress, and therefore, deep underground works need to be predicted by measures such as microseismic monitoring and optimization of the sequence and manner of the excavation.
The total numbers of cracks, including tensile and shear cracks, in rock specimens after failure under varying circumferential pressures are listed in Table 5 and Table 6. It can be observed that the total number of microcracks under cyclic loading at various circumferential pressures exceeds that under conventional triaxial conditions. This indicates that compared to conventional triaxial loading, the degree of damage to rock specimens under cyclic loading is more severe. Under varying circumferential pressures, the proportions of tensile cracks in conventional triaxial loading and cyclic loading are 59.30~65.41% and 59.03~63.05%, respectively, indicating that tensile cracks are dominant under the two loading modes, and the proportion of shear cracks generated under cyclic loading is higher than that observed under conventional triaxial loading and unloading. This suggests that cyclic loading promotes the formation of shear cracks. Shear reinforcement supports (e.g., high-strength anchors, steel-fiber concrete) are required in areas susceptible to mechanical vibrations (e.g., seismic loads) during cavern construction. As the circumferential pressures increases, the crack types in both loading modes exhibit a similar trend, with a gradual decrease in the proportion of tensile cracks and a relative increase in shear cracks. This change is primarily due to the significant enhancement of the rock’s compressive strength with increasing circumferential pressures, while the shear strength remains relatively lower, making the rock more susceptible to shear failure. Additionally, at higher circumferential pressures, the lateral deformation of the rock specimen is constrained. Under deviatoric stress, cracks predominantly form and propagate as shear cracks, resulting in the increase in shear cracks. The experimental results can well explain the effect of confining the pressure and stress path on the rock failure form and damage degree from the microcrack growth, which is consistent with the experimental results observed by Yang et al. [35,38] using a micro-CT scanning system, indicating that the simulation results are consistent with the existing research rules. This means that the perimeter rock damage support measures for underground cavern construction under high geostress should be based on the prevention of shear damage, and the spacing and length of the anchors can be appropriately increased or the anchor support parameters can be systematically reconfigured.

5.2. Microcrack Angle Distribution

The tendency angles of the total cracks, tension cracks and shear cracks after rock specimen failure were calculated and a rose map was made. It was found that the angle distribution of the three kinds of microcracks was similar under varying circumferential pressures. Therefore, only the crack angle distribution under the circumferential pressure of 20 MPa was analyzed, as shown in Figure 18. It is evident that the angular distribution of the tensile and shear cracks is distinct. Among them, the dip angle of a tensile crack after rock specimen failure under conventional triaxial conditions is mostly distributed in the axial loading direction (80~100°). The reason for this is that under the action of a vertical axial load, the particles are separated radially, resulting in the center spacing of adjacent particles exceeding the sum of their radii. However, the shear crack angle is less distributed in the axial and horizontal directions, mainly concentrated in the vicinity of 40~60° and 140°, which is not different from the actual macroscopic failure angle formed by the final expansion [39]. The distribution law of tensile cracks and shear cracks under cyclic loading is similar to that of conventional triaxial loading. The tensile crack angle is mainly distributed in the axial loading direction (80~120°), the shear crack angle distribution is mainly between 40~60° and 120~140°, and the angle distribution range is expanded. Support structures should be targeted, while areas subjected to cyclic loading may be supported by full-section dynamic support structures.

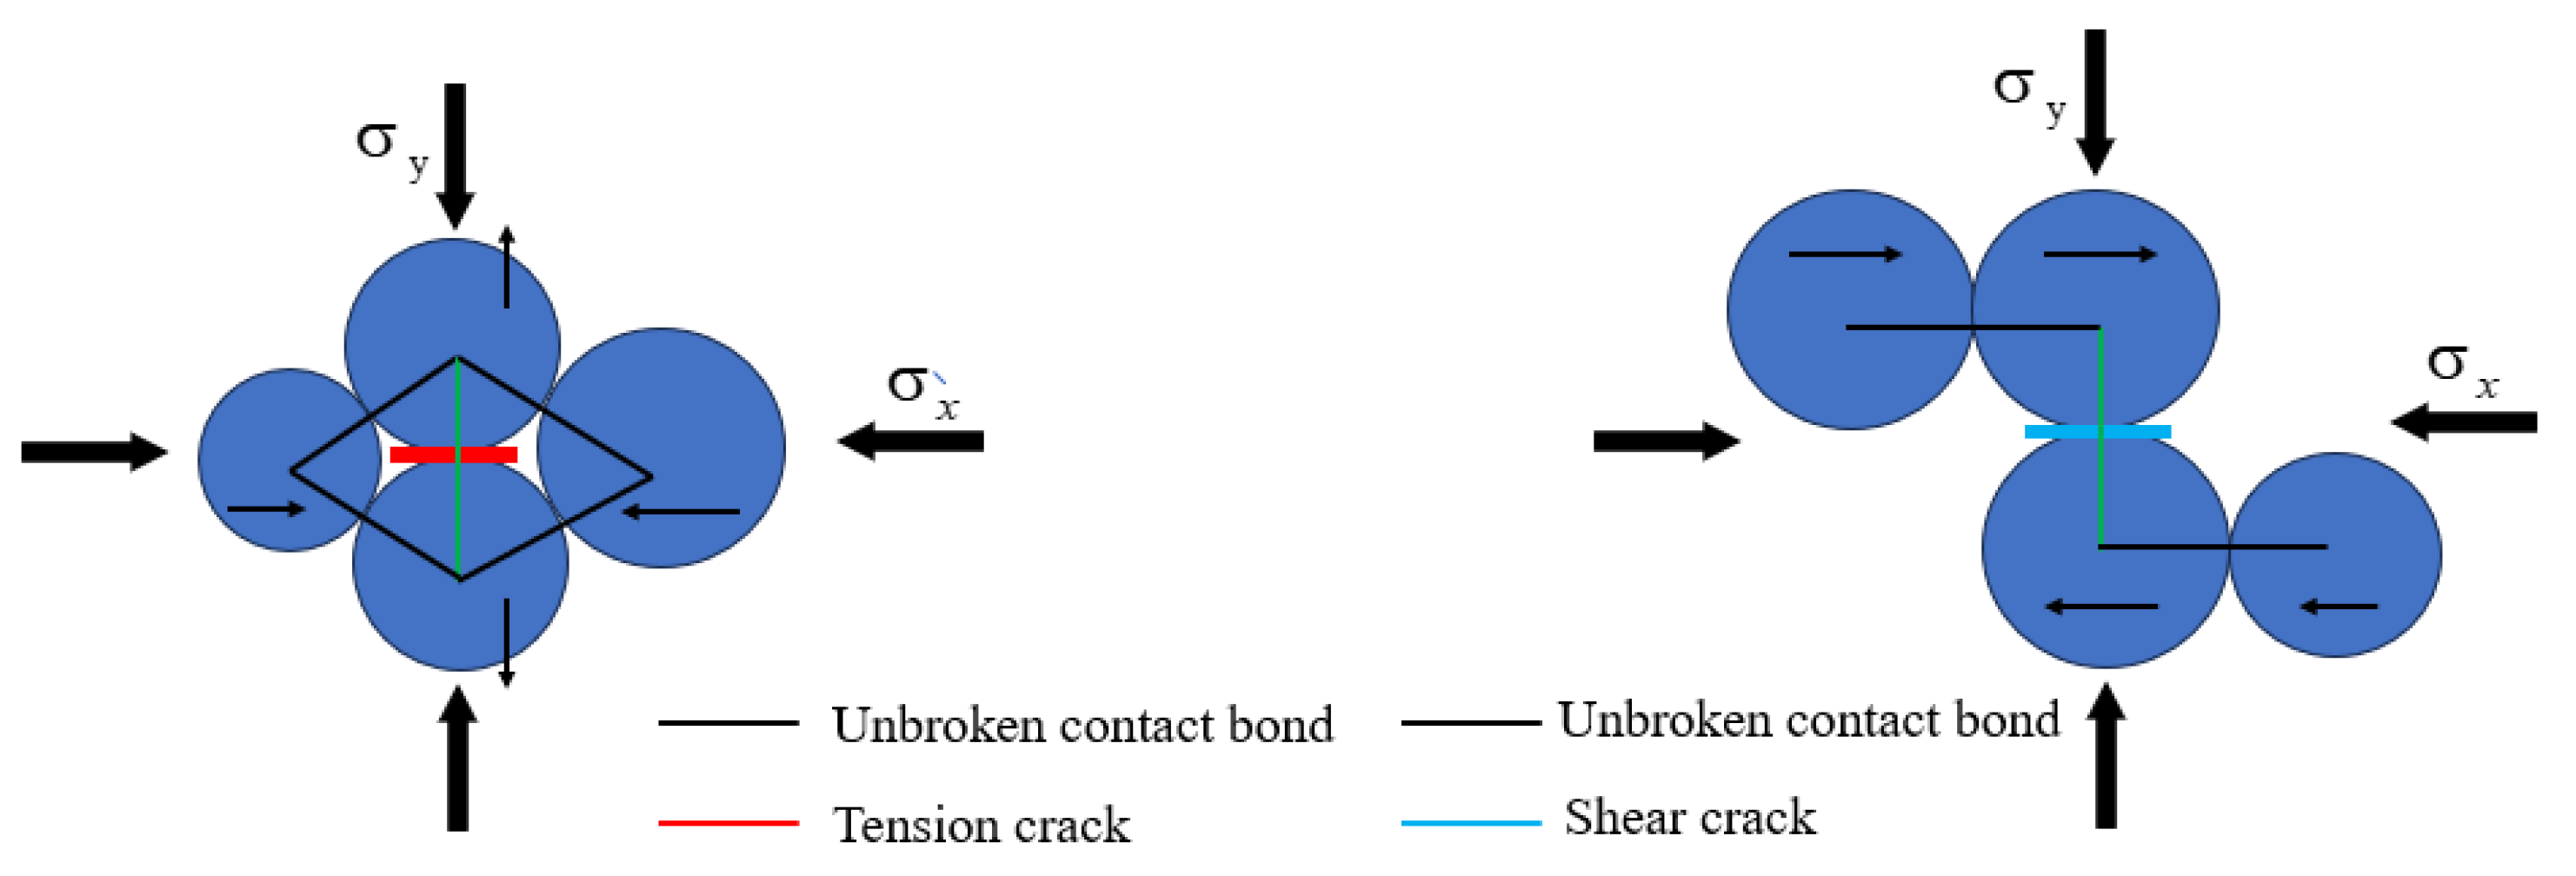
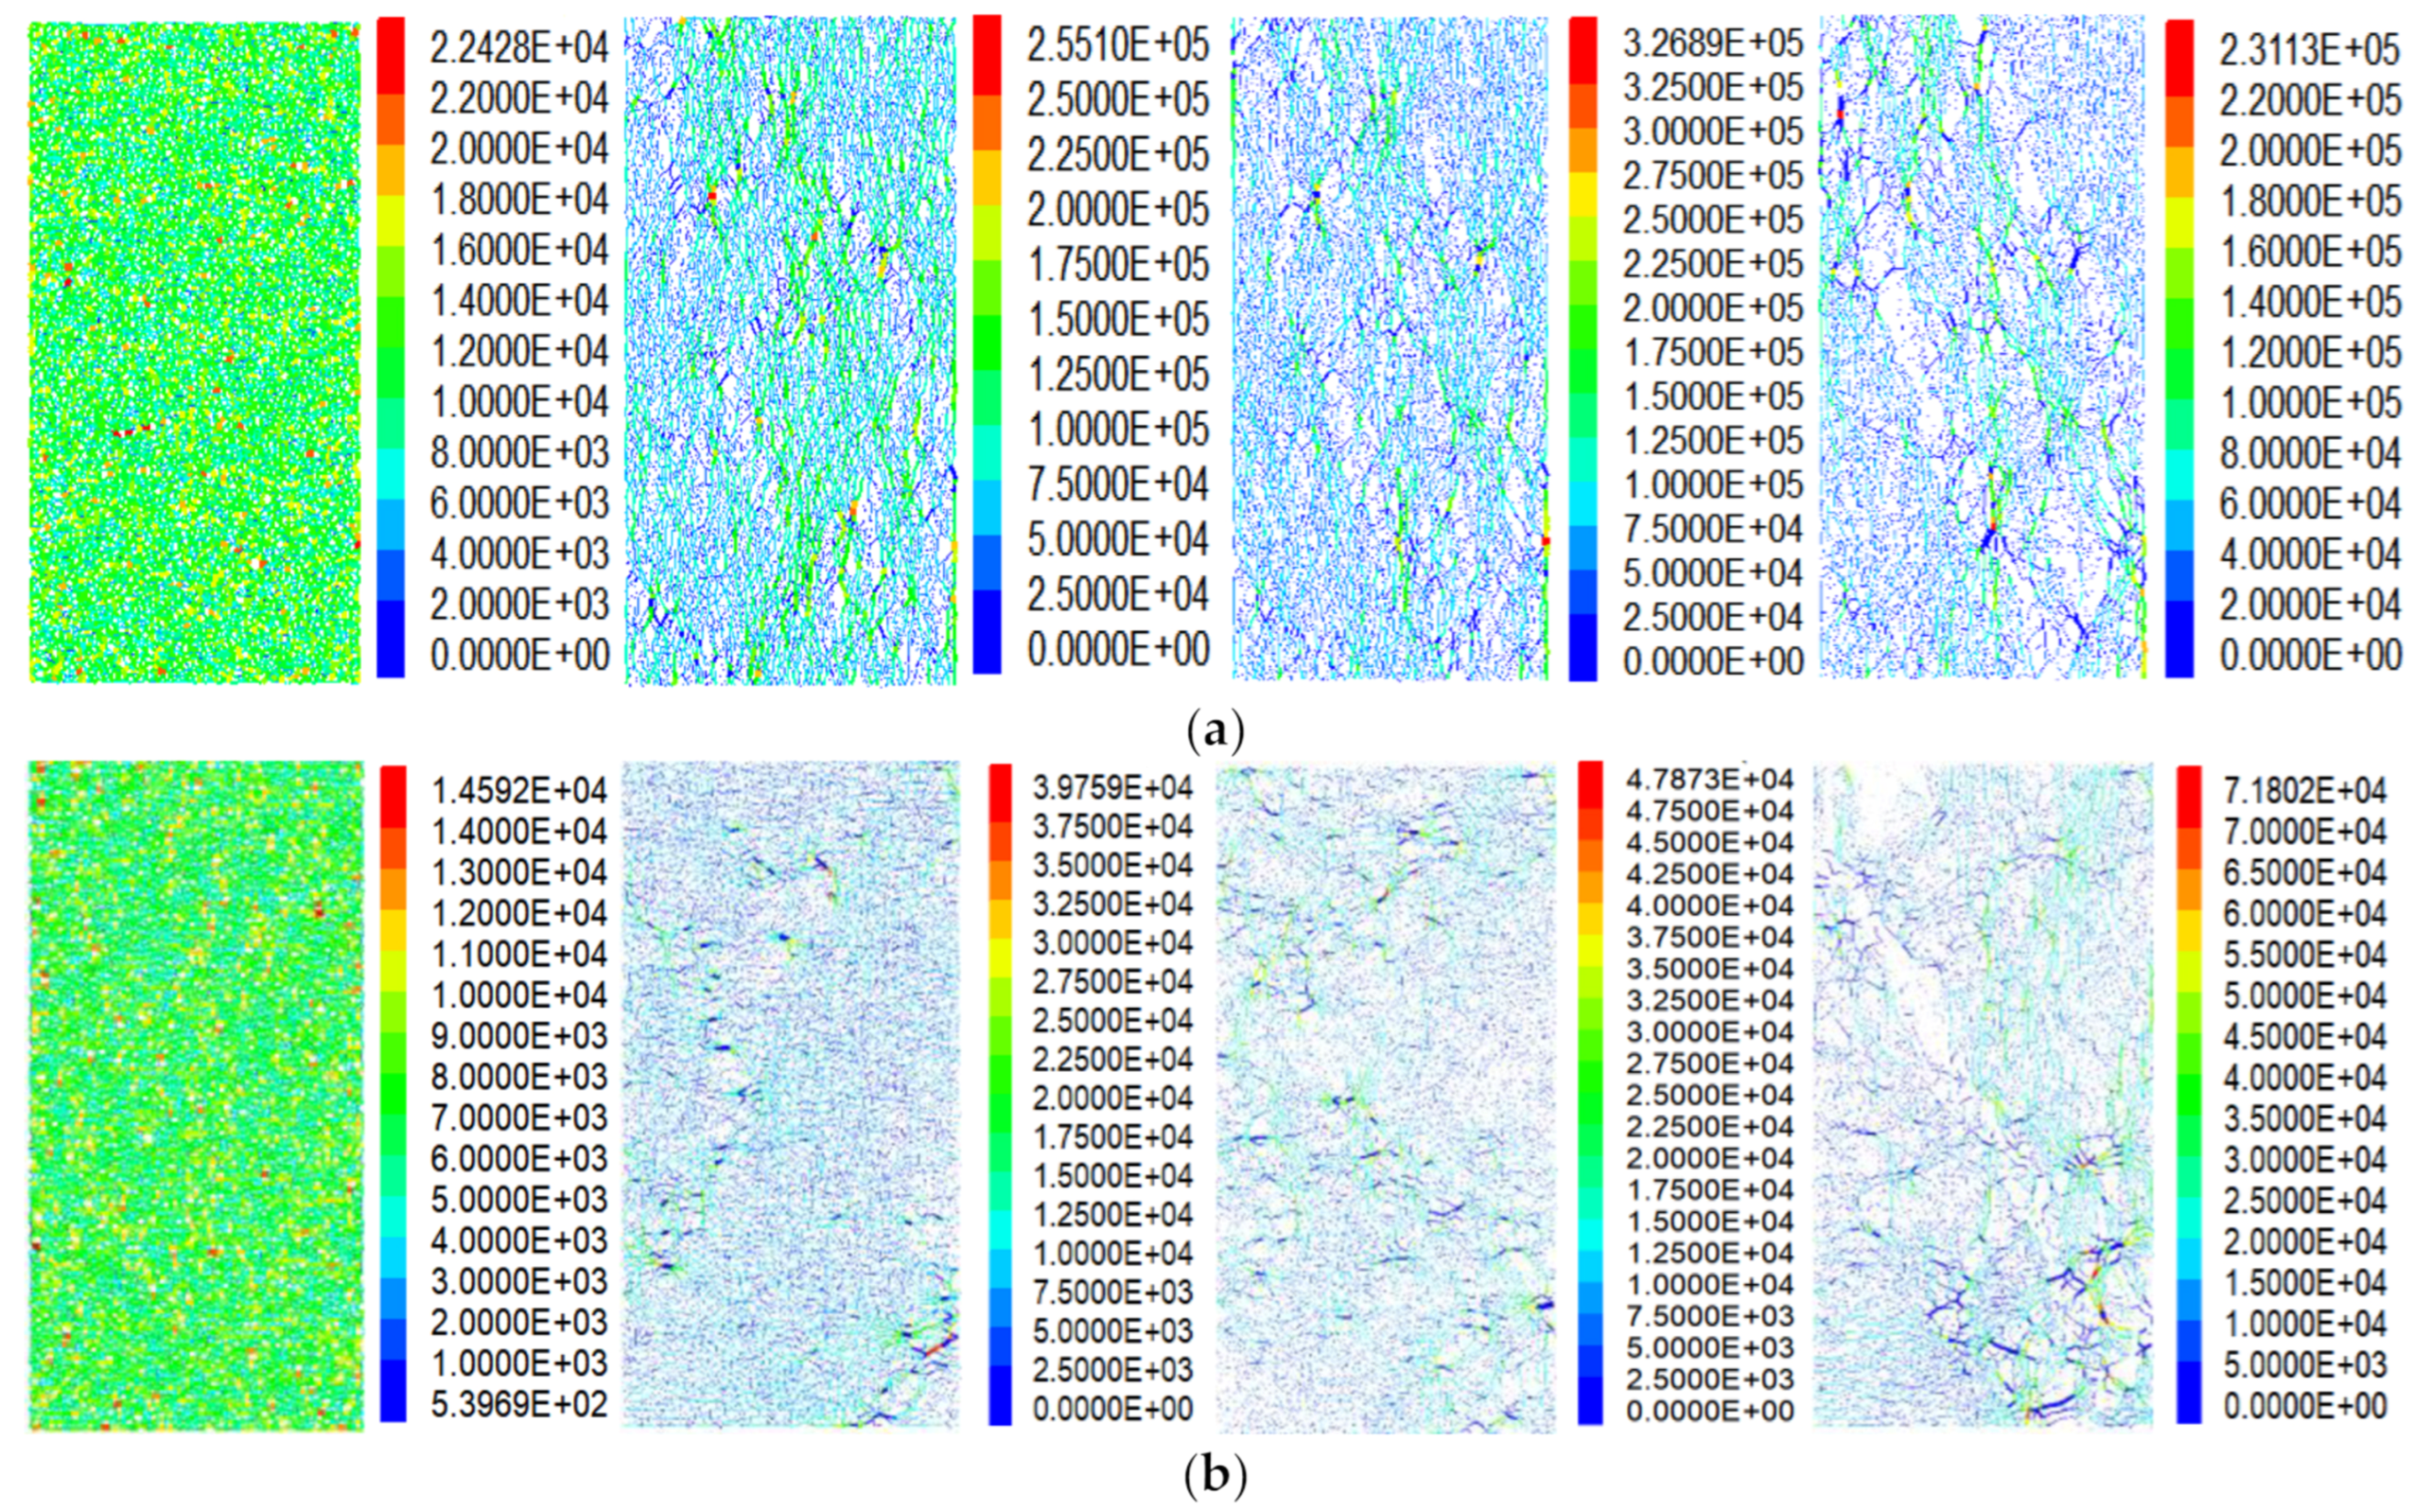
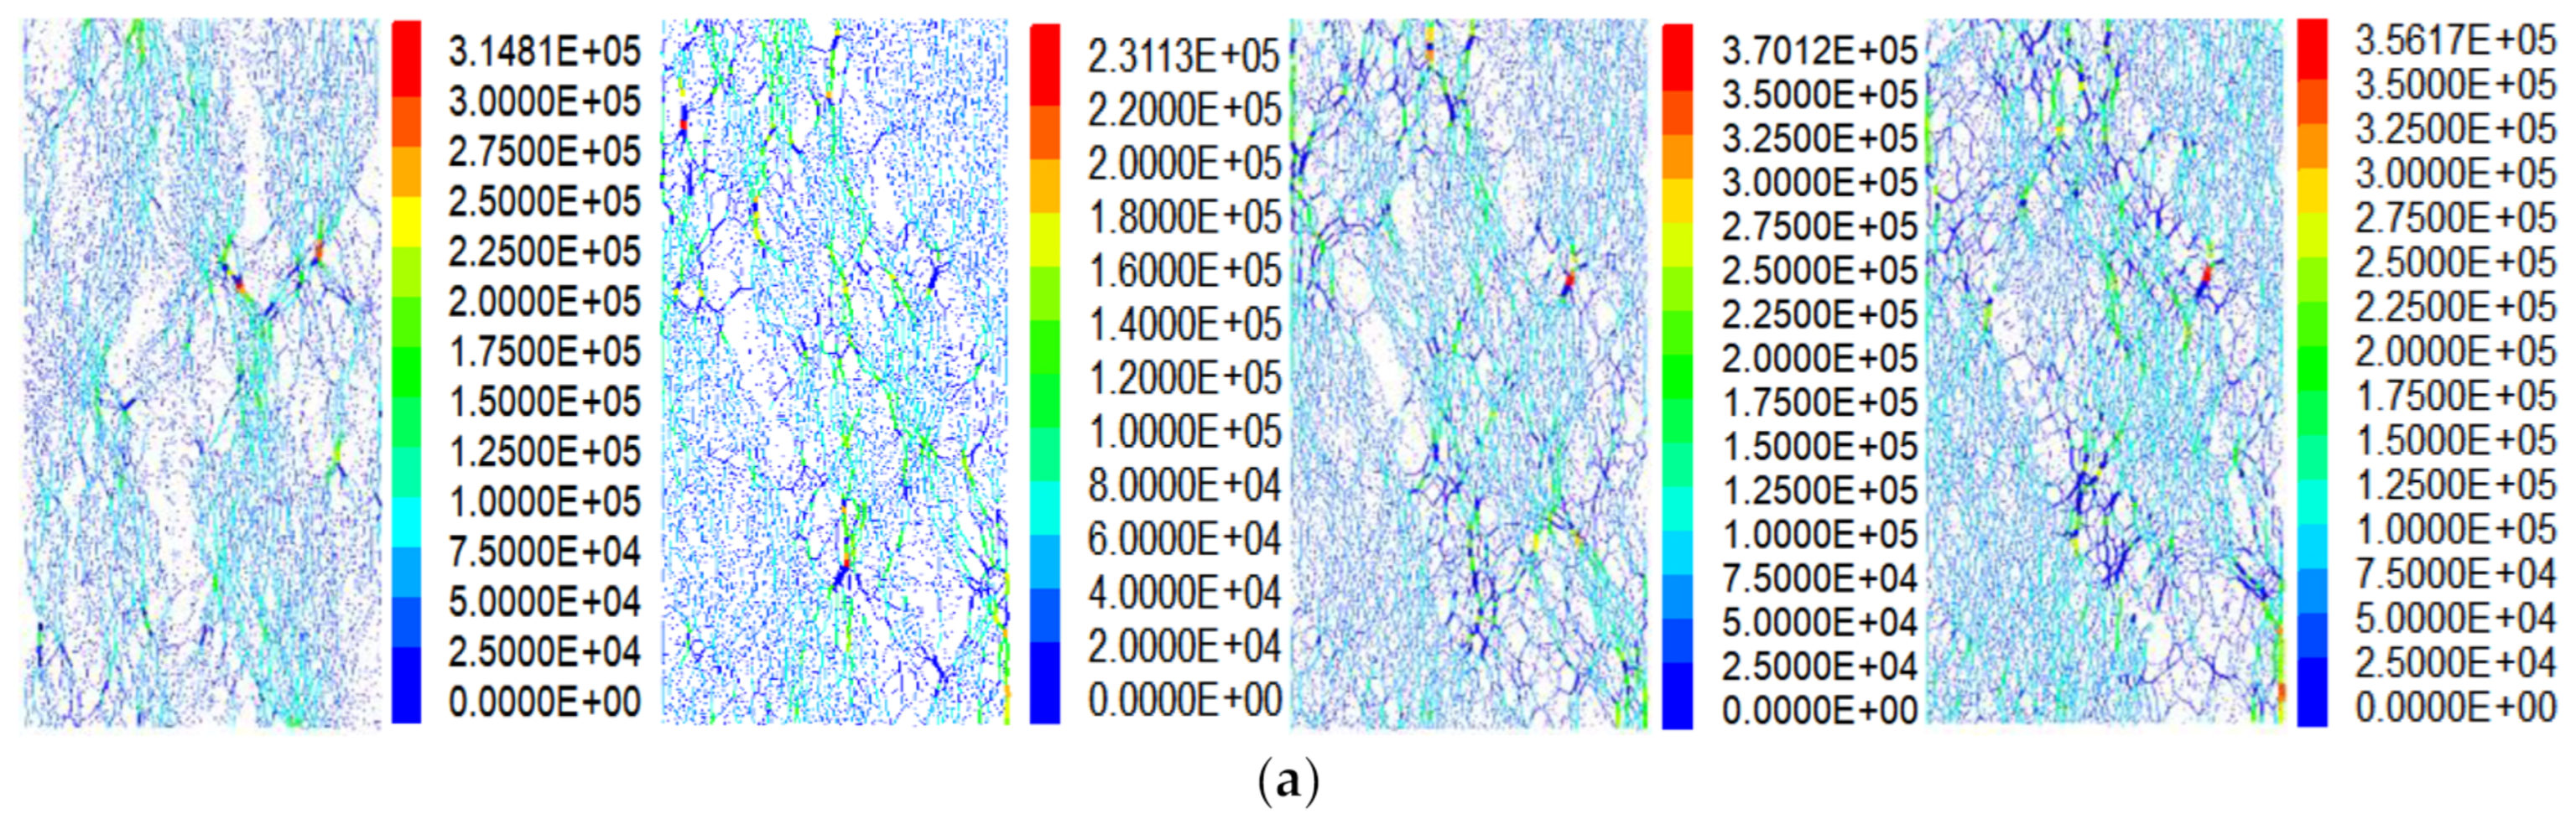
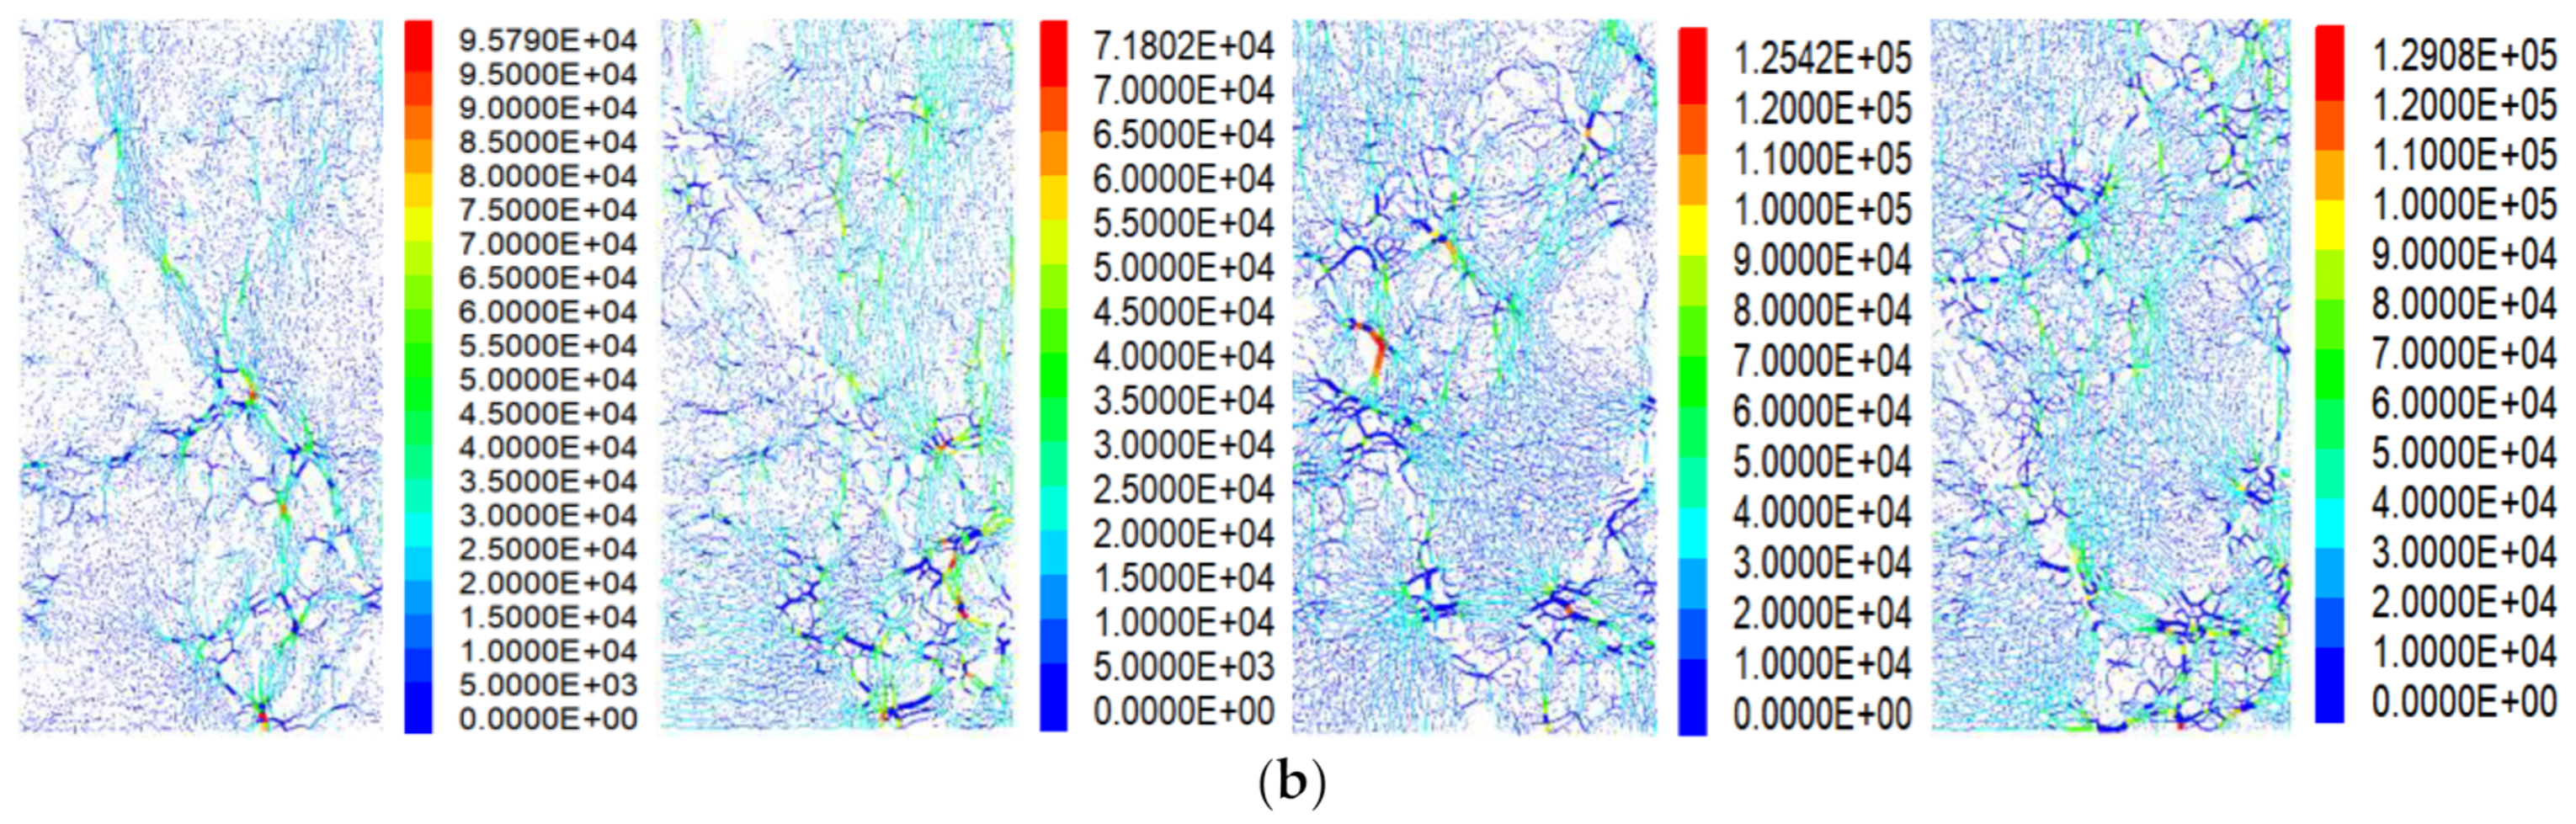
5.3. Microscopic Force Field Analysis

Figure 19 shows the distribution and evolution diagram for the lower force chain of conventional triaxial and cyclic loading. It can be seen that the internal force chain evolution of the rock specimens for the two loading paths has a certain stage. The density of the force chain reflects the size of the force, and the denser the force chain, the greater the ability to withstand pressure. At the beginning of loading, the rock specimen structure is relatively complete, the overall contact force chain distribution is uniform, and the pores of the force chain network are small, forming a “fish-phosphorus”-like force chain structure, indicating that the rock specimen is stressed evenly and the internal damage is small. Before reaching the peak strength, the force chain gradually shows directionality, and the strong chain gathers in the direction of the principal stress, forming a “columnar” force chain. In this stage, local regional stress concentration occurs at the potential point of crack propagation. When the peak strength is near, some of the strong chains buckle and bend in a certain direction, showing an “arch” force chain, indicating that the bearing limit is close to the failure stage, the local damage is intensified, and the internal microcracks increase rapidly. During the post-peak failure stage of the rock specimen, the internal force chain fractures and progressively reconfigures, with the pores in the strong force chain network being filled by weaker force chains. As a result, the overall force chain distribution adopts a dense, “turtle shell” pattern. At this stage, the macro-fracture surface of the rock specimen is formed, where the force chain density at the fracture surface decreases, leading to a sharp reduction in the carrying capacity.
The distribution characteristics of the internal force chains in the rock specimens after failure under varying circumferential pressures are shown in Figure 20. It is evident that the voids within the force chain network are larger under low circumferential pressures compared to high circumferential pressures. As the circumferential pressures increase, the force chains become more densely distributed, enhancing the bearing capacity and leading to a greater number of microcracks during failure. On the whole, compared with conventional triaxial loading and unloading, the distribution of the force chains after rock specimen failure is more uneven, the damage degree is higher, and the internal cracks are more abundant, but the failure states of the two are similar, indicating that cyclic loading will not change the failure form of rock. Therefore, when subjected to cyclic loading for a long period of time, the internal damage of the rock mass is more serious, and it is necessary to consider the fatigue damage and durability, and to increase the anti-fatigue support measures if necessary, as well as adopting processes such as grouting or self-repairing concrete to fill the weak zones where the damage is not homogeneous.

6. Conclusions

(1) For both stress paths, the peak strength, residual strength, and peak axial strain of the rock specimens exhibit a positive linear correlation with the circumferential pressures. However, the peak strength under cyclic loading is slightly lower than that under conventional triaxial conditions.
(2) For both stress paths, the elastic modulus and Poisson’s ratio increase with the rise in the circumferential pressures. During cyclic loading, the increase in the elastic modulus becomes less pronounced as the circumferential pressures increase, while the post-peak decline in the curve slows down. The Poisson’s ratio increases with the number of loading cycles. Notably, the Poisson’s ratio under cyclic loading is higher than that under conventional triaxial conditions, while the elastic modulus is lower in cyclic loading compared to conventional triaxial loading, with both becoming approximately equal at high circumferential pressures. Therefore, the degradation of the rock mass mechanical properties due to partial excavation should be thoroughly considered in the stability analysis of underground structures under deep high-stress conditions, necessitating the selection of appropriate excavation methods.
(3) There is an obvious lag in the destruction of cyclically loaded rock samples under high peripheral pressure, revealing the law that time-lagged rock bursts are more likely to occur in high geopathic stress zones, and predictive measures such as microseismic monitoring are needed. The total number of microcracks under cyclic loading is more than that under conventional triaxial loading and unloading. Under the same circumferential pressures, tensile cracks are dominant in both of them, and more shear cracks occur under cyclic loading. As the circumferential pressure increases from 10 MPa to 40 MPa, the pro-portion of tensile cracks decreases, while the proportion of shear cracks increases. Therefore, in the process of underground cavern construction under high stress, the surrounding rock damage support measures need to be based on the prevention and control of shear damage, especially in the process of partial excavation, which can be used to install additional high-strength anchors, steel arches, and other measures.
(4) In conventional triaxial loading, tensile cracks are predominantly distributed within the 80–100° range, while shear cracks are concentrated in the 40–60° and 140° rang-es. The angular distribution of microcracks under cyclic loading is broader compared to conventional triaxial loading. As the circumferential pressure increases, the force chain network becomes denser after damage for both stress paths. However, under cyclic loading, the force chain distribution is more heterogeneous, and the internal damage is more extensive compared to conventional triaxial conditions. Therefore, in the process of partial excavation, priority should be given to the dynamic support structure of the whole section and to increasing the corresponding anti-fatigue support measures. It can also be used in the way of grouting reinforcement to weaken the internal damage to the surrounding rock.

Author Contributions

Conceptualization, Y.Y. and J.P.; methodology, Z.C. and Z.K.; software, J.P. and Z.K.; validation, Y.Y. and L.Y.; formal analysis, Y.Y. and Z.K.; investigation, Z.C.; resources, Y.Y.; data curation, J.P.; writing—original draft preparation, J.P.; writing—review and editing, Y.Y.; supervision, L.Y. and Z.K.; project administration, Y.Y.; funding acquisition, Y.Y. All authors have read and agreed to the published version of the manuscript.

Funding

This research was funded by the Natural Science Foundation of China (42377172).

Institutional Review Board Statement

Not applicable.

Informed Consent Statement

Not applicable.

Data Availability Statement

The original contributions presented in this study are included in the article. Further inquiries can be directed to the corresponding author.

Acknowledgments

The authors want to thank the editor and anonymous reviewers for their valuable suggestions for improving this paper.

Conflicts of Interest

The authors declare no conflicts of interest.

References

  1. Lou, C.D.; Zhang, Z.P.; Wu, S.Y.; Zhou, J.F.; Peng, Y.; Ai, T.; Liu, Y.; Zhang, R.; Ren, L. Study on mechanical properties and energy evolution of Jinping deep buried marble. Hydro-Sci. Eng. 2022, 87–96. [Google Scholar]
  2. Wang, Q.; Wang, Z.Q.; Cheng, Y.Q.; Li, C.H. Experimental study on deep marble deformation characteristics and energy evolution under high circumferential pressures. Prot. Eng. 2023, 45, 7–15. [Google Scholar]
  3. Jiang, Q.; Fei, X.T.; Li, S.J.; Su, G.S.; Xiao, Y.X. Cracking-restraint design method for large underground caverns with hard rock under high geostress condition and its practical application. Chin. J. Rock Mech. Eng. 2019, 38, 1081–1101. [Google Scholar]
  4. Xie, H.P. Research Framework and Anticipated Results of Deep Rock Mechanics and Mining Theory. Adv. Eng. Sci. 2017, 49, 1–16. [Google Scholar]
  5. Zhu, L.; Pei, X.J.; Cui, S.H.; Liang, Y.F.; Luo, L.G. Experimental study on cycle loading and unloading damage and strength characteristics of rocks with vein defects. Chin. J. Rock Mech. Eng. 2019, 38, 900–911. [Google Scholar]
  6. Li, J.T.; Xiao, F.; Ma, Y.P. Deformation Damage and Energy Evolution of Red Sandstone under Uniaxial Cyclic loading. J. Hunan Univ. (Nat. Sci.) 2020, 47, 139–146. [Google Scholar]
  7. Liu, Z.Y.; Dong, X.; Zhang, X.Y. Experimental study on mechanical properties of bedding coal and rock under graded cyclic loading. Chin. J. Rock Mech. Eng. 2021, 40 (Suppl. S1), 2593–2602. [Google Scholar]
  8. Wang, W.; Wang, T.; Xiong, D.F.; Cheng, L.; Zhang, H.Y.; Zhu, Q.Z. Experiment of Fractal Characteristics of Acoustic Emission of Sandstone Under Triaxial Cyclic loading. Adv. Eng. Sci. 2022, 54, 90–100. [Google Scholar]
  9. Chen, X.; Xiao, Y.; Tang, M.G.; Jiao, T.; Zhang, F. Experimental study on deformation permeability and AE characteristics of sandstone under multi-stage cyclic loading with a constant amplitude. Chin. J. Rock Mech. Eng. 2024, 43, 1923–1935. [Google Scholar]
  10. Meng, Q.B.; Liu, J.F.; Li, R.; Hai, P.; Chen, Y.L. Experimental Study on Rock Strength and Deformation Characteristics Under Triaxial Cyclic loading Conditions. Rock Mech. Rock Eng. 2021, 54, 777–797. [Google Scholar] [CrossRef]
  11. Shirani Faradonbeh, R.; Taheri, A.; Karakus, M. Failure Behavior of a Sandstone Subjected to the Systematic Cyclic Loading: Insights from the Double-Criteria Damage-Controlled Test Method. Rock Mech. Rock Eng. 2021, 54, 5555–5575. [Google Scholar] [CrossRef]
  12. Geranmayeh Vaneghi, R.; Ferdosi, B.; Okoth, A.D.; Kuek, B. Strength degradation of sandstone and granodiorite under uniaxial cyclic loading. J. Rock Mech. Geotech. Eng. 2018, 10, 117–126. [Google Scholar] [CrossRef]
  13. Naderloo, M.; Kumar, K.R.; Hernandez, E.; Hajibeygi, H.; Barnhoorn, A. Experimental and numerical investigation of sandstone deformation under cycling loading relevant for underground energy storage. J. Energy Storage 2023, 64, 107198. [Google Scholar] [CrossRef]
  14. Zhang, Y.; Ding, Z.Q.; Fang, C.; Cong, B.T. Three-dimensional Particle Flow Simulation on Macro-micro Mechanical Properties of Granite under Triaxial Cyclic loading. Min. Res. Dev. 2019, 39, 52–58. [Google Scholar]
  15. Zhou, X.; Li, J.T. Crack propagation law of brittle rock mass under cyclic loading. J. Cent. South Univ. (Sci. Technol.) 2020, 51, 724–731. [Google Scholar]
  16. Zhao, B.; Xu, T.; Yang, S.Q.; Fu, T.F. Experimental and numerical study of fatigue damage of highly stressed rocks under cyclic loading. J. Cent. South Univ. (Sci. Technol.) 2021, 52, 2725–2735. [Google Scholar]
  17. Lee, H.; Jeon, S. An experimental and numerical study of fracture coalescence in pre-cracked specimens under uniaxial compression. J. Solids Struct. 2011, 48, 979–999. [Google Scholar] [CrossRef]
  18. Zhou, Y.Q.; Sheng, Q.; Li, N.N.; Fu, X.D. Numerical investigation of the deformation properties of rock materials subjected to cyclic compression by the finite element method. Soil Dyn. Earthq. Eng. 2019, 126, 105795. [Google Scholar] [CrossRef]
  19. Wang, Z.C.; Li, S.C.; Qiao, L.P.; Zhang, Q.S. Finite element analysis of the hydro-mechanical behavior of an underground crude oil storage facility in granite subject to cyclic loading during operation. Int. J. Rock Mech. Min. Sci. 2015, 73, 70–81. [Google Scholar] [CrossRef]
  20. Cerfontaine, B.; Charlier, R.; Collin, F.; Taiebat, M. Validation of a New Elastoplastic Constitutive Model Dedicated to the Cyclic Behavior of Brittle Rock Materials. Rock Mech. Rock Eng. 2017, 50, 2677–2694. [Google Scholar] [CrossRef]
  21. Zhu, J.B. The ‘Rock Testing Regulations for Water Conservancy and Hydropower Engineering’ (SL/T 264-2020), revised under the auspices of the Yangtze Academy of Sciences, was promulgated and implemented. J. Yangtze River Sci. Res. Inst. 2020, 37, 2. [Google Scholar]
  22. Zhang, K.; Zhou, H.; Feng, X.T.; Shao, J.F.; Yang, Y.S.; Zhang, Y.G. Experimental research on elastoplastic coupling character of marble. Rock Soil Mech. 2010, 8, 2425–2434. [Google Scholar]
  23. Zhang, X.W.; Xu, J.H.; Sui, L.; Zhang, H.W.; Wang, Q. Mechanical properties evolution of thermally damaged limestone under triaxial cyclic loading and unloading. J. Min. Strat. Control Eng. 2022, 4, 87–98. [Google Scholar]
  24. Liu, X.P.; Jiang, Q.; Li, S.J.; Xin, J.; Chen, P.F. Energy characteristics of progressive damage of Jinping marble under cyclic loading and unloading. Rock Soil Mech. 2024, 45, 2373–2386. [Google Scholar]
  25. Zhang, L.; Li, B.; Zhu, B.L.; Luo, B. Loading and Unloading Mechanical Properties and Energy Evolution Mechanism of Red-Bed Mudstone. J. Southwest Jiaotong Univ. 2023, 58, 592–602+612. [Google Scholar]
  26. Tomac, I.; Gutierrez, M. Coupled hydro-thermo-mechanical modeling of hydraulic fracturing in quasi-brittle rocks using BPM-DEM. J. Rock Mech. Geotech. Eng. 2017, 9, 92–104. [Google Scholar]
  27. Wang, H.B.; Ma, Z.; Wu, L.T.Y.; Fan, Z.P.; Wang, C.G. Calibration method of mesoscopic parameters using BP neural network and Burgers model. Trans. Chin. Soc. Agric. Eng. 2024, 38, 152–161. [Google Scholar]
  28. Tian, W.L.; Yang, S.Q.; Fang, G. Particle flow simulation on mechanical behavior of coal specimen under triaxial cyclic loading. J. China Coal Soc. 2016, 41, 603–610. [Google Scholar]
  29. Zhen, Z.G.; Yang, S.Q.; Chen, C.P.; Tian, W.L.; Qian, J.H.; Li, X. Simulation Study on Mechanical Behavior of Bedding Yellow Sandstone Under Triaxial Cycling Loading-unloading. J. Basic Sci. Eng. 2023, 31, 731–740. [Google Scholar]
  30. Cho, N.; Martin, C.D.; Sego, D.C.; Venturi, N. A clumped particle model for rock. Int. J. Rock Mech. Min. Sci. 2007, 44, 997–1010. [Google Scholar] [CrossRef]
  31. Liu, J.; Li, J.T. Analysis on meso-damage characteristics of marble under triaxial cyclic loading based on particle flow simulation. J. Cent. South Univ. (Sci. Technol.) 2018, 49, 2797–2803. [Google Scholar]
  32. Zhen, Z.G.; Sui, B.W.; Chen, C.P.; Yang, S.Q.; Xu, J. Experimental and 3D DEM Simulation on the Triaxial Compression Mechanical Behavior of Limestone. Chin. J. Undergr. Space Eng. 2023, 19 (Suppl. S2), 610–616. [Google Scholar]
  33. Peng, J.; Rong, G.; Cai, M.; Peng, K. Determination of residual strength of rocks by a brittle index. Rock Soil Mech. 2015, 36, 403–408. [Google Scholar]
  34. Zhao, J.; Guo, G.T.; Xu, D.P.; Huang, X.; Hu, S.; Xia, Y.L.; Zhang, D. Experimental study of deformation and failure characteristics of deeply-buried hard rock under triaxial and cyclic loading stress paths. Rock Soil Mech. 2020, 41, 1521–1530. [Google Scholar]
  35. Yang, S.Q.; Ranjith, P.G.; Huang, Y.H.; Yin, P.F.; Jing, H.W.; Gui, Y.L.; Yu, Q.L. Experimental investigation on mechanical damage characteristics of sandstone under triaxial cyclic loading. Geophys. J. Int. 2015, 201, 662–682. [Google Scholar] [CrossRef]
  36. Zhou, Z.L.; Zhao, Y.; Jiang, Y.H.; Zou, Y.; Cai, X.; Li, D.Y. Dynamic behavior of rock during its post failure stage in SHPB tests. Trans. Nonferrous Met. Soc. China 2017, 27, 184–196. [Google Scholar] [CrossRef]
  37. Yang, S.Q.; Dong, J.P.; Yang, J.; Yang, Z.; Huang, Y.H. An experimental investigation of failure mechanical behavior in cylindrical granite specimens containing two non-coplanar open fissures under different confining pressures. J. Cent. South Univ. 2022, 29, 1578–1596. [Google Scholar]
  38. Chen, B.R.; Feng, X.T.; Ming, H.J.; Zhou, H.; Zeng, X.H.; Feng, G.L.; Xiao, Y.X. Laws and Mechanisms of Rockburst Generation in Deeply Buried Tunnels: Time Lag Rockbursts. Chin. J. Rock Mech. Eng. 2012, 31, 561–569. [Google Scholar]
  39. Wang, Y.; Liu, X.H.; Hu, A.K.; Li, H.Y.; Qu, X. Crack Propagation Characteristics of Deep Marble Under Triaxial Compression. Adv. Eng. Sci. 2024, 56, 21–31. [Google Scholar]
Figure 1. Rock specimen and test system: (a) marble standard parts; and (b) rock mechanics multifunctional triaxial experiment system.
Applsci 15 03576 g001
Figure 2. Three-axis cyclic loading path.
Applsci 15 03576 g002
Figure 3. Laboratory test results for triaxial and cyclic loading: (a) conventional triaxial stress–strain curve; and (b) cyclic loading stress–strain curve.
Applsci 15 03576 g003
Figure 4. Comparison of the conventional triaxial stress–strain curves.
Applsci 15 03576 g004
Figure 5. Comparison of the damage patterns: (a) 10 MPa; (b) 30 MPa; and (c) 50 MPa.
Applsci 15 03576 g005
Figure 6. Validation of the cyclic loading test parameters: (a) 10 MPa; (b) 30 MPa; (c) 50 MPa; and (d) comparison of the cyclic loading stress–strain curves (10 MPa).
Applsci 15 03576 g006
Figure 7. Conventional triaxial numerical test stress–strain curves.
Applsci 15 03576 g007
Figure 8. Relation between the mechanical parameters and the circumferential pressures under conventional triaxial conditions: (a) strength parameter; and (b) deformation parameter.
Applsci 15 03576 g008
Figure 9. Stress–strain curve of the cyclic loading numerical test: (a) 10 MPa; (b) 20 MPa; (c) 30 MPa; and (d) 40 MPa.
Applsci 15 03576 g009aApplsci 15 03576 g009b
Figure 10. Relationship between the mechanical parameters and the circumferential pressures under cyclic loading conditions.
Applsci 15 03576 g010
Figure 11. Relationship between the cyclic loading deformation parameters and the cycle times under varying circumferential pressures: (a) loading elastic modulus; (b) unloading elastic modulus; and (c) Poisson’s ratio.
Applsci 15 03576 g011
Figure 12. Variation of the elastic modulus and Poisson’s ratio with the circumferential pressures.
Applsci 15 03576 g012
Figure 13. Comparison of the mechanical parameters for two loading paths: (a) peak strength; (b) Poisson’s ratio; and (c) elastic modulus.
Applsci 15 03576 g013
Figure 14. Schematic representation of microcrack formation.
Applsci 15 03576 g014
Figure 15. Microcrack evolution diagram for two loading paths (20 MPa): (a) conventional triaxial; and (b) cyclic loading.
Applsci 15 03576 g015
Figure 16. Conventional triaxial microcrack development curves: (a) tensile cracks; (b) shear cracks; and (c) total cracks.
Applsci 15 03576 g016
Figure 17. Microcrack development curve for cyclic loading: (a) 10 MPa; (b) 20 MPa; (c) 30 MPa; (d) 40 MPa; and (e) total cracks.
Applsci 15 03576 g017aApplsci 15 03576 g017b
Figure 18. Rose diagram of the microcrack angle after rock specimen failure for two loading paths (20 MPa): (a) conventional triaxial; and (b) cyclic loading.
Applsci 15 03576 g018
Figure 19. Evolution of the force chain morphology for two loading paths (20 MPa): (a) conventional triaxial; and (b) cyclic loading.
Applsci 15 03576 g019
Figure 20. Force chain morphology of the rock specimens after failure for two loading paths: (a) conventional triaxial; and (b) cyclic loading.
Applsci 15 03576 g020aApplsci 15 03576 g020b
Table 1. Numerical simulation microscopic parameters.
ParametersValuesParametersValues
Particle density/(kg·m−3)2700.00Porosity0.36
Particle size ratio1.66Parallel bond radius factor1.00
Minimum particle size/mm0.40Parallel bond modulus/GPa27.40
Particle contact modulus/GPa27.40Parallel bond stiffness ratio3.20
Particle contact stiffness ratio3.20Parallel bond normal strength/MPa78.00
Friction coefficient0.30Parallel bond shear strength/MPa62.00
Table 2. Comparison of the mechanical parameters.
Circumferential Pressures/MPaPeak Strength/MPaPeak Strain/%Elasticity Modulus/GPa
Laboratory TestSimulation TestLaboratory TestSimulation TestLaboratory TestSimulation Test
10163.43166.270.4840.46741.2438.92
30204.25199.410.5310.57444.2340.55
50236.29227.680.6670.72744.4741.12
Table 3. Mechanical parameters in conventional triaxial loading.
Circumferential Pressures/MPaPeak Strength/MPaResidual Strength/MPaPeak Axial Strain/%Elastic Modulus/GPaPoisson’s Ratio
10166.2741.930.46738.920.305
20185.2857.030.54640.420.330
30199.4270.210.57440.550.341
40214.6483.700.62140.900.349
Table 4. Mechanical parameters under cyclic loading conditions.
Circumferential Pressures/MPaPeak Strength/MPaResidual Strength/MPaPeak Axial Strain/%
10161.5730.550.449
20176.3536.250.499
30187.6242.810.545
40201.2646.220.595
Table 5. Number and percentage of tension and shear cracks under conventional triaxial loading.
Circumferential Pressures/MPaTotal Number of Cracks/PiecesNumber of Tension Cracks/PiecesProportions/%Number of Shear Cracks/PiecesProportions/%
1082453965.4128534.59
20141289563.3951736.61
301819114262.7867737.22
402017119659.3082140.70
Table 6. Number and percentage of tensile and shear cracks under cyclic loading.
Circumferential Pressures/MPaTotal Number of Cracks/PiecesNumber of Tension Cracks/PiecesProportions/%Number of Shear Cracks/PiecesProportions/%
10142189663.0552536.95
202232139962.6783337.32
302386147161.6591538.34
402702159559.03110740.97
Disclaimer/Publisher’s Note: The statements, opinions and data contained in all publications are solely those of the individual author(s) and contributor(s) and not of MDPI and/or the editor(s). MDPI and/or the editor(s) disclaim responsibility for any injury to people or property resulting from any ideas, methods, instructions or products referred to in the content.

