
Prediction of Student Academic Performance Utilizing a Multi-Model Fusion Approach in the Realm of Machine Learning


Abstract
1. Introduction
- (1)
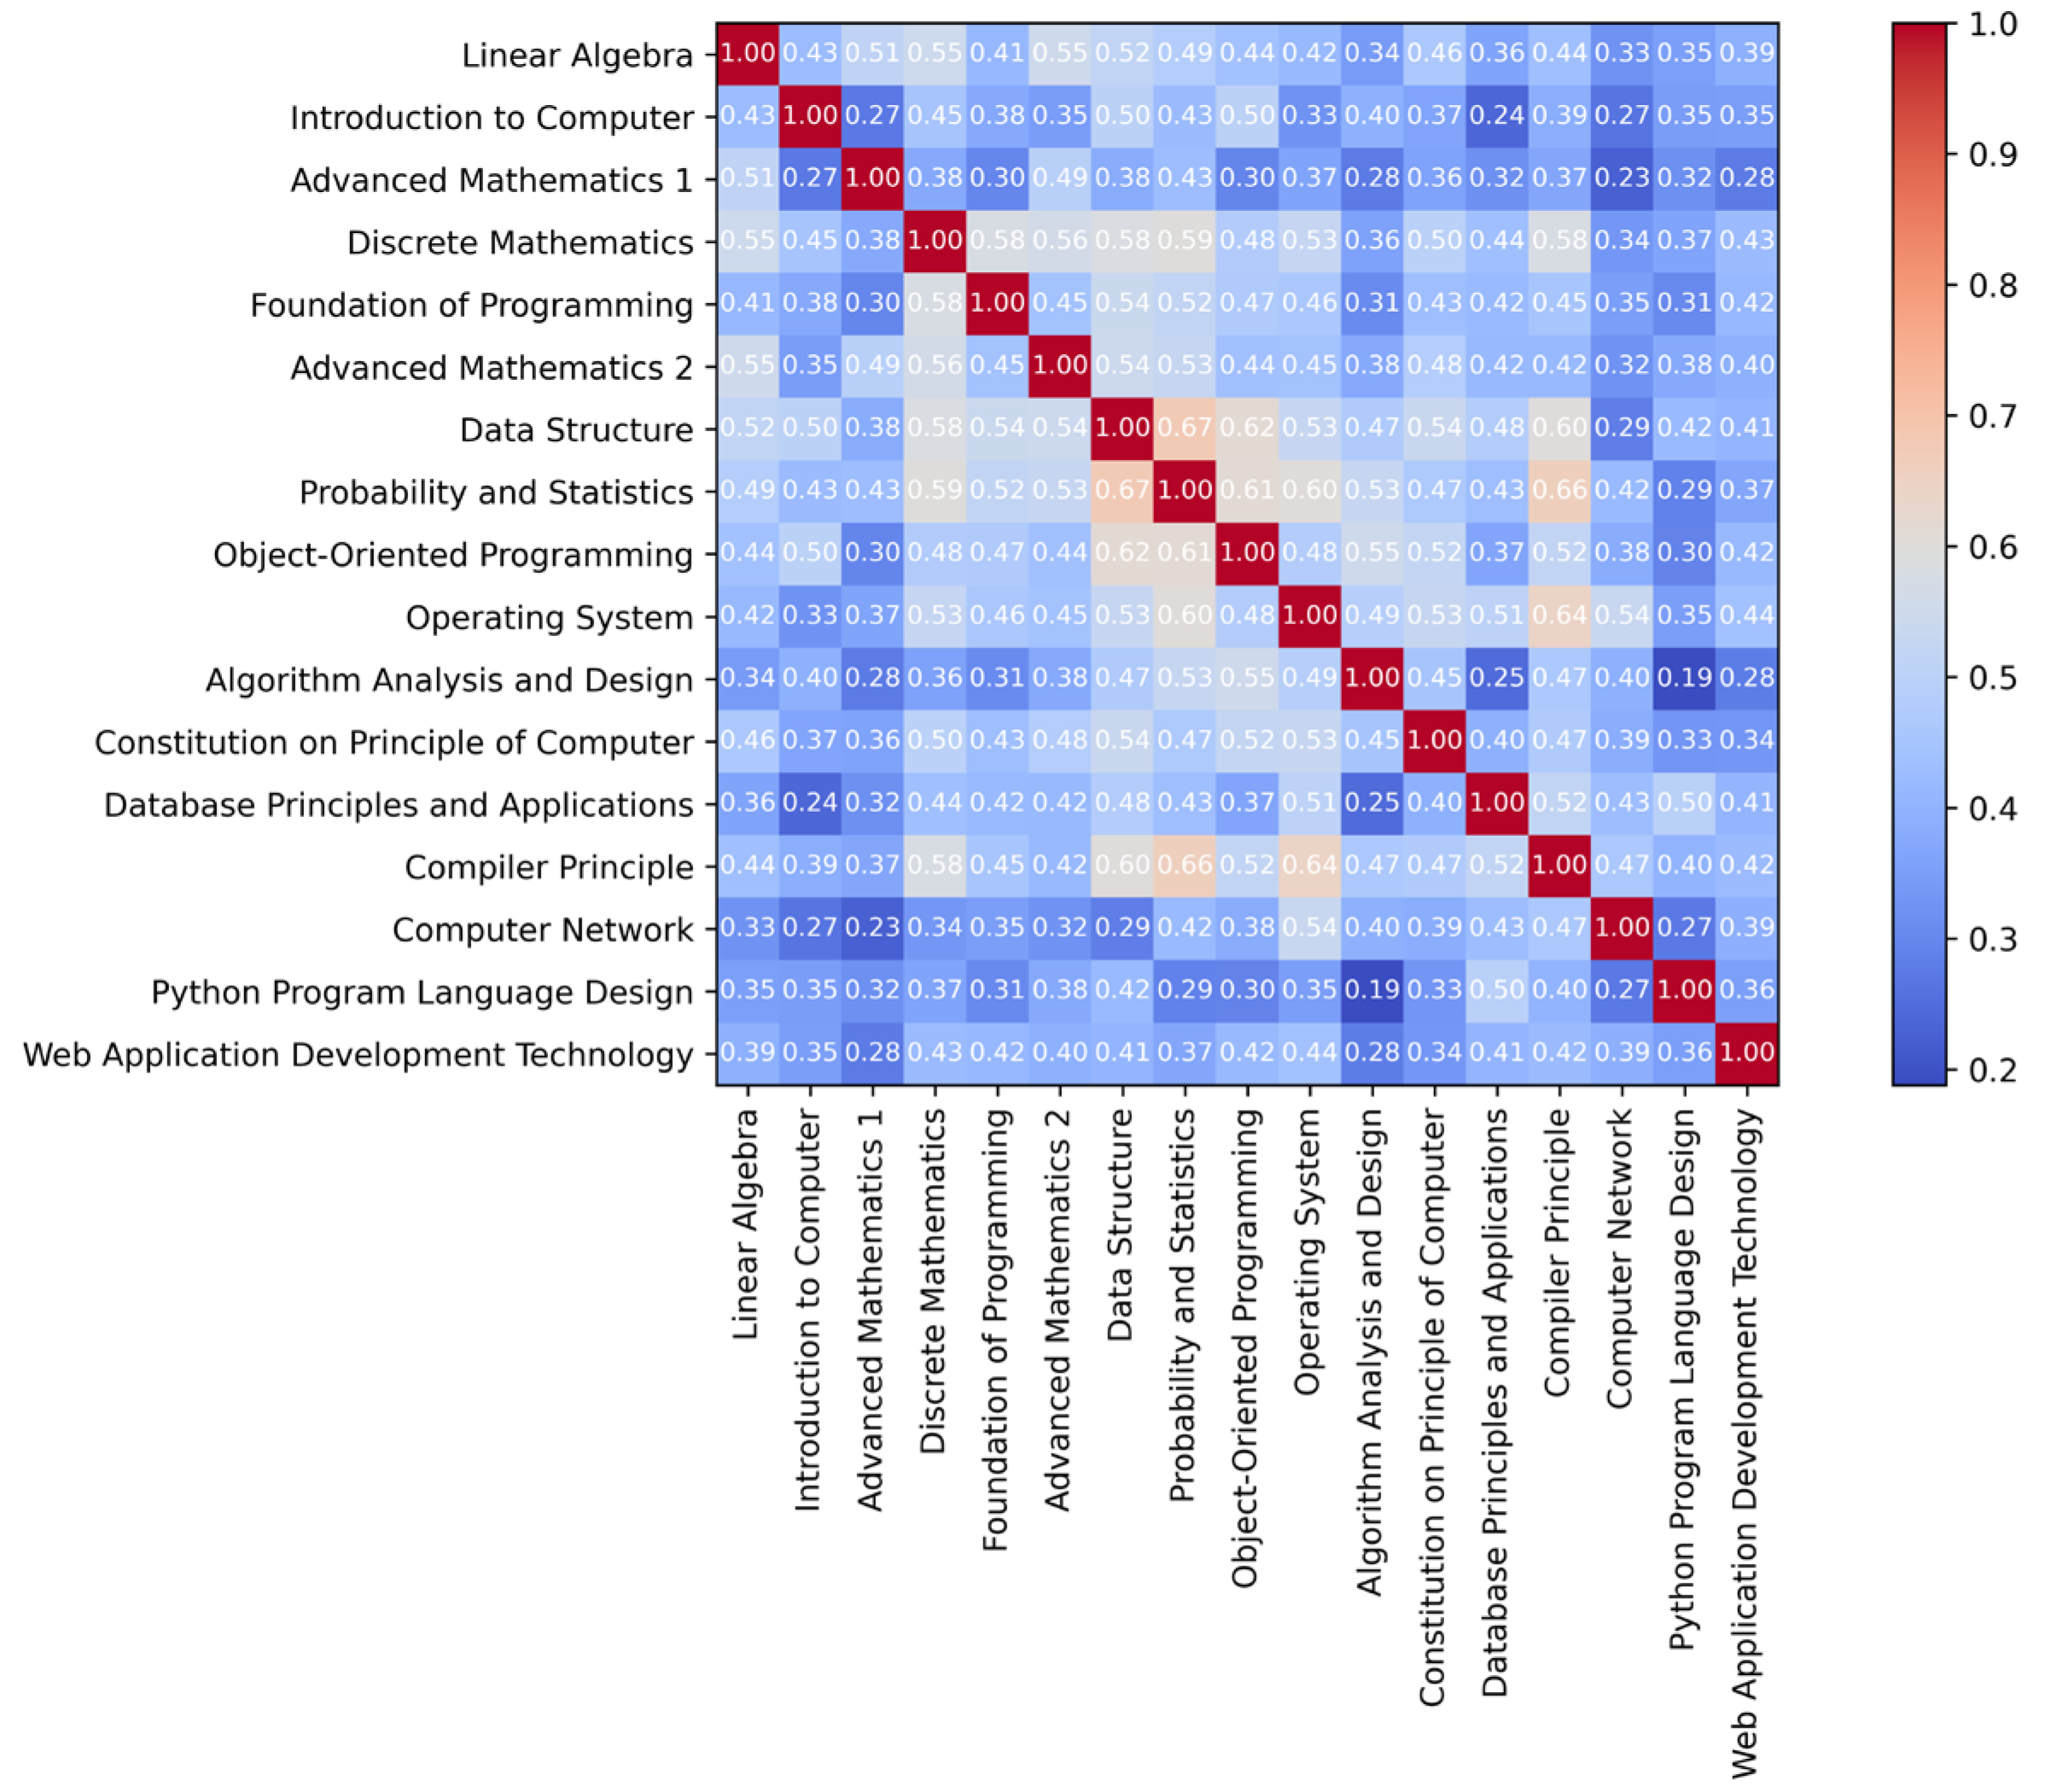
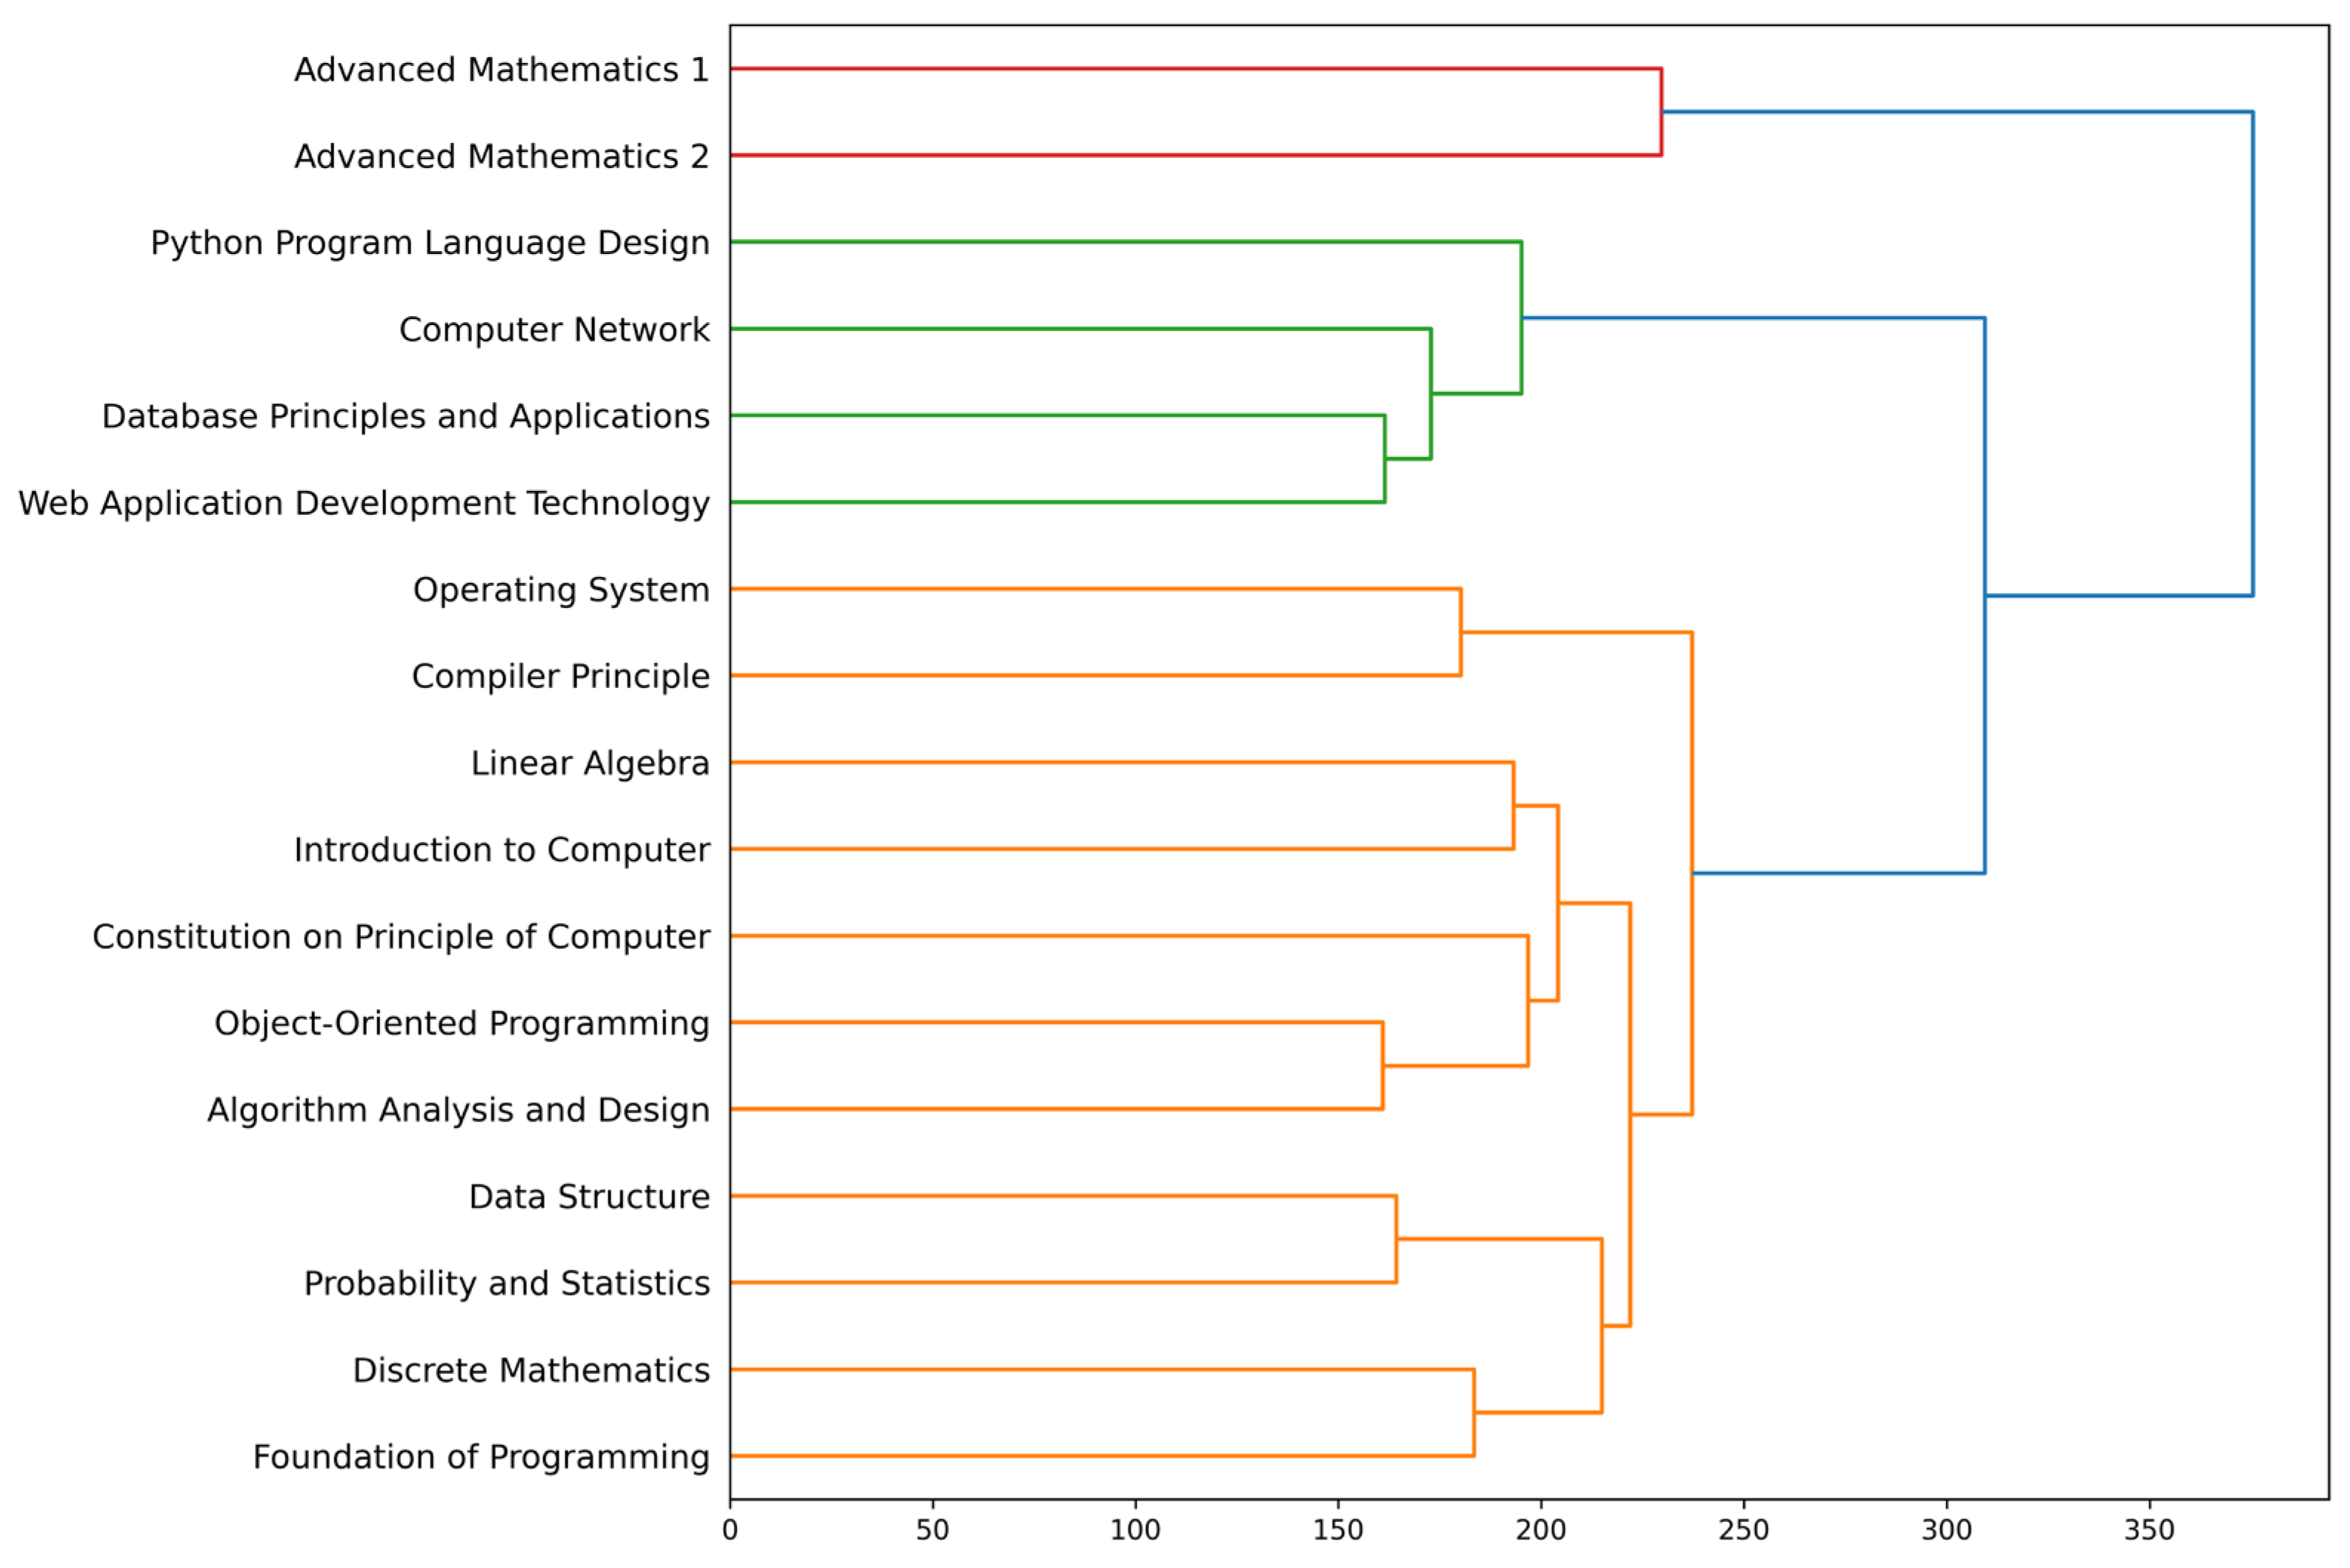
- Course Correlation Analysis: The study conducts correlation and cluster analyses on 17 specialized courses in the computer major training program. The identification of four sets of highly related courses provides valuable insights for optimizing the teaching arrangement of computer curriculum systems in universities.
- (2)
- Evaluation of Multiple Machine Learning Algorithms: Through numerous experiments, the study validates the performance of various machine learning algorithms in predicting student performance under different tasks and datasets. The findings highlight the inconsistency in the performance of different models and emphasize the limitations of relying on a single machine learning method for accurate predictions in real-world teaching scenarios.
- (3)
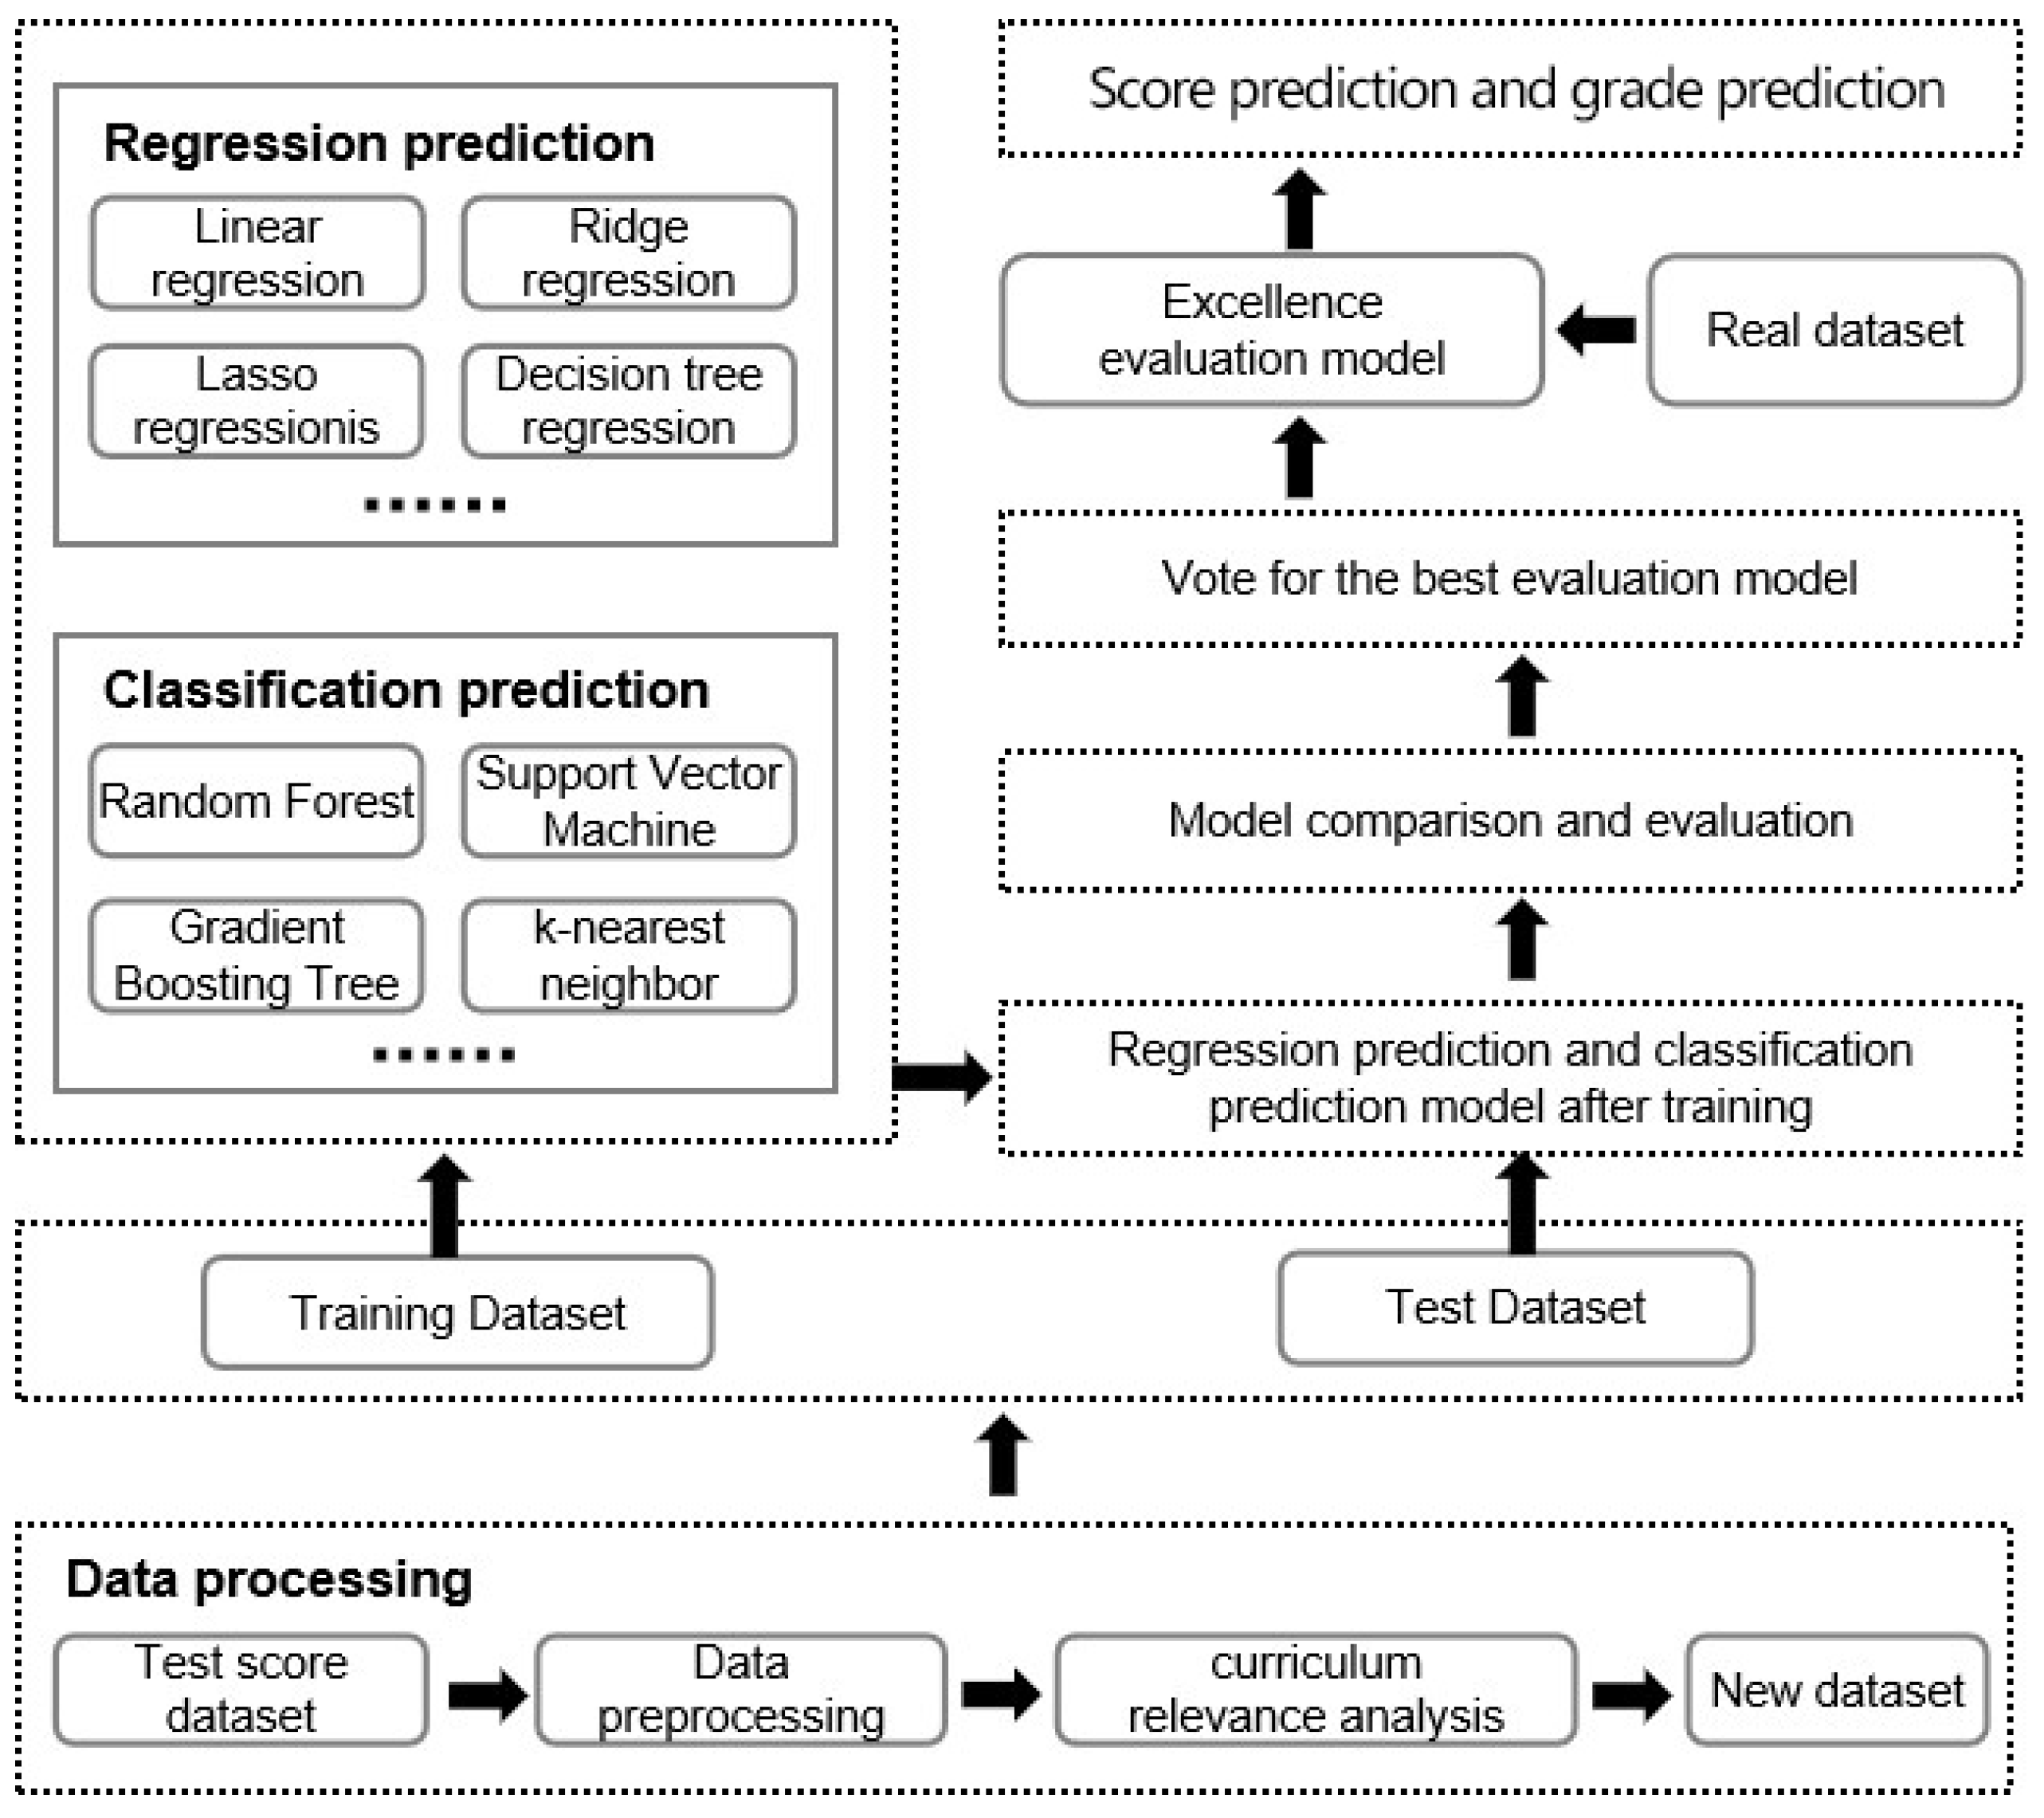
- Multi-Model Fusion Framework: To address the limitations of a single machine learning model, this study proposes a multi-model fusion framework based on machine learning. The framework utilizes accuracy voting to select the optimal model for each dataset or task, resulting in a more reliable and comprehensive student performance prediction system. This framework offers valuable insights and guidance for university administrators in conducting academic prediction and early warning.
2. Materials and Methods
2.1. Determination of Analysis Objects and Data Preprocessing
2.2. Analytical Method and Process
- (1)
- Correlation Between Courses: By analyzing correlations, we can identify connections and intersections between different courses. This information helps students understand how various subjects are related and how they can build on each other. Students can leverage this knowledge to see the broader picture and make connections across different courses, enhancing their learning experience.
- (2)
- Continuity of Courses: Cluster analysis helps identify the continuity of courses within a semester. By organizing related courses together, students can better understand the progression of knowledge and skills. This arrangement allows for a smooth transition between topics, enabling students to build a strong foundation and delve deeper into complex concepts.
- (3)
- Prerequisites for Courses: Correlation analysis helps identify prerequisites for courses. By understanding the correlations between different courses, educators can establish an appropriate sequence for the curriculum. This ensures that students have the necessary pre-knowledge to understand and succeed in subsequent courses, fostering a comprehensive understanding of the subject matter.
3. Model Selection
3.1. Methodology Selection and Rationale
3.2. Regression Prediction
3.3. Classification Prediction
4. Experiments and Analysis
4.1. Regression Prediction Experiments
4.2. Classification Prediction Experiments
4.3. Multi-Model Fusion Learning Performance Analysis
5. Discussion
5.1. Comparison of Research Results
5.2. Research Limitations and Future Prospects
5.3. Practical Application Value of the Research
5.4. Generalizability of the Research
5.5. Research Thinking
6. Conclusions
Author Contributions
Funding
Institutional Review Board Statement
Informed Consent Statement
Data Availability Statement
Acknowledgments
Conflicts of Interest
References
- Khan, A.; Ghosh, S.K. Student performance analysis and prediction in classroom learning: A review of educational data mining studies. Educ. Inf. Technol. 2021, 26, 205–240. [Google Scholar] [CrossRef]
- Wang, Y.; OuYang, Y.; Levkiv, M. Academic performance prediction model based on educational similarity. In Proceedings of the 2023 17th International Conference on the Experience of Designing and Application of CAD Systems (CADSM), Jaroslaw, Poland, 22–25 February 2023; Volume 1, pp. 1–4. [Google Scholar]
- Amjad, S.; Younas, M.; Anwar, M.; Shaheen, Q.; Shiraz, M.; Gani, A. Data mining techniques to analyze the impact of social media on academic performance of high school students. Wirel. Commun. Mob. Comput. 2022, 2022, 9299115. [Google Scholar] [CrossRef]
- Gao, X. Characteristics of Study Motivation of Contemporary College Students and Its Impact on Academic Achievement. High. Educ. Explor. 2020, 43–47. (In Chinese) [Google Scholar] [CrossRef]
- Sun, R.J.; Shen, R.M.; Guan, L.S. Study on the influencing factors of college students’ learning effectiveness. J. Nat. Acad. Educ. Adm. 2012, 9, 65–71. [Google Scholar]
- Marbouti, F.; Diefes-Dux, H.A.; Madhavan, K.J.C. Models for early prediction of at-risk students in a course using standards-based grading. Comput. Educ. 2016, 103, 1–15. [Google Scholar] [CrossRef]
- Conard, M.A. Aptitude is not enough: How personality and behavior predict academic performance. J. Res. Personal. 2006, 40, 339–346. [Google Scholar] [CrossRef]
- Wheaton, A.G.; Chapman, D.P.; Croft, J.B. School start times, sleep, behavioral, health, and academic outcomes: A review of the literature. J. Sch. Health 2016, 86, 363–381. [Google Scholar] [CrossRef]
- Xu, X.; Wang, J.; Peng, H.; Wu, R. Prediction of academic performance associated with internet usage behaviors using machine learning algorithms. Comput. Hum. Behav. 2019, 98, 166–173. [Google Scholar] [CrossRef]
- Philipp, J.G. End of Course Grades and End of Course Tests in the Virtual Environment: A Study of Correlation; Liberty University: Lynchburg, VA, USA, 2014. [Google Scholar]
- Sticca, F.; Goetz, T.; Nett, U.E.; Hubbard, K.; Haag, L. Examining the Accuracy of Students’ Self-Reported Academic Grades from a Correlational and a Discrepancy Perspective: Evidence from a Longitudinal Study. PLoS ONE 2017, 12, e0187367. [Google Scholar] [CrossRef]
- Caponera, E.; Sestito, P.; Russo, P.M. The Influence of Reading Literacy on Mathematics and Science Achievement. J. Educ. Res. 2016, 109, 197–204. [Google Scholar] [CrossRef]
- Nie, X.; Ma, Y.; Qiao, H.; Guo, J.; Cui, C.; Yu, Z.; Liu, X.; Yin, Y. Survey on student academic performance prediction from the perspective of task granularity. J. Shandong Univ. (Eng. Sci.) 2022, 52, 1–14. [Google Scholar]
- Nabil, A.; Seyam, M.; Abou-Elfetouh, A. Prediction of students’ academic performance based on courses’ grades using deep neural networks. IEEE Access 2021, 9, 140731–140746. [Google Scholar] [CrossRef]
- Bujang, S.D.A.; Selamat, A.; Ibrahim, R.; Krejcar, O.; Herrera-Viedma, E.; Fujita, H.; Ghani, N.A.M. Multiclass prediction model for student grade prediction using machine learning. IEEE Access 2021, 9, 95608–95621. [Google Scholar] [CrossRef]
- Feng, G.; Fan, M.; Chen, Y. Analysis and prediction of students’ academic performance based on educational data mining. IEEE Access 2022, 10, 19558–19571. [Google Scholar] [CrossRef]
- Zeineddine, H.; Braendle, U.; Farah, A. Enhancing prediction of student success: Automated machine learning approach. Comput. Electr. Eng. 2021, 89, 106903. [Google Scholar] [CrossRef]
- Brahim, G.B. Predicting student performance from online engagement activities using novel statistical features. Arab. J. Sci. Eng. 2022, 47, 10225–10243. [Google Scholar] [CrossRef]
- Qiu, F.; Zhang, G.; Sheng, X.; Jiang, L.; Zhu, L.; Xiang, Q.; Jiang, B.; Chen, P.-K. Predicting students’ performance in e-learning using learning process and behaviour data. Sci. Rep. 2022, 12, 453. [Google Scholar] [CrossRef]
- Mingyu, Z.; Sutong, W.; Yanzhang, W.; Dujuan, W.J.C. An interpretable prediction method for university student academic crisis warning. Complex Intell. Syst. 2022, 8, 323–336. [Google Scholar] [CrossRef]
- Gareth, J.; Witten, D.; Hastie, T.; Tibshirani, R.; Taylor, J. An Introduction to Statistical Learning: With Applications in Python; Springer International Publishing: Cham, Switzerland, 2023. [Google Scholar]
- Wang, X.; Wang, X.; Ma, B.; Li, Q.; Wang, C.; Shi, Y. High-performance reversible data hiding based on ridge regression prediction algorithm. Signal Process. 2023, 204, 108818. [Google Scholar] [CrossRef]
- Mei, Z.; Shi, Z. On LASSO for high dimensional predictive regression. J. Econom. 2024, 242, 105809. [Google Scholar] [CrossRef]
- Costa, V.G.; Pedreira, C.E. Recent advances in decision trees: An updated survey. Artif. Intell. Rev. 2023, 56, 4765–4800. [Google Scholar] [CrossRef]
- He, S.; Wu, J.; Wang, D.; He, X. Predictive modeling of groundwater nitrate pollution and evaluating its main impact factors using random forest. Chemosphere 2022, 290, 133388. [Google Scholar] [CrossRef] [PubMed]
- Chen, Y.; Mao, Q.; Wang, B.; Duan, P.; Zhang, B.; Hong, Z. Privacy-preserving multi-class support vector machine model on medical diagnosis. IEEE J. Biomed. Health Inform. 2022, 26, 3342–3353. [Google Scholar] [CrossRef] [PubMed]
- Mohd Talib, N.I.; Abd Majid, N.A.; Sahran, S.J.A.S. Identification of student behavioral patterns in higher education using K-means clustering and support vector machine. Appl. Sci. 2023, 13, 3267. [Google Scholar] [CrossRef]
- Dombry, C.; Duchamps, J.-J. Infinitesimal gradient boosting. Stoch. Process. Their Appl. 2024, 170, 104310. [Google Scholar] [CrossRef]
- Uddin, S.; Haque, I.; Lu, H.; Moni, M.A.; Gide, E.J.S.R. Comparative performance analysis of K-nearest neighbour (KNN) algorithm and its different variants for disease prediction. Sci. Rep. 2022, 12, 6256. [Google Scholar] [CrossRef]
- Rincon-Flores, E.G.; Lopez-Camacho, E.; Mena, J.; Olmos, O. Teaching through learning analytics: Predicting student learning profiles in a physics course at a higher education institution. Int. J. Interact. Multimedia Artif. Intell. 2022, 7, 82–89. [Google Scholar] [CrossRef]
- Wu, Z.; Jing, L.; Wu, B.; Jin, L. A PCA-AdaBoost model for E-commerce customer churn prediction. Ann. Oper. Res. 2022, 208, 1–18. [Google Scholar] [CrossRef]
- Sevinç, E.J.C. An empowered AdaBoost algorithm implementation: A COVID-19 dataset study. Comput. Ind. Eng. 2022, 165, 107912. [Google Scholar] [CrossRef]


| Course Name | Introduction to Computers (1st Semester) | Linear Algebra (1st Semester) | Foundations of Programming (2nd Semester) | Discrete Mathematics (2nd Semester) |
|---|---|---|---|---|
| Data Structures (3rd semester) | 0.50 | 0.52 | 0.54 | 0.58 |
| Course Name | Introduction to Computers (1st Semester) | Linear Algebra (1st Semester) | Discrete Mathematics (2nd Semester) | Object-Oriented Programming (3rd Semester) | Probability and Statistics (3rd Semester) | Data Structures (3rd Semester) |
|---|---|---|---|---|---|---|
| Algorithm Analysis and Design (4th semester) | 0.40 | 0.34 | 0.36 | 0.55 | 0.53 | 0.47 |
| Course Name | Linear Algebra (1st Semester) | Discrete Mathematics (2nd Semester) | Foundations of Programming (2nd Semester) | Object-Oriented Programming (3rd Semester) | Probability and Statistics (3rd Semester) | Data Structures (3rd Semester) |
|---|---|---|---|---|---|---|
| Operating Systems (4th semester) | 0.42 | 0.53 | 0.46 | 0.48 | 0.60 | 0.53 |
| Course Name | Discrete Mathematics (2nd Semester) | Object-Oriented Programming (3rd Semester) | Probability and Statistics (3rd Semester) | Data Structures (3rd Semester) | Algorithm Analysis and Design (4th Semester) | Operating Systems (4th Semester) |
|---|---|---|---|---|---|---|
| Compiler Principles (5th semester) | 0.58 | 0.52 | 0.66 | 0.54 | 0.47 | 0.65 |
| Algorithm | Course Name | Intercept | MSE | RMSE | RE |
|---|---|---|---|---|---|
| Linear Regression | Compiler Principles | −0.34 | 72.32 | 8.50 | 9.27% |
| Operating Systems | 11.43 | 84.27 | 9.18 | 9.28% | |
| Data Structures | 9.21 | 74.85 | 8.65 | 9.77% | |
| Algorithm Analysis and Design | 31.38 | 53.60 | 7.32 | 7.3% | |
| Ridge Regression | Compiler Principles | −0.33 | 72.32 | 8.50 | 9.27% |
| Operating Systems | 11.43 | 84.27 | 9.18 | 9.28% | |
| Data Structures | 9.21 | 74.85 | 8.65 | 9.77% | |
| Algorithm Analysis and Design | 31.38 | 53.60 | 7.32 | 7.3% | |
| Lasso Regression | Compiler Principles | 1.00 | 71.05 | 8.43 | 9.19% |
| Operating Systems | 12.34 | 84.34 | 9.18 | 9.29% | |
| Data Structures | 10.37 | 75.35 | 8.68 | 9.82% | |
| Algorithm Analysis and Design | 32.08 | 52.42 | 7.24 | 7.23% | |
| Decision Tree Regression | Compiler Principles | None | 110.08 | 10.49 | 11.28% |
| Operating Systems | None | 189.89 | 13.78 | 12.48% | |
| Data Structures | None | 151.93 | 12.33 | 13.83% | |
| Algorithm Analysis and Design | None | 119.07 | 10.91 | 10.41% |
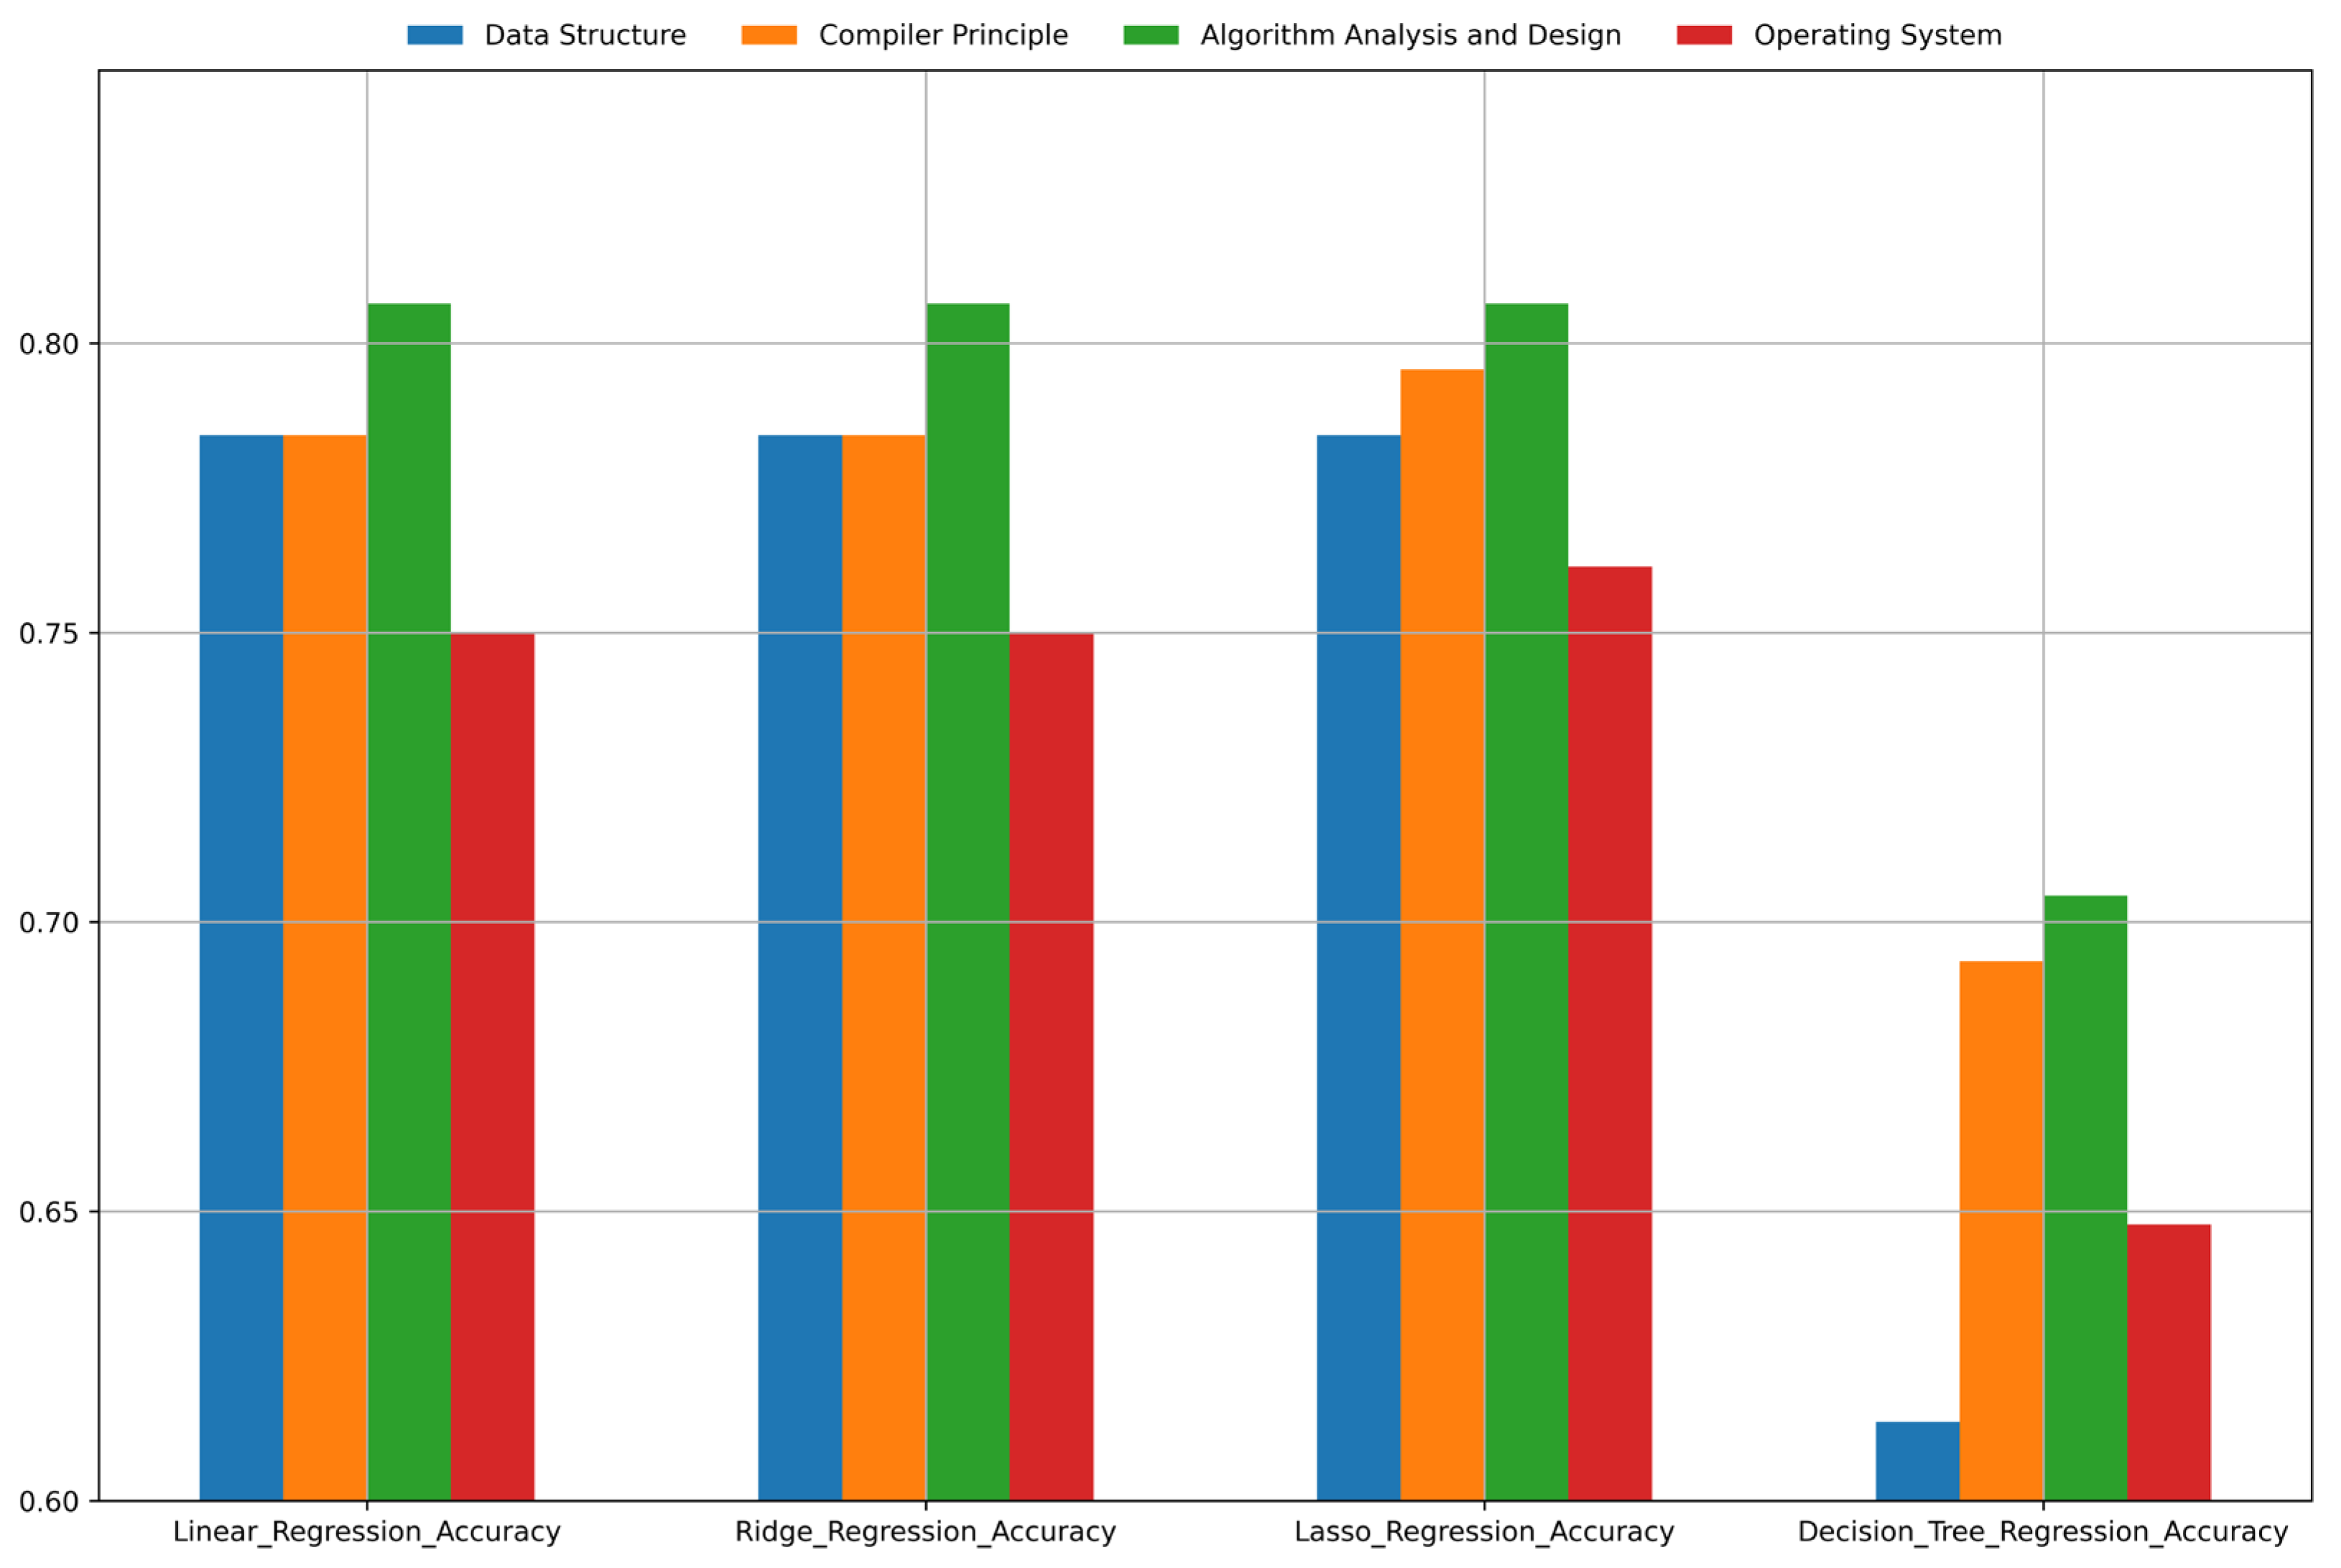
| Course Name | Linear Regression | Ridge Regression | Lasso Regression | Decision Tree Regression |
|---|---|---|---|---|
| Data Structures | 0.78 | 0.78 | 0.78 | 0.68 |
| Compiler Principles | 0.78 | 0.78 | 0.79 | 0.70 |
| Algorithm Analysis and Design | 0.81 | 0.81 | 0.81 | 0.72 |
| Operating Systems | 0.75 | 0.75 | 0.77 | 0.68 |
| Prediction Model | Evaluation Metrics | Precision | Recall | F1-Score | Support |
|---|---|---|---|---|---|
| Random Forest | Fail | 0.00 | 0.00 | 0.00 | 4 |
| Pass | 0.95 | 1.00 | 0.98 | 84 | |
| Accuracy | -- | -- | 0.95 | 88 | |
| Macro Avg | 0.48 | 0.50 | 0.49 | 88 | |
| Weighted Avg | 0.91 | 0.95 | 0.93 | 88 | |
| SVM | Fail | 0.00 | 0.00 | 0.00 | 4 |
| Pass | 0.95 | 1.00 | 0.98 | 84 | |
| Accuracy | -- | -- | 0.95 | 88 | |
| Macro Avg | 0.48 | 0.50 | 0.49 | 88 | |
| Weighted Avg | 0.91 | 0.95 | 0.93 | 88 | |
| Gradient Boosting | Fail | 0.00 | 0.00 | 0.00 | 4 |
| Pass | 0.95 | 1.00 | 0.98 | 84 | |
| Accuracy | -- | -- | 0.95 | 88 | |
| Macro Avg | 0.48 | 0.50 | 0.49 | 88 | |
| Weighted Avg | 0.91 | 0.95 | 0.93 | 88 | |
| K-Neighbors | Fail | 0.00 | 0.00 | 0.00 | 4 |
| Pass | 0.95 | 1.00 | 0.98 | 84 | |
| Accuracy | -- | -- | 0.95 | 88 | |
| Macro Avg | 0.48 | 0.50 | 0.49 | 88 | |
| Weighted Avg | 0.91 | 0.95 | 0.93 | 88 | |
| AdaBoost | Fail | 0.00 | 0.00 | 0.00 | 4 |
| Pass | 0.95 | 1.00 | 0.98 | 84 | |
| Accuracy | -- | -- | 0.95 | 88 | |
| Macro Avg | 0.48 | 0.50 | 0.49 | 88 | |
| Weighted Avg | 0.91 | 0.95 | 0.93 | 88 |
| Prediction Model | Evaluation Metrics | Precision | Recall | F1-Score | Support |
|---|---|---|---|---|---|
| Random Forest | Fail | 0.00 | 0.00 | 0.00 | 4 |
| Pass | 0.77 | 0.89 | 0.82 | 55 | |
| Excellent | 0.75 | 0.62 | 0.68 | 29 | |
| Accuracy | -- | -- | 0.76 | 88 | |
| Macro Avg | 0.51 | 0.50 | 0.50 | 88 | |
| Weighted Avg | 0.73 | 0.76 | 0.74 | 88 | |
| SVM | Fail | 0.00 | 0.00 | 0.00 | 4 |
| Pass | 0.77 | 0.85 | 0.81 | 55 | |
| Excellent | 0.70 | 0.66 | 0.68 | 29 | |
| Accuracy | -- | -- | 0.75 | 88 | |
| Macro Avg | 0.49 | 0.50 | 0.50 | 88 | |
| Weighted Avg | 0.71 | 0.75 | 0.73 | 88 | |
| Gradient Boosting | Fail | 0.00 | 0.00 | 0.00 | 4 |
| Pass | 0.75 | 0.87 | 0.81 | 55 | |
| Excellent | 0.71 | 0.59 | 0.64 | 29 | |
| Accuracy | -- | -- | 0.74 | 88 | |
| Macro Avg | 0.49 | 0.49 | 0.48 | 88 | |
| Weighted Avg | 0.70 | 0.74 | 0.72 | 88 | |
| K-Neighbors | Fail | 0.00 | 0.00 | 0.00 | 4 |
| Pass | 0.76 | 0.82 | 0.79 | 55 | |
| Excellent | 0.66 | 0.66 | 0.66 | 29 | |
| Accuracy | -- | -- | 0.73 | 88 | |
| Macro Avg | 0.47 | 0.49 | 0.48 | 88 | |
| Weighted Avg | 0.69 | 0.73 | 0.71 | 88 | |
| AdaBoost | Fail | 0.00 | 0.00 | 0.00 | 4 |
| Pass | 0.77 | 0.78 | 0.77 | 55 | |
| Excellent | 0.62 | 0.69 | 0.66 | 29 | |
| Accuracy | -- | -- | 0.72 | 88 | |
| Macro Avg | 0.46 | 0.49 | 0.48 | 88 | |
| Weighted Avg | 0.69 | 0.72 | 0.70 | 88 |
| Prediction Model | Evaluation Metrics | Precision | Recall | F1-Score | Support |
|---|---|---|---|---|---|
| Random Forest | Fail | 0.00 | 0.00 | 0.00 | 4 |
| Pass | 0.54 | 0.58 | 0.56 | 24 | |
| Fair | 0.38 | 0.48 | 0.43 | 31 | |
| Good | 0.50 | 0.33 | 0.40 | 21 | |
| Excellent | 0.44 | 0.50 | 0.47 | 8 | |
| Accuracy | -- | -- | 0.45 | 88 | |
| Macro Avg | 0.37 | 0.38 | 0.37 | 88 | |
| Weighted Avg | 0.44 | 0.45 | 0.44 | 88 | |
| SVM | Fail | 0.00 | 0.00 | 0.00 | 4 |
| Pass | 0.63 | 0.50 | 0.56 | 24 | |
| Fair | 0.43 | 0.65 | 0.52 | 31 | |
| Good | 0.50 | 0.33 | 0.40 | 21 | |
| Excellent | 0.44 | 0.50 | 0.47 | 8 | |
| Accuracy | -- | -- | 0.49 | 88 | |
| Macro Avg | 0.40 | 0.40 | 0.39 | 88 | |
| Weighted Avg | 0.49 | 0.49 | 0.47 | 88 | |
| Gradient Boosting | Fail | 0.00 | 0.00 | 0.00 | 4 |
| Pass | 0.58 | 0.62 | 0.60 | 24 | |
| Fair | 0.50 | 0.52 | 0.51 | 31 | |
| Good | 0.50 | 0.48 | 0.49 | 21 | |
| Excellent | 0.40 | 0.50 | 0.44 | 8 | |
| Accuracy | -- | -- | 0.51 | 88 | |
| Macro Avg | 0.40 | 0.42 | 0.41 | 88 | |
| Weighted Avg | 0.49 | 0.51 | 0.50 | 88 | |
| K-Neighbors | Fail | 0.00 | 0.00 | 0.00 | 4 |
| Pass | 0.53 | 0.42 | 0.47 | 24 | |
| Fair | 0.36 | 0.52 | 0.43 | 31 | |
| Good | 0.42 | 0.24 | 0.30 | 21 | |
| Excellent | 0.31 | 0.50 | 0.38 | 8 | |
| Accuracy | -- | -- | 0.40 | 88 | |
| Macro Avg | 0.32 | 0.33 | 0.32 | 88 | |
| Weighted Avg | 0.40 | 0.40 | 0.38 | 88 | |
| AdaBoost | Fail | 0.11 | 0.25 | 0.15 | 4 |
| Pass | 0.27 | 0.12 | 0.17 | 24 | |
| Fair | 0.39 | 0.42 | 0.41 | 31 | |
| Good | 0.40 | 0.67 | 0.50 | 21 | |
| Excellent | 0.00 | 0.00 | 0.00 | 8 | |
| Accuracy | -- | -- | 0.35 | 88 | |
| Macro Avg | 0.24 | 0.29 | 0.25 | 88 | |
| Weighted Avg | 0.31 | 0.35 | 0.32 | 88 |
Disclaimer/Publisher’s Note: The statements, opinions and data contained in all publications are solely those of the individual author(s) and contributor(s) and not of MDPI and/or the editor(s). MDPI and/or the editor(s) disclaim responsibility for any injury to people or property resulting from any ideas, methods, instructions or products referred to in the content. |
© 2025 by the authors. Licensee MDPI, Basel, Switzerland. This article is an open access article distributed under the terms and conditions of the Creative Commons Attribution (CC BY) license (https://creativecommons.org/licenses/by/4.0/).
Share and Cite
Zou, W.; Zhong, W.; Du, J.; Yuan, L. Prediction of Student Academic Performance Utilizing a Multi-Model Fusion Approach in the Realm of Machine Learning. Appl. Sci. 2025, 15, 3550. https://doi.org/10.3390/app15073550
Zou W, Zhong W, Du J, Yuan L. Prediction of Student Academic Performance Utilizing a Multi-Model Fusion Approach in the Realm of Machine Learning. Applied Sciences. 2025; 15(7):3550. https://doi.org/10.3390/app15073550
Chicago/Turabian StyleZou, Wei, Wei Zhong, Junzhen Du, and Lingyun Yuan. 2025. "Prediction of Student Academic Performance Utilizing a Multi-Model Fusion Approach in the Realm of Machine Learning" Applied Sciences 15, no. 7: 3550. https://doi.org/10.3390/app15073550
APA StyleZou, W., Zhong, W., Du, J., & Yuan, L. (2025). Prediction of Student Academic Performance Utilizing a Multi-Model Fusion Approach in the Realm of Machine Learning. Applied Sciences, 15(7), 3550. https://doi.org/10.3390/app15073550