Article

Innovation in Energy Saving: Application for the Optimization of Consumption and the Integration of Photovoltaic Energy

by
Celia Tena-Pintado
1,
Vicente A. Román-Galeano
1,
Dorotea Dimitrova-Angelova
1,
Diego Carmona-Fernández
2 and
Juan Félix González-González
1,*
1
Department of Applied Physic, School of Industrial Engineering, University of Extremadura, Avda. Elvas s/n, 06006 Badajoz, Spain
2
Department of Electric, Electronic and Automatic Engineering, School of Industrial Engineering, University of Extremadura, Avda. Elvas s/n, 06006 Badajoz, Spain
*
Author to whom correspondence should be addressed.
Appl. Sci. 2025, 15(7), 3493; https://doi.org/10.3390/app15073493
Submission received: 17 February 2025 / Revised: 11 March 2025 / Accepted: 19 March 2025 / Published: 22 March 2025
(This article belongs to the Section Materials Science and Engineering)

Abstract

:
Nowadays, due to the considerable increase in energy demand, the reduction of CO2 emissions, the increase in energy efficiency and the lack of knowledge of the population in the current electricity system, both at residential and industrial levels, the need to implement measures that promote the common benefit of society has arisen. Photovoltaic energy has been gaining importance as a sustainable alternative to traditional energy sources, especially in Spain, where it is one of the most advantageous options thanks to its geographical location. In order to help consumers at household, SME or industrial levels to understand the complex electricity market, a new tool designed to optimize savings is presented. This application analyzes individual consumption patterns in detail and proposes savings strategies based on both tariffs and the implementation of solar photovoltaic installations. By integrating actual consumption data and PV generation estimations, the tool generates different customized scenarios, allowing the user to minimize their costs. The results of this study underline the importance of adopting renewable energy solutions, offering practical ideas for both policy makers and consumers.

1. Introduction

Climate change and the urgency to reduce greenhouse gas emissions have led to the transformation towards a more sustainable and ecosystem-friendly energy system becoming a global priority. In this context, the electricity sector plays a key role, as it is responsible for a large part of these emissions at a global level [1]. It is therefore crucial to boost the use of renewable energy sources in order to reduce emissions. For example, Spain, like many other countries, has set ambitious targets in this respect, aiming to generate 74% of its electricity from renewable sources by 2030 [2].
Figure 1 shows the evolution of demand coverage in Spain over the last few years.
This article covers the critical aspects that enable these objectives to be achieved, including an analysis of both current energy consumption and the functioning of the electricity market, in order to understand how the demand and price of energy is managed. It also examines the role of renewables in the European context together with the current tariff situation, which is crucial to understanding the conditions faced by consumers. The importance of correctly calculating PV installations and properly predicting solar radiation is also highlighted, as these are key factors in optimizing the integration of solar energy into the electricity system. It also emphasizes the need for accurate matching of energy consumption and production to avoid imbalances in the electricity grid. Then, the developed tool is presented. It helps consumers to select the most appropriate tariff according to their needs and assesses the profitability of a photovoltaic installation. Finally, the conclusions develop the results obtained and put forward recommendations to move towards a more sustainable energy system.
However, the path towards the full integration of renewables into the electricity system presents multiple challenges and considerations. One crucial aspect is the ability of homes and buildings to achieve energy self-sufficiency, especially through the installation of photovoltaic systems of rooftops. A detailed analysis reveals that energy planning must consider not only annual data, but also hourly data for more accurate forecasting and planning [4]. In addition, compensation policies play a key role in the economic viability of these installations, with significant implications for the use of available roof pace.
The current situation, marked by the COVID-19 pandemic and volatile energy prices, has highlighted the need to accelerate the transition towards a cleaner and decentralized energy model. The integration of renewable energies, including solar photovoltaics, is presented as a key solution in this context [5]. Experiences such as the implementation of energy communities in vulnerable areas have proven to be viable models, highlighting the importance of citizen participation and the development of appropriate policies.
Spain’s photovoltaic sector, for example, emerges as a significant opportunity for economic recovery and meeting sustainability goals [6]. However, detailed strategic analysis is required to identify challenges and opportunities, as well as to develop effective short-, medium- and long-term strategies. Advances in solar PV forecasting techniques, especially those based on artificial intelligence and machine learning, promise to improve the accuracy and efficiency of these systems, paving the way for a successful and sustainable energy transition [7].

2. Energy Consumption

Over the last few years, energy consumption in Europe has grown significantly, both in the residential and industrial sectors. As a result, a number of energy policy measures have been adopted, such as the European Green Pact [8], energy efficiency strategies and the development of Renewable Energy Plans.
The industrial sector is particularly relevant in the European Union (EU), accounting for around 25% of total energy consumption in the region. At the EU level, the European Commission has promoted energy efficiency through directives and regulations that encourage electrification and the use of renewable energies in industry, aiming to reduce emissions and improve competitiveness. Projects such as the Energy Performance of Buildings Directive establish measures to reduce energy consumption in buildings, with the aim of achieving nearly zero-energy buildings [9].
The transition to renewable energy such as solar PV and wind has contributed to the reduction in energy demand in several sectors, including the residential. However, energy price volatility, exacerbated by events such as the 2022 natural gas crisis, remains a challenge for energy markets. In 2021, prices reached historic peaks due to the energy crisis, although in 2022 they began to moderate as member states took measures to contain the crisis. This has affected both industrial competitiveness and household welfare, increasing energy costs. It has also raised concerns about energy stability and security. Despite the efforts to liberalize the market, structural challenges remain, such as the costs associated with distribution networks and taxation, which affect both industrial and residential consumers.
Spain, in particular, has played a prominent role within this European framework. In 2023, 50% of the country’s electricity generation came from renewable sources [10], with its leadership in wind and solar photovoltaic energy standing out. However, it has also been impacted by the natural gas crisis, with a considerable increase in energy prices. The government implemented measures such as the temporary reduction in VAT on electricity and the promotion of self-consumption with renewable energies.
In addition, Spain has developed projects such as SPAHOUSEC, which focuses on the analysis of household energy consumption. This project seeks to identify energy consumption patterns by service and climate region, with the aim of improving energy efficiency and promoting the use of renewable sources.

3. Operation of the Electricity Market

The European electricity market is a complex system designed to coordinate the generation, distribution and consumption of electricity across Europe, based on principles of competition, regional integration and sustainability, with the aim of ensuring secure, accessible and environmentally friendly electricity supply.
The European electricity market is divided into two main levels:
  • Wholesale market: in this market, electricity generators such as nuclear, solar, wind and gas plants sell electricity to retailers, large consumers or directly to the grid. The wholesale market is organized into different temporary markets:
    Day-ahead market: here participants bid and offer to buy and sell electricity for the next day. Prices are determined based on an auction mechanism, where the cross between supply and demand establishes the marginal price, as shown in Figure 2. This price is applied uniformly to all transactions in that interval.
    Intraday market: adjusts daily market forecasts by allowing participants to modify their bids according to changes in production or demand.
    Adjustment market: ensures that supply and demand are balanced in real time.
  • Retail market: here electricity is sold by retailers to final consumers (households, businesses and industry). Prices in the retail market are influenced by wholesale market costs, network tariffs, taxes and other factors.
The European electricity system is overseen by national transmission system operators (TSOs), such as Red Eléctrica de España (REE) or TenneT in Germany, which are responsible for managing the electricity grids and ensuring the balance between supply and demand.
The integration of renewable energy has been a priority in Europe [12]. European Union (EU) energy policies encourage investment in clean energy through the European Emissions Trading System (ETS) and subsidies for clean technologies. However, the intermittent nature of sources such as solar and wind poses challenges, such as the need for increased energy storage capacity and flexibility in the system. Lessons learned from the UK electricity market reform provide a valuable framework for designing policies to improve the competitiveness and sustainability of the European electricity market [13].
One of the greatest achievements of EU energy policy has been the creation of a single electricity market, which allows cross-border trade and promotes efficiency, as countries can import or export electricity according to their needs and capacities. Prices are therefore interconnected at the European level and fluctuations in one country can affect others.
Interconnections between national grids are key as they allow the transfer of electricity between countries, helping to stabilize prices and avoid the risk of blackouts.
The European electricity market follows a marginal price model, which means that the price of electricity in a given time interval is determined by the most expensive generation plant needed to meet demand at that time. This approach is used to ensure that the cheapest energy sources (such as renewables) are dispatched first but can result in the final market price being set by more expensive technologies, such as gas-fired plants. This situation creates what is known as the ‘market paradox’, where, despite the use of renewables with near-zero marginal costs, the final price of electricity may still be high due to the use of more expensive sources to balance demand.
In the long term, it is crucial to ensure the stability of the electricity system to avoid significant imbalances between supply and demand, which is achieved through market mechanisms that encourage investment in back-up storage technologies. Continuity of service can be ensured by adopting a market-based approach that appropriately integrates generation costs and reserve requirements, thus achieving a sustainable balance over time [14].

4. Renewable Energies

Renewable energy developments in Europe have advanced significantly in recent years, with a strong momentum towards the energy transition, as shown in Figure 3. In 2023, electricity generated from renewables such as wind and solar reached record levels in the EU, accounting for 44% of total electricity generation, exceeding the 40% threshold for the first time. This growth was driven by the need to reduce dependence on fossil fuels, resulting in an unprecedented decrease in the use of coal and gas.
Reports highlight how renewables are transforming Europe’s energy mix, with a 19% plunge in fossil fuel generation and a 26% drop in coal-fired generation by 2023. This has been key to the EU’s power sector emissions falling by 19%, the largest annual reduction on record [15].
In the long term, this trend is expected to continue, with wind and solar capacity expanding in most European countries. According to the IRENA report, solar energy, in particular, has shown steady growth across the region, especially in southern Europe, where climatic conditions favor its use [16]. However, the report also stresses that, in order to reach the EU’s climate neutrality targets, it will be crucial to further accelerate the installation of renewable infrastructure, doubling the current annual installation capacity.
Therefore, most sources agree that Europe has taken important steps in the energy transition, reducing dependence on fossil fuels and moving towards an electricity system based on renewable energies. This process has not only reduced CO2 emissions but also increased energy security in the region.
In this context, the installation of photovoltaic systems at home is presented not only as a key tool to accelerate the energy transition, but also as a practical solution to reduce electricity bills. As energy prices remain high and volatile in many parts of Europe, harnessing solar energy at home can offer significant savings. The tool developed, which will be explained in later sections, facilitates this process by providing a personalized analysis of electricity tariffs and the profitability of solar installations, allowing users to make informed decisions that not only benefit the environment, but also their household economy. This is especially relevant in countries such as Spain, where tariffs with hourly discrimination and increased sunshine hours maximize the benefits of self-consumption.

5. Current Tariff Situation

As discussed above, across the EU, electricity prices are mainly affected by fossil fuel costs and carbon emission allowances. In addition, power generation from renewable sources such as solar and wind has started to reduce prices in certain countries due to their increasing competitiveness. However, retail electricity costs are not uniform across countries, as governments take varying measures to mitigate the effects of recent energy crises, such as those caused by the war in Ukraine and the pandemic. It is therefore essential that policymakers develop long-term strategic energy planning [17].
It is also important to bear in mind that consumers in countries such as Spain and Portugal have received aid to curb the impact of wholesale prices. In contrast, in other countries such as Germany and Italy, costs have been more volatile. This aspect is an important factor when choosing which tariff is more appropriate depending on the country.
Some countries are also applying special tariffs to incentivize the installation of renewable energies, which is directly linked to the assessment of the profitability of the PV installation.
Below are the most relevant tariffs in some EU countries:
  • Spain:
    • Time discriminatory tariff (TDH): this tariff varies according to the time of day. It is divided into two or three periods (peak, flat and valley), with the valley being the cheapest. Figure 4 and Figure 5 illustrate the allocation of periods to specific hours, contingent on the day of the week.
    • Indexed prices: prices vary according to the wholesale market, allowing consumers to take advantage of times of low demand to pay less, but exposing them to higher prices at times of high demand.
    • PVPC tariff (Voluntary Price for Small Consumers): the price varies every hour according to the wholesale market, regulated by the government.
  • Germany:
    • Fixed vs. variable tariffs: electricity tariffs in Germany are highly influenced by environmental taxes and the cost of renewable energies. Consumers can choose between tariffs with long-term fixed prices or variable tariffs that fluctuate according to the market.
    • EEG-Umlage: this is a specific surcharge to finance renewables, which is added to the basic cost of electricity.
  • France:
    • Regulated Blue Tariff (TRV): this is a fixed tariff regulated by the government, available to households and small businesses, which guarantees some stability against market fluctuations.
    • Green tariff options: some suppliers offer renewable energy tariffs that guarantee that the electricity supply comes from sources such as wind or solar.
  • Portugal:
    • Social Electricity Tariff: similar to Spain, Portugal offers subsidized tariffs for vulnerable consumers, with a discount on the bill for low-income households.
    • Hourly tariffs: these are structured according to the hours of the day, similar to Spain’s time discriminatory tariffs, with three periods: peak, flat and off-peak.
Energy consumption decisions in Europe are deeply influenced by electricity tariffs, which vary by location, which also impacts the cost-effectiveness of installing solar panels. These differences depend on factors such as the tariff structure, the share of renewable energy and the fiscal and energy policies of each country.
As we have already seen, in Spain, the tariff with hourly discrimination allows users to take advantage of off-peak hours to obtain lower prices. This type of tariff encourages the installation of photovoltaic systems to maximize savings during sunlight hours. However, the high volatility of tariffs such as the Voluntary Price for Small Consumers (PVPC), linked to the wholesale market, means that consumers must weigh the risks of variable prices against the advantages of solar self-generation.
In Germany, on the other hand, electricity tariffs tend to be more stable, but include high taxes related to the energy transition, such as the EEG-Umlage, which finances the expansion of renewable energy. This can make conventional electricity more expensive and make solar installations more cost-effective to reduce the impact of these surcharges. However, green tariffs in Germany, which offer 100% renewable energy, also make consumers consider whether installing their own solar power is necessary or whether it is more convenient to access energy.

6. Importance of Photovoltaic Installation Calculations and Solar Radiation Prediction

The correct design and calculation of photovoltaic installations is essential to maximize energy efficiency and minimize the associated costs. According to studies published in the IEEE Journal of Photovoltaics [19], optimizing various aspects of the system, such as the location, orientation, and angle of the solar panels, is crucial to ensure the optimal performance of PV systems. This optimization not only improves energy efficiency, but also significantly reduces installation and operating costs in the long run. A thorough analysis can make a big difference to the overall performance of the system. Therefore, it is vital to also take into account factors such as climatic and geographical conditions during the design phase, as they directly influence the amount of energy a system can generate.
Accurate solar radiation prediction is essential for the planning and optimization of photovoltaic installations. Several prediction methods coexist today, including models based on historical data and advanced machine learning techniques. These methods make it possible to anticipate the amount of solar radiation that a given area will receive, which is vital for adjusting the design and improving the efficiency of PV systems [20].
In addition, it is also relevant to highlight the importance of maximum power point tracking (MPPT) algorithms, which rely on accurate predictions of solar radiation to continuously optimize system performance. MPPT algorithms adjust system operation in real time to ensure that the maximum possible amount of energy is always being generated, which is crucial to maximize the efficiency and profitability of solar installations.
Despite advancements in technology and optimization, photovoltaic installations face several challenges. These includes the variability in the availability of solar radiation, the need for efficient energy storage, and integration with existing electrical grids. The mentioned studies also address these challenges, proposing solutions such as the use of integrated energy storage systems and improvements in control algorithms to better manage energy generation and distribution.

7. Consumption–Production Cassation

The transition to renewable energy sources has fundamentally altered the generation, consumption, and management of energy resources. The concepts of grid consumption, surplus, and self-consumption [21] are critical for comprehending this dynamic.
The importance of the relationship between consumption and production in the sizing of installations lies in the optimization of energy generation and use. It is essential to adjust the size of these systems to match the user’s consumption pattern, thus maximizing self-consumption and minimizing dependence on the electrical grid.
When discussing the sizing of a photovoltaic installation, a common approach is to ensure that solar energy production closely aligns with the energy consumption of the building or facility. This alignment allows the majority of the generated energy to be used locally and helps avoid legal and contractual complications that can arise from injecting excess energy into the electrical grid. To achieve this, factors such as daily minimum consumption needs are considered [22].
Energy consumption refers to the use of energy by end consumers, whether residential, SME or industrial. It should be noted that, to meet this consumption, electricity can come from various energy sources:
  • The electrical grid, managed at the European level by the entities such as ENTSO-E (European Network of Transmission System Operators for Electricity), plays a key role in distributing electricity from generation plants, both renewable and non-renewable, to end consumers. These networks ensure supply while allowing for the integration of renewable sources such as solar and wind.
  • Self-generation: this type of generation allows consumers to self-consume using renewable sources, such as photovoltaic panels or modules, enabling them to save not only on their electricity bills but also on overall electricity consumption. To meet the demand for electrical energy, various sources are used, both renewable (solar, wind, hydroelectric, and biomass) and non-renewables. Photovoltaic solar energy has gained importance due to its ability to enable self-consumption, generate surpluses, or reduce grid consumption, thanks to the generation from solar panels that convert sunlight into electricity.
  • Self-consumption refers to a consumer’s ability to generate and consume their own energy. This reduces reliance on the electrical grid and can result in savings on the electricity bill. Self-consumption lowers costs by decreasing energy consumption from the grid and reducing electricity bills, generates less dependence on the electrical network, and contributes to the reduction in greenhouse gas emissions.
  • Surplus refers to the energy generated that is not consumed and can be fed back into the electrical grid. This energy can be sold to the utility company, providing compensation for the surplus.
  • Grid consumption is the energy that a consumer obtains from the electrical grid when their self-generation is insufficient to meet their demand. To feed energy back into the grid, it is important to consider that the grid must balance supply and demand, efficiently integrating renewable generation.
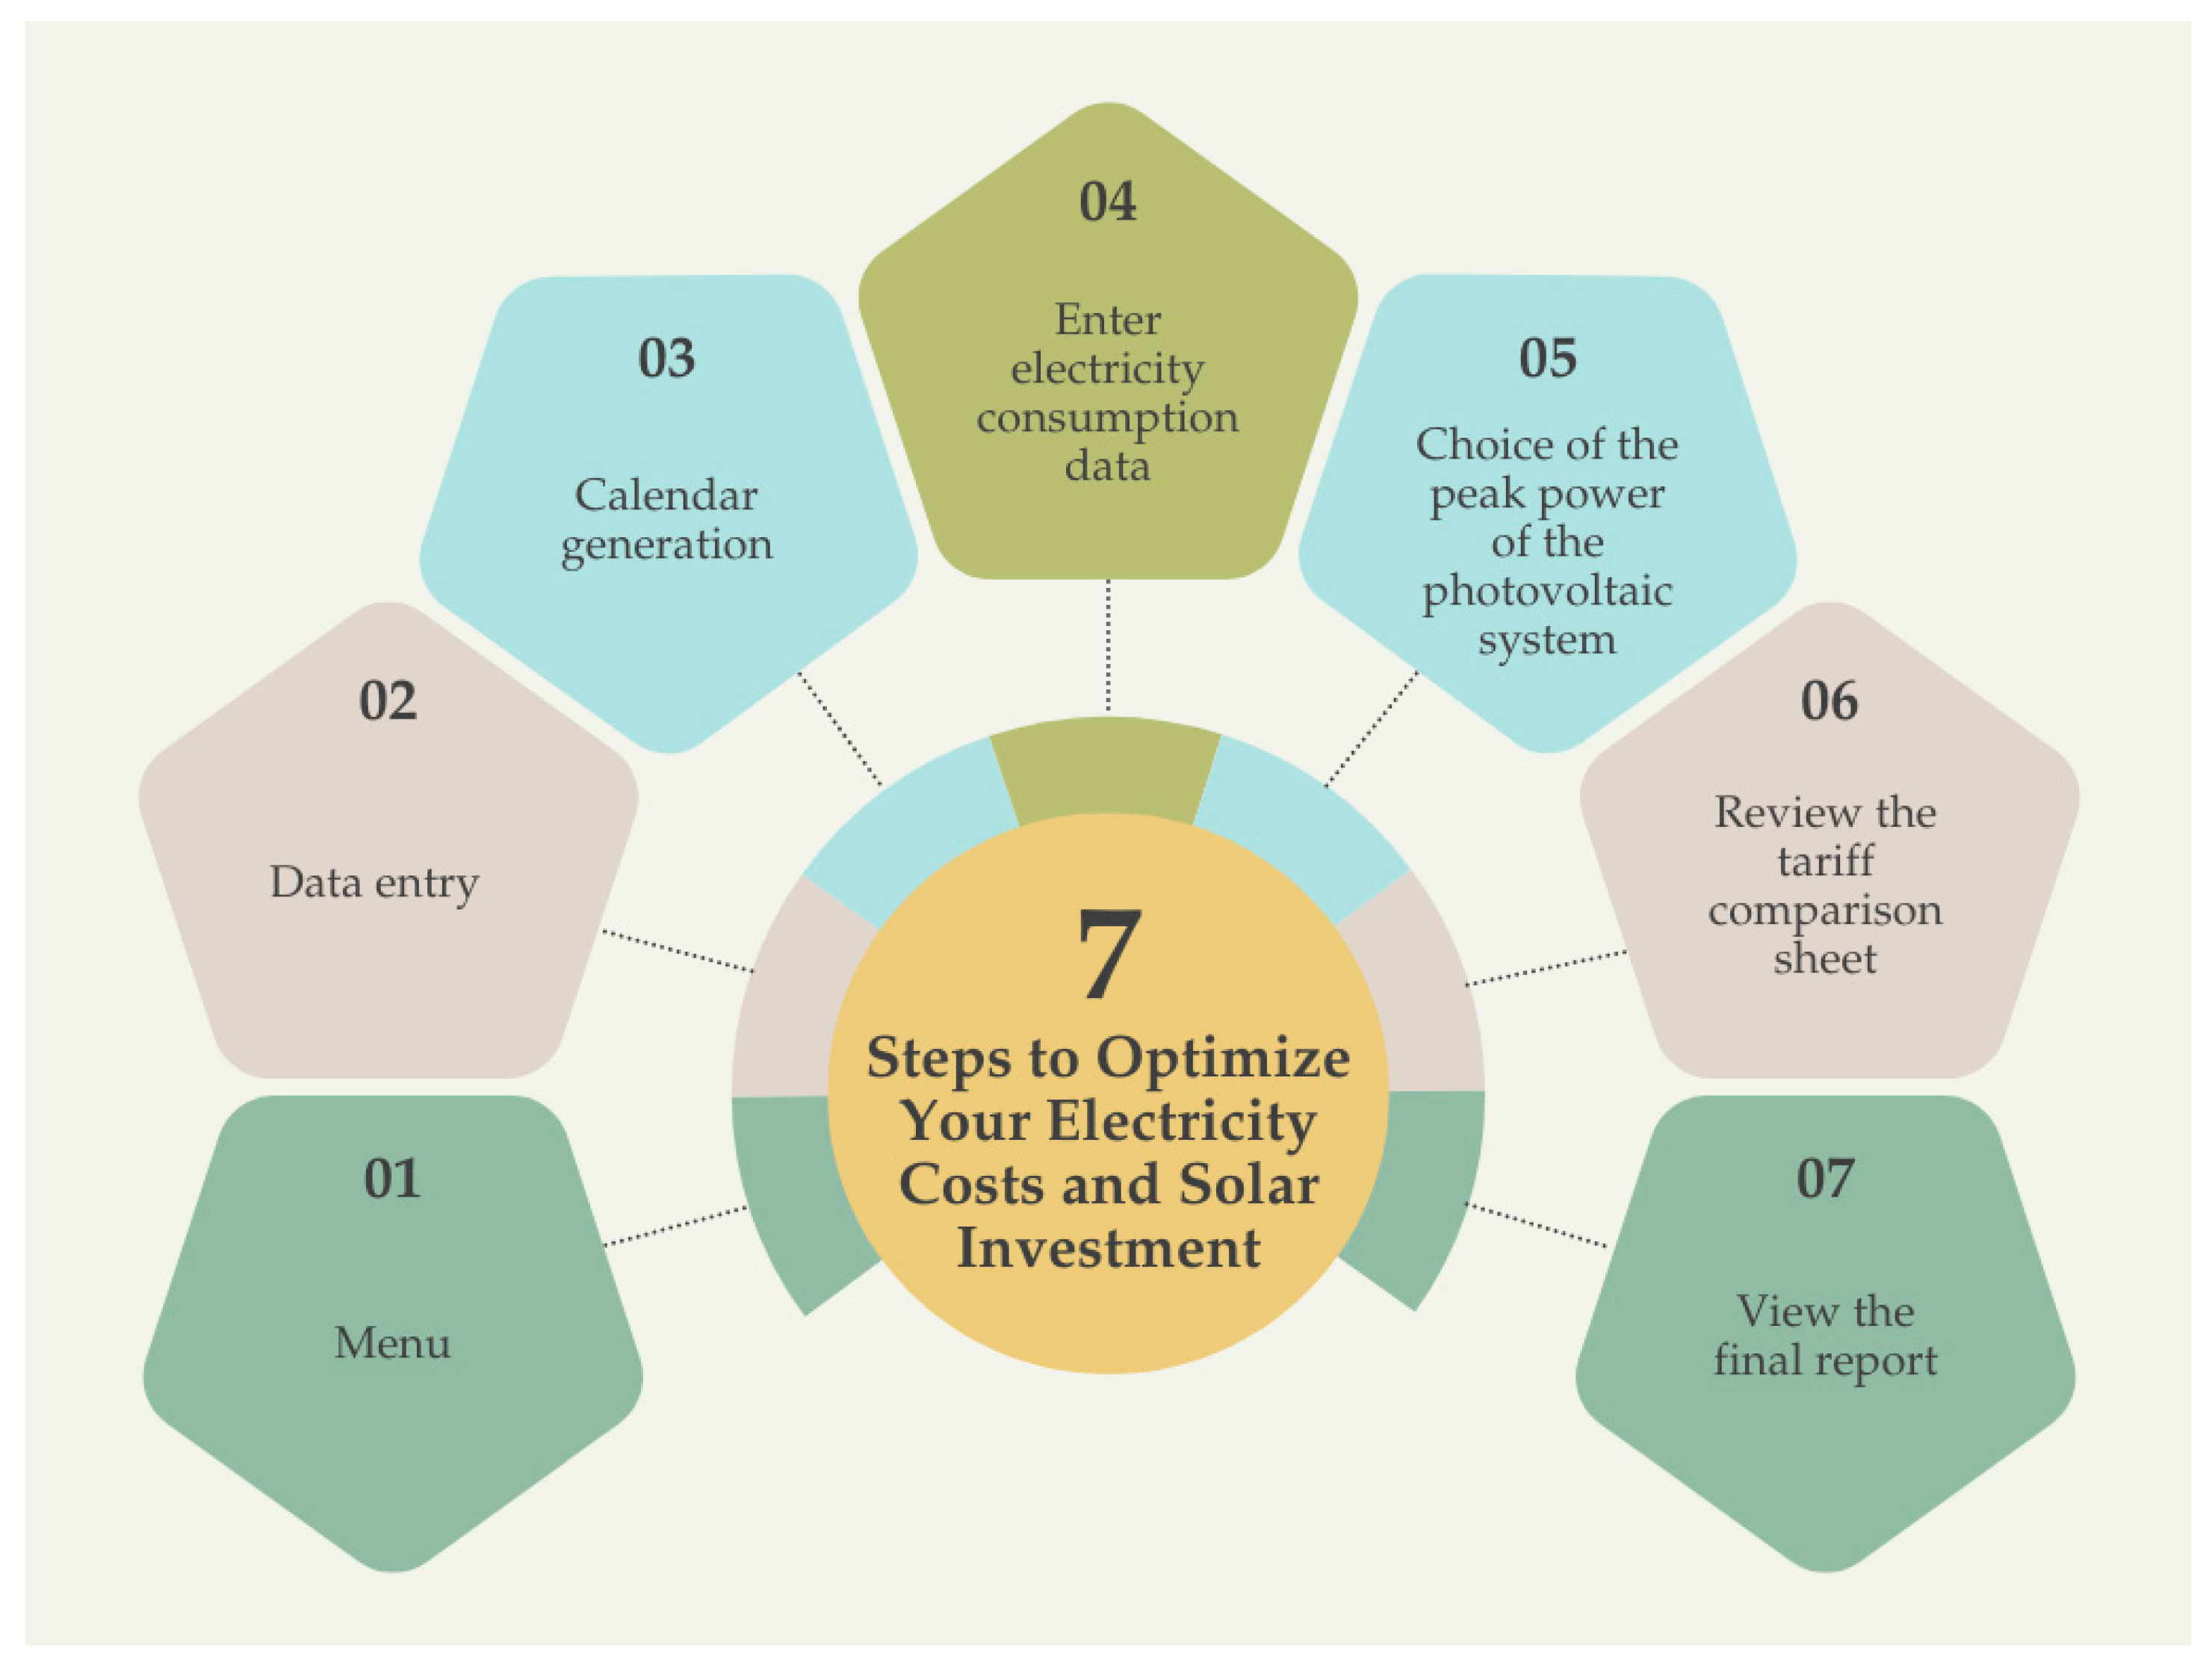
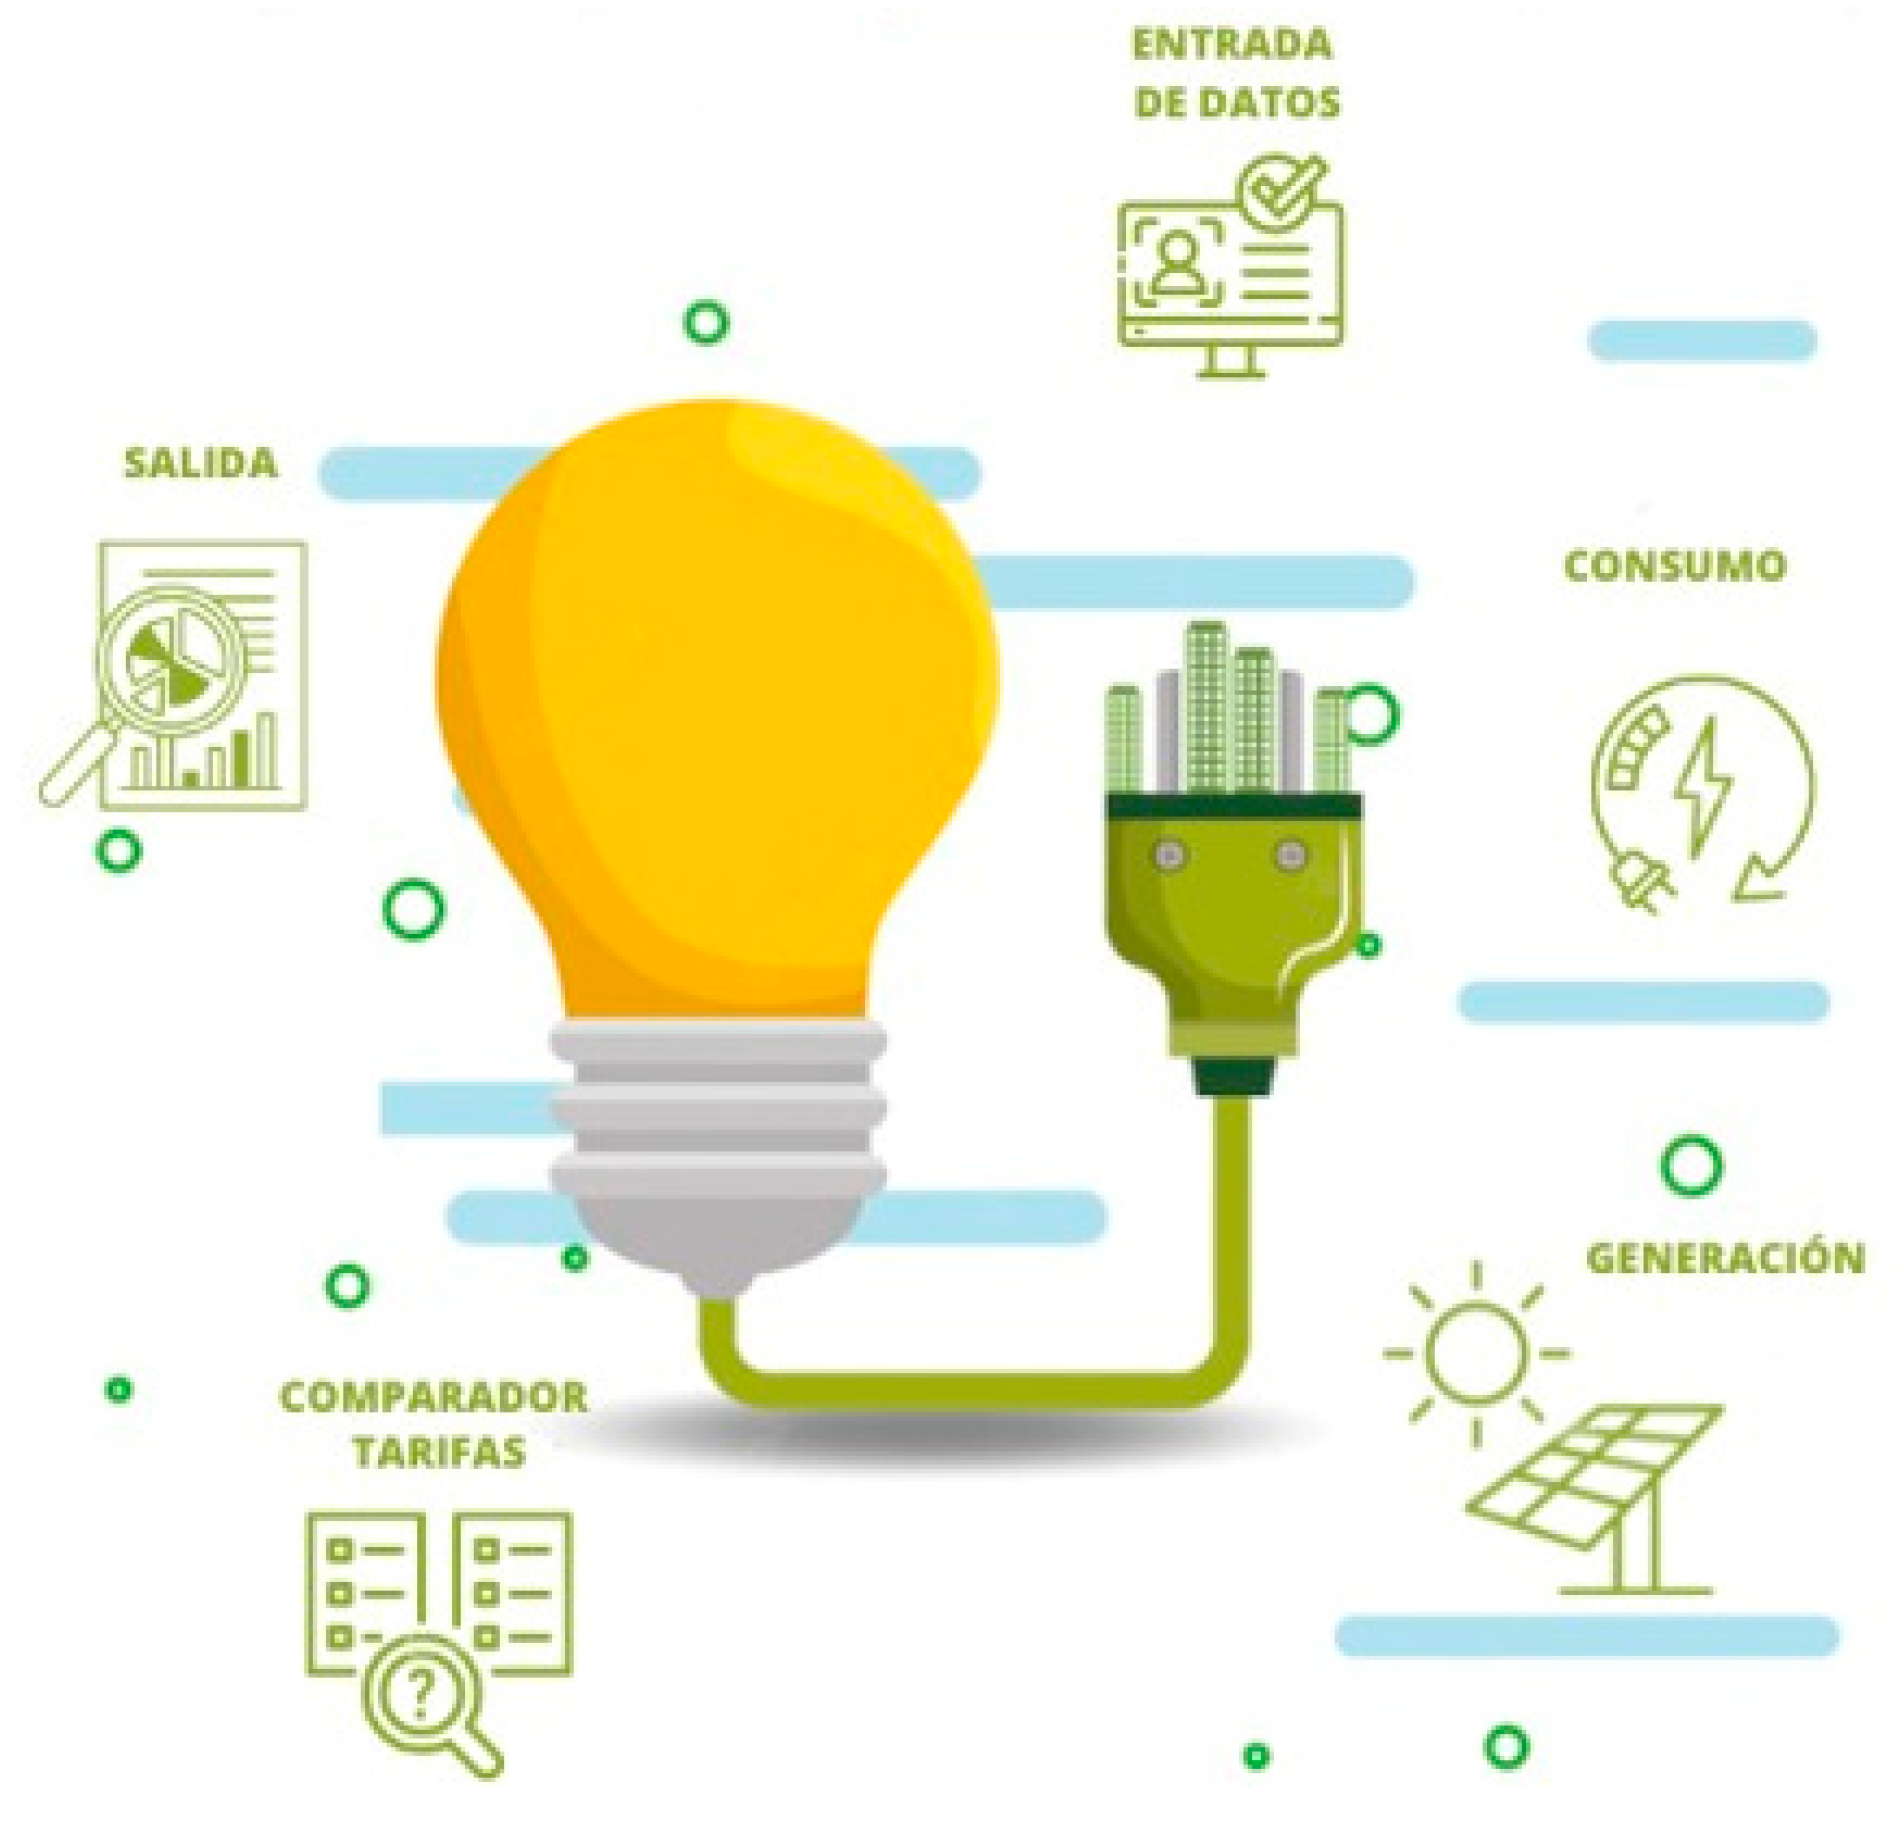
This electricity can be used directly or stored in batteries. The batteries can be Lithium-Ion, Lead-Acid, Flow, Nickel-Cadmium, or Nickel-Metal Hydride [23].

8. Developed Tool

The main objective of this tool is to provide consumers with a clear and objective view that helps them make informed decisions about their energy consumption, considering the volatility of the European electricity market. These factors have directly influenced the design of the tool, ensuring that it can dynamically analyze tariff variations and assist consumers in making cost-effective decisions. The task of choosing the most suitable electricity tariff for each context is complicated by the instability of energy prices, driven by factors such as fluctuations in fossil fuel prices, the integration of renewable energy, and regulatory policies. Additionally, there is widespread ignorance among consumers regarding mechanisms for self-consumption, surpluses, and other options to reduce dependence on the electrical grid.
To simplify the decision-making process for consumers, the tool follows a structured workflow that guides users step by step. The workflow is illustrated in Figure 6.
In this context, the tool not only guides users on the most efficient electricity tariff according to their consumption profile, but it also advises on the economic viability of implementing a photovoltaic installation in their home. Its design responds specifically to the challenges posed by the European electricity market, such as frequent tariff fluctuations and evolving self-consumption policies, ensuring that users receive tailored and up-to-date recommendations. The adoption of renewable energy is crucial on the path to energy transition, not only to mitigate environmental impact but also to reduce dependence on fossil fuel markets and thereby avoid exposure to energy price volatility.
These functionalities are especially relevant at this moment as self-consumption installations allow households not only to generate energy to meet their needs but also to sell excess energy back to the grid, contributing to the balance of the energy system and generating significant savings on electricity bills.
As of today, the tool is developed in Spanish and designed to analyze electricity tariffs in that market. However, the goal is to expand its reach at the European level by translating the tool into various languages and adapting its functionalities to integrate tariffs from different countries, which will allow consumers across Europe to benefit from a greater understanding of the electricity market, with accurate and personalized information for each region, facilitating decision-making in a complex and constantly evolving energy environment.
The application has been developed using Microsoft Excel para Microsoft 365 MSO (versión 2502) and Visual Basic programming language. The tool is made up of five main sections, which are accessed through an interactive menu shown in Figure 7.
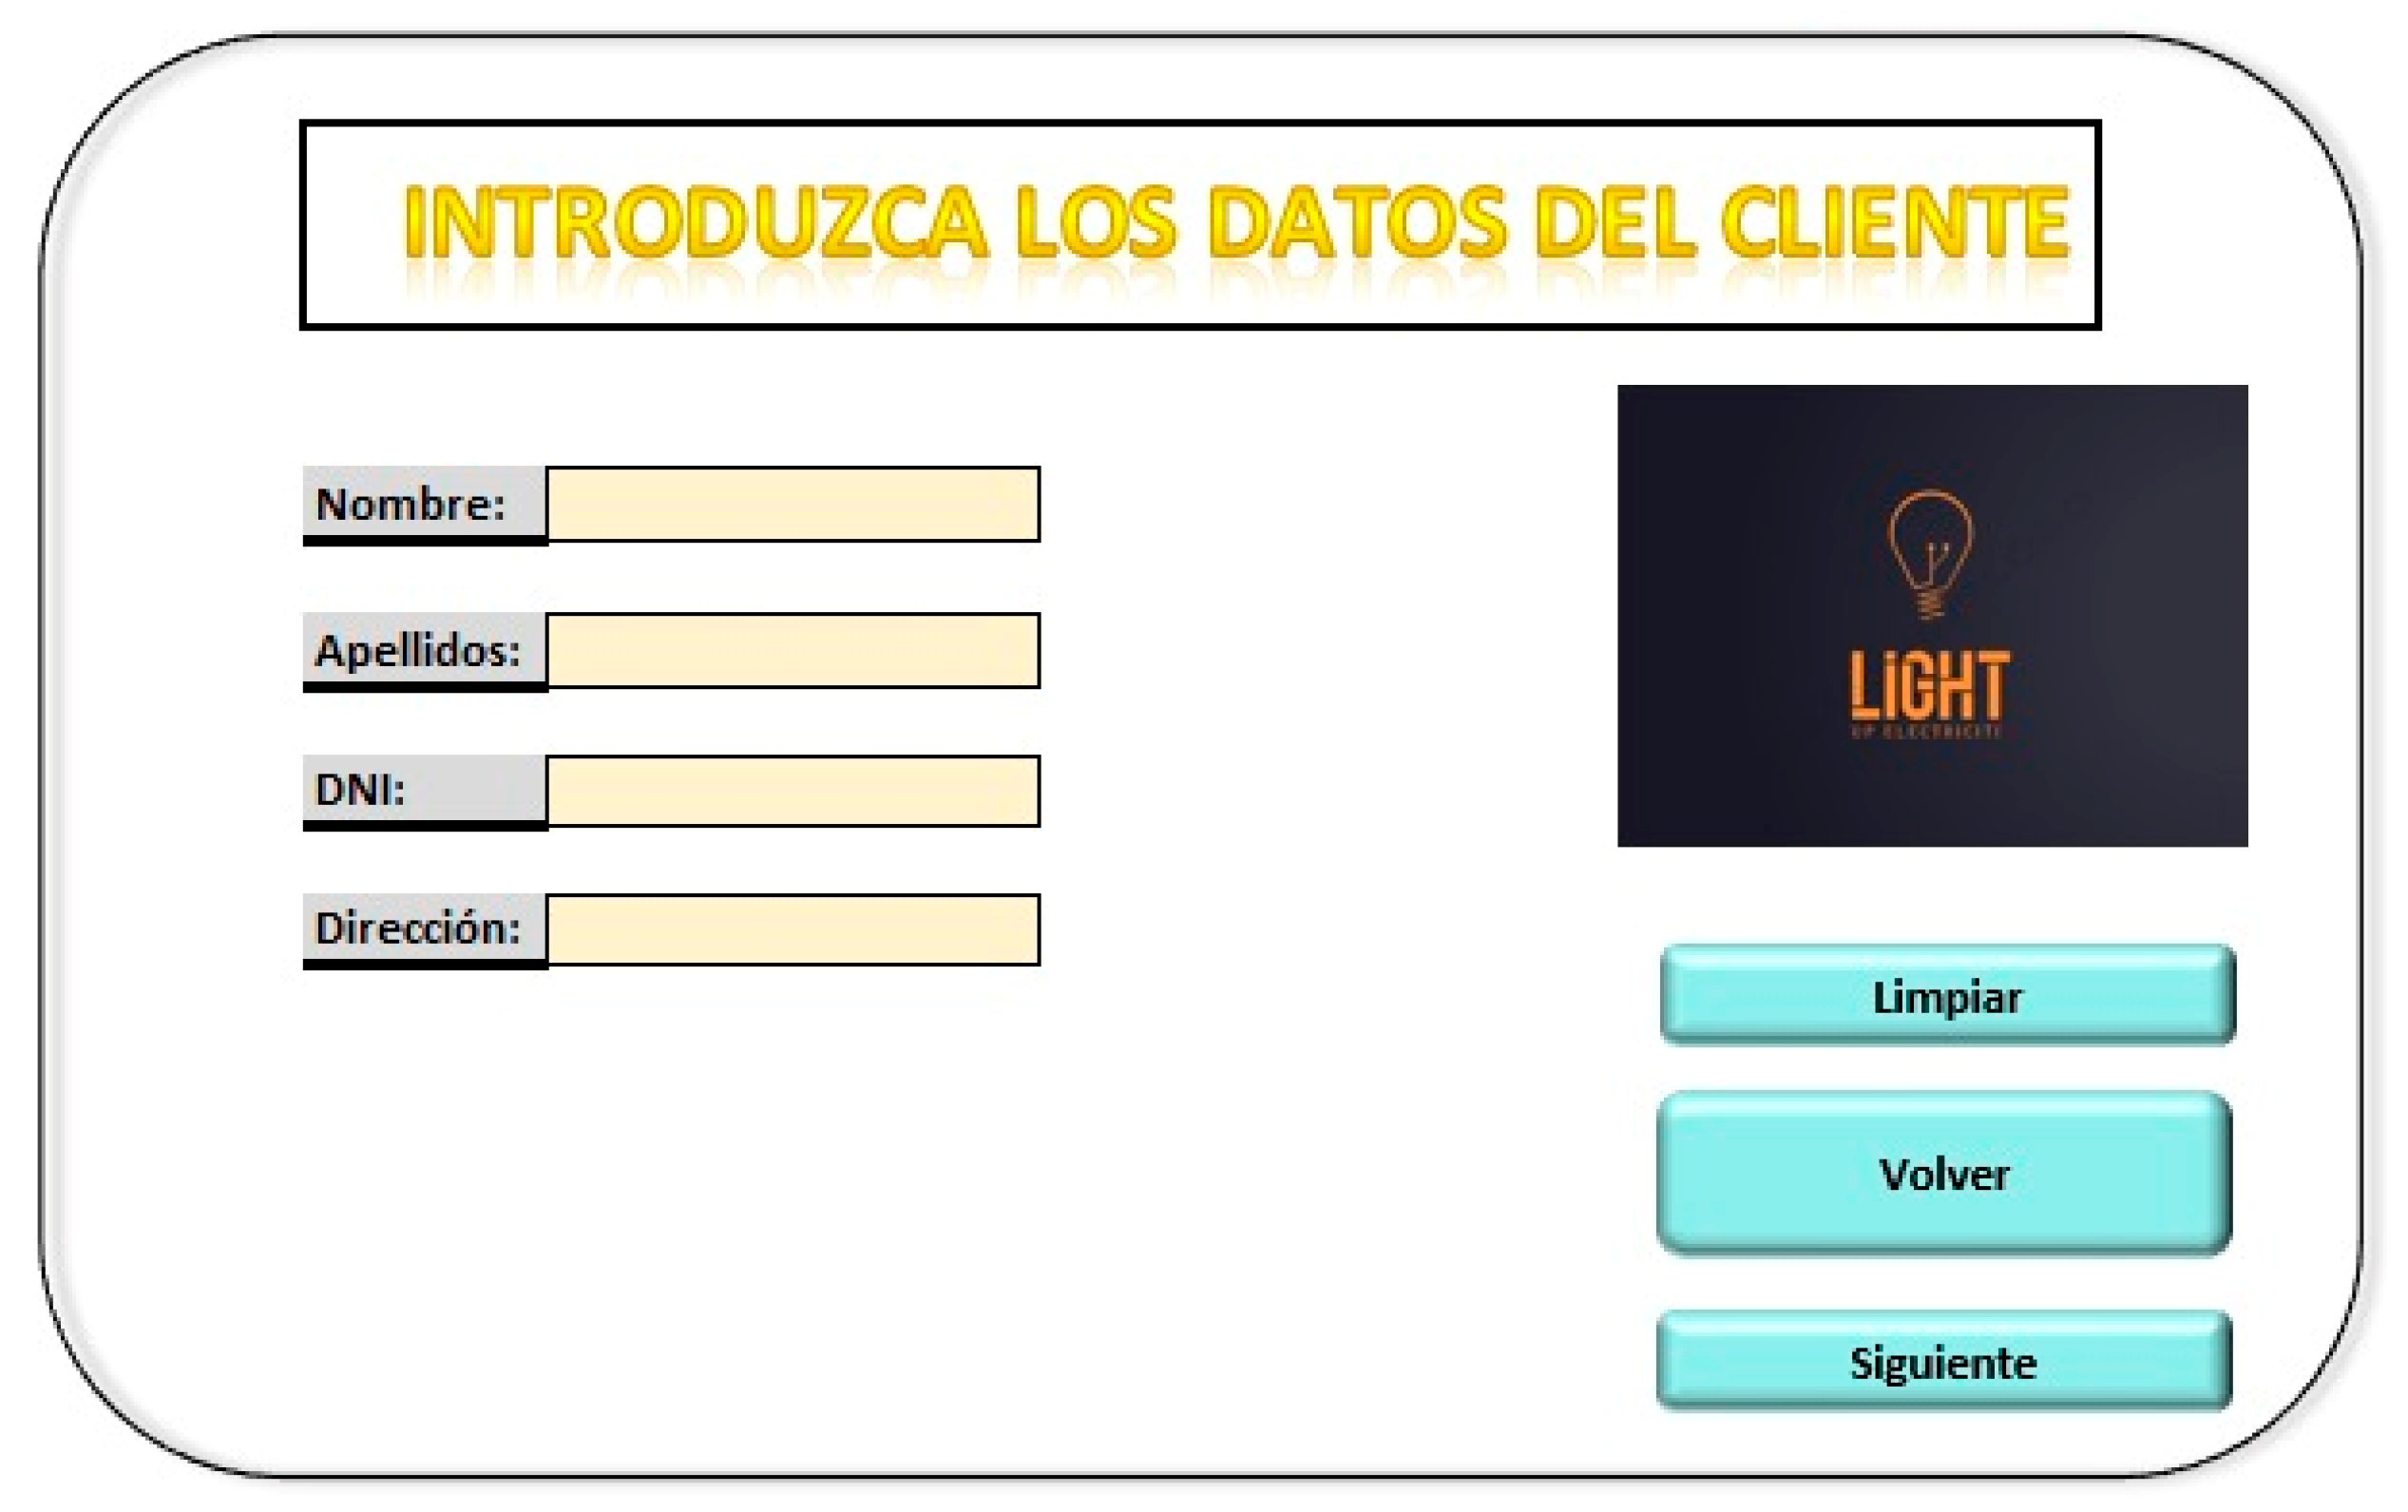
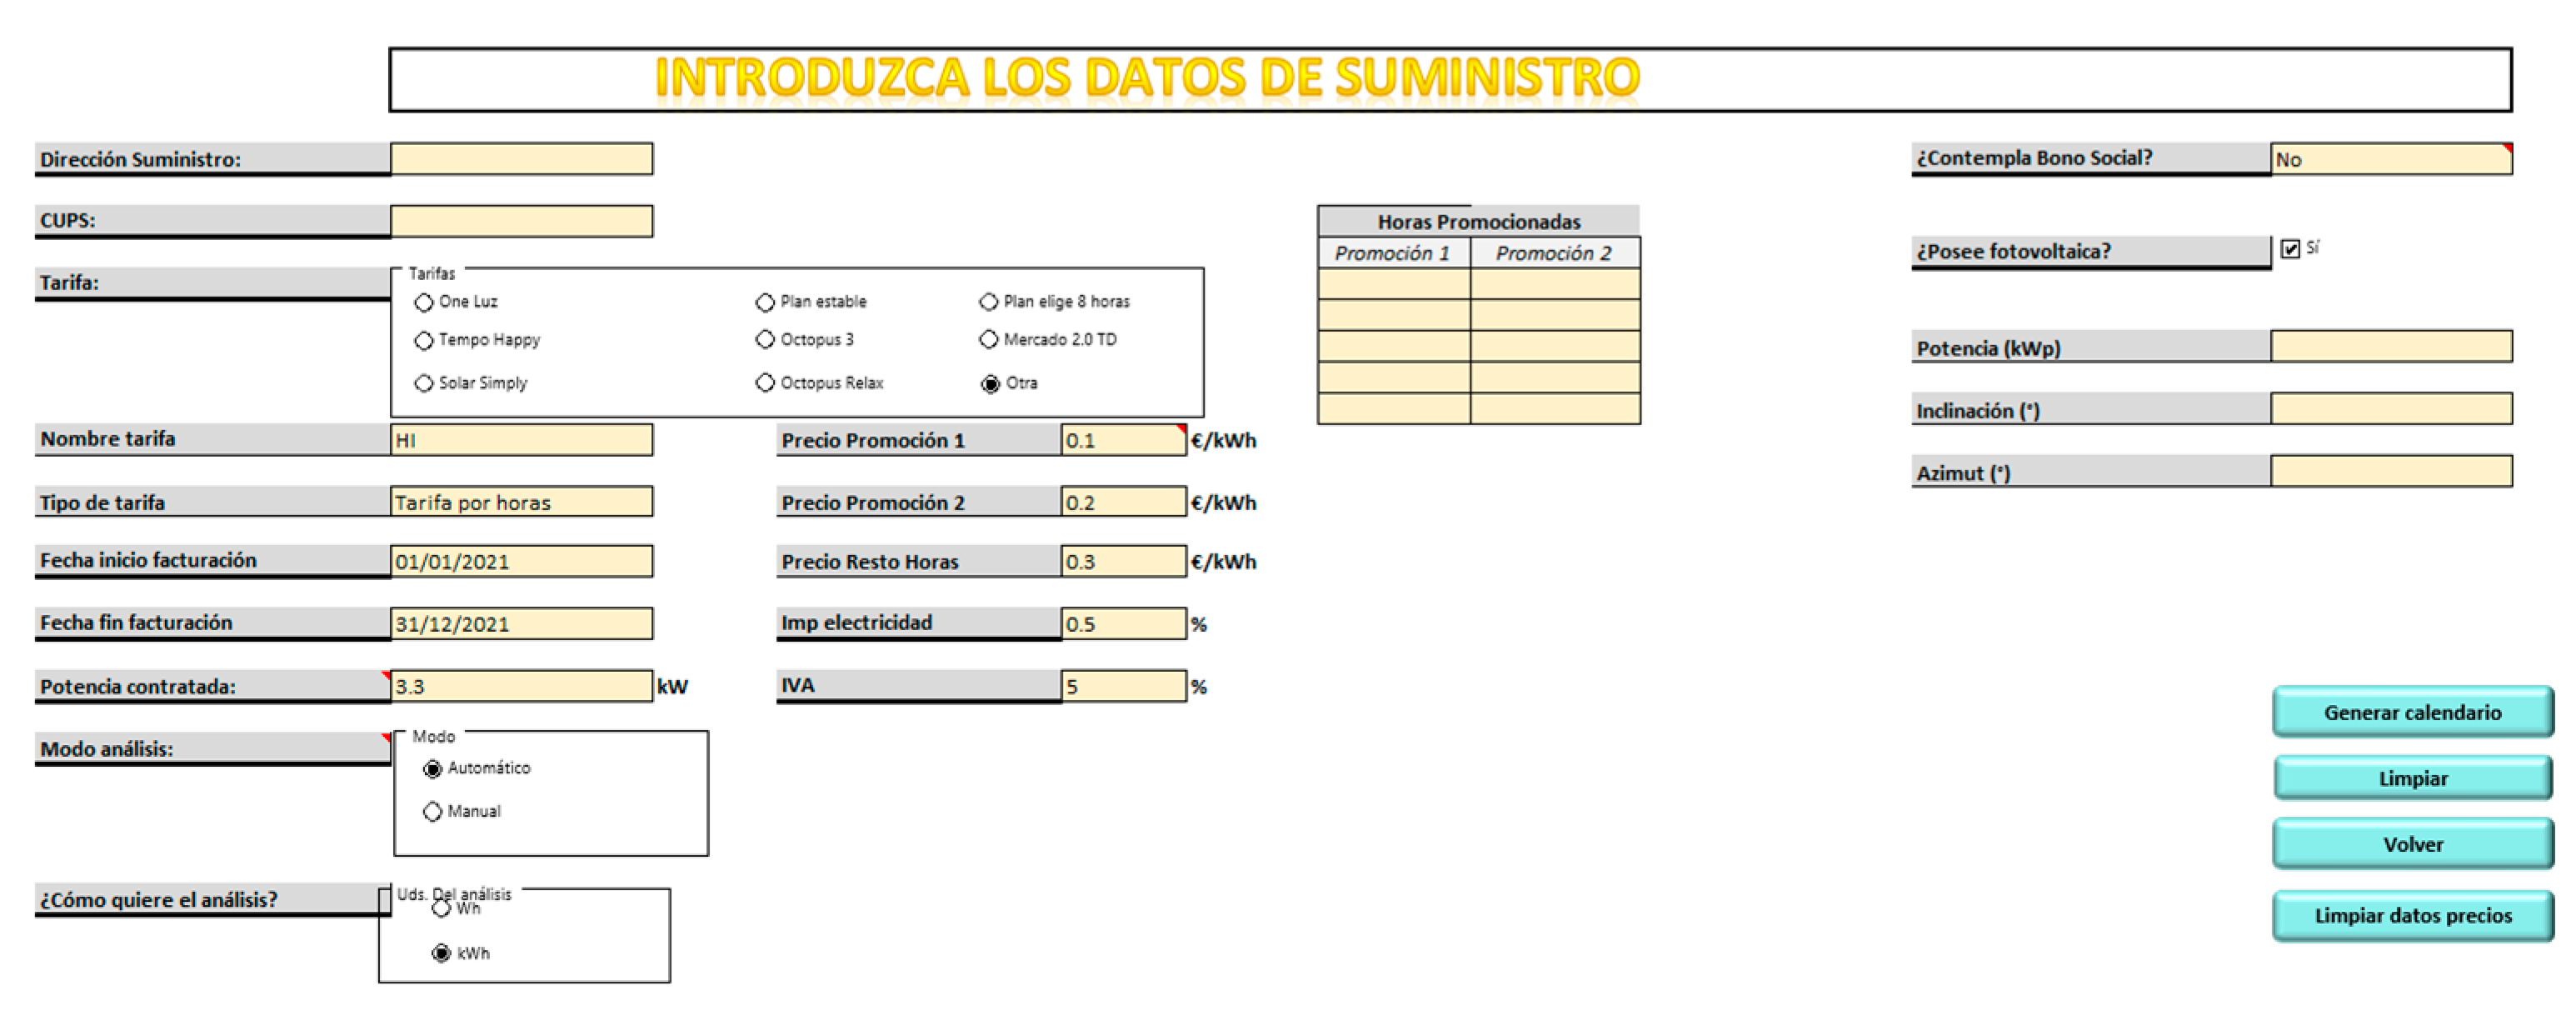
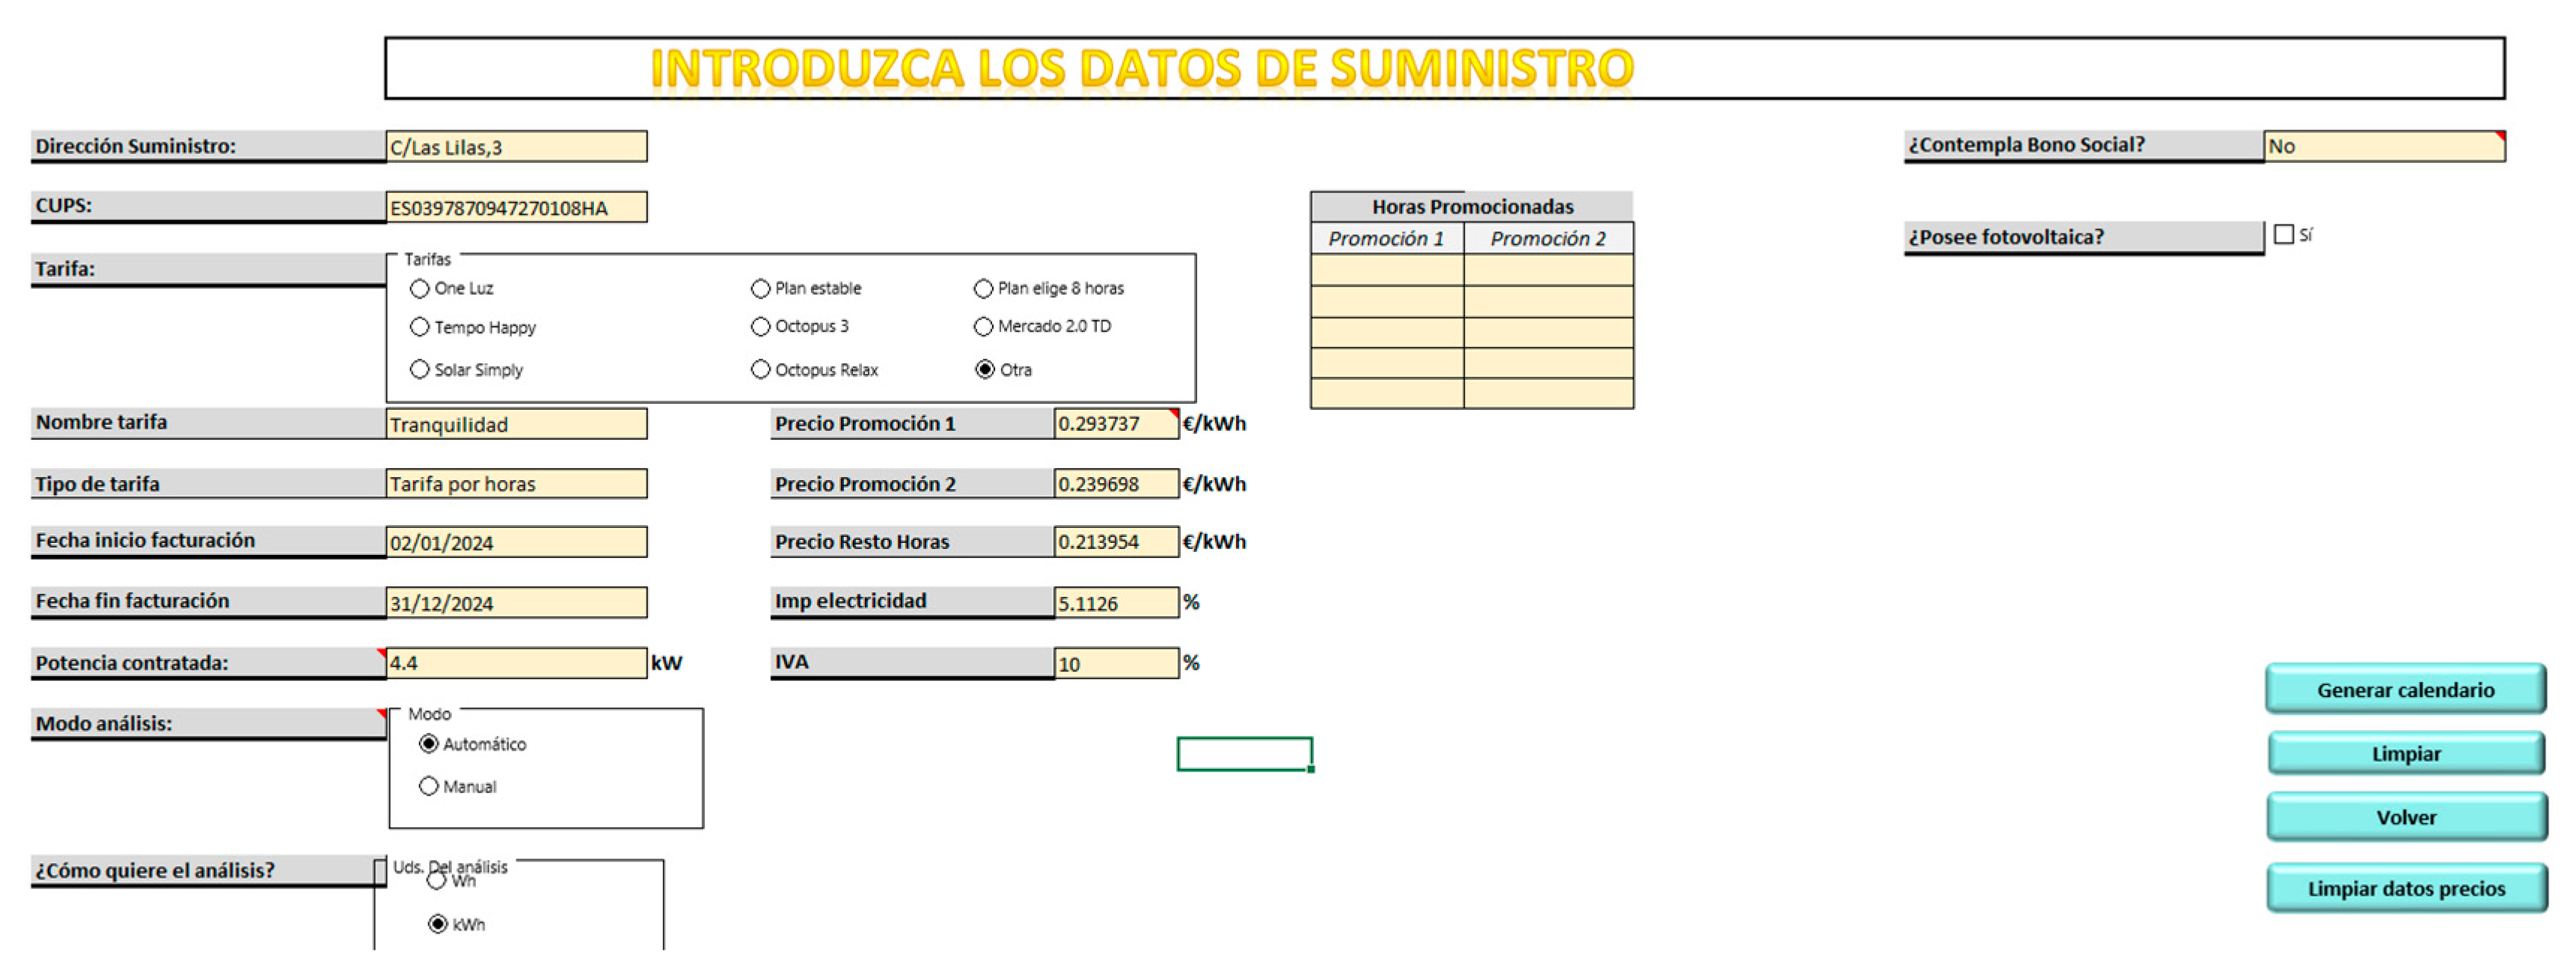
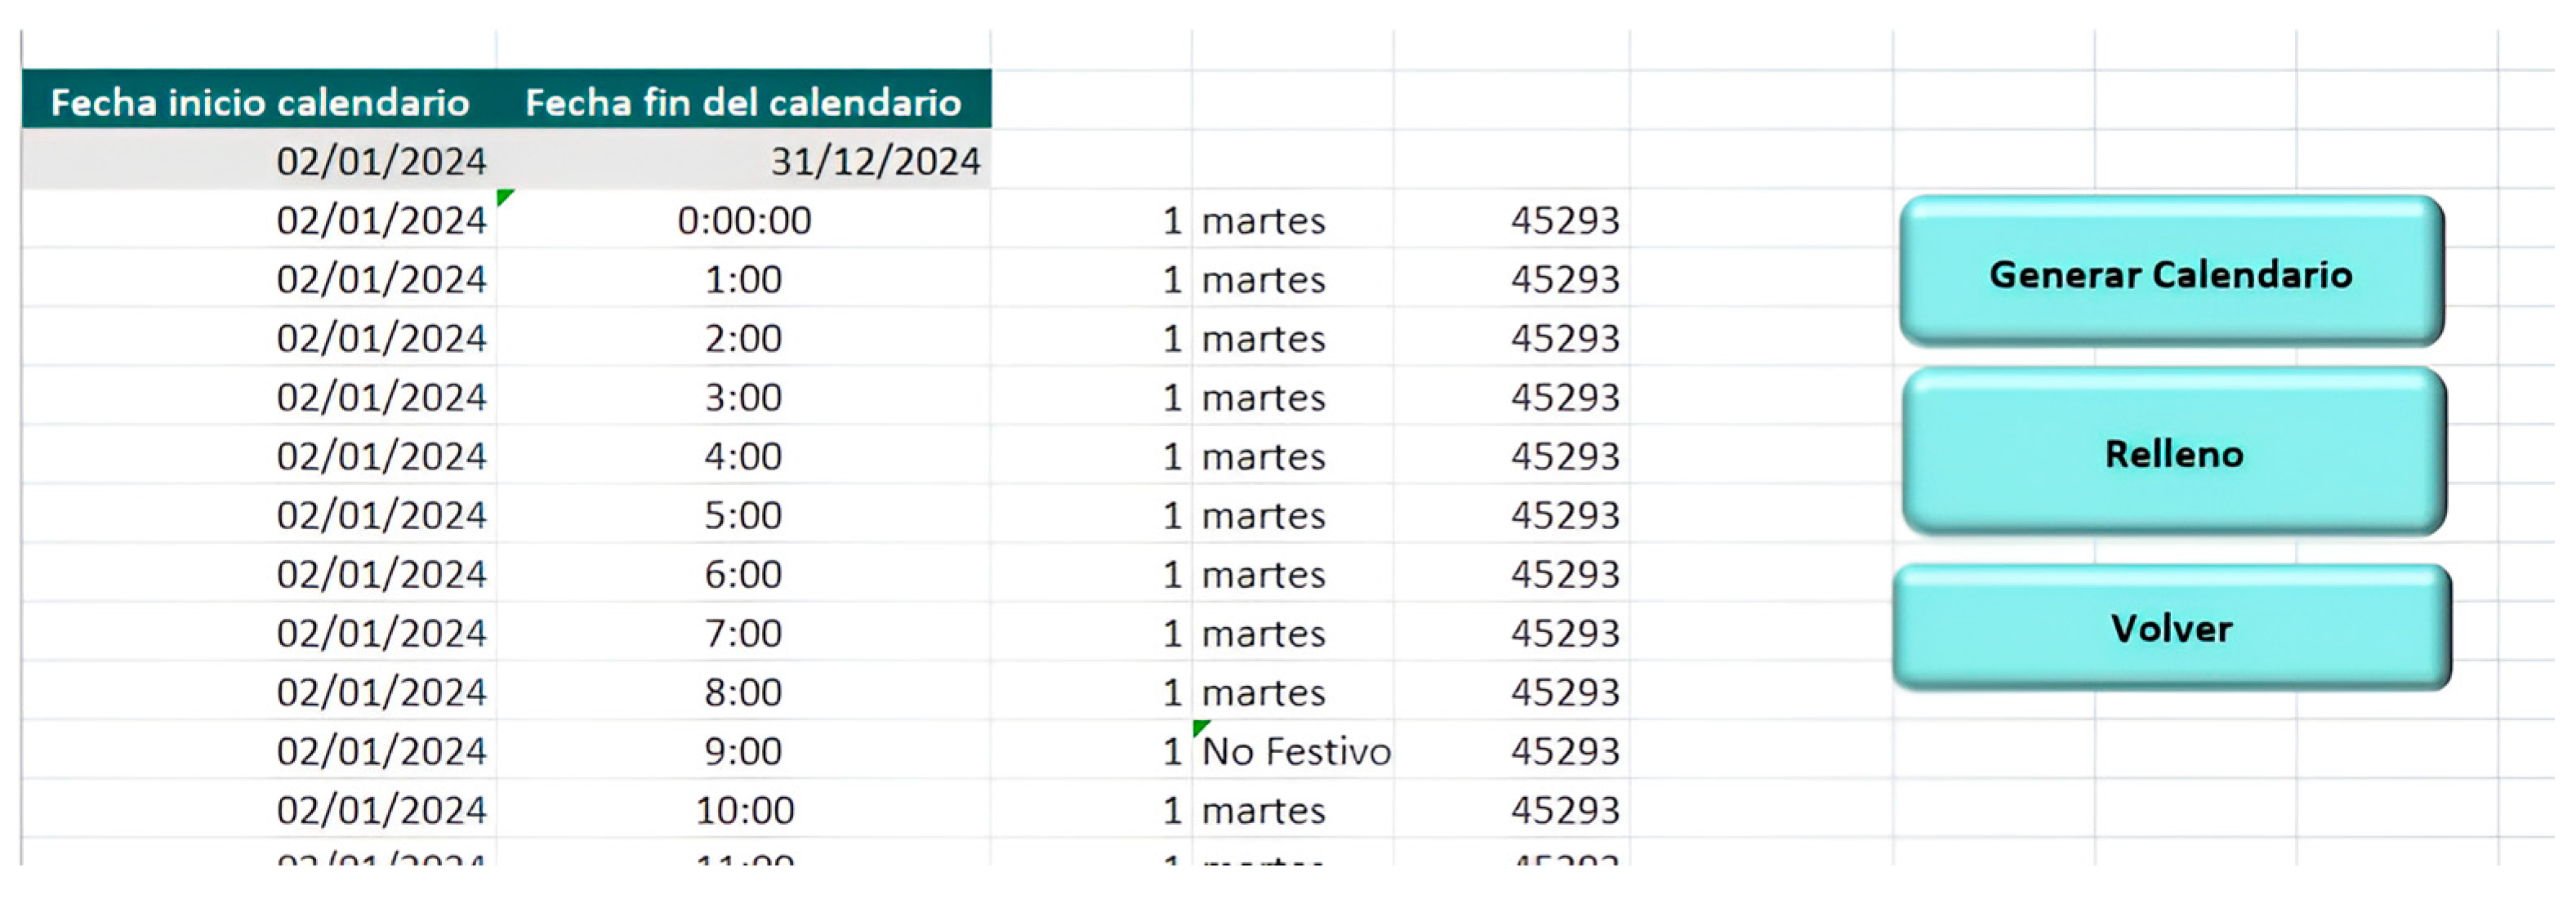
  • Data entry: This section, of which a screenshot is shown in Figure 8 and Figure 9, is the starting point from which all the information required for the analysis is collected. Here, the user is asked to enter the customer’s personal data, such as name, address and contact details. In addition, data specific to the installation under study is collected, which could include information on the location of the installation, the type of building (residential, commercial, industrial), the contracted power, the type of tariff, whether they had a social bonus, a photovoltaic installation, and other relevant details. These data provide the necessary context for an accurate analysis of the customer’s electricity situation.
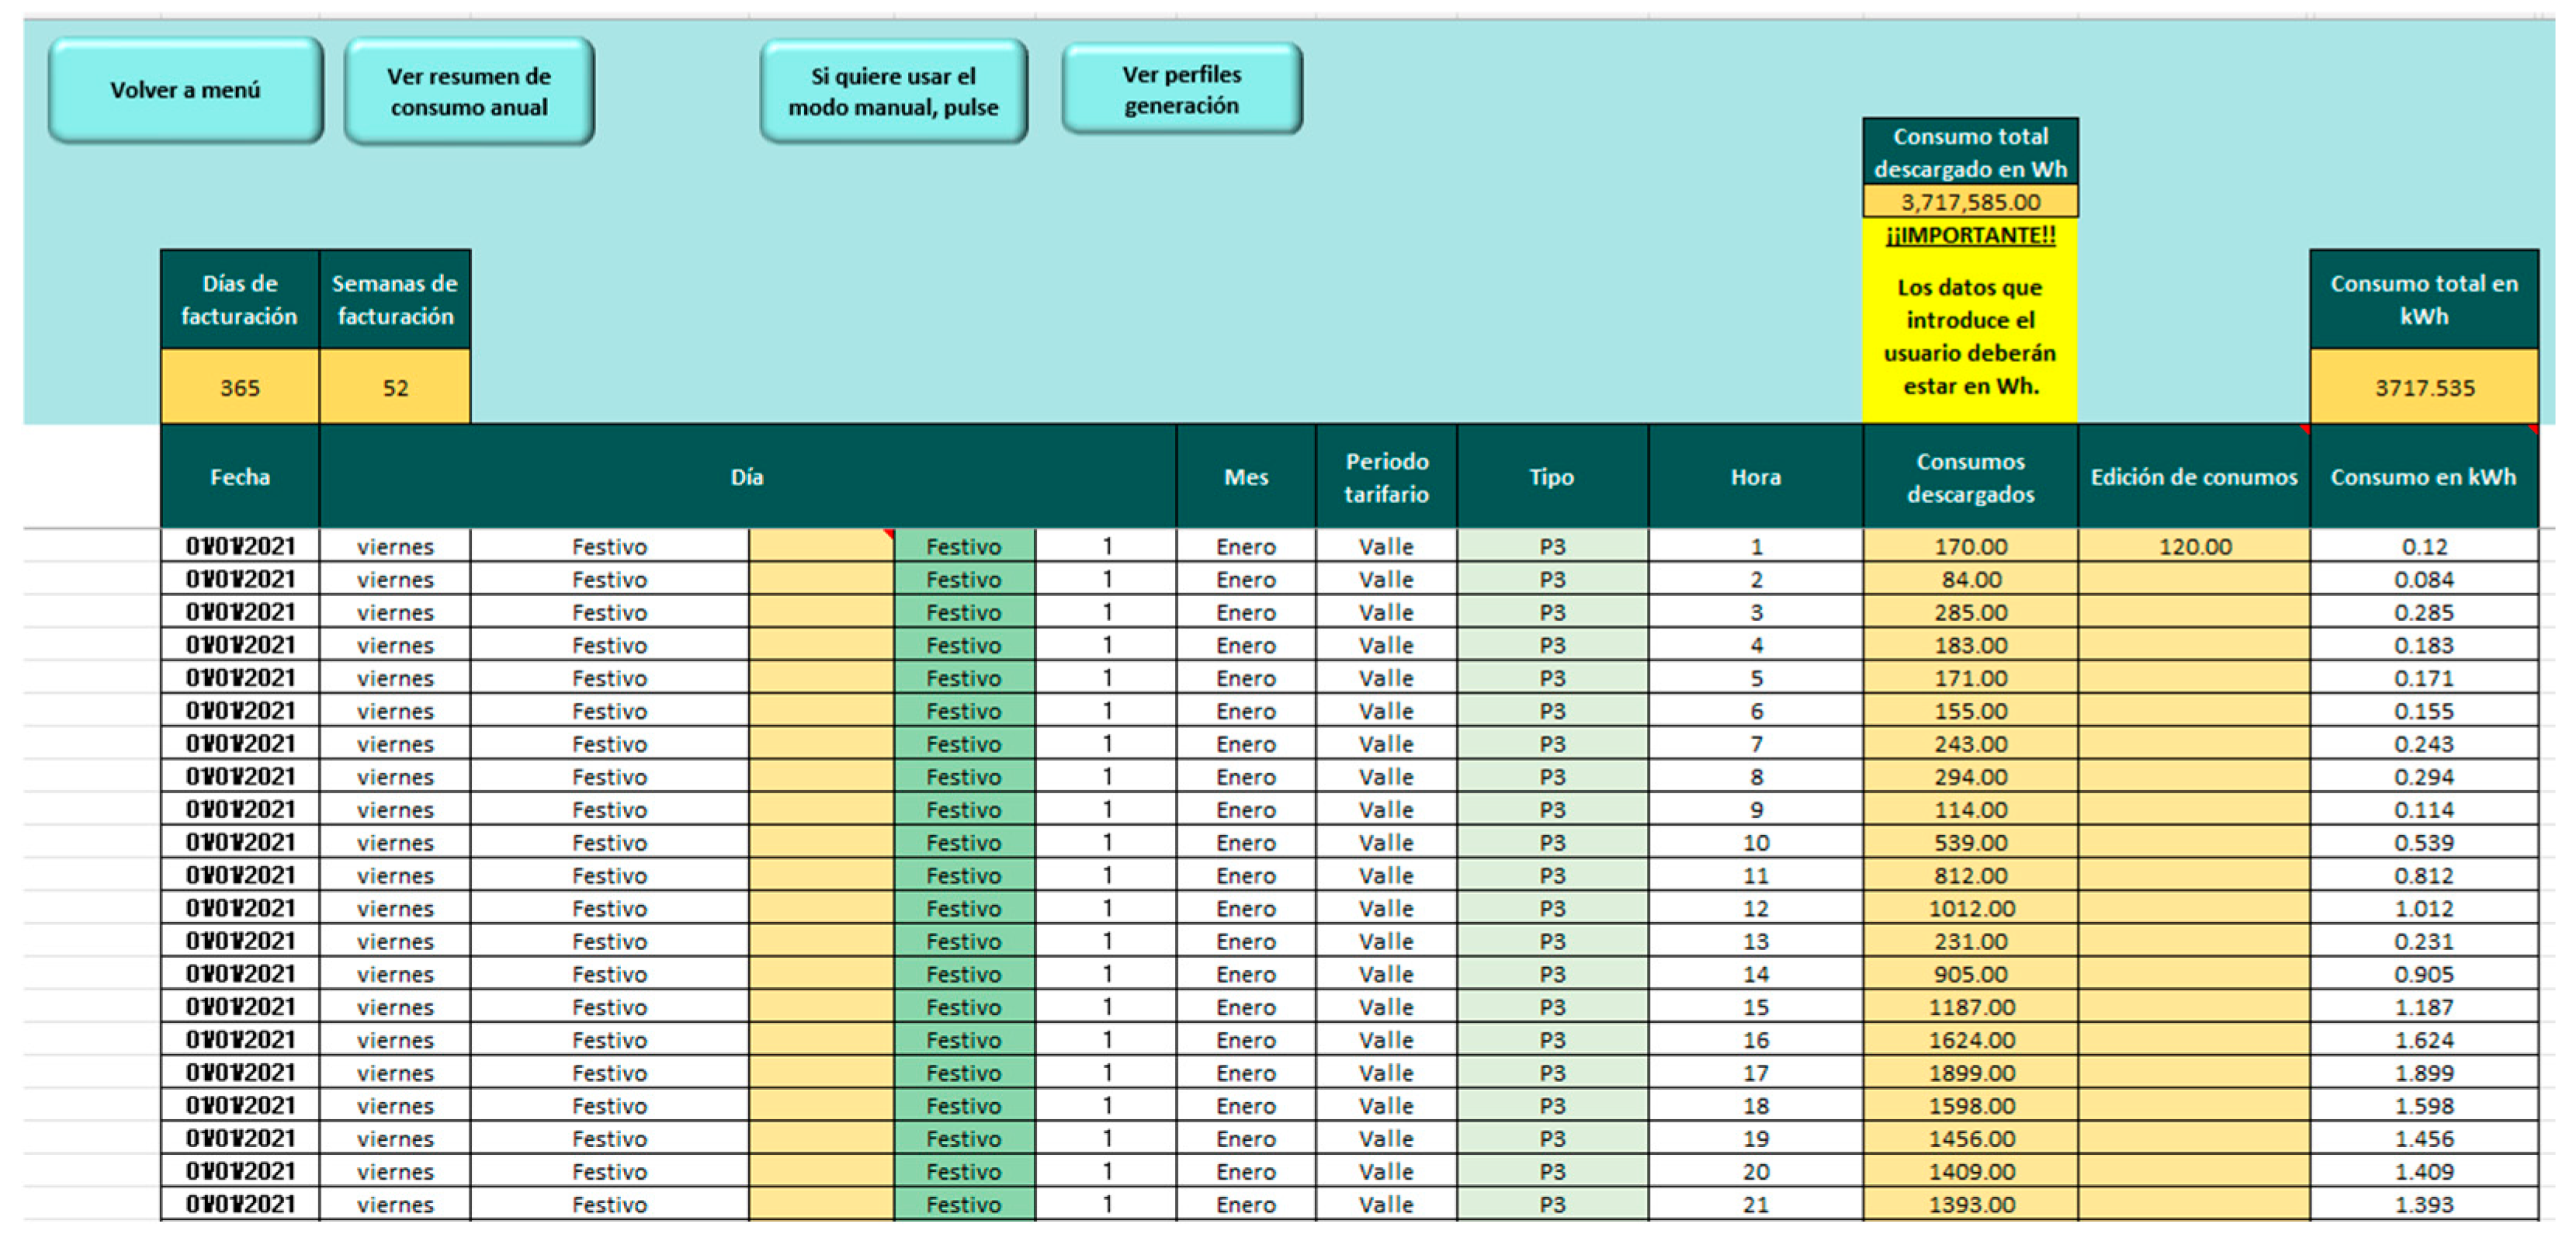
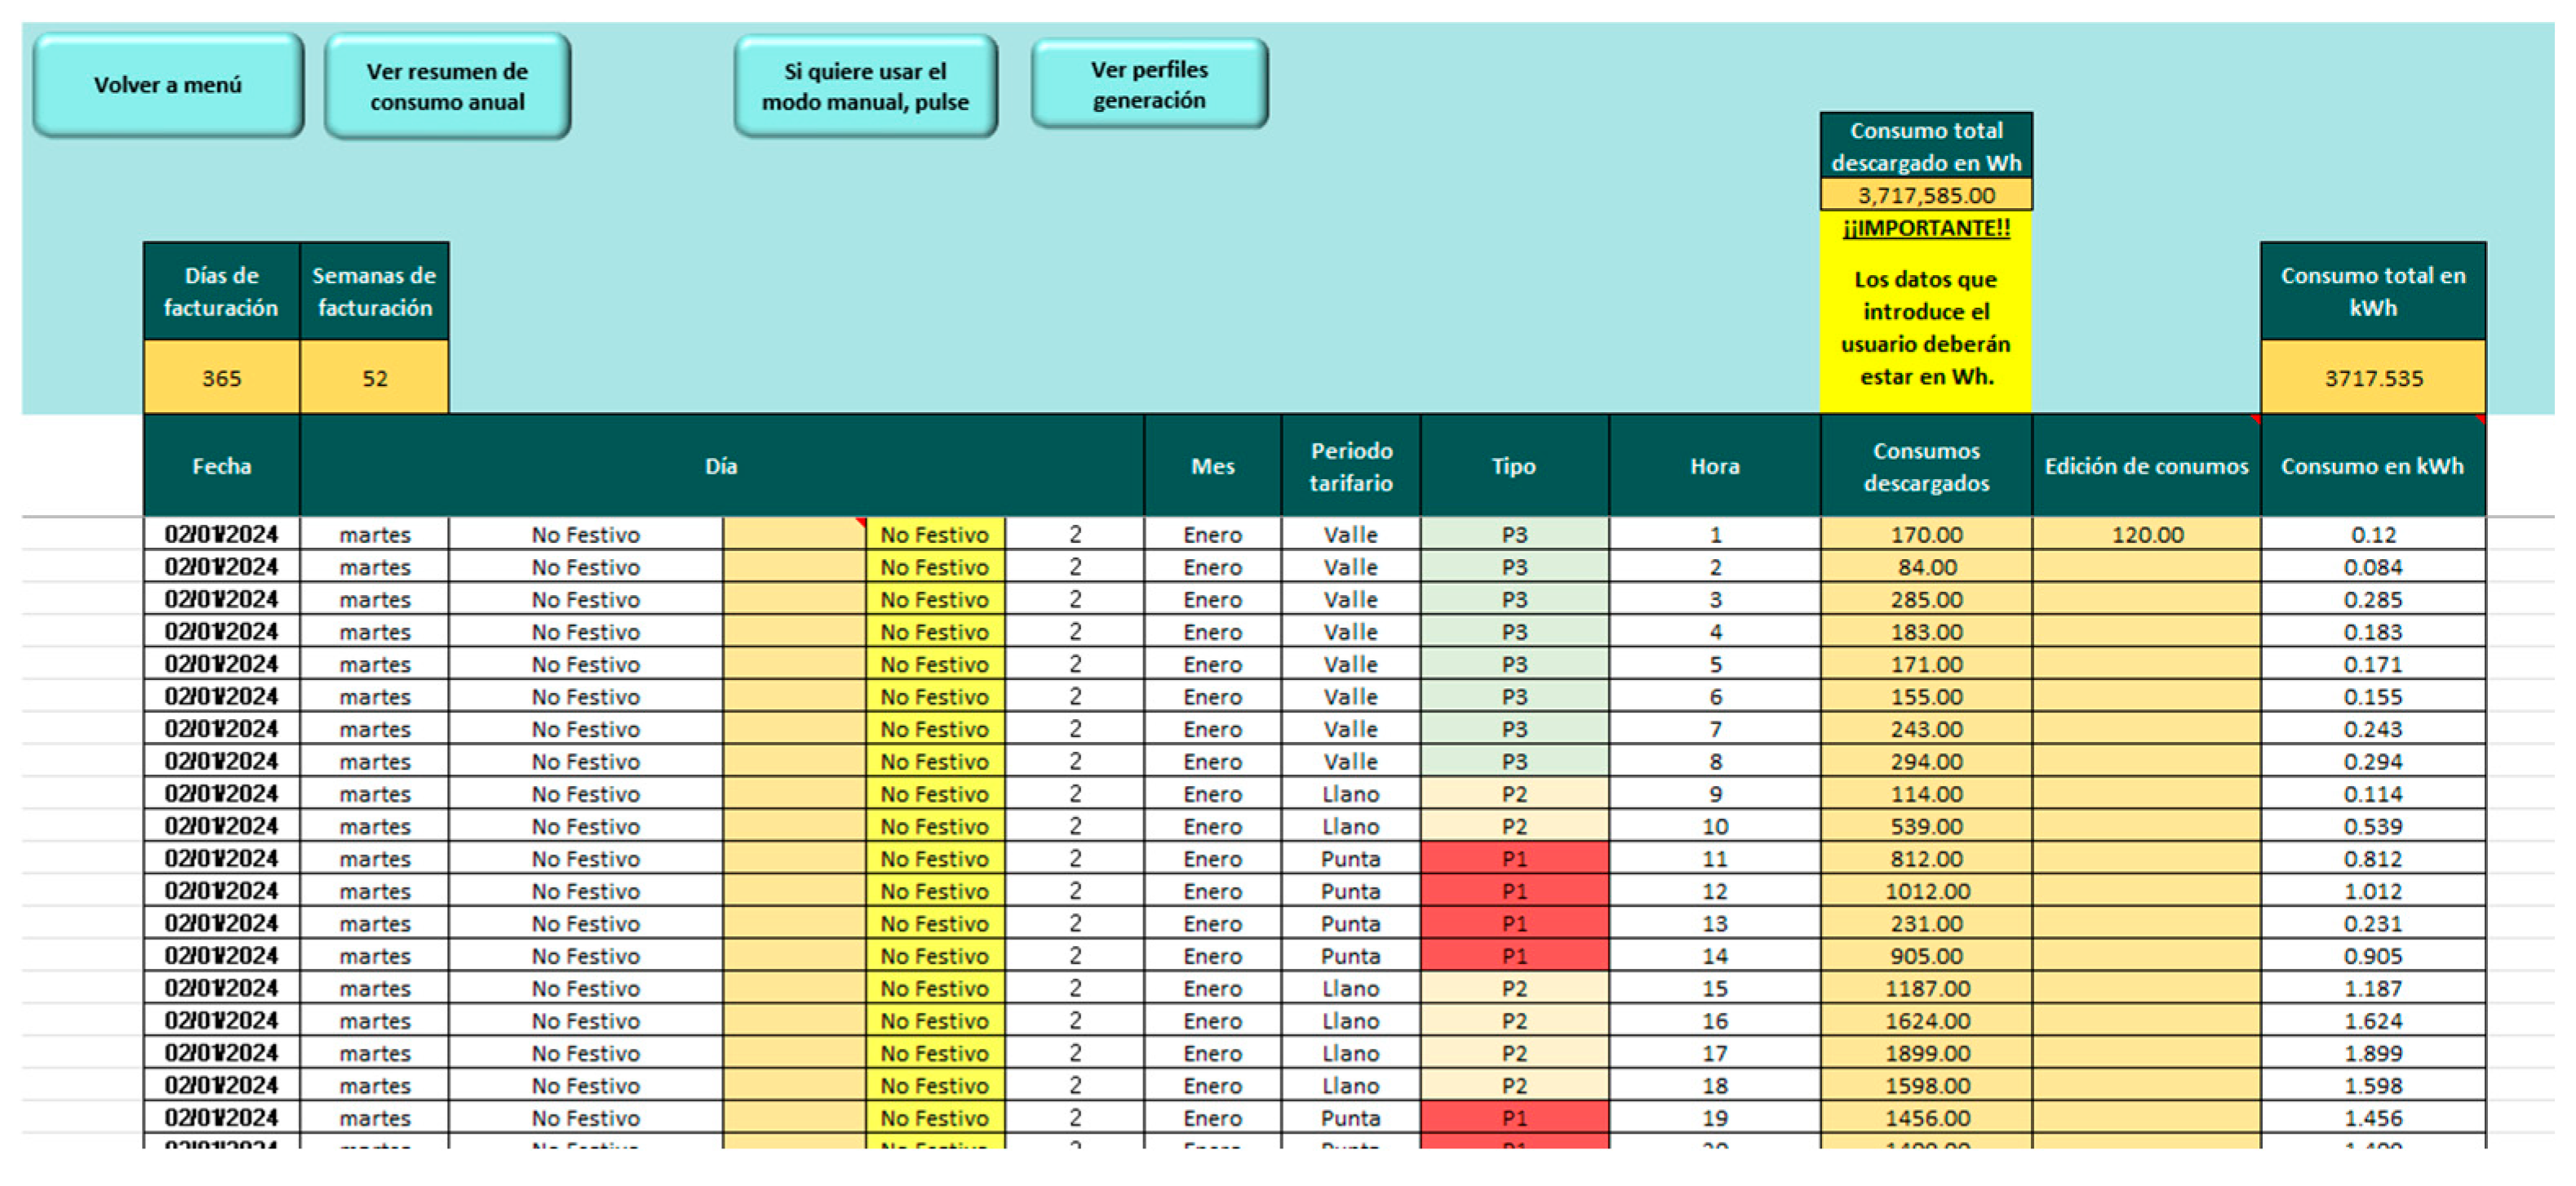
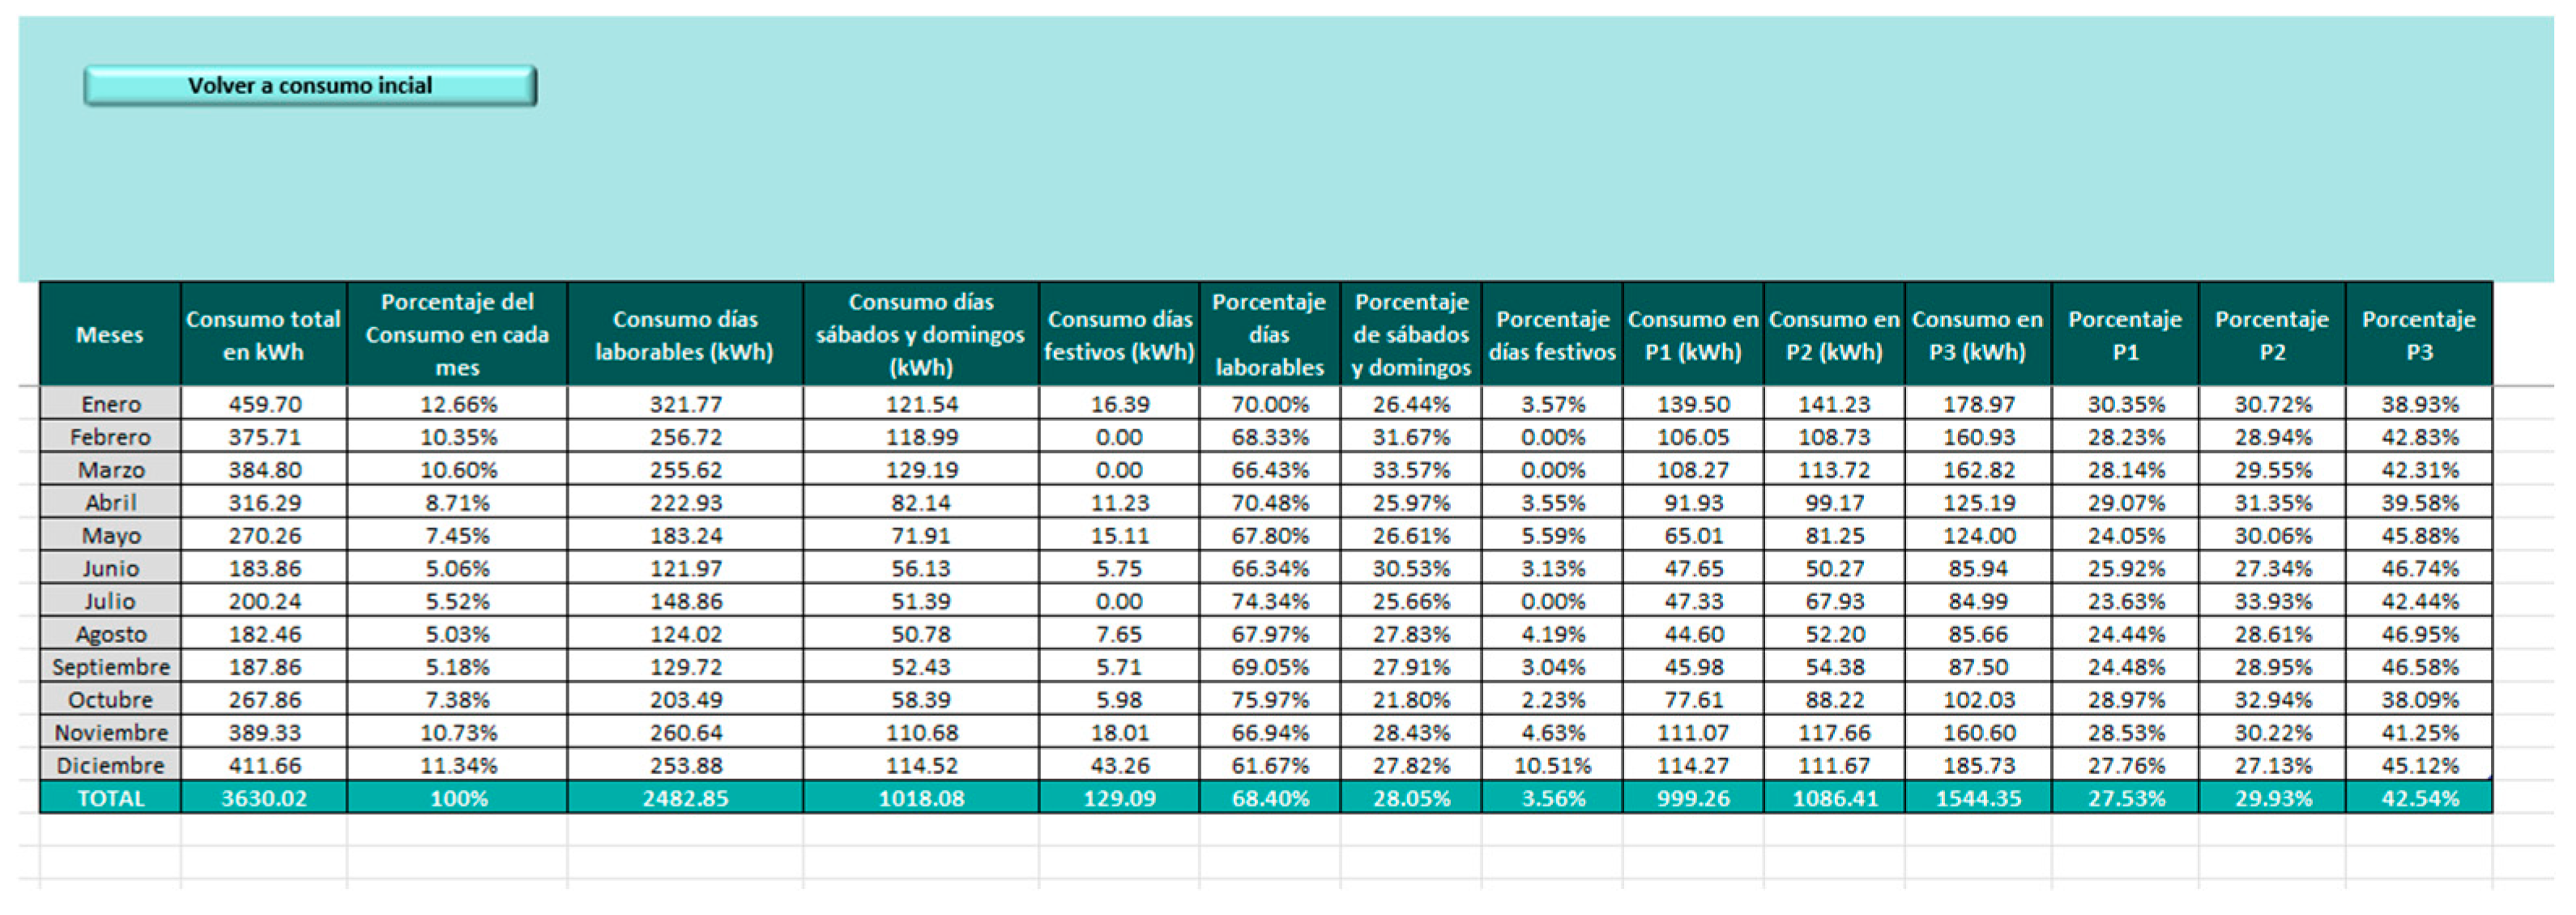
  • Consumption: In this section, electricity consumption data are collected, as can be seen in Figure 10. The user must enter detailed information on monthly or annual consumption, specifying the consumptions obtained from his distributor. This allows for a detailed analysis of electricity consumption patterns over time. In addition, the tariff period to which each meter reading belongs can be considered, which is crucial to accurately calculate the costs associated with electricity consumption. In addition, a summary is made that shows in which months and on which days, working days or holidays, consumption is higher in percentage terms.
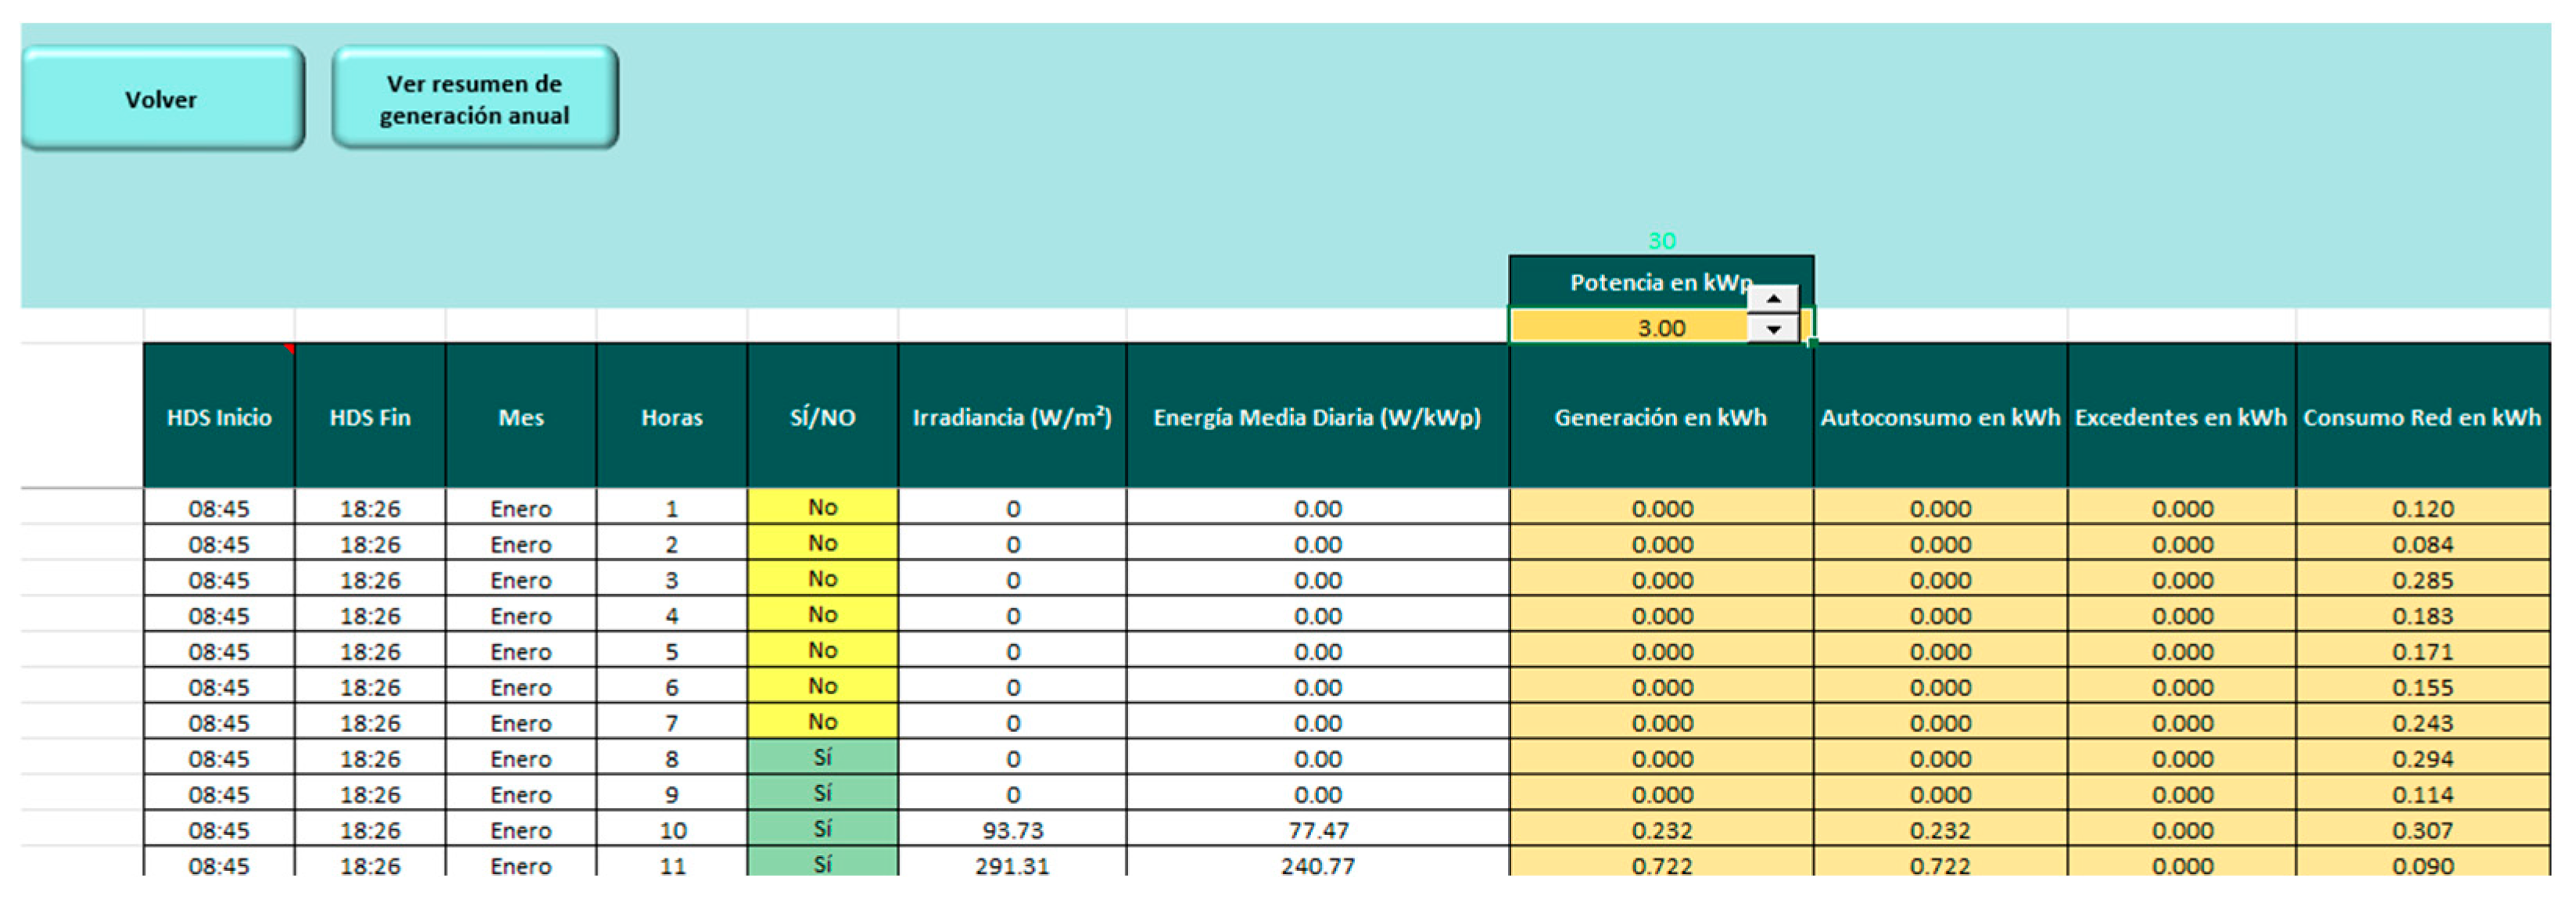
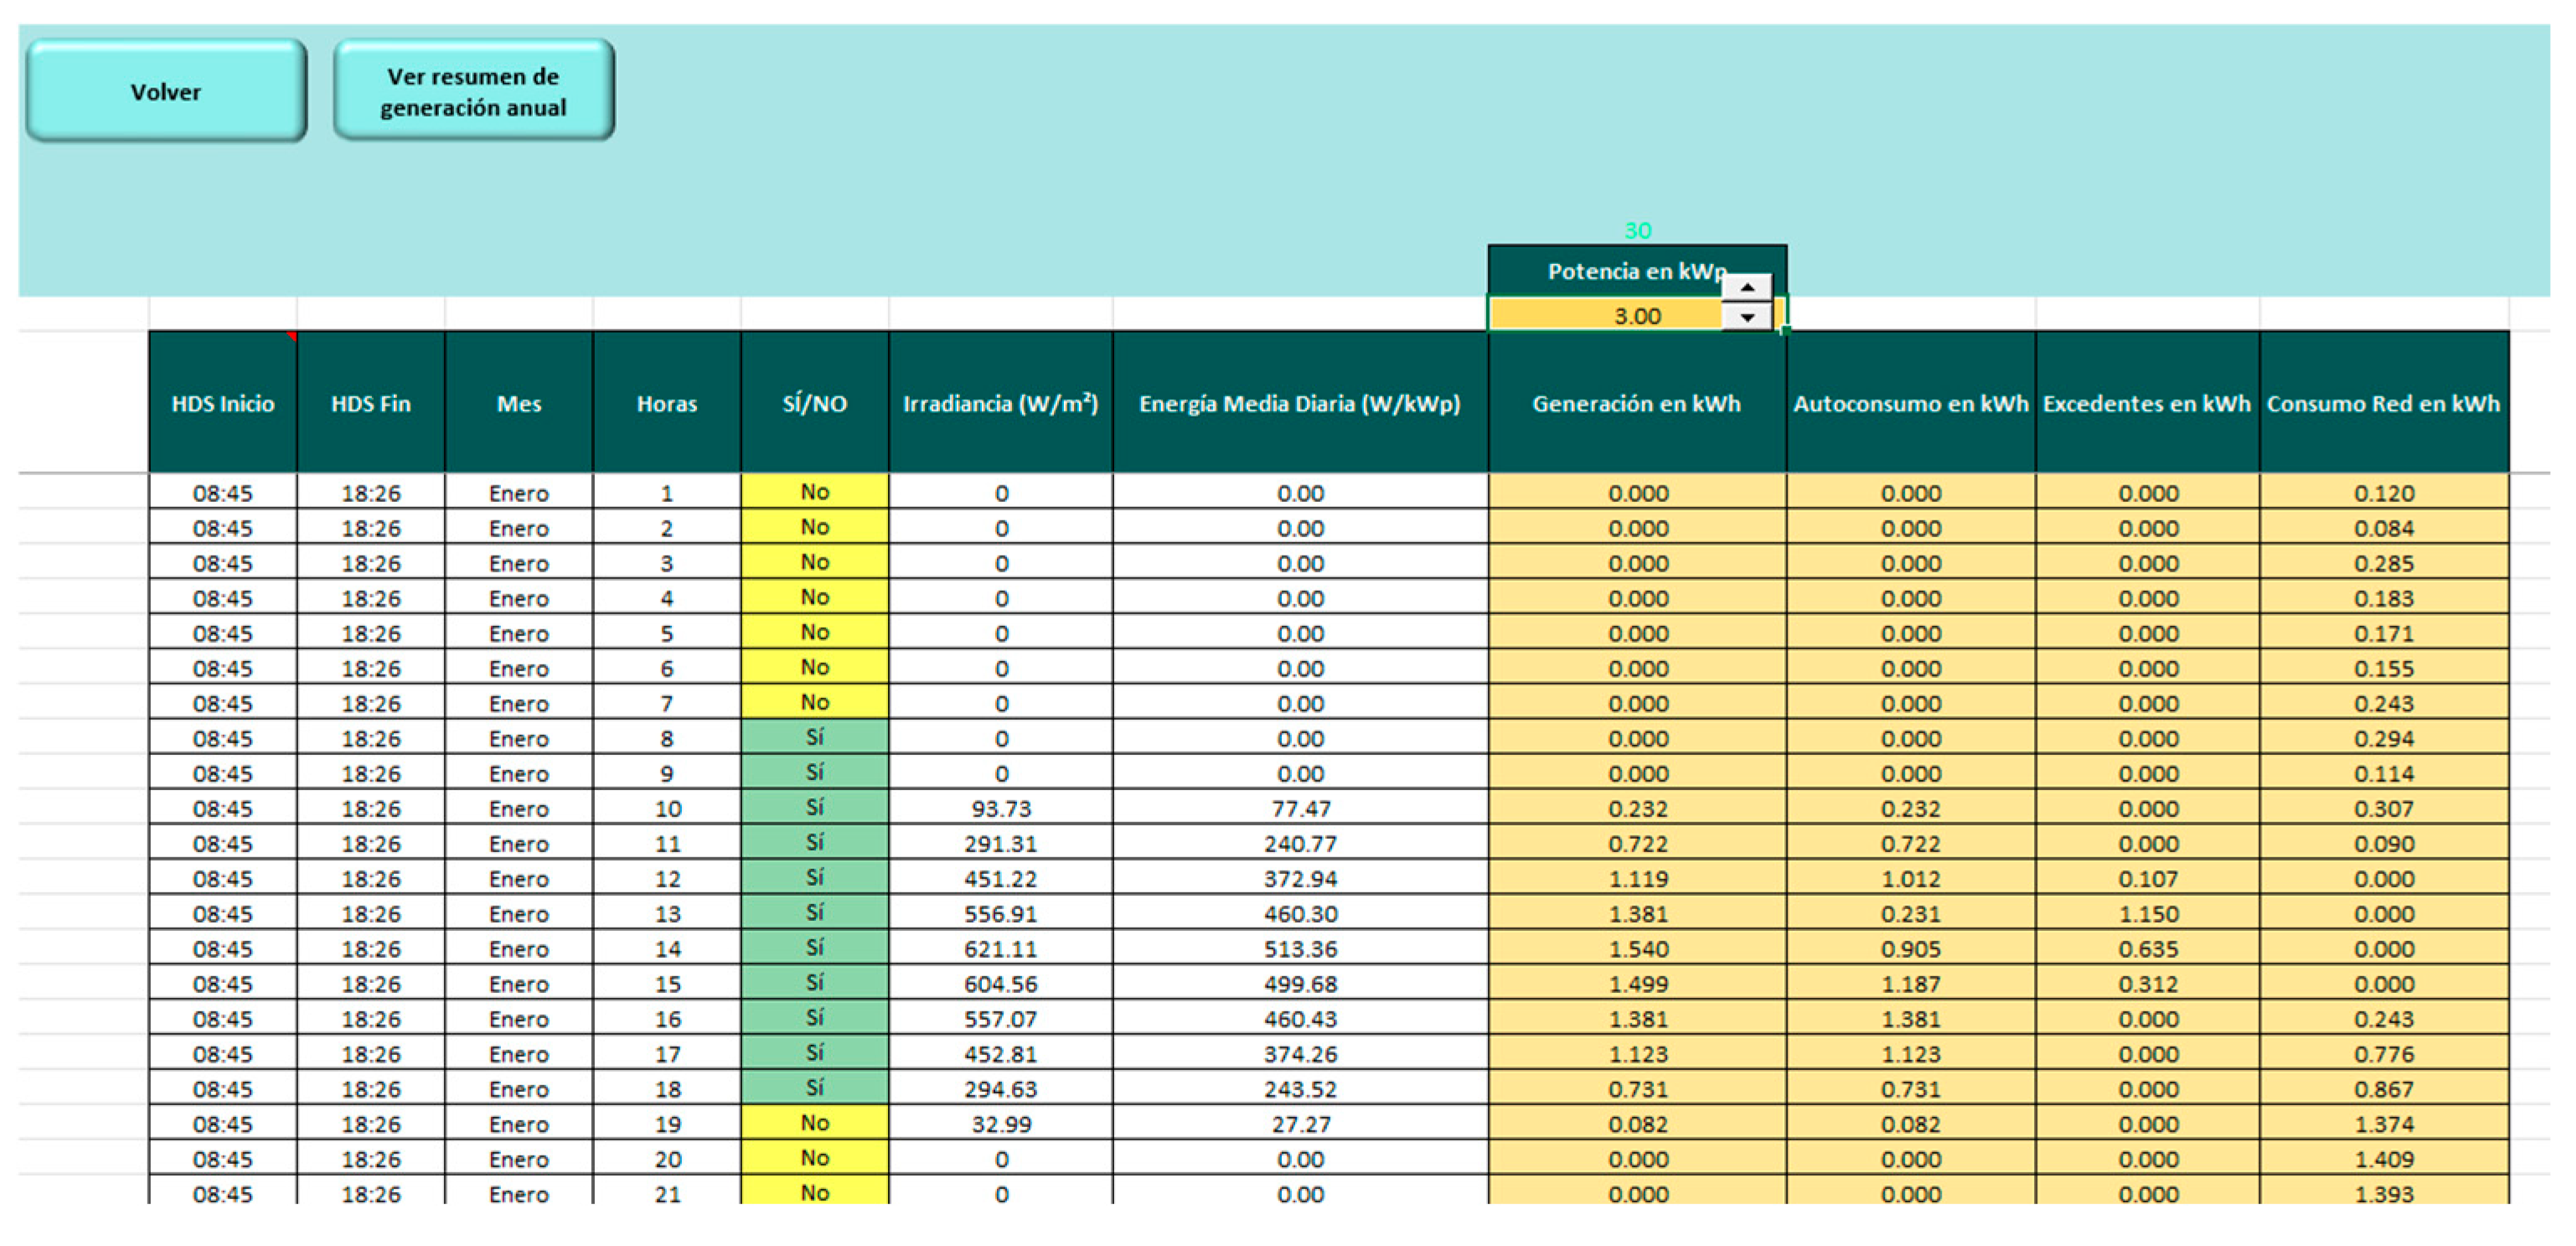
  • Generation: In this part, shown in Figure 11, the user is asked to enter the desired peak power for the PV installation, which allows the estimated hourly production of solar energy to be calculated. In addition, the self-consumption of solar energy, the surplus of generated energy that is fed into the grid and the consumption of energy from the grid when the solar generation is not sufficient to meet the demand are calculated. These calculations, which take into account tilt, orientation, latitude and longitude, are performed using Visual Basic, which ensures the accuracy of the calculations.
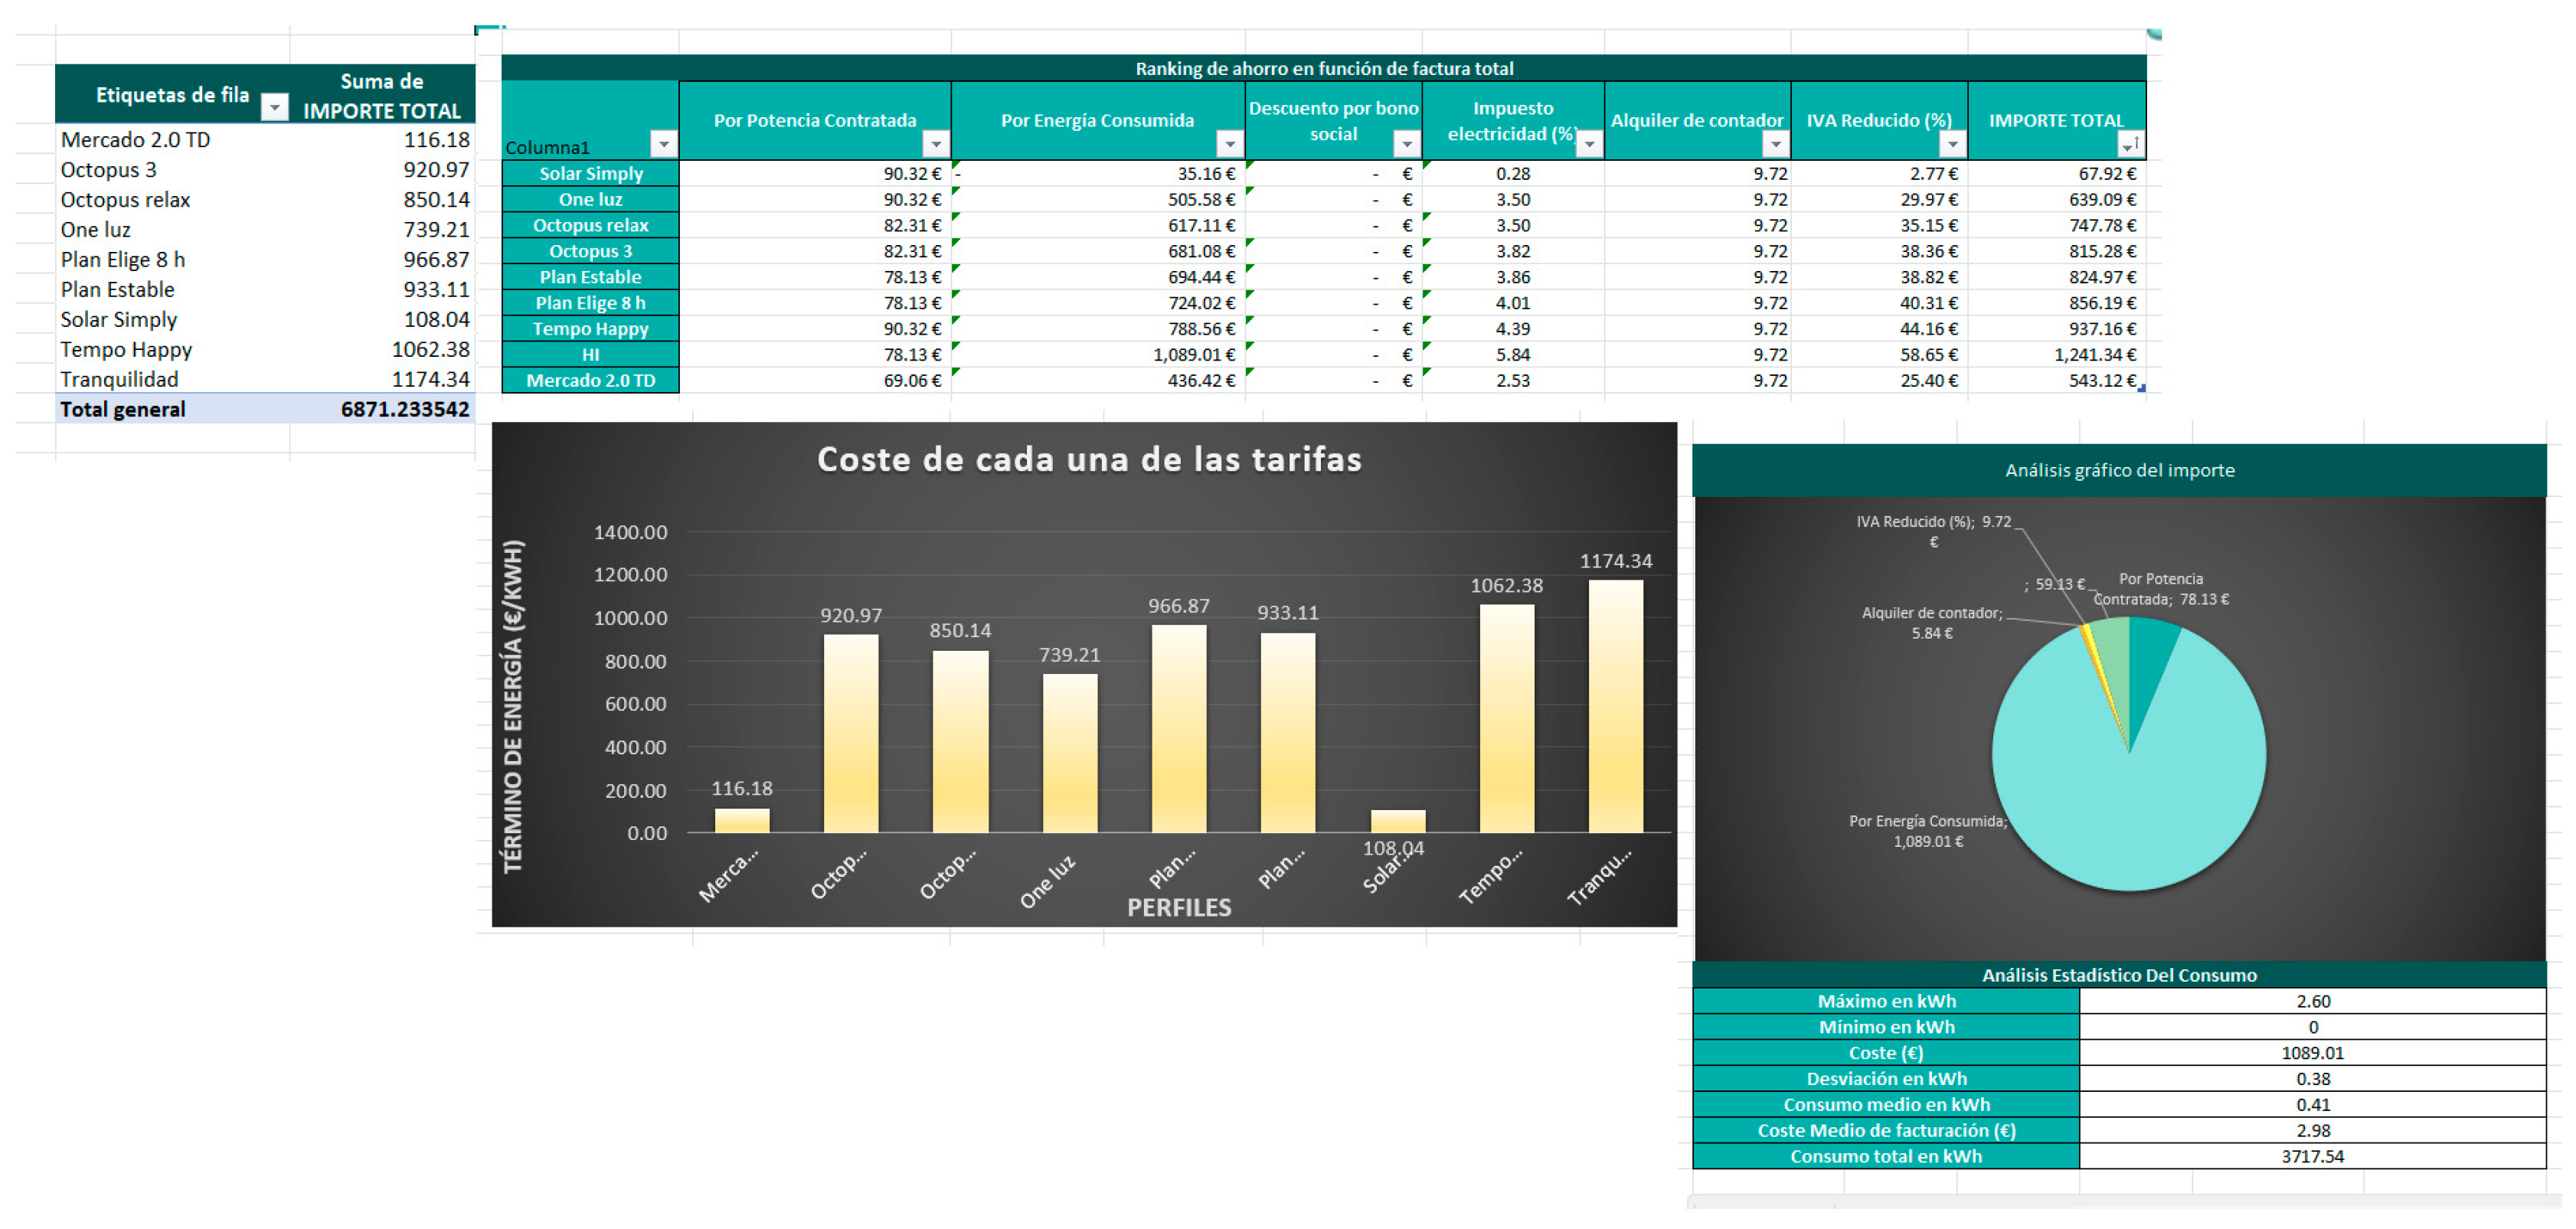
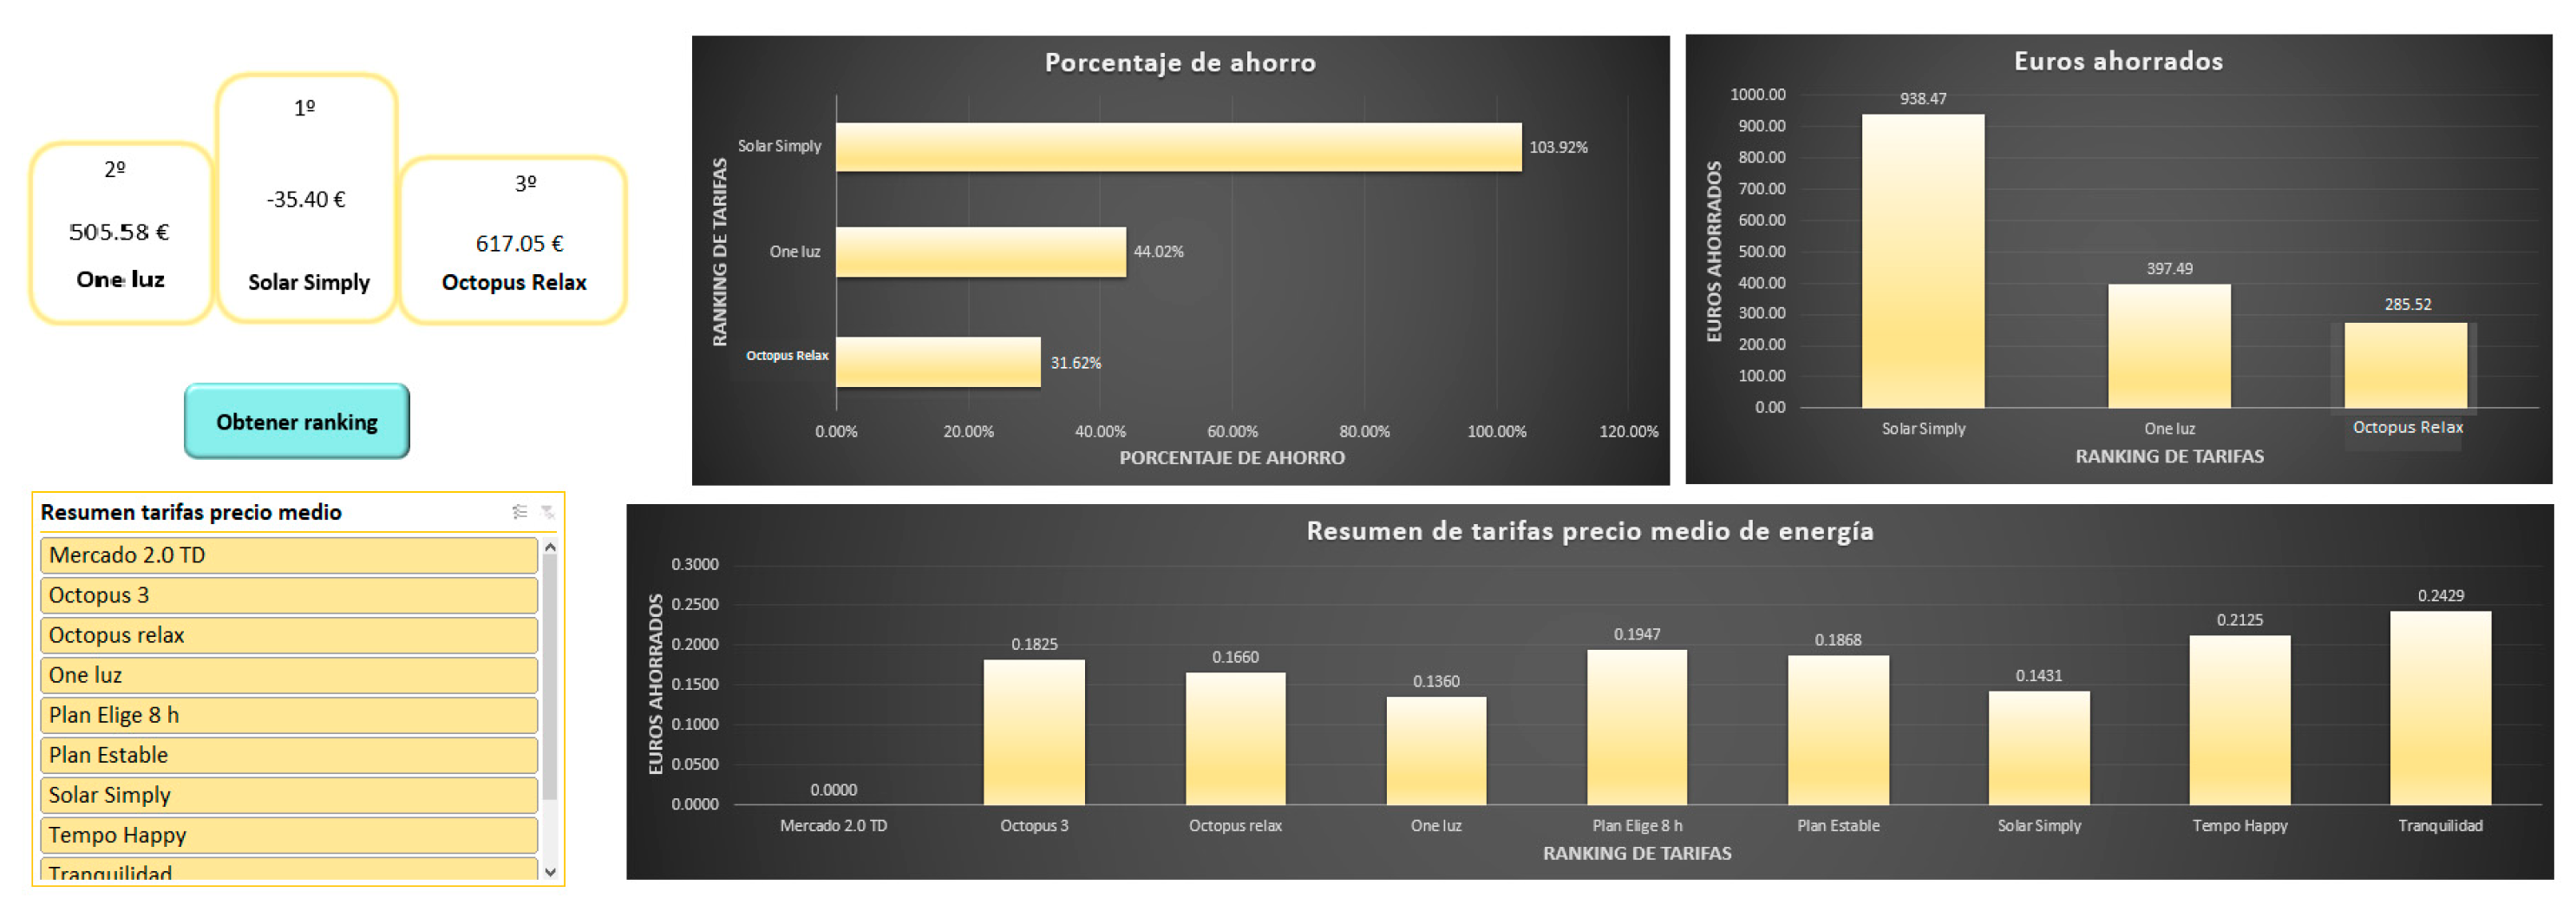
  • Tariff comparator: This section provides the user with a tool to compare the tariffs offered by different electricity companies. The cost of each tariff is calculated based on the consumption entered and the tariffs are ordered from lowest to highest cost, as shown in Figure 12 and Figure 13. This allows the user to make informed decisions on the selection of the most suitable electricity tariff for their needs and budget.
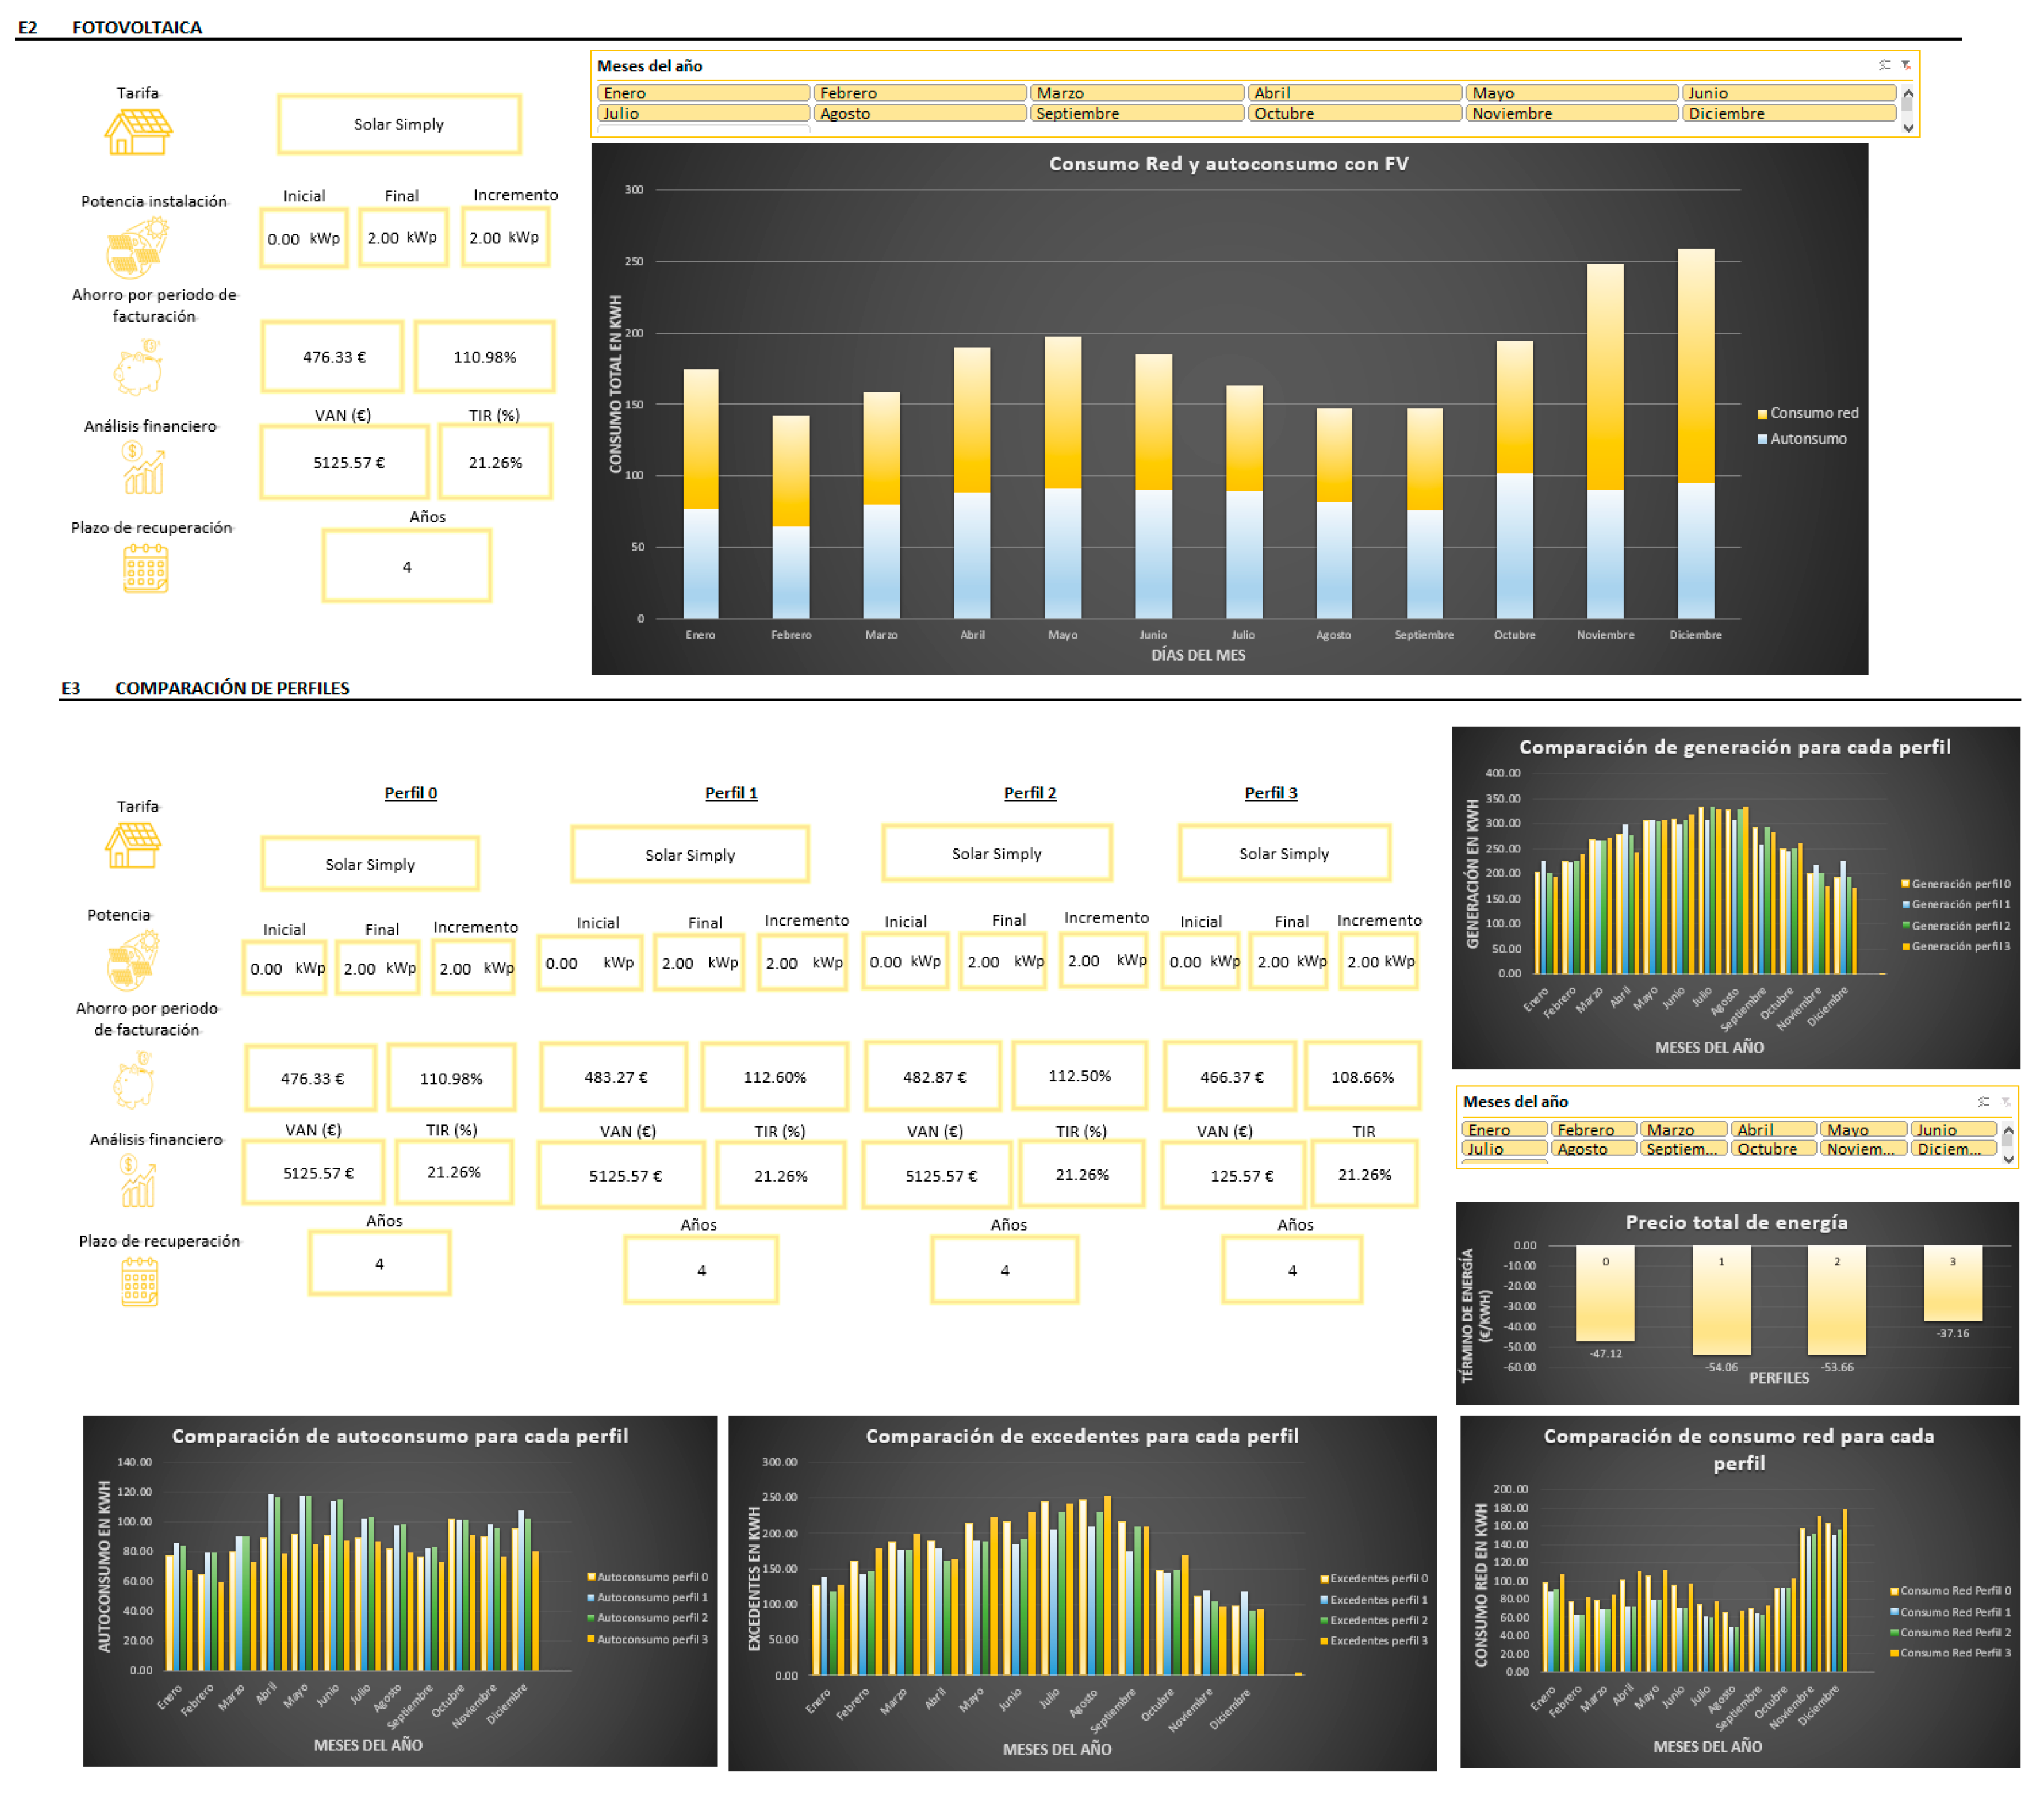
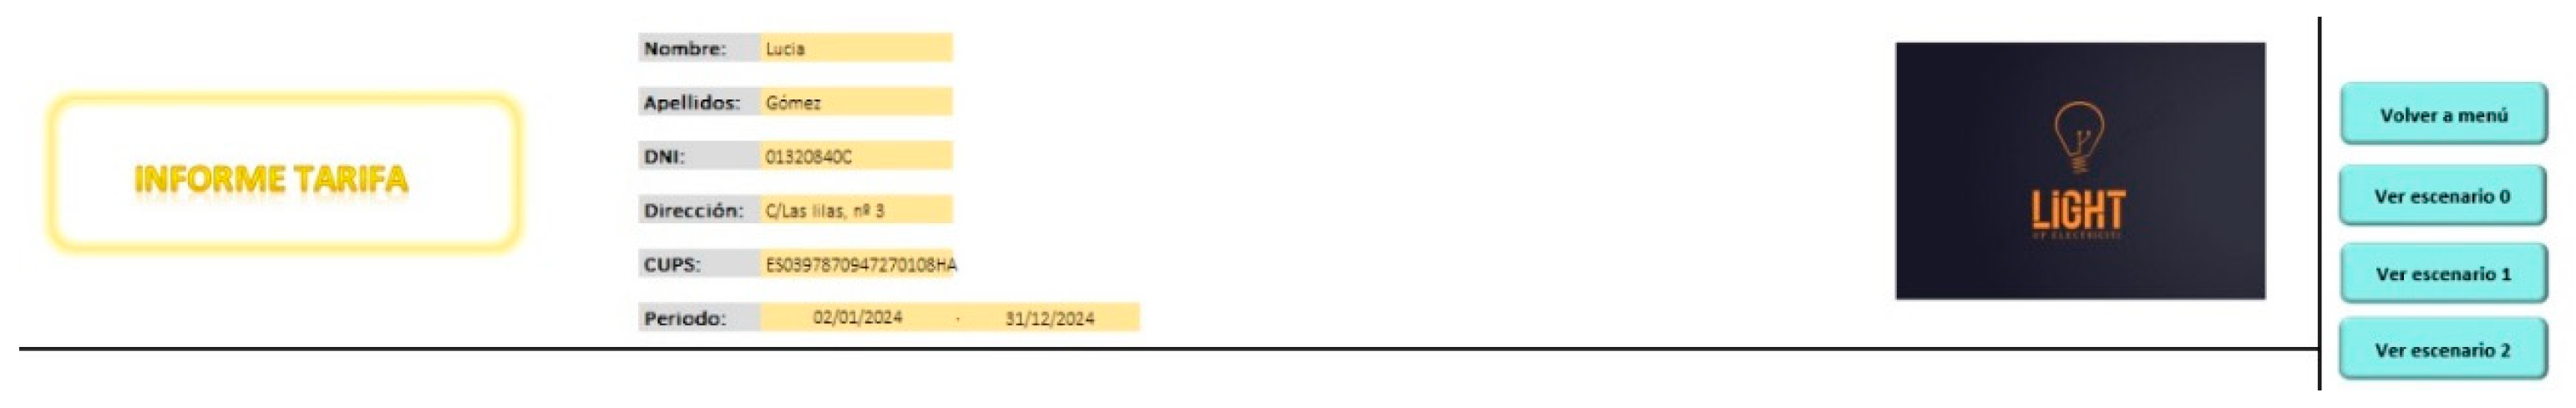
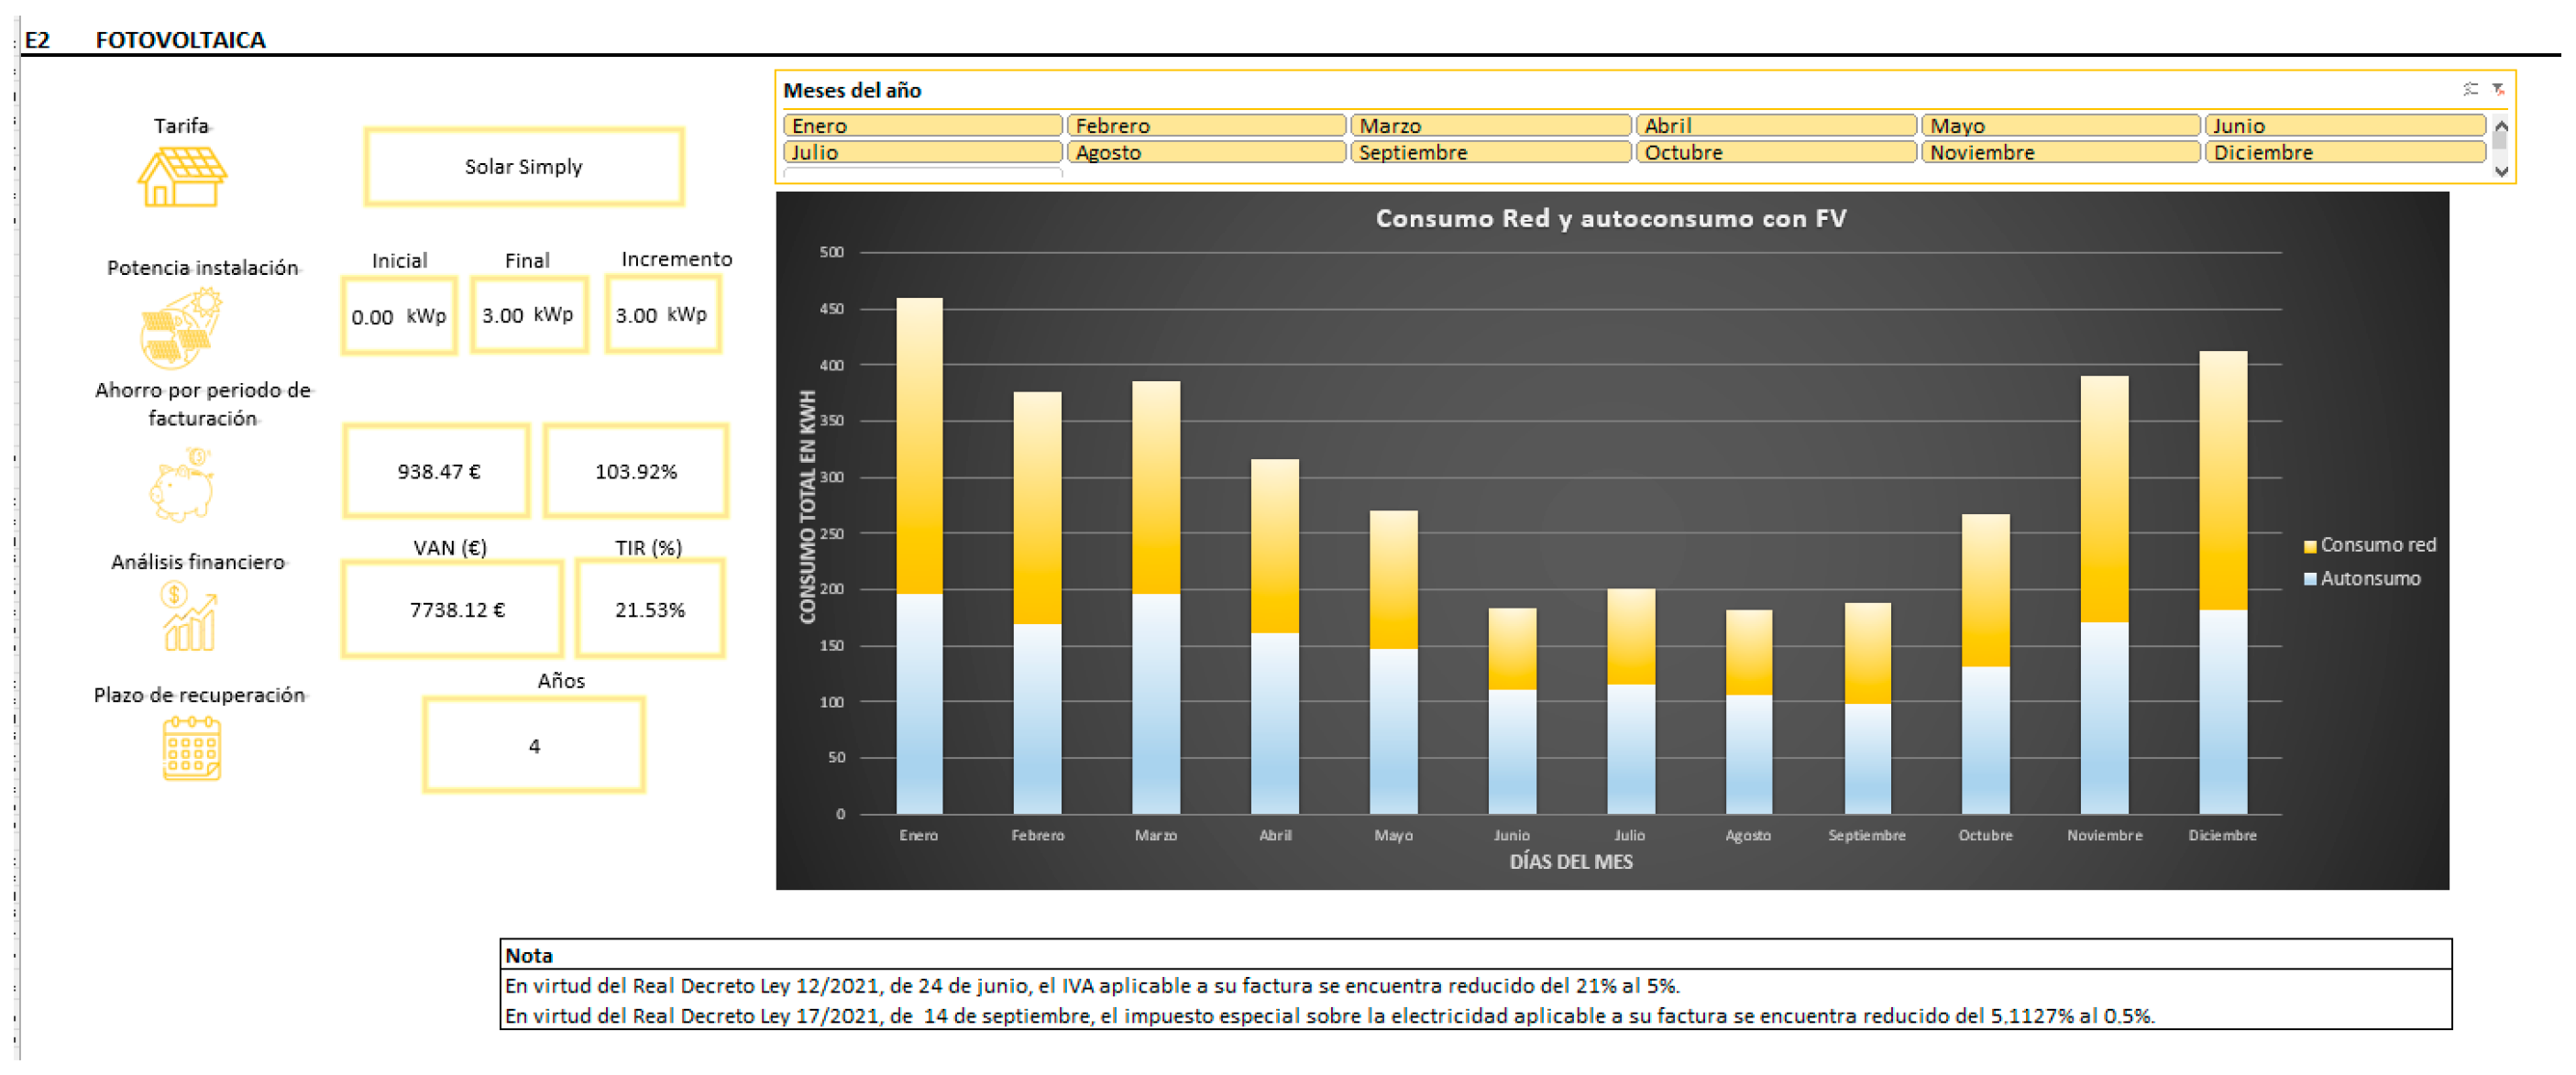
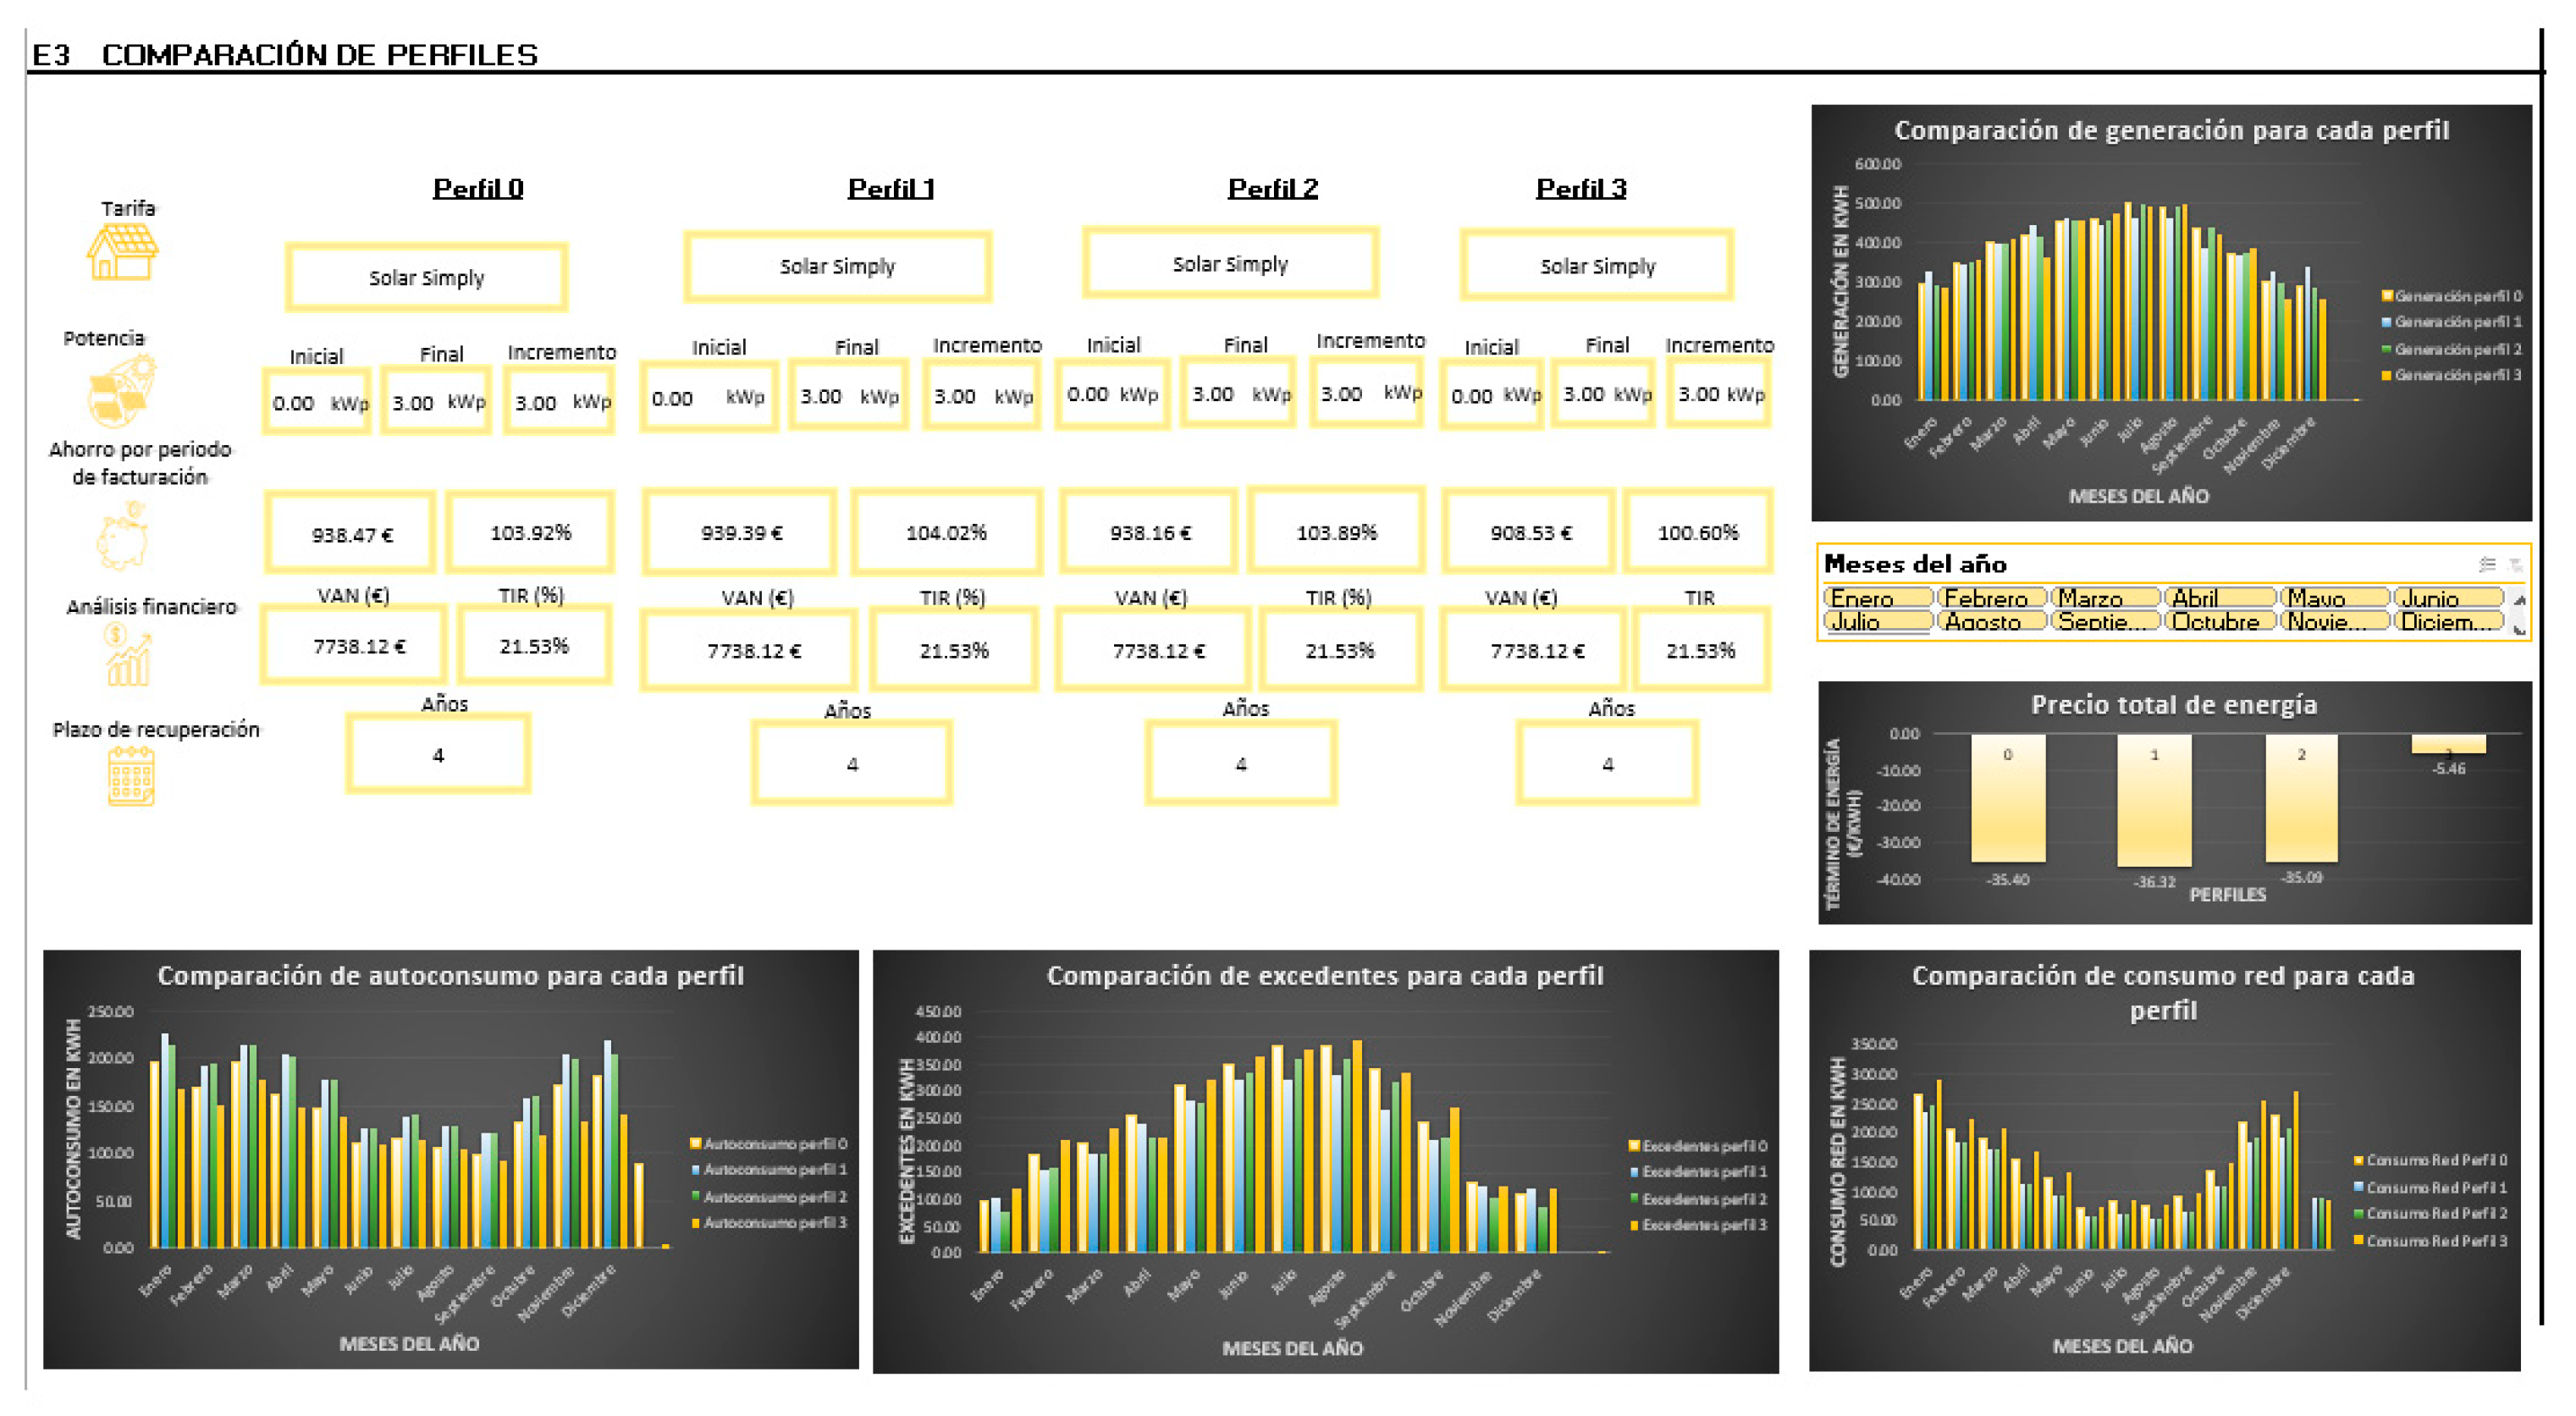
  • Output: In this section, the results of the analysis are presented in the form of a report on the different scenarios considered. Figure 14 and Figure 15 show the layout and design of this section. A clear and concise summary of the initial situation (E0) is provided, as well as the alternative situations that arise when applying changes in the electricity tariff (E1) and when considering the installation of solar PV panels (E2). Furthermore, the possibility to explore additional scenarios (E3) combining different energy consumption and production profiles can be included, providing a more complete and detailed view of the options available to the customer.

8.1. Profile Simulation

In view of the content of the tool, in order to understand the designation of each profile, which will be named according to the P ABCD model, the meaning of each letter is explained below:
P: profile.
A: takes values depending on which consumption profile is chosen.
  • Value 0: actual consumption, obtained from the distribution company.
  • Value 1: average consumption.
  • Value 2: percentage consumption. The term refers to the distribution of consumption in different percentages during the day and night. For example, in the case, 80-20 consumption, what is indicated is that 80% of the consumption takes place during daytime hours, while the remaining 20% occurs during nighttime hours.
  • Value 3: BOE Profile. The BOE electricity consumption profile estimates consumers’ hourly electricity uses without requiring precise hourly metering, resulting in a fair allocation of costs and billing. The CNMC determines the profile by considering factors such as type of consumer, season, day of the week and daytime hours. It uses hourly weighting coefficients for different periods and types of days, simplifying the billing and electricity consumption management process. The BOE, which is published annually, contains the up-to-date and detailed information necessary for accurate billing and energy allocation.
B: will take the value 0, if the tariff is the customer’s initial tariff without any modification, or 1, if a tariff change is to be made in order to obtain an optimization of the bill price.
C: will take the value 0 if no photovoltaic installation is envisaged and 1 otherwise.
D takes values (0, 1, 2, 3) depending on which generation profile is chosen.
  • Value 0: actual generation, based on irradiance data obtained from PVGIS.
  • Value 1: average annual generation in sunshine hours.
  • Value 2: average monthly generation in hours of sunshine.
  • Value 3: generation of a typical year.

8.2. Real Case Study

In order to facilitate a comprehensive understanding of the proposed tool’s functionality, the subsequent procedure for its proper utilization will be delineated. This analysis will ensure the effective application of the tool and will also underscore its capabilities and scope in the evaluation of energy data.
Prior to the entry of data into the tool, it is imperative to ascertain the electricity consumption for the designated period. In the case of Spain, this information must be obtained through the designated platform provided by the distributor or marketer responsible for the supply in each instance.
The process of downloading electricity consumption data necessitates the adherence to a series of specific steps, which are outlined below.
  • From your distributor’s website:
    • Identify your distributor: on the bill, look for the CUPS (Universal Supply Point Code). The CUPS usually starts with ES0021, ES0031, ES0022, etc., which indicates the distributor:
    • Access your distributor’s virtual office:
      -
      Register or log in.
      -
      Look for the section “My consumption”/“Consumption data”.
      -
      Download the data in Excel (CSV) with hourly details.
  • From your supplier
    Some suppliers (Endesa, Iberdrola, Naturgy, etc.) also allow you to view and download your consumption:
    • Access their website or app.
    • Look for the consumption/billing section.
    • Download the report in PDF or Excel.
Should a regulated tariff be in place (PVPC—Voluntary Price for Small Consumers), Red Eléctrica de España (REE) provides a service through which consumers may consult and download hourly electricity consumption data directly from its platform. For those residing outside of Spain who wish to download the electricity consumption data of their supply point in countries such as France, Portugal, Germany, or elsewhere, the procedure varies depending on the regulations and energy management systems of each country. In general, the management of electricity consumption data is the responsibility of the distribution network operator in each area, and in many cases, this information is accessible through designated digital platforms. In France, the entity responsible for electricity distribution is Enedis, which provides access to detailed consumption data through its online portal. To access this information, it is necessary to create an account on the Enedis Mon Compte platform, where, once registered, users can consult and download their hourly, daily or monthly consumption. In addition, consumers with Linky smart meters can obtain real-time consumption data. In Portugal, the entity responsible for distribution is E-Redes. In France, users can access their consumption history through the E-Redes Online portal. After registering and linking their contract with their Supply Point Code (SPC), they can download consumption data in different formats. It is also possible to track consumption via mobile applications provided by some retailers.
In Germany, the system is characterized by a greater degree of decentralization, with each region having a different network operator. However, most consumers can obtain their consumption data via the website of their Stadtwerk (municipal electricity company) or local grid operator. To do so, they are usually required to enter the Zählernummer (meter number) and a contract identifier. With the introduction of smart meters, some platforms allow real-time access to consumption data.
In all cases, the most straightforward method of obtaining consumption data is to access the website of the electricity distribution company that manages the grid in one’s area. In the event that one is uncertain of the relevant company, it is possible to ascertain this information by referring to the electricity bill, in which the name of the responsible supply company is typically indicated. Once the operator has been identified, it is recommended that registration be completed on the online portal, following the instructions to access historical consumption data. In the event of encountering difficulties, customers are advised to contact the customer service department of the distribution company to request the provision of information in digital format.
The database employed in the tool is tailored to each case study, as it is derived from the specific consumption data of each user, thereby ensuring an optimal fit. This adaptable structure enables a bespoke analysis, customized to the unique consumption patterns of the user.
Once the necessary data have been collected, the main menu of the tool is accessed. First of all, the user must enter the ‘Data entry’ section, where it is necessary to complete relevant information, such as the supply address, the Universal Supply Point Code (CUPS), the billing period, the contracted power, as well as indicating whether the user has a social voucher or a photovoltaic installation, among other parameters.
In this particular instance, as illustrated in Figure 16, the user does not have a predefined tariff in the application. Consequently, it has been necessary to manually enter the name of the tariff, its typology and the prices corresponding to each tariff period.
Subsequent to the completion of these steps, the ‘Generate calendar’ option must be selected, which will result in the generation of the consumption sheet, as illustrated in Figure 17. The ‘Generate calendar’ and ‘Fill in’ buttons will then be utilized to populate the consumption sheet with the dates of the billing period that have been entered in the data entry field. Thereafter, the user will return to the main menu to access the consumption sheet and continue with the analysis process.
In the consumption sheet, shown in Figure 18, the electricity consumption data that have been downloaded from the distributor’s or marketer’s platform must be entered. These values must be entered specifically in the column entitled ‘Downloaded consumption’, and expressed in Wh. The data used for the simulation of this case can be found in reference [24].
This tab facilitates manual modification of the classification of public holidays, which is advantageous in instances where a regional holiday is not automatically reflected in the system. Additionally, it enables the editing of consumption values to analyze their impact on the final cost of the bill or for other comparative studies.
Irrespective of the modifications made, it is imperative that the sum of the “Consumption in kWh” column corresponds to the total consumption entered by the user, thereby ensuring the consistency of the data analyzed.
In this section, a synopsis of annual consumption is available for consultation, as illustrated in Figure 19, which delineates the distribution of consumption across the months of the year. The document also includes the segmentation of consumption according to the different tariff periods, as well as its differentiation between holidays and working days.
The subsequent step in the sequence of events is to return to the menu and access the generation tab. Within this tab, shown in Figure 20, the peak power of the photovoltaic installation must be selected. The tool facilitates the calculation of PV generation directly from irradiance data obtained from PVGIS, considering a specific tilt and azimuth. Currently, these values are defined manually, providing flexibility to the user, but also opening up the possibility for future improvements. In this regard, a potential avenue for optimization would be the automation of the selection of these parameters according to the location and site conditions. This approach would not only expedite the process but also enhance the accuracy of the results.
As with the consumption tab, the generation tab also offers the possibility of accessing an annual summary of the calculations corresponding to generation, surplus, self-consumption, and grid consumption according to the selected peak power, as illustrated in Figure 21.
Upon completion of the data entry in the preceding tabs, the generated report, otherwise referred to as the output sheet, will be accessible. The aforementioned sheet is structured in different sections. The initial section, illustrated in Figure 22, pertains to the header, wherein the user’s entered data are collated, encompassing name, surname, ID number, address, CUPS, and billing period. Additionally, there are several buttons that facilitate navigation between the different sections or return to the main menu.
Figure 23 represents scenario 0, i.e., the customer’s initial situation. This section shows the average energy price corresponding to its current tariff, together with the prices differentiated by periods (valley, flat and peak), a summary of the billing and the total to be paid. In addition, graphs reflecting monthly consumption and its distribution by tariff periods are included.
It is common for this section to have buttons such as “Update tables”, the use of which is recommended to ensure that the data are correctly updated.
In this case, the customer paid a total of EUR 1175.31 in the year 2024.
In the event of a tariff change, as indicated by the transition to scenario 1, a ranking is generated to denote the annual amount that would be payable if an alternative tariff were to be selected.
In the case represented, shown in Figure 24, the Solar Simply tariff, applicable if the selected 3 kWp PV system is installed, would result in an annual cost of EUR 0. It is important to note that although a negative value is shown in the ranking, this does not imply that the electricity company will issue a refund to the customer. It is important to note that certain basic taxes remain outstanding. The negative value signifies that the user would accrue a credit balance in systems such as solar piggy banks, virtual batteries or virtual wallets offered by some companies. This service facilitates the offset of surplus energy generated by the photovoltaic installation, thereby accumulating its economic value rather than physically storing it in a battery. Consequently, the surplus energy discharged to the grid can be offset against future electricity bills, thereby reducing the financial burden on consumers.
In terms of ranking, the One Luz tariff is in second place, followed in third place by the Octopus Relax tariff. The graphs included facilitate the interpretation of the numerical results, showing both the percentage of savings and the euros saved. Furthermore, a summary of the average energy price for each tariff is presented.
In scenario 2, the focus is on the installation of a 3 kWp photovoltaic system. The subsequent section will highlight the calculation of the amortization period of the installation, as well as a graph showing the distribution of consumption, differentiating between consumption from the grid and self-consumption.
As demonstrated in Figure 25, the initial investment would be fully amortized within a period of four years.
Scenario 3 allows the comparison of different PV generation profiles, depending on the profile selected:
  • Profile 0: Actual generation based on irradiance data obtained from PVGIS.
  • Profile 1: Average annual generation in sunshine hours.
  • Profile 2: Average monthly generation in hours of sunshine.
  • Profile 3: Typical annual generation.
The most relevant profile for the analysis is generation profile 1, as shown in Figure 26, which corresponds to the average annual generation in sunshine hours. However, these profiles are purely exploratory, as in practice it would not be possible to evenly distribute the average annual generation in sunshine hours in a real installation.
The analysis conducted demonstrates the significance of optimizing electricity tariff contracts and promoting photovoltaic self-consumption in order to reduce costs and transition towards a more sustainable energy model. The comparison of scenarios has enabled the evaluation of the economic impact of different contracts, illustrating that, for instance, a 3 kWp installation would be amortized in 4 years, thereby reducing dependence on the grid.
Furthermore, the study of different generation profiles highlights the need to adapt renewable production to real demand, a key aspect to maximize the efficiency of the energy system. These strategies are pivotal in accelerating decarbonization, reducing the carbon footprint, and transitioning towards a future where energy is more accessible, cleaner, and more efficient.

9. Conclusions

The conclusions of this article cover several key issues in the current energy context. Firstly, the increase in energy demand in the contemporary world has generated significant pressure on traditional energy resources, which has led to the search for more sustainable and environmentally friendly alternatives. In this sense, renewable energies, such as photovoltaic energy, have emerged as a viable solution to reduce CO2 emissions and mitigate the impact of climate change.
Secondly, Europe has experienced a remarkable progression in the field of photovoltaic energy, taking advantage of its abundant solar resource. The potential of this technology is considerable, and its continued development could contribute significantly to the diversification of the energy matrix and the reduction in dependence on fossil fuels.
On the other hand, the Europe tariff landscape has evolved in recent years, presenting a greater variety of options and a higher degree of complexity. This has led to a high degree of ignorance among users, who often do not understand the billing terms and may be influenced by misleading offers from suppliers.
In this context, an Excel tool has been developed as a solution to help consumers to better understand billing in concepts and to select the most appropriate tariff for their needs. It also allows them to assess the potential benefit of installing self-consumption photovoltaic systems, giving them a clear and practical overview of the options available to optimize their energy consumption and reduce costs in the long term.
In summary, this article highlights the importance of education and information in the energy fields, as well as the crucial role of technological tools in making informed and sustainable energy consumption decisions.

Author Contributions

Conceptualization, C.T.-P., V.A.R.-G. and J.F.G.-G.; Methodology, C.T.-P., V.A.R.-G., D.D.-A., D.C.-F. and J.F.G.-G.; Software, C.T.-P., V.A.R.-G. and D.D.-A.; Validation, C.T.-P. and V.A.R.-G.; Formal analysis, C.T.-P., V.A.R.-G., D.D.-A. and J.F.G.-G.; Investigation, C.T.-P., V.A.R.-G., D.D.-A., D.C.-F. and J.F.G.-G.; Resources, C.T.-P., V.A.R.-G. and D.C.-F.; Data curation, C.T.-P., V.A.R.-G., D.D.-A., D.C.-F. and J.F.G.-G.; Writing—original draft, C.T.-P. and V.A.R.-G.; Writing—review & editing, C.T.-P. and J.F.G.-G.; Visualization, J.F.G.-G.; Supervision, J.F.G.-G.; Project administration, D.C.-F.; Funding acquisition, J.F.G.-G. All authors have read and agreed to the published version of the manuscript.

Funding

This research received no external funding.

Institutional Review Board Statement

Not applicable.

Informed Consent Statement

Not applicable.

Data Availability Statement

The original contributions presented in this study are included in the article. Further inquiries can be directed to the corresponding author.

Conflicts of Interest

The authors declare no conflict of interest.

References

  1. Rosales-Asensio, E.; Diez, D.B.; Cabrera, P.; Sarmento, P. Effectiveness and Efficiency of Support Schemes in Promoting Renewable Energy Sources in the Spanish Electricity Market. Int. J. Electr. Power Energy Syst. 2024, 158, 109926. [Google Scholar] [CrossRef]
  2. Instituto para la Transición Justa, O.A. Strategic Energy and Climate Framework; Instituto para la Transición Justa, O.A.: Madrid, Spain, 2020. [Google Scholar]
  3. REE Evolución de La Demanda. Información Elaborada Con Datos Provisionales a Enero Del. 2024. Available online: https://www.sistemaelectrico-ree.es/informe-del-sistema-electrico/demanda/evolucion-demanda (accessed on 19 July 2024).
  4. Saez, R.; Boer, D.; Shobo, A.B.; Vallès, M. Techno-Economic Analysis of Residential Rooftop Photovoltaics in Spain. Renew. Sustain. Energy Rev. 2023, 188, 113788. [Google Scholar] [CrossRef]
  5. Parreño-Rodriguez, A.; Ramallo-González, A.P.; Chinchilla-Sánchez, M.; Molina-García, A. Community Energy Solutions for Addressing Energy Poverty: A Local Case Study in Spain. Energy Build. 2023, 296, 113418. [Google Scholar] [CrossRef]
  6. Segura, E.; Belmonte, L.M.; Morales, R.; Somolinos, J.A. A Strategic Analysis of Photovoltaic Energy Projects: The Case Study of Spain. Sustainability 2023, 15, 12316. [Google Scholar] [CrossRef]
  7. Fernández-González, R.; Suárez-García, A.; Álvarez Feijoo, M.Á.; Arce, E.; Díez-Mediavilla, M. Spanish Photovoltaic Solar Energy: Institutional Change, Financial Effects, and the Business Sector. Sustainability 2020, 12, 1892. [Google Scholar] [CrossRef]
  8. Secretaría General del Consejo Pacto Verde Europeo. Available online: https://www.consilium.europa.eu/es/policies/green-deal/ (accessed on 14 October 2024).
  9. IEA. World Energy Outlook 2022; IEA: Paris, France, 2022. [Google Scholar]
  10. Red Eléctrica Las Renovables Baten Récord y Generan Más de La Mitad de Toda La Electricidad En España En. 2023. Available online: https://www.ree.es/es/sala-de-prensa/actualidad/nota-de-prensa/2023/12/las-renovables-baten-record-y-generan-mas-de-la-mitad-de-toda-electricidad-espana-en-2023 (accessed on 14 October 2024).
  11. Carmen Goizueta De Mercados Mayoristas y Sanciones Por Infracciones. Available online: https://blog.cnmc.es/2019/08/28/de-mercados-mayoristas-y-sanciones-por-infracciones/ (accessed on 27 June 2024).
  12. Auer, H.; Haas, R. On Integrating Large Shares of Variable Renewables into the Electricity System. Energy 2016, 115, 1592–1601. [Google Scholar] [CrossRef]
  13. Meeus, L.; Belmans, R. Electricity Market Integration in Europe; University of Leuven: Leuven, Belgium, 2008. [Google Scholar]
  14. Vázquez, C.; Rivier, M.; Pérez-Arriaga, I.J. A Market Approach to Long-Term Security of Supply. IEEE Trans. Power Syst. 2002, 17, 349–357. [Google Scholar] [CrossRef]
  15. Brown, S.; Jones, D.; Fulghum, N.; Bruce-Lockhart, C.; Candlin, A.; Ewen, M.; Czyżak, P.; Rangelova, K.; Heberer, L.; Rosslowe, C.; et al. European Electricity Review. 2024. Available online: https://ember-energy.org/app/uploads/2024/10/European-Electricity-Review-2024.pdf (accessed on 4 January 2025).
  16. International Renewable Energy Agency. Renewable Energy Statistics 2023; International Renewable Energy Agency: Masdar City, United Arab Emirates, 2023; ISBN 978-92-9260-537-7. Available online: https://www.irena.org/Publications/2023/Jul/Renewable-energy-statistics-2023 (accessed on 4 January 2025).
  17. Halkos, G.E.; Tsirivis, A.S. Electricity Prices in the European Union Region: The Role of Renewable Energy Sources, Key Economic Factors and Market Liberalization. Energies 2023, 16, 2540. [Google Scholar] [CrossRef]
  18. CNMC. La Nueva Factura de La Luz. Available online: https://www.cnmc.es/la-nueva-factura-de-la-luz (accessed on 21 June 2024).
  19. Gabriela Luque, A.; Joseline Aguilera, C.; Lata-García, J.; Onofre, K.V. Analysis of the Performance of Photovoltaic System Through Different Angles of Tilt and Orientation in Equatorial Latitude. In Proceedings of the International Conference on Electrical, Computer and Energy Technologies, ICECET 2023, Cape Town, South Africa, 16–17 November 2023; Institute of Electrical and Electronics Engineers Inc.: New York, NY, USA, 2023. [Google Scholar]
  20. Hasan, M.; Serra Altinoluk, H. Current and Future Prospective for Battery Controllers of Solar PV Integrated Battery Energy Storage Systems. Front. Energy Res. 2023, 11, 1139255. [Google Scholar] [CrossRef]
  21. IDAE. Instituto para la Diversificación y Ahorro de la Energía ¿Qué Es El Autoconsumo? Available online: https://www.idae.es/tecnologias/energias-renovables/oficina-de-autoconsumo/que-es-el-autoconsumo (accessed on 28 May 2024).
  22. Vanya Ignatova Four Strategies for Sizing Your Photovoltaic System. Available online: https://blog.se.com/infrastructure-and-grid/power-management-metering-monitoring-power-quality/2020/02/04/four-strategies-for-sizing-your-photovoltaic-system/ (accessed on 5 November 2024).
  23. Deguenon, L.; Yamegueu, D.; Moussa Kadri, S.; Gomna, A. Overcoming the Challenges of Integrating Variable Renewable Energy to the Grid: A Comprehensive Review of Electrochemical Battery Storage Systems. J. Power Sources 2023, 580, 233343. [Google Scholar]
  24. Celia Tena Pintado. Consumos año 2024. Available online: https://docs.google.com/spreadsheets/d/1KsjDMDwN1Xhc-xQJR5fExQKFRuxNWnBX/edit?usp=sharing&ouid=114640214704945989787&rtpof=true&sd=true (accessed on 11 March 2025).
Figure 1. Evolution of demand coverage [3].
Applsci 15 03493 g001
Figure 2. Daily market clearing [11].
Applsci 15 03493 g002
Figure 3. Development of renewables [3].
Applsci 15 03493 g003
Figure 4. Consumption periods from Monday to Friday on working days according to the new electricity bill [18].
Applsci 15 03493 g004
Figure 5. Periods of consumption on Saturdays, Sundays and public holidays according to the new electricity bill [18].
Applsci 15 03493 g005
Figure 6. Workflow.
Figure 6. Workflow.
Applsci 15 03493 g006
Figure 7. Interactive access menu.
Applsci 15 03493 g007
Figure 8. Section for entering customer data.
Applsci 15 03493 g008
Figure 9. Section for entering supply data.
Applsci 15 03493 g009
Figure 10. Section for recollecting electricity consumption data.
Applsci 15 03493 g010
Figure 11. Section in which the peak power of the installation is selected.
Applsci 15 03493 g011
Figure 12. Tariff comparator.
Applsci 15 03493 g012
Figure 13. Savings ranking and graphical analysis of bill amount.
Applsci 15 03493 g013
Figure 14. E0 and E1 of the output report.
Applsci 15 03493 g014
Figure 15. E2 and E3 of the output report.
Applsci 15 03493 g015
Figure 16. Supply data.
Applsci 15 03493 g016
Figure 17. Calendar.
Applsci 15 03493 g017
Figure 18. Consumption sheet.
Applsci 15 03493 g018
Figure 19. Additional information for the consumption sheet.
Applsci 15 03493 g019
Figure 20. Generation tab in which the peak power of the photovoltaic installation is chosen.
Applsci 15 03493 g020
Figure 21. Extended information of the generation tab.
Applsci 15 03493 g021
Figure 22. Header of the report generated.
Applsci 15 03493 g022
Figure 23. Initial situation.
Applsci 15 03493 g023
Figure 24. Tariff change scenario.
Applsci 15 03493 g024
Figure 25. Section of the photovoltaic installation.
Applsci 15 03493 g025
Figure 26. Profile comparison scenario.
Applsci 15 03493 g026
Disclaimer/Publisher’s Note: The statements, opinions and data contained in all publications are solely those of the individual author(s) and contributor(s) and not of MDPI and/or the editor(s). MDPI and/or the editor(s) disclaim responsibility for any injury to people or property resulting from any ideas, methods, instructions or products referred to in the content.

