Article

Extra-Tidal Members and Dynamics of the Open Cluster NGC 6705

School of Computer Science and Artificial Intelligence, Changzhou University, Changzhou 213164, China
*
Author to whom correspondence should be addressed.
Appl. Sci. 2025, 15(7), 3488; https://doi.org/10.3390/app15073488
Submission received: 2 February 2025 / Revised: 6 March 2025 / Accepted: 18 March 2025 / Published: 22 March 2025

Abstract

:
In this study, we utilized Gaia-DR3 astrometric data combined with the density-based spatial clustering of applications with noise (DBSCAN) algorithm to thoroughly investigate the dynamics and extra-tidal members of the open cluster NGC 6705. We determined more than 1900 cluster members within ∽12 pc of the cluster. We estimated the core and tidal radii to be 3.11 ± 0.21 arcmin (∽2 pc) and 20.02 ± 0.71 arcmin (∽13 pc), respectively, based on the cluster members. A Gaussian mixture model (GMM) was used to segregate the core and halo components of the cluster. The major and minor axes of the core and halo were determined through principal component analysis (PCA). The semi-major axis lengths of the core and halo were estimated to be 7 (∽4.5 pc) and 21 (∽13.6 pc), respectively. Additionally, the axis ratios of the core and halo were found to be e∽0.89 and e∽0.80, respectively, suggesting that the halo was significantly affected by the external tidal field. We detected a clear mass segregation effect within the cluster. Furthermore, we also detected some extra-tidal members around the cluster, implying that these stars are being lost from the cluster because of gravitational interactions with the Milky Way. This work provided a comprehensive characterization of NGC 6705, revealing its tighter structure, ongoing mass segregation, and potential star loss.

1. Introduction

Open clusters are typical representatives of the thin disk of the galaxy [1]. By studying open clusters, we can gain insights into the dynamical evolution of stellar systems and galaxy structure. Thus, open clusters are very important tracers [2,3]. NGC 6705 ( l = 27.300 ° , b = 2.744 ° ) is a widely studied open cluster, located approximately 2200 pc from Earth and over 6000 pc from the Galactic Center, with an age of about 300 Myr [1,4,5,6,7]. It is known to be one of the richest and densest of the open clusters. NGC 6705 is an inner disk cluster of the Milky Way, and inner disk clusters serve as important probes for studying the formation and evolution of the Milky Way, the chemical abundance distribution of the disk, the dynamical properties, and the distribution of dark matter [8,9,10]. Through in-depth research on NGC 6705, we can gain a more comprehensive understanding of the Milky Way and its disk. Santos et al. [11] estimated the core radius of NGC 6705 to be 1.23 pc and the tidal radius to be 29 pc, with the cluster’s mass estimated to be between 3700 M and 11,000 M .
However, the NGC 6705 cluster, located 2200 pc from Earth in the direction of the Galactic Center, is heavily contaminated by field stars; this not only complicates the identification of cluster members but also affects the accuracy of stellar photometry and kinematic data. This, in turn, makes the analysis of key dynamical characteristics, such as mass distribution, central density, and stellar velocity distribution, more challenging [12]. This complexity significantly limits the ability to gain a deeper understanding of the cluster’s dynamical evolution and its trajectory within the Milky Way. If we obtain reliable cluster members, it becomes highly meaningful for studying the extended halo and extra-tidal structures of heavily contaminated clusters [13,14,15,16]. Fortunately, Gaia-DR3 data provide us with high-precision positional measurements, parallaxes, and proper motion data [17,18], enabling us to obtain reliable members of NGC 6705 within the complex star field background. Based on some previous studies, Cantat-Gaudin et al. [4] identified 1409 cluster members, while Hunt and Reffert [7] identified even more, over 1900 members, 39% of which were located outside the tidal radius. Accurately separating the core–halo components is of great significance for studying the spatial structure of NGC 6705, yet this point has not been specifically emphasized in previous papers. In this context, GMM is an effective tool for distinguishing between these components based on stellar positions and kinematics. GMM allows us to model the spatial distribution of stars in a probabilistic framework, providing insights into the distinct dynamical characteristics of the core and halo regions [16,19]. By applying the GMM, we better understand the spatial structure and dynamical state of NGC 6705 and further analyze whether it has formed tidal structures. Tidal structures are typically the result of interactions between the cluster and the gravitational field of the Milky Way [20,21]. By studying these structures, we can better understand the cluster’s evolution within the galactic gravitational field and its dynamic history along its orbit. Recently, Kos [22] confirmed the existence of tidal structures of NGC 6705.
Reliable cluster members are crucial for studying star clusters, especially for highly contaminated inner disk clusters. In this paper, we aim to separate the reliable members of NGC 6705 and investigate its structural and dynamical properties. The remainder of this paper is organized as follows: Section 2 outlines the data and methods employed in this study. In Section 3, we investigate the structural parameters and dynamical state of the cluster using the identified members. Section 4 explores the tidal structures and their associated structural parameters. Finally, Section 5 presents the discussion and conclusions.

2. Data and Method

2.1. Sample Selection

Compared to Gaia-DR2, Gaia-DR3 provides more precise astrometric data; it offers five-dimensional (5D) astrometric data (position, parallax, and proper motion) for approximately 1.8 billion sources, along with three-band ( G , B P , R P ) photometric measurements [17,18]. This enables the extraction of a large number of reliable cluster members (including extra-tidal members) from open clusters. It is crucial to apply appropriate filtering criteria when selecting an initial sample from Gaia-DR3; the initial sample refers to the preliminary dataset from which cluster members will be extracted using the DBSCAN clustering algorithm (see Section 2.2). Based on Gaia-DR3 data, Hunt and Reffert [7] determined some fundamental parameters for NGC 6705: central positions ( l = 27.300 ° , b = 2.744 ° ) , mean proper motions ( μ α c o s δ , μ δ ) = ( 1.535 ± 0.008 , 4.165 ± 0.005 ) masyr−1, parallax ϖ = 0.411 ± 0.004 mas. Based on previous studies, the relevant parameters are shown in Table 1.
In order to better study this cluster, we attempted to identify reliable cluster members with G = 21 mag within 30 arcmin of the cluster center. According to the estimation by Hunt and Reffert [7], the tidal radius of the cluster is about 11 arcmin. Our search radius is approximately three times the tidal radius estimated by Hunt and Reffert [7], allowing us to identify more extra-tidal members of NGC 6705. To reduce field star contamination, we selected sample stars based on the following selection criteria: (1) the stars must have five astrometric parameters ( l , b , ϖ , μ α c o s δ , μ δ ) ; (2) the stars must have three-band photometric data ( G , B P , R P ) ; (3) the stars must have proper motions in the ranges of −2 < μ α c o s δ < −1 mas/yr and −4.6 < μ δ < −3.6 mas/yr; (4) the stars must have parallaxes in the range of −0.2 < ϖ < 1 mas. Finally, we obtained 11,291 sample stars in Gaia-DR3 catalog.

2.2. Membership Determination

To determine more reliable cluster members (including extra-tidal members) of NGC 6705, we employed the DBSCAN clustering algorithm, a widely used unsupervised clustering method [27]. The advantage of DBSCAN is that it does not require prior knowledge of the sample star distribution and can identify clusters of any shape while being resistant to noise and outliers [28,29,30,31]. This makes it particularly well-suited for identifying reliable cluster members in star clusters contaminated by field stars, such as NGC 6705, which is located in a low galactic latitude region and suffers from significant field star contamination. Given that DBSCAN’s clustering results are highly sensitive to the input parameters Eps and MinPts, we carefully selected these parameters by constructing a parameter grid [19,27,32]. The Eps parameter, which defines the neighborhood radius, was varied from 0.01 to 0.2 in steps of 0.01, while the MinPts parameter, defining the minimum number of points required to form a dense region, ranged from 1 to 50 with a step of 1. This grid search approach ensured a thorough exploration of parameter space to identify the optimal settings for the clustering. To ensure that all dimensions were on a comparable scale, we applied min–max normalization to the 5D astrometric data, which included the parallax ( ϖ ), proper motion in right ascension ( μ α c o s δ ), proper motion in declination ( μ δ ), galactic longitude (l), and galactic latitude (b). Each dimension was rescaled to the range [0, 1] using the following formula:
x i k = x k M i n ( X k ) M a x ( X k ) M i n ( X k ) ( k = 1 , 2 , 3 , 4 , 5 )
where x i k is the original value of the k-th dimension for the i-th star and x k is the normalized value. Min( X k ) and Max( X k ) represent the minimum and maximum values of the k-th dimension across all sample stars.
We ran the DBSCAN clustering algorithm across the parameter grid to classify stars as cluster members or outliers. To further refine our member selection, we calculated the membership probability P i for each star by running the DBSCAN clustering algorithm 1000 times across different parameter combinations. The membership probability of the i-th star is defined as follows: P i = N i c / N t , where N i c is the total number of times that the i-th star is classified as a ”core point” across all runs and N t is the total number of runs. Stars with higher membership probabilities are retained as reliable cluster members, ensuring that only stars consistently identified as cluster members were included for further analysis.
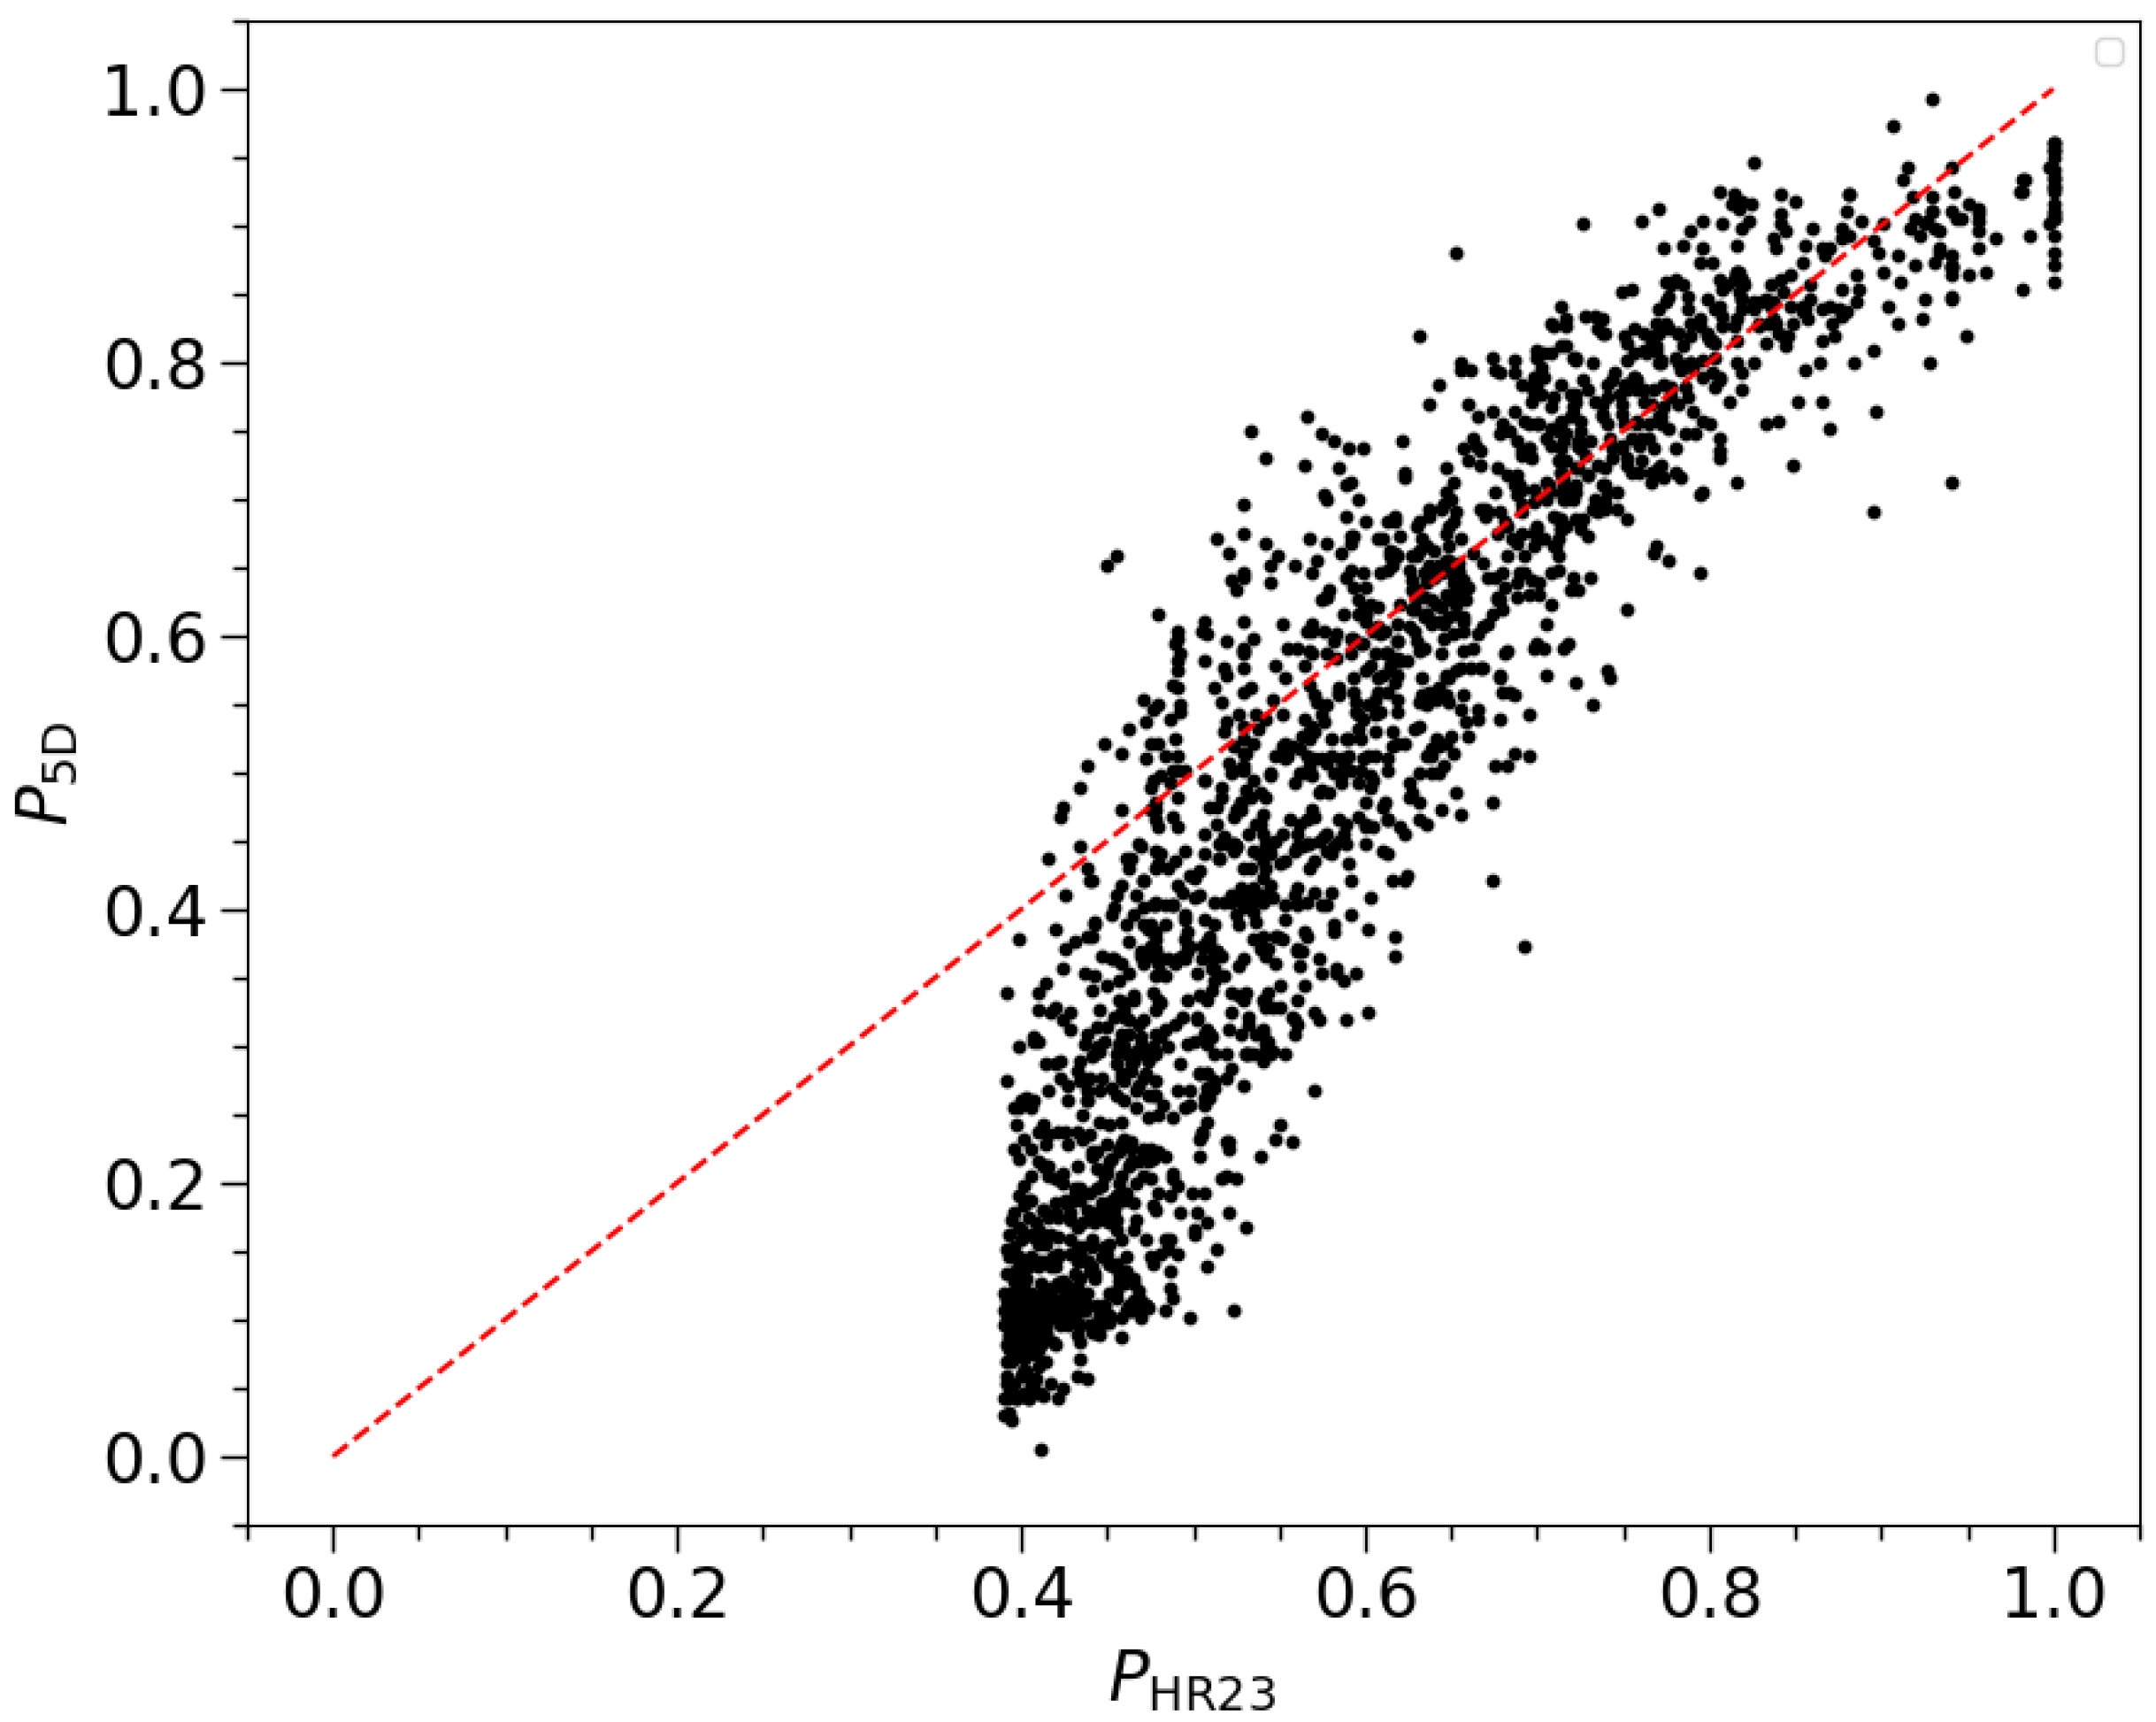
From Figure 1, we see that the stars can be divided into two groups, and the stars with R > 18 arcmin have lower membership probabilities ( P 5 D < 0.1 ). Therefore, the upper limit for field star probability is P 5 D 0.1 . At this point, P 5 D = 0.15 can be considered a safe threshold for selecting reliable cluster members (represented by the red dashed line), and these members extend up to a radial distance of ∽20 arcmin (∽13 pc at a distance of 2200 pc). This radial distance can be defined as the detectable radius of the cluster. Based on the threshold, we identified 1969 likely cluster members. Upon comparison, we found that our membership probabilities allowed for the identification of more cluster members in the mid-to-high probability range (see Figure 2). Specifically, Hunt and Reffert [7] identified 1911 cluster members based on Gaia-DR3 data (positions, proper motions, and parallaxes) using the HDBSCAN method. Our analysis of the same dataset shows that, for 1908 common stars, as shown in Figure 2, our membership probabilities are generally higher than those of Hunt and Reffert [7], particularly in the region where P H R 23 > 0.4 . Our probabilities also tend to concentrate near 1, reflecting greater certainty in identifying cluster members. This difference may be attributed to the different methods used, particularly in handling marginal member stars.
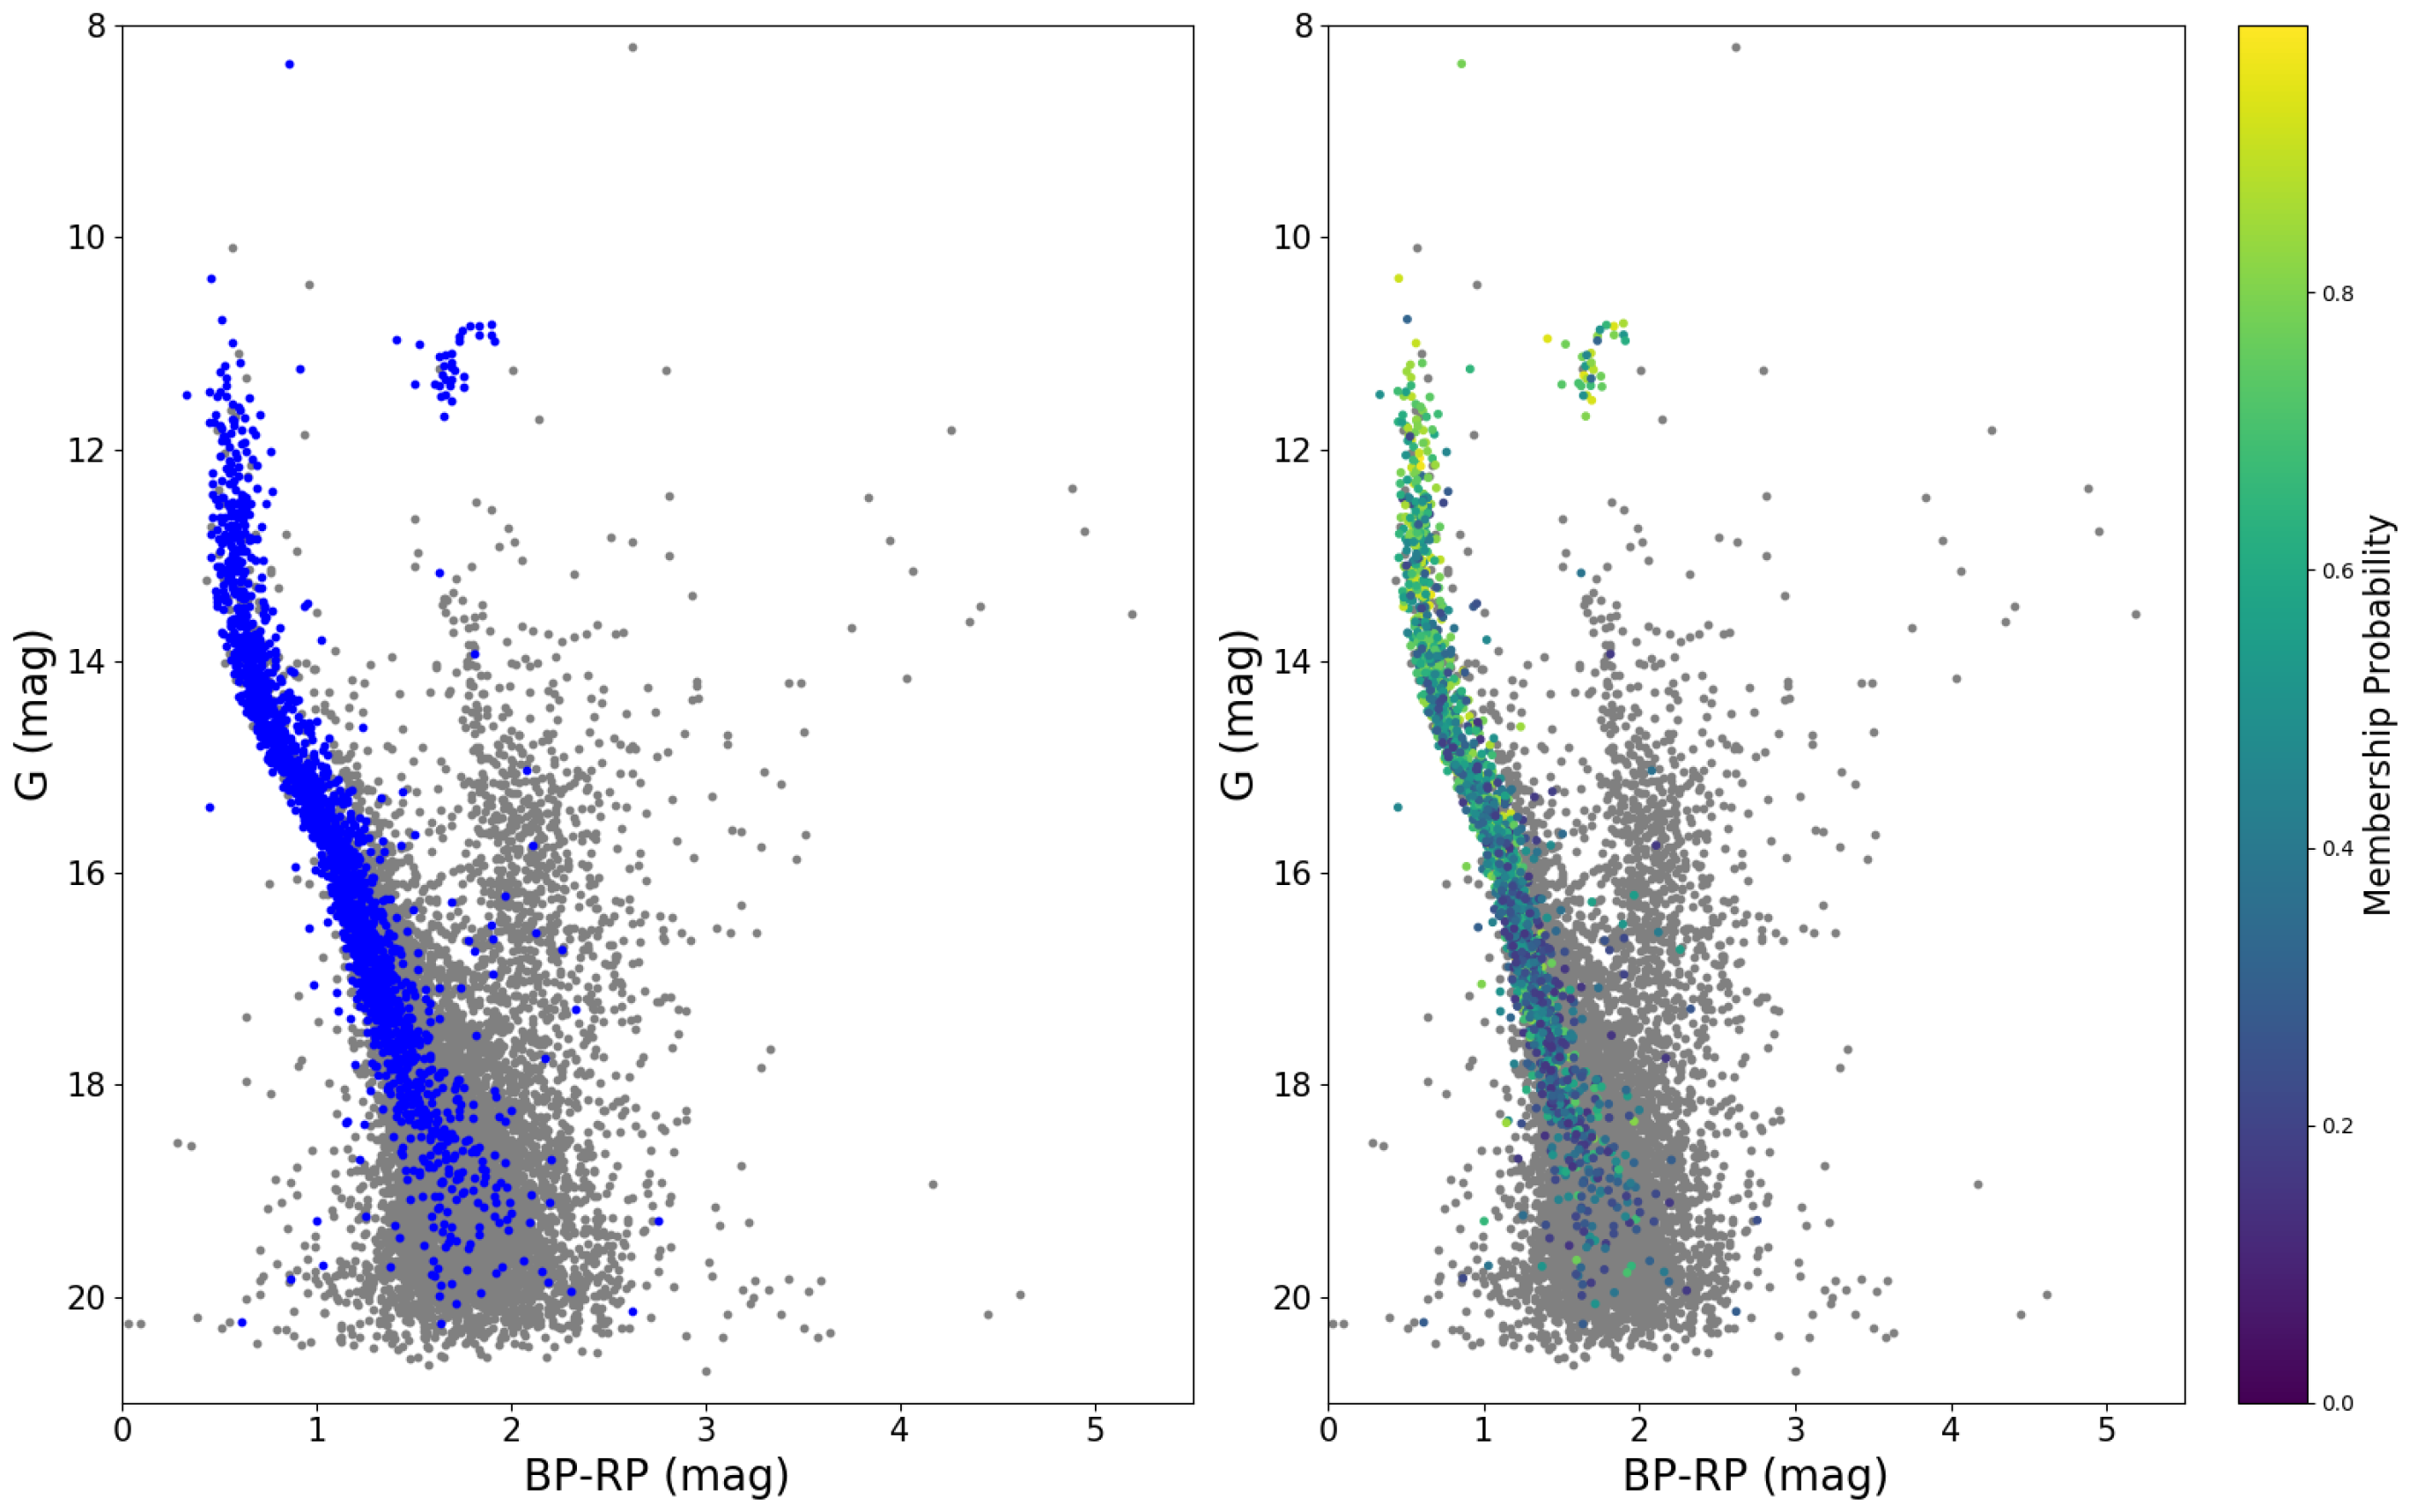
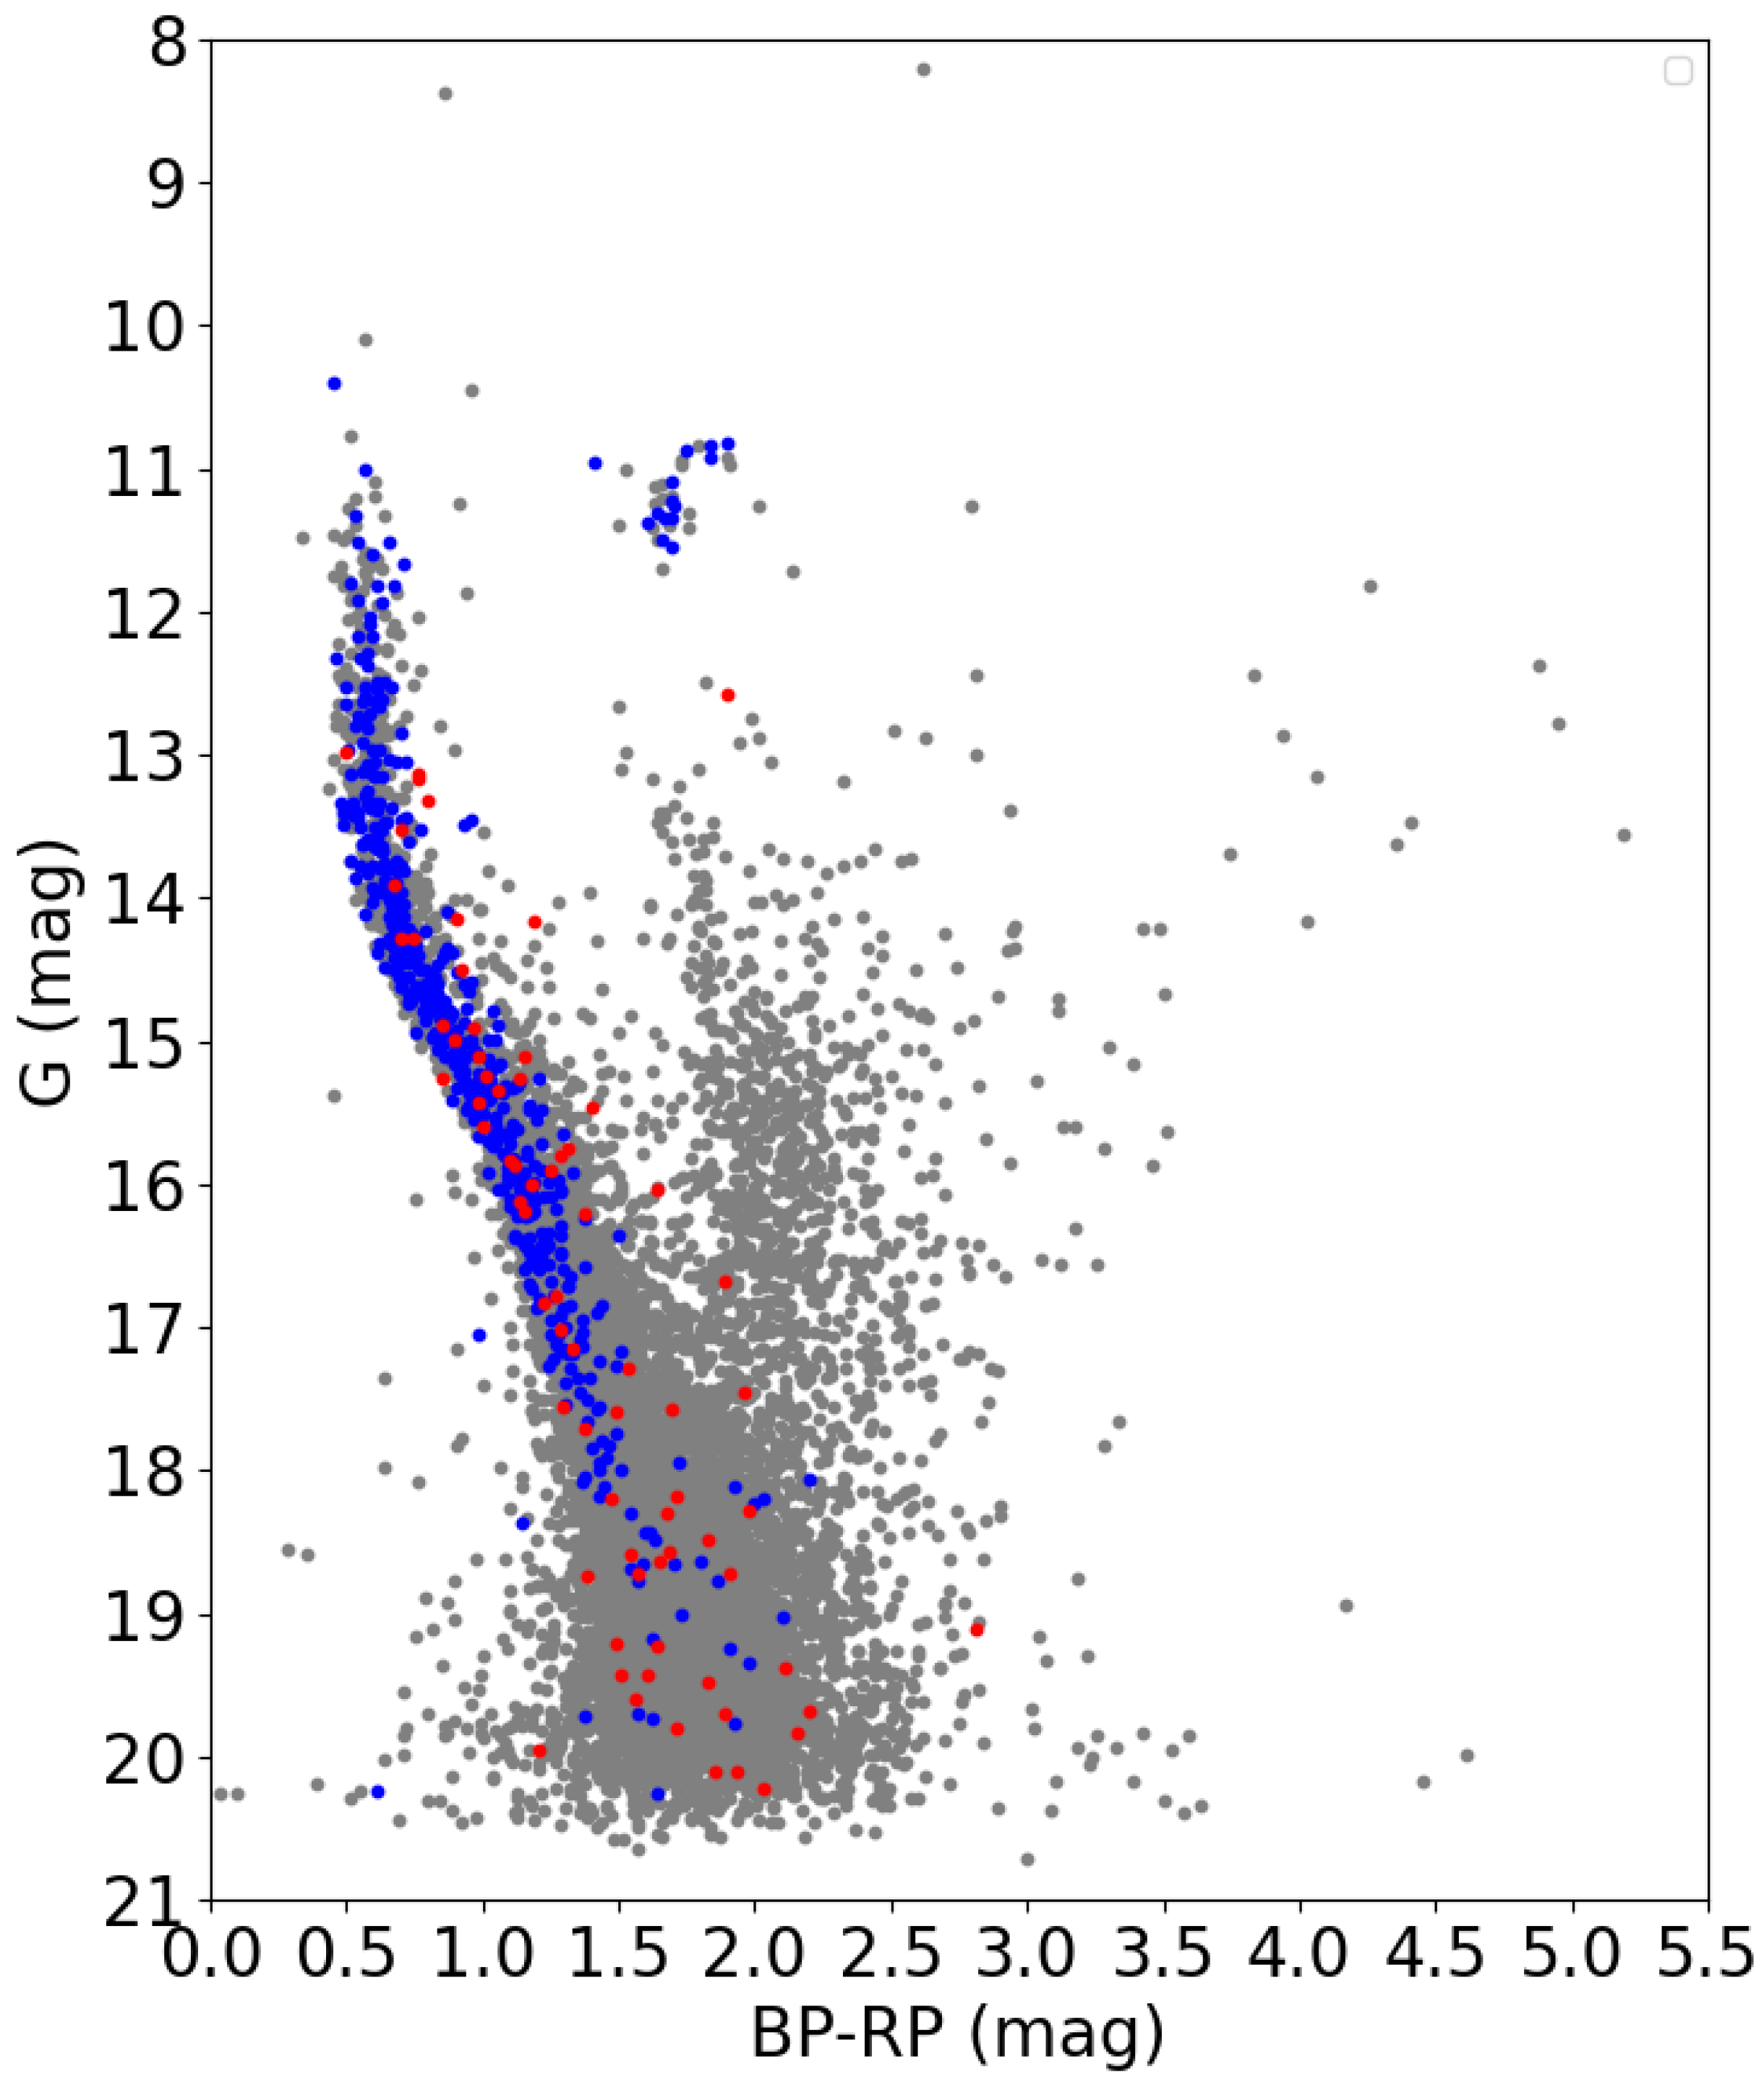
Figure 3 shows the color–magnitude diagrams (CMDs) of the 5D cluster members ( P 5 D 0.15) and field stars ( P 5 D < 0.15). We found that the CMD of 5D cluster members exhibited a clear main sequence (MS), indicating that our method is effective for identifying reliable cluster members in the normalized 5D parametric space. We find that the bright cluster members (G < 16 mag), on average, have higher membership probabilities (see the right panel of Figure 3), and the high-probability members ( P 5 D 0.8) are mainly located in the inner regions of the cluster (see Figure 1).
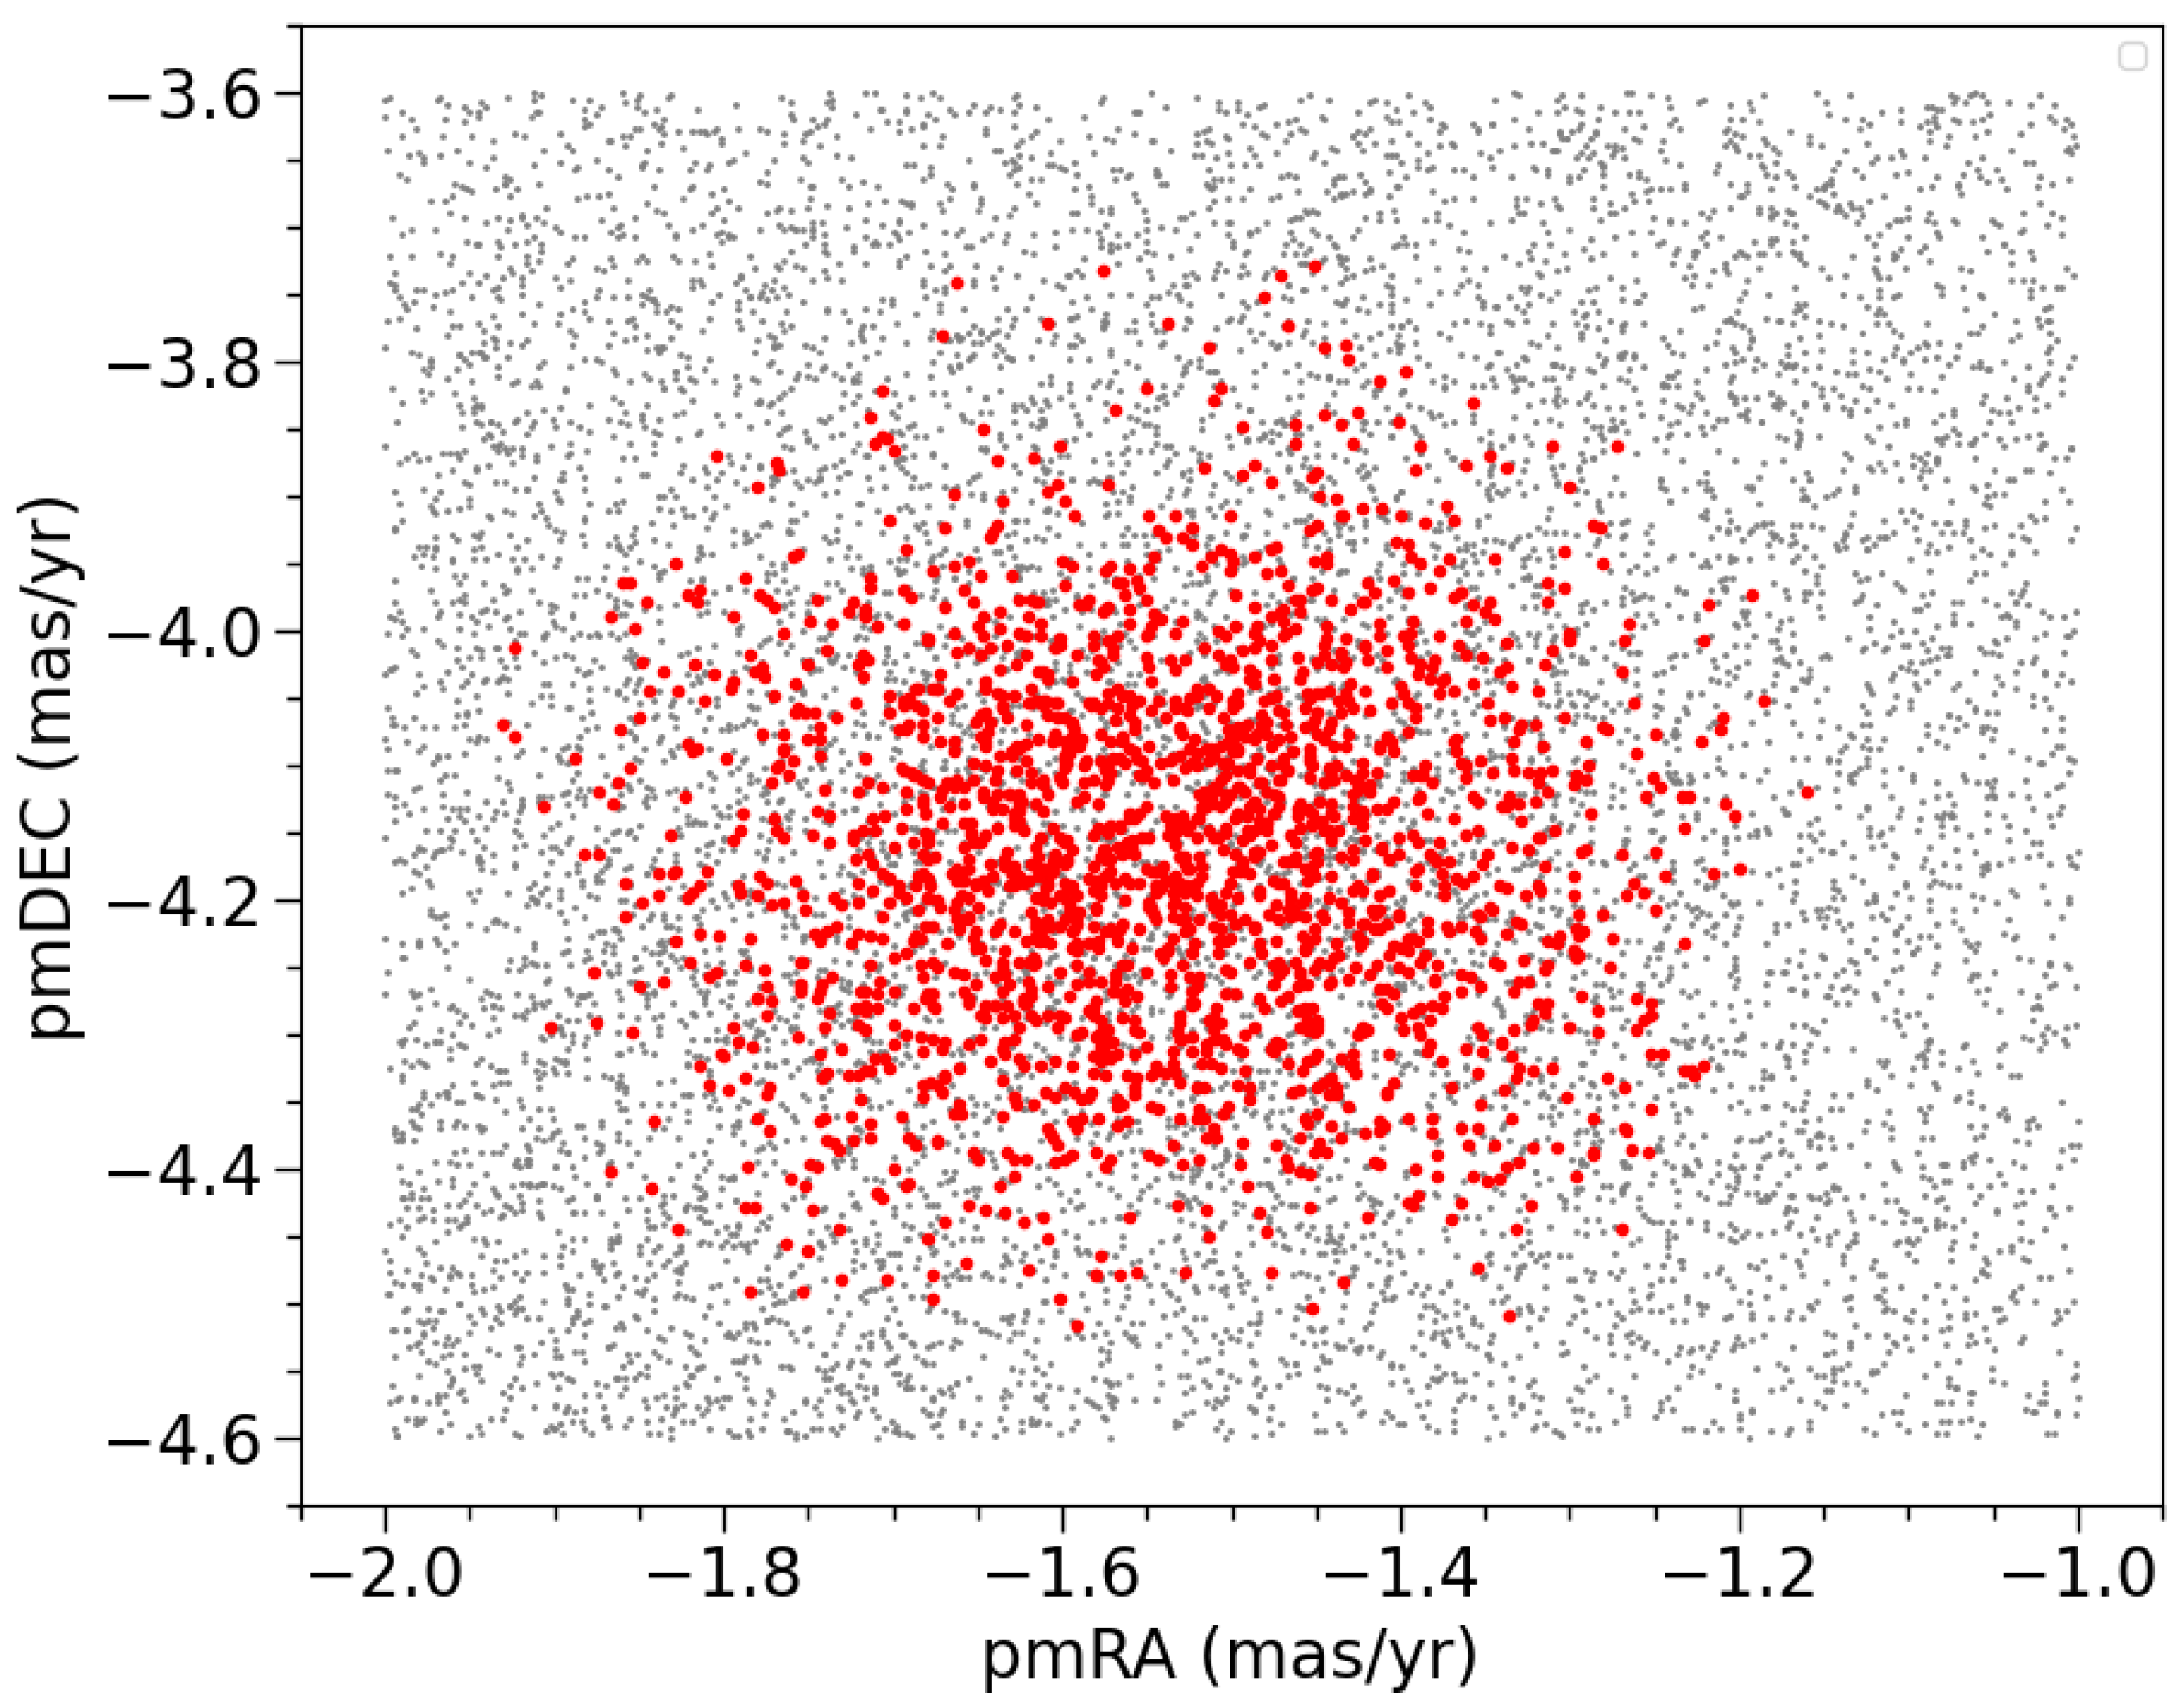
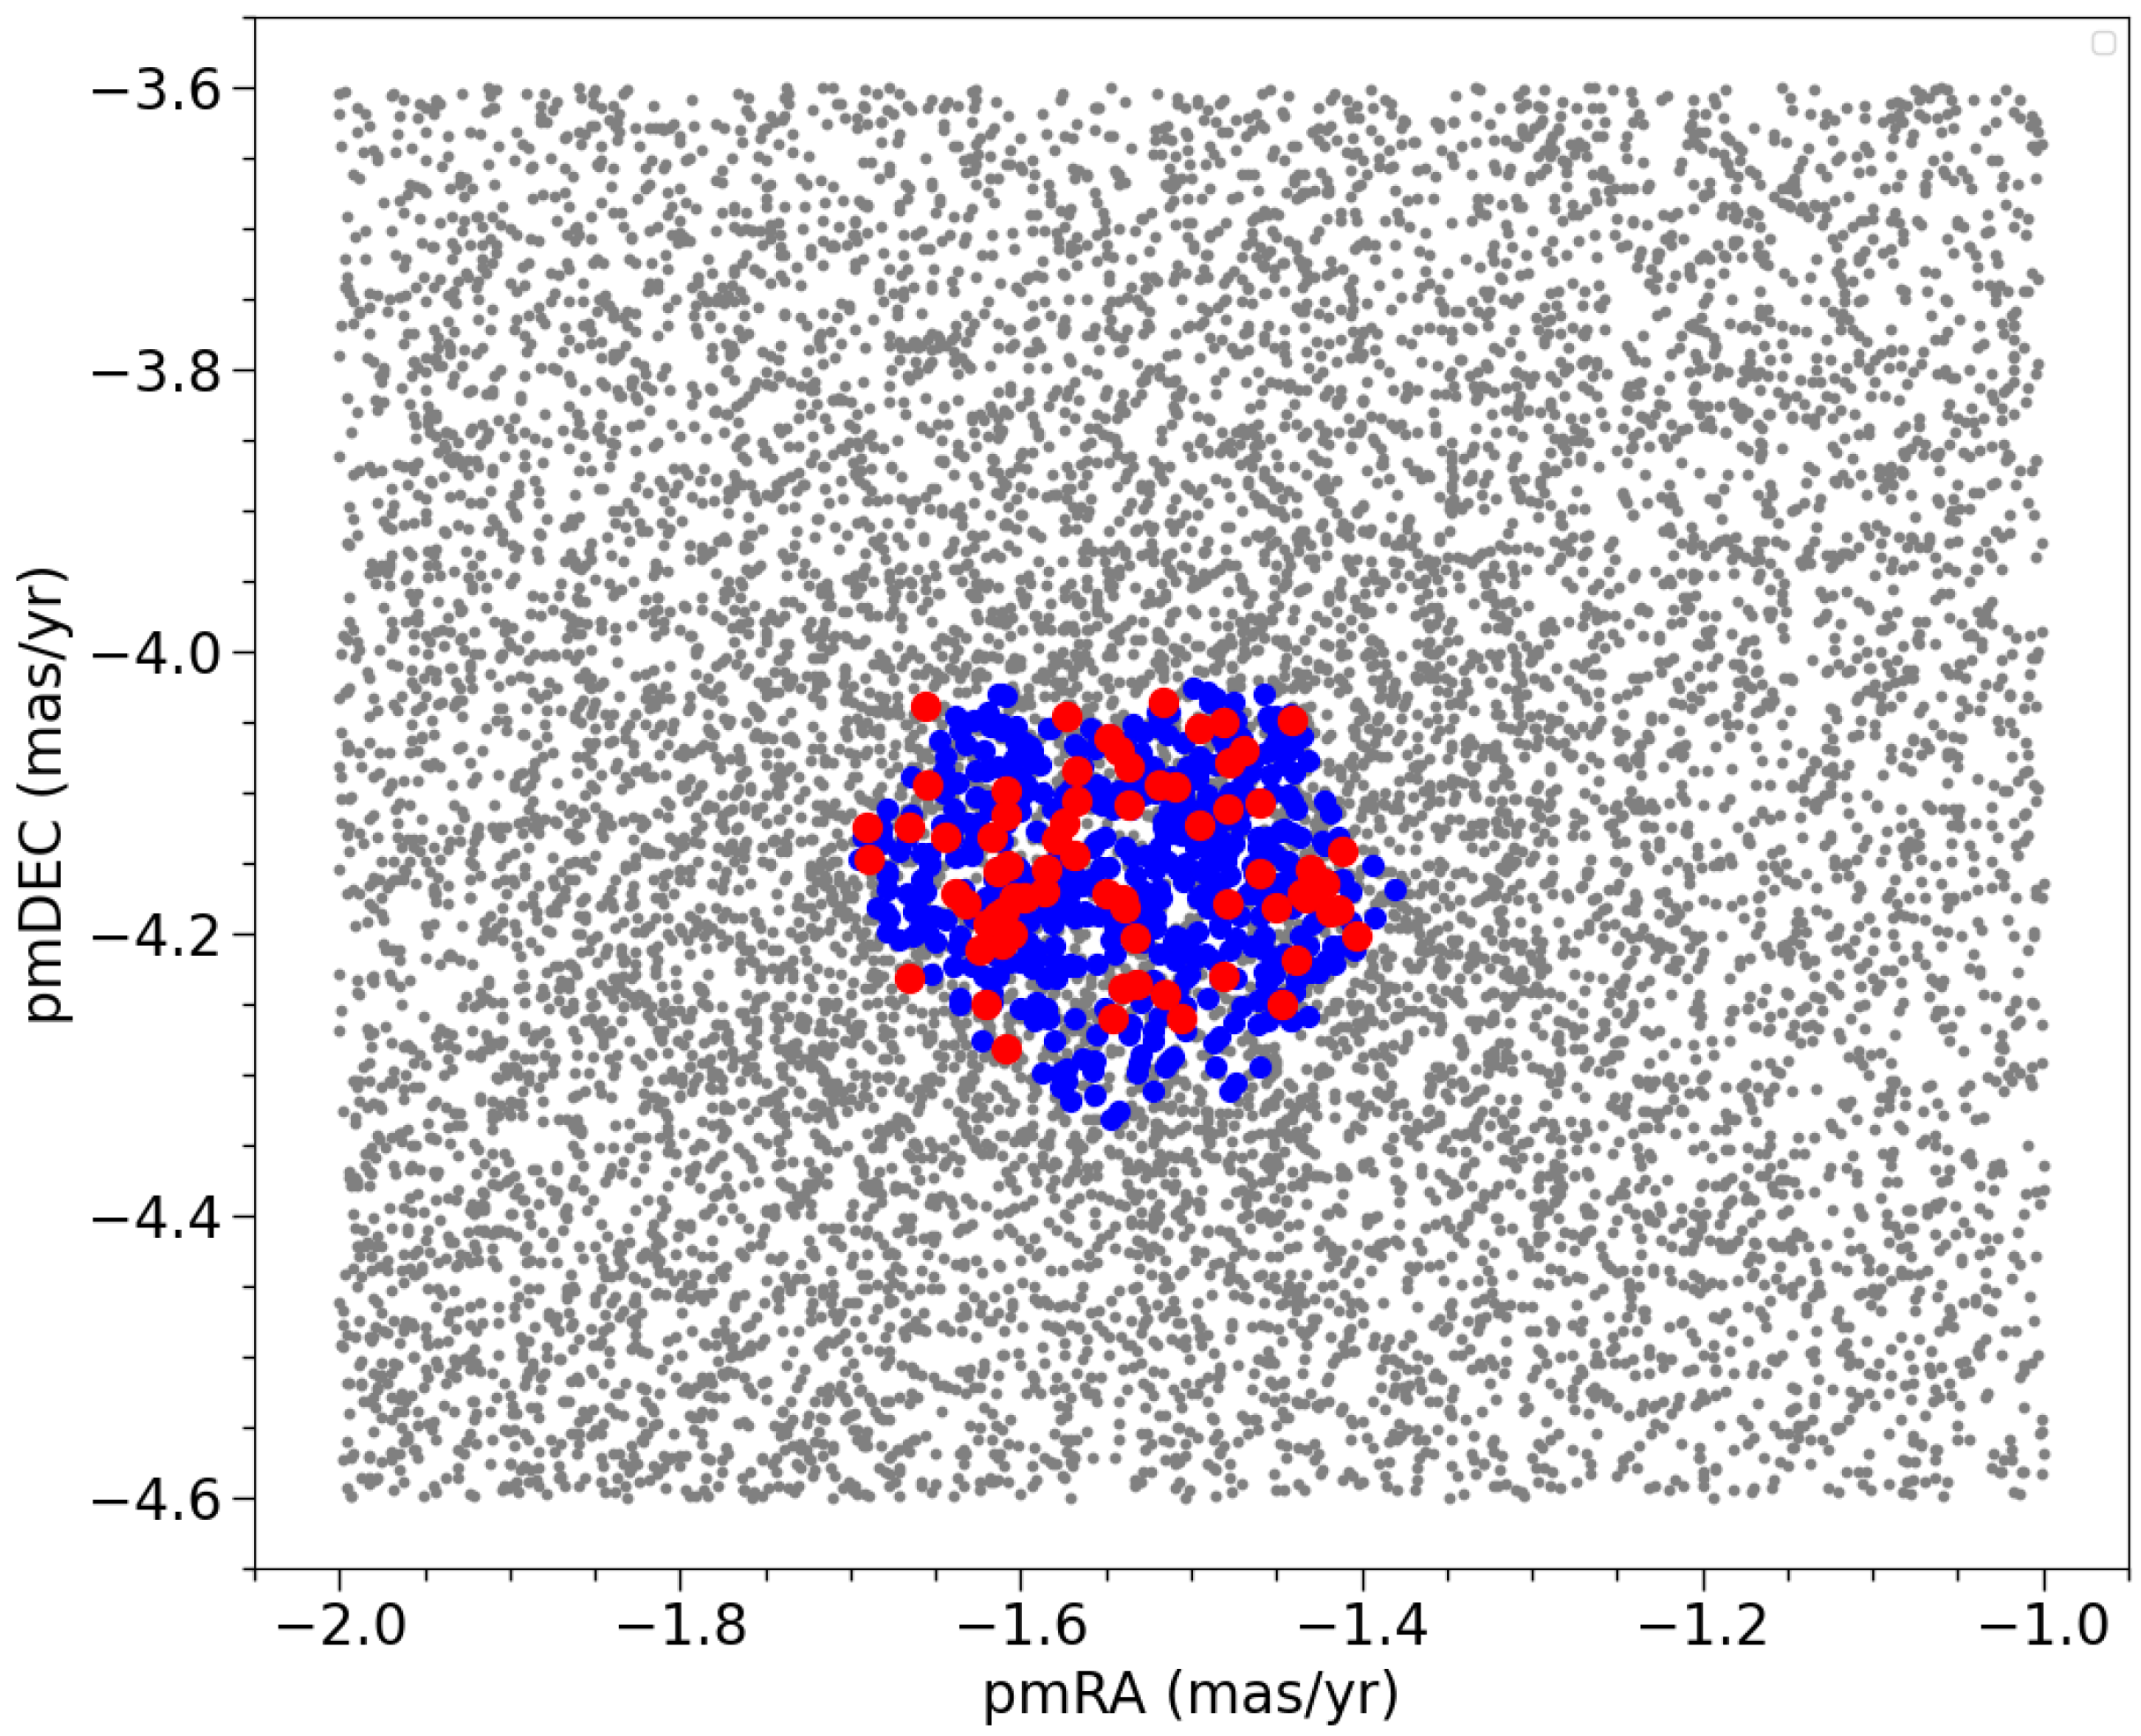
In addition, for a better comparison, the proper motion vector-point diagrams (PM-VPDs) show that the 5D cluster members are significantly concentrated in a specific region in the proper motion space, indicating that the 5D members are moving with similar tangential velocities (see Figure 4).

3. Structural Parameters and Dynamical State

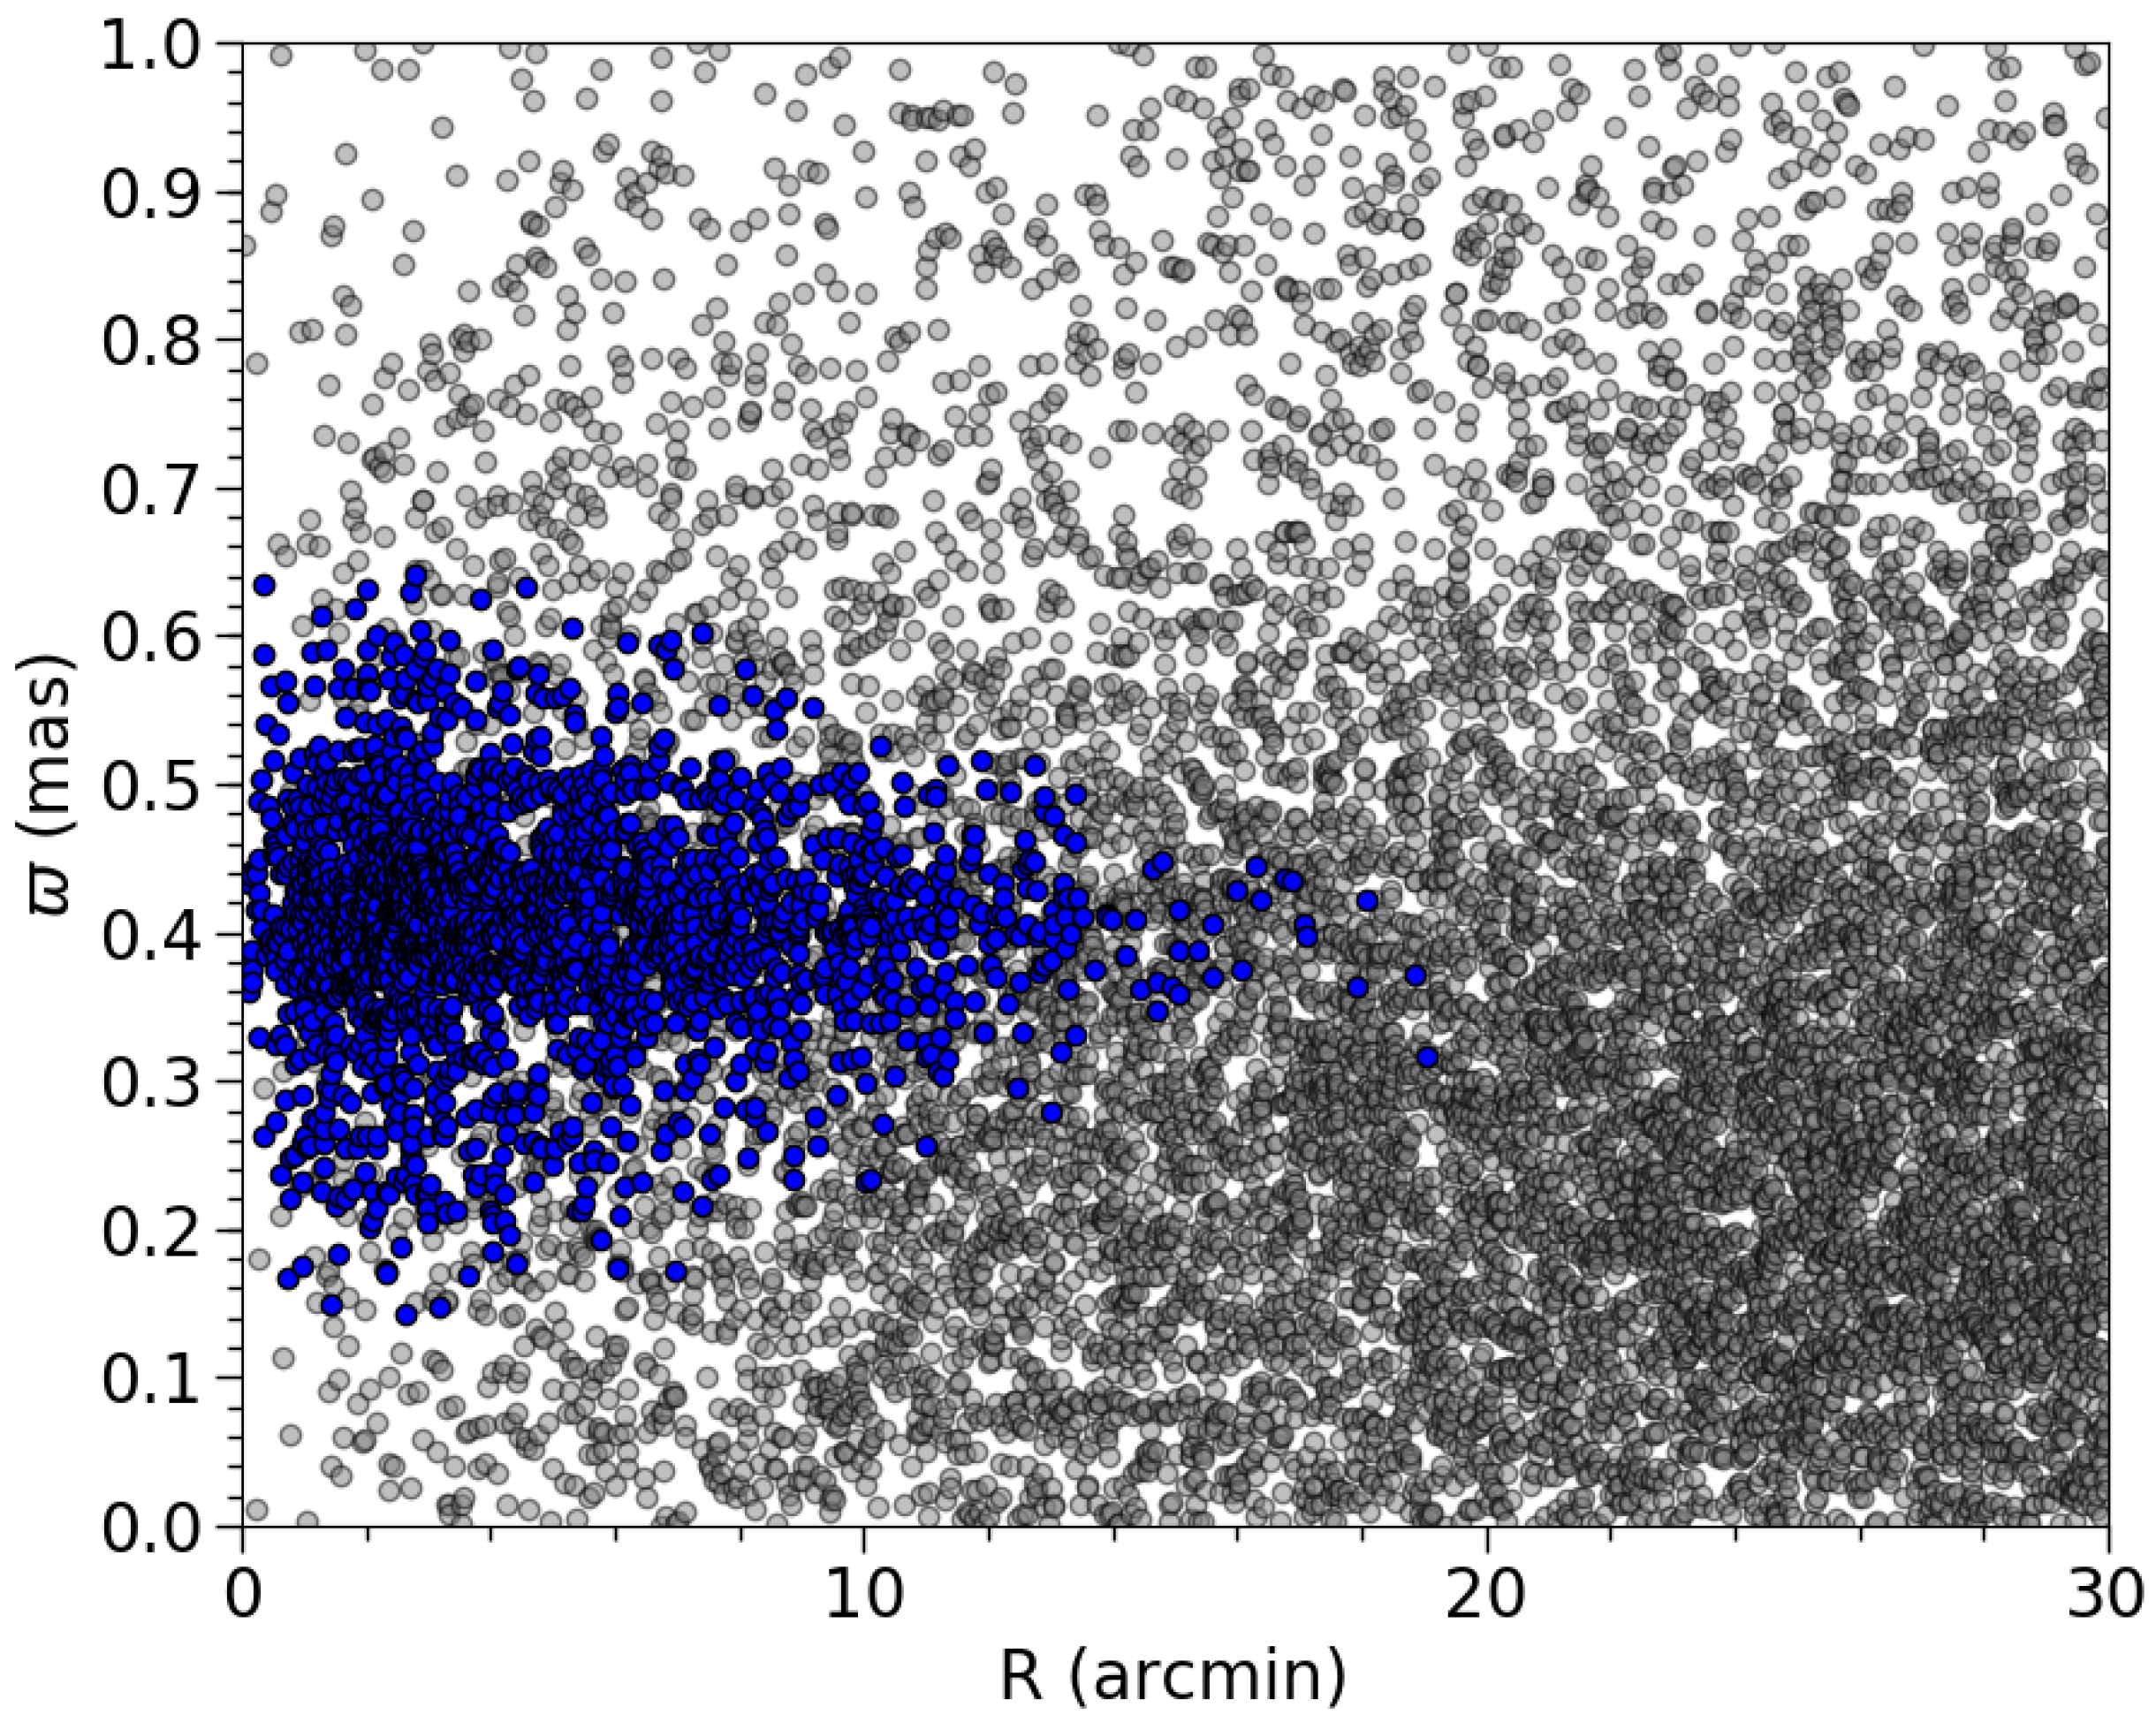
We obtained 1969 cluster members ( P 5 D 0.15) for NGC 6705 based on the membership probabilities (see Figure 1). Their CMDs, PM-VPDs, and parallax data indicate that the majority, if not all, of these stars are reliable members of NGC 6705 (see Figure 3, Figure 4 and Figure 5). As these cluster members extend up to 19 arcmin from the cluster center (equivalent to 12 pc at a distance of 2300 pc), they are well-suited for investigating the spatial structure of the cluster (see Figure 5).
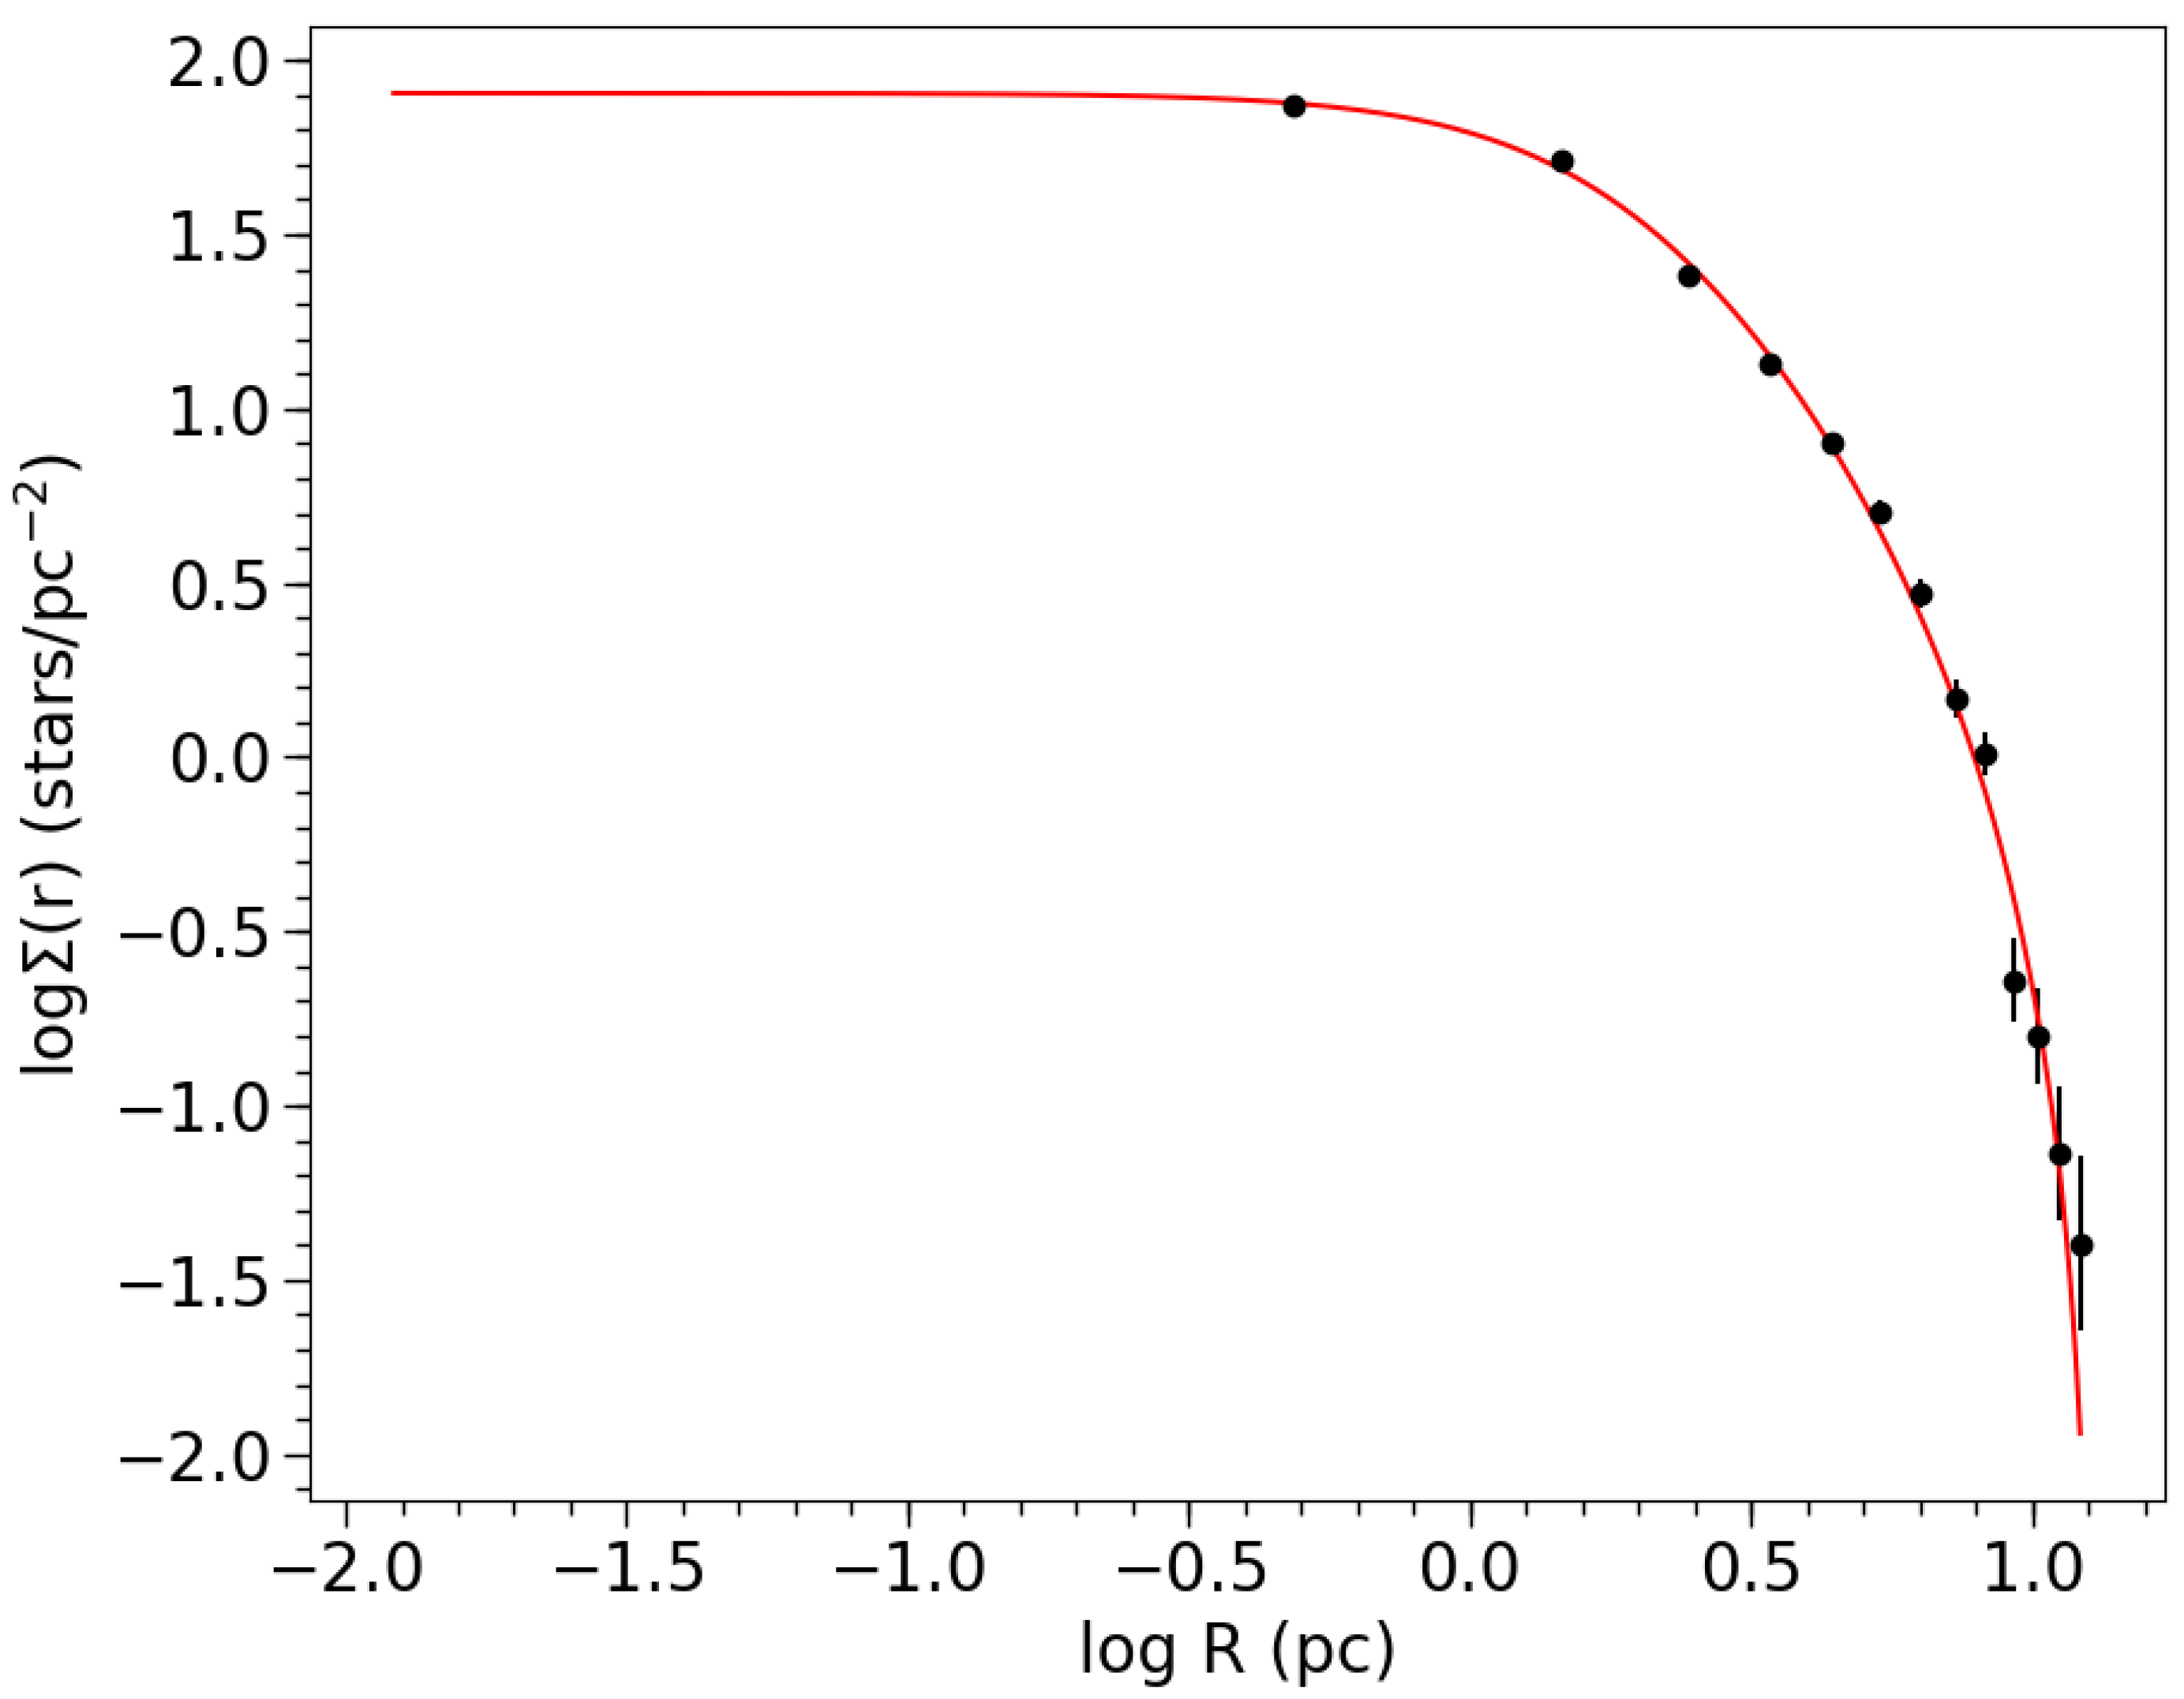
We estimated the core ( R c ) and tidal radii ( R t ) for NGC 6705 by fitting the radial density profile (RDP) of the cluster members (see Figure 6) to the King model [33]:
Σ ( r ) = k [ 1 1 + ( r / R c ) 2 1 1 + ( R t / R c ) 2 ] 2
where r is the radial distance to the cluster center and k is a constant. We take logarithms to see the density of the core and halo structure in more detail. The core and tidal radii were determined to be R c = 3.11 ± 0.21 and R t = 20.02 ± 0.71 arcmin, respectively.
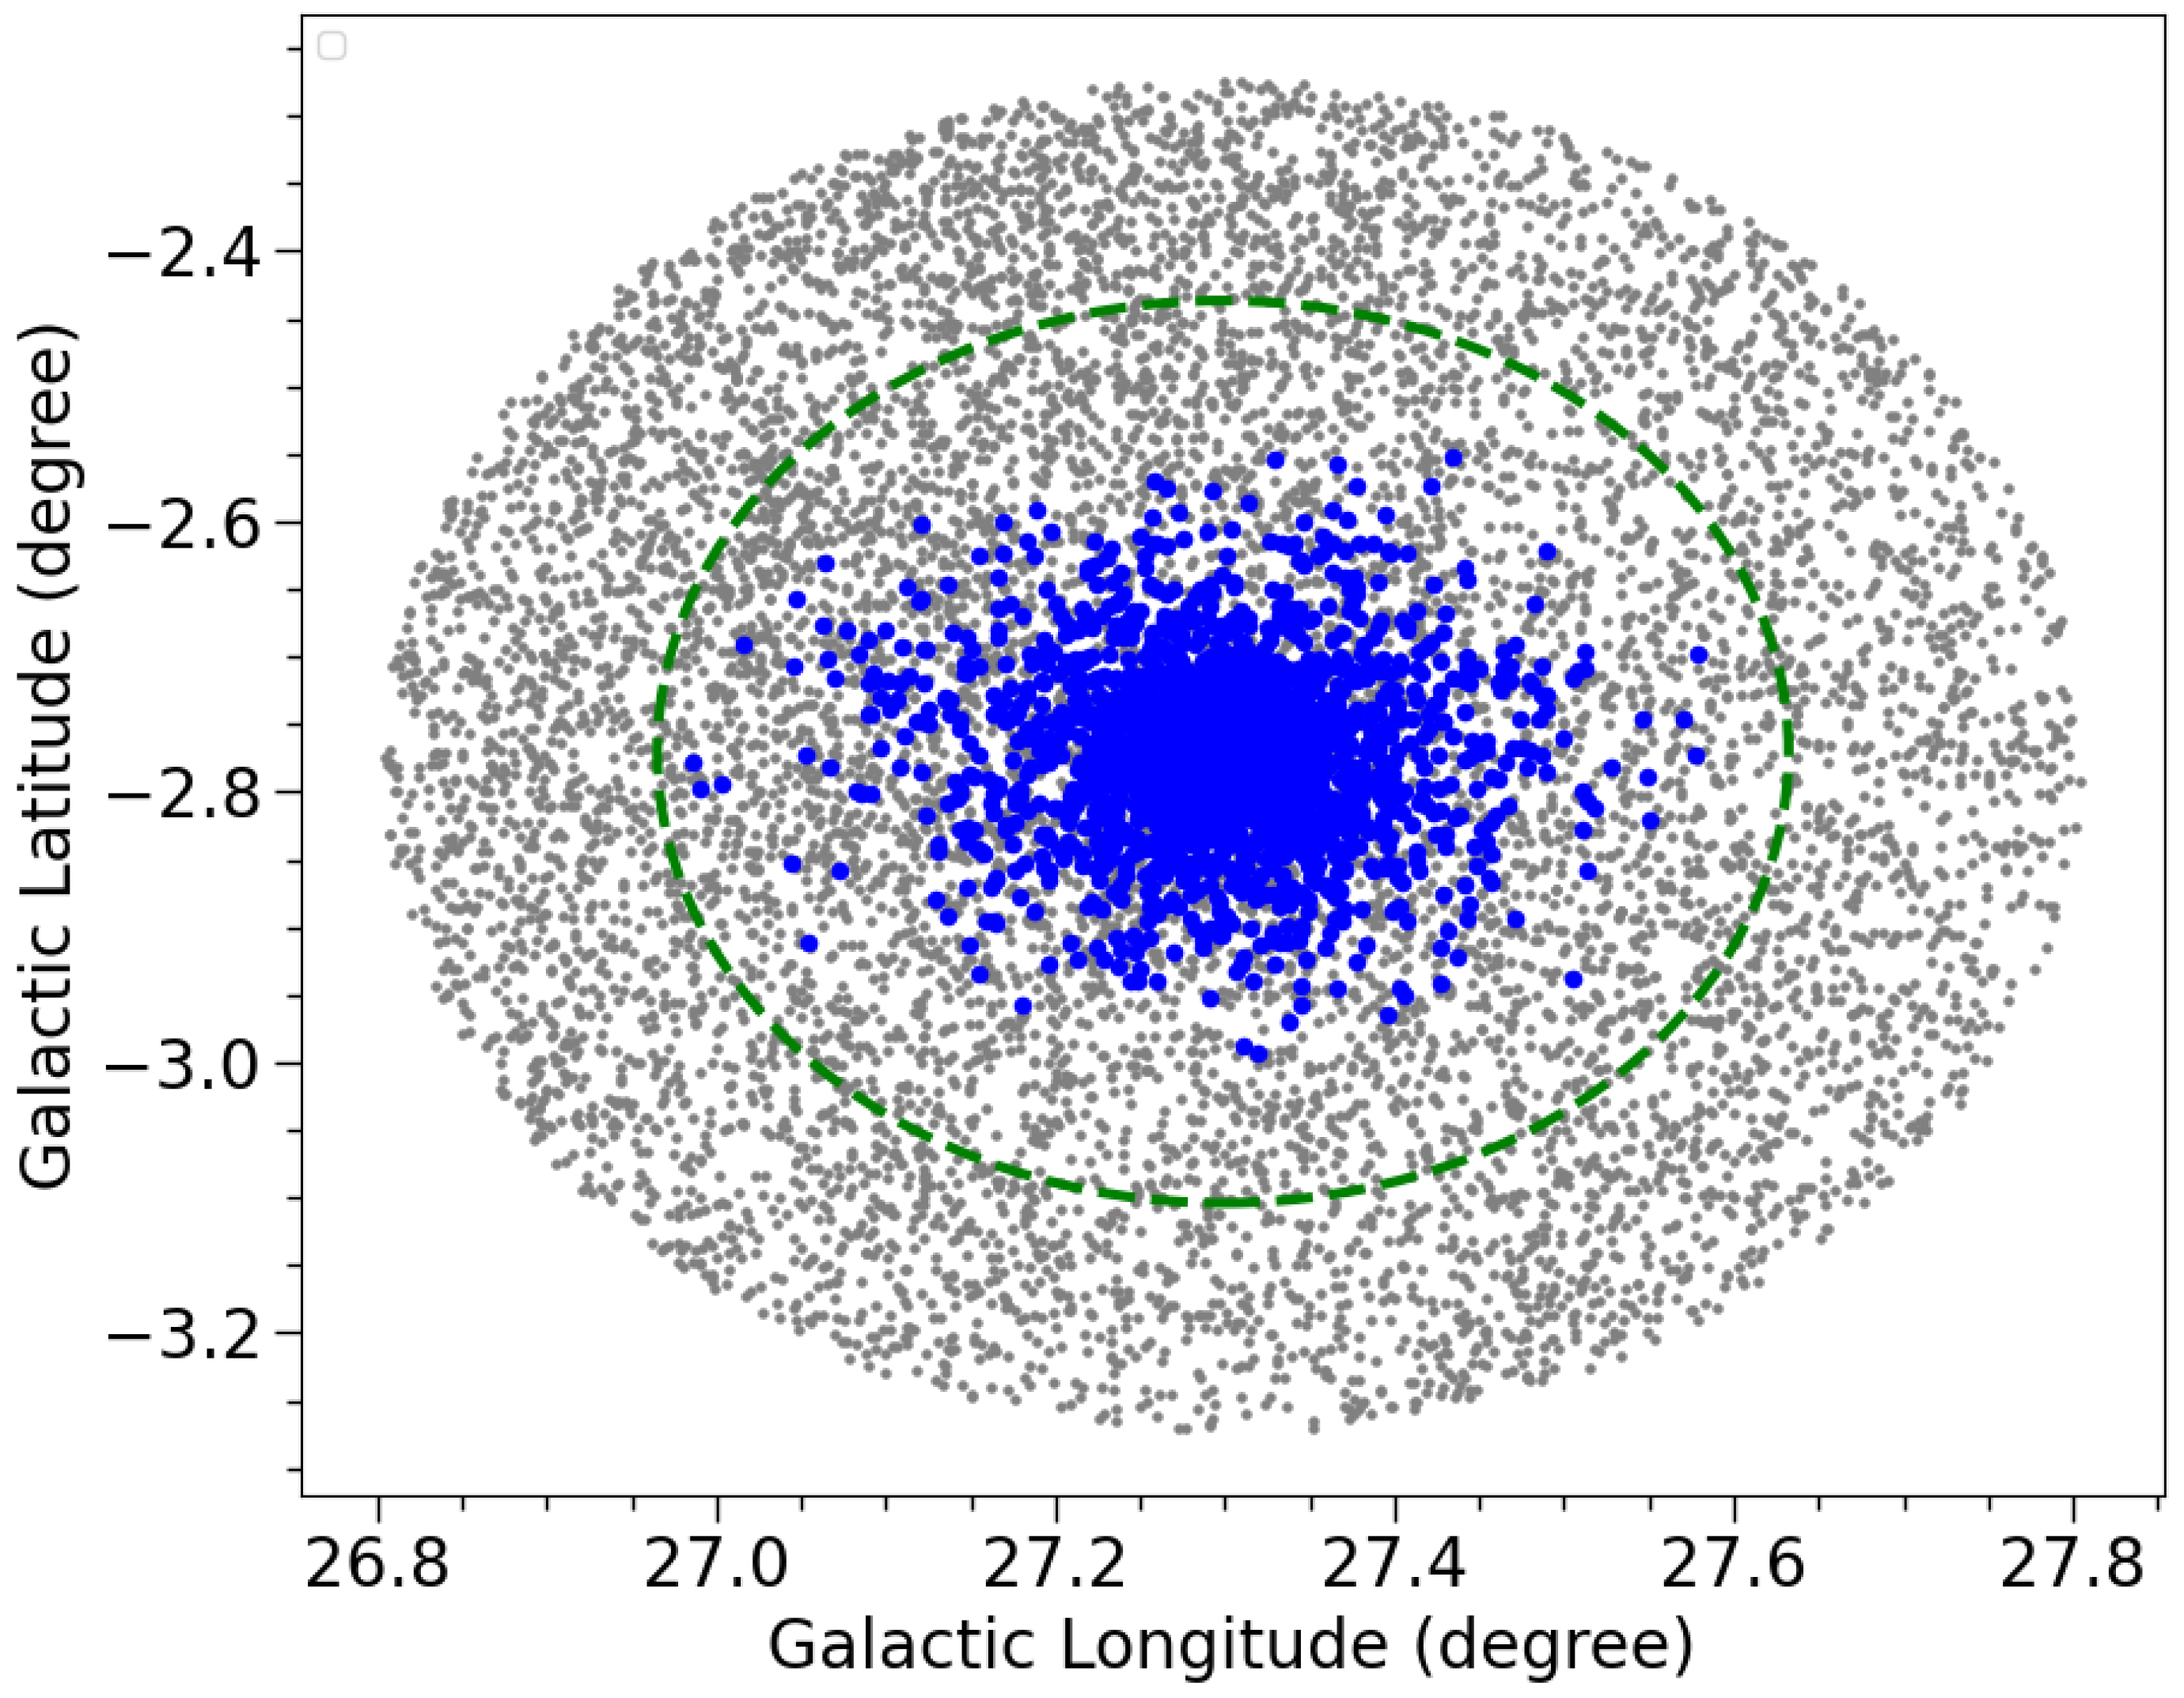
A centrally concentration parameter of C = log( R c / R t ) ≈ 0.81 was determined for the cluster, indicating that NGC 6705 has a high density in its central region, meaning that the stars in the core of the cluster are very closely packed, with strong mutual gravitational interactions between the member stars, possibly forming a relatively tight core. Hunt and Reffert [7] obtained core and tidal radii of 5.9 arcmin and 10.73 arcmin, respectively, while our results indicate a smaller core radius and a larger tidal radius. This discrepancy may be due to differences in member stars, as our method identifies a larger number of reliable member stars. In addition, our tidal radius is smaller than those reported by Kos and Just et al. [34], who estimated a tidal radius of 25.3 arcmin. This may be due to the different data usage, leading to differences in the results. Moreover, Kos and Just et al. did not specify the errors. We used stricter member selection, excluding stars further from the cluster, resulting in a smaller tidal radius. Figure 7 shows the spatial distribution of the cluster; cluster members can be seen to be spatially concentrated.
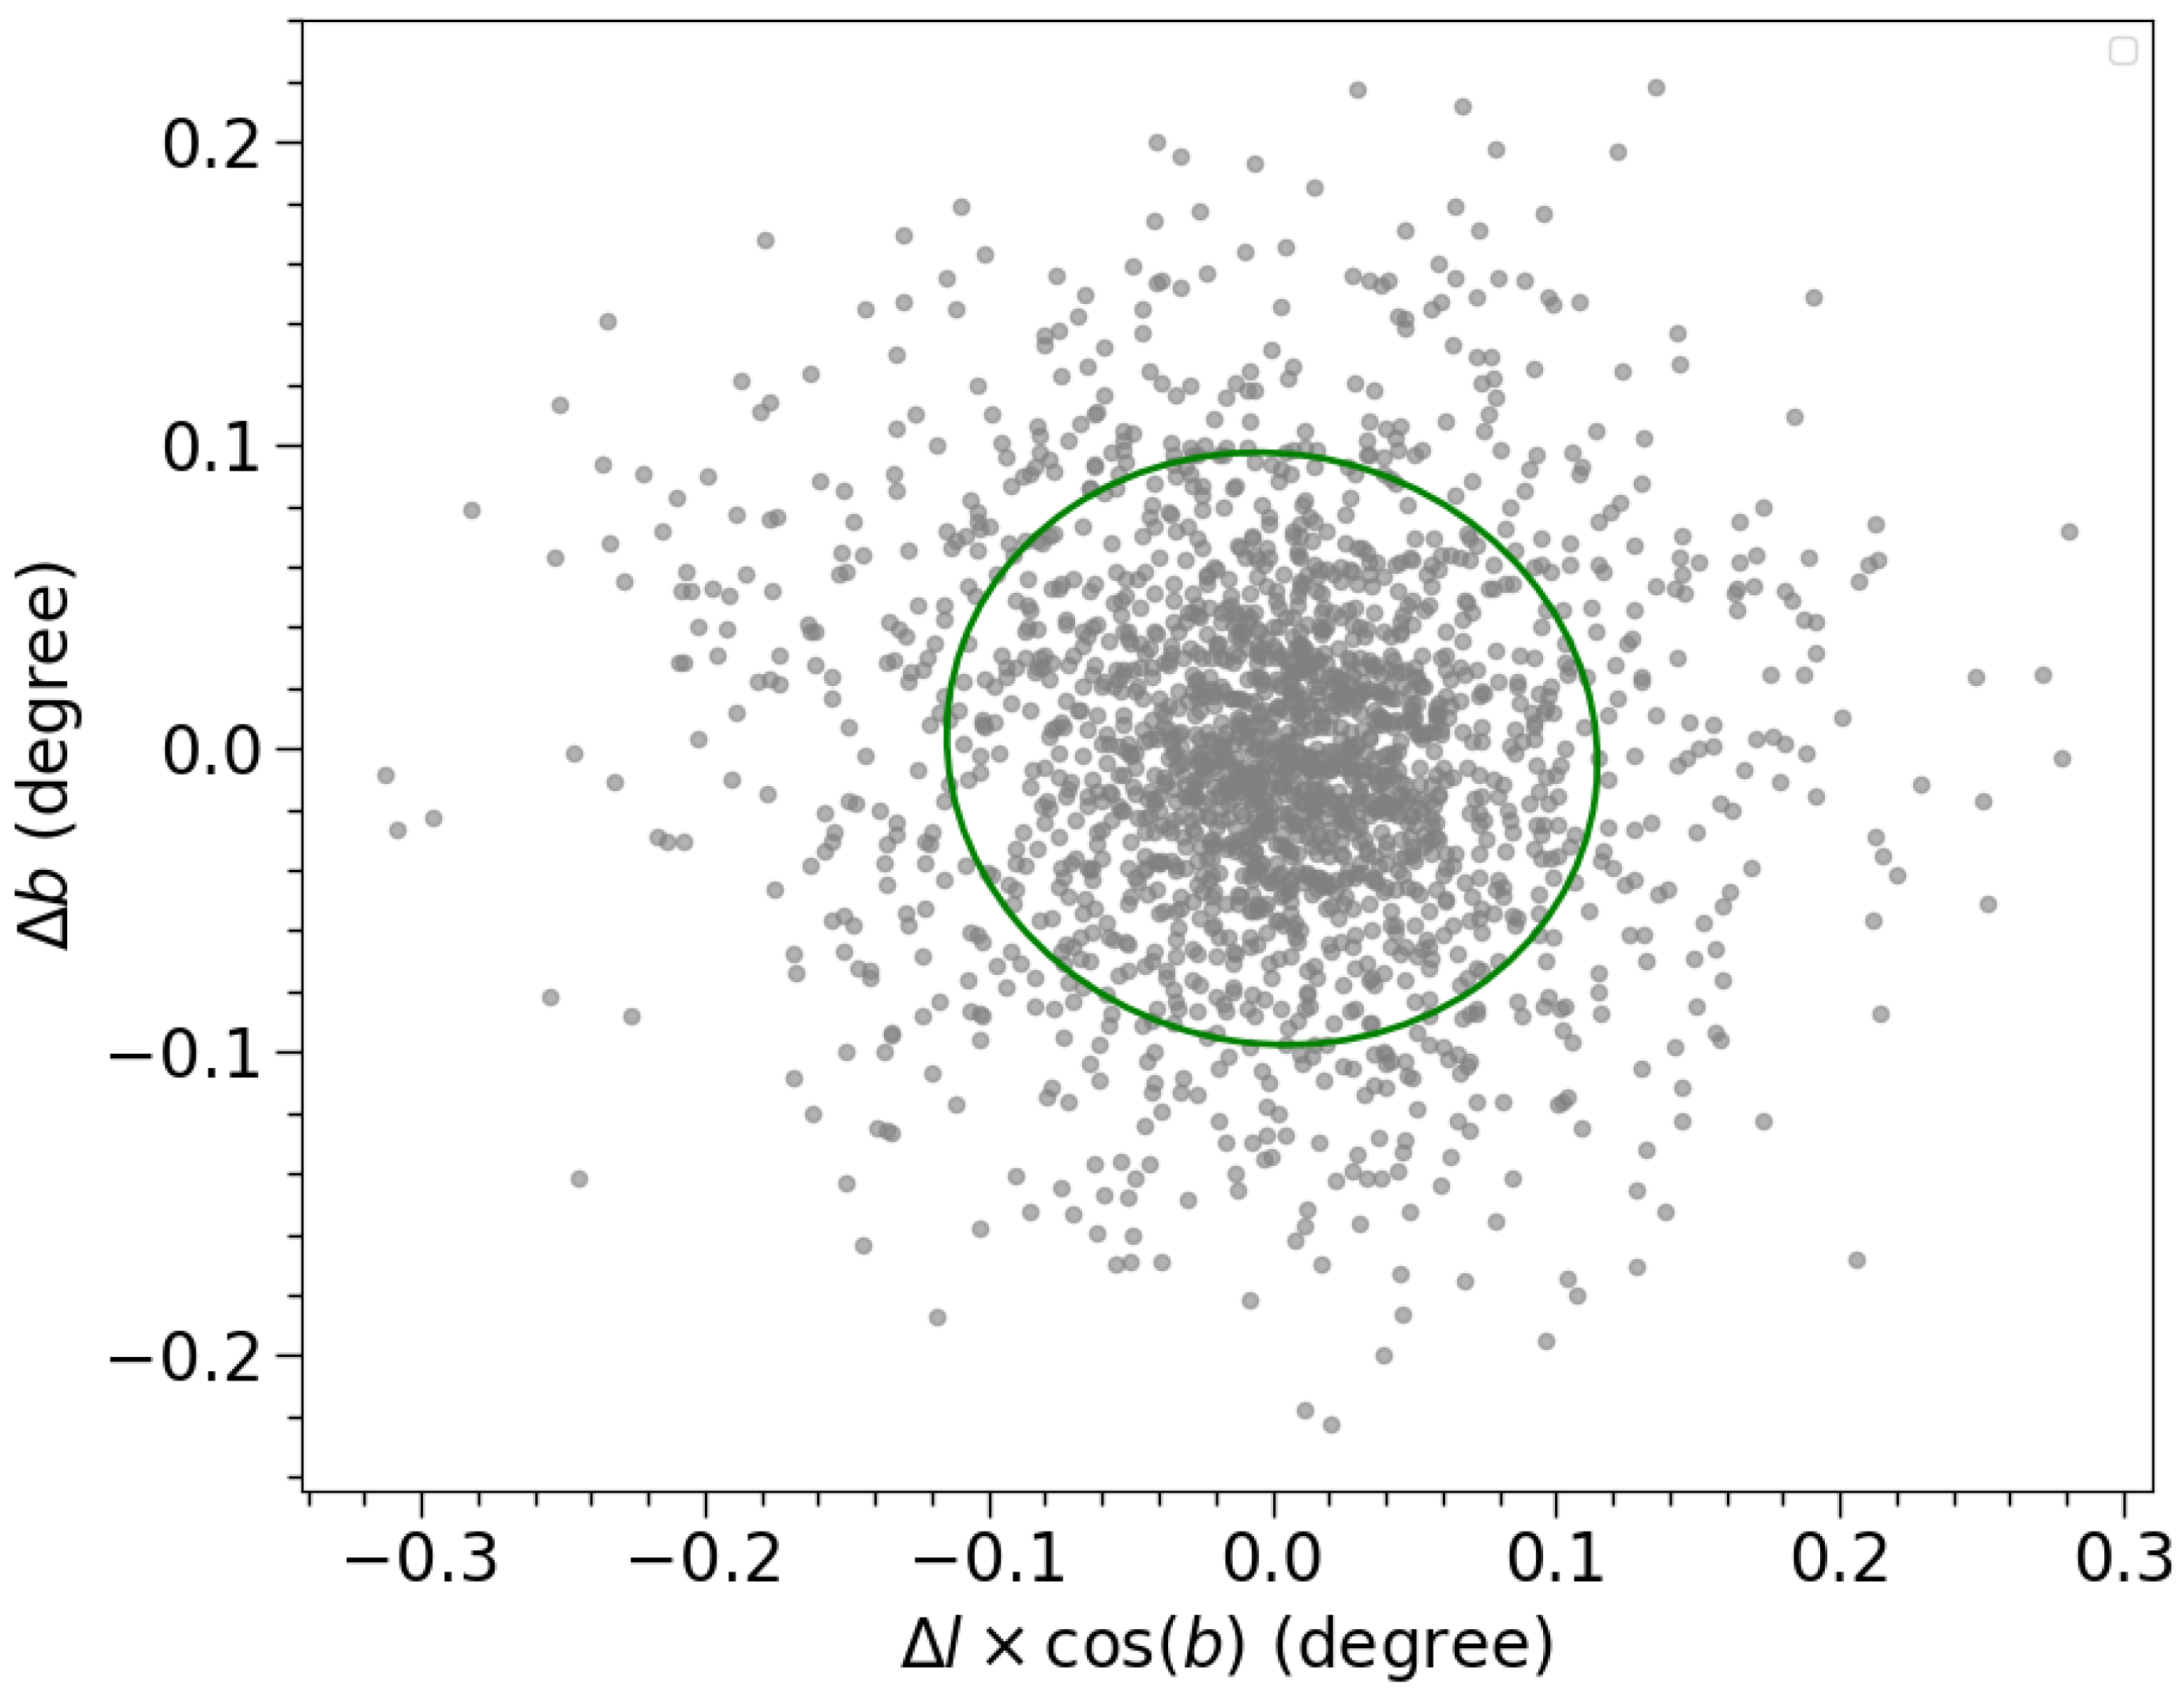
We used the standard deviation ellipse (SDE) to analyze the shape of NGC 6705 (see Figure 8). NGC 6705 exhibits an elongated form, which can be roughly characterized by an ellipse with a semi-major axis of a = 13 . ´ 7 (∽9.2 pc) and a semi-minor axis of b = 11 . ´ 6 (∽7.8 pc). a and b were estimated based on three times the standard deviations of the spatial positions along the major and minor axes, respectively. We speculate that the elongated shape of the cluster is influenced by the tidal field.
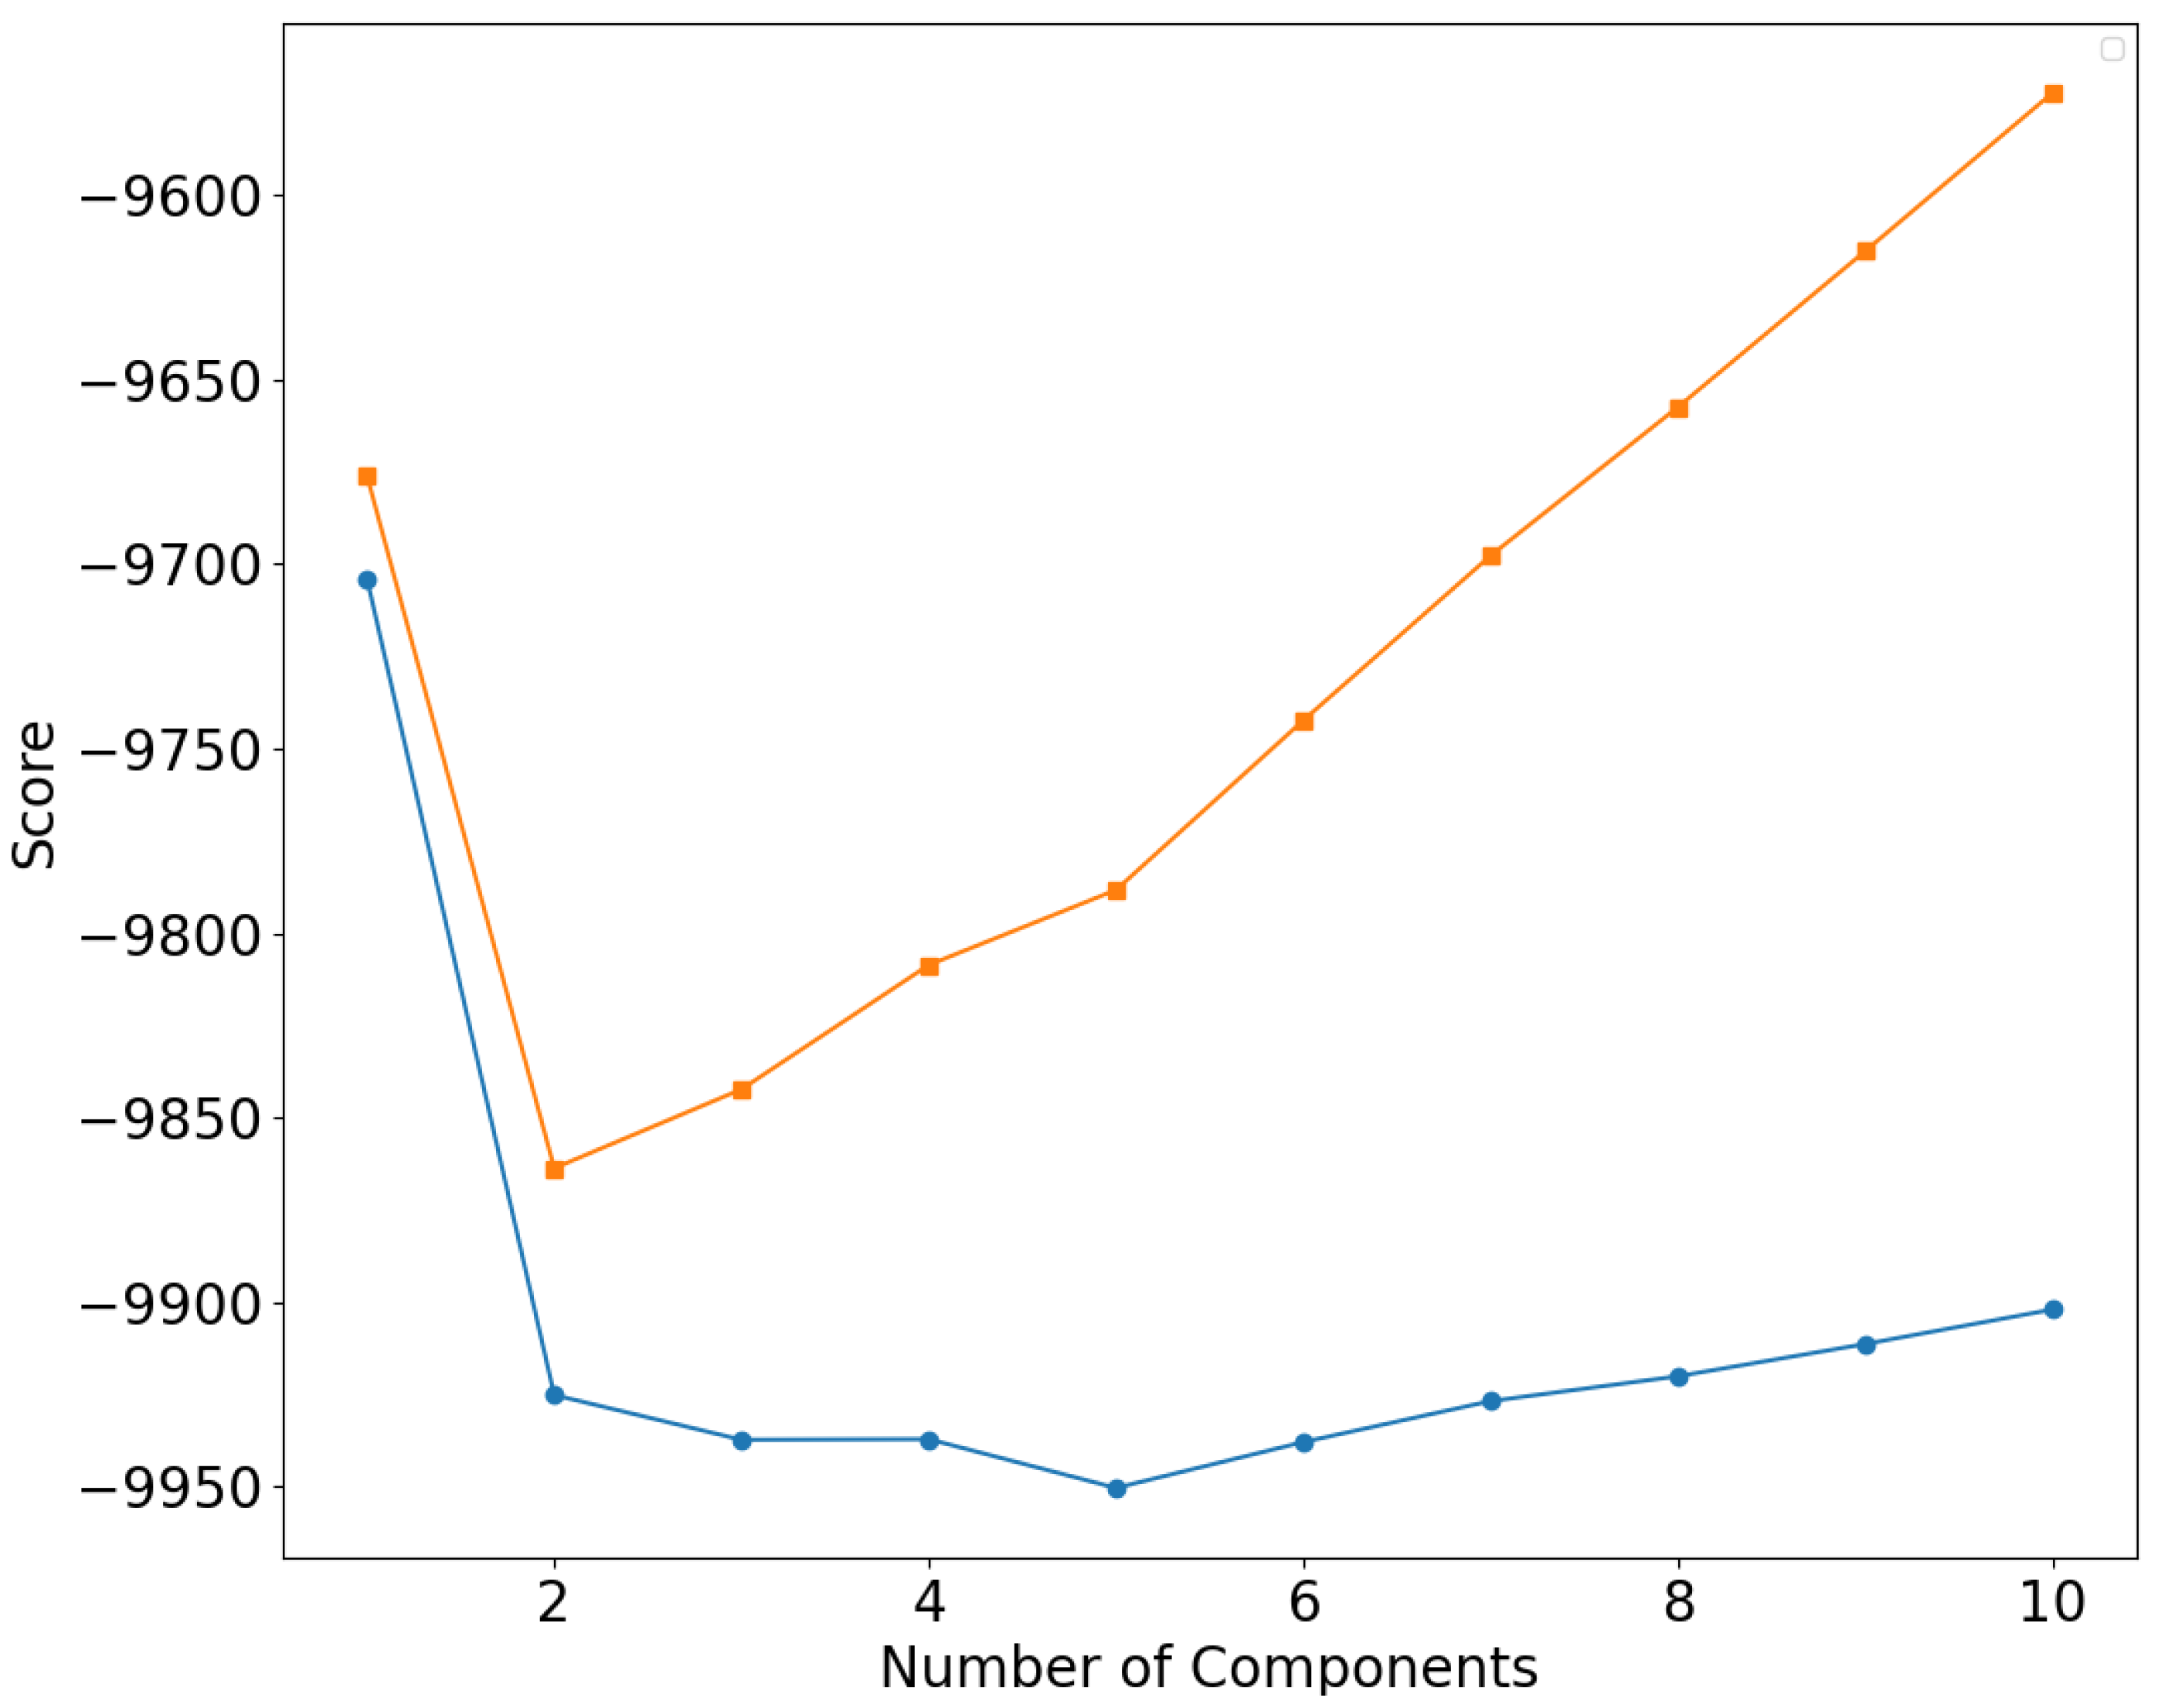
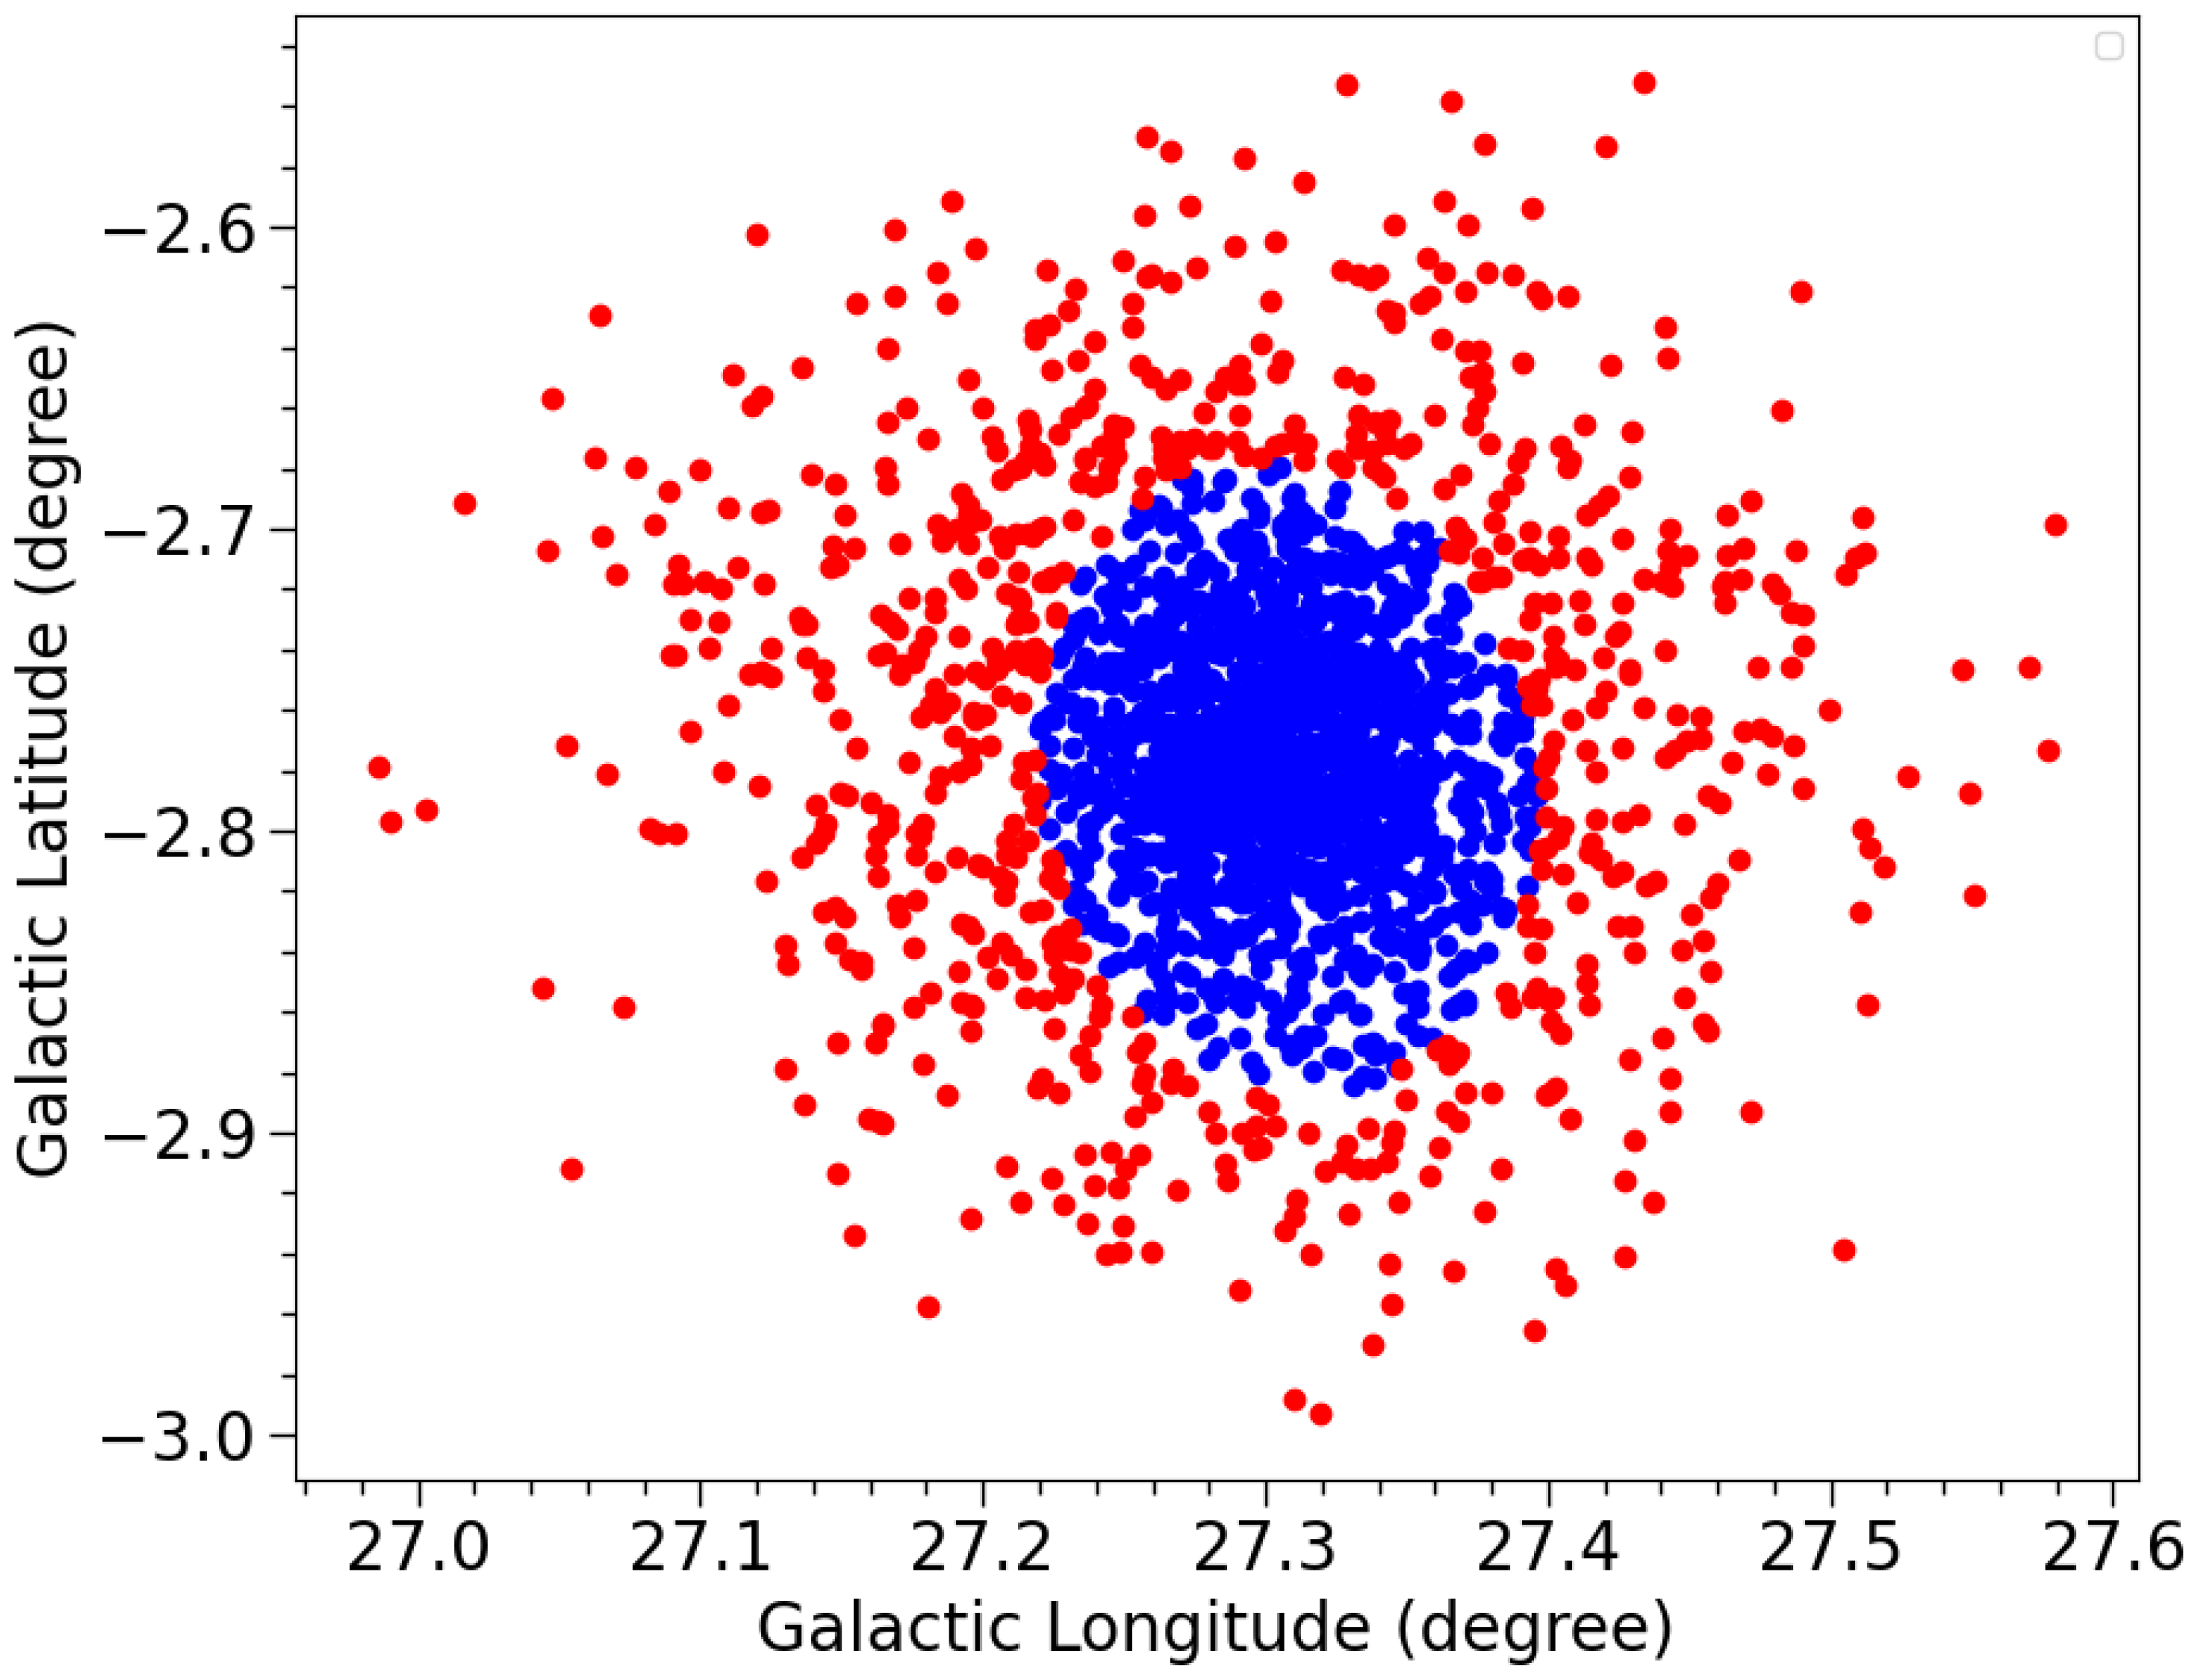
In this study, to effectively divide the core and halo of the NGC 6705 cluster, we employed the GMM to perform clustering analysis on the spatial distribution of the cluster members. We extracted the 2D spatial positions ( l , b ) of the 5D cluster members and calculated their relative positions with respect to the cluster center. Based on different numbers of Gaussian components, we calculated the Akaike Information Criterion (AIC) and Bayesian Information Criterion (BIC) to evaluate the performance of the models (see Figure 9). AIC and BIC are commonly used model selection criteria. We explored GMM with component numbers ranging from 1 to 10 and successfully distinguished the core and halo by analyzing both AIC and BIC values. This suggests that NGC 6705 can be naturally divided into core and halo using a two-component GMM (see Figure 10). The diagonal elements of the 2 × 2 full covariance matrix of the two-component GMM provide valuable insights into the cluster structure; it is evident that the core ( σ l l = 2.2 , σ b b = 2.4 ) is more concentrated than the halo ( σ l l = 7.0 , σ b b = 5.6 ). This indicates that NGC 6705 has developed a distinct core–halo structure through dynamical evolution. We have identified 1279 stars in the core and 690 stars in the halo. In addition, we computed the proper motions for members of the core and halo regions of the NGC 6705 cluster. The results show that the mean proper motion directions of the core and halo regions are very close to each other, with a mean RA of −1.543 mas/yr and a DEC of −4.167 mas/yr in the core region and a mean RA of −1.539 mas/yr and a DEC of −4.163 mas/yr in the halo region. This suggests that, although these two regions are different in terms of their spatial distributions, their directions of motion are almost the same. The arrows represent the direction of the stars’ total proper motions (see Figure 11). The key parameters for both the core and halo components are provided in Table 2.
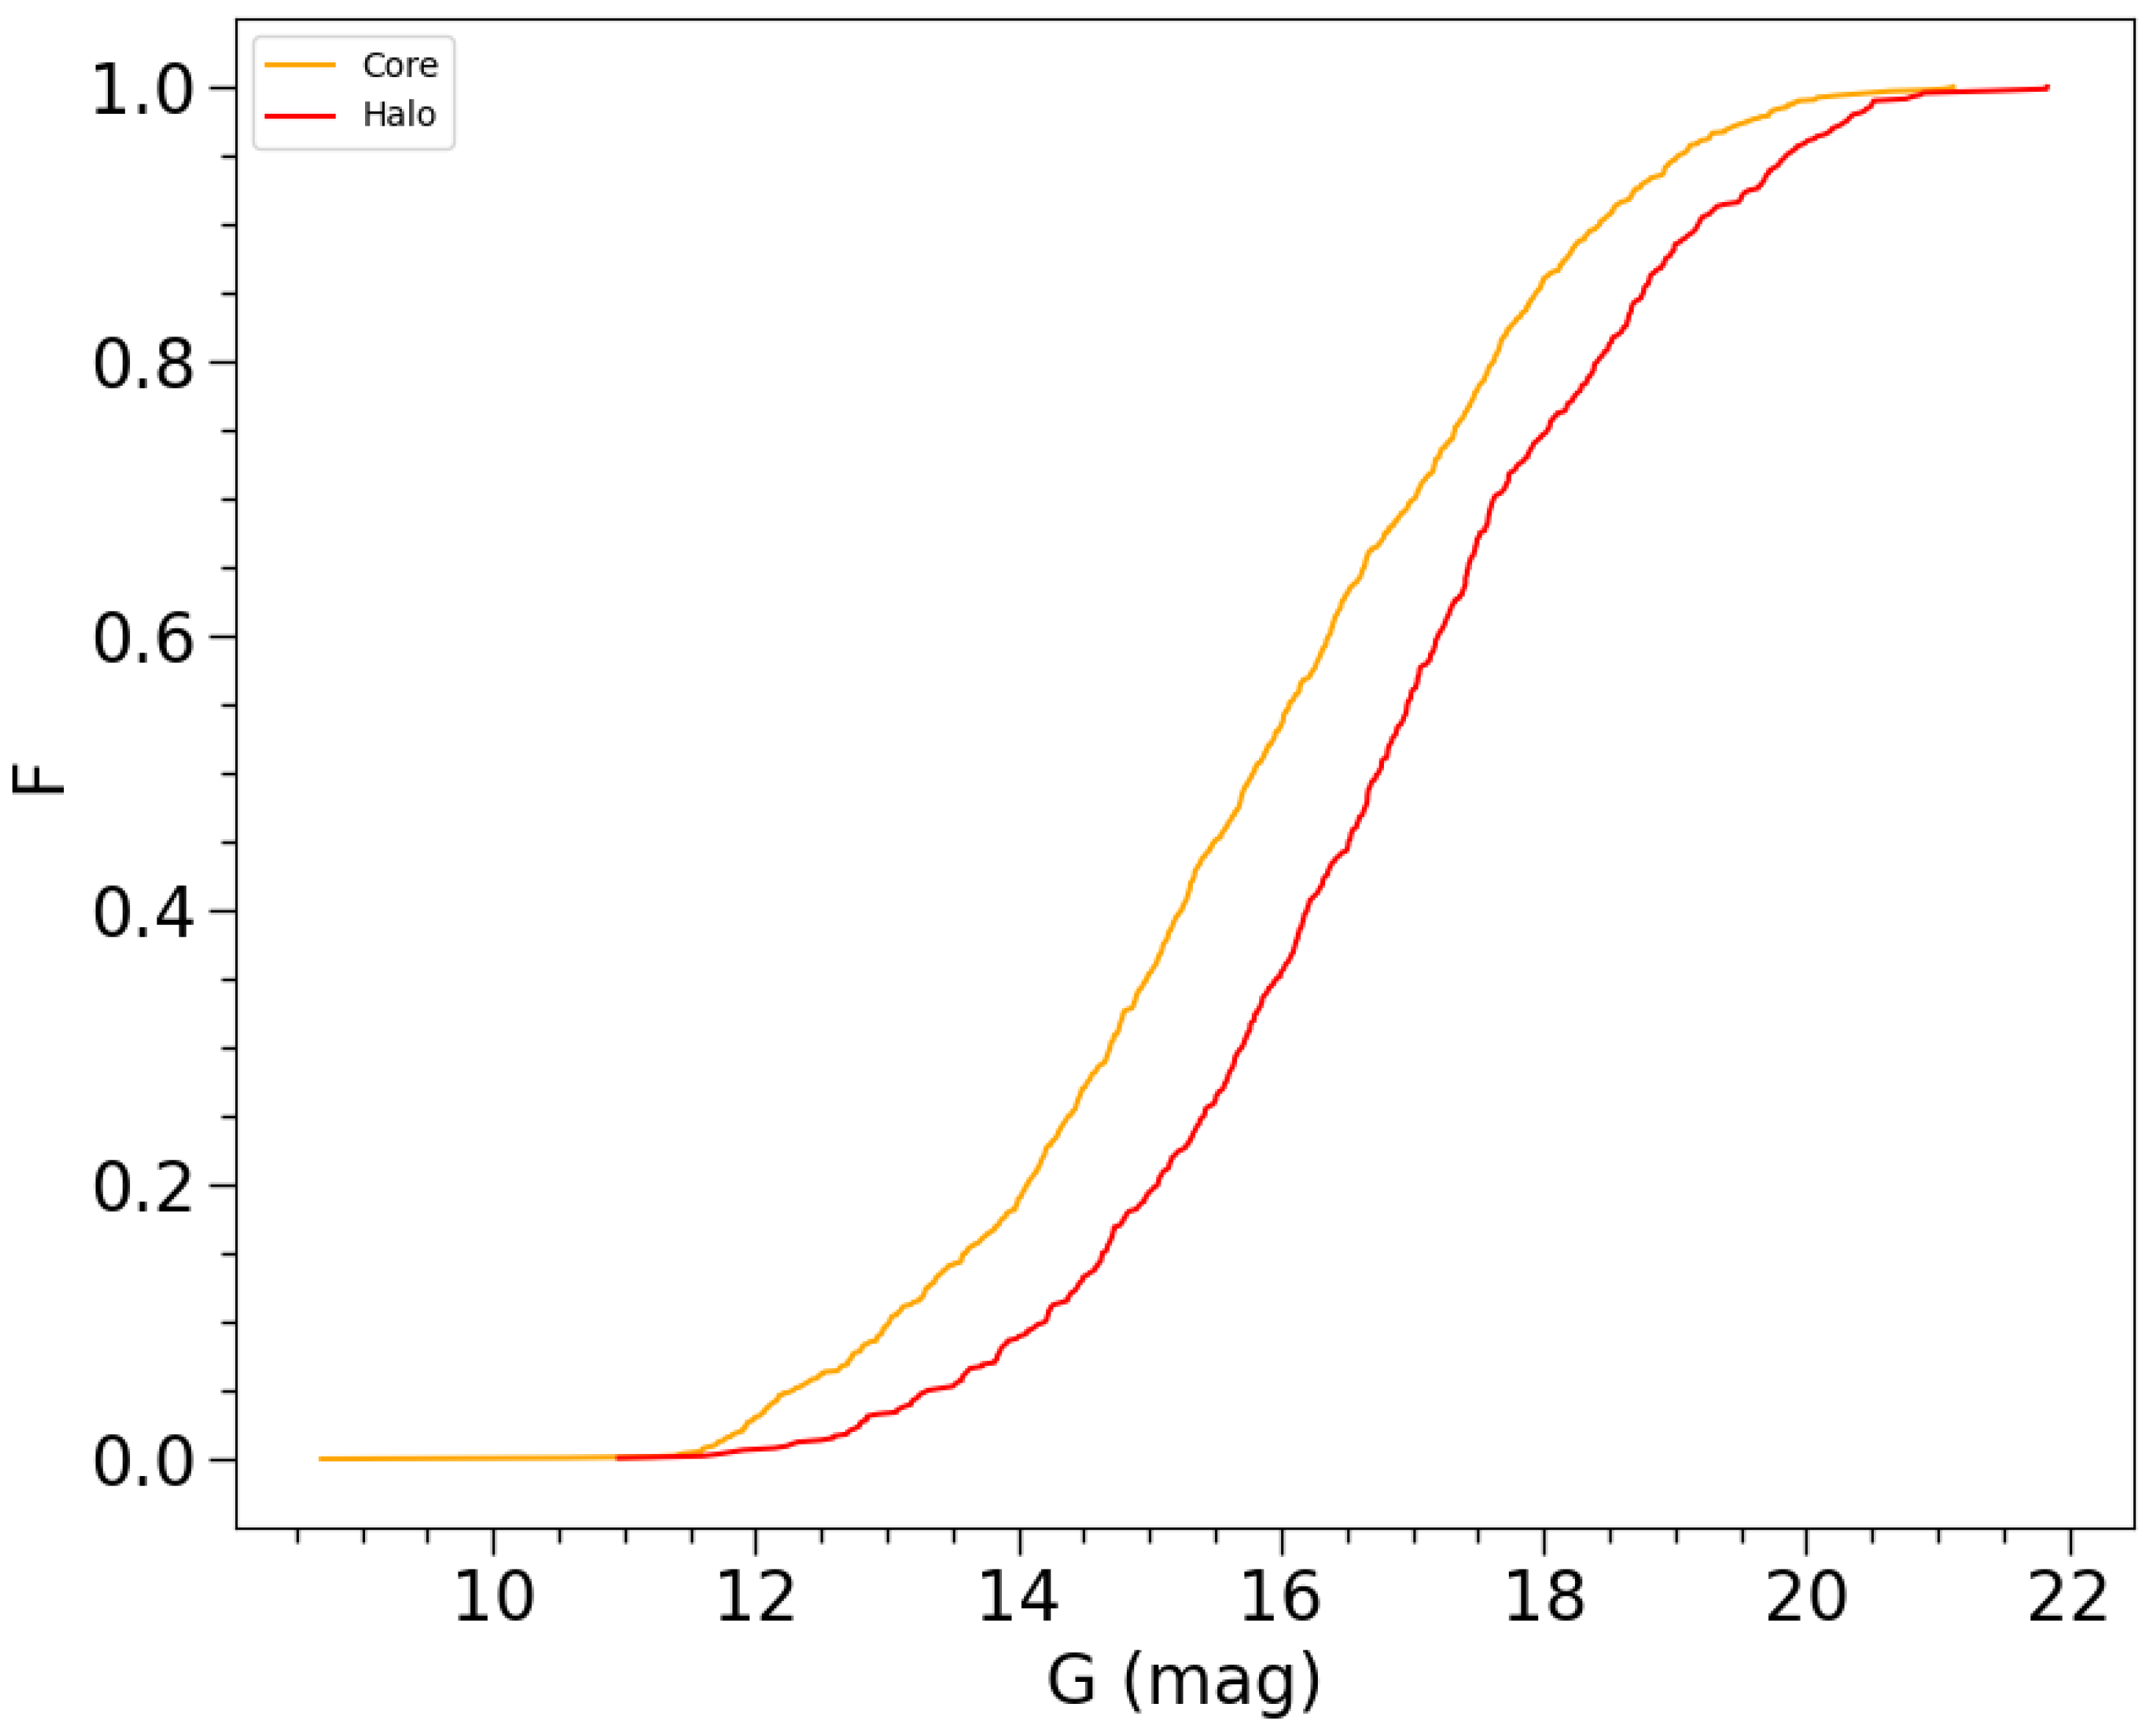
Next, we used principal component analysis (PCA) to estimate the lengths of the semi-major axis (a) and semi-minor axis (b) for the core and halo. PCA is a commonly used dimensionality reduction technique that projects high-dimensional data onto a few principal components through linear transformation [35,36]. These principal components represent the directions of maximum variance in the data. The first principal component (PC1) represents the direction with the greatest variance in the data distribution, while the second principal component (PC2) represents the direction with the second greatest variance; these major and minor axes reflect the primary distribution patterns of the data (see Figure 12). At the same time, they also allow for an accurate estimation of the ellipticites (e = b/a) of the core and halo. For the core, we obtained standard deviations of σ 1 = 2.4 and σ 2 = 2.2 for PC1 and PC2, respectively. The core has a semi-major axis of a = 3 σ 1 7 (∽4.5 pc) and a semi-minor axis of b = 3 σ 2 6 (∽3.9 pc). The ellipticity of the core was determined to be e∽ 0.89, suggesting that NGC 6705 has a nearly circular core that is less affected by the tidal field. For the halo, we calculated the standard deviations of PC1 and PC2 as σ 1 = 7.0 and σ 2 = 5.6 , respectively. These values are appropriate for estimating the spatial size of the halo; it has a semi-major axis of a = 3 σ 1 21 (∽13.6 pc) and a semi-minor axis of b = 3 σ 2 17 (∽11.0 pc). The ellipticity of the halo (e = b/a∽0.80) indicates that its shape is significantly influenced by the tidal field of the galaxy. The fundamental parameters ( σ 1 , σ 2 , e) for both the core and halo, derived from PCA, are also listed in Table 2. As shown in Figure 12, the gap between the halo and core regions represents areas where member stars have been lost because of the influence of the galactic tidal force or the internal dynamical evolution of the cluster. This phenomenon is related to the effect of mass segregation in the cluster, where higher-mass member stars tend to gather in the core region, while lower-mass member stars are more likely to be distributed in the outer regions. From this, we infer that the halo of NGC 6705 is still in an early stage of dynamical evolution and has not yet experienced a sufficiently long period to form a fully symmetrical halo structure. According to the cumulative G magnitude distribution (see Figure 13), core members (orange curve) are more densely distributed in the brighter magnitude range, while halo members (red curve) have a higher proportion in the fainter magnitude range. This difference indicates that mass segregation has occurred within the cluster, with brighter members tending to concentrate in the core region and fainter members more likely to be distributed in the halo. This distribution feature supports the conclusion that mass segregation leads to structural differences between the core and halo, reflecting the distribution pattern of members with different masses during the dynamical evolution of the cluster.

4. Extra-Tidal Members

In this study, after identifying reliable 5D ( l , b , ϖ , μ α c o s δ , μ δ ) cluster members, we conducted clustering analysis using 3D ( l , b , ϖ ) data, focusing on kinematic parameters to further identify members located outside the tidal radius. In the clustering analysis based on 3D data, position parameters are removed, but the kinematic parameters (self and parallax) are retained. This means that we now pay more attention to stars that may have changed in position but are still kinematically aligned with the cluster [37]. Because of tidal forces, these stars may have deviated from their original positional characteristics outside the tidal radius, but their kinematics may still be consistent with the cluster members. Therefore, clustering analysis based on 3D data can help us identify these extra-tidal stars that are still kinematically part of the cluster.
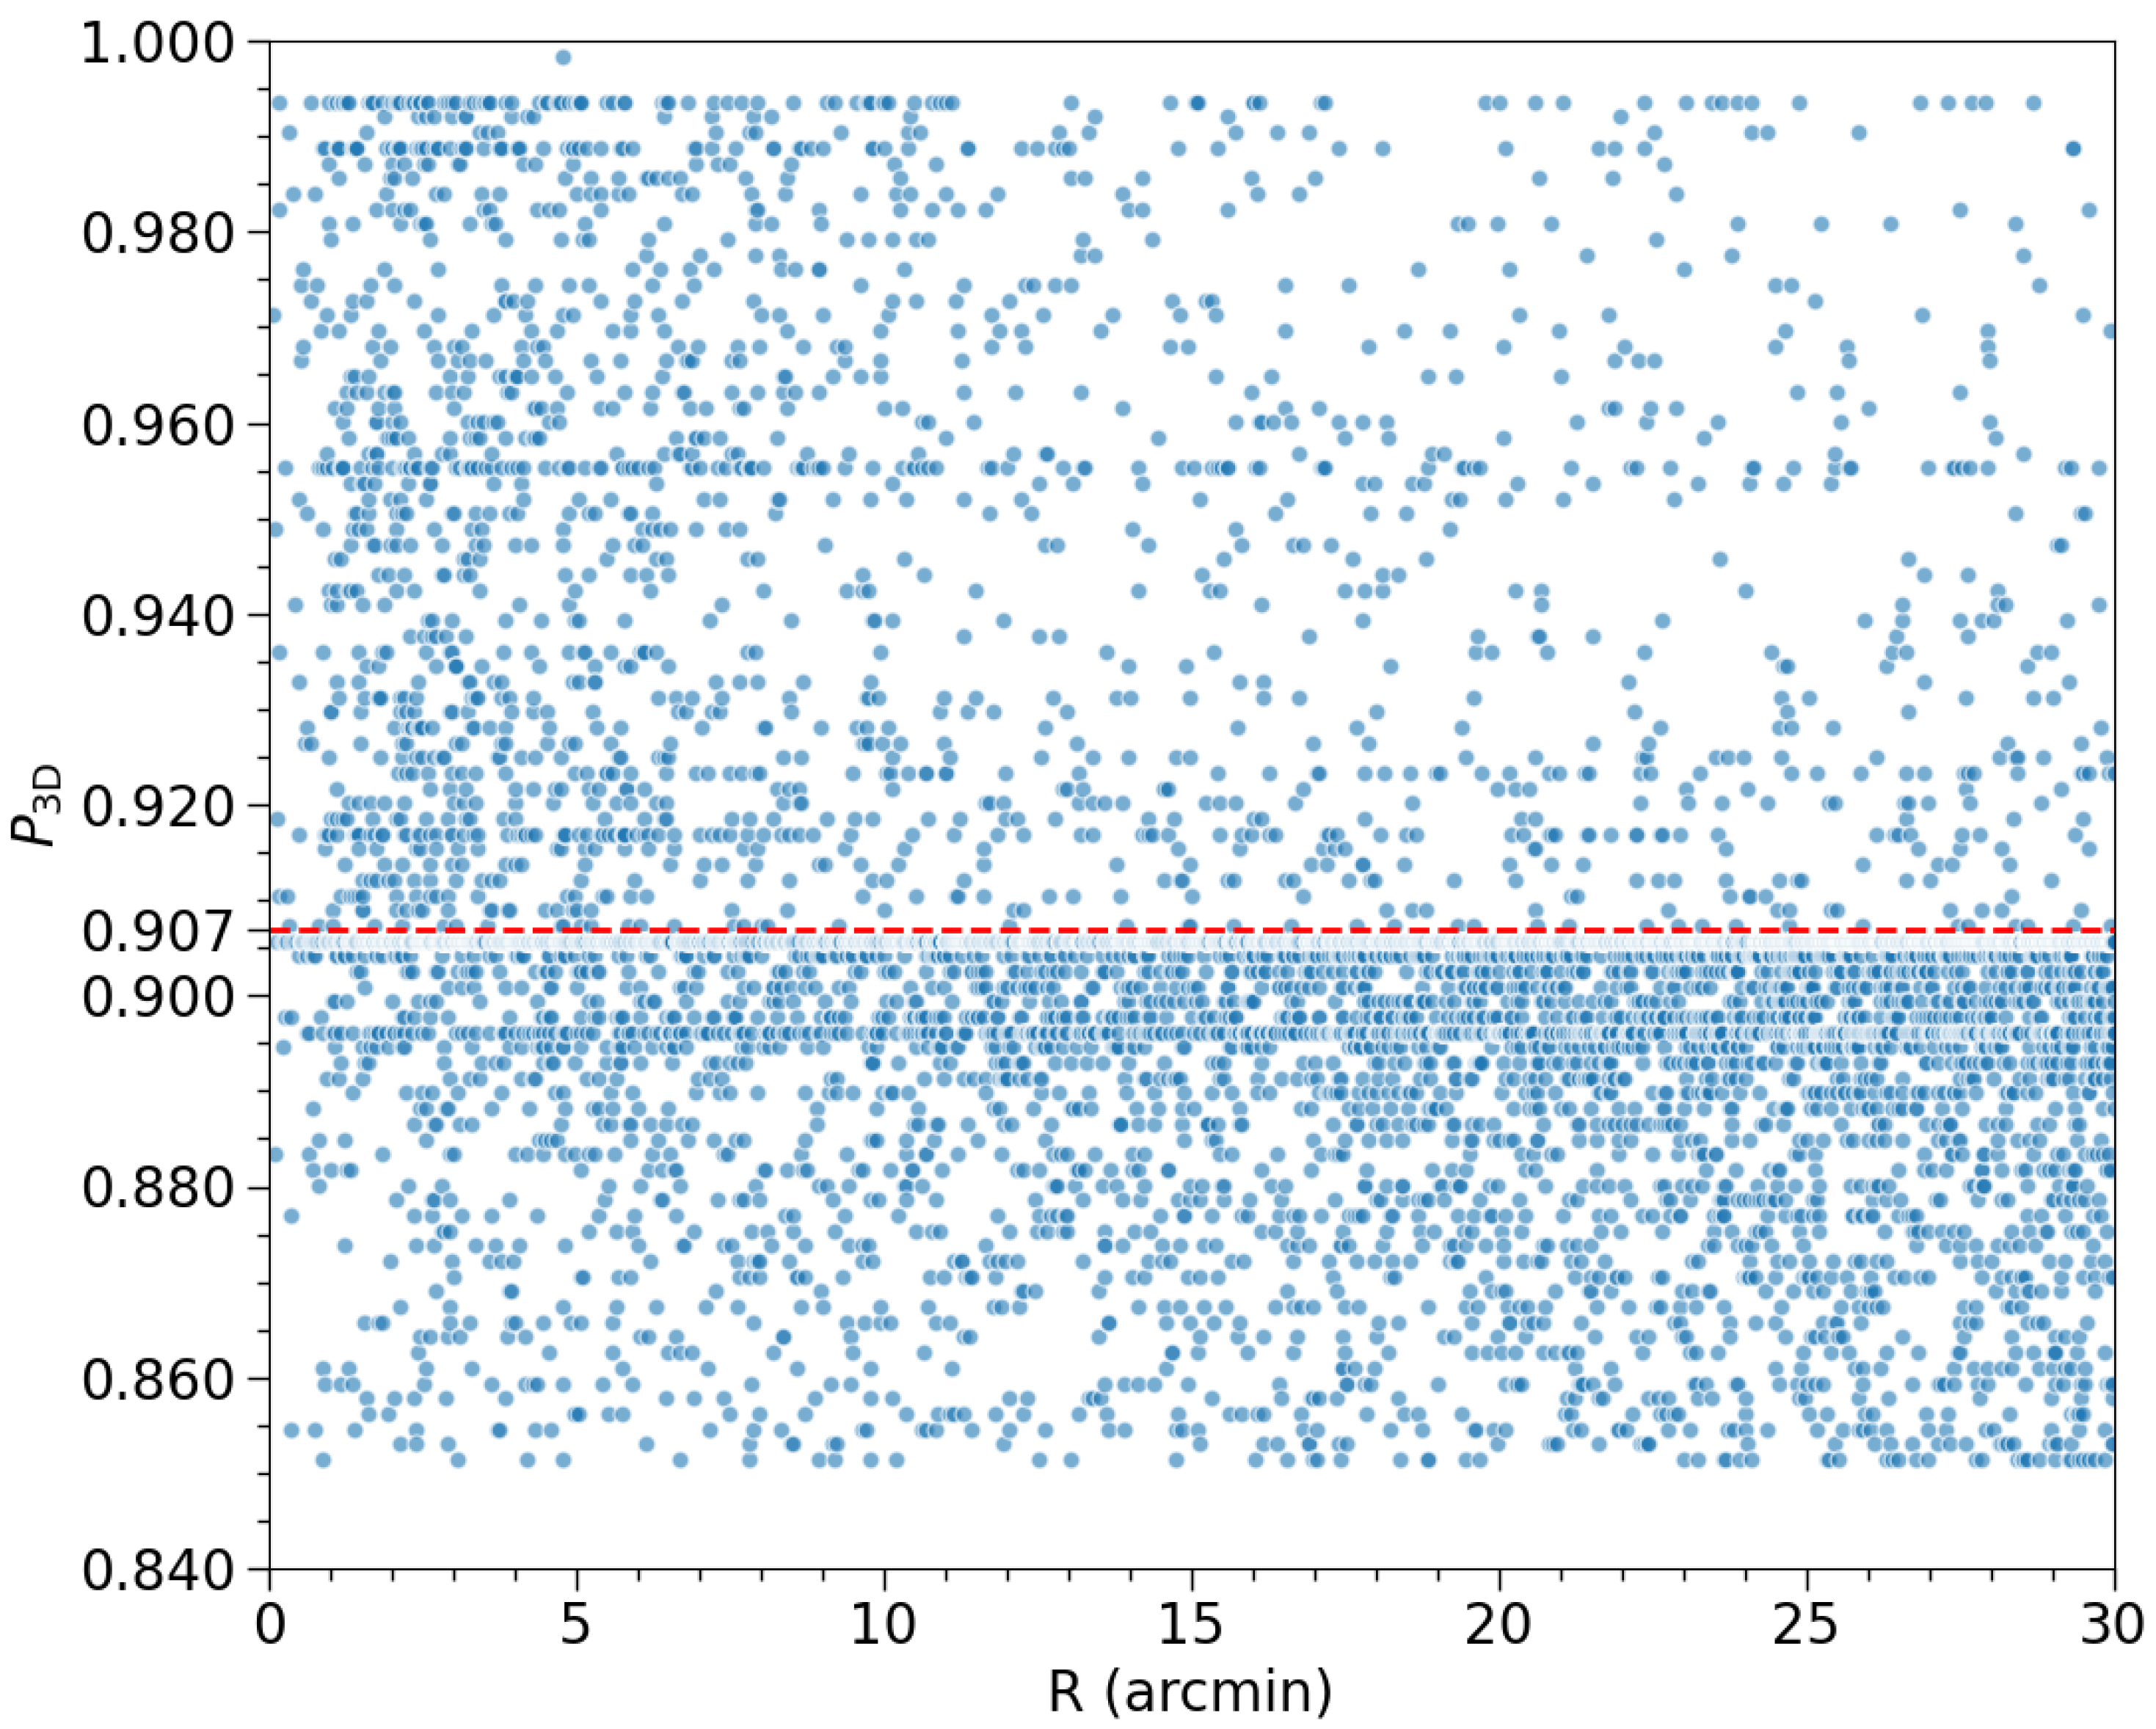
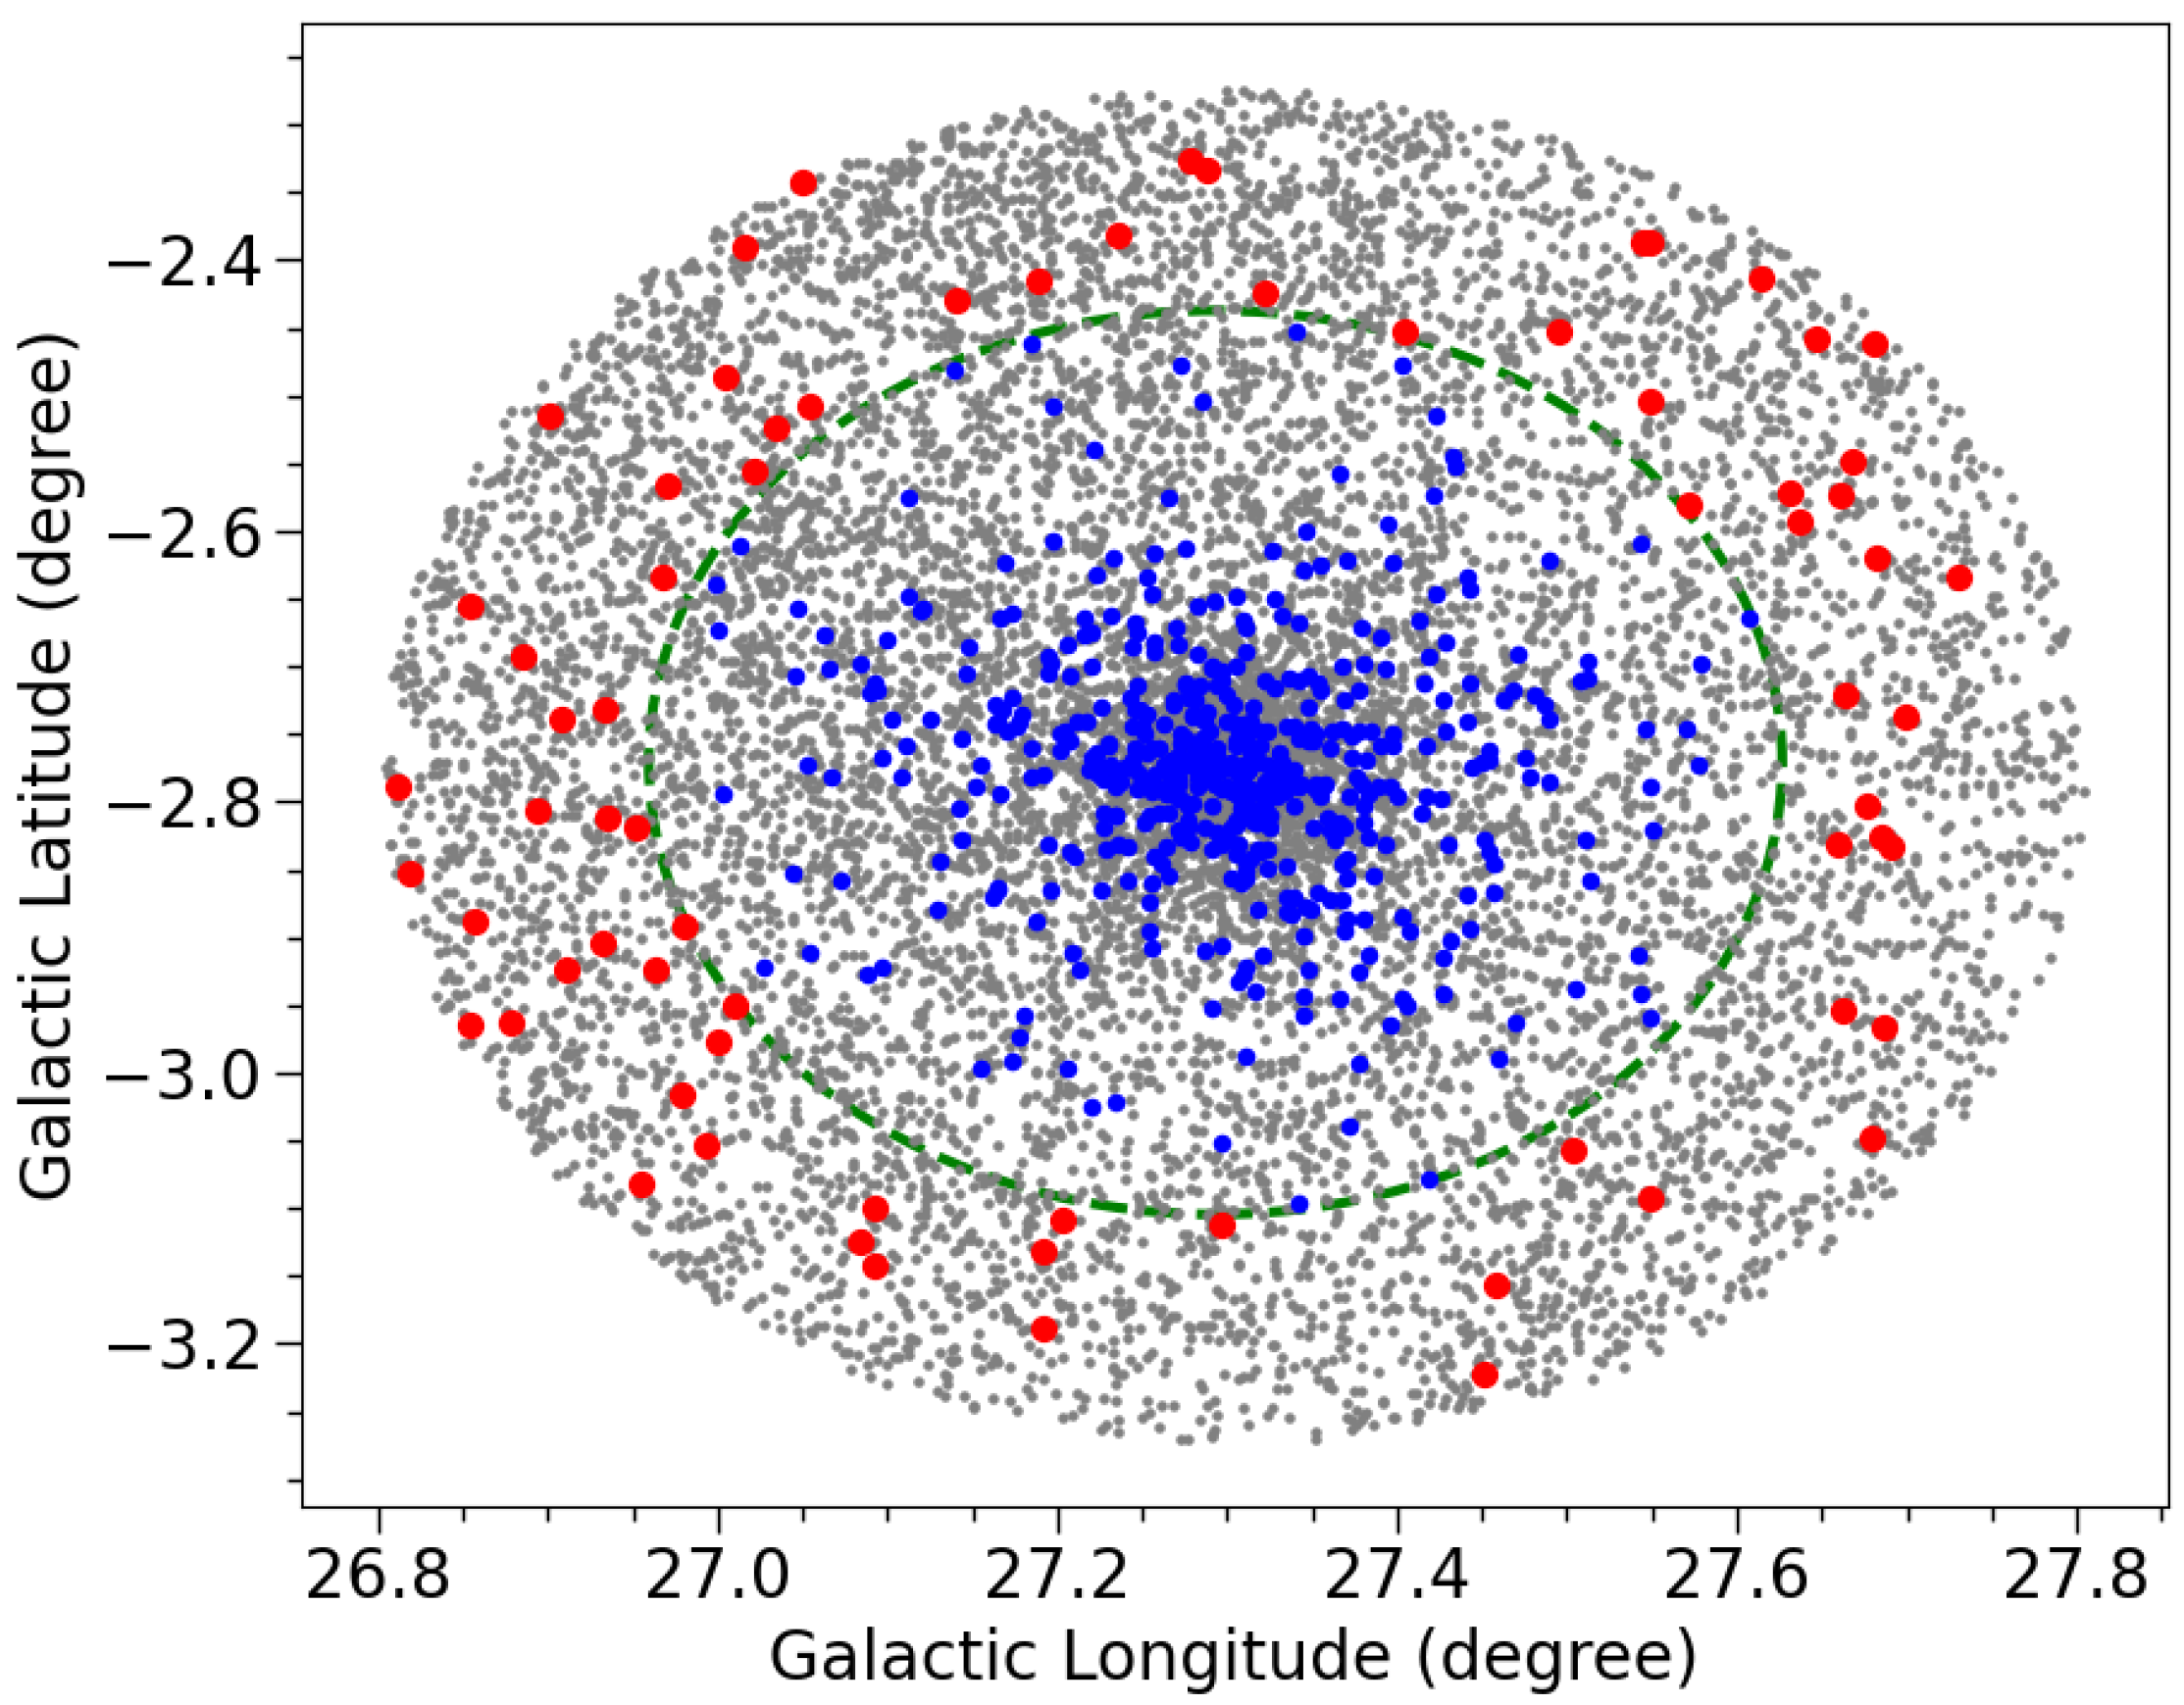
Figure 14 indicates that P 3 D = 0.907 is a safe threshold, and after performing clustering analysis using 3D data, we obtain 571 members ( P 3 D > 0.907) extended up to ∽30 arcmin (∽19 pc) from the cluster center (see Figure 14). In the 3D parametric space, field star contamination is more significant, leading to more than 1000 5D members being identified as field stars. Based on the 3D members, we find that NGC 6705 has formed an extremely extended halo, and 72 members may have escaped from the cluster and become extra-tidal members (>20.02 arcmin, see Figure 15). Previous work by Janez Kos [22] showed the detection of the tidal tail of NGC 6705 (length ∽3259 pc) with fewer member stars than ours However, in our work, no clear tidal tails can be detected around the cluster. This may be due to the different methods and data used. Figure 15 illustrates the distribution of the positions of 3D members. Intra-tidal members show a denser structure, whereas extra-tidal members are more scattered. Extra-tidal members indicated by the red dots are part of the tidal structure; these stars are located further away from the cluster center in space, but they may still remain kinematically associated with the cluster.
The CMDs of the intra-tidal and extra-tidal 3D members are shown in Figure 16. We find that the extra-tidal members cover a wide range of magnitudes (G ∽ 13–20 mag), and some extra-tidal members are located on the upper MS (G ∽ 15–17 mag). This indicates that some extra-tidal members have relatively high masses. Tarricq et al. [16] found that star evaporation may be more efficient than mass segregation in open clusters. This implies that some high-mass members might have escaped from NGC 6705 before they could sink to the cluster core. This can explain why our extra-tidal members include some high-mass stars.
Figure 17 shows the distribution of parallaxes for 3D members. It can be seen that even though these stars are located outside the tidal radius, their parallaxes remain consistent with those of the member stars in the tidal radius. This suggests that these extra-tidal stars still have distance characteristics similar to those of the cluster, supporting the possibility that they are part of the tidal structure. Figure 18 illustrates the proper motions of intra-tidal and extra-tidal members. The proper motions of the extra-tidal stars also show consistency compared to the intra-cluster members, and despite the fact that these stars are more spatially dispersed, their kinematic characteristics remain consistent with those of the cluster members.

5. Discussion and Conclusions

In this paper, we conducted a comprehensive investigation into the structural parameters, dynamical state, and extra-tidal members of the open cluster NGC 6705, employing Gaia-DR3 astrometric data combined with DBSCAN clustering algorithms. Through the identification of 1969 reliable cluster members, we successfully characterized the core and halo components of the cluster, revealing a tight structure. By fitting the RDP to the King model, we estimated the core radius ( R c ) to be 3.11 ± 0.21 arcmin (∽2.02 pc) and the tidal radius ( R t ) to be 20.02 ± 0.71 arcmin (∽13.00 pc). These results indicate that NGC 6705 exhibits a tighter core and a larger tidal extent compared to previous studies, such as the work of Hunt and Reffert [7], where a smaller core and tidal radii were reported. The high central density of NGC 6705, as reflected by the concentration parameter (C∽ 0.81), suggests that the cluster’s internal gravitational interactions have led to the formation of a tightly bound core, which may be a result of ongoing dynamical relaxation. The GMM analysis allowed us to distinguish between the core and halo components of the cluster. PCA further reveals that the core has a semi-major axis of ∽ 7 (∽4.5 pc) and an ellipticity (e∽ 0.89), indicating a nearly circular core with minimal tidal distortion. In contrast, the halo exhibits a more elongated structure with a semi-major axis of ∽ 21 (∽13.6 pc) and a lower ellipticity (e∽ 0.80), suggesting that the outer regions of the cluster are significantly influenced by external tidal forces, likely from the galactic potential. Based on these results, we detected a significant mass segregation effect, indicating that brighter stars tend to concentrate in the core, while fainter stars are distributed in the halo. Additionally, in contrast to earlier findings [22], no clear tidal tail structures could be detected around the cluster. However, we identified 72 extra-tidal members, implying that NGC 6705 is losing its members. These extra-tidal members have a wide range of magnitudes (star masses), which is comparable to that of the intra-tidal members. Our study contributes to understanding the dynamical evolution of NGC 6705, particularly in the context of mass segregation and tidal stripping. The detection of extra-tidal stars highlights the cluster’s interaction with the galactic tidal field, which may have profound implications for its long-term dynamical evolution. Future studies utilizing higher precision astrometric data can further explore the extent of tidal features and provide deeper insights into the processes driving star loss in open clusters located in the inner Galactic disk.

Author Contributions

Conceptualization, C.Z. and X.G.; methodology, C.Z. and X.G.; formal analysis, C.Z. and X.G.; writing—original draft preparation, C.Z. and X.G.; writing—review and editing, C.Z. and X.G. All authors have read and agreed to the published version of the manuscript.

Funding

This work was supported by the Foundation of Changzhou University (Grant Nos. KYP2202231C, KYP2402265C).

Institutional Review Board Statement

Not applicable.

Informed Consent Statement

Not applicable.

Data Availability Statement

The data underlying this article will be shared on reasonable request to the corresponding author.

Acknowledgments

This work has made use of data from the European Space Agency (ESA) mission Gaia (https://www.cosmos.esa.int/gaia, accessed on 1 September 2024), processed by the Gaia Data Processing and Analysis Consortium (DPAC, https://www.cosmos.esa.int/web/gaia/dpac/consortium, accessed on 1 September 2024). Funding for the DPAC has been provided by national institutions, in particular, the institutions participating in the Gaia Multilateral Agreement. This research has made use of the VizieR catalog access tool, CDS, Strasbourg, France.

Conflicts of Interest

The authors declare no conflicts of interest.

References

  1. Kharchenko, N.; Piskunov, A.; Röser, S.; Schilbach, E.; Scholz, R.D. Astrophysical parameters of Galactic open clusters. Astron. Astrophys. 2005, 438, 1163–1173. [Google Scholar] [CrossRef]
  2. Kalirai, J.S.; Richer, H.B. Star clusters as laboratories for stellar and dynamical evolution. Philos. Trans. R. Soc. Math. Phys. Eng. Sci. 2010, 368, 755–782. [Google Scholar] [CrossRef] [PubMed]
  3. Friel, E. The old open clusters of the Milky Way. Annu. Rev. Astron. Astrophys. 1995, 33, 381–414. [Google Scholar] [CrossRef]
  4. Cantat-Gaudin, T.; Jordi, C.; Vallenari, A.; Bragaglia, A.; Balaguer-Núñez, L.; Soubiran, C.; Bossini, D.; Moitinho, A.; Castro-Ginard, A.; Krone-Martins, A.; et al. A Gaia DR2 view of the open cluster population in the Milky Way. Astron. Astrophys. 2018, 618, A93. [Google Scholar] [CrossRef]
  5. Cantat-Gaudin, T.; Anders, F.; Castro-Ginard, A.; Jordi, C.; Romero-Gómez, M.; Soubiran, C.; Casamiquela, L.; Tarricq, Y.; Moitinho, A.; Vallenari, A.; et al. Painting a portrait of the Galactic disc with its stellar clusters. Astron. Astrophys. 2020, 640, A1. [Google Scholar] [CrossRef]
  6. Dias, W.S.; Monteiro, H.; Moitinho, A.; Lépine, J.R.; Carraro, G.; Paunzen, E.; Alessi, B.; Villela, L. Updated parameters of 1743 open clusters based on Gaia DR2. Mon. Not. R. Astron. Soc. 2021, 504, 356–371. [Google Scholar] [CrossRef]
  7. Hunt, E.L.; Reffert, S. Improving the open cluster census-II. An all-sky cluster catalogue with Gaia DR3. Astron. Astrophys. 2023, 673, A114. [Google Scholar] [CrossRef]
  8. Magrini, L.; Randich, S.; Romano, D.; Friel, E.; Bragaglia, A.; Smiljanic, R.; Jacobson, H.; Vallenari, A.; Tosi, M.; Spina, L.; et al. The Gaia-ESO Survey: Abundance ratios in the inner-disk open clusters Trumpler 20, NGC 4815, NGC 6705. Astron. Astrophys. 2014, 563, A44. [Google Scholar] [CrossRef]
  9. Tang, B.; Geisler, D.; Friel, E.; Villanova, S.; Smiljanic, R.; Casey, A.; Randich, S.; Magrini, L.; San Roman, I.; Muñoz, C.; et al. The Gaia-ESO survey: The inner disk intermediate-age open cluster NGC 6802. Astron. Astrophys. 2017, 601, A56. [Google Scholar] [CrossRef]
  10. Overbeek, J.; Friel, E.; Donati, P.; Smiljanic, R.; Jacobson, H.; Hatzidimitriou, D.; Held, E.V.; Magrini, L.; Bragaglia, A.; Randich, S.; et al. The Gaia-ESO Survey: The inner disk, intermediate-age open cluster Trumpler 23. Astron. Astrophys. 2017, 598, A68. [Google Scholar] [CrossRef]
  11. Santos, J.; Bonatto, C.; Bica, E. Structure and stellar content analysis of the open cluster M 11 with 2MASS photometry. Astron. Astrophys. 2005, 442, 201–209. [Google Scholar]
  12. Bonatto, C.; Bica, E. Mass segregation in M 67 with 2MASS. Astron. Astrophys. 2003, 405, 525–530. [Google Scholar]
  13. Sagar, R.; Pandey, A.; Mohan, V. A study of spatial structure of galactic open star clusters. Astron. Astrophys. 2002, 383, 153–162. [Google Scholar]
  14. Bonatto, C.; Bica, E. Old open clusters in the inner Galaxy: FSR 1744, FSR 89 and FSR 31. Astron. Astrophys. 2007, 473, 445–455. [Google Scholar] [CrossRef]
  15. Bonatto, C.; Bica, E. Open clusters in dense fields: The importance of field-star decontamination for NGC 5715, Lyngå 4, Lyngå 9, Trumpler 23, Trumpler 26 and Czernik 37. Mon. Not. R. Astron. Soc. 2007, 377, 1301–1323. [Google Scholar] [CrossRef]
  16. Tarricq, Y.; Soubiran, C.; Casamiquela, L.; Castro-Ginard, A.; Olivares, J.; Miret-Roig, N.; Galli, P. Structural parameters of 389 local open clusters. Astron. Astrophys. 2022, 659, A59. [Google Scholar]
  17. Prusti, T.; De Bruijne, J.; Brown, A.G.; Vallenari, A.; Babusiaux, C.; Bailer-Jones, C.; Bastian, U.; Biermann, M.; Evans, D.W.; Eyer, L.; et al. The gaia mission. Astron. Astrophys. 2016, 595, A1. [Google Scholar]
  18. Vallenari, A.; Brown, A.G.; Prusti, T.; De Bruijne, J.H.; Arenou, F.; Babusiaux, C.; Biermann, M.; Creevey, O.L.; Ducourant, C.; Evans, D.W.; et al. Gaia data release 3-summary of the content and survey properties. Astron. Astrophys. 2023, 674, A1. [Google Scholar]
  19. Gao, X. A clustering (DBSCAN+ GMM) investigation of the young open cluster NGC 6649. Mon. Not. R. Astron. Soc. 2024, 527, 1784–1793. [Google Scholar] [CrossRef]
  20. Gao, X. Discovery of Tidal Tails around the Old Open Cluster NGC 2506. Astrophys. J. 2020, 894, 48. [Google Scholar]
  21. Gao, X.; Zhu, C. The extended halo and tidal tails of the old open cluster NGC 2112. Publ. Astron. Soc. Jpn. 2024, 76, psae085. [Google Scholar] [CrossRef]
  22. Kos, J. Tidal tails of open clusters. Astron. Astrophys. 2024, 691, A28. [Google Scholar] [CrossRef]
  23. Solomon, S.; McNamara, B. M11-A study of its inner and outer regions. Astron. J. 1980, 85, 432–437. [Google Scholar] [CrossRef]
  24. Casamiquela, L.; Balaguer-Núnez, L.; Jordi, C.; Masana, E. Physical parameters of NGC6705 (M11) open cluster using Strömgren photometry. In Highlights of Spanish Astrophysics VIII: Proceedings of the XI Scientific Meeting of the Spanish Astronomical Society, Teruel, Spain, 8–12 September 2014; Spanish Astronomical Society: Barcelona, Spain, 2015; p. 596. [Google Scholar]
  25. Carbajo-Hijarrubia, J.; Casamiquela, L.; Carrera, R.; Balaguer-Núñez, L.; Jordi, C.; Anders, F.; Gallart, C.; Pancino, E.; Drazdauskas, A.; Stonkutė, E.; et al. OCCASO-V. Chemical-abundance trends with Galactocentric distance and age. Astron. Astrophys. 2024, 687, A239. [Google Scholar] [CrossRef]
  26. Bragaglia, A.; D’Orazi, V.; Magrini, L.; Baratella, M.; Bensby, T.; Martell, S.; Randich, S.; Tautvaišienė, G.; Alfaro, E.J.; Morbidelli, L.; et al. The Gaia-ESO Survey: No sign of multiple stellar populations in open clusters from their sodium and oxygen abundances. Astron. Astrophys. 2024, 687, A124. [Google Scholar] [CrossRef]
  27. Ester, M.; Kriegel, H.P.; Sander, J.; Xu, X. A density-based algorithm for discovering clusters in large spatial databases with noise. In Proceedings of the Second International Conference on Knowledge Discovery and Data Mining, Portland, OR, USA, 2–4 August 1996; pp. 226–231. [Google Scholar]
  28. Agarwal, M.; Rao, K.K.; Vaidya, K.; Bhattacharya, S. ML-MOC: Machine learning (kNN and GMM) based membership determination for open clusters. Mon. Not. R. Astron. Soc. 2021, 502, 2582–2599. [Google Scholar] [CrossRef]
  29. Gao, X.H.; Xu, S.K.; Chen, L. 3D cluster members and near-infrared distance of open cluster NGC 6819. Res. Astron. Astrophys. 2015, 15, 2193. [Google Scholar] [CrossRef]
  30. Gao, X. Spatial structure and dynamical state of the old open cluster Collinder 261 based on a clustering method. Publ. Astron. Soc. Jpn. 2023, 75, 82–89. [Google Scholar] [CrossRef]
  31. Bhattacharya, S.; Mahulkar, V.; Pandaokar, S.; Singh, P.K. Morphology of open clusters NGC 1857 and Czernik 20 using clustering algorithms. Astron. Comput. 2017, 18, 1–7. [Google Scholar] [CrossRef]
  32. Gao, X.; Fang, D. A clustering study of the old open cluster Trumpler 19. Astrophys. Space Sci. 2023, 368, 73. [Google Scholar] [CrossRef]
  33. King, I. The structure of star clusters. I. an empirical density law. Astron. J. 1962, 67, 471. [Google Scholar]
  34. Just, A.; Piskunov, A.E.; Klos, J.H.; Kovaleva, D.A.; Polyachenko, E.V. Global survey of star clusters in the Milky Way-VII. Tidal parameters and mass function. Astron. Astrophys. 2023, 672, A187. [Google Scholar]
  35. Jolliffe, I.T. Principal Component Analysis for Special Types of Data; Springer: Berlin/Heidelberg, Germany, 2002. [Google Scholar]
  36. Cottaar, M.; Hénault-Brunet, V. Binary-corrected velocity dispersions from single-and multi-epoch radial velocities: Massive stars in R136 as a test case. Astron. Astrophys. 2014, 562, A20. [Google Scholar]
  37. Piatti, A.E. Binary star sequence in the outskirts of the disrupting Galactic open cluster UBC 274. Astron. Astrophys. 2020, 639, A55. [Google Scholar] [CrossRef]
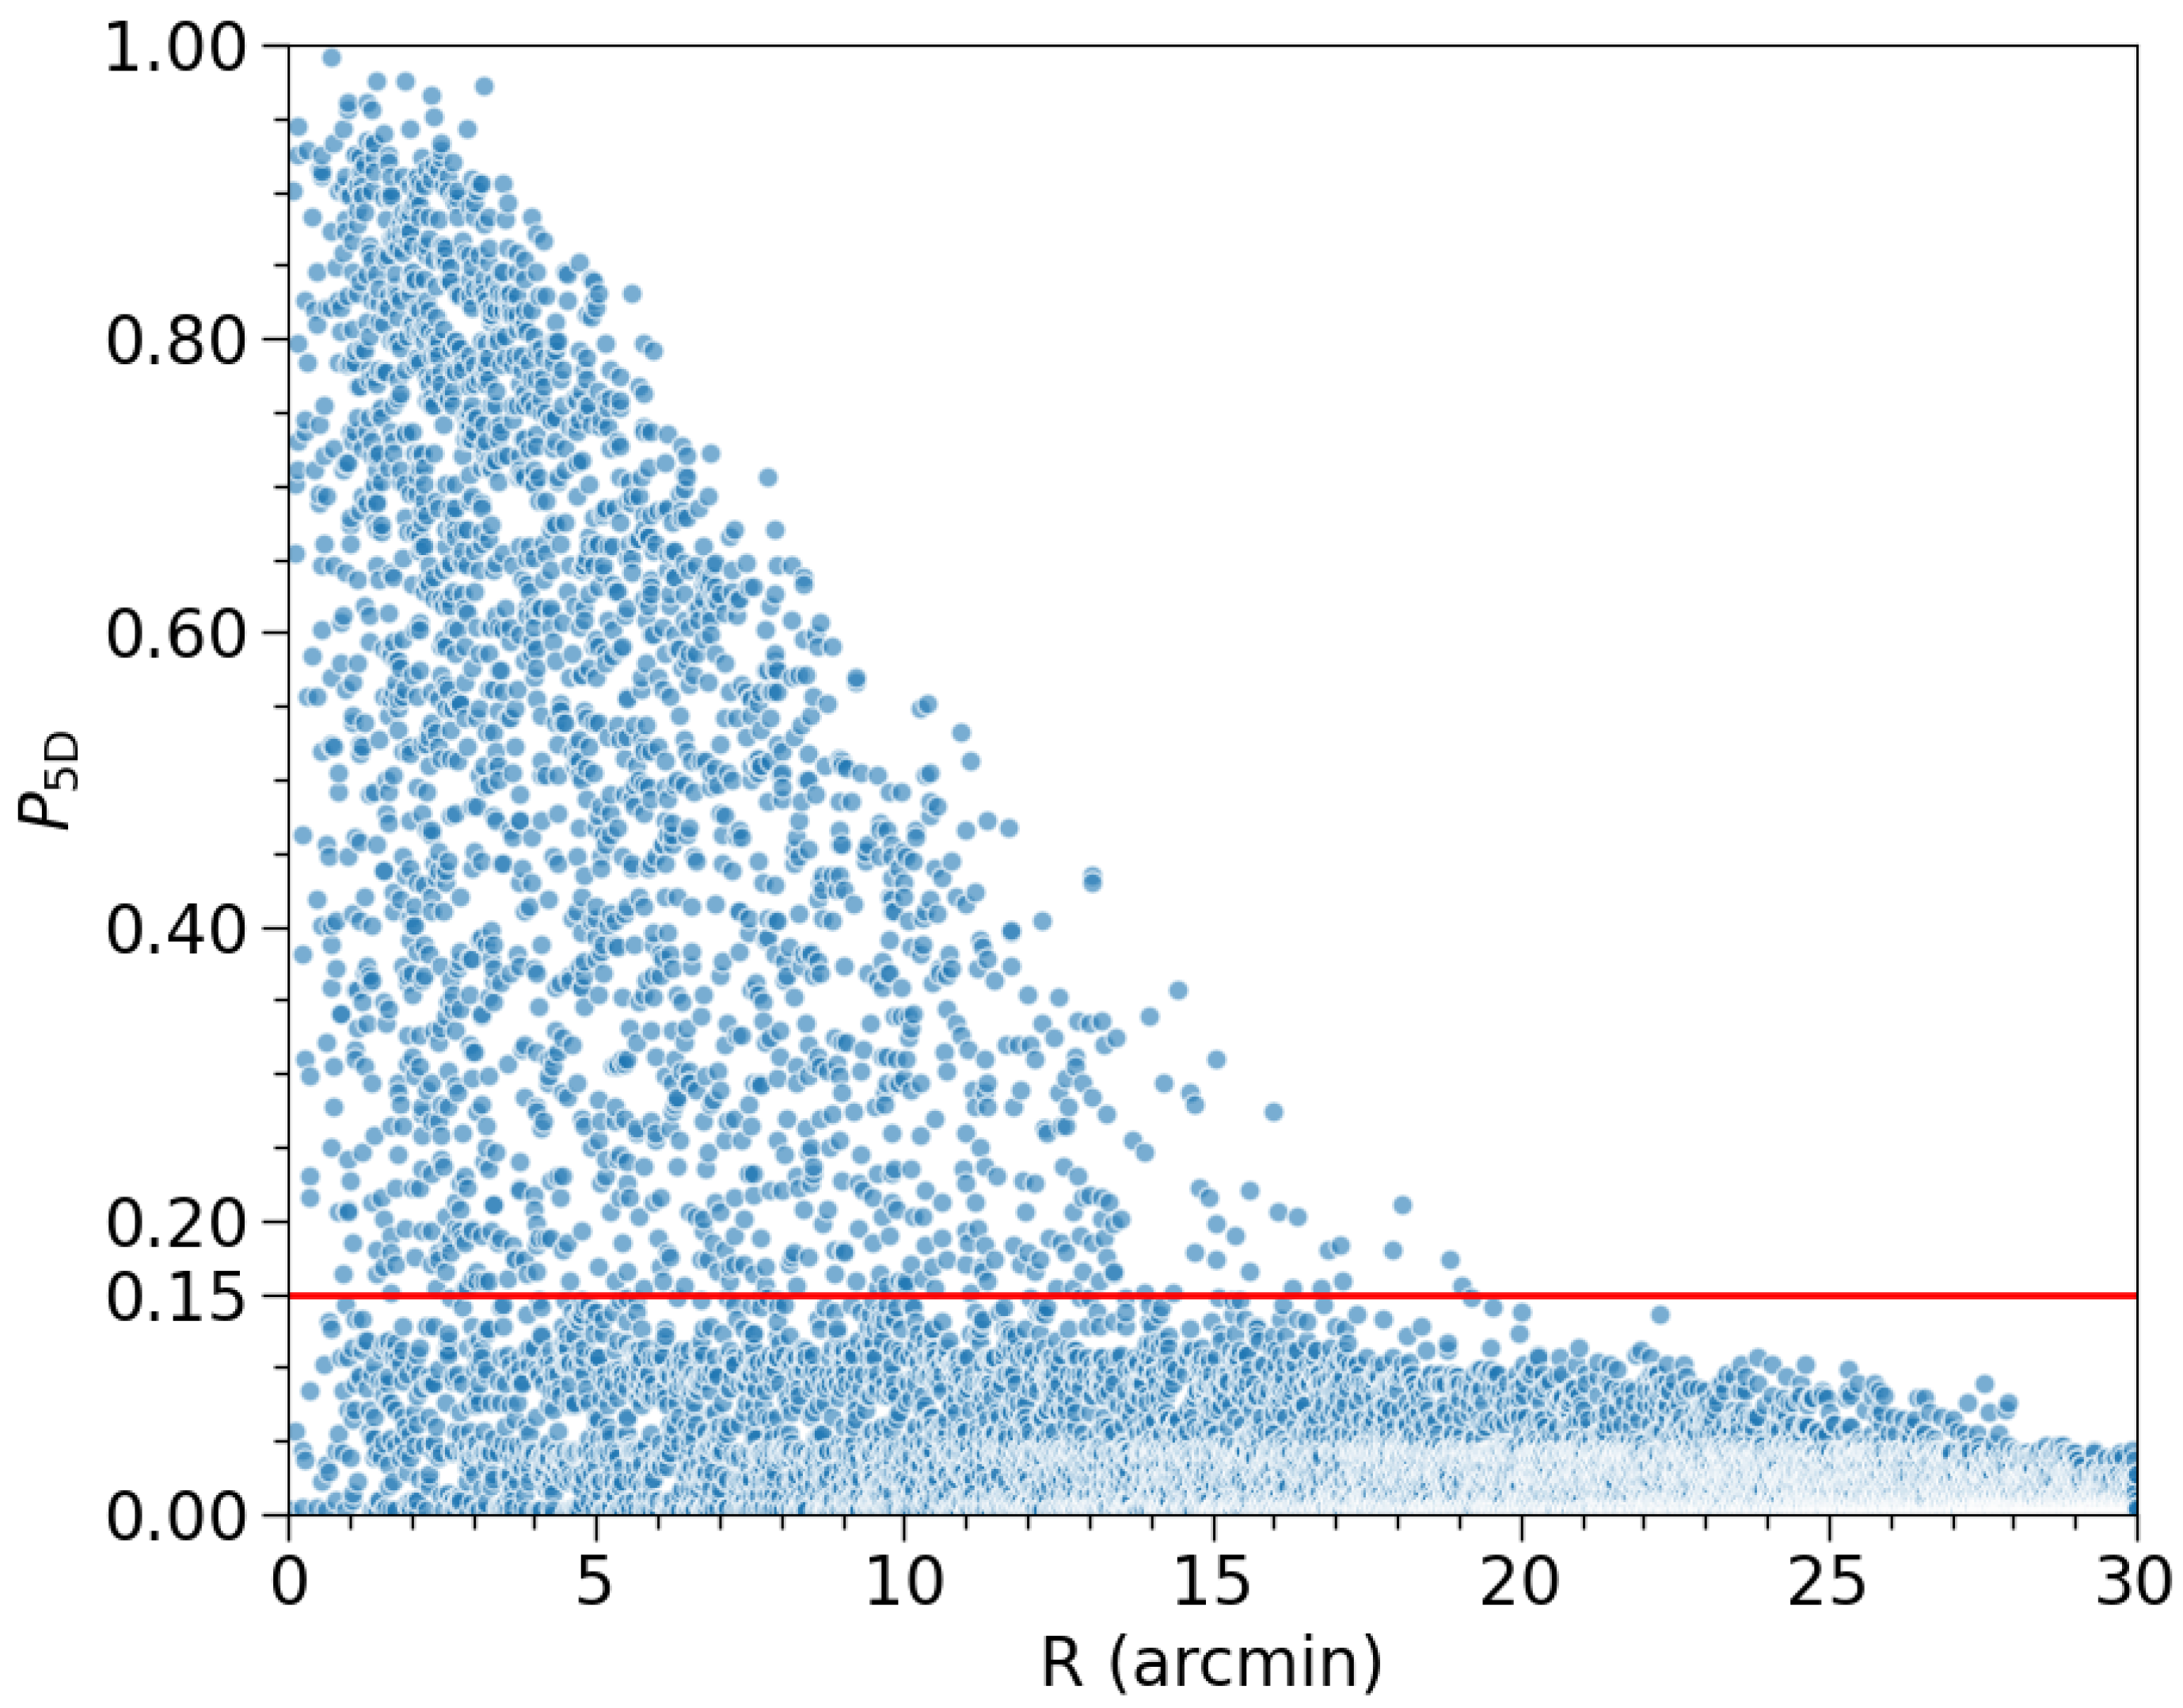
Figure 1. Five-dimensional membership probability ( P 5 D ) as a function of the radial distance to the cluster center (R) for all the sample stars. The red line indicates the threshold probability ( P 5 D = 0.15) used for selecting reliable cluster members. The blue dots represent the sample stars, while those with membership probabilities higher than the threshold are considered likely cluster members.
Applsci 15 03488 g001
Figure 2. Comparison between our membership probabilities ( P 5 D ) and those ( P H R 23 ) of Hunt and Reffert [7]. The black dots represent the common member stars, and the red dashed line indicates the best-fit line between the two sets of membership probabilities.
Applsci 15 03488 g002
Figure 3. Left panel: CMDs of the 5D cluster members (blue dots) and field stars (gray dots); right panel: CMD of the 5D cluster members, where the color bar shows the membership probabilities.
Applsci 15 03488 g003
Figure 4. PM-VPDs of the 5D cluster members (red dots) and field stars (gray dots).
Applsci 15 03488 g004
Figure 5. Parallax ( ϖ ) of 5D cluster members (blue dots) and field stars (gray dots) as a function of radial distance (R).
Applsci 15 03488 g005
Figure 6. RDP of the cluster members, where the black dots represent the observed data of cluster members, and the red curve shows the fit to the King model.
Applsci 15 03488 g006
Figure 7. Positions of the 5D cluster members (blue dots) and field stars (gray dots), where the green circle is the tidal radius of the cluster (20.02 arcmin).
Applsci 15 03488 g007
Figure 8. SDE analysis (green line) for the spatial positions of the 5D cluster members (gray dots).
Applsci 15 03488 g008
Figure 9. AIC (blue line) and BIC (orange line) as functions of Gaussian components for the spatial positions of the 5D members.
Applsci 15 03488 g009
Figure 10. Spatial positions of the core (blue dots) and halo stars (red dots) determined using the two-component GMM.
Applsci 15 03488 g010
Figure 11. Vector diagram of the core and halo. The blue dots represent the stars in the core region, the red dots represent the stars in the halo region, and the gray arrows indicate the proper motion vectors of the stars.
Applsci 15 03488 g011
Figure 12. The first (PC1) and second (PC2) principal components of the 2D positions for the cluster members. The blue dots represent the stars in the core region, the red dots represent the stars in the halo region.
Applsci 15 03488 g012
Figure 13. Cumulative G magnitude distribution of core and halo members.
Applsci 15 03488 g013
Figure 14. P 3 D of member stars as a function of radial distance to the cluster center. The red line indicates the threshold probability ( P 3 D = 0.907) used to select reliable cluster members. The blue dots represent individual member stars, with their corresponding membership probabilities.
Applsci 15 03488 g014
Figure 15. Two-dimensional spatial distribution of 3D members with field stars (gray dots) and cluster members (colored dots). Intra-tidal 3D members (<20.02 arcmin) are shown as blue dots, while extra-tidal 3D members (>20.02 arcmin) are shown as red dots. The green dashed circle represents the tidal radius of the cluster (20.02 arcmin).
Applsci 15 03488 g015
Figure 16. CMD of intra-tidal 3D members (blue dots), extra-tidal 3D members (red dots), and field stars (gray dots).
Applsci 15 03488 g016
Figure 17. Parallax ( ϖ ) of 3D cluster members as a function of radial distance (R), where red dots are extra-tidal 3D members and gray dots are intra-tidal 3D members.
Applsci 15 03488 g017
Figure 18. PM-VPDs for extra-tidal members (red dots) and intra-tidal members (blue dots) of 3D clusters. Gray dots represent field stars.
Applsci 15 03488 g018
Table 1. Relevant parameters for NGC 6705.
Age (Gyr)Distance (pc)[Fe/H]AV (mag)E (B-V)Bibliography
0.2001900 0.42Solomon and McNamara 1980 [23]
2000−0.2 ± 0.4 0.42Casamiquela et al. 2015 [24]
0.28818880.0431.457 Dias et al. 2021 [6]
0.3102233 1.3 Hunt and Reffert 2023 [7]
0.30922030.114 Carbajo-Hijarrubia et al. 2024 [25]
0.30922030.1141.2 Bragaglia et al. 2024 [26]
Table 2. Fundamental parameters of the core and halo components based on GMM and PCA.
ComponentStarsCentral Positions σ ll σ bb pmRApmDEC σ 1 σ 2 e
Core1279(l,b) = ( 27.2987 ° , 2.7702 ° ) 2.2 2.4 −1.543−4.167 2.4 2.2 0.89
Halo690(l,b) = ( 27.4815 ° , 2.6402 ° ) 7.0 5.6 −1.539−4.163 7.0 5.6 0.80
Columns (2)–(7) are obtained based on GMM. Columns (8)–(10) are obtained based on PCA.
Disclaimer/Publisher’s Note: The statements, opinions and data contained in all publications are solely those of the individual author(s) and contributor(s) and not of MDPI and/or the editor(s). MDPI and/or the editor(s) disclaim responsibility for any injury to people or property resulting from any ideas, methods, instructions or products referred to in the content.