Article

Spatial Conflicts in ‘Production, Living, and Ecological Space’ Functions at Urban Fringes: The Case of Zengcheng, Guangzhou

1
College of Natural Resources and Environment, South China Agricultural University, Guangzhou 510642, China
2
Key Laboratory of Redevelopment of Construction Land, Ministry of Natural Resources, South China Agricultural University, Guangzhou 510642, China
*
Author to whom correspondence should be addressed.
Appl. Sci. 2025, 15(7), 3483; https://doi.org/10.3390/app15073483
Submission received: 22 January 2025 / Revised: 13 March 2025 / Accepted: 19 March 2025 / Published: 22 March 2025

Abstract

:
Understanding the interdependencies among production, living, and ecological spaces (PLESs) is critical for sustainable regional development. Urban fringe areas, shaped by rapid urbanization and conflicting land-use demands, are particularly vulnerable to spatial tensions. This study analyzes the spatiotemporal dynamics and drivers of PLES conflicts in Zengcheng District, Guangzhou, a representative urban fringe region. Using land-use data from 2010 to 2020, the study applies the optimal parameter geographic detector, chosen for its ability to untangle complex spatial interactions, to quantify conflict intensity and identify key drivers. This method was chosen over other spatial analysis techniques due to its ability to effectively capture nonlinear relationships and interaction effects between variables, which traditional regression-based or spatial autocorrelation methods often fail to fully address. The results indicate that production and ecological lands dominated the landscape, while living space expansion slowed, leading to escalating conflicts, particularly in the southern and central regions. The PLES conflict index shows that severe conflict units rose from 0.89% in 2010 to 2.15% in 2020, despite over 80% of spatial units remaining stable. Moderate conflicts peaked in 2015 before declining, while stronger conflicts intensified, especially in rapidly urbanizing areas. Conflict hotspots were most pronounced in rapidly urbanizing zones, particularly at the interface of urban expansion and ecological conservation areas. Moreover, the driving forces behind these conflicts transitioned from economic and urbanization factors to a multifaceted interplay of natural and social determinants, underscoring the growing intricacy of spatial dynamics. These findings offer crucial insights into the mechanisms driving PLES conflicts, guiding urban planners and policymakers in developing strategies to balance competing land-use priorities. By quantifying conflicts and identifying key drivers, this study helps prioritize interventions that mitigate tensions between production, living, and ecological spaces, supporting policies that reconcile urban expansion with ecological preservation for sustainable development in urban fringe areas.

1. Introduction

Amid rapid industrialization and urbanization, conflicts in land-use structure, resource allocation, functionality, and spatial distribution are becoming increasingly pronounced. Land resource utilization must balance three key functions: production and development, quality of life, and ecological protection. Urban fringe areas are hotspots for intense competition over land resources, where conflicts among these three functions are most acute. These areas also play a crucial role in ensuring the coordinated development of the core city and its surrounding hinterlands.
China has experienced rapid urbanization, accompanied by a significant increase in population density, which has intensified spatial conflicts in urban fringe areas [1]. The expansion of cities has led to increasing pressure on land resources, requiring integrated solutions that consider both socio-economic and environmental sustainability. In this regard, ecosystem assessments have become essential for formulating climate change adaptation and mitigation policies aimed at ecosystem protection [2].
To address land-use conflicts, nature-based solutions (NbSs) have emerged as a strategic approach to enhance urban resilience and optimize the allocation of ecosystem services in urban areas [3]. Furthermore, sustainable urban planning must integrate principles of health-conscious design, ensuring that urban environments support well-being through improved spatial configurations and access to ecological resources [4,5]. Understanding the trends, patterns, mechanisms, and driving forces of spatial conflicts in urban fringe areas is crucial for promoting the synergy of production, living, and ecological functions, achieving high-quality development, creating optimized spaces for urban regions, and advancing national strategies of spatial integration.
Wu, Z.Y. was the first to clearly define the concept of the PLES from the perspective of their respective functions, laying a theoretical foundation for subsequent research [6]. From ecological and geographical perspectives, numerous scholars have systematically examined the connotations, evolutionary characteristics, and regulatory pathways of spatial conflicts within territorial spaces. These studies employed methods such as the suitability evaluation model for the PLES national development intensity analysis and landscape pattern indices [7,8,9,10,11].
For instance, Zhang Na et al., through a study on urban expansion in Beijing, found that as urban areas grow, the coordination among the PLES diminishes [12]. Li Ting et al. explored the spatial conflict and coordination mechanisms of the PLES in Nanjing [13]. Wang Deling et al. developed a relative conflict identification model that integrated remote sensing ecological indices with landscape pattern indices to investigate spatial evolution and land-use conflicts in Nanchang County [14]. Similarly, Song Furong et al. analyzed the evolution of spatial conflicts in the mining–agriculture composite region of Daye City [15]. In an international context, Campbell et al. examined land-use conflict characteristics and drivers in the Kagadu District of Kenya [16]. Luo Hong et al. extended this line of inquiry by linking spatial conflicts among the PLES with ecosystem service values, demonstrating a significant negative correlation between conflict intensity and ecological service value [17]. Addressing regional variations, Xiang Fangfang et al. proposed a strategy for measuring homeland spatial conflicts and optimizing functions under an integrated framework [18]. Additionally, Zhou et al. investigated the impacts of land-use changes during urban expansion in Guangzhou, offering valuable insights and references for the study of spatial conflicts in Zengcheng District [19,20]. Despite substantial research on the evolution and reconciliation of spatial conflicts among [21,22,23,24], studies specifically addressing urban fringe areas, particularly those at the urban–rural interface such as Zengcheng District, remain limited. Most existing studies have focused on either urban or rural areas, neglecting the complex and interwoven economic and environmental dynamics inherent to urban fringe regions, where PLES conflicts are more multifaceted and intricate. This study seeks to fill this gap by investigating the distinctive spatial conflicts in these transitional zones. This study utilizes the optimal parameter geographic detector to quantitatively analyze spatial conflicts at different stages, with the following research questions guiding the investigation: (1) What are the evolutionary patterns of PLES conflicts in urban fringe areas? (2) What are the underlying driving mechanisms of these conflicts? Through addressing these questions, this study aims to provide valuable insights into the dynamics of spatial conflicts in transitional zones. Similar spatial conflicts between production, living, and ecological spaces are widespread in urban fringe areas globally, both in developed and developing countries. In many instances, policies tend to favor either urban or rural areas, often overlooking the development of transitional zones, thereby intensifying PLES conflicts and complicating regional planning. The findings offer valuable insights to guide decision-making processes toward the coordinated and sustainable development of the region.

2. Study Area and Data Sources

2.1. Study Area

Zengcheng District, located in the eastern part of Guangzhou City, Guangdong Province, at the periphery of the Pearl River Delta, exemplifies a typical urban fringe area (Figure 1). Its significance lies in its rapid urbanization, intricate land-use transitions, and the coexistence of agricultural, industrial, and ecological functions. Serving as a crucial gateway between Guangzhou and its surrounding rural areas, Zengcheng faces pronounced PLES conflicts driven by accelerated urban expansion, industrial development, and ecological conservation pressures. These dynamics make it an ideal case for examining spatial conflicts in metropolitan edge regions. Zengcheng District’s topography is characterized by hilly terrain in the northwest and expansive plains in the southeast and central regions, with elevations ranging from 10 to 500 m above sea level. The district experiences a warm, humid subtropical climate, with an average annual temperature of approximately 22 °C. Precipitation is concentrated during the summer months, with annual rainfall ranging from 1700 to 1900 mm, providing favorable conditions for agricultural and forestry activities. As a result, agricultural and forestry land is predominantly distributed in the north-central region, while construction land is concentrated in the south-central area.

2.2. Data Sources

This study examines spatial dynamics from 2010 to 2020, focusing on three key time points: 2010, 2015, and 2020. Land-use data were obtained from the Zengcheng District Land Use Change Database, derived from high-resolution remote sensing imagery and validated through field surveys and accuracy assessments to ensure reliability. Environmental variables were sourced from the National Earth System Science Data Center, which adheres to standardized data processing protocols. Data on river networks and transportation infrastructure were extracted from OpenStreetMap and cross-verified with official mapping sources where available. Socio-economic indicators, including GDP and population density, were acquired from the Resource and Environment Science and Data Platform, ensuring alignment with official statistical records.

3. Research Methods

To enhance clarity, a methodological flowchart (Figure 2) is provided to illustrate the overall research framework, including data processing, conflict assessment, and factor detection.

3.1. Establishment of the PLES Classification System

Drawing on the dominant functions of land use and informed by previous studies [25,26,27], this study adheres to the principles of spatial continuity and functional independence to refine and optimize the spatial layout of PLES. As a result, a detailed classification system for the production, living, and ecological spaces in Zengcheng District is established (Table 1).

3.2. Construction of a Composite Index of Conflicts in the PLES

A spatial grid of 300 m × 300 m was chosen as the assessment unit, considering the scope of the study, the characteristics of the data, and the conditions of land patches. This scale was selected for the following reasons: A 300 m × 300 m grid provides sufficient spatial resolution to capture variations in land use while maintaining computational feasibility. Finer grids (e.g., 100 m × 100 m) may increase computational complexity without significantly improving analytical accuracy, whereas coarser grids (e.g., 500 m × 500 m or 1 km × 1 km) could obscure localized spatial conflicts. Building on insights from prior research [28,29], a set of evaluation indicators was developed to measure the intensity of spatial conflicts among the three functional domains. This intensity is quantified using the Spatial Conflict Composite Index (SCCI).
S C C I = C I + F I S I
The Spatial Conflict Composite Index (SCCI) is a comprehensive metric that combines three critical indices: the Spatial Complexity Index (CI), the Fragility Index (FI), and the Stability Index (SI). Spatial complexity is evaluated through area-weighted sub-dimensions, which provide a quantitative measure of the intricacy of patch boundaries. Higher sub-dimension values signify more complex patch geometries, indicating greater levels of interference and heightened risk. The calculation formula is presented as follows:
A W M P F D = j = 1 m i = 1 n [ 2 ln 0.25 P i j ln a i j × a i j A ]
Here, Pij represents the perimeter of the patch, aij denotes the area of the patch, A refers to the total area of the spatial unit, m indicates the total number of evaluation units, and n corresponds to the number of landscape types.
Vulnerability captures the degree of exposure faced by risk receptors, exhibiting spatial variability across different regions. Drawing on previous studies [30,31], the spatial vulnerability indices for each category were determined (Table 2). The formulas for their calculation are as follows:
F I = i = 1 n F i × a i S
Stability is evaluated using patch density within the Landscape Index. Higher patch density indicates greater landscape fragmentation, reduced biodiversity, diminished environmental coherence, and heightened ecological risk. The calculation formula is as follows:
S I = 1 P D P D m i n P D m a x P D m i n
P D = n i A
ni represents the number of patches of spatial type i within the spatial unit, while A denotes the total area of the spatial unit.
The values of the spatial conflict index were normalized to fall within the range of 0 to 1. Conflict levels are categorized using the equal-interval method, with the thresholds and characteristics of each level detailed in Table 3.

3.3. Optimal Parameter Geodetic Detector

Optimal Parameter Geodetectors extend the functionality of traditional geodetectors by identifying and quantifying the factors influencing spatial distribution variations. They further investigate the influence of various factors and their interactions on spatial dynamics [32,33].
  • Factor Detection
Factor detection in the Optimal Parameter Geodetector evaluates the extent to which factor X explains the spatial variation in attribute Y through the computation of the q-statistic. The q-value ranges between 0 and 1, with higher values signifying greater explanatory power. The calculation formula is as follows:
q = 1 1 N × i = 1 n N i × σ i 2 σ 2
where i = 1, 2, …, n represents the stratification or categorization of factor X; N and Ni denote the total number of units and the number of units in stratum i, respectively; and σ2 and σi2 refer to the variances in the overall dataset and in stratum i, respectively.
2.
Interaction Detection
Interaction detection examines the relationships between factors by contrasting the q-values of individual factors with the q-value derived from their interaction. The nature and intensity of these interactions are classified into five distinct categories, as outlined in Table 4.

4. Results and Analysis

4.1. An Analysis of the Spatial Pattern of PLES

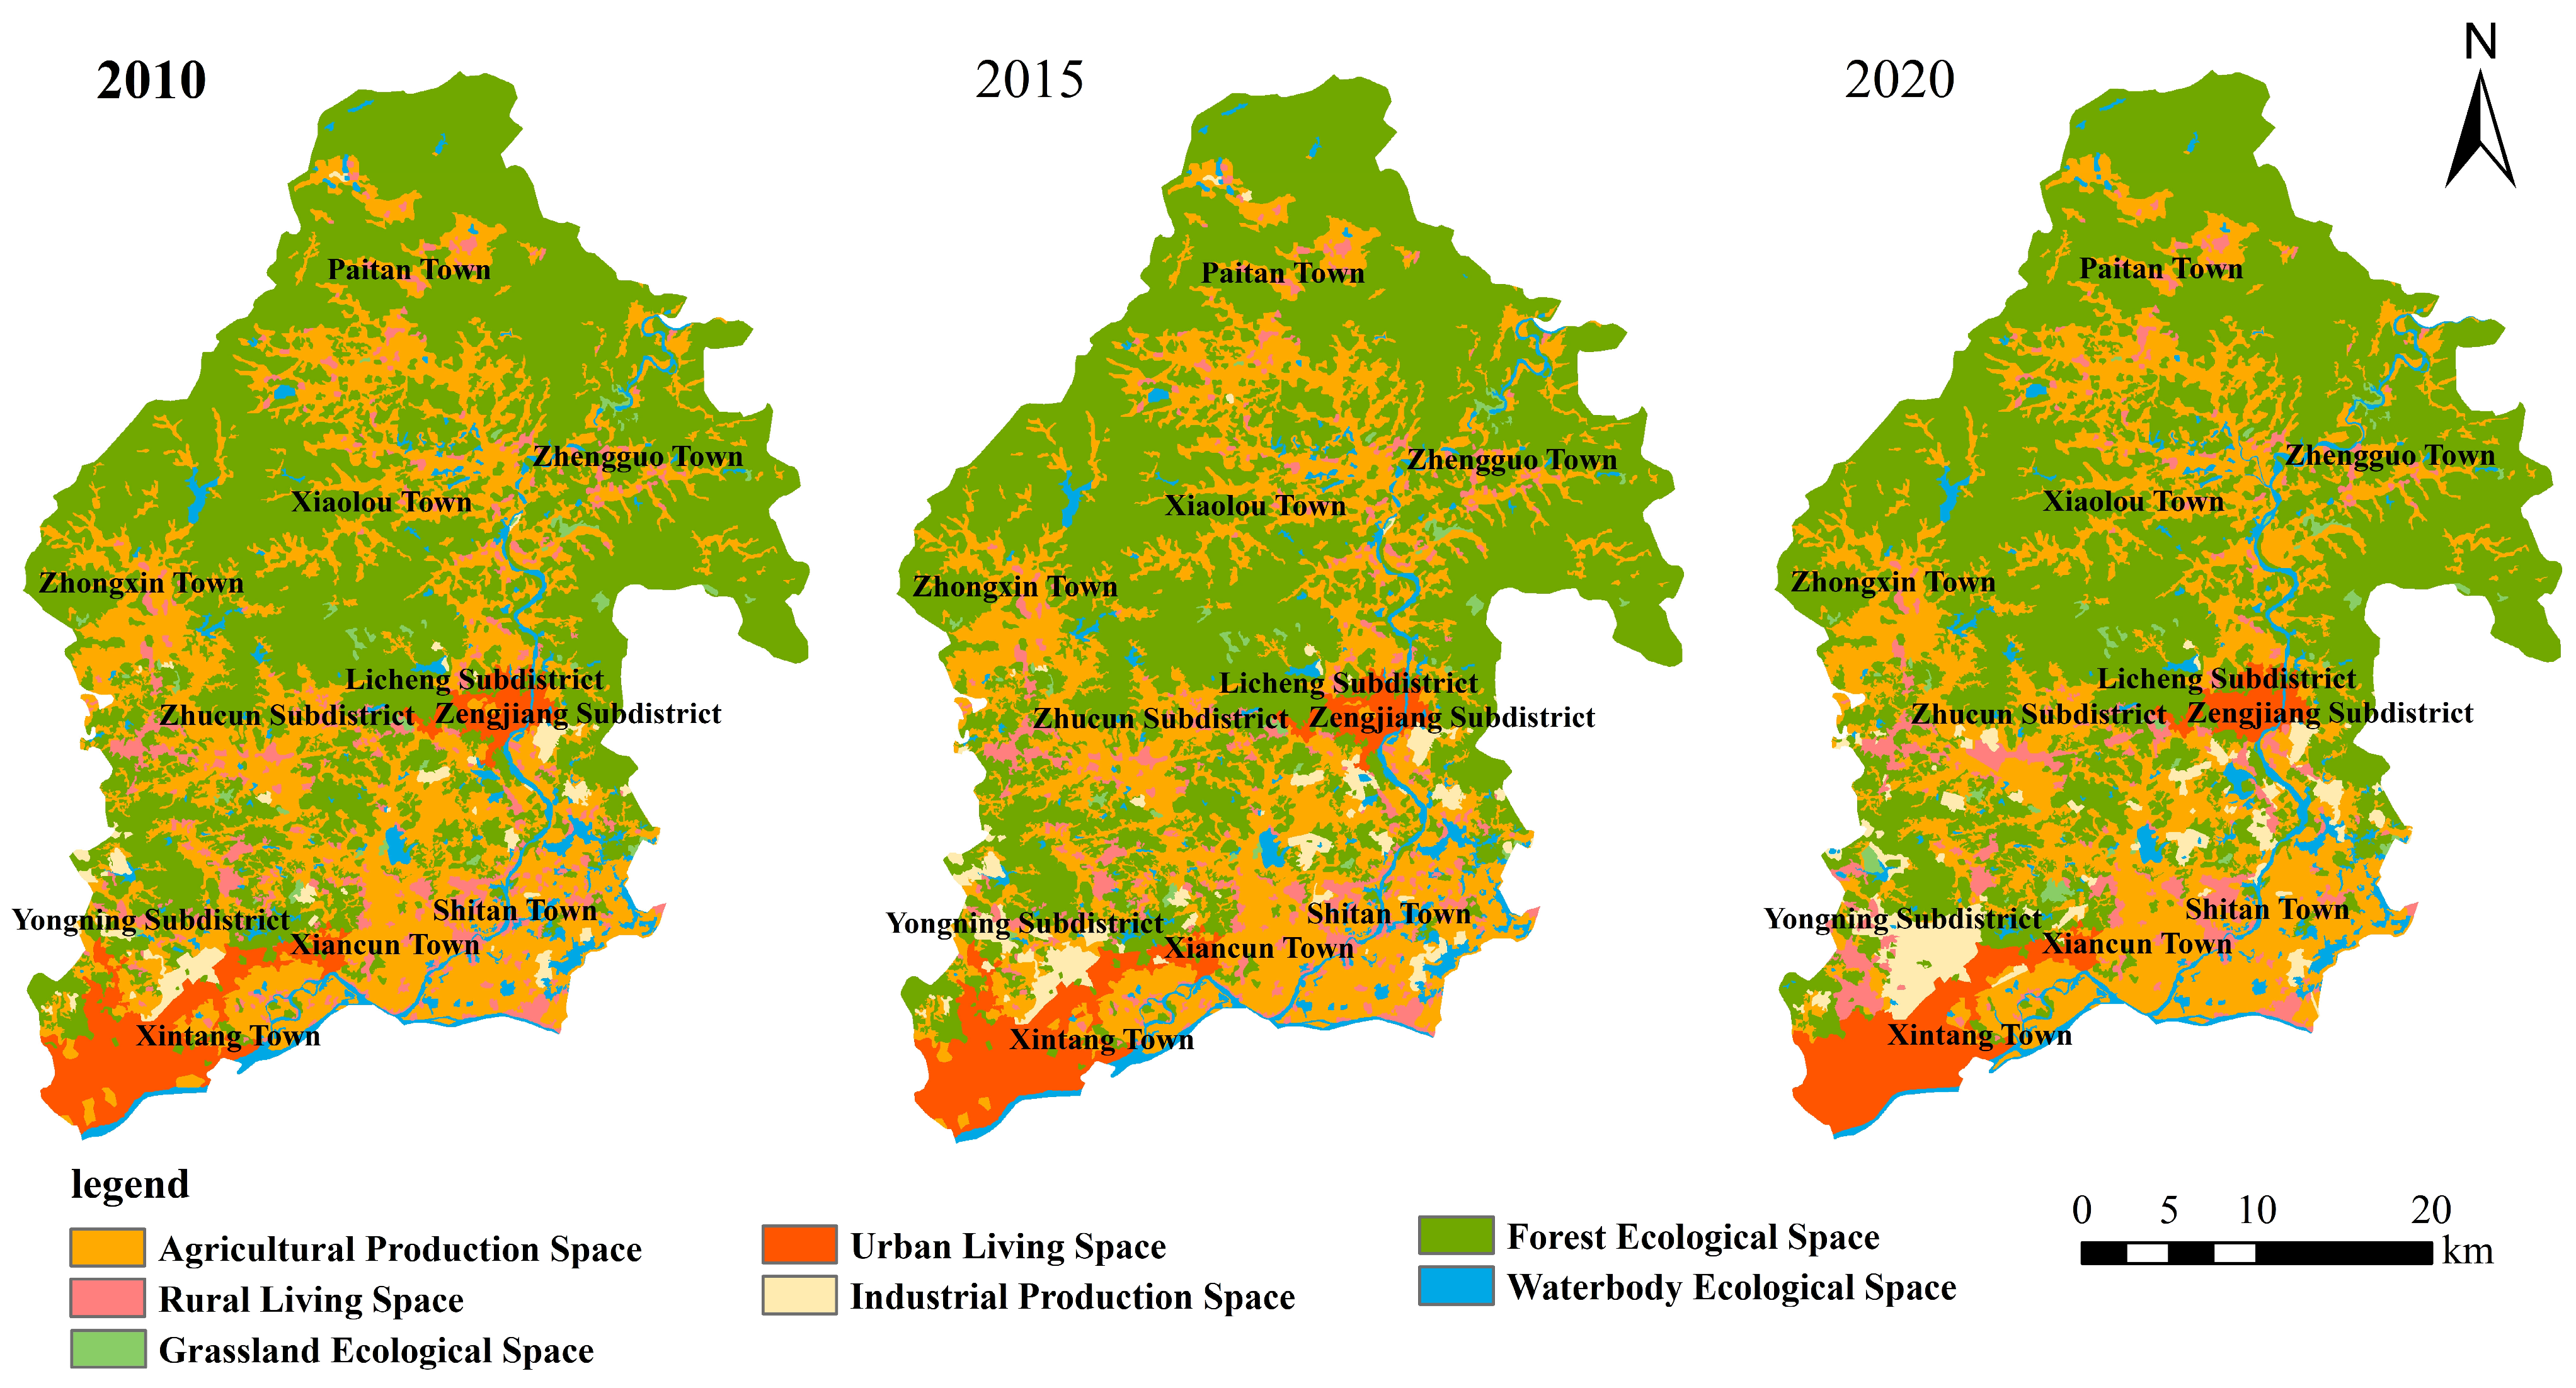
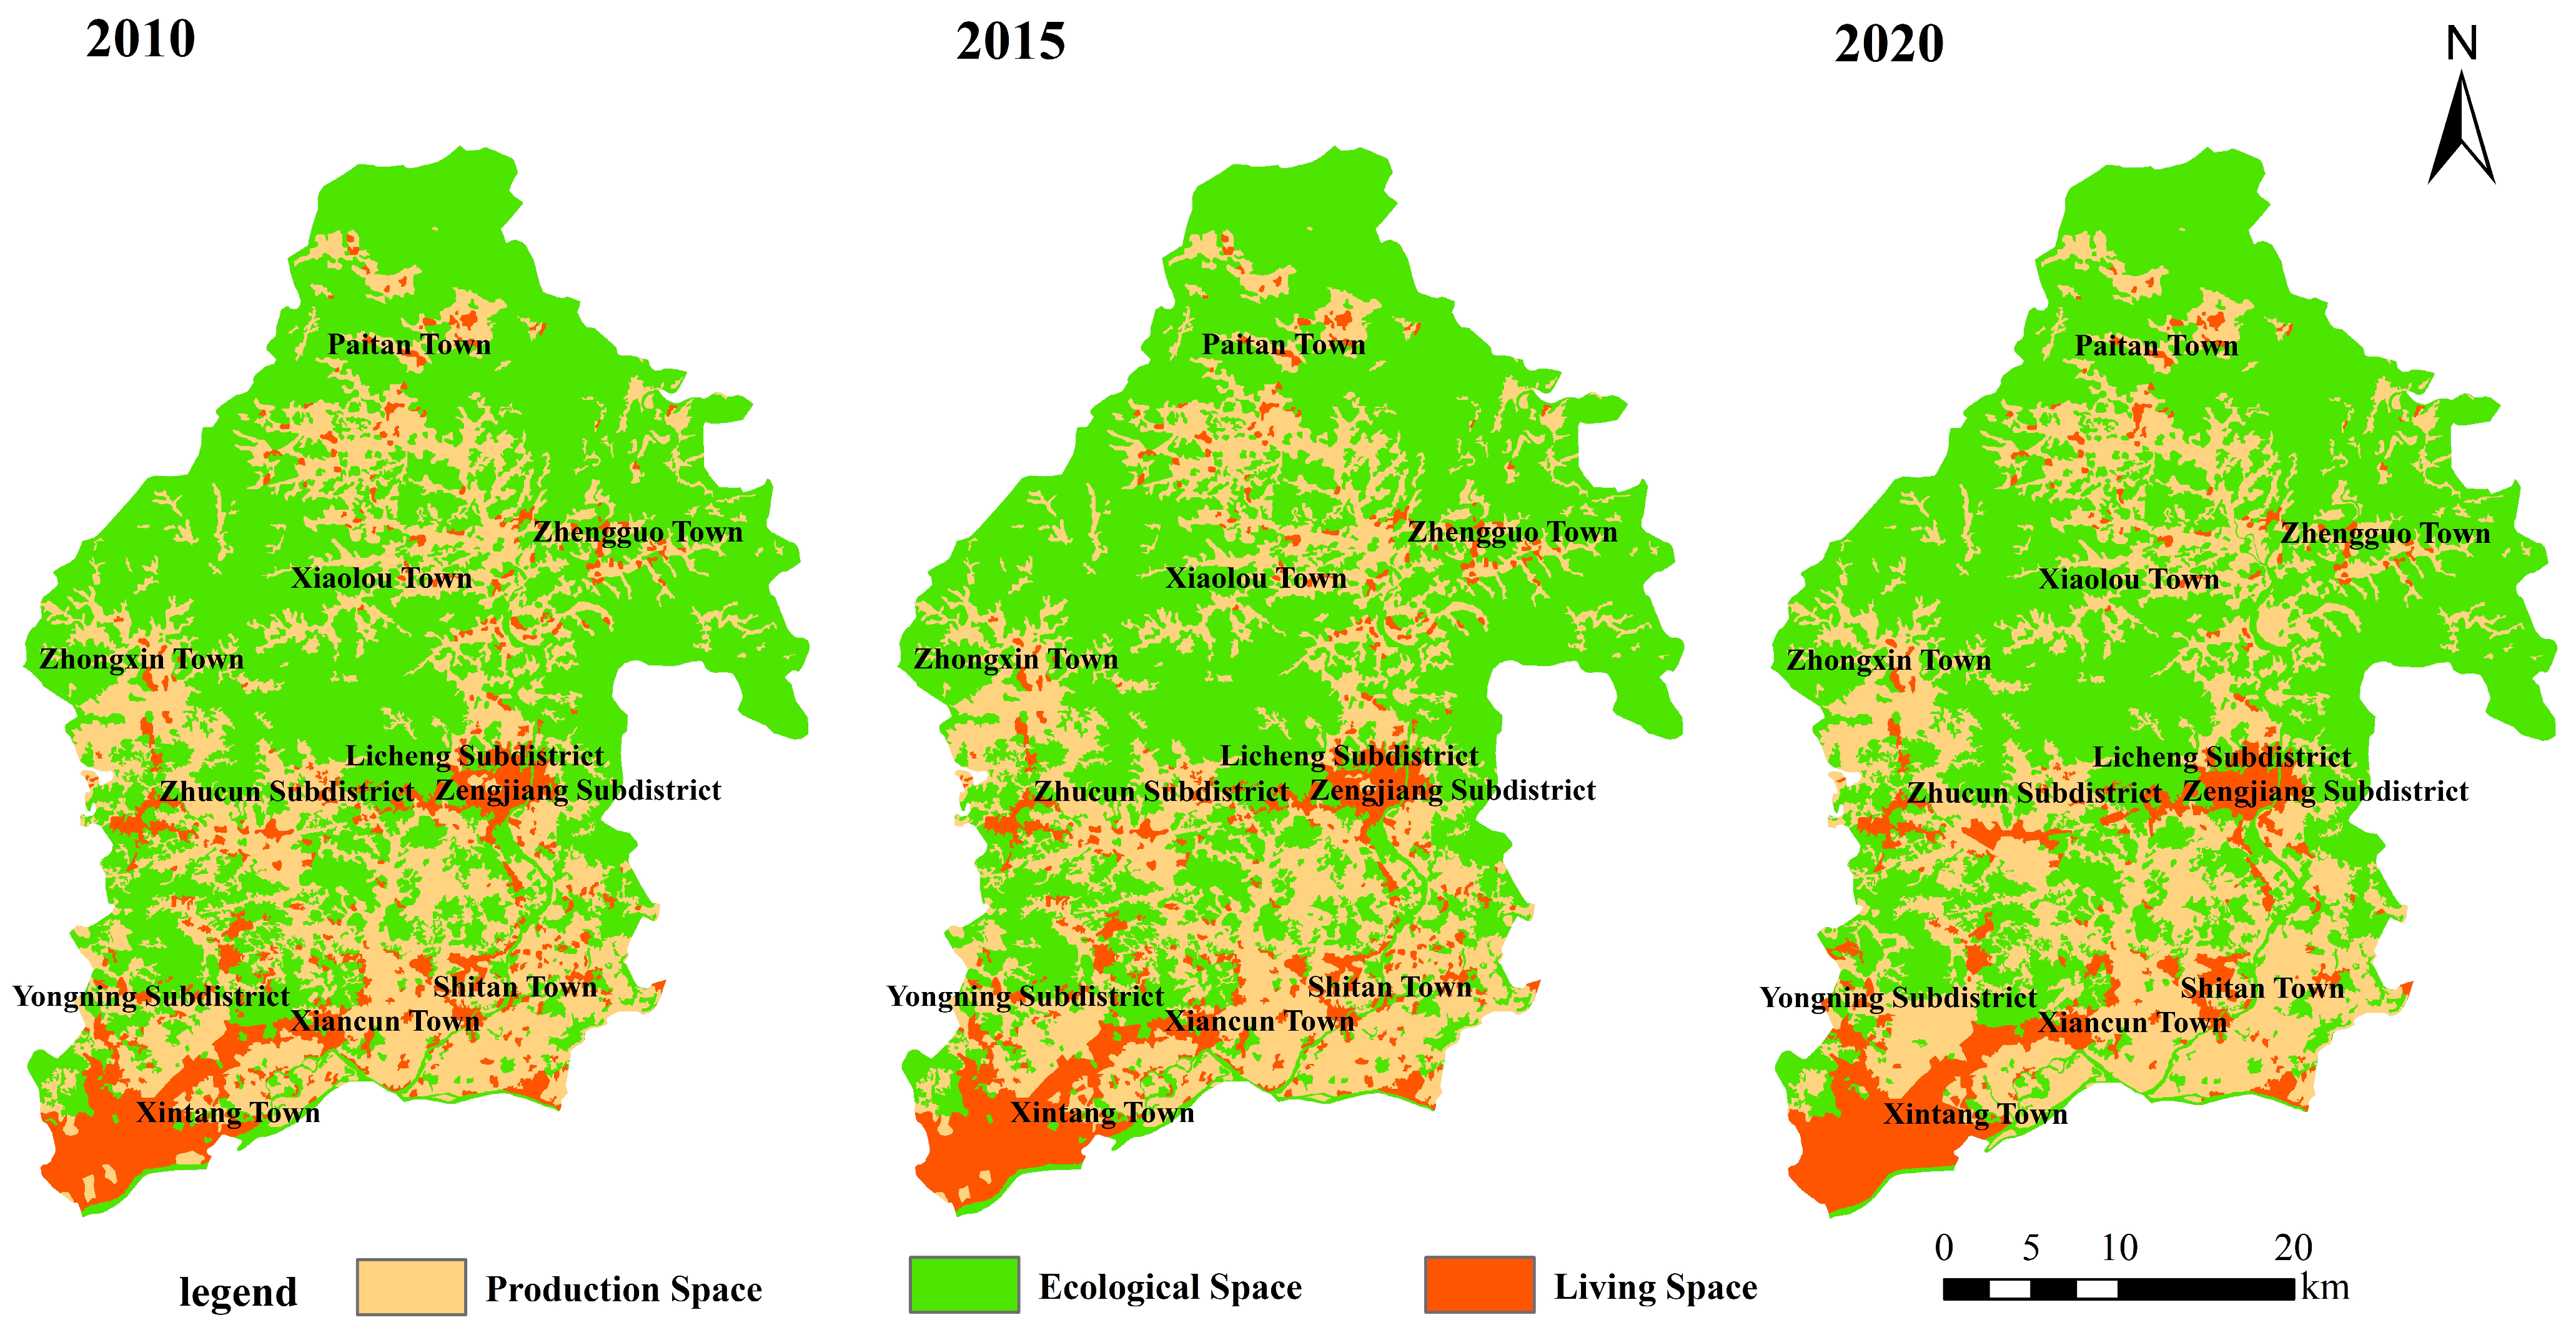
Based on the spatial categorization system of the PLES land types, the spatial distribution maps of Zengcheng District in 2010, 2015, and 2020 were produced (Figure 3 and Figure 4). In 2010, urban living land was primarily concentrated in the central urban area. Over time, it expanded eastward, southeastward, and southwestward, with the main development areas focusing on Licheng Street, Xintang Town, Shitan Town, and Zhucun Street.
This pattern of development can be attributed to the Zengcheng City Area Main Functional Area Planning, which designated strict controls for the northern ecological-agriculture and eco-tourism zone, the central urban living area, and the southern industrial development zone. Additionally, stringent ecological restoration measures for towns and villages across the district played a significant role in shaping this spatial evolution.
Over time, agricultural land in Zengcheng District has become increasingly fragmented, particularly in Zhongxin Town, Shitan Town, and Yongning Street, due to accelerated urbanization and industrialization. After 2015, agricultural land in Xintang Town and Xiancun Town experienced a significant decline, influenced by the implementation of rural revitalization strategies and land improvement projects. Between 2010 and 2020, efforts in forest conservation and greening resulted in the transformation of portions of agricultural land into ecological land, thereby enhancing the quality of the ecological environment.
Zengcheng District is characterized by a substantial proportion of ecological land, which plays a crucial role in maintaining environmental functions. However, this ecological significance has been increasingly compromised due to the encroachment of land for production and residential purposes. Between 2010 and 2015, forests and grasslands in Licheng Street, Xintang Town, and Shitan Town were significantly reduced, with some agricultural land being converted into forested areas. Following 2015, the decline in grasslands continued, although ecological protection measures were implemented, leading to an increase in the proportion of ecological land from 16.87% in 2010 to 18.56% in 2020. These gains were particularly concentrated in Xiaolou, Zhongxin, and Paitan Towns, where ecological restoration efforts successfully enhanced the local environment and promoted the coordinated development of production, living, and ecological spaces (PLESs).
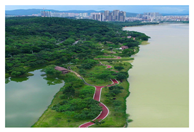
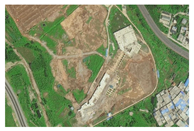
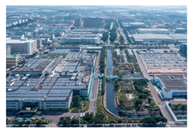
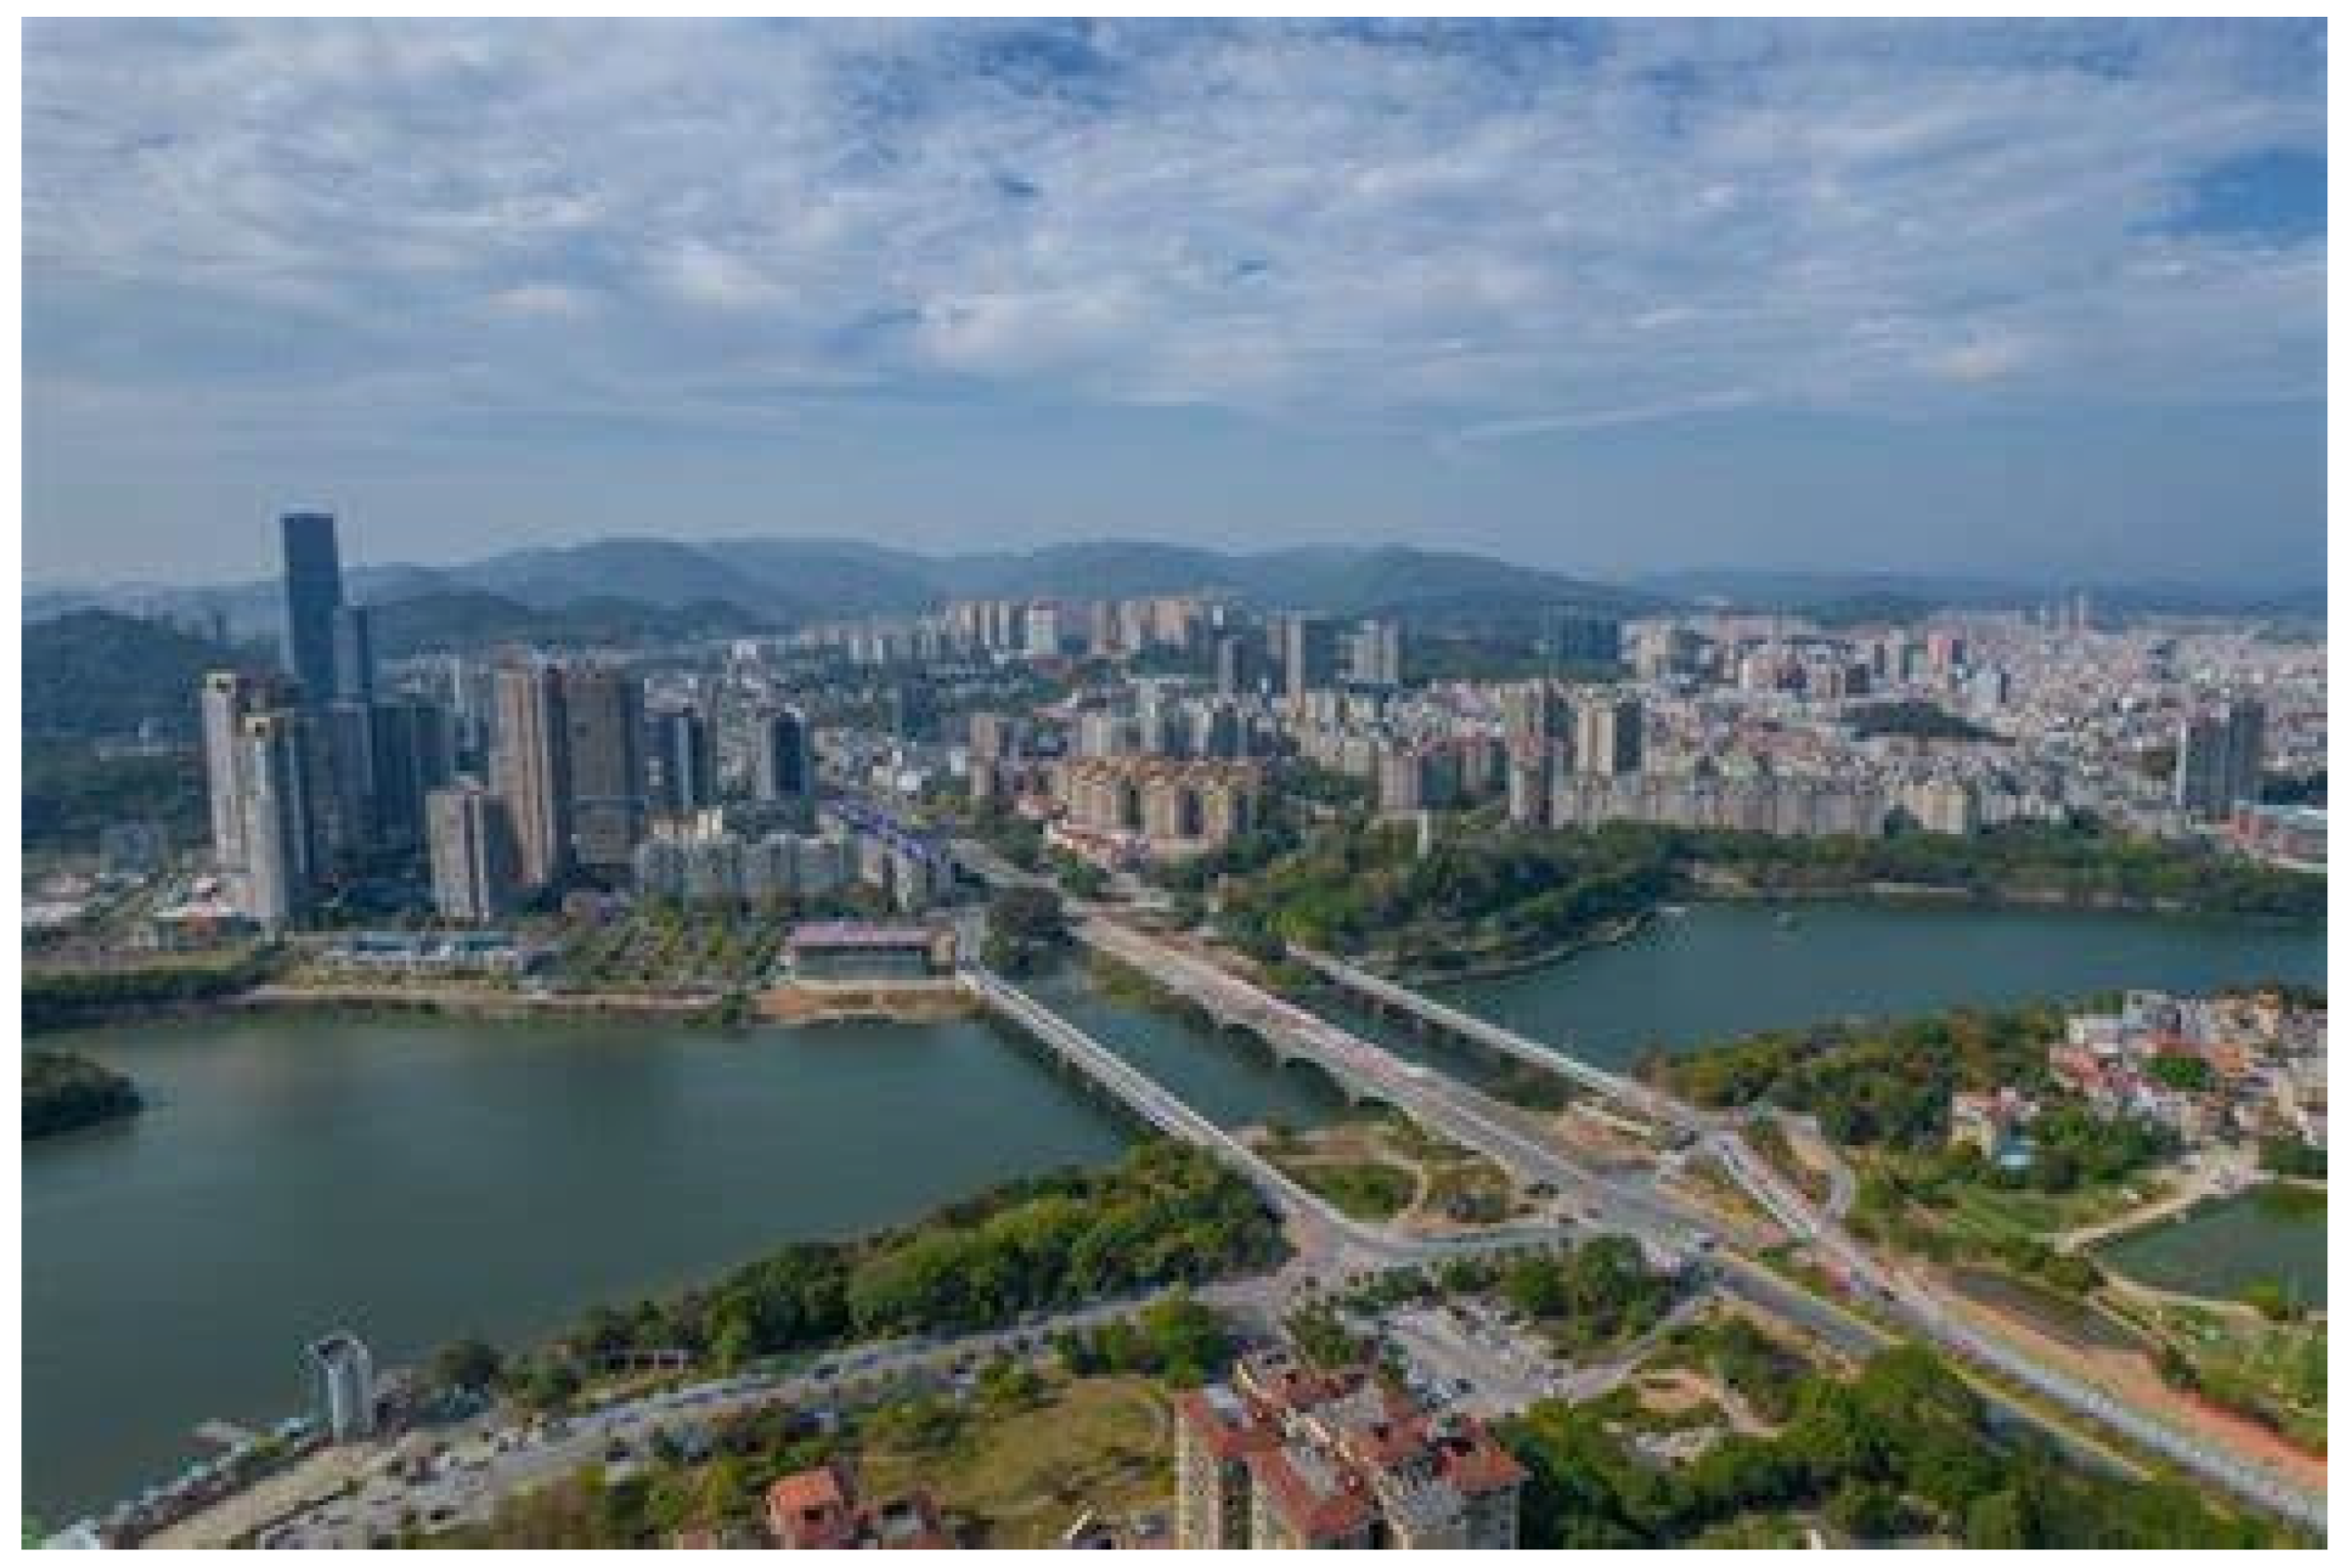
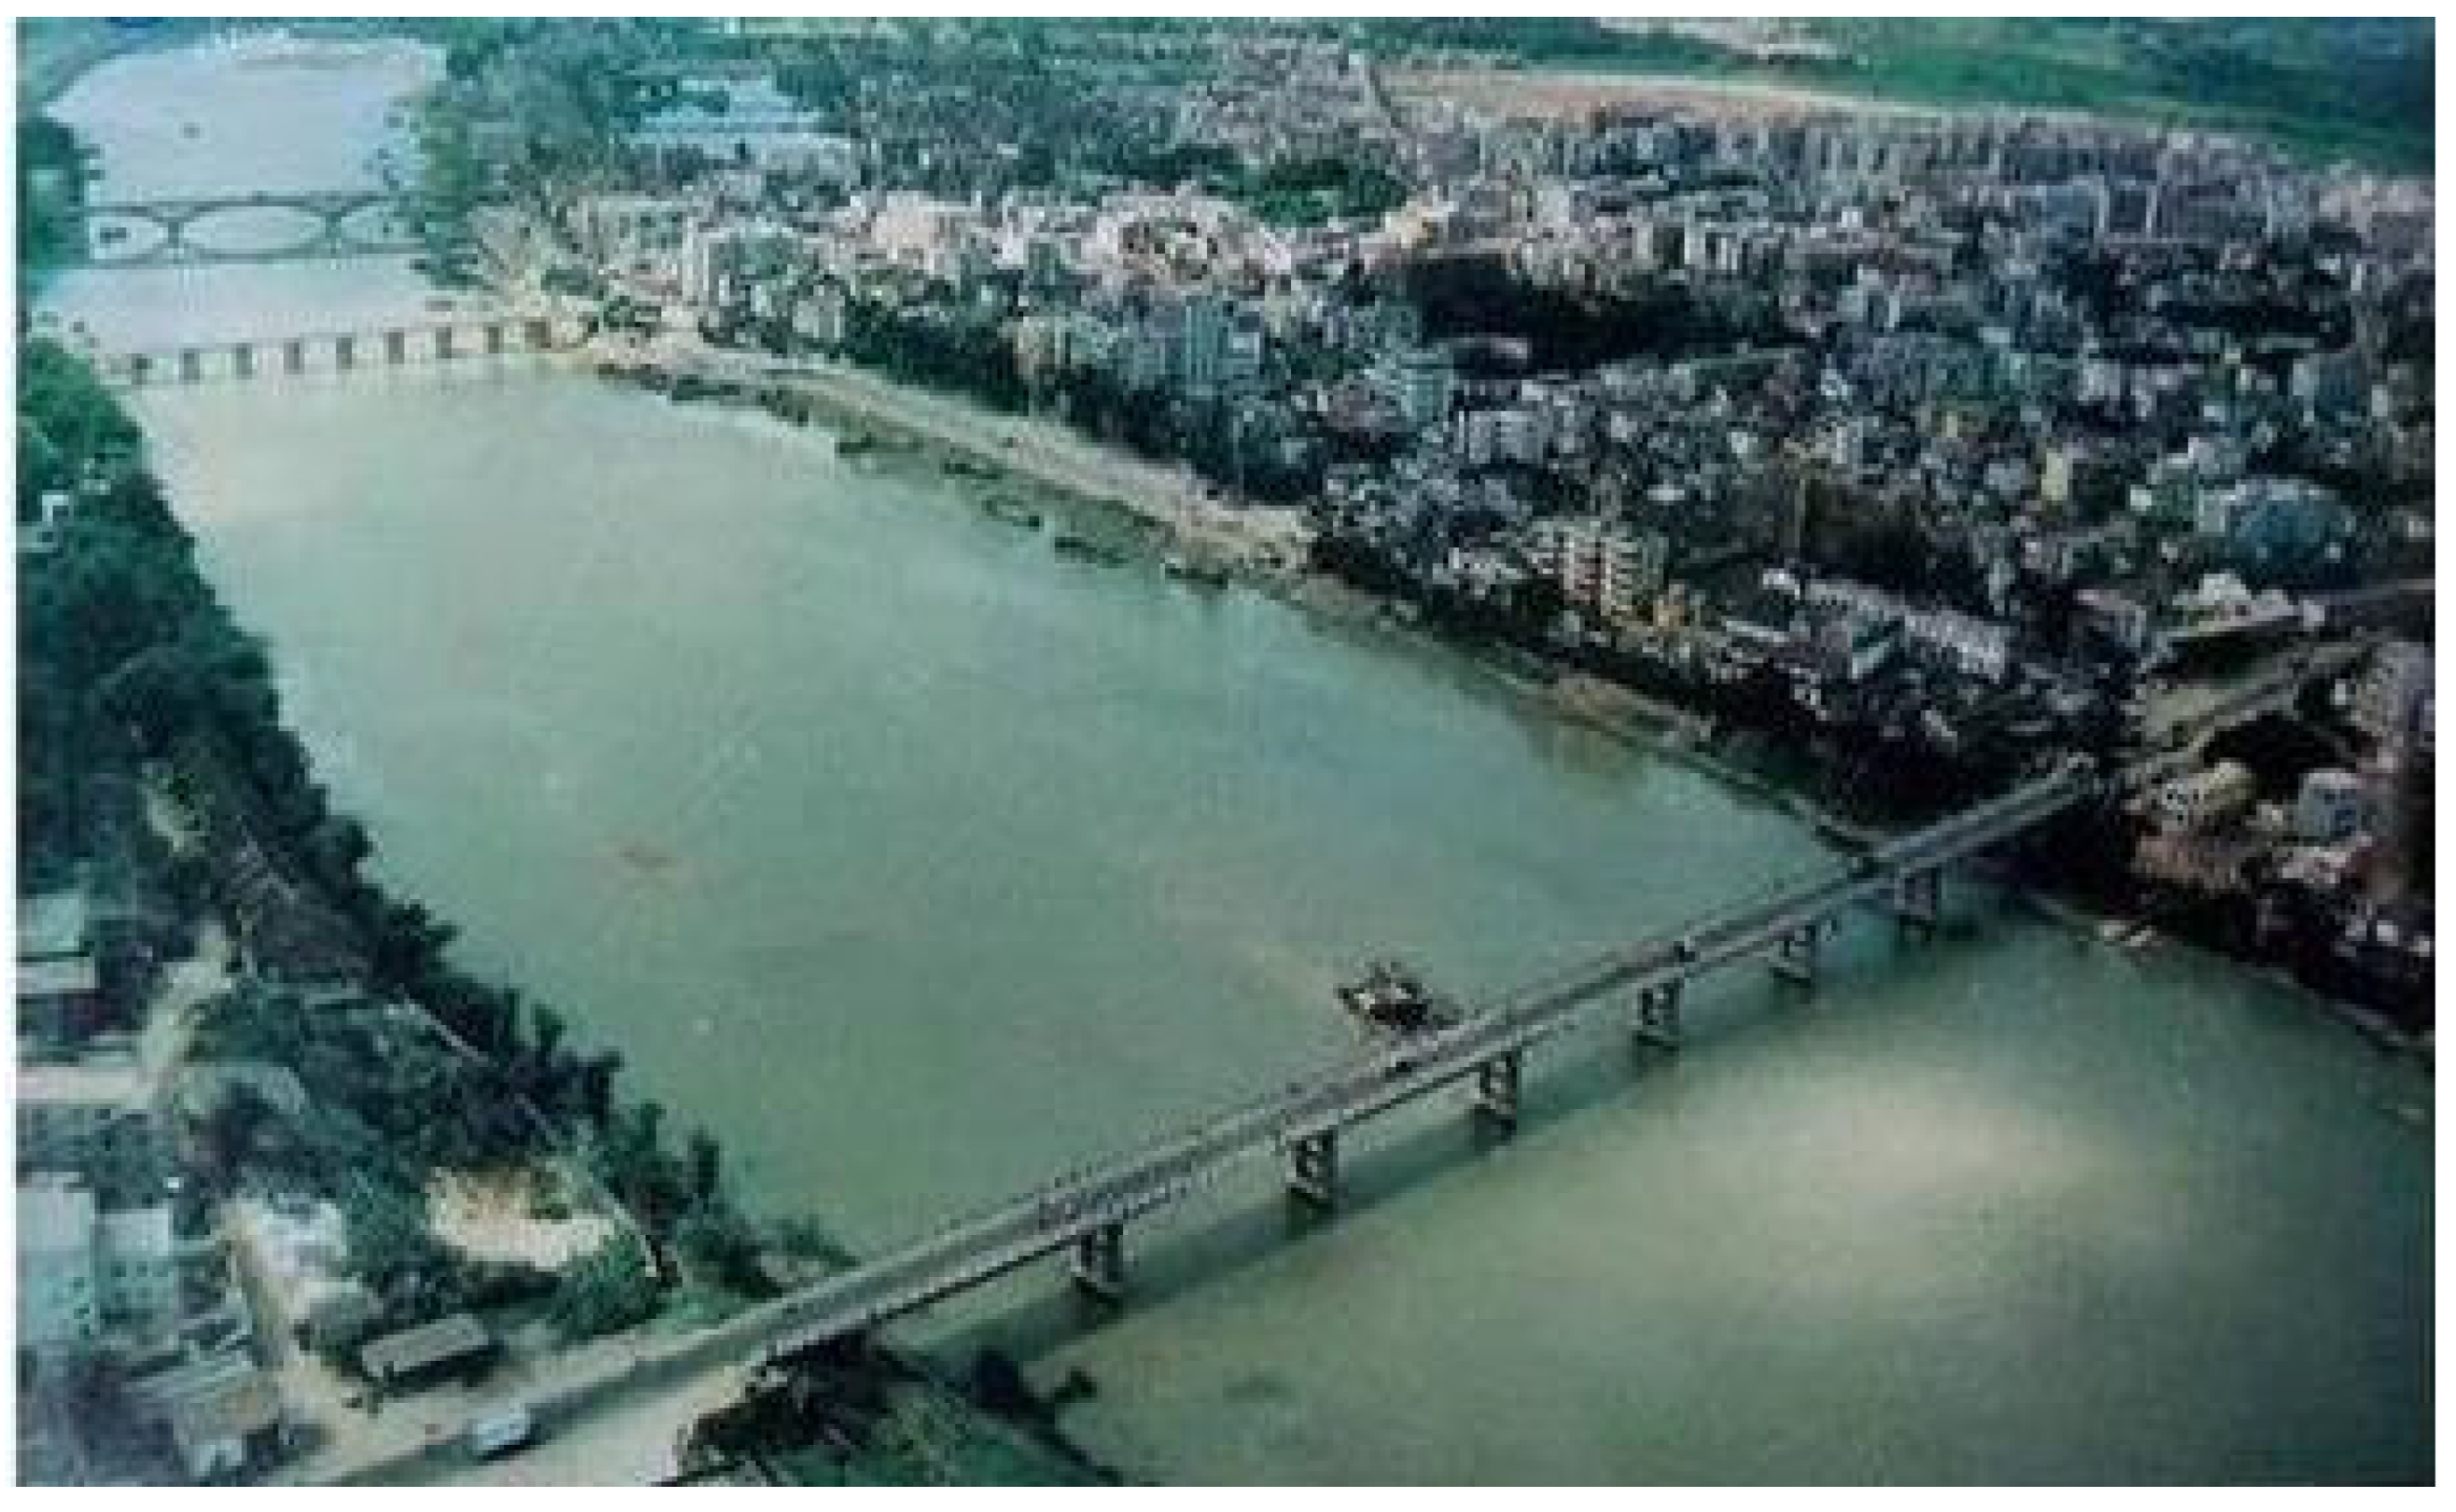
To analyze the evolution of PLES conflicts in Zengcheng District, we compare historical and contemporary spatial patterns. Using two photographs—one from 1989 (Figure 5) and another from the present day (Figure 6)—we illustrate the significant transformations in land use and the increasing intensification of conflicts between production, living, and ecological spaces. These visual aids provide valuable context for understanding the spatiotemporal evolution of these conflicts and the influence of urbanization on the district’s land-use dynamics.

4.2. PLES Conflict Measurement

To quantify spatial conflicts, a modeling approach based on the PLES framework was employed [34,35]. Landscape ecology indices were measured to evaluate spatial conflicts in Zengcheng District for 2010, 2015, and 2020, with the results summarized in Table 5.
The PLES conflict index revealed a temporal distribution pattern of weak conflict > weaker conflict > medium conflict > stronger conflict > strongest conflict. Overall, the intensity of spatial conflicts has increased over time but remains within a manageable range. The proportion of stable and controllable units decreased slightly but still accounted for over 80%. Moderate conflicts rose between 2010 and 2015 but showed a decline from 2015 to 2020. However, the share of severe conflict units steadily increased, from 0.89% in 2010 to 2.15% in 2020, indicating growing pressure on the spatial functions of production, living, and ecology in certain areas.
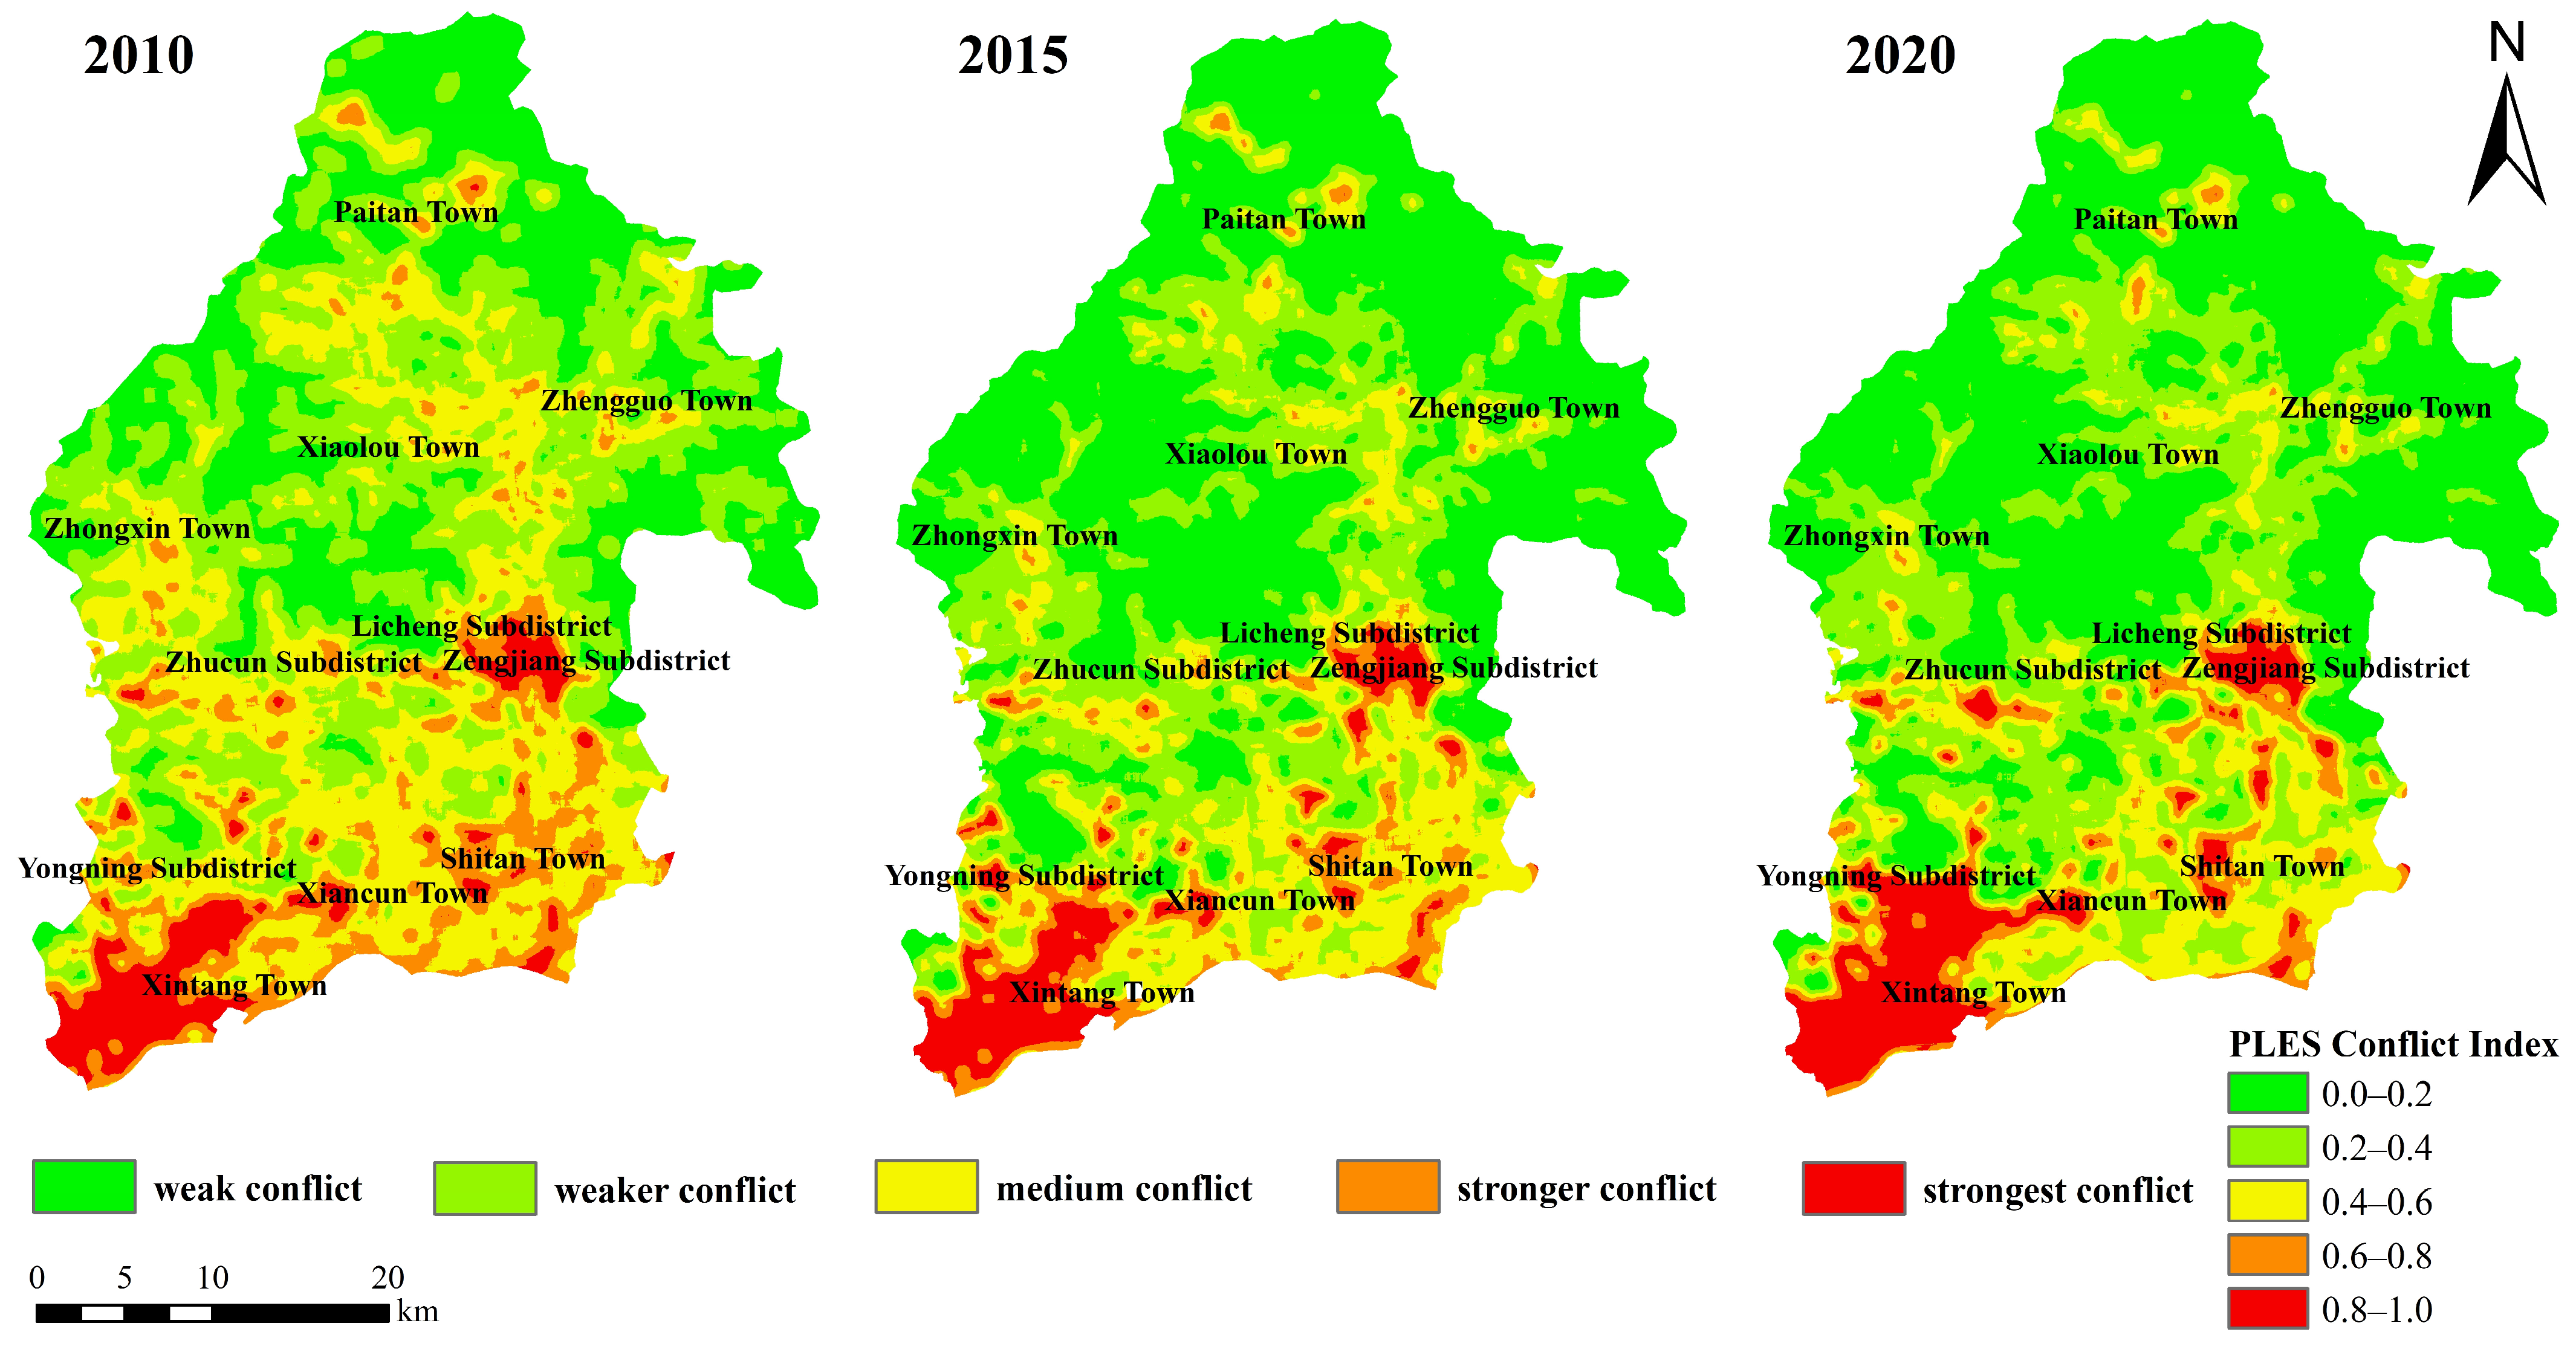
Over the past decade, the spatial distribution of conflict levels in PLES of Zengcheng District has undergone significant changes (Figure 7). In 2010, the majority of the area experienced weak conflicts, with moderate conflicts concentrated in the southern and central regions and almost no strong conflict zones observed. By 2015, weak and moderate conflict areas expanded, particularly in the southern and central regions of the district, mirroring the growth of living spaces.
By 2020, weak and moderate conflict areas continued to spread, and the extent of strong conflict zones increased, primarily concentrated in the southern region. This area includes a 60 km2 national-level economic and technological development zone, where production spaces are significantly constrained by the expansion of living spaces.

4.3. An Analysis of the Drivers of Conflict in the Sangsang Space

4.3.1. Construction of the Indicator System

To analyze the driving factors behind these spatial conflicts, socio-economic data, natural resource attributes, and land-use information for Zengcheng District were integrated into the study [36,37]. A comprehensive indicator system was developed to evaluate the drivers of spatial conflicts from three dimensions: socio-economic activities, natural resource endowment, and ecological protection measures (Table 6). This framework seeks to offer a comprehensive understanding of the interactions and potential conflicts between production, living, and ecological spaces in Zengcheng District, facilitating a more nuanced evaluation of their respective impacts.

4.3.2. Factor Detection Analysis

The conflict index was designated as the dependent variable (Y), while the driving factors were assigned as the independent variables (X). The PLES conflict index and 13 driving factors were rasterized, reclassified using ArcGIS 10.2, and subsequently analyzed in RStudio 4.3.0. The results (Table 7, Table 8 and Table 9) revealed that 12 out of the 13 factors significantly influenced PLES conflicts, with the exception of river network density (X6), which exhibited a low q-value and no statistically significant effect.
From 2010 to 2020, the Normalized Difference Vegetation Index (NDVI) (X7) and nighttime lighting intensity (X2) emerged as the most significant factors, highlighting the pivotal influence of economic development and infrastructure expansion in shaping spatial conflicts. The NDVI emerged as the strongest influencing factor, particularly notable in 2020 (q = 0.5691) and 2010 (q = 0.5522). Nighttime lighting also exhibited a strong correlation, especially in 2020 (q = 0.5154) and 2015, further highlighting the impact of urbanization and human activity.
Natural factors, such as elevation (X12) and annual temperature (X8), also played a significant role, particularly in 2020. The multi-factor q-values in 2020 were substantially higher than those in 2010, indicating that spatial conflicts have become more complex over time. This shift reflects a transition in driving forces: from the predominance of economic development and urbanization in the earlier period to a more intricate interplay of multiple factors by 2020. The exacerbation of spatial conflicts in recent years underscores the compounded effects of natural and socio-economic influences.

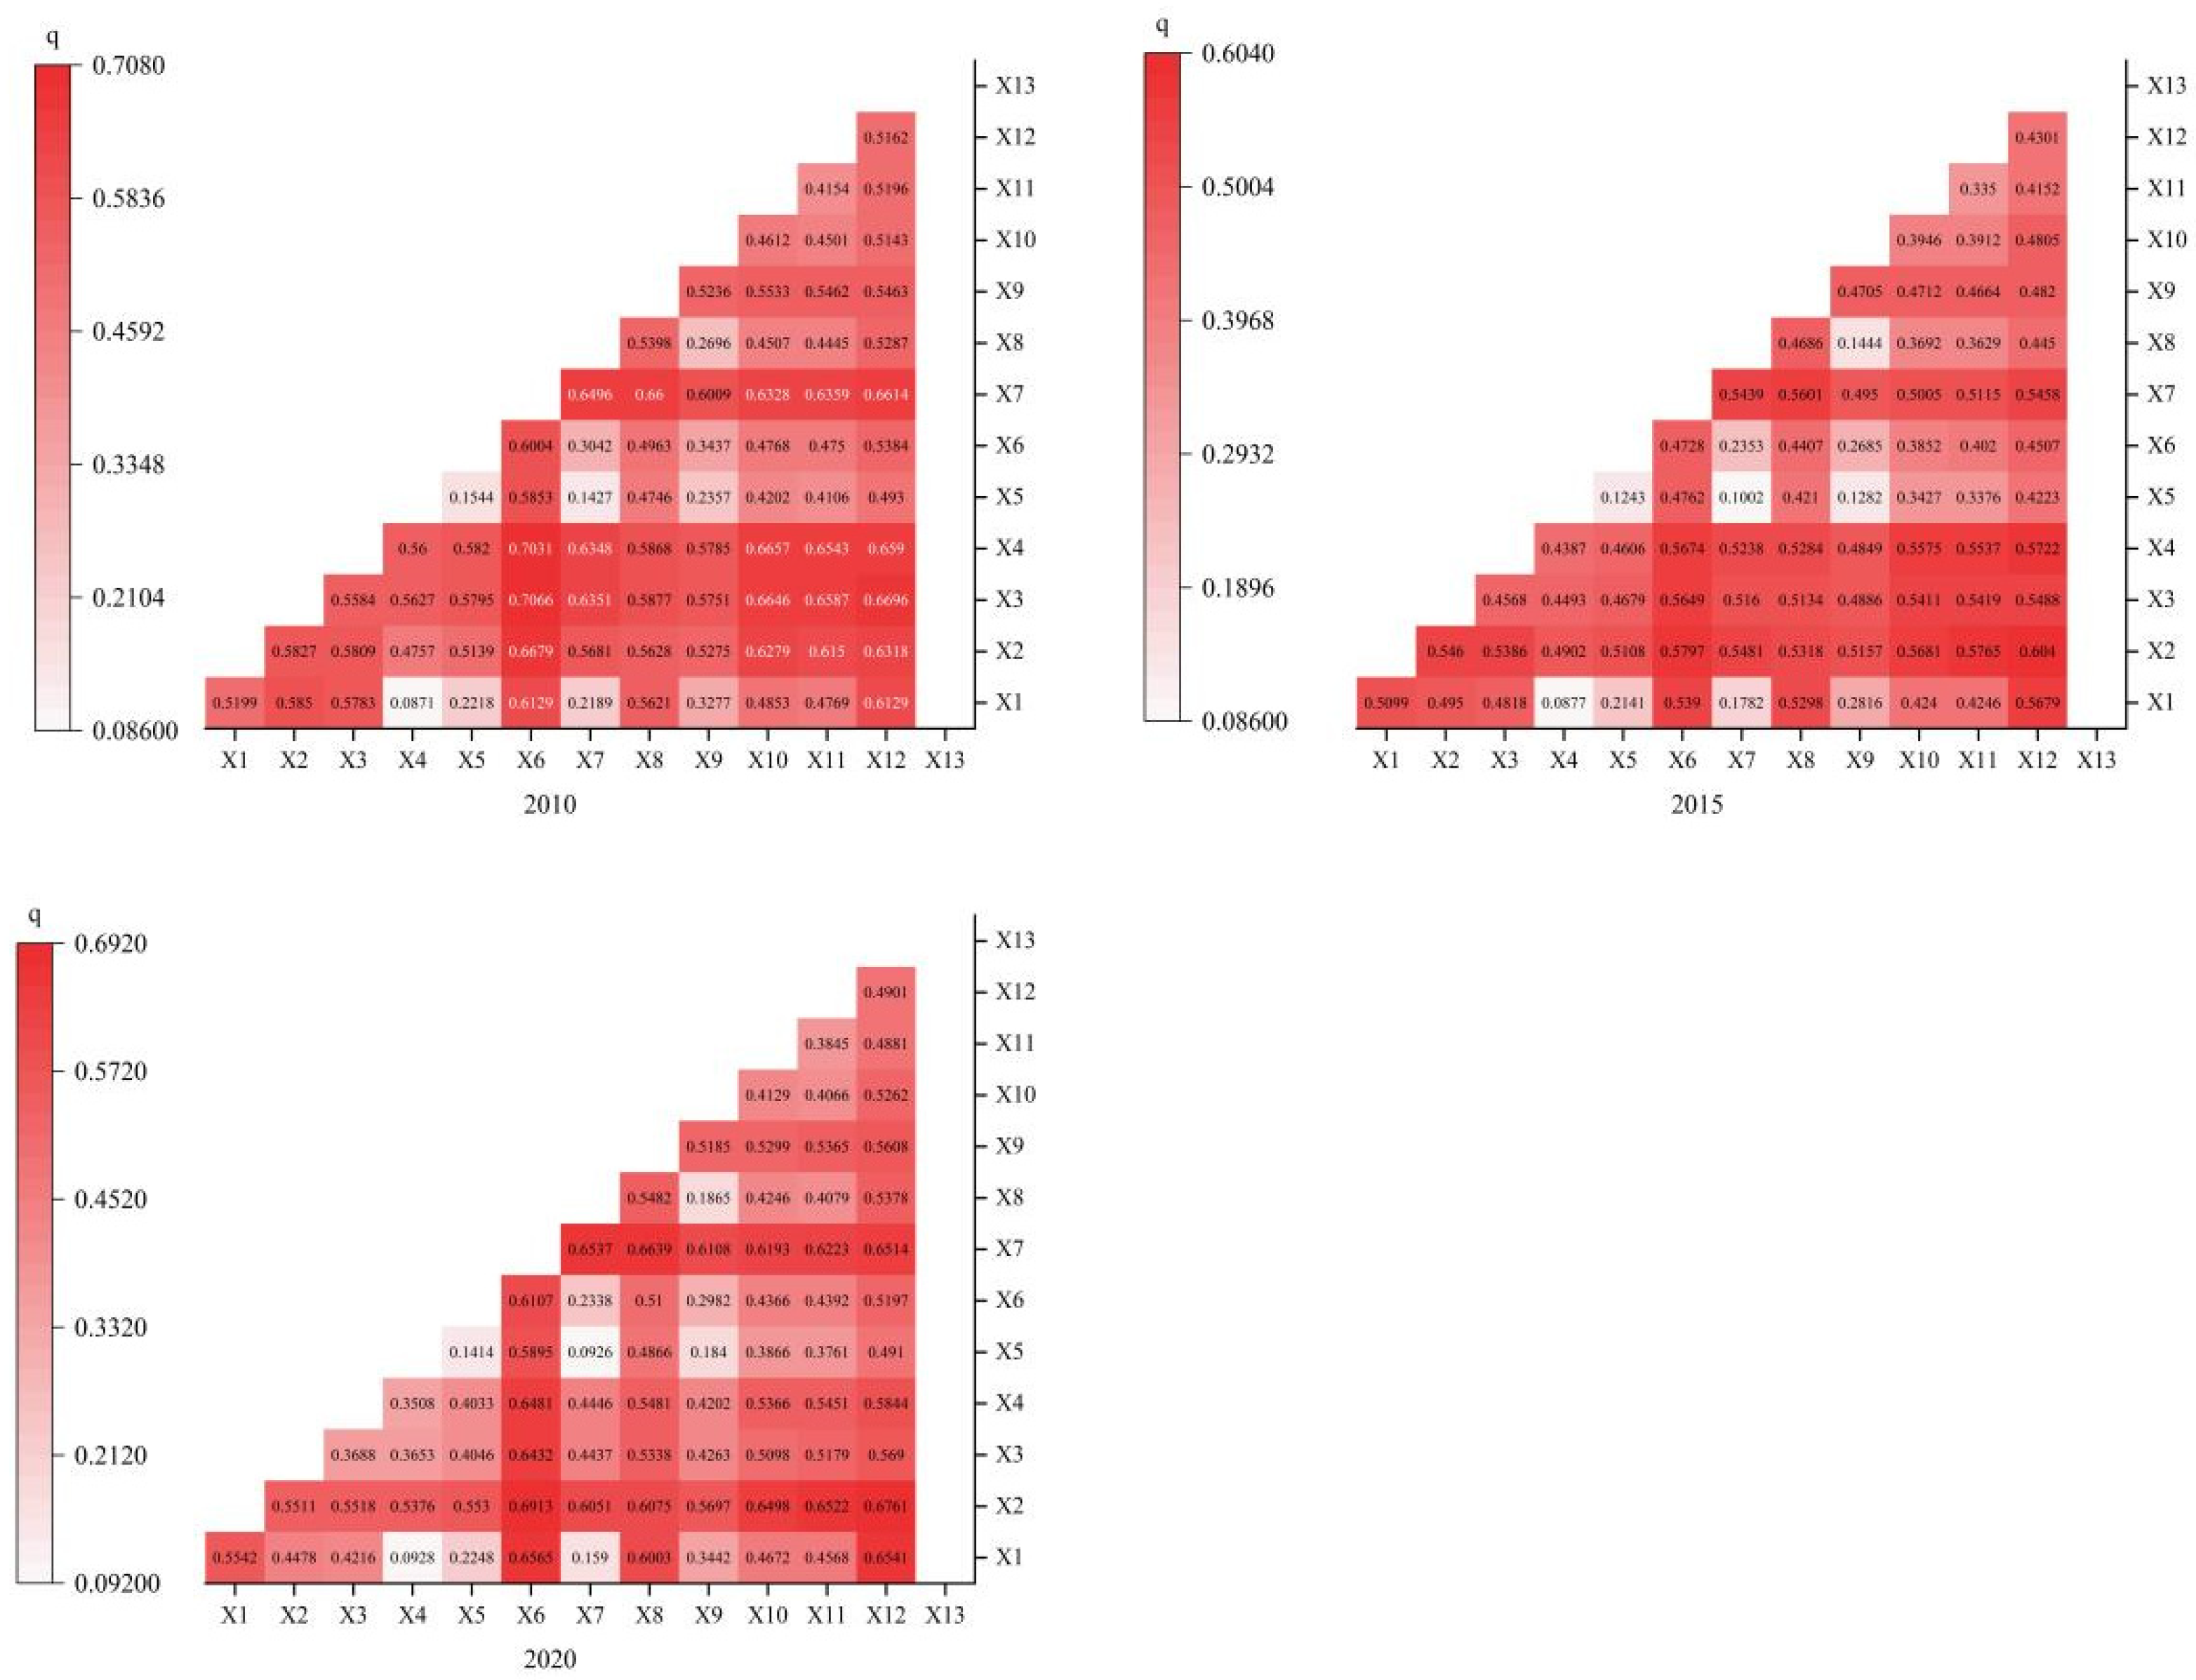
4.3.3. Interaction Detection Analysis

The interaction detection results from the Optimal Parameter Geodetector (Figure 8) reveal that interactions between any two factors exhibit either nonlinear enhancement or two-factor enhancement, with nonlinear enhancement being predominant. This indicates that the explanatory power of spatial conflicts in the PLES is significantly amplified when two factors are combined compared to when each factor acts independently. These findings indicate that PLES conflicts in Zengcheng District are influenced by the complex interplay of various natural and socio-economic factors, rather than being attributed to a single driving force.
The dominant influencing factors of PLES conflicts in Zengcheng District remained consistent across 2010, 2015, and 2020. The interaction between nighttime lighting intensity and river network density (X2∩X6) demonstrated the highest explanatory power, with q-values of 0.7066, 0.6040, and 0.6913 for the respective years, underscoring the enduring and substantial influence of this interaction in driving spatial differentiation. Furthermore, interactions such as the NDVI and slope (X7∩X12) and nighttime lighting and topographic relief (X2∩X11) exhibited q-values exceeding 0.5, underlining the critical role of combined natural and socio-economic factors in driving spatial conflicts.
Several other interactions, with q-values between 0.3 and 0.5, also contributed to the spatial differentiation patterns, albeit to a lesser degree.
Overall, the interactions of factors such as nighttime lighting, river network density, slope, and topographic relief are identified as key determinants of PLES conflicts in Zengcheng District from 2010 to 2020. These findings offer a solid foundation for informing future regional land-use planning and spatial conflict management, with a focus on fostering the coordinated development of production, living, and ecological spaces.

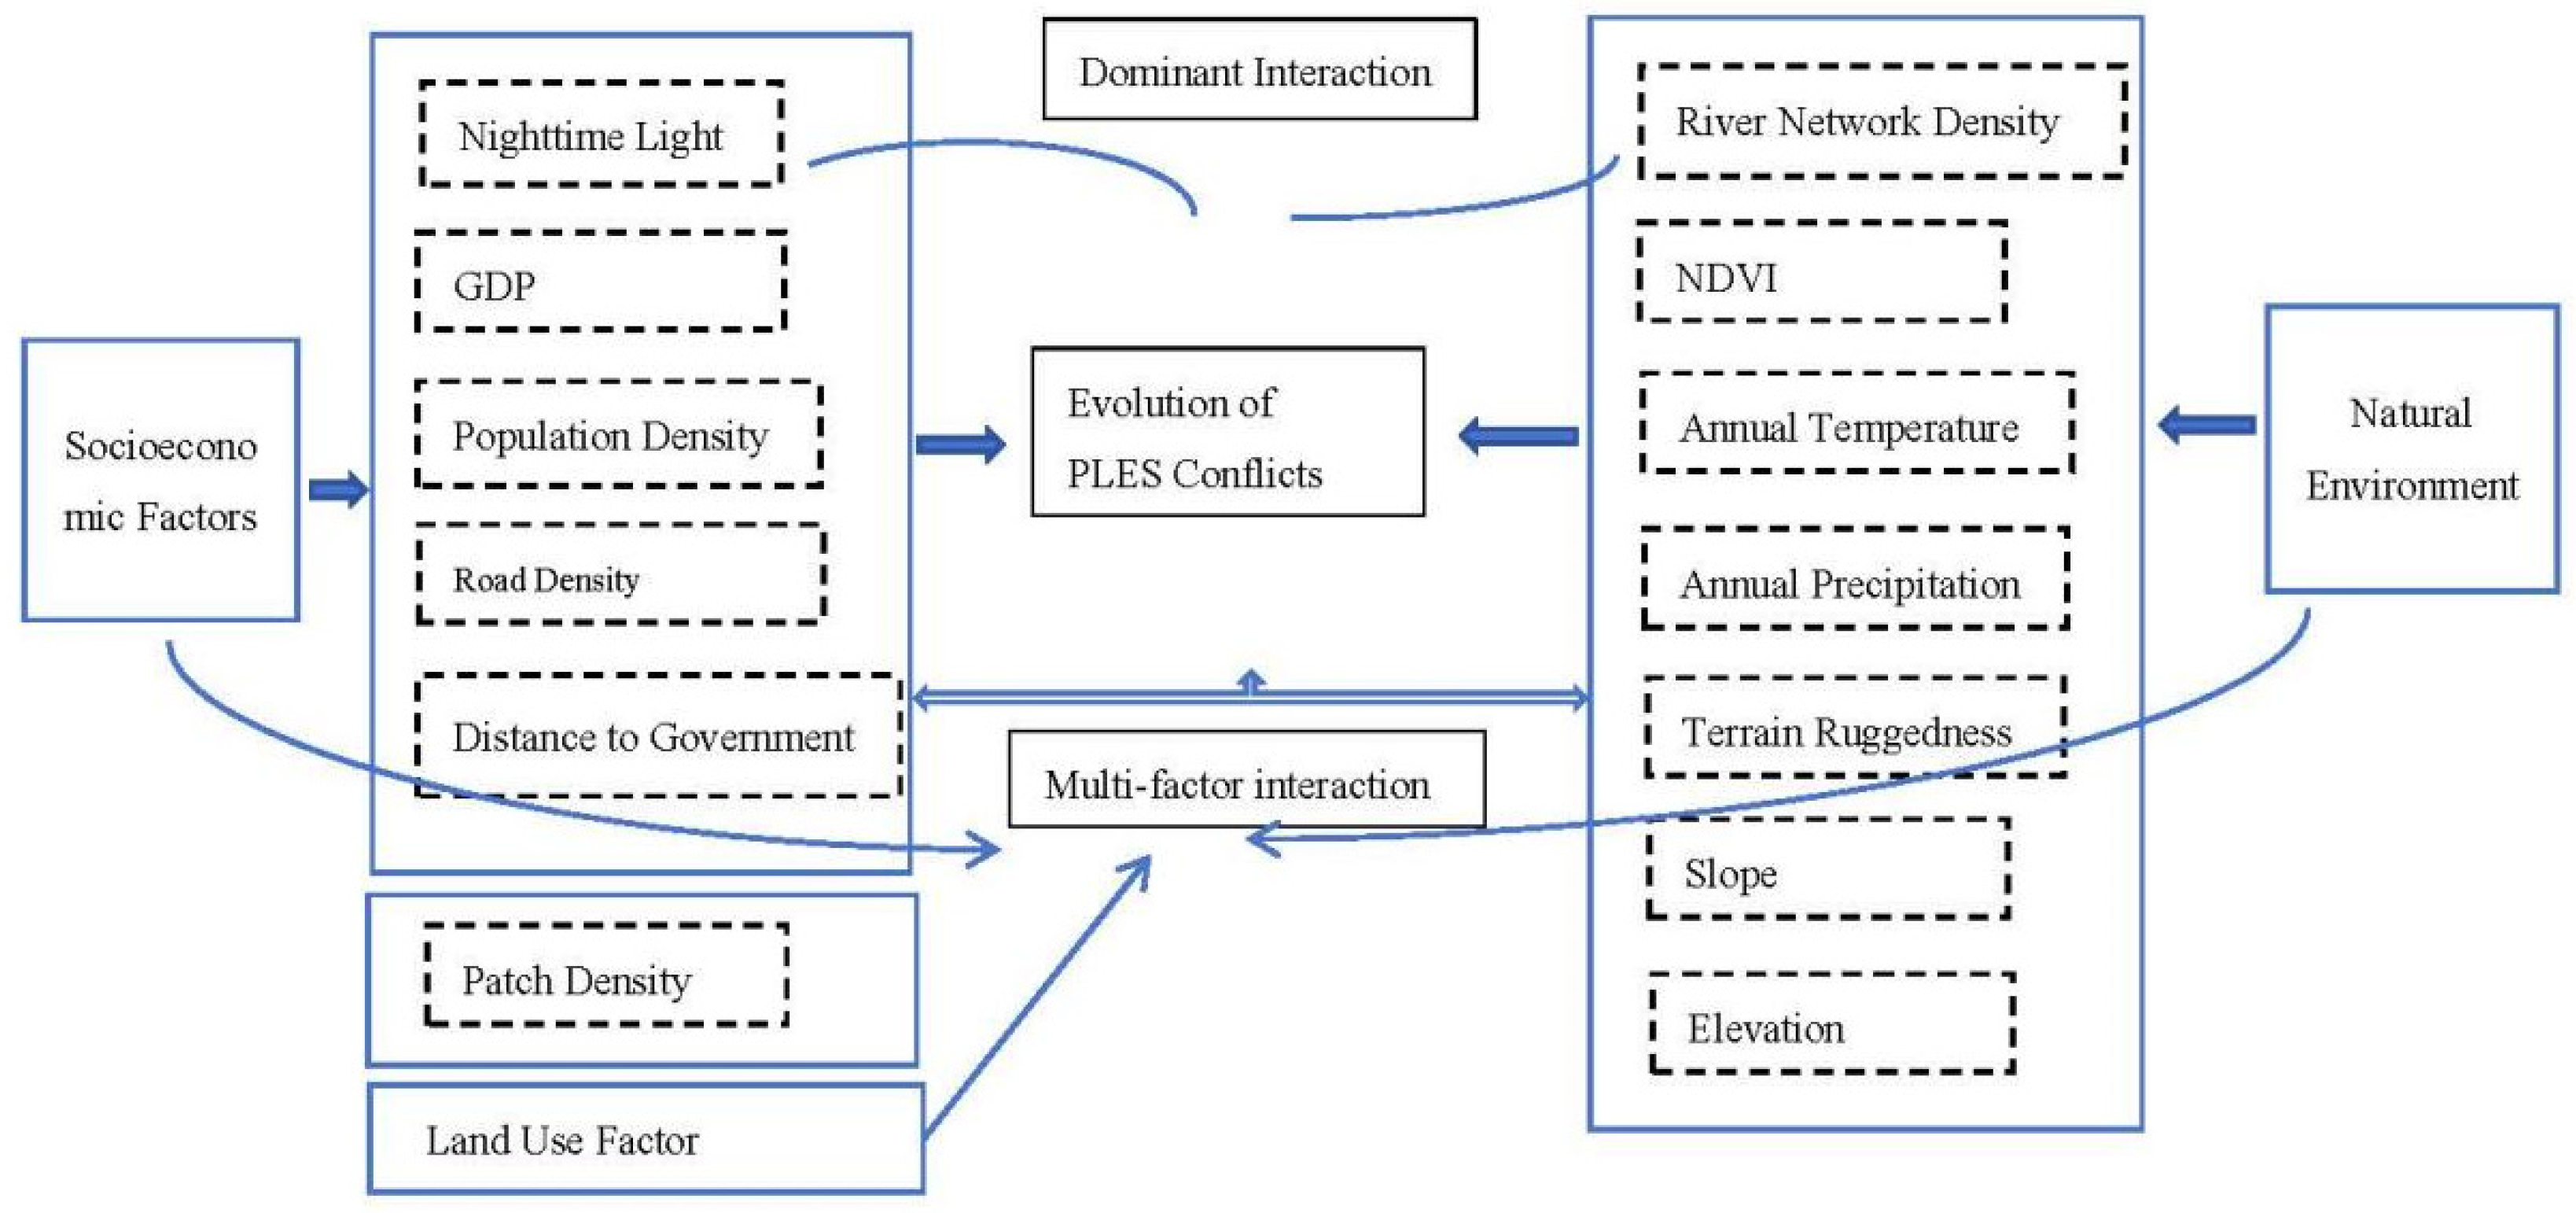
4.3.4. Analysis of Driving Mechanisms Behind Spatial Conflicts in PLES of Zengcheng District

The findings from factor and interaction detection using the Optimal Parameter Geodetector reveal that a combination of natural and socio-economic factors collectively influences the intricate spatial differentiation patterns in Zengcheng District. The primary drivers of PLES conflicts in the district are summarized as follows (Figure 9):
  • Demographic and Economic Pressures: High population density, rapid population growth, elevated urbanization levels, and a fast-paced economic development trajectory significantly drive PLES conflict indices. These factors intensify land-use pressures and exacerbate spatial conflicts among production, living, and ecological spaces.
  • Urban Fringe Dynamics: Zengcheng District, as a prominent urban fringe area, is characterized by rapid urban expansion and high-intensity land-use transformations. These processes drive intense competition among production, living, and ecological spaces, particularly in regions experiencing accelerated urbanization and industrial growth.
  • Interplay of Socio-Economic Factors: The unique geographic and economic positioning of Zengcheng, marked by a developed economy, advanced urbanization, and constrained land resources, amplifies PLES conflicts. The synergistic effects of these socio-economic factors increase ecological pressures, limit production activities, and reduce the quality of the living environment.
This complex interplay of factors highlights the multifaceted and interconnected nature of spatial conflicts in Zengcheng District. Addressing these challenges requires integrated strategies that balance economic growth, urban expansion, and ecological sustainability to ensure harmonious development across production, living, and ecological spaces.
The analysis reveals that the PLES conflicts in Zengcheng District are driven by a multidimensional synergy of natural and socio-economic factors, as outlined below:
1.
Impact of Single Factors:
Among the 13 factors analyzed, 12 exhibited significant influence on PLES conflicts, with river network density being the only exception. Notably, the impact of the NDVI and nighttime lighting has shown a consistent upward trend over the years, underscoring the dominant role of socio-economic activities and urbanization in driving spatial conflicts. Simultaneously, the growing influence of natural factors, such as elevation and annual air temperature, highlights the importance of ecological and environmental changes as contributors to spatial conflicts.
2.
Influence of Multi-Factor Interactions:
The interactions between factors exhibited greater explanatory power for spatial conflicts compared to individual factors, with most interactions showing a nonlinear enhancement in their effects. The interaction between nighttime lighting intensity and river network density consistently emerged as the most influential determinant of spatial differentiation across all years, highlighting the significant impact of the combined influence of natural and socio-economic factors. Additionally, interactions between nighttime lighting and terrain relief, as well as between the NDVI and slope, also demonstrated considerable explanatory power, emphasizing the synergistic effects of natural resource attributes and socio-economic variables on spatial conflict dynamics.
3.
Socio-economic dynamics on spatial conflicts.
These findings emphasize the intricate interplay of factors influencing spatial conflicts in Zengcheng District, underscoring the critical need for integrated spatial planning and conflict resolution strategies that holistically address both natural and socio-economic dimensions.

5. Discussion and Conclusions

5.1. Discussion

This study employs the Optimal Parameter Geodetector method to optimize the parameters of individual factors, uncover the interactions among them, and provide an in-depth analysis of the driving mechanisms behind spatial conflicts. Compared to the traditional Geodetector approach, the Optimal Parameter Geodetector offers significant advantages, including the ability to better address complex nonlinear relationships among multiple factors, enhance the model’s explanatory power, and clarify the relative contributions and interaction effects of each factor. This method ensures more a rational and precise parameter selection for spatial factors, enabling a clearer representation of the spatial differentiation characteristics of PLES conflicts. However, this study has limitations. First, the Optimal Parameter Geodetector depends on a predefined variable selection, which may overlook certain influencing factors. Second, while it reveals factor interactions, it does not establish causal relationships, requiring further validation through complementary quantitative or qualitative methods. The findings elucidate the formation mechanisms and evolutionary dynamics of PLES conflicts in Zengcheng District, providing theoretical and methodological insights that contribute to a broader understanding of spatial conflicts in urban fringe areas worldwide, particularly in rapidly urbanizing regions facing similar land-use challenges.
Using Zengcheng District as a case study, this research study explores the underlying mechanisms driving PLES conflicts in urban fringe areas and their spatiotemporal evolution. Nevertheless, certain limitations persist. The Optimal Parameter Geodetector may fall short in accurately capturing dynamic spatial variations due to the constrained temporal resolution of the dataset. Furthermore, the research model did not comprehensively incorporate the intricate effects of policy interventions and anthropogenic activities, both of which exert profound influences on regional spatial conflicts. To bridge these gaps, future research should incorporate high-resolution spatiotemporal datasets and explicitly integrate policy and governance variables into the analytical framework. These advancements would enhance both the explanatory power and predictive accuracy of PLES conflict analysis, providing a more robust theoretical and methodological framework for understanding spatial conflicts in urban fringe areas globally. By offering insights into land-use dynamics and conflict mitigation strategies, these findings contribute to the integrated planning, sustainable development, and strategic conservation of territorial space. This, in turn, supports balanced urban–rural transitions, fosters regional spatial optimization, and aligns with broader global efforts toward sustainable land management and spatial integration.

5.2. Conclusions

The dissertation research led to the following conclusions:
  • The PLES conflicts in Zengcheng District demonstrate distinct spatial and temporal evolution patterns. The average PLES conflict indices for 2010, 2015, and 2020 were 0.17, 0.32, and 0.18, respectively, indicating an overall increase of 5.9% from 2010 to 2020. This trend suggests a progressive intensification of land-use conflicts among production, living, and ecological functions, particularly in high-conflict zones. To mitigate these conflicts, a comprehensive land consolidation approach should be adopted. For instance, territorial spatial planning and land-use zoning can optimize the spatial layout of production, living, and ecological spaces, ensuring a rational allocation of land functions. Additionally, ecological restoration measures such as wetland restoration, farmland ecological compensation, and afforestation can help alleviate conflicts in ecologically sensitive areas. Implementing comprehensive land consolidation strategies, including farmland protection, rural settlement restructuring, and degraded land rehabilitation, can enhance land-use efficiency and promote the coordinated development of urban and rural areas.
  • The Optimal Parameter Geodetector analysis reveals that the interaction between nighttime lighting and river network density exerts the most significant influence on conflicts, with a q-value of 0.69 in 2020. This underscores the critical role of the interplay between socio-economic development and resource environments in intensifying conflicts. Furthermore, the combined effects of natural factors, such as river network density and the NDVI, alongside socio-economic variables like nighttime lighting, substantially shape spatial differentiation patterns. The mechanisms and intensities of these effects vary across different stages of development. Future studies should focus on the long-term monitoring of PLES conflicts, employing continuous spatial–temporal data to track the evolution of these conflicts over extended periods. Moreover, integrating policy interventions into the analysis of conflict dynamics is crucial for developing effective, evidence-based strategies to mitigate PLES conflicts in urban fringe areas.
  • Conflicts are primarily concentrated in areas of rapid urbanization, particularly between urban expansion and ecological reserves. Spatial conflicts show an upward trend, especially in ecologically fragile areas in the southern region. To effectively mitigate these conflicts, it is crucial for policymakers and urban planners to prioritize the protection and restoration of ecological spaces through targeted ecological restoration programs and land-use zoning strategies. Strengthening the integration of ecological considerations into urban development plans, coupled with the enforcement of land-use regulations, will help balance the competing demands of production, living, and ecological functions. These efforts should be coupled with comprehensive monitoring and adaptive management to ensure sustainable land-use practices in the long term.

Author Contributions

Conceptualization, Z.F.; data curation, Z.F.; methodology, Z.F. and S.L.; software, Z.F. and Y.L.; validation, S.L.; writing—original draft, Z.F., Y.L. and S.L.; writing—review and editing, S.L. All authors have read and agreed to the published version of the manuscript.

Funding

This research was funded by Guangdong Provincial Social Science Fund, grant number GD24CGL63.

Data Availability Statement

The original contributions presented in this study are included in the article. Further inquiries can be directed to the corresponding author.

Acknowledgments

We wish to thank the anonymous reviewers and editors for their professional comments and suggestions.

Conflicts of Interest

The authors declare no conflicts of interest.

References

  1. García-Almirall, P.; Redondo, E.; Adán, M.; Ruiz, M.M.; Mazas, J. Evolution of urbanisation and population density in China. In Proceedings of the 29th ISUF International Conference: Urban Form and the Sustainable and Prosperous Cities of the Future, Kraków, Poland, 6–11 September 2022; p. 85648. [Google Scholar]
  2. Ouyang, Z.; Wang, X.; Chen, Q. Existing methodology for ecosystem assessment oriented to climate-change adaptation and mitigation policies focused on ecosystem protection. J. Geogr. Sci. 2016, 26, 1223–1242. Available online: https://www.sciencedirect.com/science/article/pii/S1679007316301621 (accessed on 11 March 2025).
  3. Wang, Y.; Liu, Y.; Zhang, H. Allocation of nature-based solutions (NbS) in urban areas based on ecosystem service demand. Landsc. Urban Plan. 2019, 229, 104621. Available online: https://www.sciencedirect.com/science/article/pii/S0169204623000622 (accessed on 11 March 2025).
  4. Muñoz-Sastre, D.; Mehdi, L.; Canals, L.M. Designing healthier environments. Urban Plan. Transp. Res. 2020, 8, 114–135. Available online: https://www.tandfonline.com/doi/full/10.1080/23748834.2020.1799173 (accessed on 11 March 2025).
  5. Andrés Rodríguez, M.; Gómez, F.J.; Martín, B. Urban design strategies for promoting health and well-being. In Proceedings of the International Conference on Sustainable Urbanism, London, UK, 24–25 May 2023; p. 67962. Available online: https://uvadoc.uva.es/handle/10324/67962 (accessed on 11 March 2025).
  6. Wu, Z.Y. Space optimization of “Production-living-ecological” and ecological environment protection of Beijing, Tianjin and Hebei. City 2014, 12, 26–29. [Google Scholar]
  7. Peng, J.J.; Zhou, G.H.; Tang, C.L.; He, Y. Measurement of spatial conflicts in rapid urbanization areas based on ecological security: A case study of the Chang-Zhu-Tan urban agglomeration. J. Nat. Resour. 2012, 27, 1–10. [Google Scholar]
  8. He, Y.H.; Tang, C.L.; Zhou, G.H.; He, S.; Qiu, Y.; Shi, L.; Zhang, H. Measuring spatial conflicts in rapid urbanization areas from a geographical perspective: A case study of the Chang-Zhu-Tan urban agglomeration. J. Nat. Resour. 2014, 29, 1–15. [Google Scholar]
  9. Wang, J.P.; Yu, D.; Lu, Y.Q.; Zhang, T.; Zheng, Y. Identification and analysis of land use conflicts at the county level based on “PLES” suitability. J. Nat. Resour. 2021, 36, 25–36. [Google Scholar]
  10. Zhao, X. Optimization of “PLES” Space in Changli County Based on Spatial Conflict Analysis. Master’s thesis, Hebei Agricultural University, Baoding, China, 2019. [Google Scholar]
  11. Zhou, G.H.; Peng, J.J. Evolution characteristics and effects of spatial conflicts: A case study of the Chang-Zhu-Tan urban agglomeration. Prog. Geogr. 2012, 31, 85–96. [Google Scholar]
  12. Zhang, N.; Li, X.J.; Chen, X.H. Impact of urban expansion on PLES and evaluation of its coordination in Beijing. Sci. Geogr. Sin. 2020, 40, 1–15. [Google Scholar]
  13. Li, T.; Chen, X.H.; Zhang, W.J. Study on conflicts and coordination mechanisms of PLES in Nanjing. Acta Ecol. Sin. 2019, 39, 1–20. [Google Scholar]
  14. Wang, D.L.; Huang, L.P.; Chen, Z.A. Evolution of PLES and relative land use conflicts in Nanchang County, Nanchang City (2000–2020). Bull. Soil Water Conserv. 2024, 44, 1–15. [Google Scholar]
  15. Song, F.R.; Zeng, X.Y.; Chen, Y. Diagnosis and evolution of PLES conflicts in mining-grain compound areas: A case study of Chengui Town, Daye City. Res. Soil Water Conserv. 2024, 31, 1–12. [Google Scholar]
  16. Campbell, D.J.; Gichohi, H.; Mwangi, A.; Chege, L. Land use conflict in Kajiado district, Kenya. Land Use Policy 2000, 17, 337–348. [Google Scholar] [CrossRef]
  17. Luo, H.; Yang, C.J.; Liao, Y. Effects of spatial conflicts of PLES on ecosystem service value in the low hill region of southwest China. Ecol. Sci. 2024, 43, 1–10. [Google Scholar]
  18. Xiang, F.F.; Huang, L.P.; Chen, R.Q. Measurement and functional optimization of land spatial conflicts at the county level: A case study of Yihuang County, Jiangxi Province. Bull. Soil Water Conserv. 2024, 44, 1–18. [Google Scholar]
  19. Zhang, X. The Effect of Urban Expansion on Ecological Control Line—Taking Guangzhou City as an Example. Urban Surv. 2017, 2, 50–54. [Google Scholar]
  20. Wang, Z.G. Analysis of urban “PLES” spatial conflicts and suggestions for coordinated development: A case study of Zengcheng District, Guangzhou. J. South China Agric. Univ. 2023, 44, 100–200. [Google Scholar]
  21. Han, Q.Z.; Gu, L.Q.; Wang, Y.Y.; Zhang, Y.B. Spatio-temporal evolution and driving factors of “PLES” in Shaanxi Province. Soil Water Conserv. China 2024, 41, 1–20. [Google Scholar]
  22. Tao, Q. Measurement and Simulation of “PLES” Conflicts in Typical Karst Mountainous Watersheds of Guizhou Province. Master’s Thesis, Guizhou Normal University, Guiyang, China, 2024. [Google Scholar]
  23. Li, Z.Y.; Li, W.X.; Yang, L.; Wang, S.B.; Ding, X.Y.; Chen, T. Measurement and analysis of land use conflicts in Kunming City. J. Southwest For. Univ. (Nat. Sci.) 2025, 45, 156–165. [Google Scholar]
  24. Min, J.S.; Wang, R.H.; Liu, C.W. Spatio-temporal evolution of “PLES” in Aksu Region. J. Agric. Resour. Environ. 2024, 42, 108–119. [Google Scholar]
  25. Cai, L.S.; Tang, X.L. Multi-scenario simulation of “PLES” and carbon storage evaluation in ecological transition zones: A case study of Gansu Province. Environ. Sci. 2024, 44, 1–19. [Google Scholar]
  26. Yan, J.J.; Tong, T.; Ma, Q.L.; Wang, X.Y.; Zhou, H. Characteristics and scenario simulation of “PLES” transformation in Henan Province over the past 30 years. Res. Soil Water Conserv. 2024, 31, 1–18. [Google Scholar]
  27. Yang, R.; Deng, W.B. Analysis of land use transformation and ecological effects in Urumqi City from the perspective of “PLES”. Sci. Technol. Eng. 2024, 24, 1–15. [Google Scholar]
  28. Dong, Z.R.; Yuan, Q.Z.; Wang, Z.C.; Ren, P. Evolution characteristics and simulation of “PLES” conflicts in the Sichuan agricultural-pastoral transition zone: A case study of four counties in Aba Prefecture. Acta Ecol. Sin. 2023, 43, 1–15. [Google Scholar]
  29. Zhao, X.; Tang, F.; Zhang, P.T.; Hu, B.Y.; Xu, L. Dynamic simulation and analysis of “PLES” conflicts at the county level based on the CLUE-S model. Acta Ecol. Sin. 2019, 39, 1–20. [Google Scholar]
  30. Liang, S.H.; Li, W.; Gao, Y.; Liu, B.Z. Relationship between ecosystem service value and landscape ecological risk in Jilin Province: Spatial differentiation and its implications. Chin. J. Appl. Ecol. 2024, 35, 1–12. [Google Scholar]
  31. Liu, S.S.; Wu, W.J.; Ju, C.Y.; Lu, Y.R. Spatio-temporal evolution and influencing factors of landscape ecological risk in “PLES” of oasis cities. Environ. Pollut. Control. 2023, 45, 1–15. [Google Scholar]
  32. Liu, F.R.; Zhao, J.S.; Lin, Y.L.; Chen, G.P.; Zhang, L.J.; Peng, S.F. Spatio-temporal evolution and driving analysis of water conservation function in Yunnan Province under climate and land use changes. J. Soil Water Conserv. 2024, 38, 212–224. [Google Scholar]
  33. Bo, L.M.; Yin, L.; Wei, W.; Zhao, L.; Xia, J.N. Analysis of territorial spatial pattern evolution and driving factors in Shandong Province from the perspective of main functional zones. Geogr. Geo-Inf. Sci. 2024, 40, 1–15. [Google Scholar]
  34. Wang, Z.W.; Wei, Y.; Li, S.; Zhu, X.W. Spatio-temporal evolution and conflict measurement of “PLES” in Jiaodong Peninsula. J. Environ. Eng. Technol. 2023, 43, 1–15. [Google Scholar]
  35. Wang, S.S.; Wu, Z.P.; Wang, J.J.; Yin, H.H.; Li, B.C. Study on spatial conflicts of “PLES” in Urumqi City, Xinjiang. Bull. Soil Water Conserv. 2022, 42, 1–20. [Google Scholar]
  36. Li, L.X.; Wei, X.P.; Yu, Y.X.; Li, H.; Cai, Y.L.; Chen, S.D.; Feng, L.L.; Li, W.Y. Evolution and driving forces of “PLES” patterns in mountainous urban agglomerations: A case study of Chongqing. Chin. J. Ecol. 2024, 43, 1–15. [Google Scholar]
  37. Wan, D.; Tan, Y.; Wang, Z.Y.; Li, C.B.; Chen, C. Evolution and driving factors of “PLES” patterns in the Dongting Lake Ecological Economic Zone. Sci. Technol. Eng. 2024, 24, 1–15. [Google Scholar]
Figure 1. The location of the study region.
Applsci 15 03483 g001
Figure 2. Methodological flowchart of the study.
Applsci 15 03483 g002
Figure 3. Spatial distribution of PLES land types in the study area.
Applsci 15 03483 g003
Figure 4. Spatial distribution of the PLES land classification within the study area.
Applsci 15 03483 g004
Figure 5. Photo of Zengcheng District Today. Note: Sourced from Baidu and other online platforms.
Applsci 15 03483 g005
Figure 6. Photo of Zengcheng District in 1989. Note: Sourced from Baidu and other online platforms.
Applsci 15 03483 g006
Figure 7. Temporal variation in the PLES Conflict Index in Zengcheng District (2010–2020).
Applsci 15 03483 g007
Figure 8. Heat map for interaction detection.
Applsci 15 03483 g008
Figure 9. Influencing factors and driving mechanisms of PLES conflicts in Zengcheng District.
Applsci 15 03483 g009
Table 1. Zengcheng District PLES Classification System.
PLES TypesSecondary-Level SpaceCurrent Land-Use CategoriesImages
Ecological SpaceForest Ecological SpaceForestlandApplsci 15 03483 i001
Grassland Ecological SpaceGrasslandApplsci 15 03483 i002
Waterbody Ecological SpaceRivers, Lakes, Reservoirs, PondsApplsci 15 03483 i003
Other Ecological SpacesSandy Land, Bare Land, Rocky LandApplsci 15 03483 i004
Living SpaceUrban Living SpaceUrban LandApplsci 15 03483 i005
Rural Living SpaceRural Residential LandApplsci 15 03483 i006
Production SpaceIndustrial Production SpaceConstruction LandApplsci 15 03483 i007
Agricultural Production SpacePaddy Field, Dry LandApplsci 15 03483 i008
Table 2. Landscape Vulnerability Index table.
Production–Living–Ecological Space TypesLandscape Vulnerability Index
Agricultural Production Space3
Forest Ecological Space1
Grassland Ecological Space2
Waterbody Ecological Space4
Urban Living Space6
Rural Living Space6
Industrial Production Space6
Other Ecological Spaces5
Table 3. Thresholds and characteristics of different levels of spatial conflict.
Conflict TypesThreshold IntervalSpatial Landscape Patch Performance
Weak Conflict[0, 0.2)Relatively undisturbed by human activities, the landscape patches demonstrate structural integrity, robust continuity, and high stability.
Weaker Conflict[0.2, 0.4)This predominantly coincides with regions of relatively low spatial conflict, characterized by minimal conflict intensity.
Medium Conflict[0.4, 0.6)Landscape patches exhibit increased fragmentation, accompanied by more intricate and irregular boundary configurations.
Stronger Conflict[0.6, 0.8)Landscape patches exhibit a high degree of fragmentation, characterized by heightened vulnerability and increased structural complexity.
Strongest Conflict[0.8, 1]The spatial landscape patches are highly fragmented, interspersed with one another, and characterized by intricate structural patterns.
Table 4. Interaction detection type.
Criteria for JudgmentInteraction Types
q(x1∩x2) < Min(q(x1), q(x2))Nonlinear Attenuation
Min(q(x1)q(x2)) < q(x1∩x2) < Max(q(x1), q(x2))Single-Factor Nonlinear Attenuation
q(x1∩x2) > Max(q(x1), q(x2))Two-Factor Enhancement
q(x1∩x2) = q(x1) + q(x2)Independence
q(x1∩x2) > q(x1) + q(x2)Nonlinear Enhancement
Table 5. Statistical results of the spatial conflict index of PLES in Zengcheng District, 2010–2020.
YearAverage Conflict IndexSpatial Proportion of Each Level/%
Weak Conflict
0.0 ≤ E < 0.2
Weaker Conflict
0.2 ≤ E < 0.4
Medium Conflict 0.4 ≤ E < 0.6Stronger Conflict 0.6 ≤ E < 0.8Strongest Conflict 0.8 ≤ E < 1Total 0 ≤ E < 1
20100.172258.9230.485.084.630.89100
20150.324335.8144.3212.256.161.46100
20200.185957.7829.404.705.972.15100
Table 6. Indicator system for drivers of PLES conflicts in Zengcheng district.
DimensionCodeImpact FactorDescription
Socioeconomic FactorsX1Distance to GovernmentReflects spatial distance to the district government seat
X2Nighttime LightReflects human activity intensity and urbanization level
X3GDPReflects economic output and development level
X4Population DensityMeasures population density
X5Road DensityReflects road network density
Natural Resource FactorsX6River Network DensityReflects river network density
X7NDVIReflects vegetation coverage and health
X8Annual TemperatureReflects annual average temperature
X9Annual PrecipitationReflects annual precipitation
X10Terrain RuggednessReflects surface elevation variation
X11SlopeReflects land surface slope
X12ElevationReflects elevation characteristics
Land-Use FactorsX13Patch DensityReflects land or tectonic plate density
Table 7. Factor detection results for 2020.
ItemX1X2X3X4X5X6X7X8X9X10X11X12X13
q0.04680.51540.33580.33910.13230.01320.56910.45400.16280.36800.34900.46390.0650
p<0.01<0.01<0.01<0.01<0.01>0.01<0.01<0.01<0.01<0.01<0.01<0.01<0.01
Table 8. Factor detection results for 2015.
ItemX1X2X3X4X5X6X7X8X9X10X11X12X13
q0.04510.46480.42230.42390.12030.00750.42810.39150.09150.32120.31020.38950.0822
p<0.01<0.01<0.01<0.01<0.01>0.01<0.01<0.01<0.01<0.01<0.01<0.01<0.01
Table 9. Factor detection results for 2010.
ItemX1X2X3X4X5X6X7X8X9X10X11X12X13
q0.06680.45490.54310.54640.13620.01580.55220.45000.21100.40010.38920.47730.1266
p<0.01<0.01<0.01<0.01<0.01>0.01<0.01<0.01<0.01<0.01<0.01<0.01<0.01
Disclaimer/Publisher’s Note: The statements, opinions and data contained in all publications are solely those of the individual author(s) and contributor(s) and not of MDPI and/or the editor(s). MDPI and/or the editor(s) disclaim responsibility for any injury to people or property resulting from any ideas, methods, instructions or products referred to in the content.

