
Effects of Cyclical Climate Change on Water Temperature Characteristics of Permafrost Slopes


Abstract
1. Introduction
2. Materials and Methods
2.1. Freeze–Thaw Model
2.2. Coupled Permafrost Water–Heat Modeling
2.2.1. Basic Assumptions
2.2.2. Control Equations
- 1.
- Temperature control equation
- 2.
- Moisture control equation
- 3.
- Phase transition dynamic equilibrium relations
2.3. Parameters
2.3.1. Material Parameters
2.3.2. Model Parameters
- 1.
- Dynamic parameters
- Soil Volumetric Integrated Heat Capacity C:
- Thermal conductivity :
- The VG model of soil mass as the theoretical equation for solving the matrix suction of soil samples is as follows:
- Permeability coefficient :
- 2.
- Material parameters
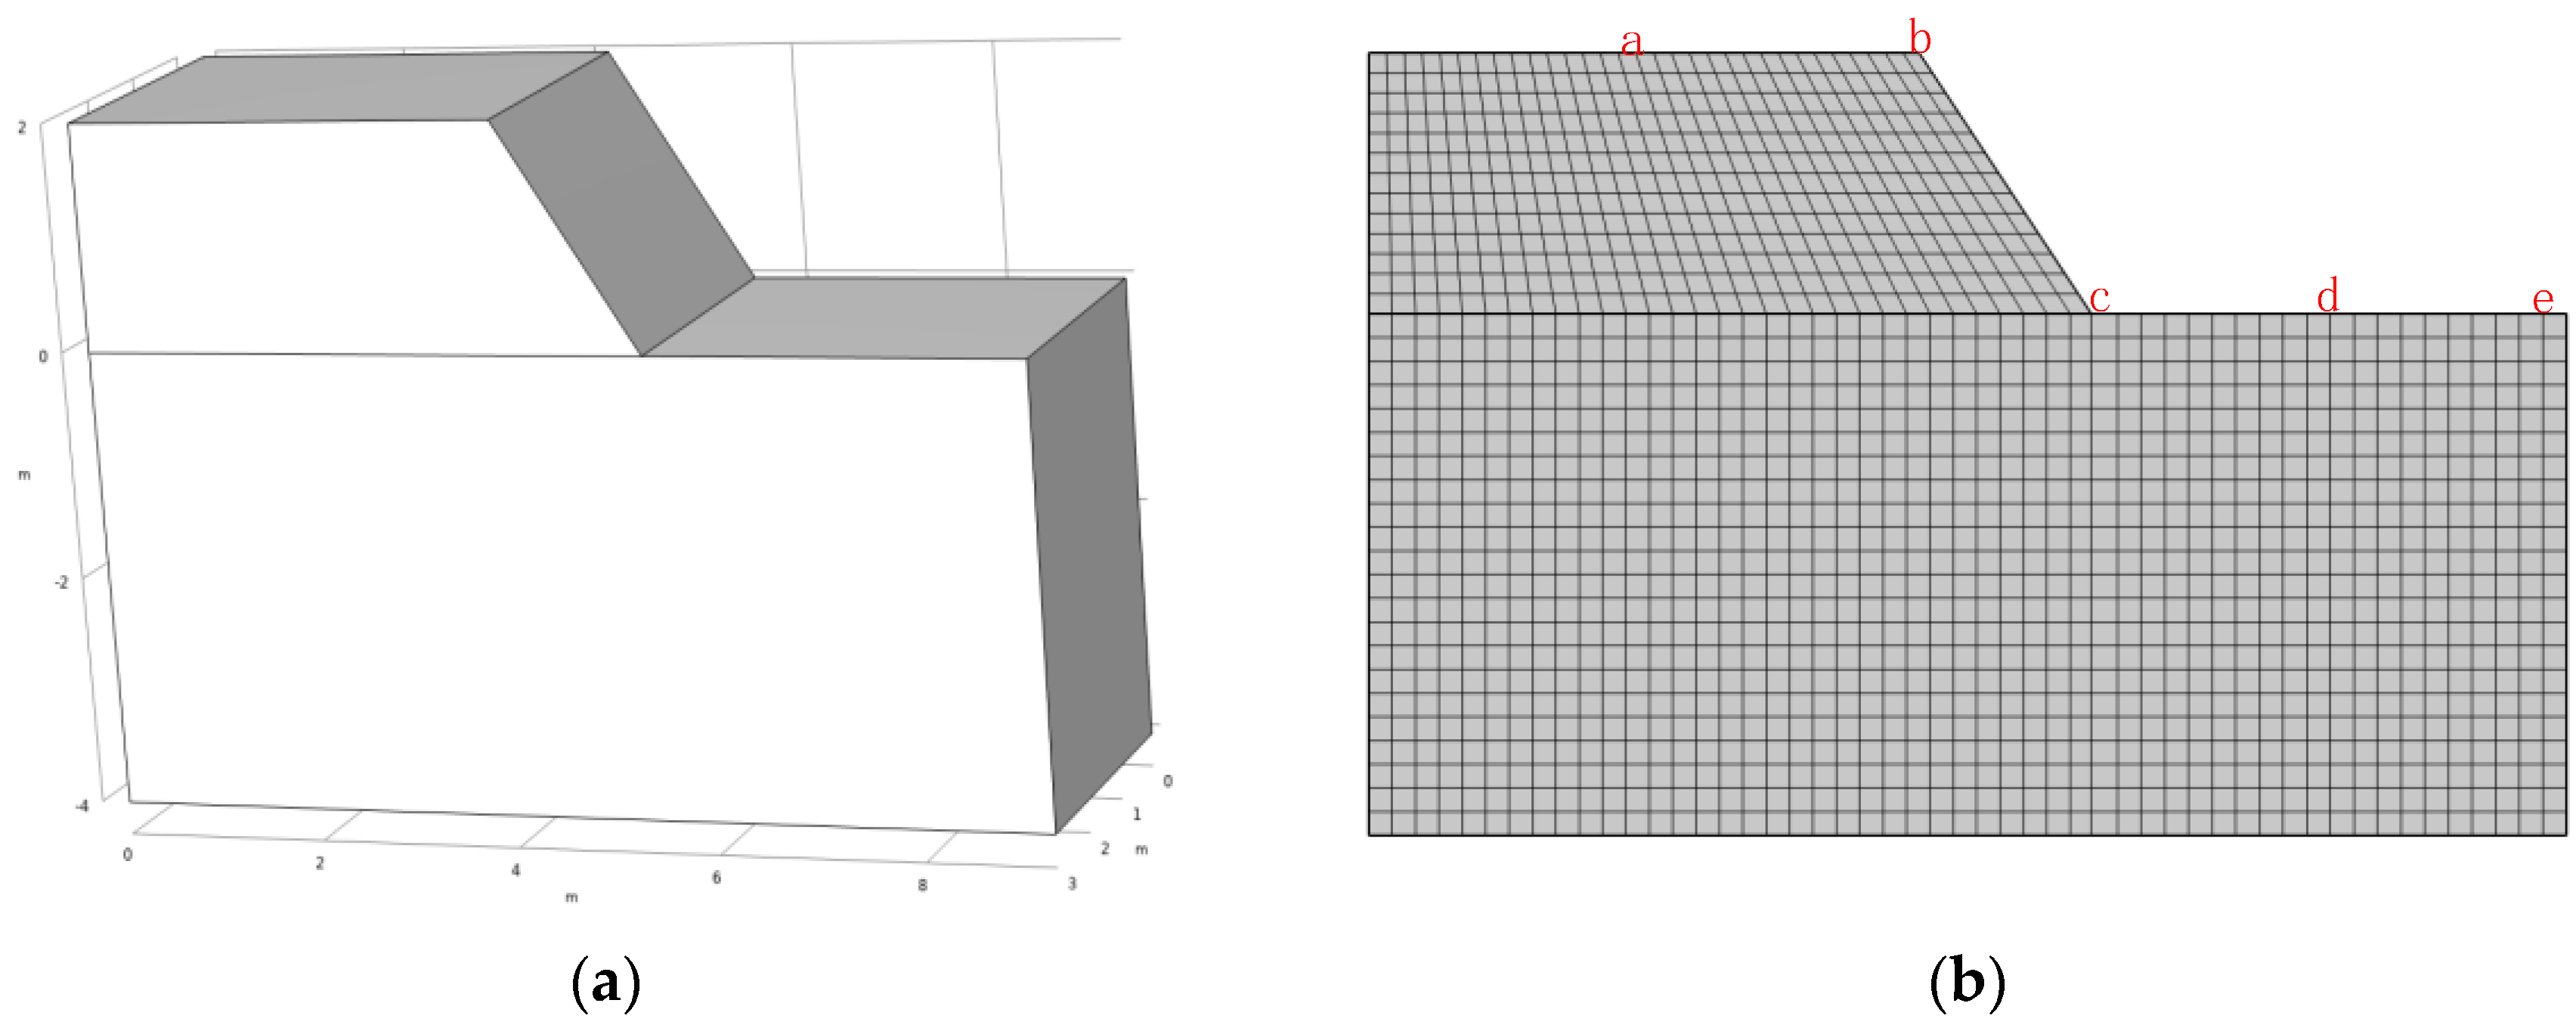
2.4. Model
3. Results and Discussion
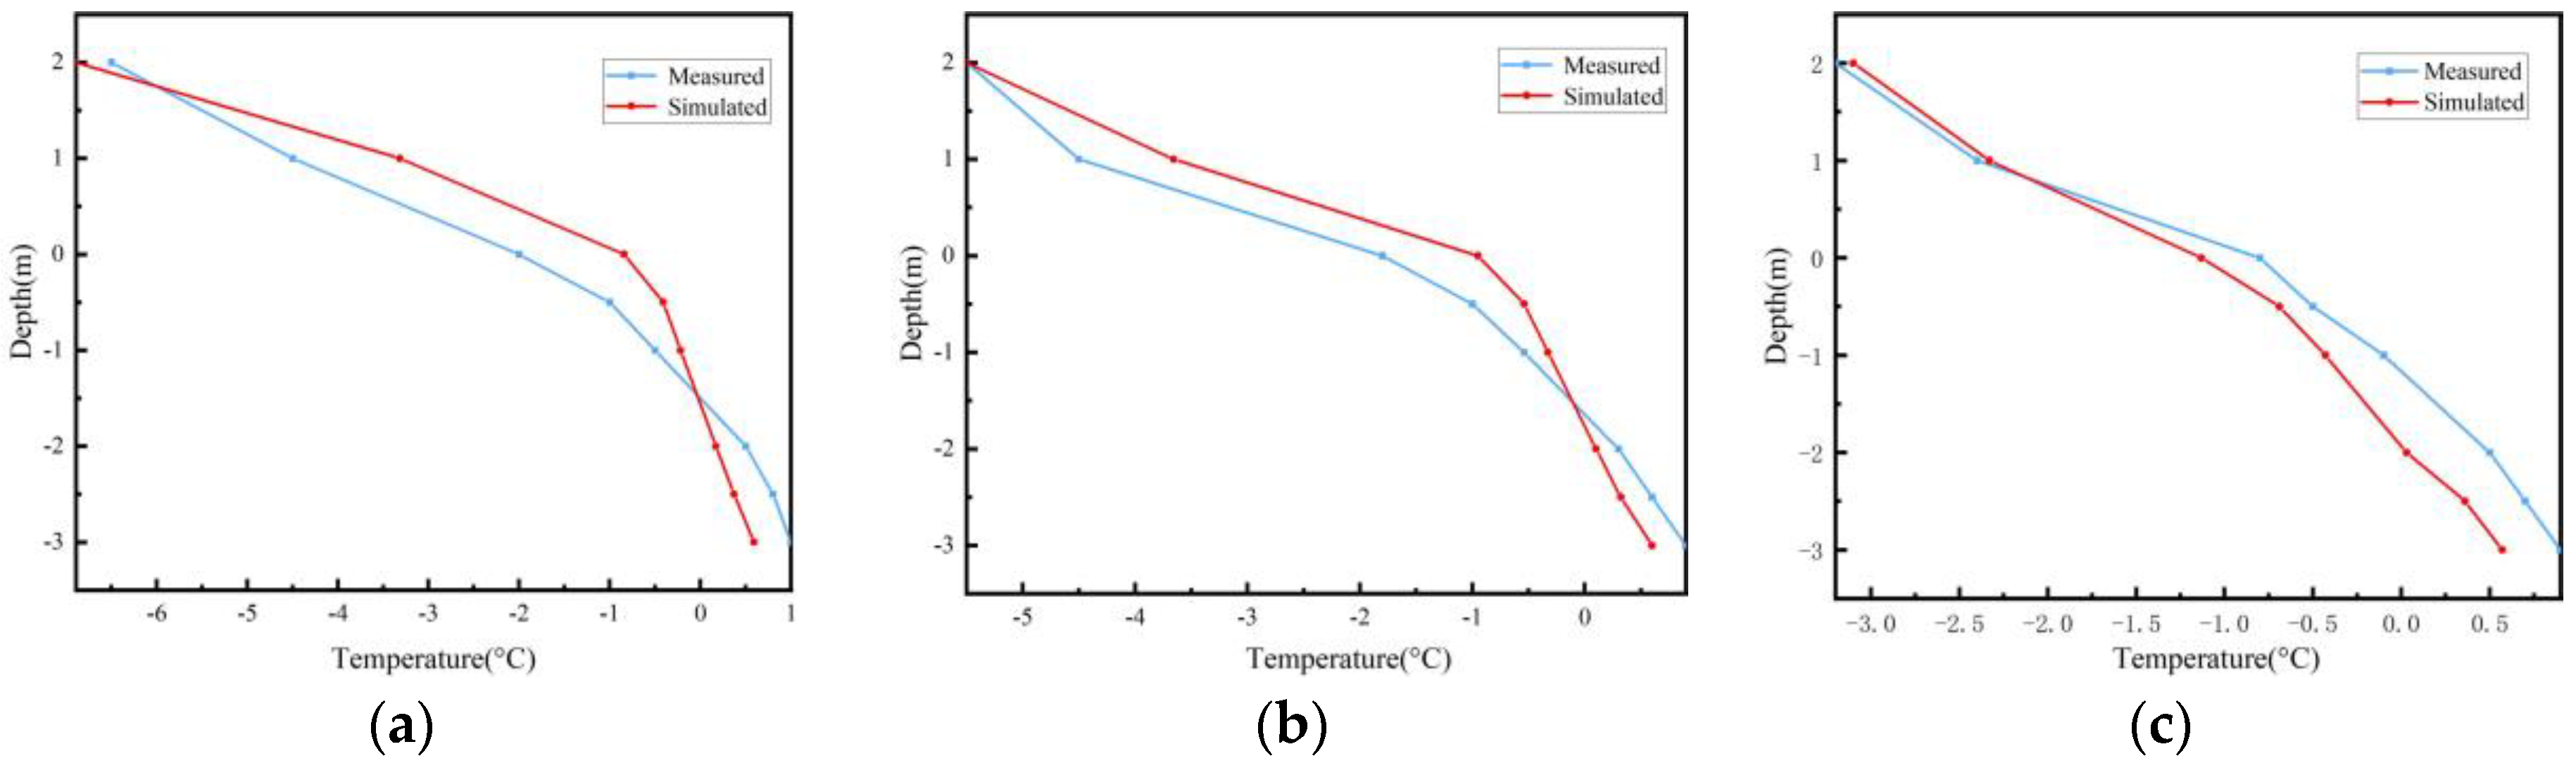
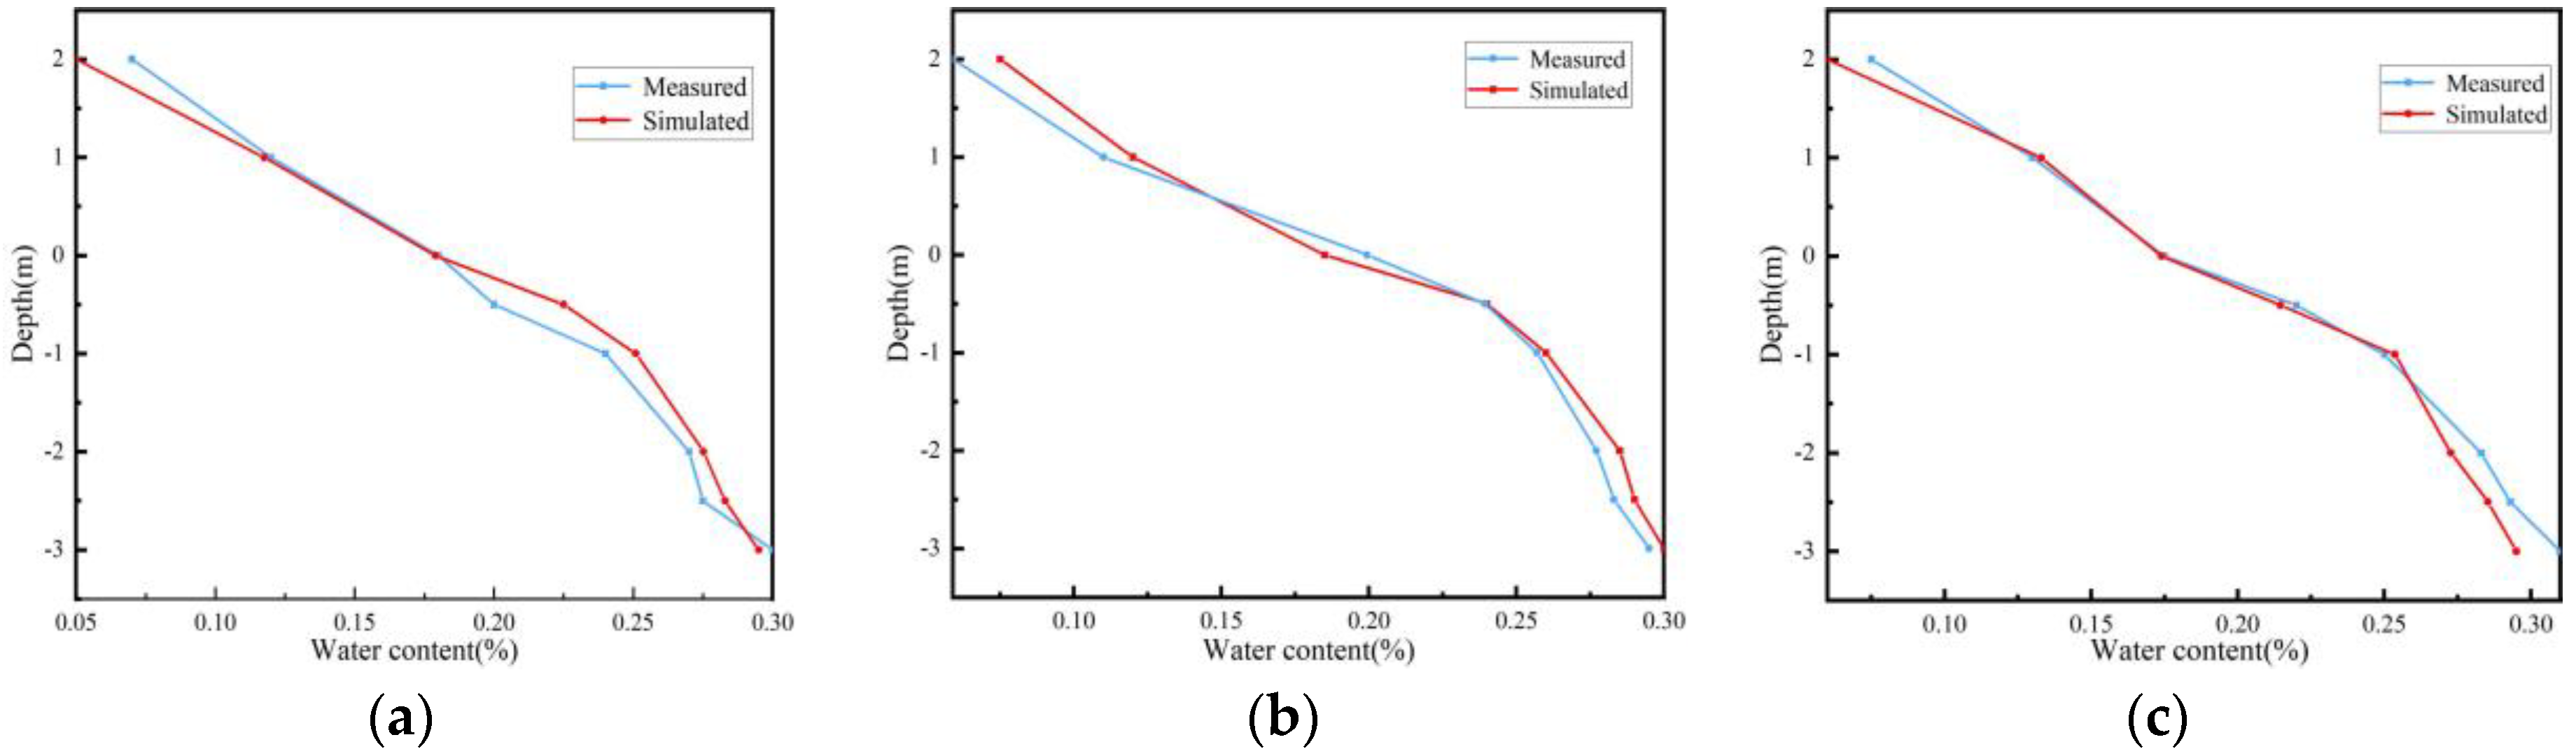
3.1. Model Verification
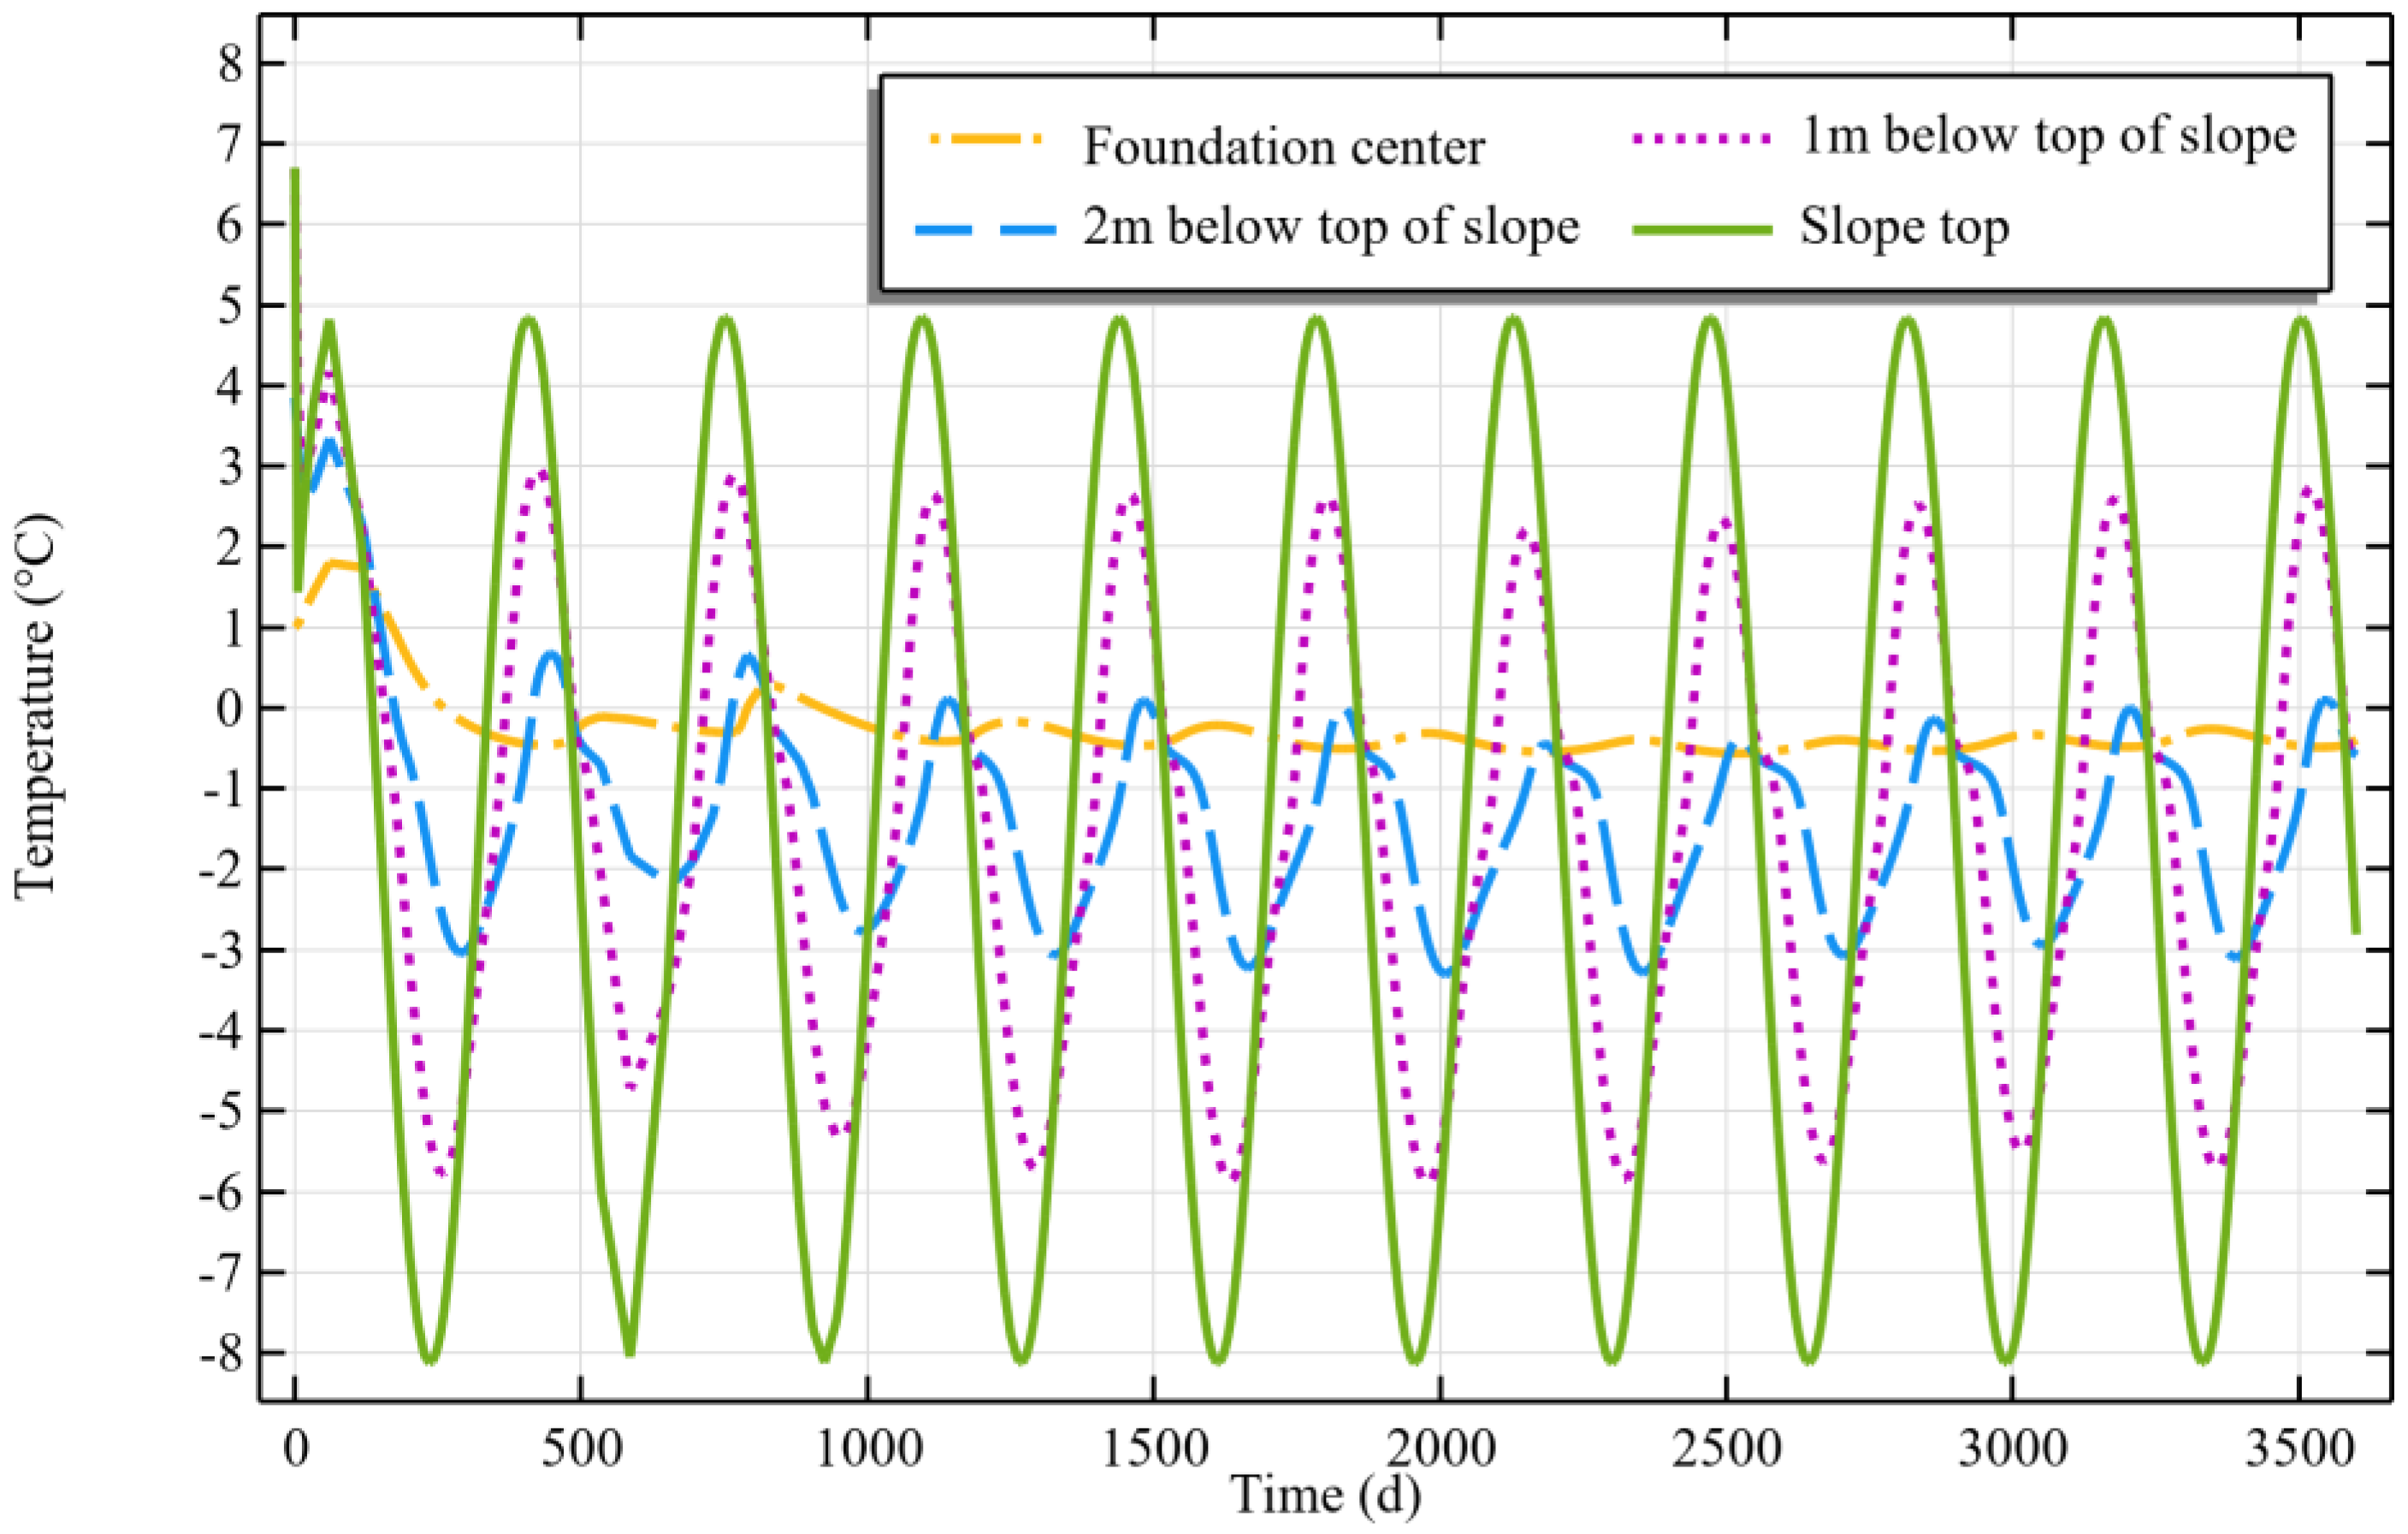
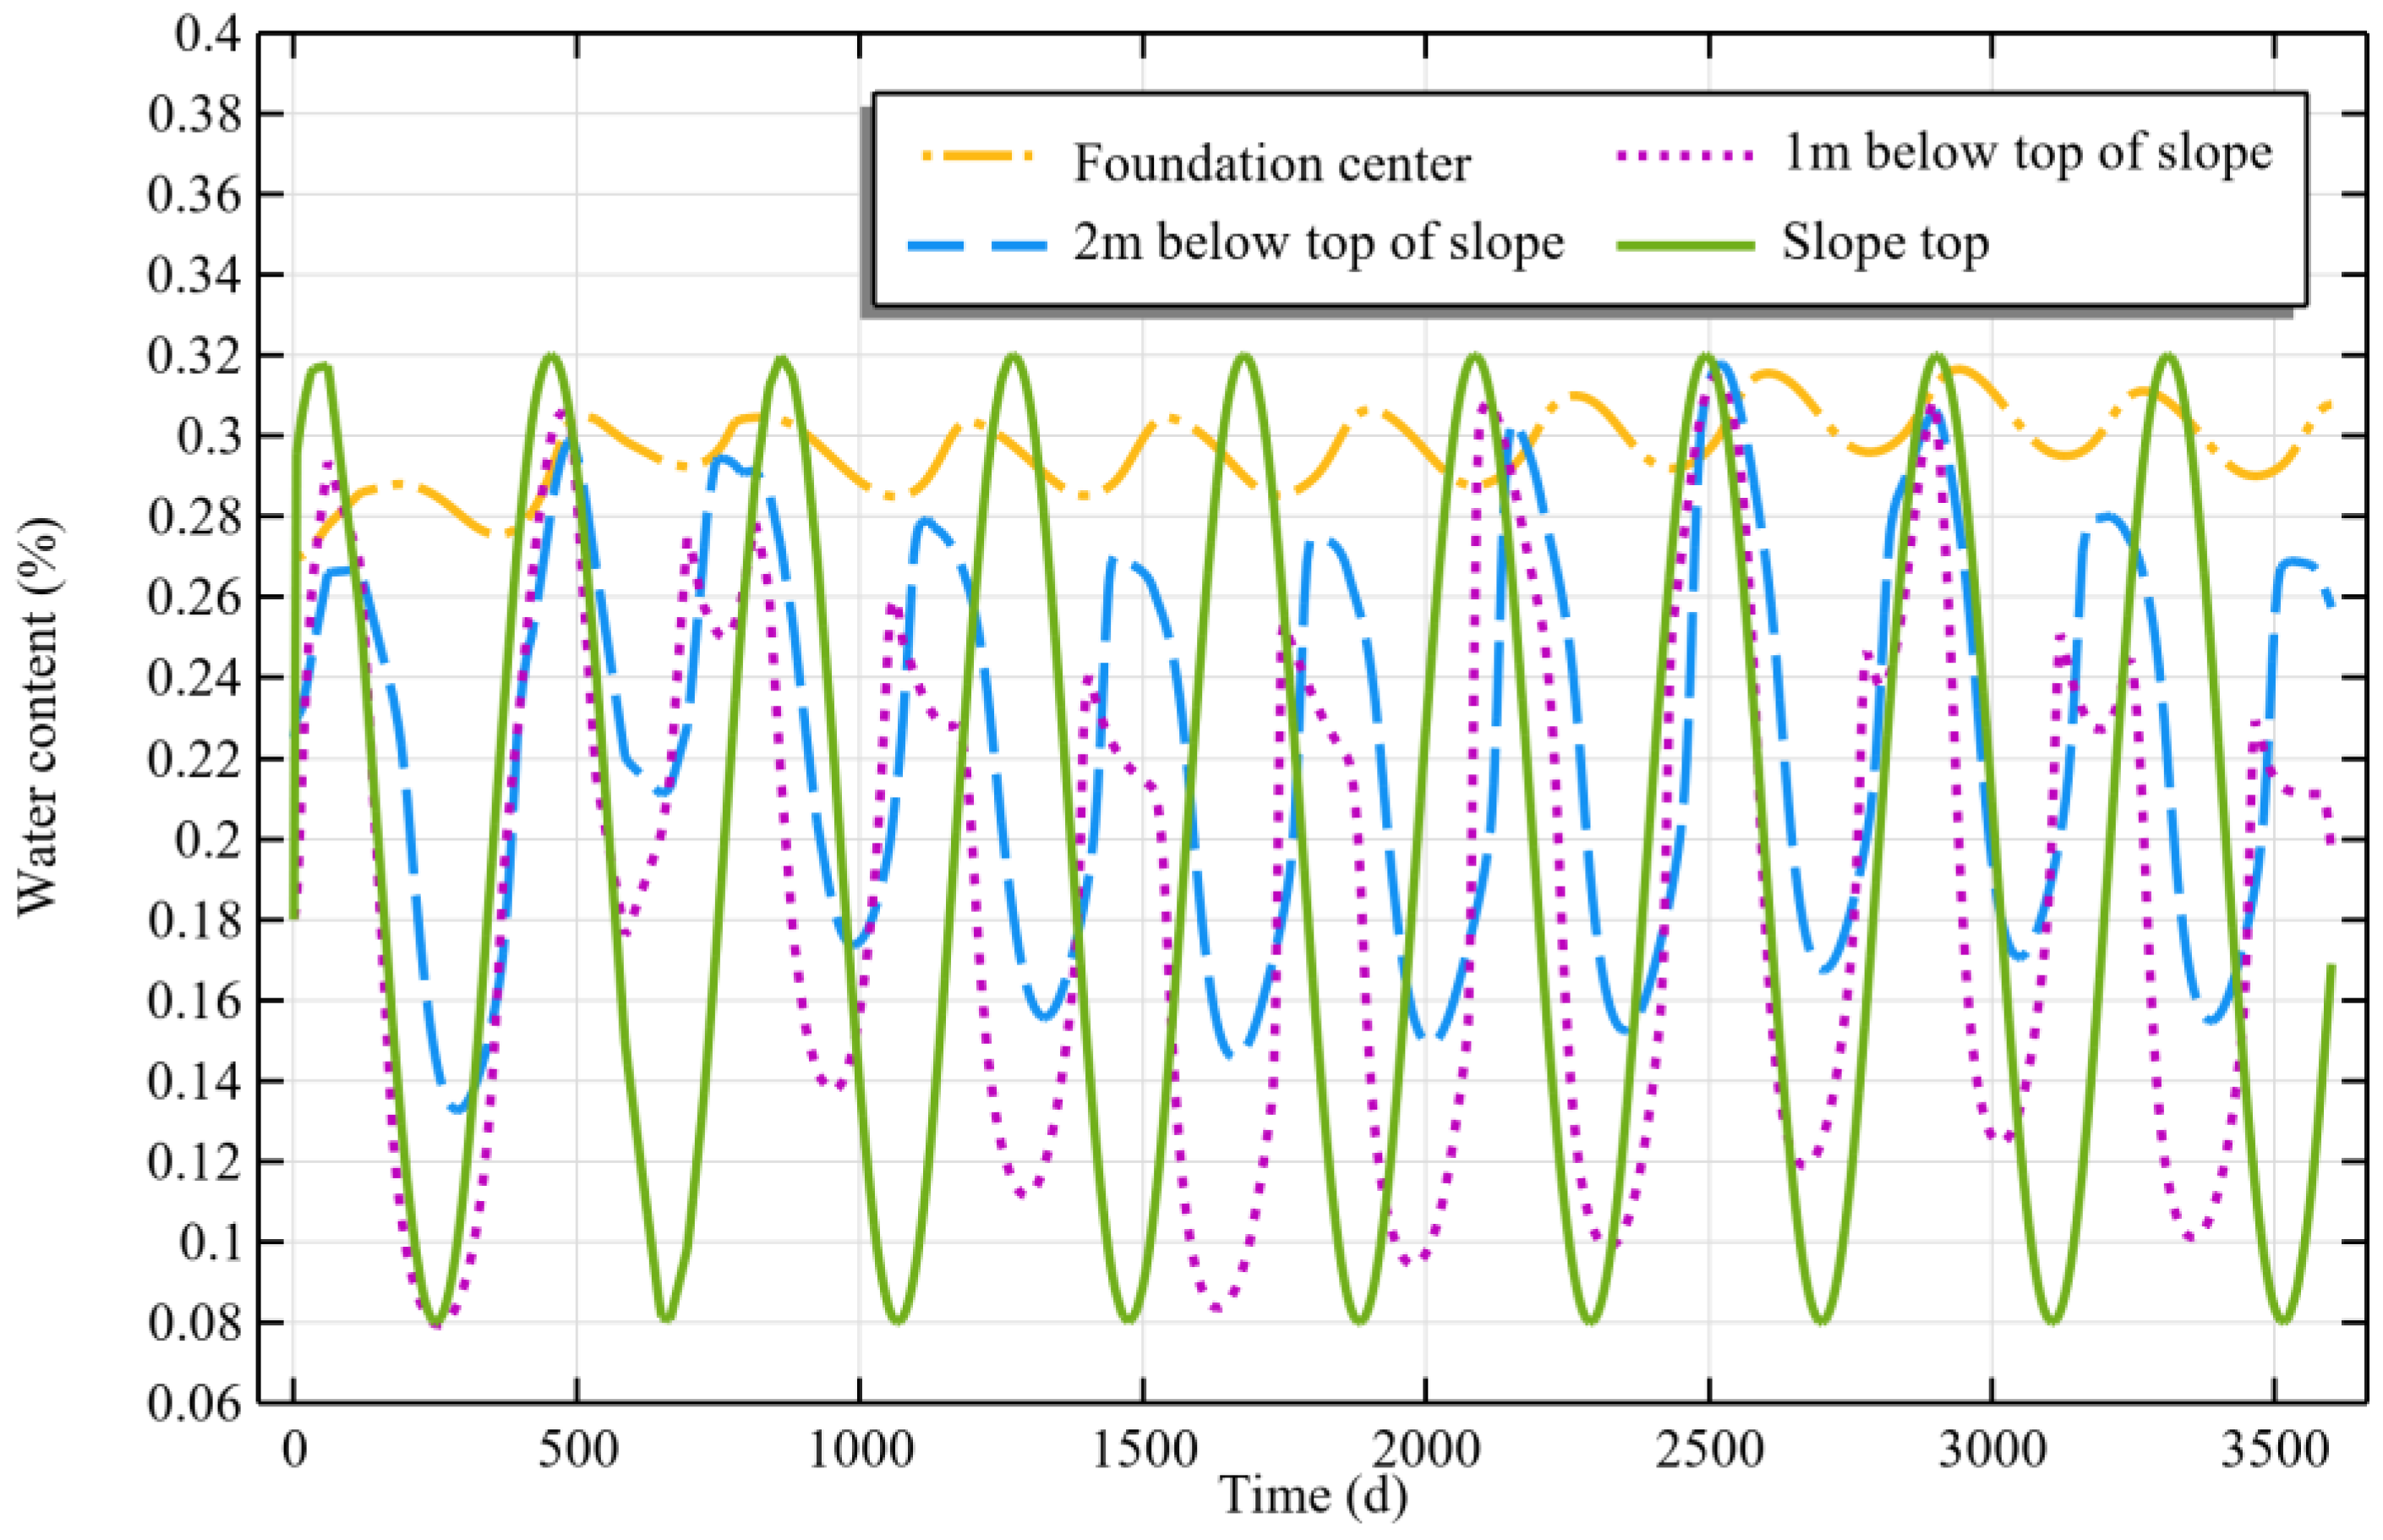
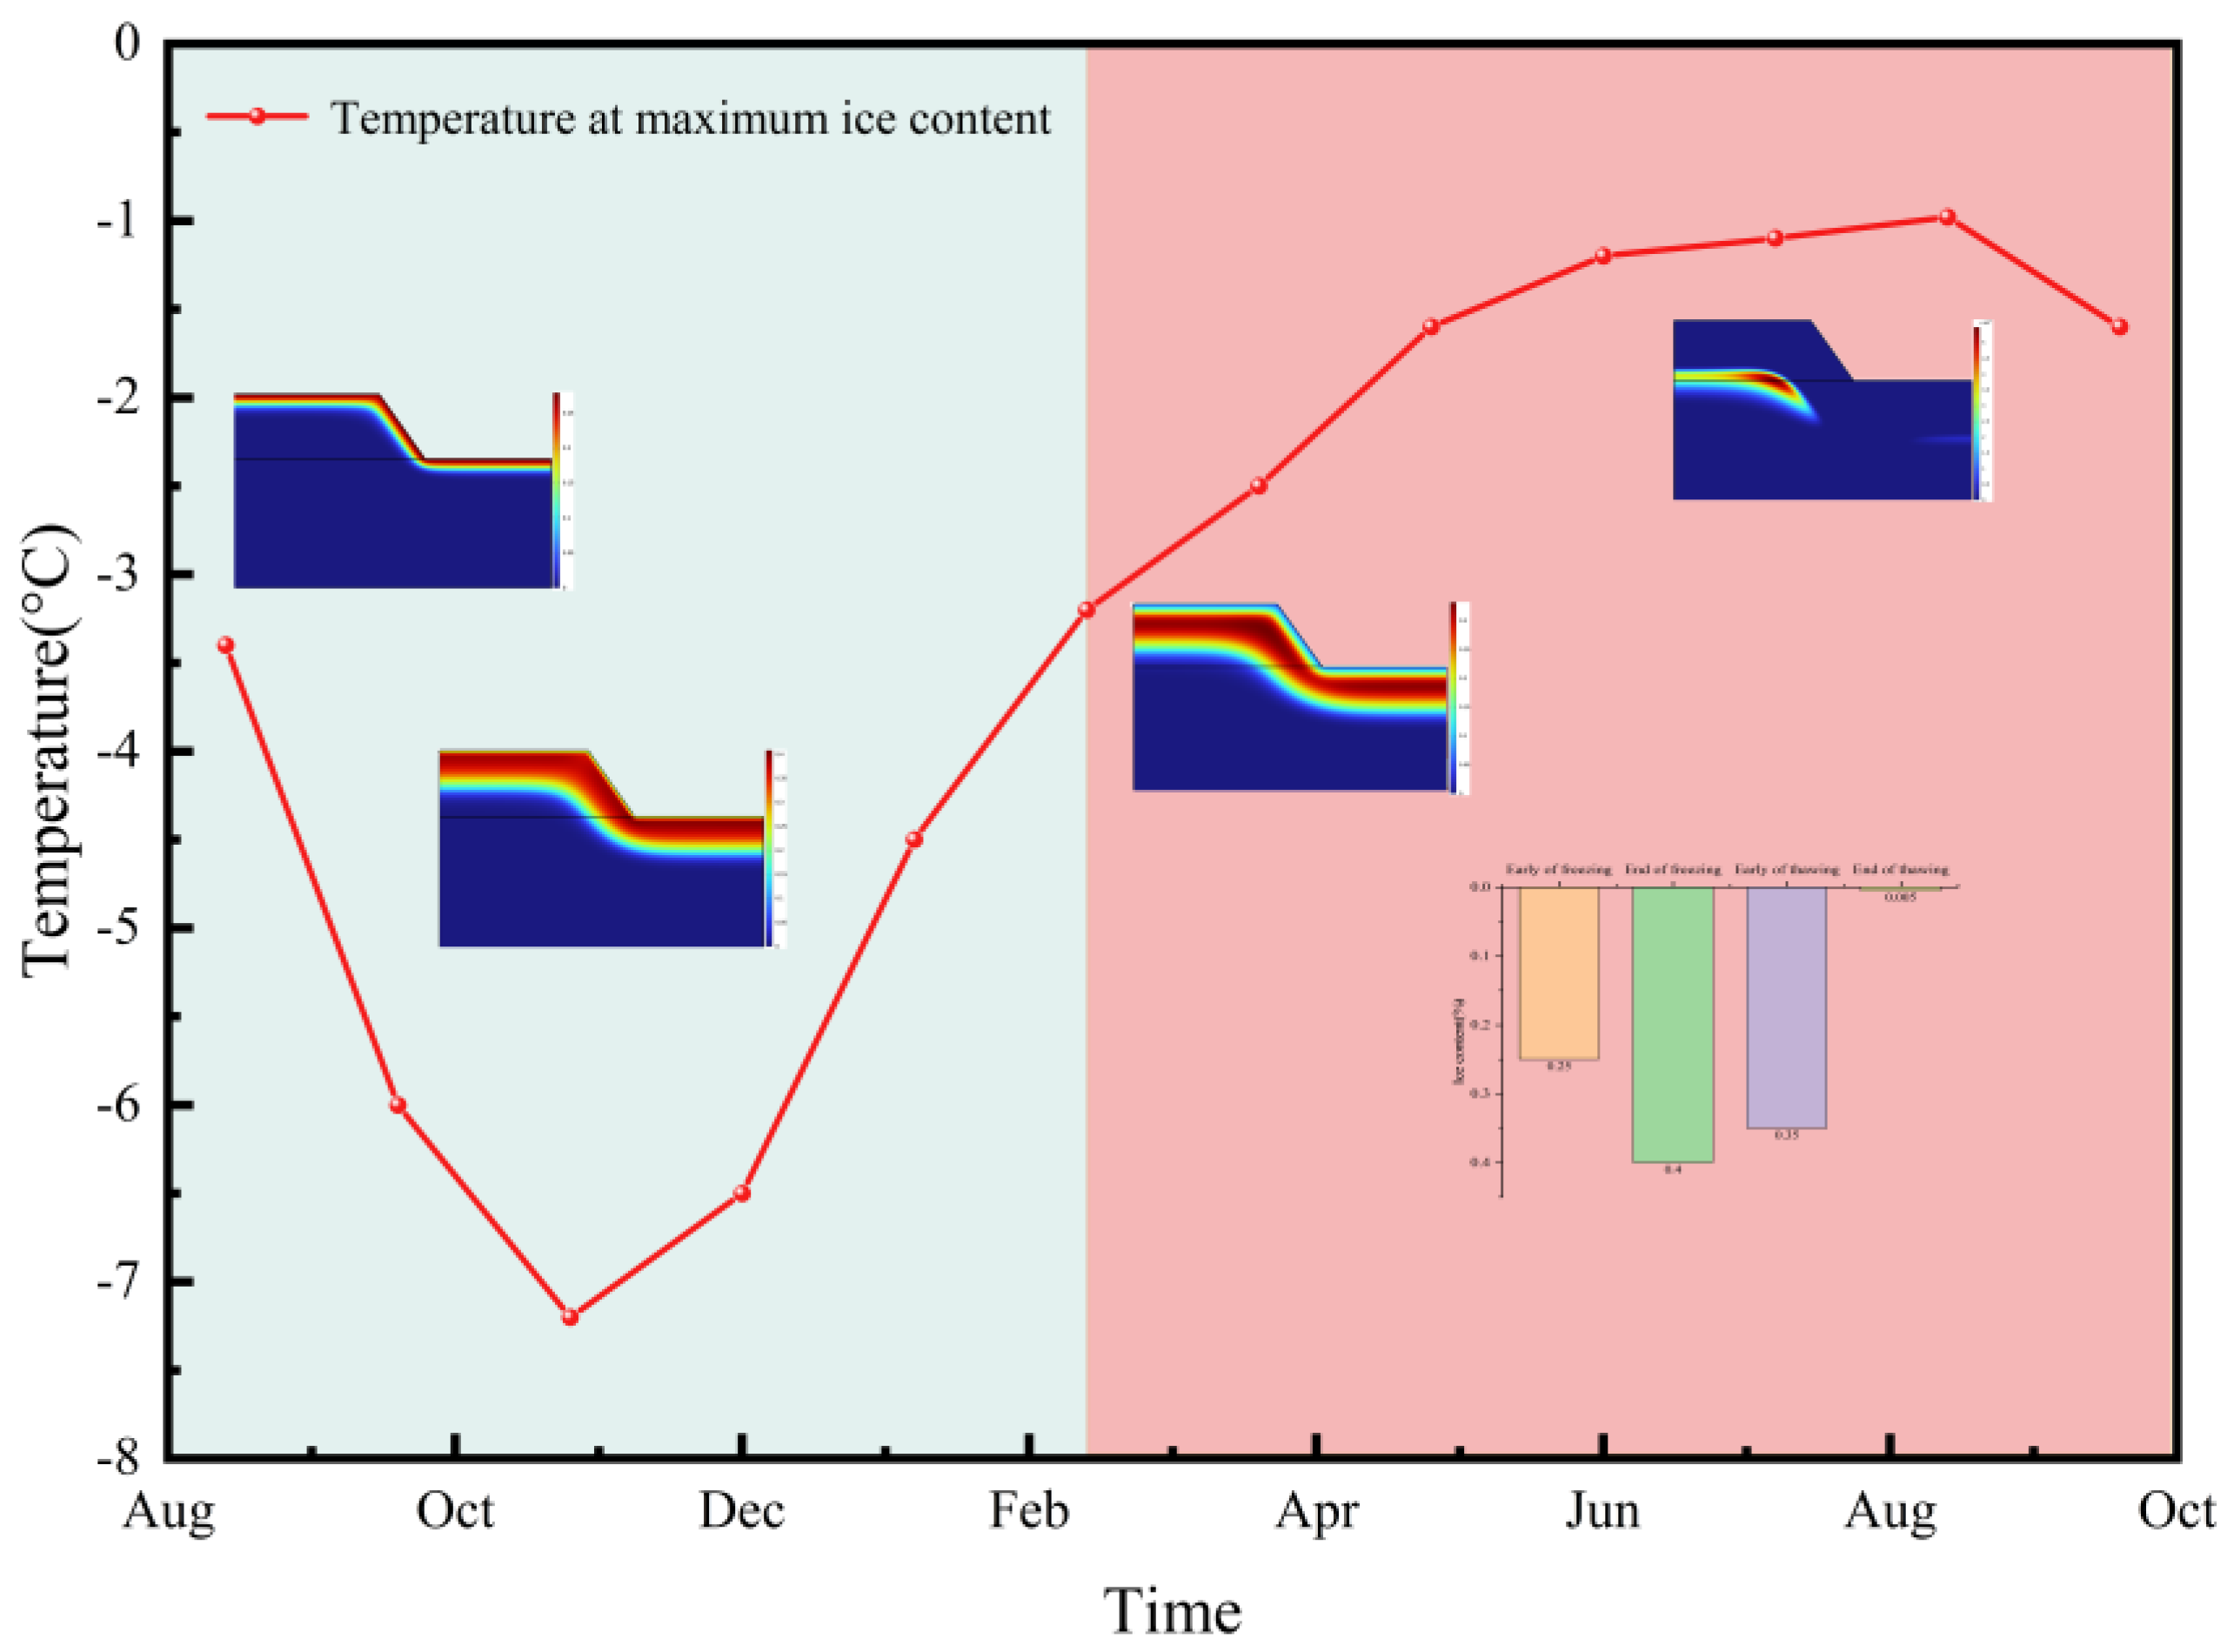
3.2. Long-Term Water Temperature Characteristics
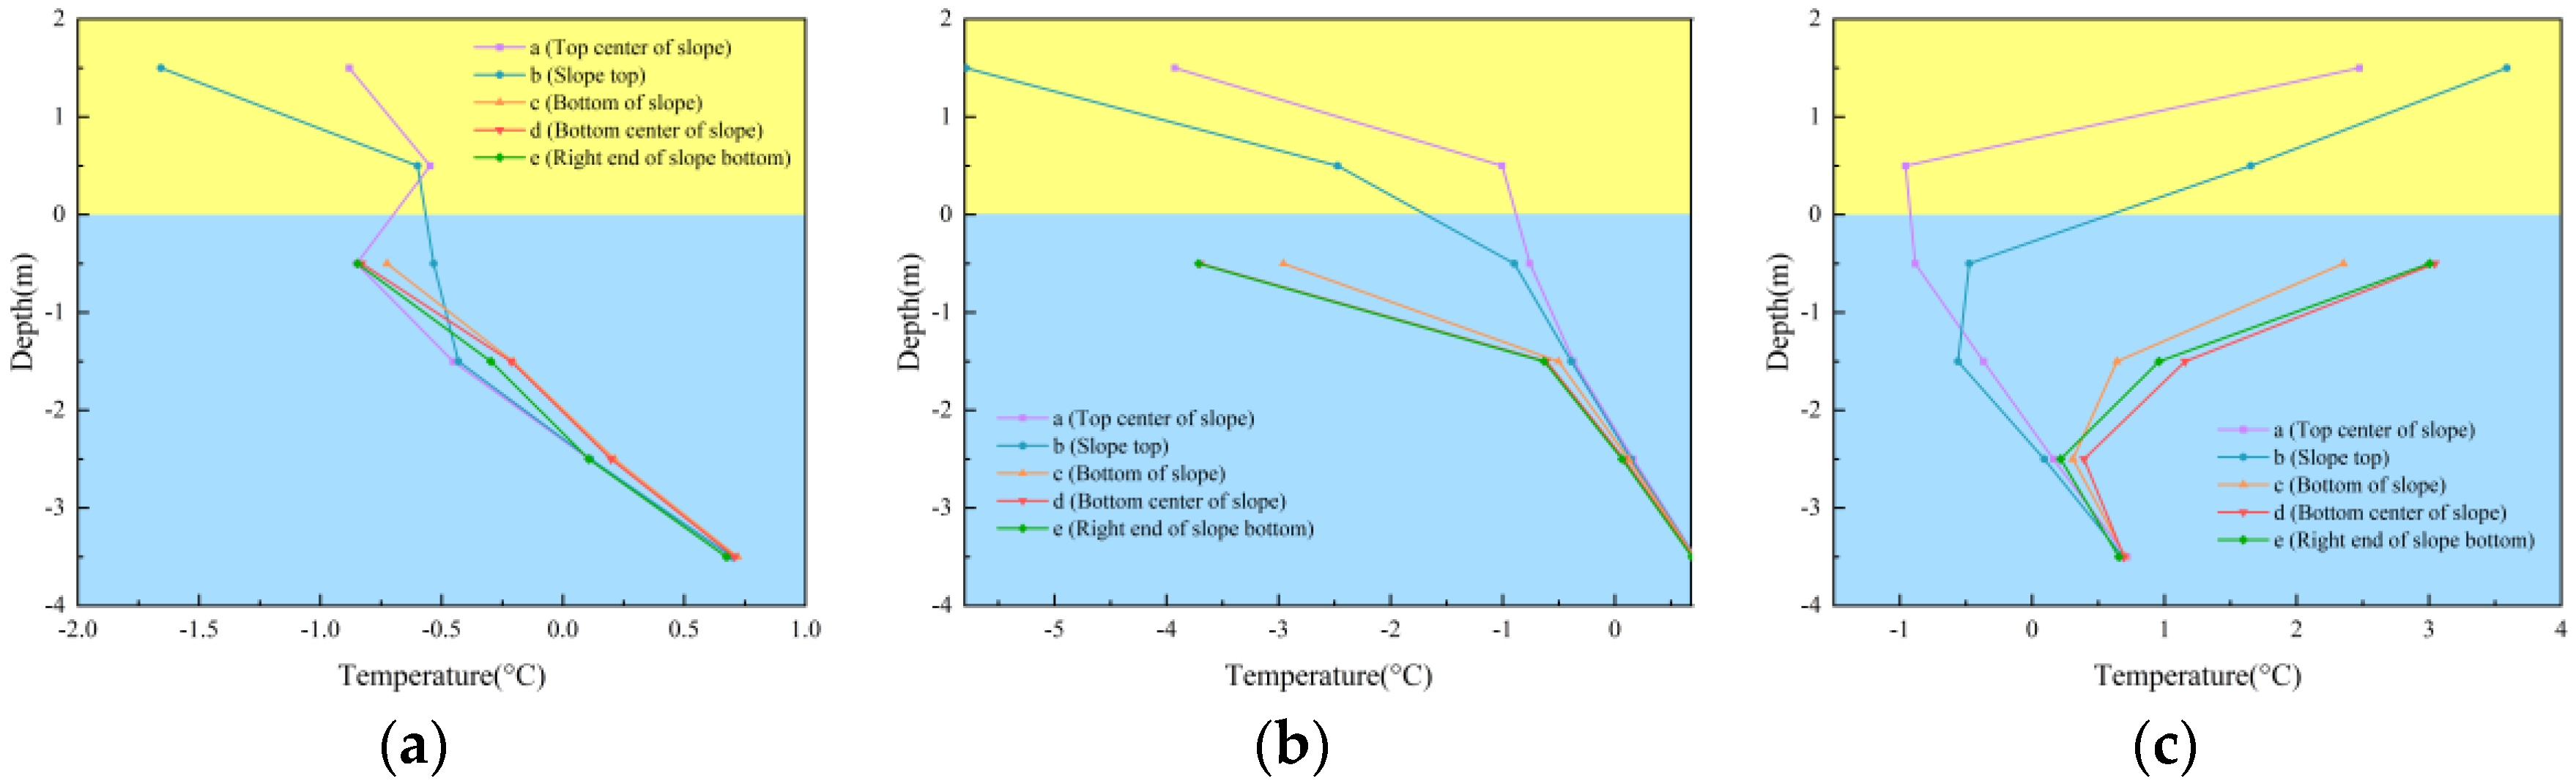
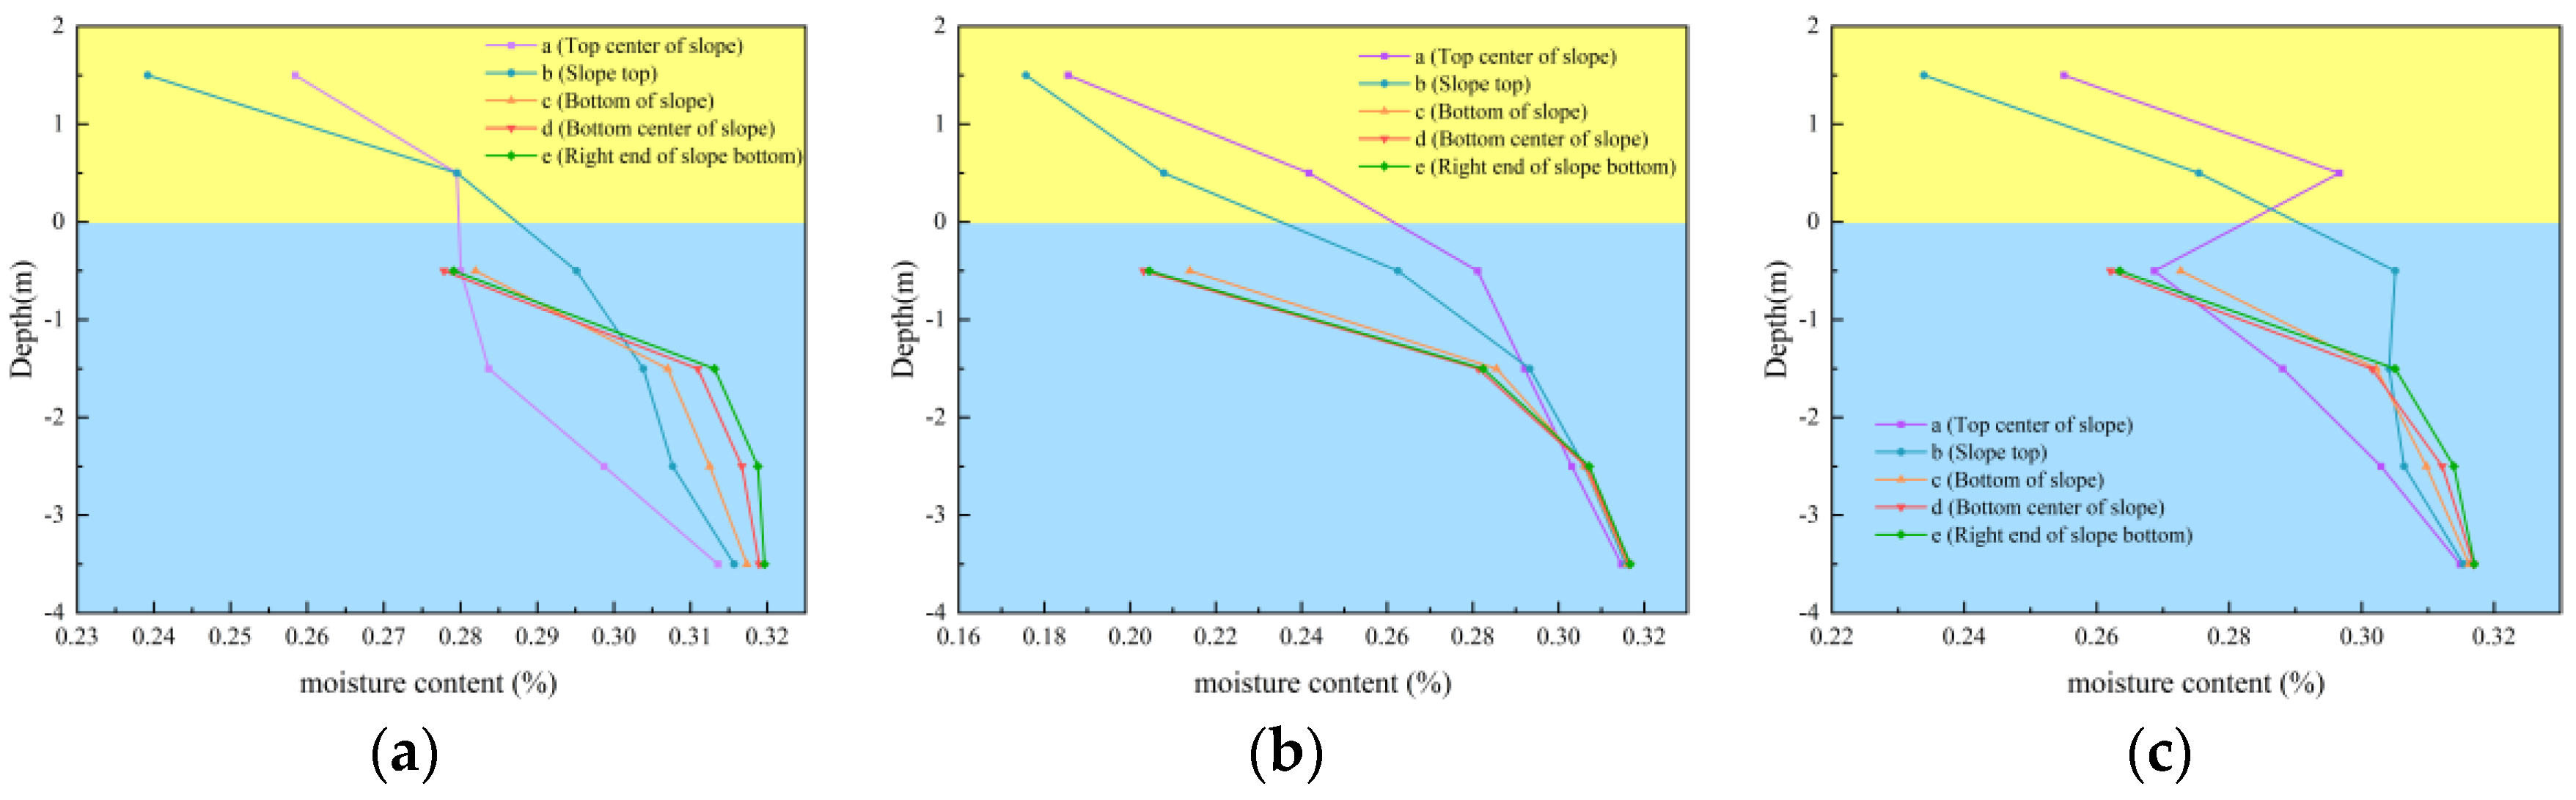
3.3. Freeze–Thaw Water Temperature Characteristics
4. Conclusions
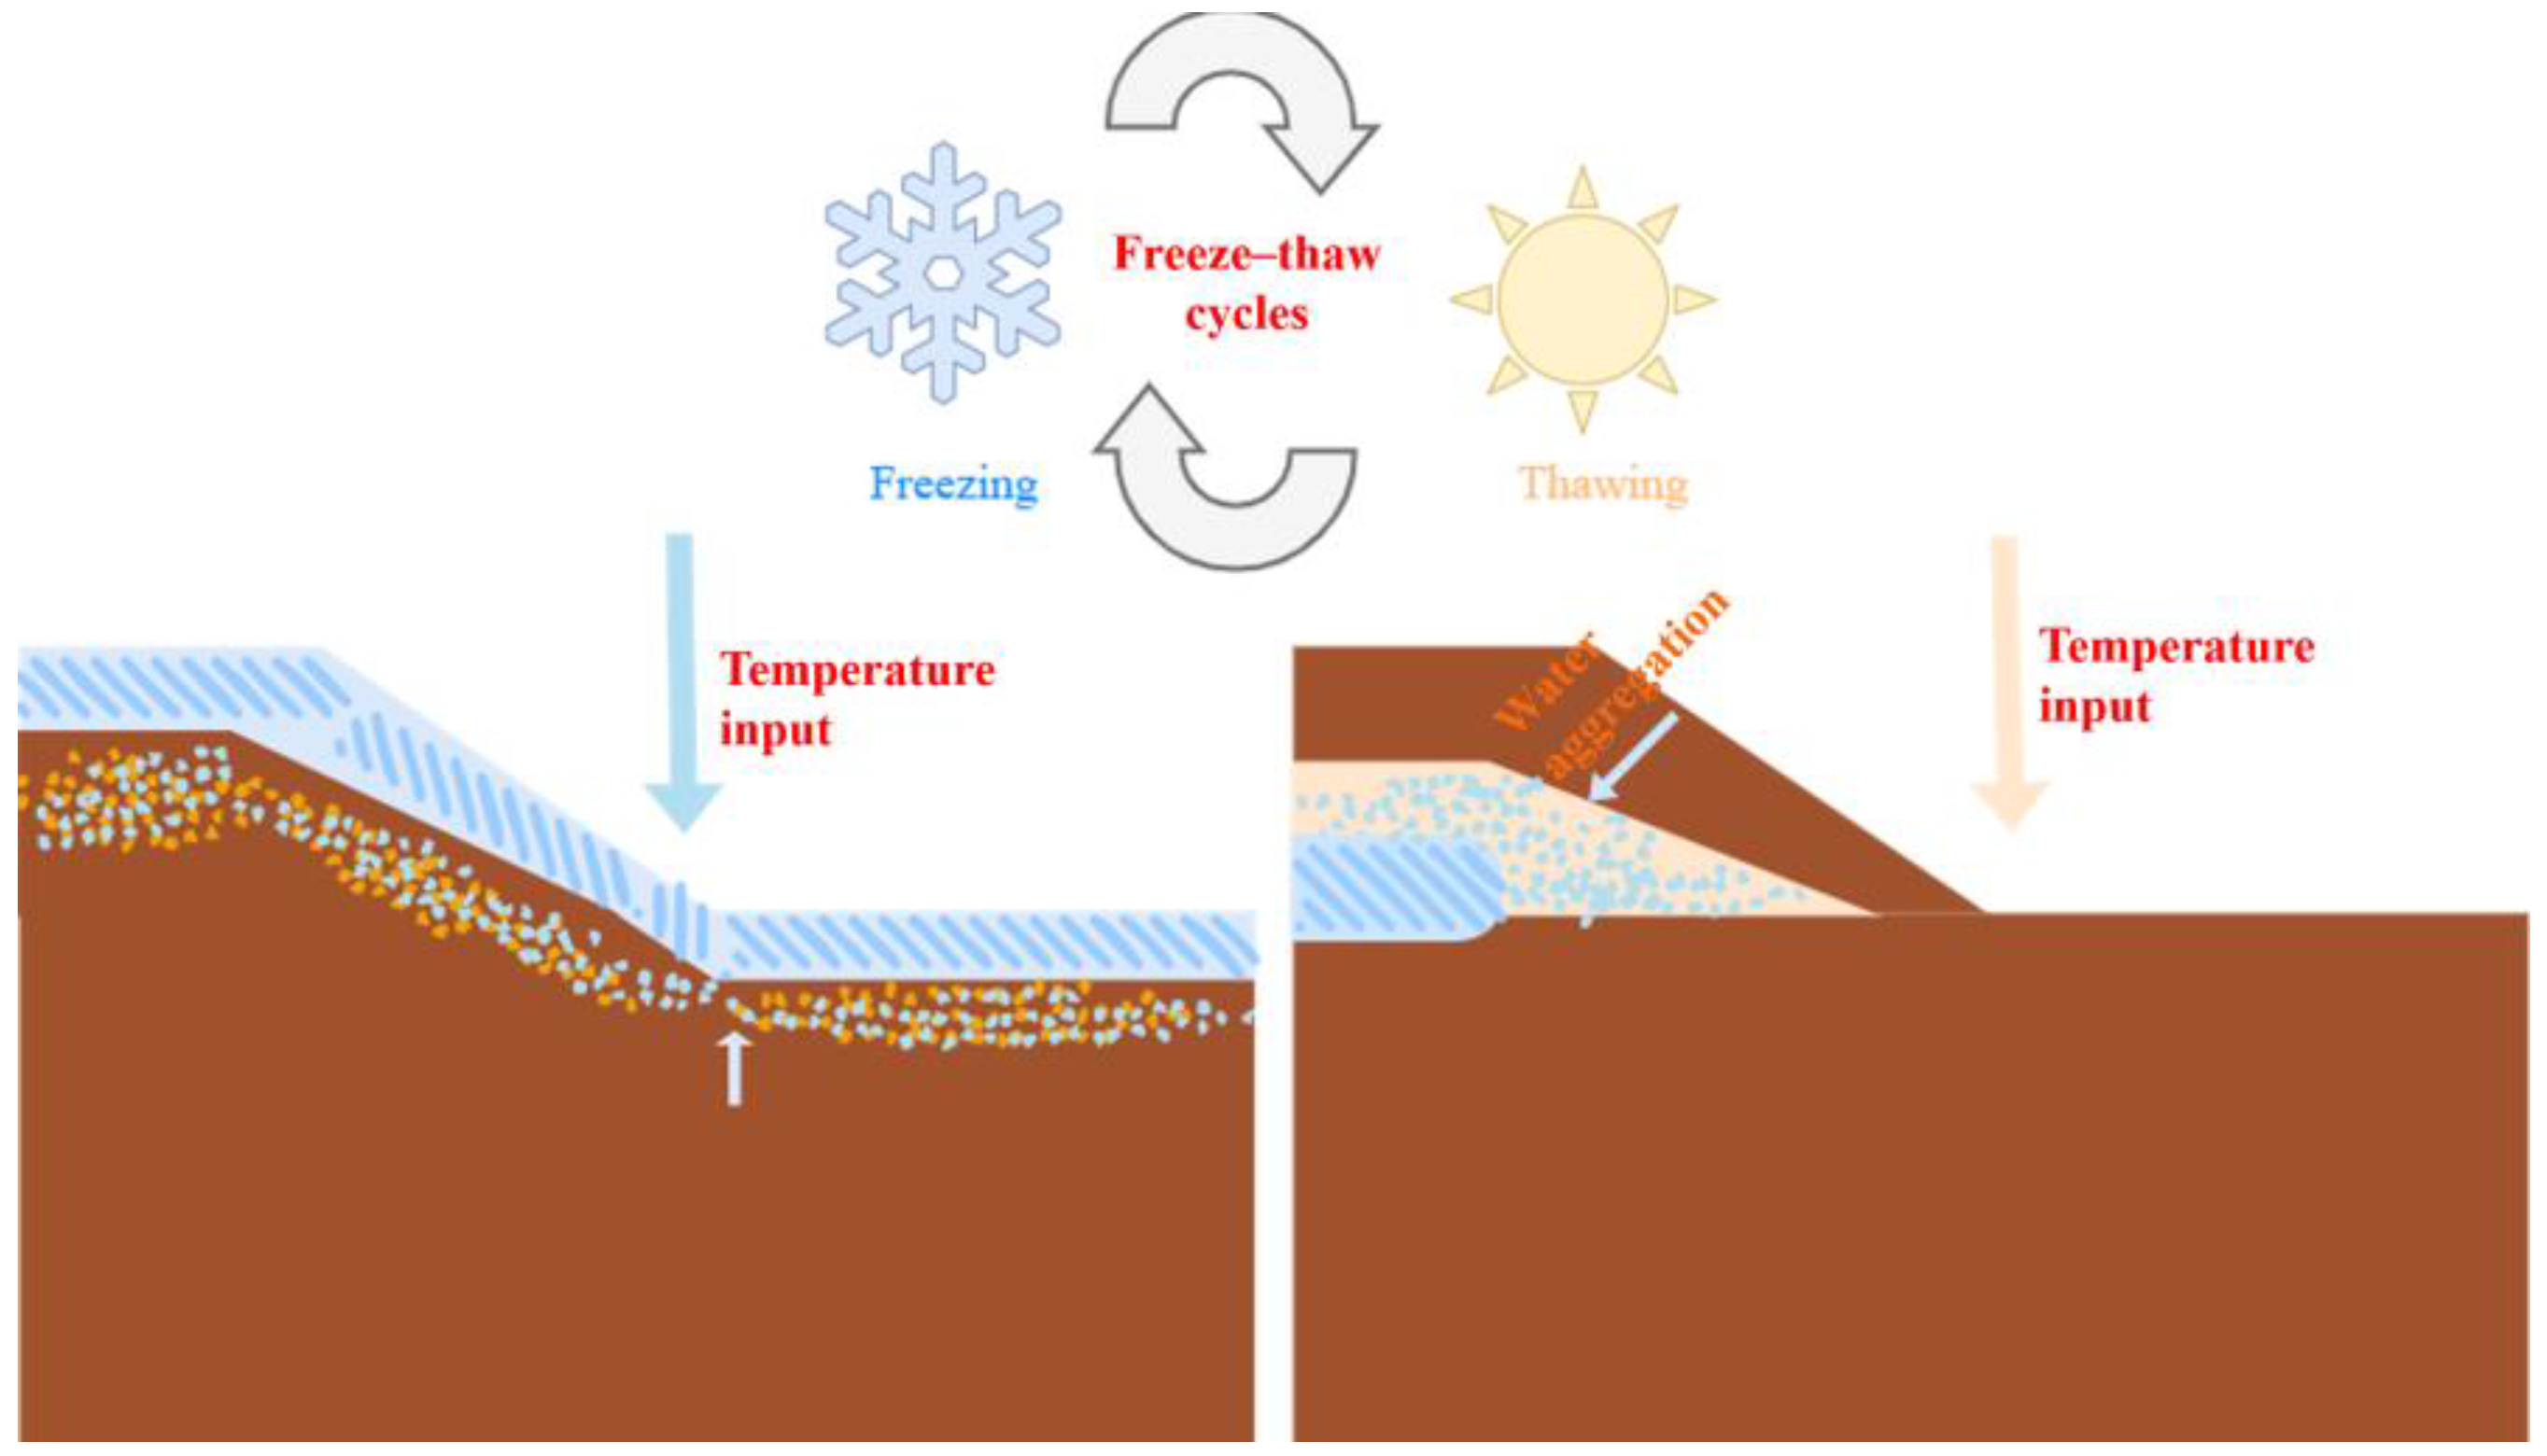
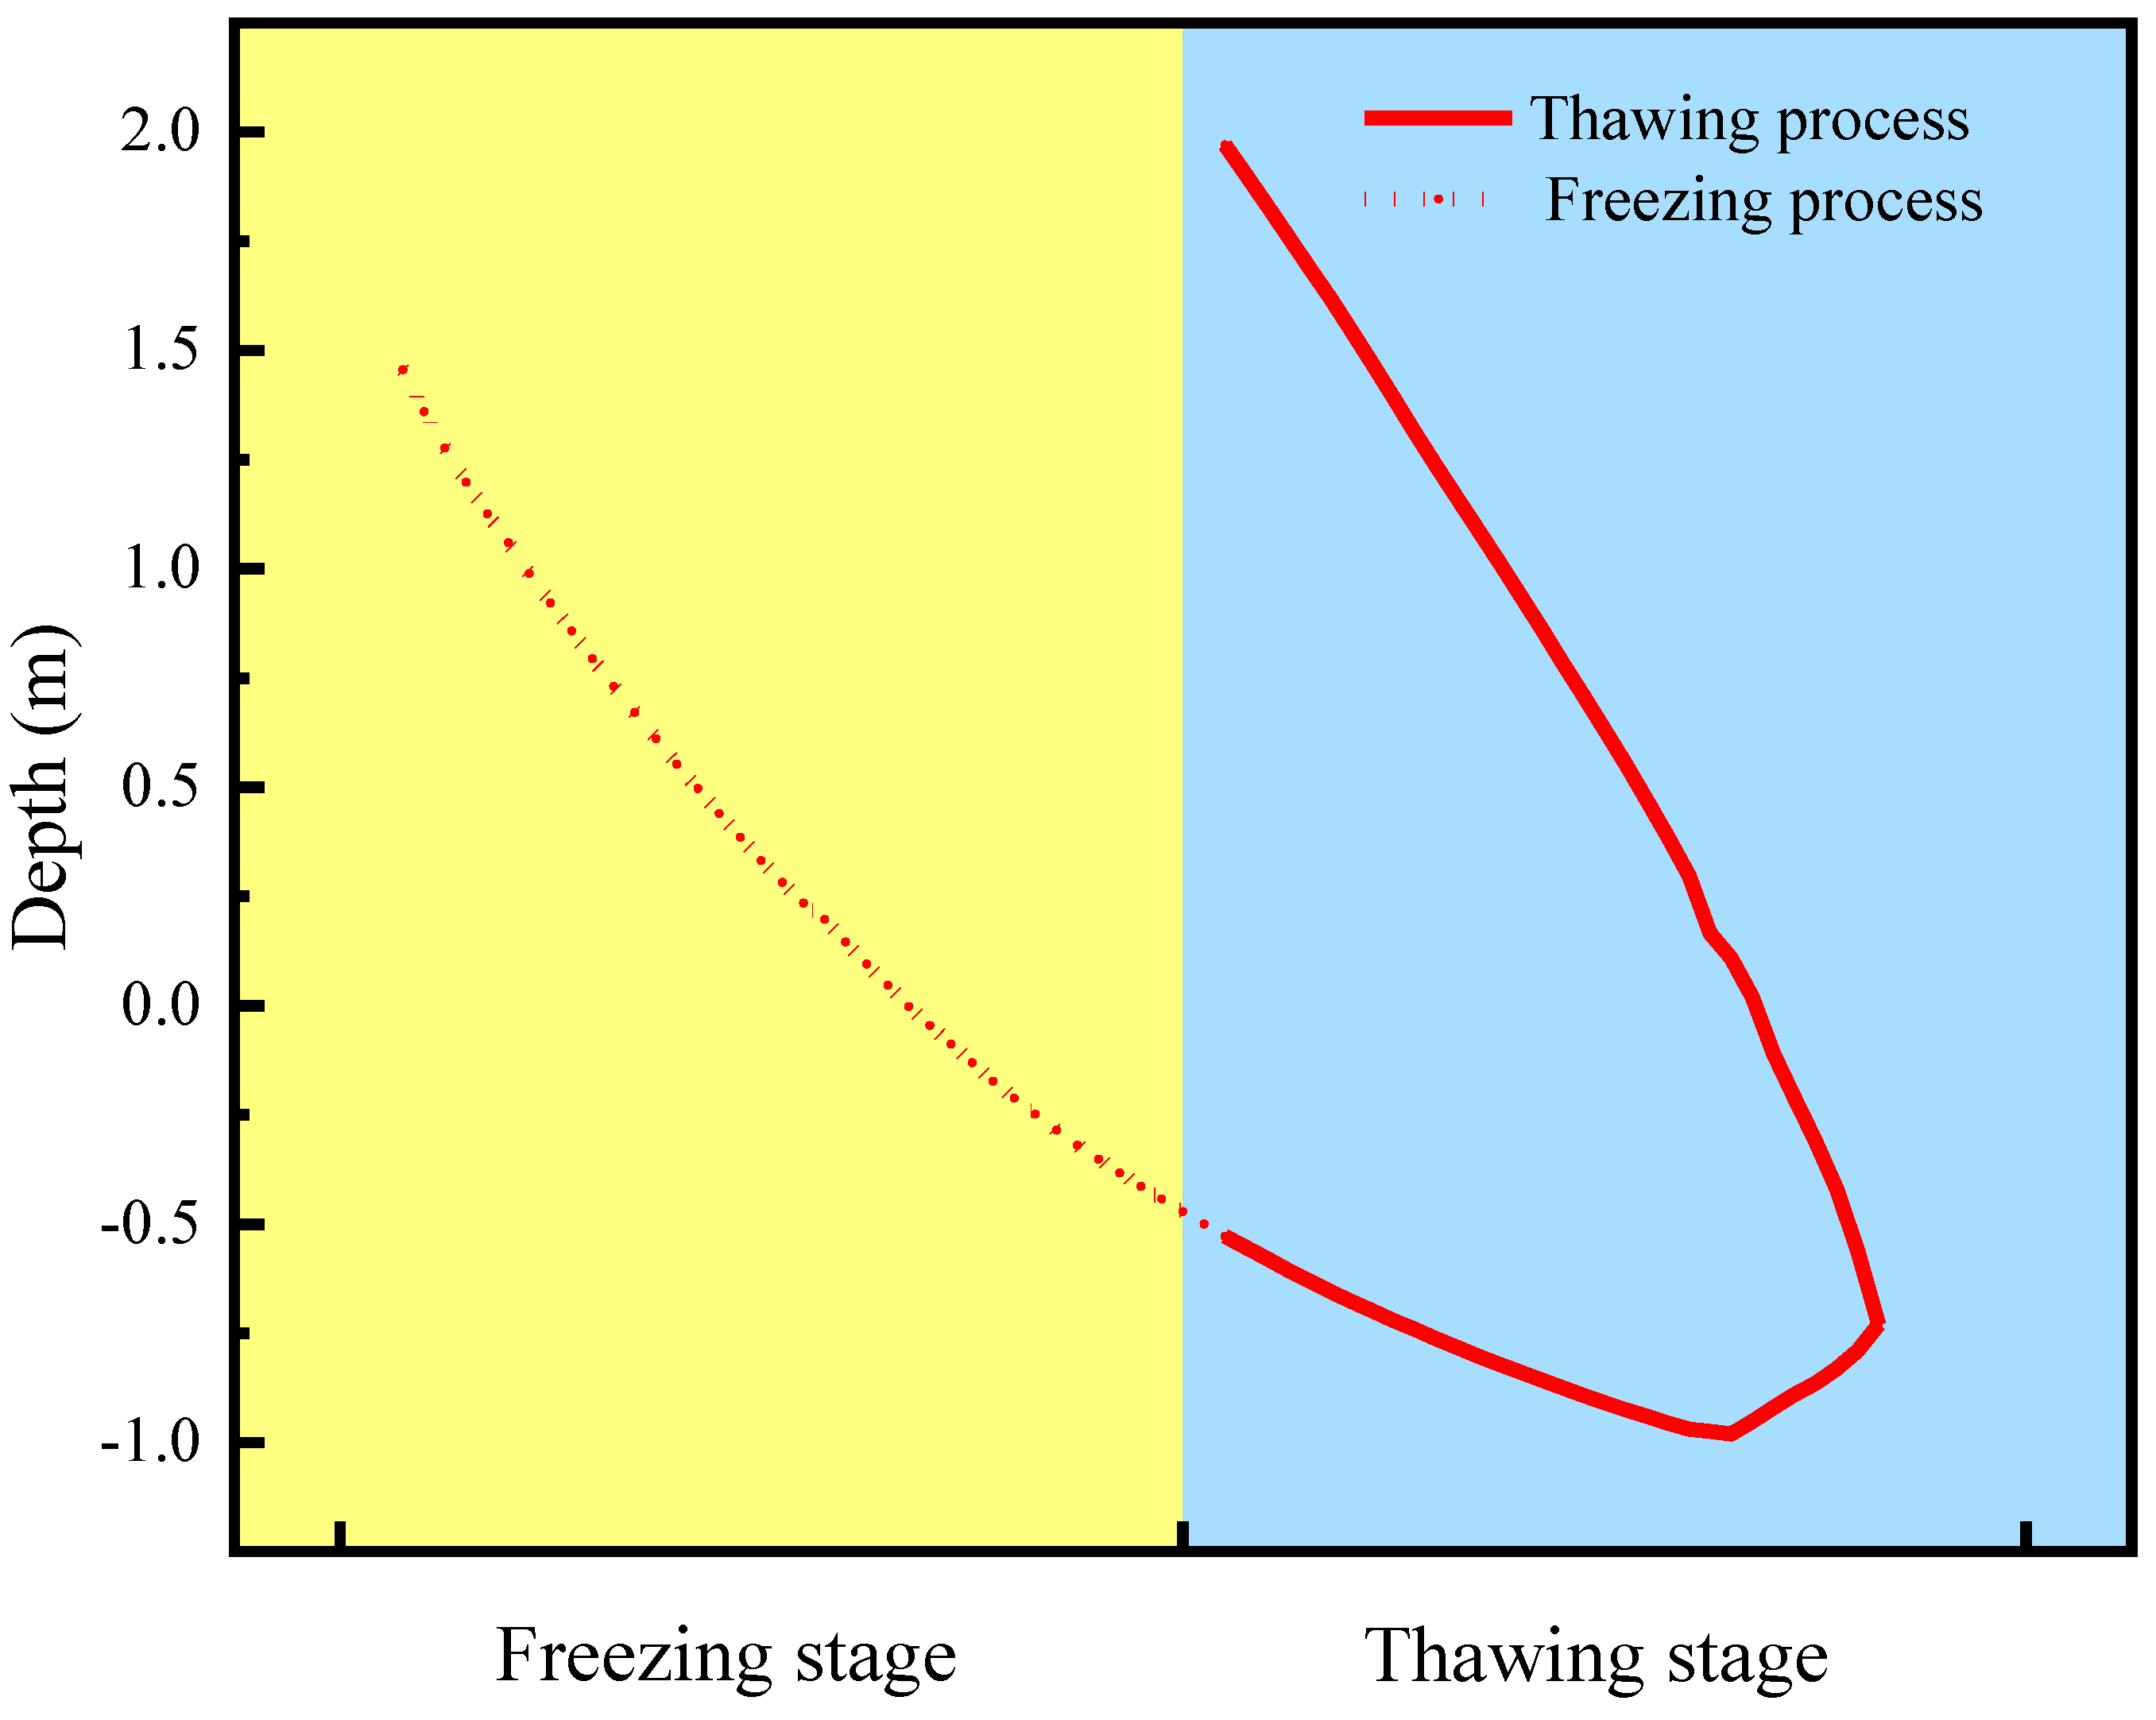
- During the freezing stage, the negative temperature gradient causes the water inside the slope to migrate towards the freezing front, thereby inducing the formation of segregated ice and the occurrence of frost heave. In the thawing stage, the latent heat released by the melting of segregated ice triggers the migration of water inside the slope towards the toe of the slope. Since there is a potential trend of increased water content at the toe of the slope during both the frost heave and thawing stages, this indirectly increases the risk of slope toe collapse and instability.
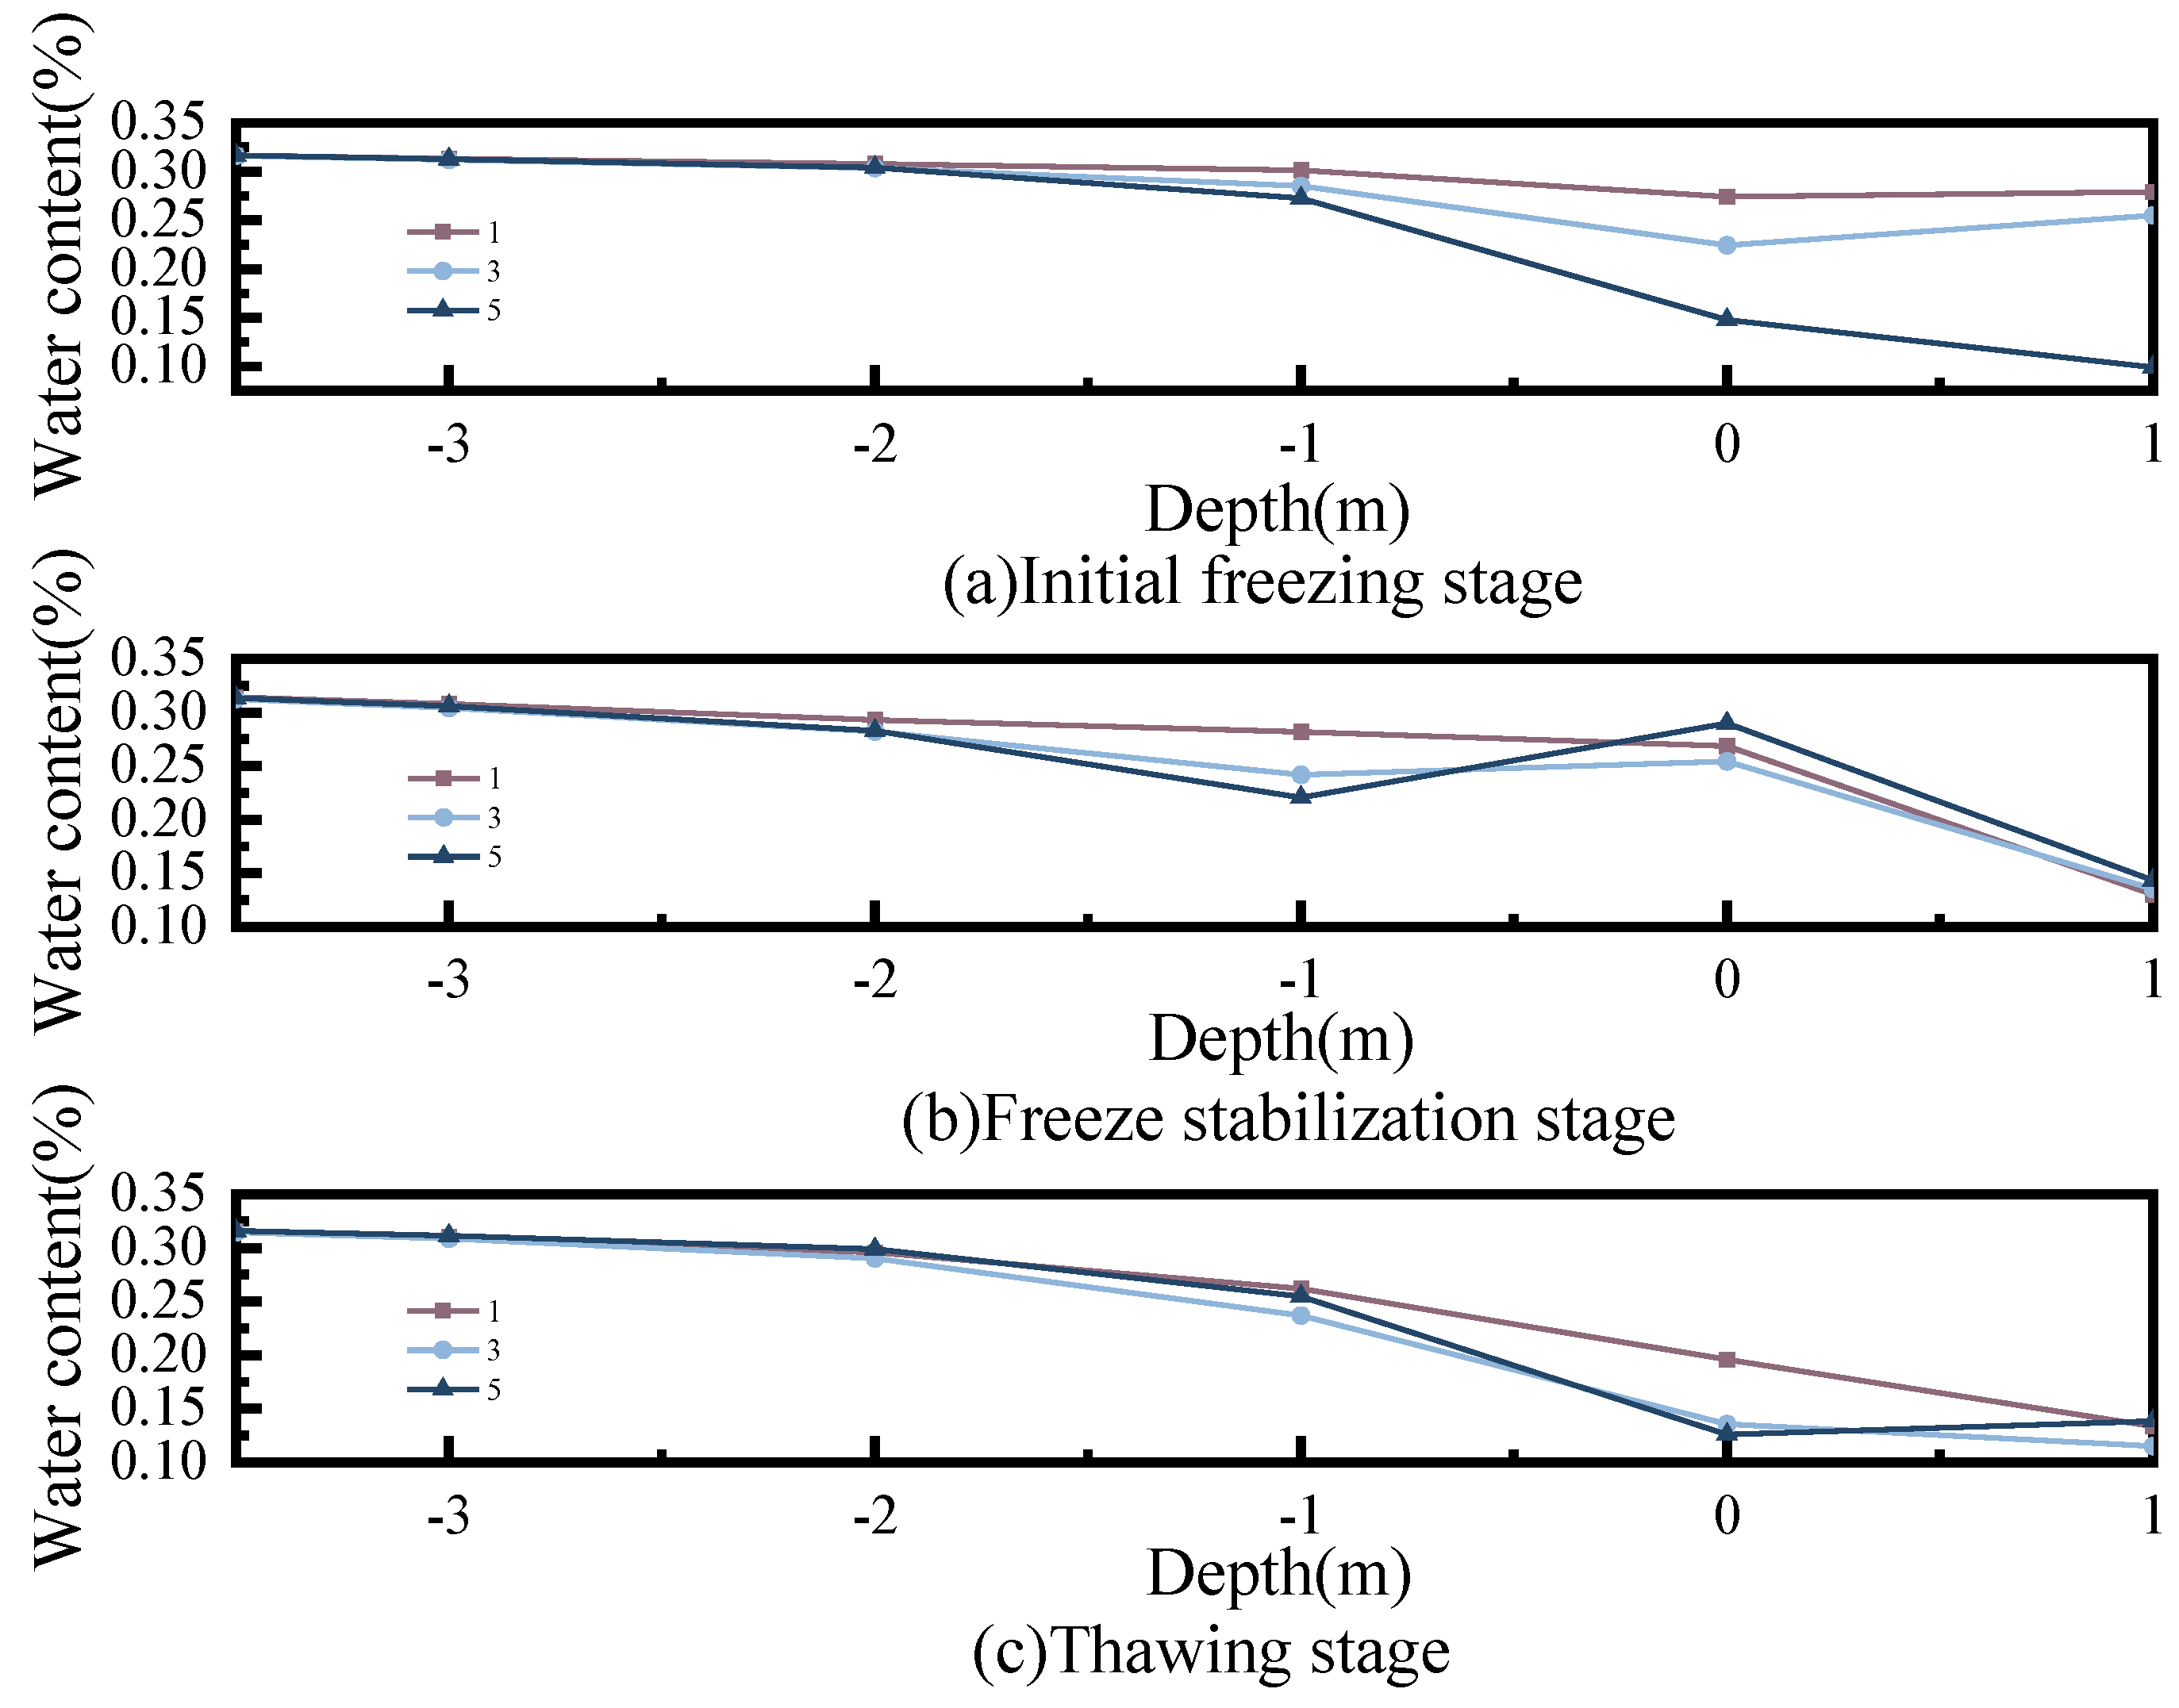
- Under the action of freeze–thaw cycles, the variation in temperature with depth inside the slope can be divided into three stages, namely the initial freezing stage, the stable freezing stage, and the thawing stage.
- In the initial freezing stage, the water content of the slope soil from −3 m to −1 m is relatively stable, and the number of freeze–thaw cycles has no significant impact on it. The difference in water content of the slope soil from −1 m to 1 m gradually becomes apparent. When entering the stable freezing stage, the soil from −3 m to −2 m is in a relatively stable frozen state, and the number of freeze–thaw cycles has a relatively limited impact on its water content. However, the water content of the soil at a depth of −2 m to 0 m is redistributed. In the thawing stage, for the soil at a depth of −3 m to 0 m, the greater the number of freeze–thaw cycles, the larger the difference in water content.
- The distribution of heat and water transfer inside the frozen soil slope with depth exhibits non-linear and dynamic characteristics. At the same time, there are differences between frozen soil slopes and frozen soil subgrades. Frozen soil slopes are characterized by one-way freezing, two-way thawing, and a thawing rate higher than the freezing rate. This is the key to understanding the mechanism of slope instability.
Author Contributions
Funding
Institutional Review Board Statement
Informed Consent Statement
Data Availability Statement
Acknowledgments
Conflicts of Interest
References
- Chen, H.; Gao, X.; Wang, Q. Research progress and prospect of frozen soil engineering disasters. Cold Reg. Sci. Technol. 2023, 212, 103901. [Google Scholar] [CrossRef]
- Shen, J.; Wang, Q.; Chen, Y.; Han, Y.; Zhang, X.; Liu, Y. Evolution process of the microstructure of saline soil with different compaction degrees during freeze-thaw cycles. Eng. Geol. 2022, 304, 106699. [Google Scholar] [CrossRef]
- Zhang, Z.-L.; Cui, Z.-D. Analysis of microscopic pore structures of the silty clay before and after freezing–thawing under the subway vibration loading. Environ. Earth Sci. 2017, 76, 528. [Google Scholar] [CrossRef]
- Wei, Y.; Tang, C.S.; Zhu, C.; Cheng, Q.; Lu, Y.; Li, L.; Tian, B.G.; Shi, B. Influence of desiccation during freeze-thaw cycles on volumetric shrinkage and tensile strength of compacted clayey soils. Eng. Geol. 2024, 334, 107513. [Google Scholar] [CrossRef]
- Kong, J.; Zhuang, J.; Peng, J.; Ma, P.; Zhan, J.; Mu, J.; Wang, J.; Zhang, D.; Zheng, J.; Fu, Y.; et al. Failure mechanism and movement process of three loess landslides due to freeze-thaw cycle in the Fangtai village, Yongjing County, Chinese Loess Plateau. Eng. Geol. 2023, 315, 107030. [Google Scholar] [CrossRef]
- Chen, Q.; Liu, Y.; Wang, Y.; Su, L.; Cheng, Y. Investigation of coupled thermo-hydro-mechanical processes on soil slopes in seasonally frozen regions. Cold Reg. Sci. Technol. 2025, 229, 104356. [Google Scholar] [CrossRef]
- Wang, T.; Jia, H.; Sun, Q.; Li, G. Effect of the frozen layer on the stability of cut soil slopes during seasonal freezing and thawing. Res. Cold Arid. Reg. 2022, 14, 281–292. [Google Scholar] [CrossRef]
- Korshunov, A.A.; Doroshenko, S.P.; Nevzorov, A.L. The impact of freezing-thawing process on slope stability of earth structure in cold climate. Procedia Eng. 2016, 143, 682–688. [Google Scholar] [CrossRef]
- Li, D.; Wen, Z.; Luo, J.; Zhang, M.; Chen, B. Slope failure induced by cold snap and continuous precipitation in the seasonal frozen area of Qinghai-Tibet Plateau. Sci. Total Environ. 2019, 694, 133547. [Google Scholar] [CrossRef]
- Wen, Z.; Zhang, M.; Ma, W.; Wu, Q.; Niu, F.; Yu, Q.; Fan, Z.; Sun, Z. Thermal–moisture dynamics of embankments with asphalt pavement in permafrost regions of central Tibetan Plateau. Eur. J. Environ. Civ. Eng. 2015, 19, 387–399. [Google Scholar] [CrossRef]
- Zhang, M.; Zhang, X.; Lai, Y.; Lu, J.; Wang, C. Variations of the temperatures and volumetric unfrozen water contents of fine-grained soils during a freezing–thawing process. Acta Geotech. 2020, 15, 595–601. [Google Scholar] [CrossRef]
- Fu, Q.; Hou, R.; Li, T.; Jiang, R.; Yan, P.; Ma, Z.; Zhou, Z. Effects of soil water and heat relationship under various snow cover during freezing-thawing periods in Songnen Plain, China. Sci. Rep. 2018, 8, 1325. [Google Scholar] [CrossRef] [PubMed]
- Xu, X.; Zhang, W.; Wang, Y. Measuring and modeling the dielectric constant of soil during freezing and thawing processes: An application on silty clay. Acta Geotech. 2022, 17, 3867–3886. [Google Scholar] [CrossRef]
- Cheng, P.; Luo, K.Q. Study on influencing factors and prediction of silty soil thermal conductivity in seasonal frozen area. Sci. Technol. Eng. 2016, 16, 235–239. [Google Scholar]
- Liu, N.; Yang, Y.; Li, N.; Liang, S.; Liu, H.; Li, C. The stability issue of fractured rock mass slope under the influences of freeze–thaw cycle. Sci. Rep. 2024, 14, 5674. [Google Scholar] [CrossRef]
- Zhang, C.; Liu, E.; Wei, X.; Yin, X.; Xiao, W.; Yu, D.; He, C. Experimental study and numerical modeling of the thermo-hydro-mechanical process in unsaturated soil under freeze-thaw cycles. Cold Reg. Sci. Technol. 2024, 218, 104063. [Google Scholar] [CrossRef]
- Sun, K.; Jia, J.; Xiong, Z.; Wu, J.; Liu, Y.; Wei, Y. Investigation of hydro-thermal variations and mechanical properties in cold region tunnels under long-term freeze–thaw cycles. Tunn. Undergr. Space Technol. 2024, 143, 105469. [Google Scholar] [CrossRef]
- Zhang, W.; Shen, Z.; Ren, J.; Gan, L.; Wang, F.; Yu, B.; Li, C. Modeling and comparative analysis of a flow and heat coupling model of the riparian zone based on thermal conductivity empirical models. J. Hydrol. 2020, 582, 124539. [Google Scholar] [CrossRef]
- Li, P.; Yue, F.; Wang, K.; Zhang, H.; Huang, H.; Kong, X. Fully coupled thermo-hydro-mechanical modeling and simulation of a fluid-saturated porous medium under local thermal non-equilibrium condition. Int. J. Heat Mass Transf. 2022, 195, 123195. [Google Scholar] [CrossRef]
- Rui, D.-H.; Lu, M.; Watanabe, K.; Zhang, J. The analysis of heat and water fluxes in frozen silty soil. Sci. Cold Arid. Reg. 2019, 11, 1. [Google Scholar]
- Wang, Z.; Fu, Q.; Jiang, Q.; Li, T. Numerical simulation of water–heat coupled movements in seasonal frozen soil. Math. Comput. Model. 2011, 54, 970–975. [Google Scholar] [CrossRef]
- Zhou, J.; Li, D. Numerical analysis of coupled water, heat and stress in saturated freezing soil. Cold Reg. Sci. Technol. 2012, 72, 43–49. [Google Scholar] [CrossRef]
- Lai, Y.; Pei, W.; Zhang, M.; Zhou, J. Study on theory model of hydro-thermal–mechanical interaction process in saturated freezing silty soil. Int. J. Heat Mass Transf. 2014, 78, 805–819. [Google Scholar] [CrossRef]
- Liu, F.; Jiao, X.; Wang, S.; Zhong, L.; An, P. Heat, water and vapor coupled migration in loess under uniaxial freezing condition. Cold Reg. Sci. Technol. 2022, 198, 103550. [Google Scholar] [CrossRef]
- Bai, Q.B.; Li, X.; Tian, Y.H.; Fang, J.H. Equations and numerical simulation for coupled water and heat transfer in frozen soil. Chin. J. Geotech. Eng. 2015, 37 (Suppl. S2), 131–136. [Google Scholar]
- Xu, X.-Z.; Wang, J.-C.; Zhang, L.-X. Physics of Frozen Soils, 2nd ed.; Science Press: Beijing, China, 2010; pp. 1–38. [Google Scholar]
- Chen, H.-C.; Li, X.-D.; Li, F.-X.; Zhou, B.-R.; Li, C.-Y. Change of Soil Temperature and Soil Moisture Content in Typical Degenerated Steppe in Maduo County in the Headstream Region of the Yellow River. Arid. Zone Res. 2013, 30, 35–40. [Google Scholar]
- Shi, F.; Qin, J.; Han, T.; Sun, Y.; Yang, B.; Fu, X. Variation and characteristics of soil hydrological elements in the source region of the Yellow River. Prog. Geogr. 2023, 42, 1691–1703. [Google Scholar] [CrossRef]
- Gao, W.; Sun, W.; Wang, X.; Dong, N. (Eds.) Moisture Content Distribution and Variation Law of Highway Subgrade in High-Latitude and Low-Altitude Deep Seasonal Frozen Ground Region. In IOP Conference Series: Earth and Environmental Science; IOP Publishing: Bristol, UK, 2021. [Google Scholar]


| Index | Test Result |
|---|---|
| Water content (%) | 23.5 |
| Density (g/cm3) | 1.7 |
| Specific gravity | 2.74 |
| Liquid limit (%) | 36.1 |
| Plastic limit | 25.7 |
| Plasticity index (%) | 10.4 |
| Index | Test Result |
|---|---|
| density (g/cm3) | 1.7 |
| specific heat capacity of frozen skeleton (kJ/(kg·K)) | 0.9 |
| specific heat capacity of molten soil skeleton (kJ/(kg·K)) | 1.1 |
| coefficient of thermal conductivity of soil skeleton (W/(m·K)) | 1.95 |
| ice content coefficient | 0.4 |
| residual volume moisture content (%) | 2 |
| saturation volume water content (%) | 40 |
| VG parameters n | 2 |
| VG parameters m | 0.5 |
| VG parameters a0 | 0.03 |
Disclaimer/Publisher’s Note: The statements, opinions and data contained in all publications are solely those of the individual author(s) and contributor(s) and not of MDPI and/or the editor(s). MDPI and/or the editor(s) disclaim responsibility for any injury to people or property resulting from any ideas, methods, instructions or products referred to in the content. |
© 2025 by the authors. Licensee MDPI, Basel, Switzerland. This article is an open access article distributed under the terms and conditions of the Creative Commons Attribution (CC BY) license (https://creativecommons.org/licenses/by/4.0/).
Share and Cite
Duan, F.; Quan, L.; Wang, H.; Tian, B. Effects of Cyclical Climate Change on Water Temperature Characteristics of Permafrost Slopes. Appl. Sci. 2025, 15, 3403. https://doi.org/10.3390/app15063403
Duan F, Quan L, Wang H, Tian B. Effects of Cyclical Climate Change on Water Temperature Characteristics of Permafrost Slopes. Applied Sciences. 2025; 15(6):3403. https://doi.org/10.3390/app15063403
Chicago/Turabian StyleDuan, Feike, Lei Quan, Haowu Wang, and Bo Tian. 2025. "Effects of Cyclical Climate Change on Water Temperature Characteristics of Permafrost Slopes" Applied Sciences 15, no. 6: 3403. https://doi.org/10.3390/app15063403
APA StyleDuan, F., Quan, L., Wang, H., & Tian, B. (2025). Effects of Cyclical Climate Change on Water Temperature Characteristics of Permafrost Slopes. Applied Sciences, 15(6), 3403. https://doi.org/10.3390/app15063403