1. Introduction
According to statistics [
1], meningiomas are the most common primary intracranial tumors in adults, accounting for 36.7% of all intracranial tumors. They originate from the meninges, the three layers of protective tissue between the skull and the brain. According to the classification standards of WHO [
2,
3], approximately 80% of cases are of benign histology and correspond to grade I [
4]. However, manual segmentation is not only time-intensive, but also heavily reliant on the doctor’s expertise, rendering it susceptible to inaccuracies. Therefore, the development of an efficient and rapid automated meningioma segmentation method could significantly boost the productivity of clinical physicians.
An MRI [
5] image is a volumetric medical image and the main tool for meningioma segmentation, due to its good soft-tissue contrast and non-invasive characteristics [
6]. Moreover, 3D medical image segmentation plays a crucial role in medical diagnostics. Numerous previous studies have shown that U-shaped architectures perform well by using encoder–decoder structures to extract image features and classify pixels in 3D medical images [
7,
8]. Throughout the years, more U-shaped model structures have been proposed [
9,
10].
However, these studies primarily focus on improving tumor segmentation accuracy, and overlook model complexity. As a result, the equipment requirements become higher, resulting in a heavy burden on memory resources, and these model structures often lack effective plug-and-play functionality, limiting their portability. So it is crucial to design a model with low memory burden and high segmentation accuracy.
In order to enhance the feature extraction capability and improve the segmentation precision, various attention methods have been proposed in recent years and widely applied to 3D medical image segmentation tasks [
11,
12,
13]. Although these attention methods enhance segmentation accuracy, they still require substantial memory and exhibit high computational complexity. This is due to the fact that, during the tasks of 3D medical image segmentation, each voxel is processed individually. This results in high computational costs, potential loss of spatial details, and increased sensitivity to noise and artifacts.
We re-evaluate the challenge of improving inference efficiency while maintaining accuracy and propose a novel lightweight attention mechanism referred to as entropy–curvature-based attention (ECA). This mechanism comprises the following three components: a tri-axial strip pooling method (TSP) and two attention modules designed in a cascade, entropy-based attention (EGA), and curvature filter attention (CFA). TSP compresses 3D medical images to reduce computational load and memory requirements. EGA aims to eliminate noise interference from the features after TSP, while CFA aims to efficiently extract local features from the image. The main contributions of this paper are as follows:
- (1)
A plug-and-play attention model named ECA is presented. It demonstrates strong portability and enhances segmentation accuracy while consuming less memory and parameters.
- (2)
A pooling method and two spatial attention methods are proposed in ECA. The pooling method is utilized to compress 3D images. Meanwhile, the two attention methods are utilized to enhance tumor features and improve segmentation accuracy.
- (3)
A meningioma dataset was constructed, which is supported by West China Hospital. All segmentation labels were manually marked by experienced neurosurgeons and used for the automatic segmentation training of meningioma tumors.
The rest of this article is organized as follows.
Section 2 discusses related works relevant to this research.
Section 3 describes the details of the specific structure of the method.
Section 4 describes the experimental setup, the performance of the method, visualization, and analysis.
Section 5 discusses the current limitations of the method and points out future directions.
Section 6 presents the conclusions.
2. Related Work
2.1. Medical Image Segmentation
Deep learning methods based on convolutional neural networks (CNNs) have demonstrated excellent performance in medical image segmentation. Ronneberger et al. [
7] proposed U-Net, which uses a fully convolutional network for feature extraction and fusion. Subsequent variants [
8,
14,
15] have further demonstrated the effectiveness of the U-shaped architecture. Wang et al. [
16] developed a brain tumor segmentation network that utilizes a residual architecture and multi-scale feature extraction to improve performance. Herng et al. [
17] proposed RU-Net, which integrates batch normalization with a residual network and employs a pooling index transmission mechanism to enhance spatial correlation for efficient segmentation. Transformer has also been widely applied in medical image segmentation. Chen et al. [
18] proposed TransUNet, which combines the hybrid structure of CNN and Transformer, utilizing the local feature extraction of convolutions and the global modeling capabilities of Transformers, respectively. Karimi et al. [
19] proposed a scheme for segmenting 3D images into 3D patches to obtain a global representation. SwinUNETR [
20] further improved segmentation accuracy by incorporating the Swin Transformer [
21] module, which replaces the traditional downsampling and upsampling processes.
With the development of deep learning frameworks, the accuracy of tumor segmentation has significantly improved. However, this is accompanied by an increase in memory consumption and the number of parameters. In particular, in 3D medical image segmentation, 3D image data require the network to process a large amount of voxel information, leading to a significant increase in computational complexity. In addition, larger models typically require more parameters to learn and memorize complex feature patterns, further burdening the memory of the computing device. As a result, despite the significant advances in accuracy of these state-of-the-art (SOTA) models, the increased computational costs and hardware requirements limit their widespread use in clinical practice.
2.2. Attention Mechanisms for Segmentation
In the MRI images of the patient’s brain, the tissue area of the tumor region is small, and the boundaries between various modalities are not clear. In order to better focus on the tumor region in brain MRI images, many researchers have introduced the attention mechanism into semantic segmentation of medical images [
22]. Initially, 2D attention was mainly used for image feature extraction. Since the introduction of squeeze-and-excitation modules in SENet [
11], various convolution-based attention methods have emerged. Woo et al. [
12] proposed CBAM, which optimizes the features by deriving the attention map along the channel and spatial dimensions. Fu et al. [
23] proposed DANet, which captures global dependencies to improve segmentation accuracy through a self-attentive mechanism that integrates spatial and channel attention modules. Luo et al. [
24] proposed a lightweight and efficient pseudo-3D model called HDC-Net. Wang et al. [
25] introduced an iterative edge attentional network, which uses multiple modules to extract multiscale information, remove noise, and integrate edge and region information to address challenges such as target scale diversity and complex context.
However, when dealing with 3D images, the problem occurs that 2D attention cannot be used directly. In 3D medical image segmentation, the complete 3D image is usually processed as a series of 2D slices, and a 2D attention mechanism is employed to improve the accuracy and robustness of segmentation, so this approach fails to fully capture the spatial contextual 3D information. In volumetric medical segmentation, a 3D convolution-based attention mechanism can better capture local and global 3D features, enabling the model to establish stronger spatial associations between slices, thereby improving segmentation accuracy. To address this limitation, researchers have begun to explore methods to directly apply attention mechanisms in 3D images. Georgescu et al. [
26] proposed the 3D attention module MHCA, which uses convolution to achieve joint attention in both space and channel. Li et al. [
27] introduced a 3D large-kernel attention module, which combines the advantages of self-attention and convolution to capture both local and global information while optimizing the computational costs. Cao et al. [
28] proposed MBANet; this network uses the optimized shuffle unit and the 3D shuffle attention module to process features while using the SA module in skip connections to recover resolution. Li et al. [
13] proposed TDPC-Net to facilitate comprehensive learning of 3D information in brain tumor images. Zhu et al. [
29] proposed a dynamic sparse attention mechanism named BiFormer, while Shaker et al. [
30] introduced UNETR++, a model that utilizes an efficient pairwise attention module to reduce computational costs.
In the context of processing 3D medical images, the problems of a large number of parameters and high memory footprint are inevitably encountered. Previous models also exhibit certain limitations, as shown in
Table 1. To address this challenge, we optimize the existing attention frameworks and propose a lightweight and easily transferable attention module.
3. Method
As shown in
Figure 1, we propose a segmentation architecture and embed ECA into this architecture, which includes a hierarchical encoder and decoder. ECA is used in each encoding layer and skip connection. Each ECA block consists of three modules, namely, TSP, EGA, and CFA, which are sequentially arranged to reduce memory consumption and improve inference efficiency while learning rich feature representations.
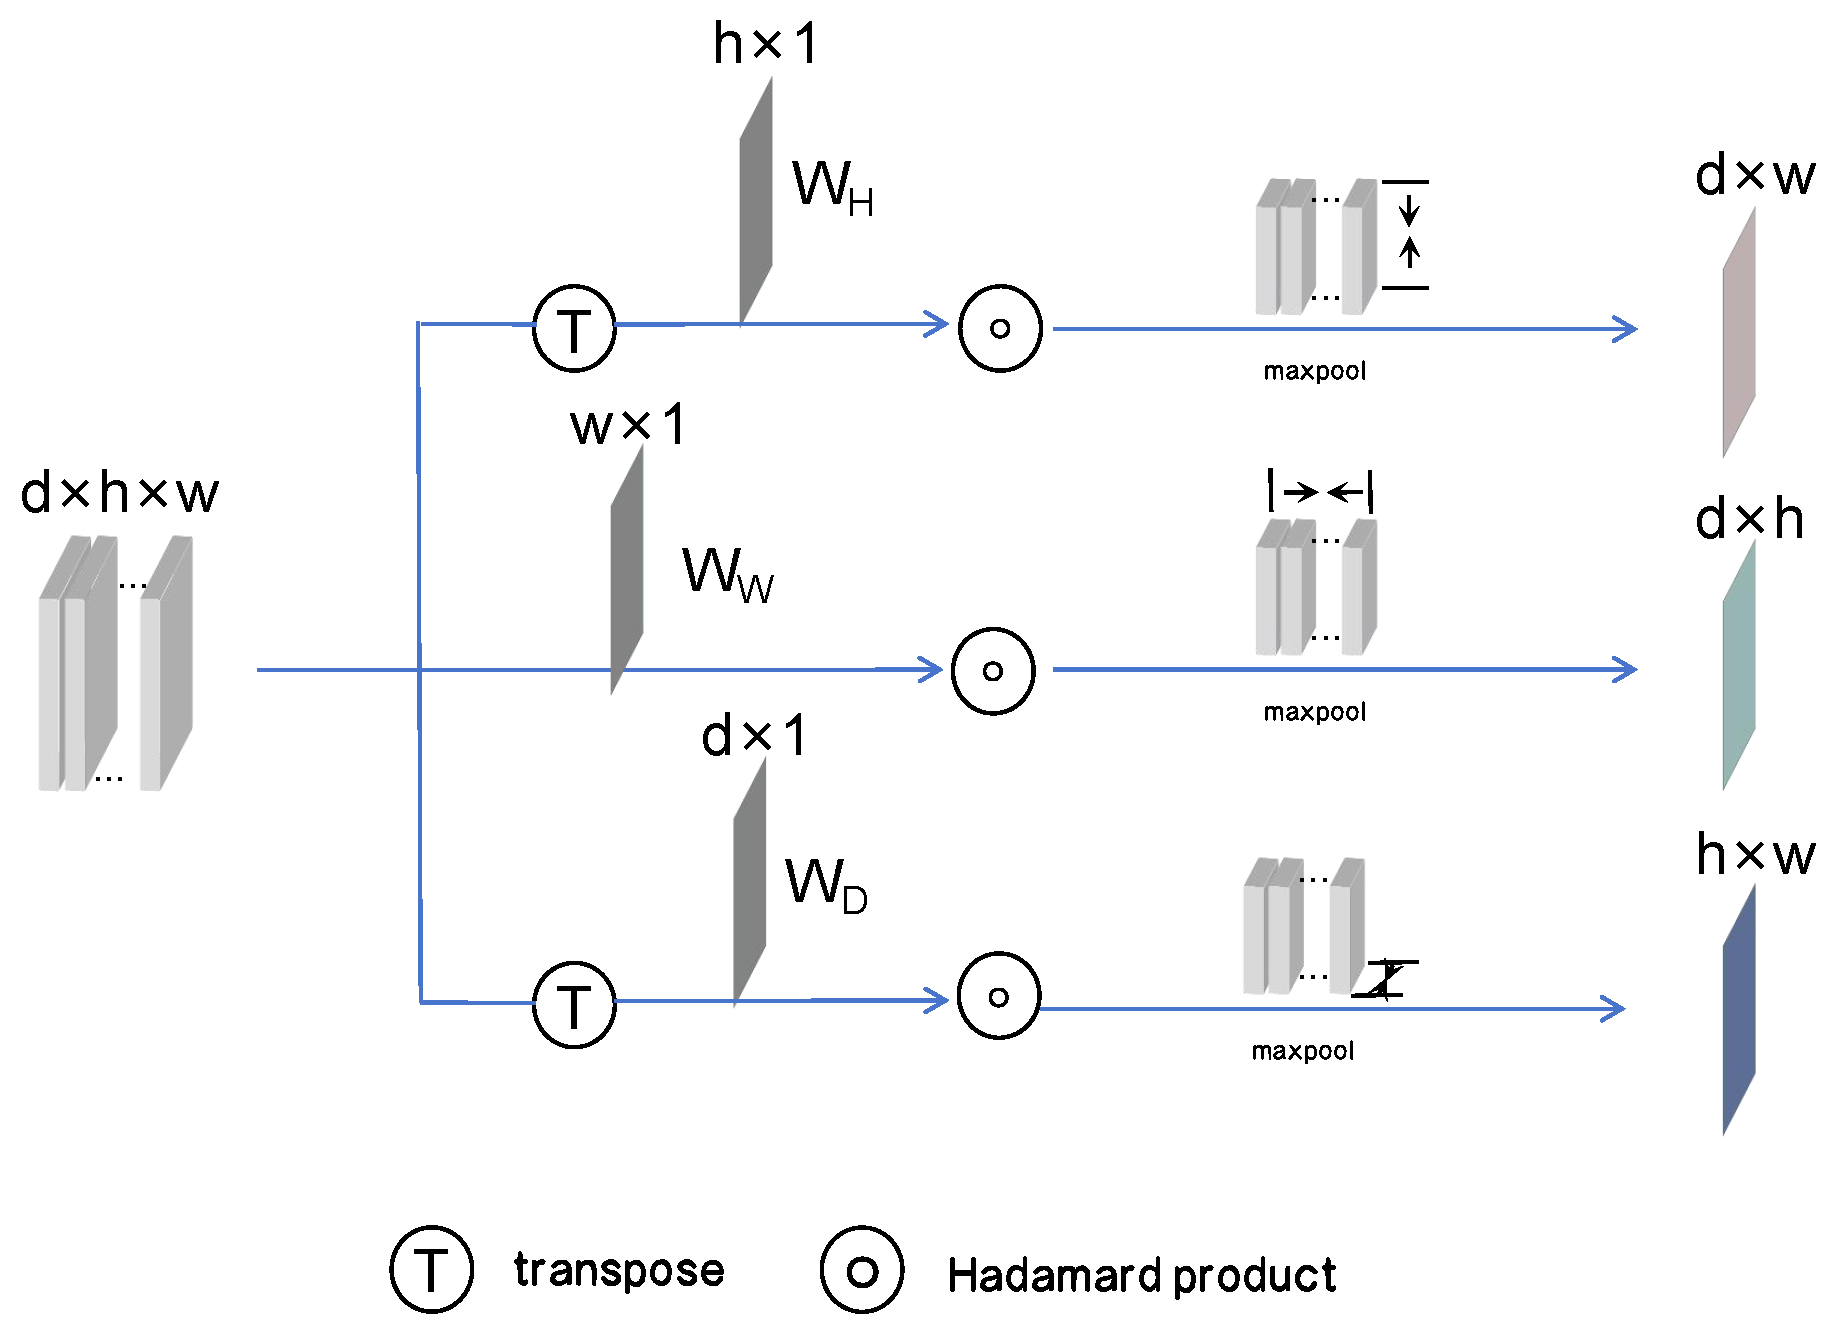
3.1. Tri-Axial Strip Pooling
Currently, the commonly used pooling methods in neural networks include max pooling, average pooling, and spatial pyramid pooling. However, max pooling focuses only on prominent information, which may lead to the loss of detailed information. Average pooling emphasizes global information but may lose important image features. Spatial pyramid pooling can handle inputs of different sizes, but it increases the computational complexity.
In order to fundamentally reduce memory consumption during the segmentation of 3D medical images, TSP is proposed, as shown in
Figure 2. To preserve the spatial information across all three dimensions, the data from the sagittal, coronal, and transverse planes are compressed separately. TSP applies weights via independently learnable vectors to emphasize the important features in each plane, enabling the ability to ignore unimportant regions and highlight tumor regions. For example, the pooling operation in the transverse plane is represented by the following formula:
where
represents the pooling result along the transverse plane,
H represents the height of this plane,
is a learnable weight matrix on the
H axis,
A is the input feature map. Using the previously mentioned formula, pooling is performed along these three planes, resulting in three 2D feature maps that capture tri-axial information. These feature maps effectively retain global information from different viewpoints. After processing through EGA and CFA, these three feature maps are merged to complement each other’s spatial information.
3.2. Entropy-Guided Attention
Information entropy, as a key metric for quantifying information uncertainty, has irreplaceable advantages in the segmentation task. On the one hand, information entropy shows a certain robustness to noise. In images with significant noise, information entropy can still effectively reflect the grayscale distribution characteristics, thereby guiding the segmentation process. On the other hand, due to its sensitivity to local features, information entropy can effectively identify structures and boundaries in the image, thus improving the accuracy of segmentation. However, the current application of information entropy mainly relies on the maximum entropy threshold method for information filtering based on grayscale values. Due to the wide distribution of gray values in MRI images, it is not feasible to apply this method directly to the whole image, and it is quite challenging to determine the gray threshold. Therefore, the direct application of information entropy in image segmentation is limited.
Based on this, we make a series of improvements in this aspect. Considering the complexity and uncertainty of setting thresholds, instead of using a thresholding approach, we divide the feature mapping into multiple small windows and then use the top-k algorithm to select the most information-rich regions. For each window, we calculate the entropy of the grayscale values, quantifying the amount of information in that region. The formula for calculating entropy is shown as follows:
where
E is the entropy of the entire small window,
n is the range of grayscale values,
is the gray value of the image, and
is the probability of the gray value
. The higher the entropy value, the greater the amount of information, indicating a more complex image. We then select the top-k regions with the highest entropy, which usually contain more useful information. In order to enhance the feature representation of these regions, these selected high-entropy regions are merged with the original image, thus improving the accuracy of the subsequent processing.
where
Y represents the enhanced outcome of EGA,
X represents the feature map before processing, and
E represents the information entropy obtained from the windows.
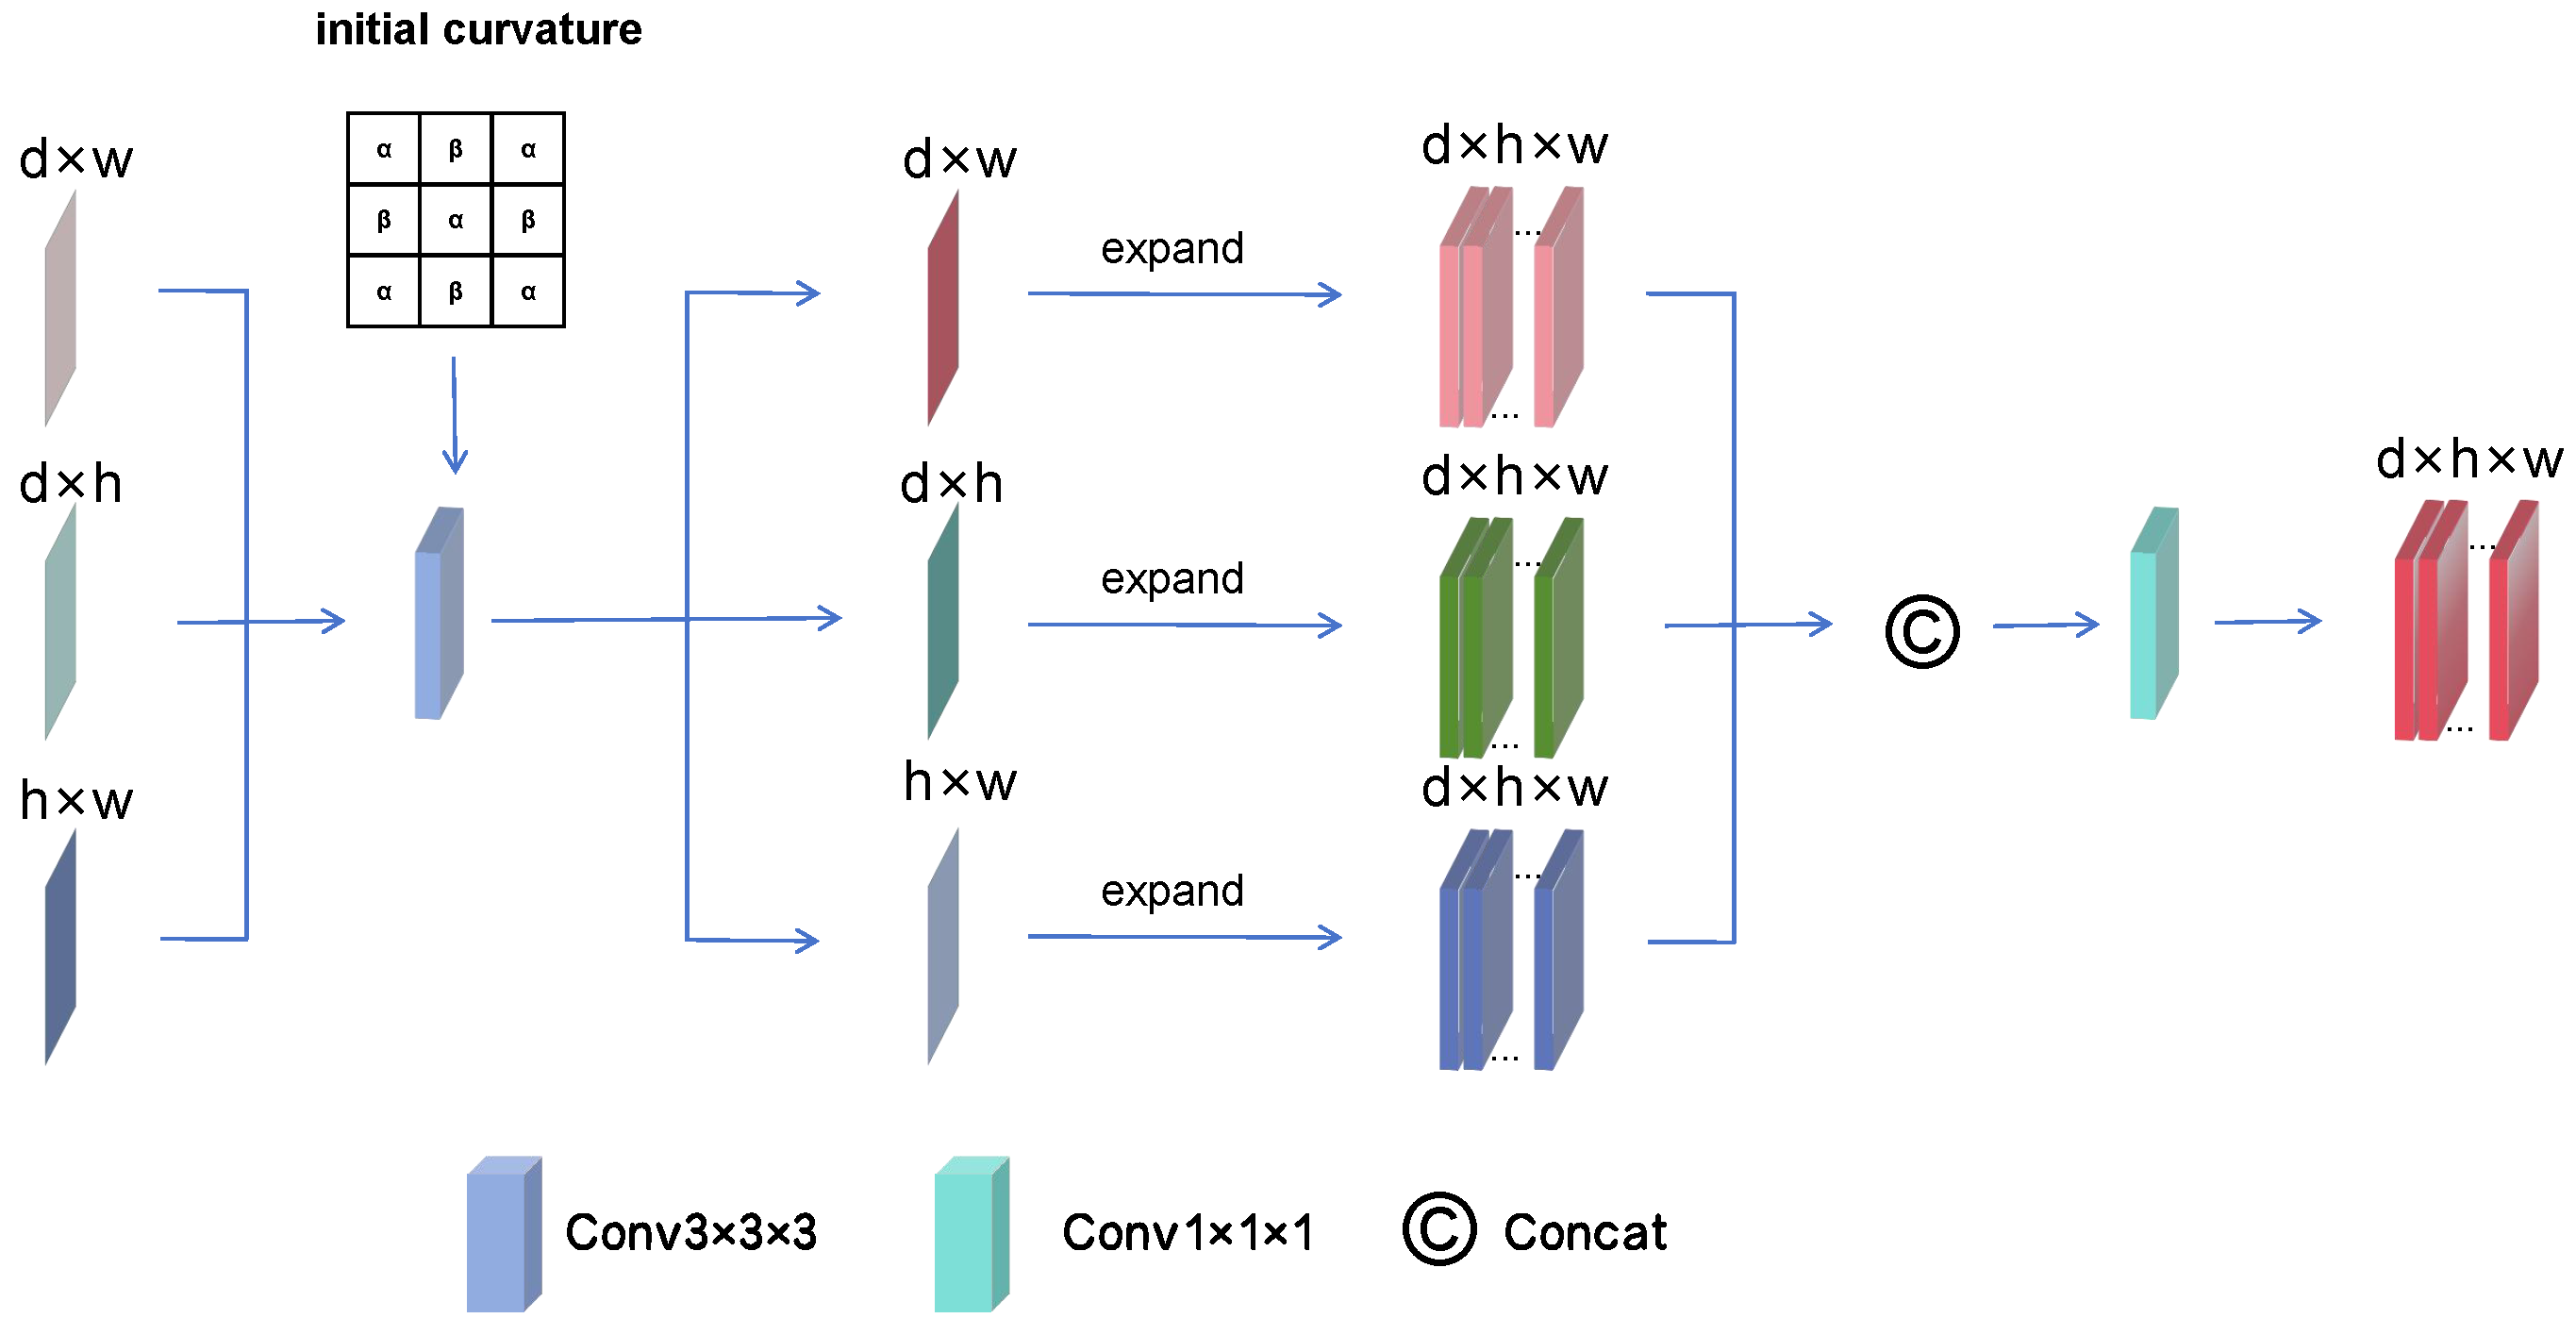
3.3. Curvature Filter Attention
In the image segmentation tasks, local and global features are both important. In order to efficiently integrate the global information, TSP is used to extract the feature information from three planes and successfully compresses the global information into three two-dimensional feature maps. Subsequently, EGA is utilized to further filter these feature maps. However, to achieve precise edge extraction, we propose an efficient local information extraction module.
Curvature can accurately reflect the geometric shape information of the image edges, which is particularly important for image segmentation. Generally, high-curvature regions correspond to edges and details in the image, while low-curvature regions correspond to flat areas. During the filtering process, the pixel changes in the high-curvature regions are relatively larger, while the low-curvature regions are smoother. By precisely calculating the curvature of image edges, subtle changes in the edges are captured. This capability allows curvature to identify object boundaries more accurately, thereby achieving precise segmentation of different regions.
However, the lack of concrete curvature parameters have limited the widespread application of curvature, we make a series of improvements to curvature and designed the CFA to better extract local features from medical images, the structure of CFA as shown in
Figure 3. This method can more effectively highlight the edges of objects, providing the possibility of using curvature to enhance edge features. To solve the problem of curvature parameter selection, we set a learnable matrix as the initial curvature value. During the learning process, this matrix gradually adapts to the rough shape of the tumor. Subsequently, we embed the curvature into a convolution operation by weighting the convolution. Finally, the three feature maps are converted into the same three-dimensional space through expand operation, which allows the feature from the three dimensions to complement each other, thus further enhancing the representation of the tumor region. Finally, in order to combine global and local information, the feature maps obtained from the three planes are integrated and the input and output of the ECA are made to be of the same size, achieving a plug-and-play feature.
3.4. Loss Function
The loss function is based on a summation of the commonly used dice loss [
31] and cross-entropy loss [
32]. Dice loss improves the model’s sensitivity to small targets, while CE loss ensures the model’s ability to classify all pixels. With this complementarity. It is defined as follows:
where
is the predicted probability of the
ith pixel,
is the true label (0 or 1) of the
ith pixel,
N is the total number of pixels in the image,
and
are weighting coefficients used to balance the contribution of the two types of losses to the total loss.
4. Experiments
4.1. Experimental Setup
4.1.1. Datasets
In our study, we employed both private and public datasets to validate the performance of the method we proposed.
Specifically, the private dataset was collected from the Neurosurgery Department of West China Hospital. The dataset contains preoperative T1-weighted MRI scans of 500 meningioma patients; all of the segmentation labels were manually labeled by experienced neurosurgeons. The training set contains 345 cases, the validation set contains 100 cases, and the test set contains 65 cases. All the meningiomas in the dataset have a volume of less than 15 mm3 for training.
The public dataset is the BraTS2021 dataset [
33], which is widely recognized for its comprehensive collection of multimodal MRI scans of glioma patients. This dataset is widely utilized in medical image segmentation. We conducted experimental validation using a dataset of 1237 cases from the BraTS2021 dataset; the training set contains 700 cases, the validation set contains 299 cases, and the test set contains 252 cases. Each case includes the following four modalities: T1, T1ce, T2, and FLAIR. The annotations consist of the enhancing tumor, the peritumoral edematous, and the necrotic tumor core, which are combined into the following three nested subregions: whole tumor (WT), tumor core (TC), and enhanced tumor (ET).
4.1.2. Evaluation Metric
The model’s performance is evaluated based on the following two key metrics commonly used in the meningioma segmentation task: the Dice similarity coefficient (DSC) and 95% Hausdorff distance (HD95). The goal of meningioma segmentation is to predict the tumor region as accurately as possible, and DSC directly measures the degree of match between prediction and the ground truth. DSC still has good performance, even if the volume of the tumor is small. HD95 focuses on the maximum difference between the boundary of prediction and the ground truth, which can effectively measure whether the shape of the prediction is accurate or not. Compared with the original Hausdorff distance (HD), HD95 removes 5% of the extreme outliers, reducing the effect of instability caused by individual noise points.
The formulas for their calculation are shown as follows:
where
represents the distance between point
a and point
b, and
A and
B are the sets of points on the prediction and ground truth, respectively. HD95 measures the 95th percentile of the distances between the two segmentation boundaries, used to assess the boundary differences.
where
represents the distance between point
a and point
b, and
A and
B are the sets of points on the prediction and ground truth, respectively. HD95 measures the 95th percentile of the distances between the two segmentation boundaries, used to assess the boundary differences.
4.1.3. Implementation Details
Our method was implemented on an Nvidia GeForce RTX 3090 20 GB GPU, using input 3D patches of size 128 × 128 × 128 for 400 epochs, with the batch size set to 2, a learning rate of 0.01, and a weight decay of 3 × 10
−5. The initial values of the curvature matrix in CFA were set to
,
, according to Gong [
34]. The curvature diffusion is best when
,
, which are the most favorable for curvature learning. The values in the loss function are set to
and
.
4.2. State-of-the-Art Comparison
This paper mainly uses the meningiomas dataset and the BraTS2021 dataset to verify the results of ECA in medical image tumor segmentation. We compare these results with SOTA 3D image segmentation models, including UNETR [
10], SwinUNETR [
20], nnFormer [
35], UNETR++ [
30], dResU-Net [
36],CU-Net [
37], and nnUNet [
9]. In order to validate the lightweight nature of ECA, it is compared based on FLOPs and Params with other 3D attention mechanisms, including 3D CBAM [
12], 3D SA [
28], HDC [
24], and TDPC [
13]. To ensure fairness of results, the same input and preprocessing strategies are applied to each model. Regarding the hyperparameters of the comparison models, since UNETR, SwinUNETR, nnFormer, and UNETR++ were trained and validated against the BraTS dataset in their original papers, the recommended hyperparameters for the BraTS dataset on the Nvidia GeForce RTX 3090 in their respective codes are used in this paper. All hyperparameters for the models are available in the official code. In addition, to ensure the fairness of the experiments, we retrained each model on both datasets using the same training and testing sets.
4.2.1. Performance on the Meningioma Dataset
This section compares ECA with SOTA methods on the meningioma test set and visualizes the segmentation performance of ECA against other attention mechanisms.
Table 2 shows a performance comparison of SOTA methods on the meningioma test set; the evaluation metrics include DSC, HD95, FLOPs, and Params. As far as DSC is concerned, the higher DSC value represents the higher segmentation accuracy, and ECA performs the best among all the methods (89.22), which is significantly better than the other models. The Transformer is very effective in extracting global information; however, it has a natural disadvantage in extracting local information and cannot perform fine segmentation of tumor edges. Although dResU-Net and CU-Net perform well in terms of accuracy, they have significant issues in edge extraction, which can also be observed from the HD95 metric. nnUNet is very effective at capturing local information, but because it predicts on patches, it lacks the ability to effectively extract global information. ECA, by compressing the whole image, realizes segmentation in the whole image while retaining the global information. In terms of HD95—the lower HD95 represents the more accurate boundary prediction of the model; ECA also performs the best in this metric (2.88), which is significantly better than the other methods. Compared to other 3D attention mechanisms, ECA achieves the best performance in DSC and HD95, with FLOPs of 977.02 and Params of 22.38, while consuming relatively moderate computational resources and showing high segmentation accuracy and boundary processing capabilities. This reflects its superiority and efficiency. This is due to the fact that ECA compresses 3D images into 2D, greatly reducing the computation amount and memory burden while maintaining high performance with low computation.
4.2.2. Performance on the BraTS 2021 Dataset
To verify the robustness of ECA on 3D medical images, we performed experiments comparing ECA with other SOTA models on the BraTS2021 dataset; the results are shown in
Table 3. The main evaluation metrics include DSC and HD95 for different tumor regions. In addition, to verify the efficiency of ECA, we also performed experiments comparing ECA with other 3D image attention on FLOPs and Params. For the WT, TC, and ET regions, ECA achieved values of 83.07, 87.04, and 87.15 for the DSC metrics, respectively, which were higher than the other models. In both WT and ET regions, ECA achieved the lowest HD95 values of 3.69 and 2.26, respectively, which means that it demonstrated good performance in terms of boundary accuracy, but in the TC region—because of the uncertainty in the shape of the TC region and its distribution being relatively scattered—the ECA could not learn the accurate curvature of the TC shape well. In terms of FLOPs and Params, similar to the meningioma dataset, ECA achieved the best performance in DSC and HD95, with FLOPs of 979.01 and Params of 23.02, while consuming relatively moderate computational resources, showing high segmentation accuracy and boundary processing capabilities, reflecting its superiority and efficiency.
4.3. Visualization of the Segmentation Results
4.3.1. Results on the Meningioma Dataset
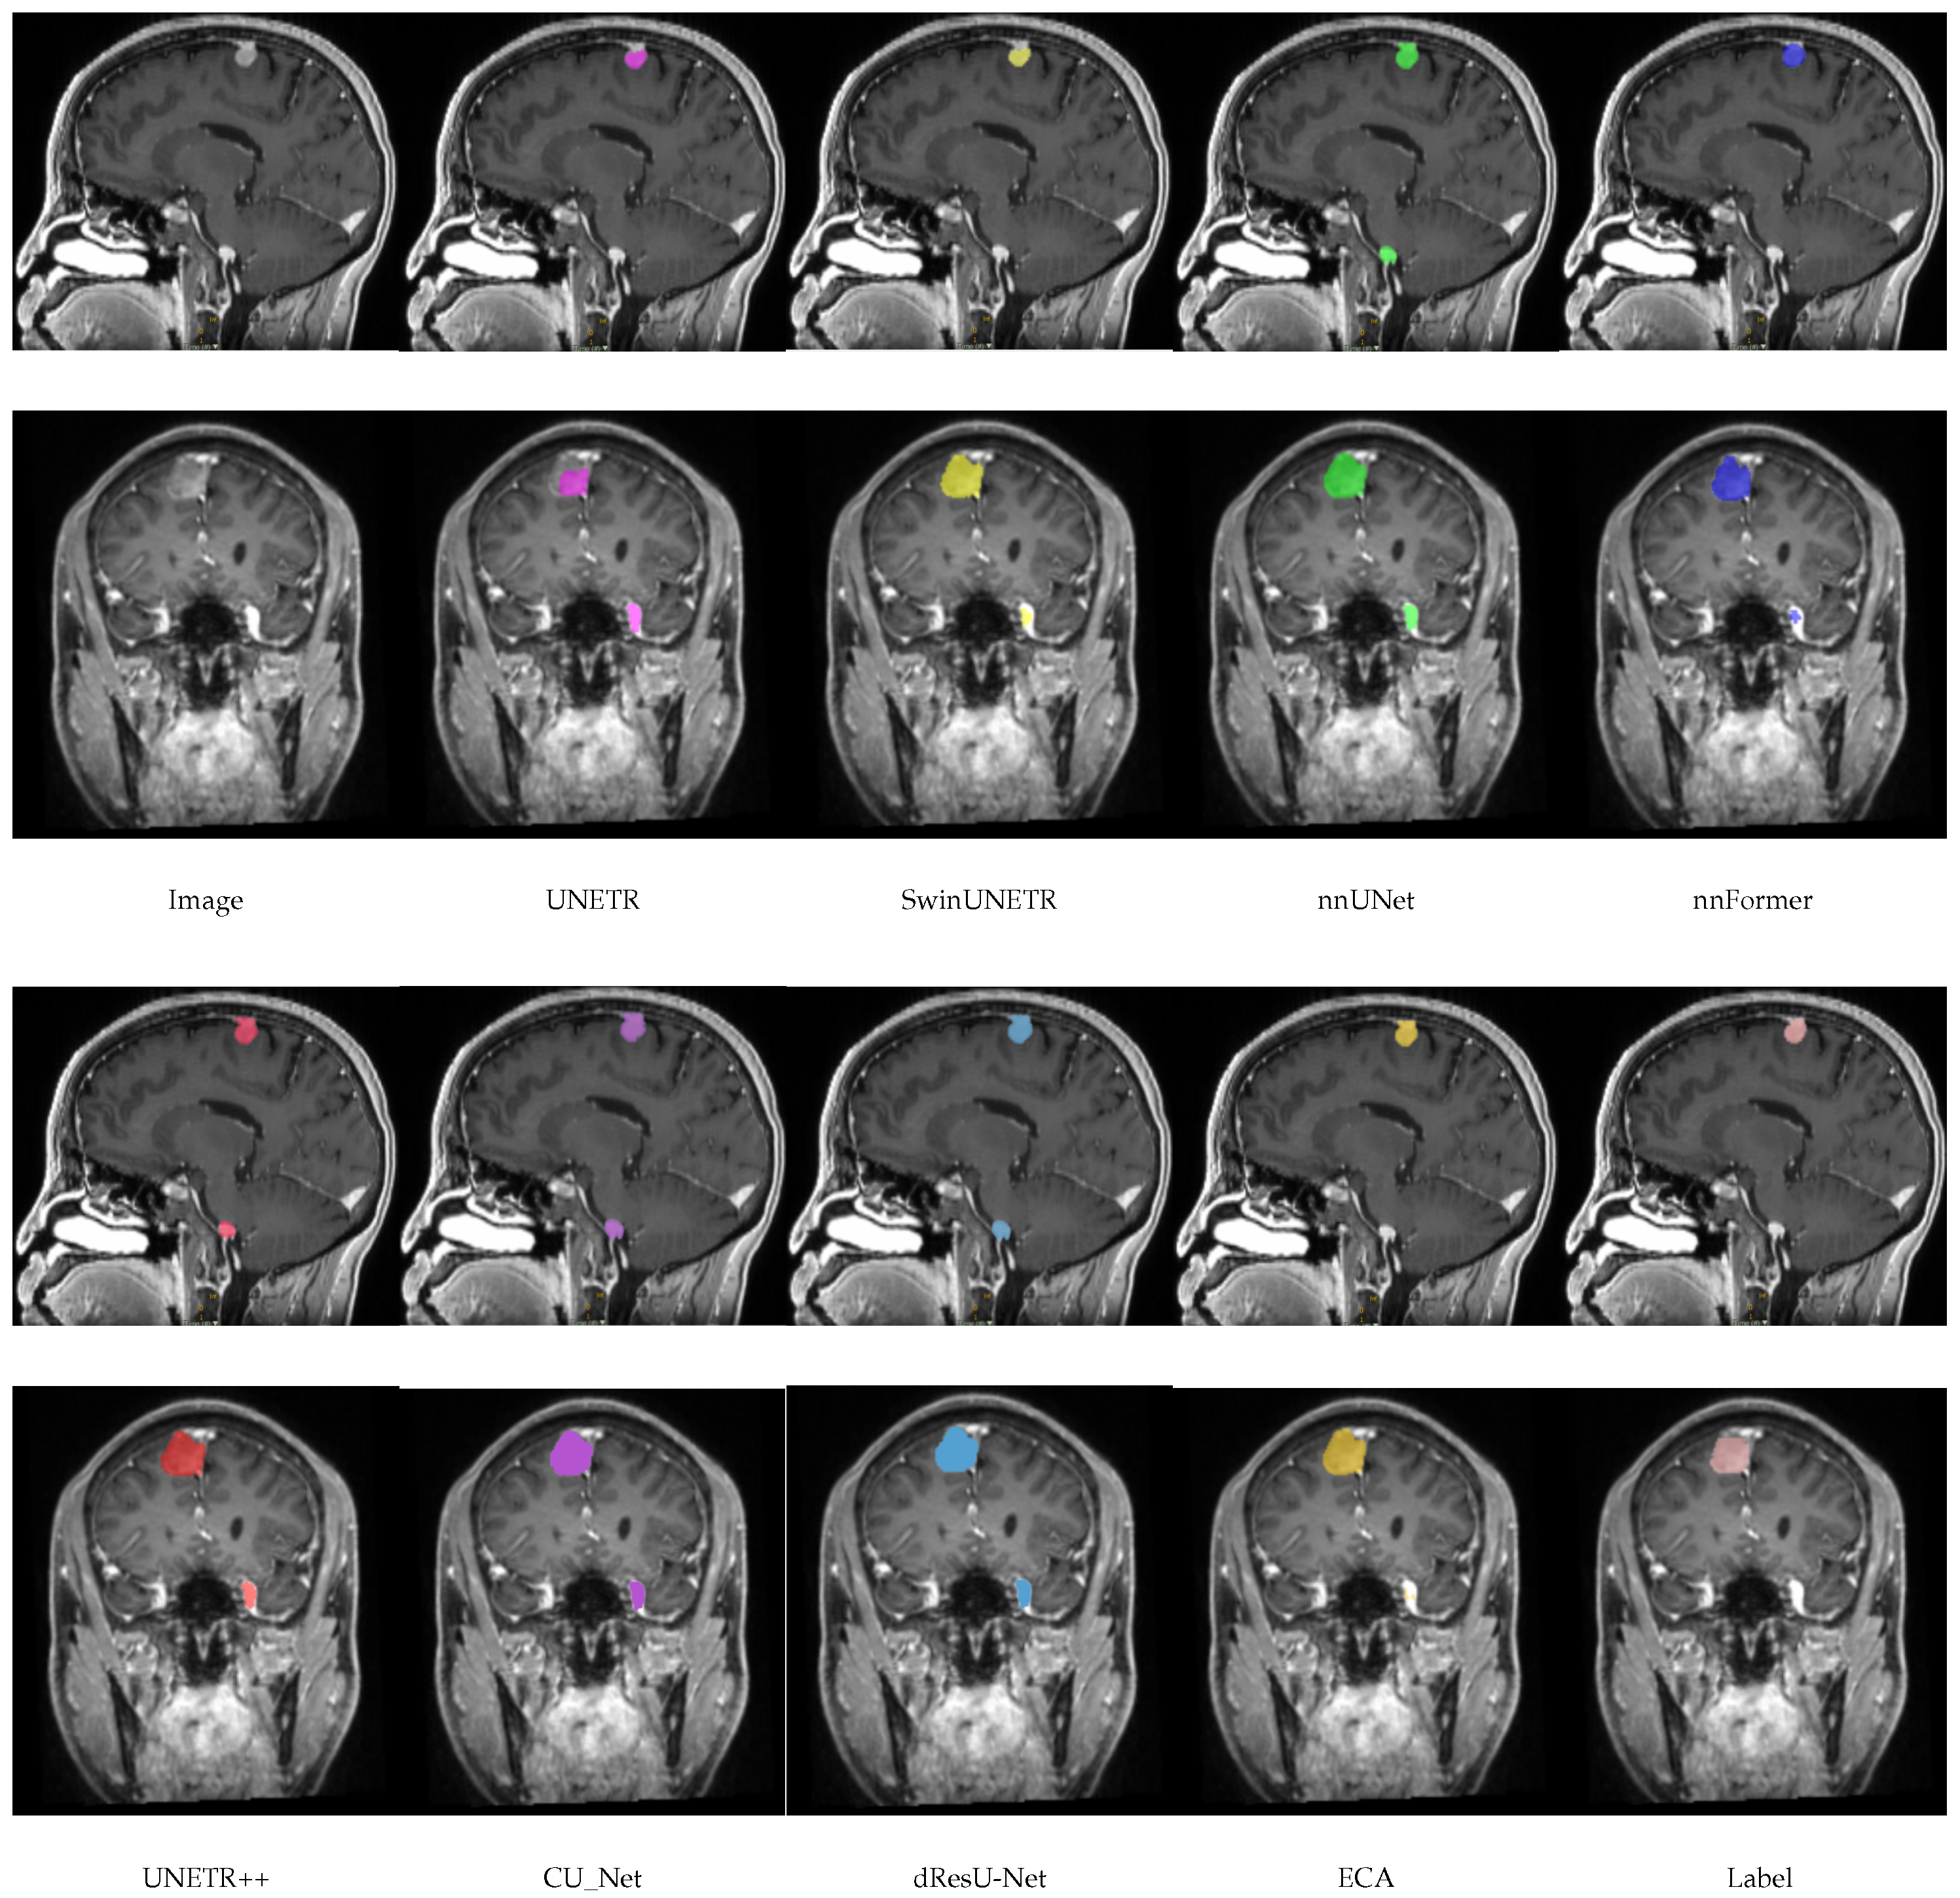
In this section, a comparison of the predictions of the ECA model with other models on the meningioma dataset is shown in
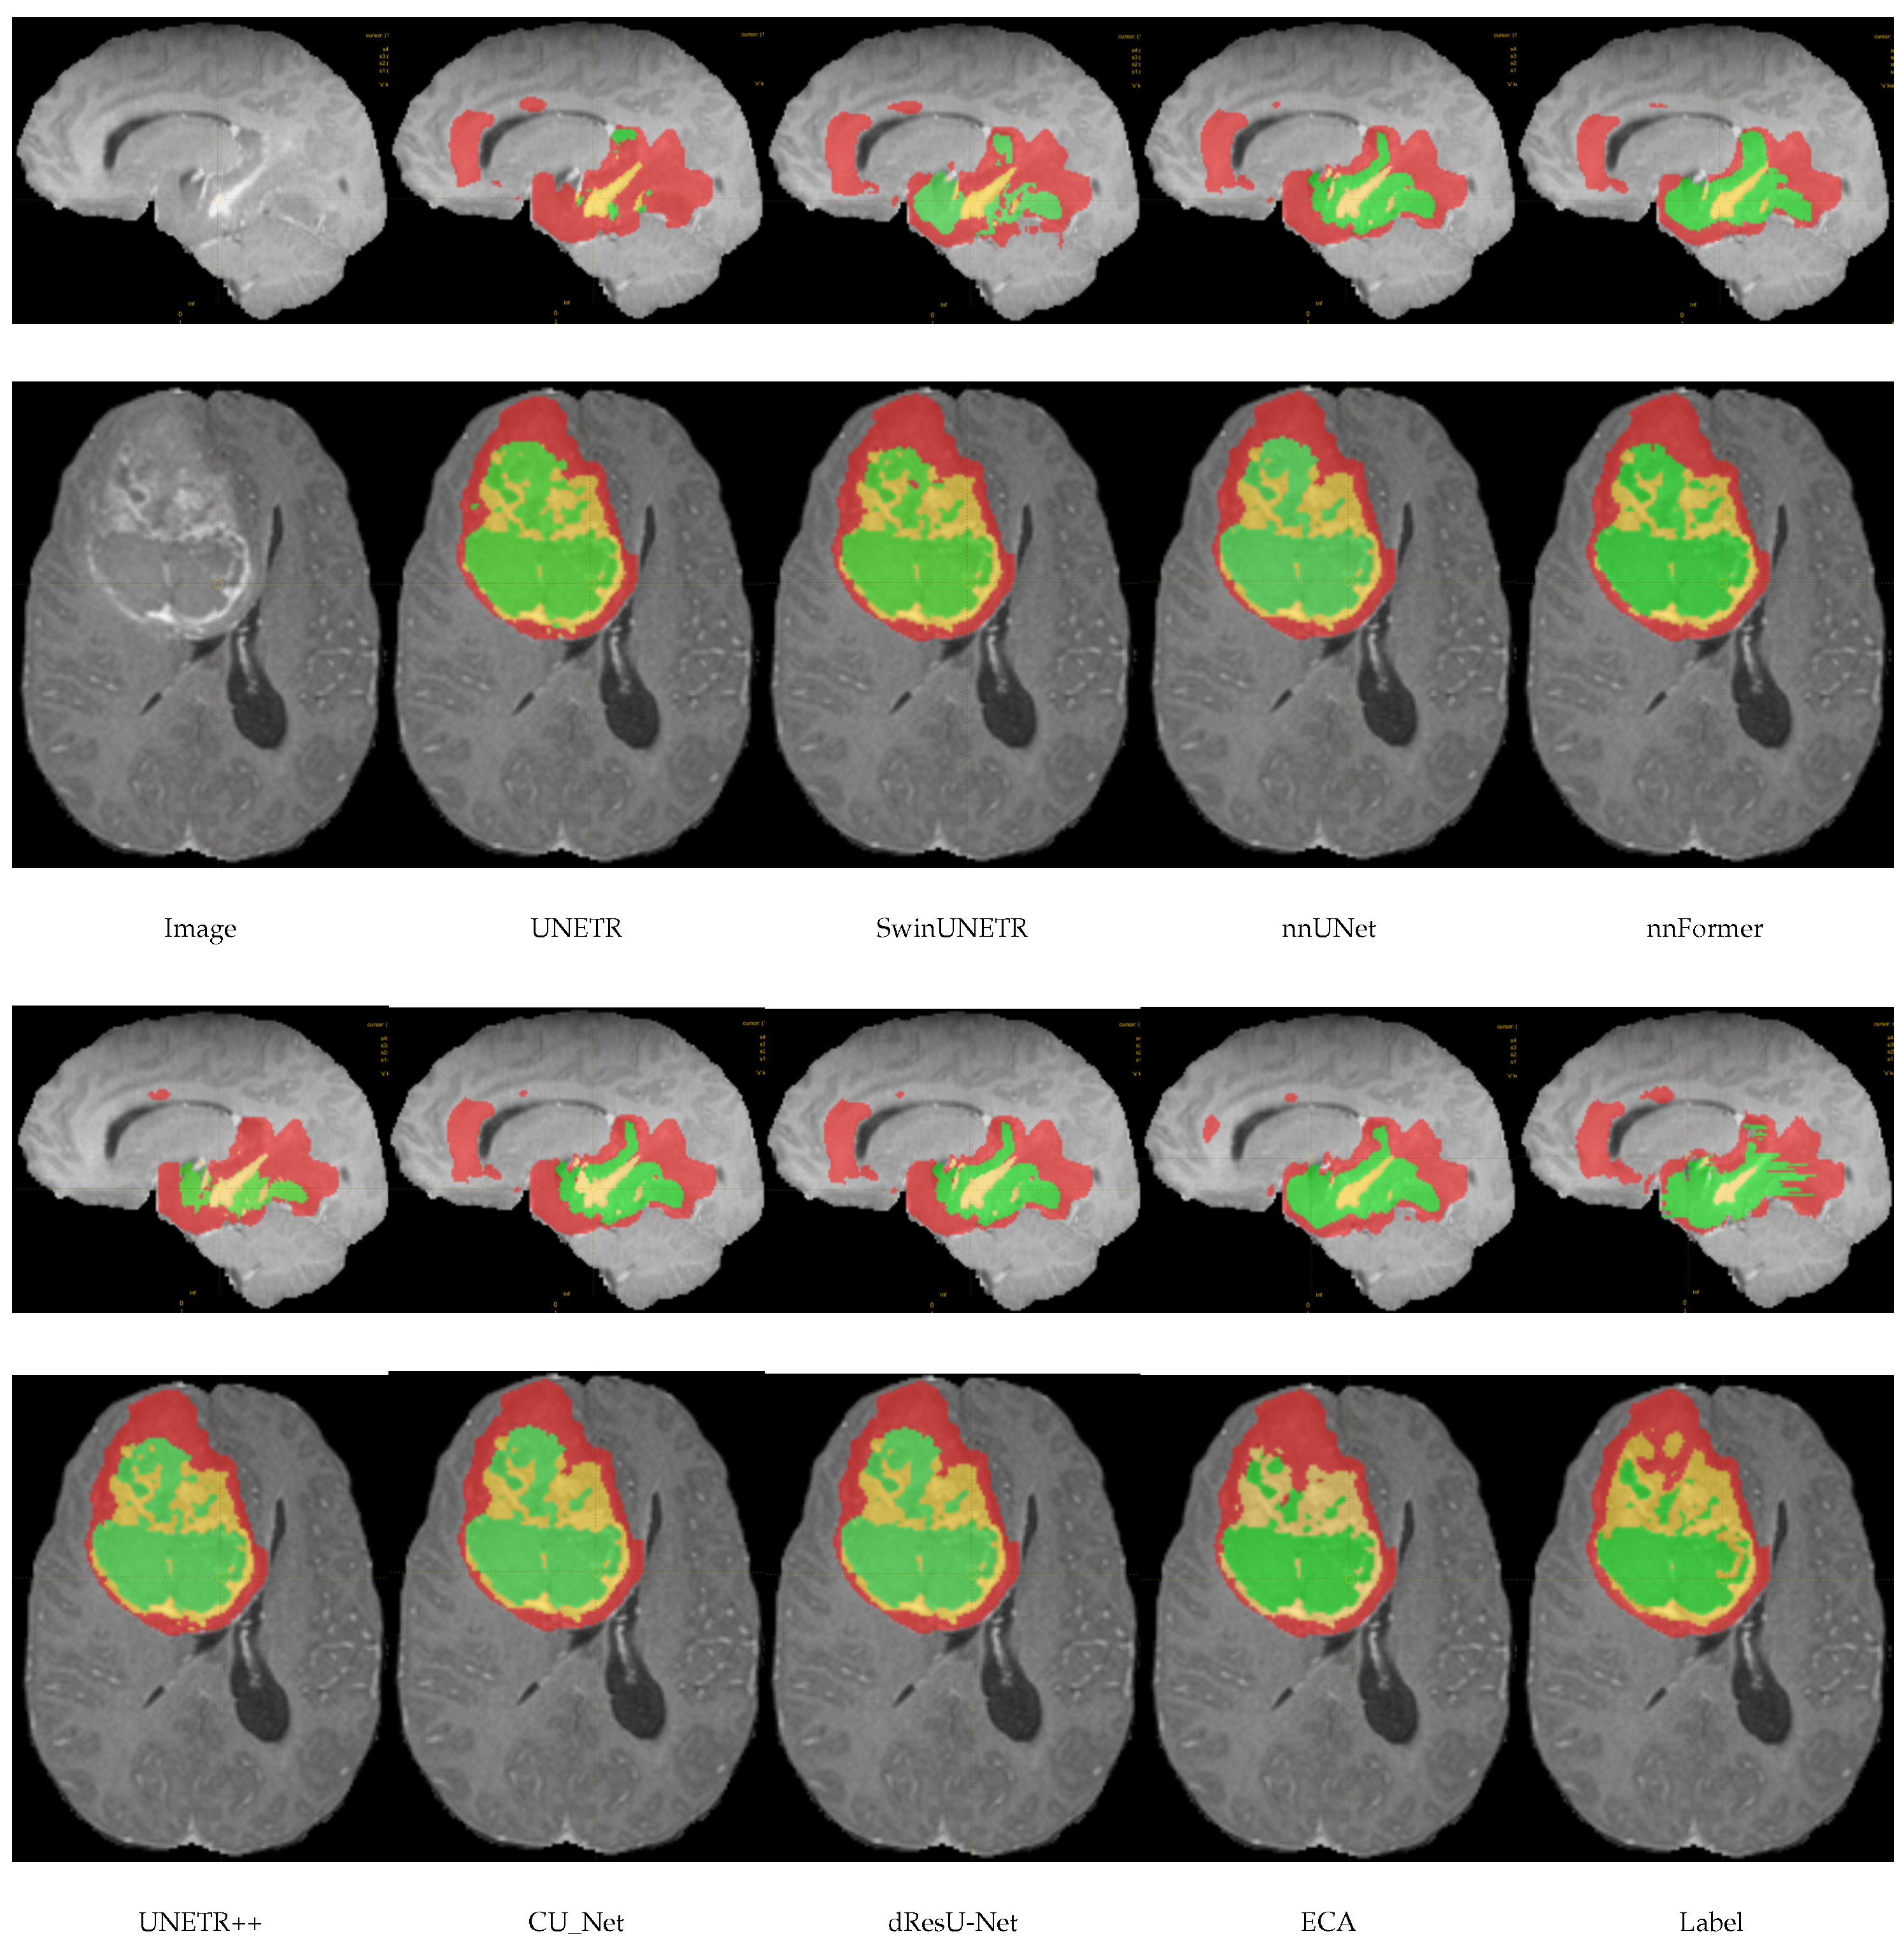
Figure 4. By comparing the segmentation of each model, it can be seen that there are significant differences in the accuracy and boundary clarity of the different models in meningioma segmentation. UNETR’s predictions are unclear at the boundaries, and its segmentation areas are small, failing to segment the whole tumor. In addition, there is an obvious error in SwinUNETR, nnFormer, nnUNet, and UNETR++, that is, these models identify regions that are non-tumors as tumors. Compared with other models, the segmentation by ECA is the closest to the ground truth, especially in the meningioma regions with complex details, indicating that the feature extraction and boundary processing capabilities of ECA are superior.
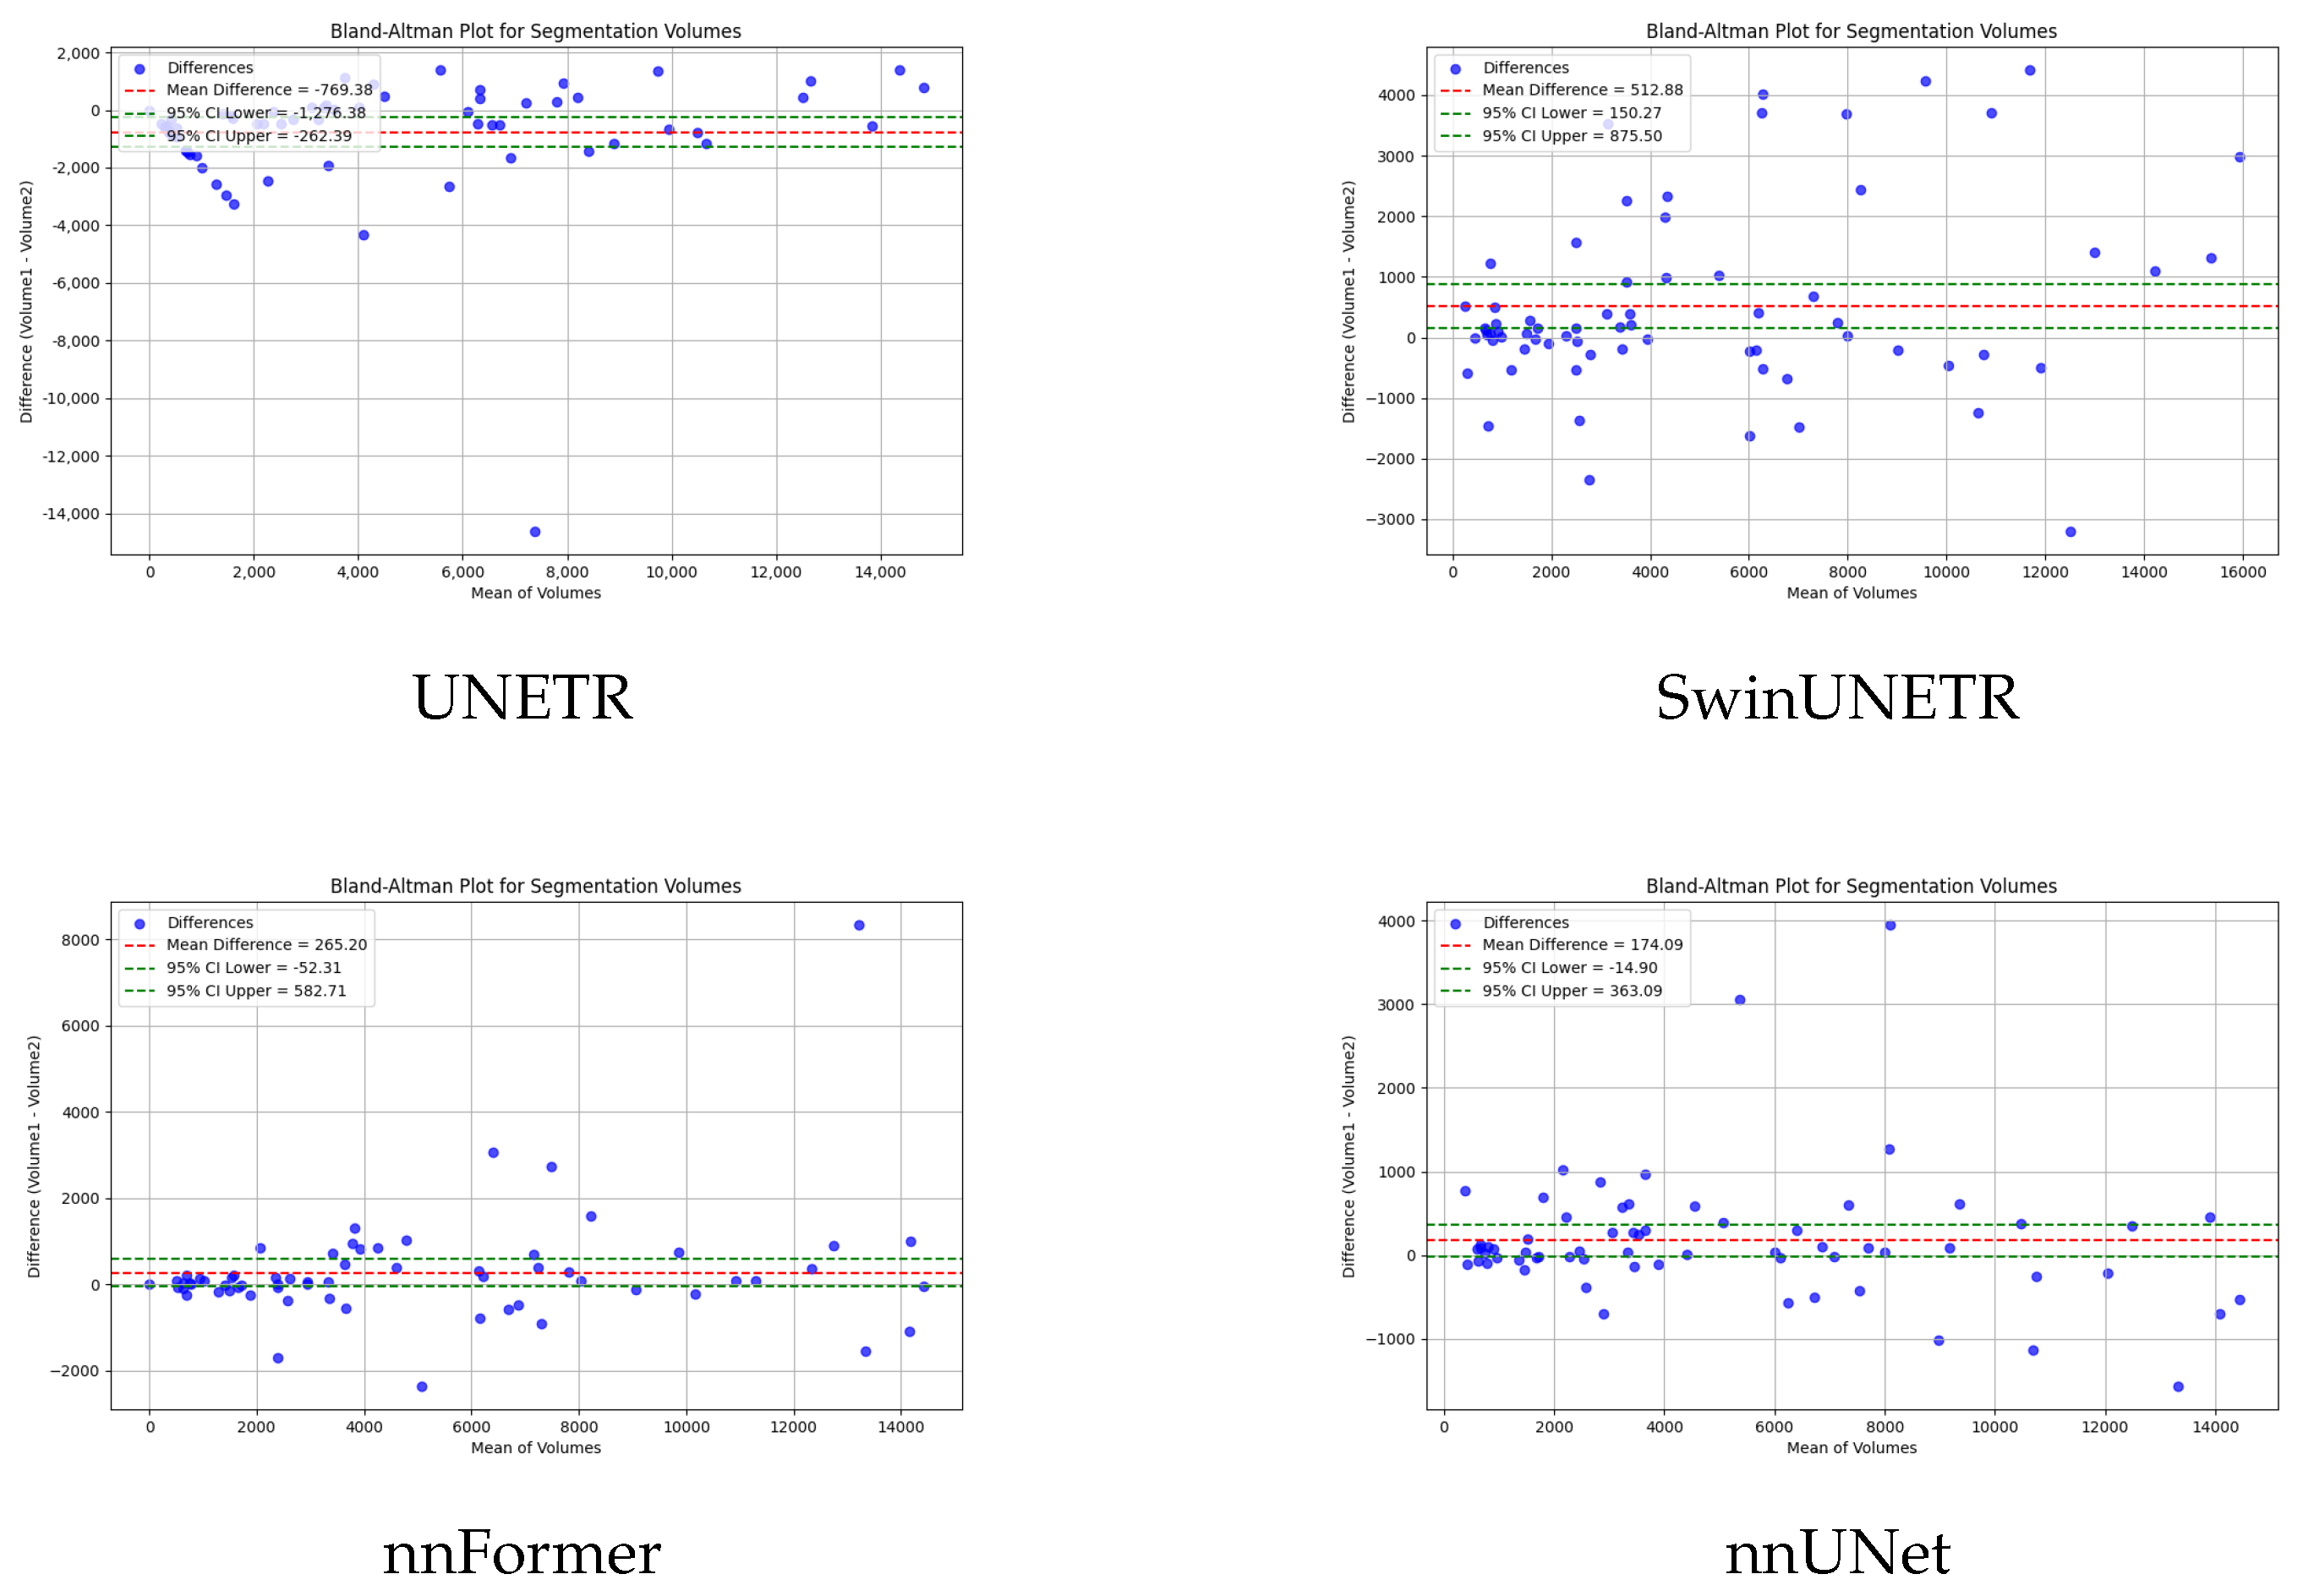
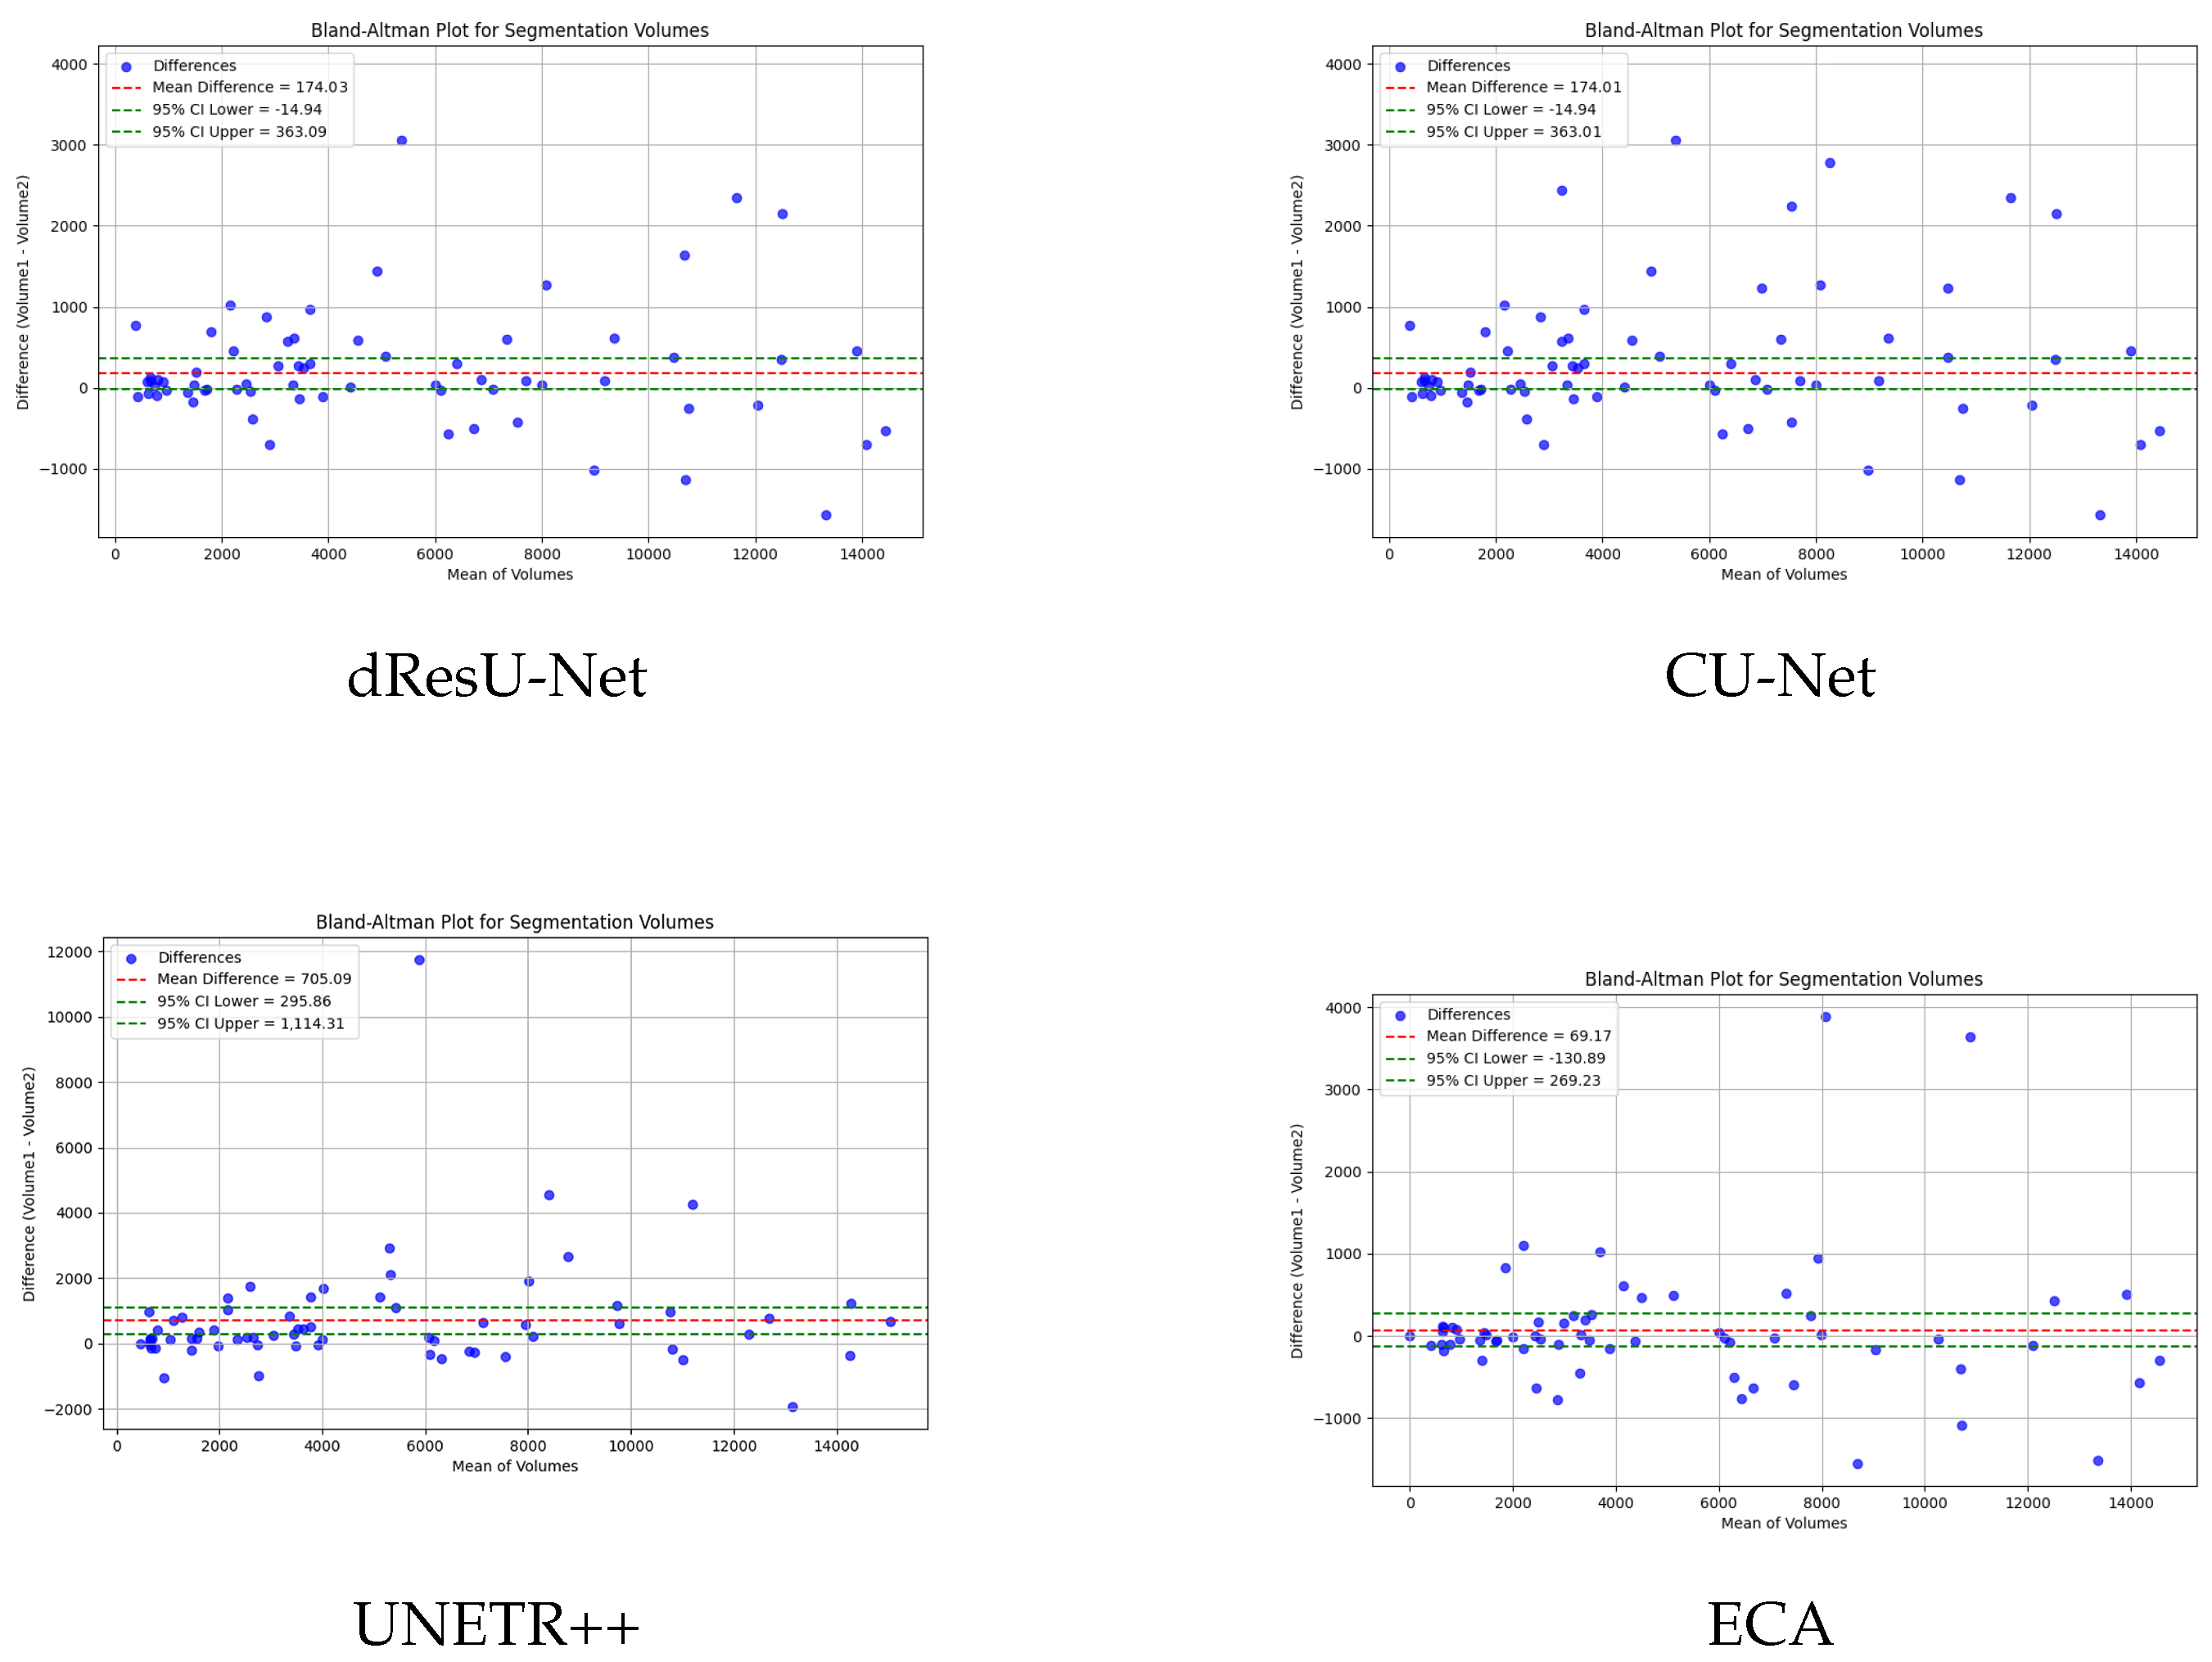
To verify the consistency and bias of ECA in segmenting 3D medical images, bland-altman analysis is used to compare the performance of ECA with other models. The results as shown in
Figure 5, where the horizontal axis of the figure represents the mean value of the segmentation and the vertical axis represents the difference between the actual value and the predicted difference. The closer the difference value is to zero, the higher the consistency of the segmentation. UNETR and SwinUNETR have more fluctuating difference values, and a more dispersed distribution up and down, indicating that they have poor consistency in segmentation. nnFormer and UNETR++ have a relatively small deviation, but still have some data points that are far away from the zero line. ECA possesses the smallest difference values (69.17) and data fluctuations, indicating that the ECA method has the best consistency in segmentation, further validating its superiority in segmentation tasks.
In addition, in order to test the segmentation accuracy of ECA in a noisy environment, we added Gaussian noise to the test set of the meningioma dataset and re-examined the segmentation, as shown in
Table 4, and found that, after the addition of noise, the value of the DSC only decreased by 0.2%, and the difference of the HD95 was 0.12%, which fully demonstrated its superior ability in eliminating noise. Also a visualization of the segmentation after adding noise as shown in
Figure 6 shows the effect of our segmentation.
4.3.2. Result on the BraTS2021 Dataset
In this section, we show a comparison of the prediction results of the ECA model with other models on the BraTS2021 dataset, as shown in
Figure 7. This figure shows the visual segmentation results of different models on the BraTS2021 dataset. Green, red, and yellow are used in the image to mark WT, TC, and ET, respectively. ECA showed high accuracy in the segmentations of all three regions. Compared with other models, the ECA model is able to capture the edges and shapes of the tumor more accurately, especially in the segmentation of the ET region. UNETR, SwinUNETR, and nnFormer may focus too much on capturing global information and the lack of local details, resulting in the accuracy in some regions, especially at the boundary between the TC and the ET, where the segmentation results of the model may not be sufficiently fine, with insufficient edge smoothing. dResU-Net and CU-Net are inadequate for edge extraction.
4.4. Ablation Experiments
This section evaluates the effects of using EGA and CFA separately for ECA, as well as the impacts of different selection ratios in EGA on the performance of the entire attention mechanism. These ablation experiments were conducted separately and validated on the meningioma dataset and the BraTS2021 dataset. We embedded ECA into the nnUNet framework, following the same training strategies mentioned earlier to ensure a fair comparison.
4.4.1. The Impact of EGA and CFA
This section focuses on analyzing the effects of EGA and CFA on the task of meningioma segmentation. ECA mainly contains two kinds of attention, EGA and CFA, and the effects of these two modules on the segmentation accuracy are verified by adding these modules, respectively.
As shown in
Table 5, when only the EGA module is introduced in the meningioma dataset, the model performance is significantly improved, proving its effectiveness in the segmentation task. However, when CFA is to be used on its own, the performance declines significantly. This is due to the fact that CFA is overly sensitive to edges and tends to reinforce many noisy regions as features, leading to poor results. Therefore, it is important to place EGA before CFA because EGA is able to filter out noise feature regions and enhance critical feature regions based on information entropy. This synergy improves the accuracy of segmentation. The advantages of integrating these two modules are also validated by the results on the BraTS2021 dataset. With the BraTS2021 dataset—since it does not have much noise interference—after adding the CFA module alone, the DSC in the WT region rises slightly to 82.03, the DSC in the ET rises to 86.22, and the HD95 decreases to 2.41 in the ET region, indicating that CFA has a certain role in enhancing the segmentation accuracy. After adding the EGA and CFA modules simultaneously, the overall segmentation performance is significantly improved; the DSC values of WT, TC, and ET reach 83.07, 87.04, and 87.15, respectively, and the HD95 values decrease to 3.69 and 2.26 in the WT and ET regions. This indicates that the optimal combination of the ECA module is effective at improving the accuracy and reducing the error.
4.4.2. The Impact of Selecting the Regional Range in EGA
In order to verify the effects of different region selection ratios in EGA on the segmentation effect, we conducted validation experiments, as shown in
Table 6, which compares the segmentation performance metrics under five different selected ratios, including DSC and HD95. DSC and HD95 generally improved when the ratio was increased from 0.0 to 0.4 on the meningioma dataset, indicating that appropriate region selection ratios can improve segmentation performance. At a ratio of 0.4, the DSC reaches an optimal value of 89.22 and HD95 reaches an optimal value of 2.88, indicating that the EGA module performs best at this ratio. As the ratio further increases to 0.8, the segmentation performance starts to decrease, the DSC decreases, and HD95 tends to increase, indicating that choosing too high of a ratio may lead to a decrease in segmentation effectiveness. In the BraTS2021 dataset, similar to the meningioma dataset, the DSC reaches its highest value at a ratio of 0.4, and HD95 reaches its minimum value. This indicates that the EGA module is able to better balance the DSC and HD95 metrics at this ratio. The segmentation performance decreases at either too low or too high a ratio.
4.4.3. Visualization of ECA Performance in Tumor Identification
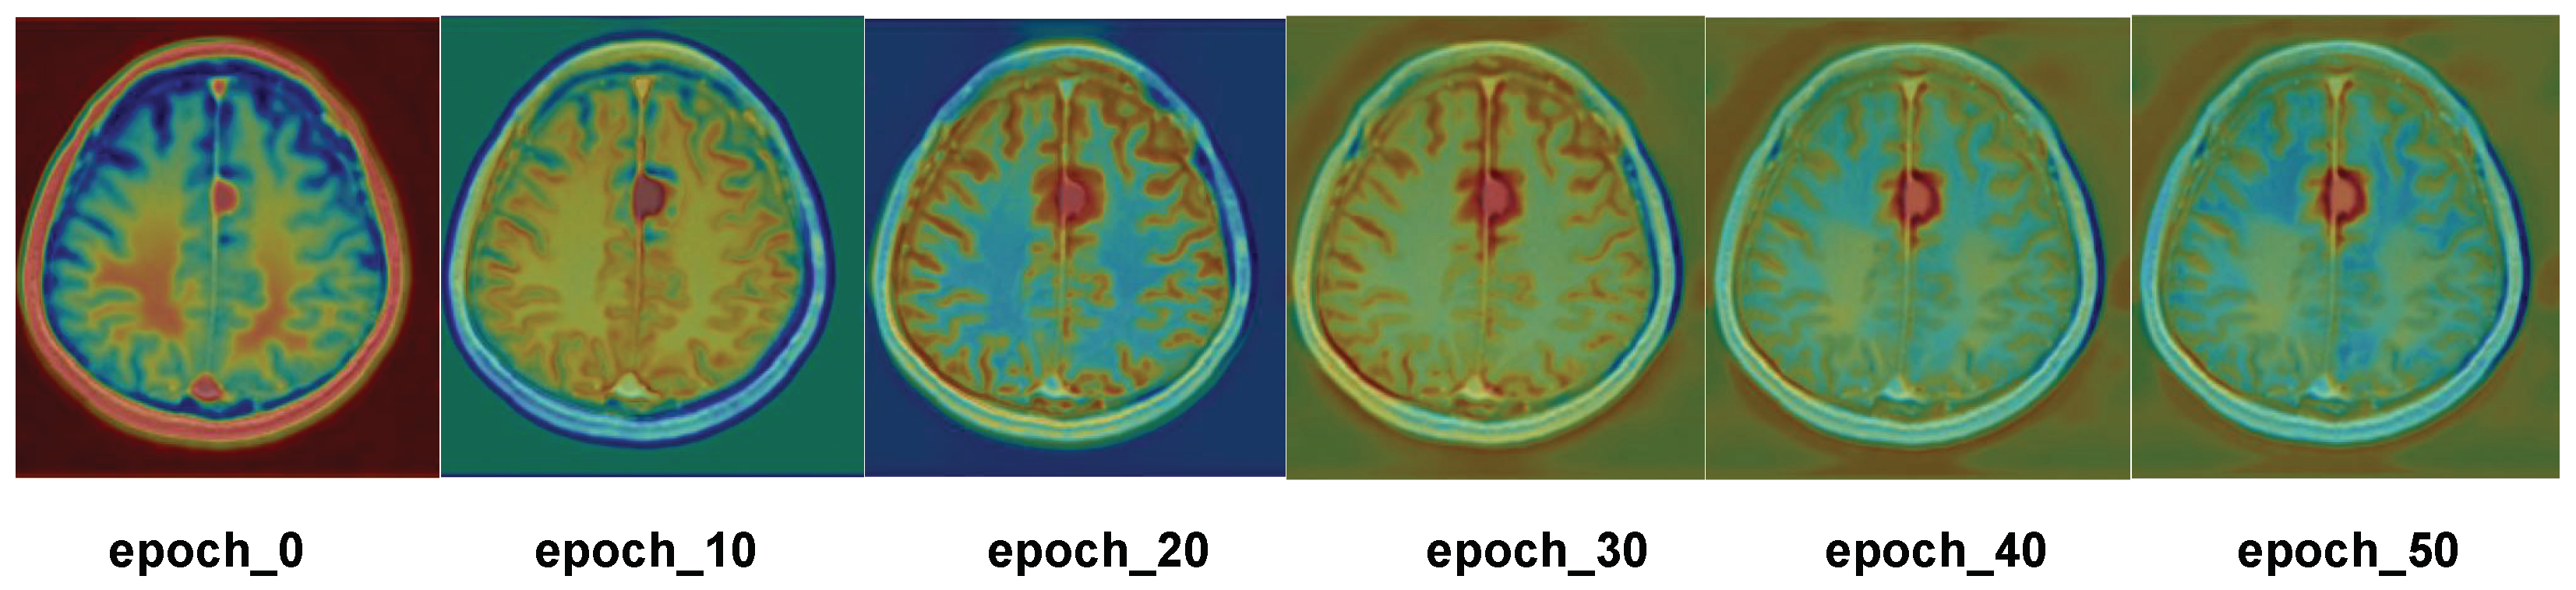
To better observe the areas of focus of ECA, heatmap results are generated from the first 50 epochs of training on the meningioma dataset, as shown in
Figure 8. In this figure, the red region indicates where the model’s attention is focused, reflecting the important region that the model considers relevant to the segmentation target; the more obvious the red color is, the more attention the model pays to that region. The six subgraphs in the figure correspond to different epochs in the training process, namely, epochs 0, 10, 20, 30, 40, and 50. It can be seen that, in the initial stage of training, the heatmap color is mainly concentrated in the image’s edge region, which indicates that the model’s attention distribution is more dispersed in the initial stage, and it pays less attention to the key regions of the image. As the number of epochs increases, ECA accurately locates the tumor region, which fully demonstrates that ECA is able to quickly locate the tumor region for segmentation operations when segmenting meningioma.
5. Discussion
The results on the meningioma dataset and BraTS2021 dataset prove the model’s effectiveness, which further improves segmentation accuracy while reducing computational and memory burdens. However, despite the good performance, the proposed method still has some limitations and deserves further study.
This method performs dimensionality reduction using TSP, removes noise interference using EGA, and then extracts the edges using CFA because CFA gradually learns to form the shape of the tumor. This method is more applicable in tumor segmentation, but its generalization to other datasets, such as for blood vessel segmentation, should still be investigated. In addition, due to the lightweight nature of the model, it can be considered to continue its lightweight operation, and perhaps attempt to apply it to meningioma surgical video segmentation in subsequent studies.
6. Conclusions
In this paper, a novel plug-and-play attention module for meningioma segmentation is proposed. This attention mainly includes the following three key components: TSP, EGA, and CFA. TSP compresses the global feature information of 3D meningiomas into three 2D feature maps, achieving dimensionality reduction without loss of information and significantly reducing the computational burden and memory requirements. After dimension reduction, region selection and feature enhancement are performed through EGA. Finally, edge information is enhanced by extracting it through CFA. Experiments were conducted on the meningioma dataset provided by the Department of Neurosurgery at West China Hospital, and its robustness was verified on the BraTS2021 dataset. The results show that ECA has superior performance.
Author Contributions
Conceptualization, Y.G.; Methodology, Y.G., X.X., J.L.; Validation, Y.G.; Formal analysis, Y.G., Y.Y.; Investigation, Y.G., X.X.; Writing—original draft, Y.G.; Writing—review & editing, Y.G., L.Z. (Lei Zhang) and J.L.; Visualization, Y.G., L.Z. (Leyi Zhang). All authors have read and agreed to the published version of the manuscript.
Funding
This research was funded by the National Science Fund for Distinguished Young Scholars (No. 62025601), relevant NSFC scientific departments are responsible for handling applications.
Institutional Review Board Statement
The study was conducted in accordance with the Declaration of Helsinki, and approved by Ethics Committee on Biomedical Research, West China Hospital of Sichuan University (No. 851 and 4 June 2021).
Informed Consent Statement
Patient consent was waived due to Ethics Committee on Biomedical Research, West China Hospital of Sichuan University has passed the waiver of informed consent.
Data Availability Statement
The original contributions presented in this study are included in the article. Further inquiries can be directed to the corresponding author.
Acknowledgments
The Meningioma Dataset for this work was provided by Chaoyue Chen from the West China Hospital.
Conflicts of Interest
The authors declare that they have no competing financial interests that could affect this research.
References
- Park, Y.W.; Oh, J.; You, S.C.; Han, K.; Ahn, S.S.; Choi, Y.S.; Chang, J.H.; Kim, S.H.; Lee, S.-K. Radiomics and machine learning may accurately predict the grade and histological subtype in meningiomas using conventional and diffusion tensor imaging. Eur. Radiol. 2019, 29, 4068–4076. [Google Scholar] [PubMed]
- Driver, J.; Hoffman, S.E.; Tavakol, S.; Woodward, E.; Maury, E.A.; Bhave, V.; Greenwald, N.F.; Nassiri, F.; Aldape, K.; Zadeh, G.; et al. A molecularly integrated grade for meningioma. Neuro-Oncology 2022, 24, 796–808. [Google Scholar] [PubMed]
- Louis, D.N.; Perry, A.; Reifenberger, G.; Deimling, A.V.; Figarella-Branger, D.; Cavenee, W.K.; Ohgaki, H.; Wiestler, O.D.; Kleihues, P.; Ellison, D.W. The 2016 World Health Organization classification of tumors of the central nervous system: A summary. Acta Neuropathol. 2016, 131, 803–820. [Google Scholar] [PubMed]
- Preusser, M.; Brastianos, P.K.; Mawrin, C. Advances in meningioma genetics: Novel therapeutic opportunities. Nat. Rev. Neurol. 2018, 14, 106–115. [Google Scholar]
- Zimmerman, R.D.; Fleming, C.A.; Saint-Louis, L.A.; Lee, B.C.; Manning, J.J.; Deck, M.D. Magnetic resonance imaging of meningiomas. Am. J. Neuroradiol. 1985, 6, 149–157. [Google Scholar]
- Kent, C.L.; Mowery, Y.M.; Babatunde, O.; Wright, A.O.; Barak, I.; McSherry, F.; Friedman, A.H.; Zomorodi, A.; Peters, K.; Desjardins, A.; et al. Long-term outcomes for patients with atypical or malignant meningiomas treated with or without radiation therapy: A 25-year retrospective analysis of a single-institution experience. Adv. Radiat. Oncol. 2022, 7, 100878. [Google Scholar]
- Ronneberger, O.; Fischer, P.; Brox, T. U-net: Convolutional networks for biomedical image segmentation. In Medical Image Computing and Computer-Assisted Intervention–MICCAI 2015; Springer: Berlin/Heidelberg, Germany, 2015; pp. 234–241. [Google Scholar]
- Zhou, Z.; Siddiquee, M.M.R.; Tajbakhsh, N.; Liang, J. Unet++: Redesigning skip connections to exploit multiscale features in image segmentation. IEEE Trans. Med. Imaging 2019, 39, 1856–1867. [Google Scholar]
- Isensee, F.; Petersen, J.; Klein, A.; Zimmerer, D.; Jaeger, P.F.; Kohl, S.; Wasserthal, J.; Koehler, G.; Norajitra, T.; Wirkert, S.; et al. nnu-net: Self-adapting framework for u-net-based medical image segmentation. arXiv 2018, arXiv:1809.10486. [Google Scholar]
- Hatamizadeh, A.; Tang, Y.; Nath, V.; Yang, D.; Myronenko, A.; Landman, B.; Roth, H.R.; Xu, D. Unetr: Transformers for 3d medical image segmentation. In Proceedings of the IEEE/CVF Winter Conference on Applications of Computer Vision, Waikoloa, HI, USA, 3–8 January 2022; pp. 574–584. [Google Scholar]
- Hu, J.; Shen, L.; Sun, G. Squeeze-and-excitation networks. In Proceedings of the IEEE Conference on Computer Vision and Pattern Recognition, Salt Lake City, UT, USA, 18–22 June 2018; pp. 7132–7141. [Google Scholar]
- Woo, S.; Park, J.; Lee, J.-Y.; Kweon, I.S. Cbam: Convolutional block attention module. In Proceedings of the European Conference on Computer Vision (ECCV), Munich, Germany, 8–14 September 2018; pp. 3–19. [Google Scholar]
- Li, Y.; Kang, J. TDPC-Net: Multi-scale lightweight and efficient 3D segmentation network with a 3D attention mechanism for brain tumor segmentation. Biomed. Signal Process. Control 2025, 99, 106911. [Google Scholar]
- Abdollahi, A.; Pradhan, B.; Alamri, A. VNet: An end-to-end fully convolutional neural network for road extraction from high-resolution remote sensing data. IEEE Access 2020, 8, 179424–179436. [Google Scholar]
- He, K.; Zhang, X.; Ren, S.; Sun, J. Deep residual learning for image recognition. In Proceedings of the IEEE Conference on Computer Vision and Pattern Recognition, Las Vegas, NV, USA, 27–30 June 2016; pp. 770–778. [Google Scholar]
- Wang, J.; Gao, J.; Ren, J.; Luan, Z.; Yu, Z.; Zhao, Y.; Zhao, Y. DFP-ResUNet: Convolutional neural network with a dilated convolutional feature pyramid for multimodal brain tumor segmentation. Comput. Methods Programs Biomed. 2021, 208, 106208. [Google Scholar] [CrossRef] [PubMed]
- Chang, H.-H.; Yeh, S.-J.; Chiang, M.-C.; Hsieh, S.-T. RU-Net: Skull stripping in rat brain MR images after ischemic stroke with rat U-Net. BMC Med. Imaging 2023, 23, 44. [Google Scholar] [CrossRef] [PubMed]
- Chen, J.; Lu, Y.; Yu, Q.; Luo, X.; Adeli, E.; Wang, Y.; Lu, L.; Yuille, A.L.; Zhou, Y. Transunet: Transformers make strong encoders for medical image segmentation. arXiv 2021, arXiv:2102.04306. [Google Scholar]
- Karimi, D.; Vasylechko, S.D.; Gholipour, A. Convolution-free medical image segmentation using transformers. In Medical Image Computing and Computer Assisted Intervention–MICCAI 2021; Springer: Berlin/Heidelberg, Germany, 2021; pp. 78–88. [Google Scholar]
- He, Y.; Nath, V.; Yang, D.; Tang, Y.; Myronenko, A.; Xu, D. Swinunetr-v2: Stronger swin transformers with stagewise convolutions for 3d medical image segmentation. In International Conference on Medical Image Computing and Computer-Assisted Intervention; Springer: Berlin/Heidelberg, Germany, 2023; pp. 416–426. [Google Scholar]
- Liu, Z.; Lin, Y.; Cao, Y.; Hu, H.; Wei, Y.; Zhang, Z.; Lin, S.; Guo, B. Swin transformer: Hierarchical vision transformer using shifted windows. In Proceedings of the IEEE/CVF International Conference on Computer Vision, Montreal, BC, Canada, 11–17 October 2021; pp. 10012–10022. [Google Scholar]
- Vaswani, A.; Shazeer, N.; Parmar, N.; Uszkoreit, J.; Jones, L.; Gomez, A.N.; Kaiser, Ł.; Polosukhin, I. Attention is all you need. In Proceedings of the Advances in Neural Information Processing Systems 30: Annual Conference on Neural Information Processing Systems 2017, Long Beach, CA, USA, 4–9 December 2017. [Google Scholar]
- Fu, J.; Liu, J.; Tian, H.; Li, Y.; Bao, Y.; Fang, Z.; Lu, H. Dual attention network for scene segmentation. In Proceedings of the IEEE/CVF Conference on Computer Vision and Pattern Recognition, Long Beach, CA, USA, 15–20 June 2019; pp. 3146–3154. [Google Scholar]
- Luo, Z.; Jia, Z.; Yuan, Z.; Peng, J. HDC-Net: Hierarchical decoupled convolution network for brain tumor segmentation. IEEE J. Biomed. Health Inform. 2020, 25, 737–745. [Google Scholar] [CrossRef]
- Wang, K.; Zhang, X.; Zhang, X.; Lu, Y.; Huang, S.; Yang, D. EANet: Iterative edge attention network for medical image segmentation. Pattern Recognit. 2022, 127, 108636. [Google Scholar] [CrossRef]
- Georgescu, M.-I.; Ionescu, R.T.; Miron, A.-I.; Savencu, O.; Ristea, N.-C.; Verga, N.; Khan, F.S. Multimodal multi-head convolutional attention with various kernel sizes for medical image super-resolution. In Proceedings of the IEEE/CVF Winter Conference on Applications of Computer Vision, Waikoloa, HI, USA, 2–7 January 2023; pp. 2195–2205. [Google Scholar]
- Li, H.; Nan, Y.; Ser, J.D.; Yang, G. Large-kernel attention for 3D medical image segmentation. Cogn. Comput. 2024, 16, 2063–2077. [Google Scholar] [CrossRef]
- Cao, Y.; Zhou, W.; Zang, M.; An, D.; Feng, Y.; Yu, B. MBANet: A 3D convolutional neural network with multi-branch attention for brain tumor segmentation from MRI images. Biomed. Signal Process. Control 2023, 80, 104296. [Google Scholar] [CrossRef]
- Zhu, L.; Wang, X.; Ke, Z.; Zhang, W.; Lau, R.W.H. Biformer: Vision transformer with bi-level routing attention. In Proceedings of the IEEE/CVF Conference on Computer Vision and Pattern Recognition, Vancouver, BC, Canada, 18–22 June 2023; pp. 10323–10333. [Google Scholar]
- Shaker, A.M.; Maaz, M.; Rasheed, H.; Khan, S.; Yang, M.-H.; Khan, F.S. UNETR++: Delving into efficient and accurate 3D medical image segmentation. IEEE Trans. Med. Imaging 2024, 40, 3377–3390. [Google Scholar] [CrossRef]
- Li, X.; Sun, X.; Meng, Y.; Liang, J.; Wu, F.; Li, J. Dice loss for data-imbalanced NLP tasks. arXiv 2019, arXiv:1911.02855. [Google Scholar]
- Zhang, Z.; Sabuncu, M. Generalized cross entropy loss for training deep neural networks with noisy labels. Adv. Neural Inf. Process. Syst. 2018, 31, 8778–8788. [Google Scholar]
- Baid, U.; Ghodasara, S.; Mohan, S.; Bilello, M.; Calabrese, E.; Colak, E.; Farahani, K.; Kalpathy-Cramer, J.; Kitamura, F.C.; Pati, S.; et al. The rsna-asnr-miccai brats 2021 benchmark on brain tumor segmentation and radiogenomic classification. arXiv 2021, arXiv:2107.02314. [Google Scholar]
- Gong, Y.; Sbalzarini, I.F. Curvature filters efficiently reduce certain variational energies. IEEE Trans. Image Process. 2017, 26, 1786–1798. [Google Scholar] [CrossRef] [PubMed]
- Zhou, H.-Y.; Guo, J.; Zhang, Y.; Han, X.; Yu, L.; Wang, L.; Yu, Y. nnformer: Volumetric medical image segmentation via a 3d transformer. IEEE Trans. Image Process. 2023, 32, 4036–4045. [Google Scholar] [CrossRef] [PubMed]
- Raza, R.; Bajwa, U.I.; Mehmood, Y.; Anwar, M.W.; Jamal, M.H. dResU-Net: 3D deep residual U-Net based brain tumor segmentation from multimodal MRI. Biomed. Signal Process. Control 2023, 79, 103861. [Google Scholar]
- Zhang, Q.; Qi, W.; Zheng, H.; Shen, X. Cu-net: A u-net architecture for efficient brain-tumor segmentation on brats 2019 dataset. In Proceedings of the 2024 4th International Conference on Machine Learning and Intelligent Systems Engineering (MLISE), Zhuhai, China, 28–30 June 2024. [Google Scholar]
| Disclaimer/Publisher’s Note: The statements, opinions and data contained in all publications are solely those of the individual author(s) and contributor(s) and not of MDPI and/or the editor(s). MDPI and/or the editor(s) disclaim responsibility for any injury to people or property resulting from any ideas, methods, instructions or products referred to in the content. |
© 2025 by the authors. Licensee MDPI, Basel, Switzerland. This article is an open access article distributed under the terms and conditions of the Creative Commons Attribution (CC BY) license (https://creativecommons.org/licenses/by/4.0/).


