Article

Application of Simulation Methods and Image Processing Techniques in Rock Blasting and Fragmentation Optimization

1
Hubei Key Laboratory of Blasting Engineering, Jianghan University, Wuhan 430056, China
2
School of Highway, Chang’an University, Xi’an 710064, China
*
Authors to whom correspondence should be addressed.
Appl. Sci. 2025, 15(6), 3365; https://doi.org/10.3390/app15063365
Submission received: 21 February 2025 / Revised: 15 March 2025 / Accepted: 17 March 2025 / Published: 19 March 2025
(This article belongs to the Section Earth Sciences)

Abstract

:
Rock fragmentation is a key indicator for evaluating the effects of rock blasting and directly impacts subsequent excavation efficiency. However, predicting rock fragmentation outcomes is challenging due to the complex physical and chemical processes involved in explosive detonation. In this study, a simulation and analysis method for rock blasting fragmentation effects was developed by integrating the finite element method with image processing technology. To validate the reliability of this method, onsite blasting experiments were conducted. Furthermore, the rock blasting parameter of blast hole spacing was optimized based on this proposed method. The results showed that explosive blasting processes vary depending on the charge. Specifically, using water as a decoupling medium led to better blasting outcomes compared to air-decoupled charges. Due to the directional effects along the cylindrical charge, the explosive loading on the blast hole wall first increases and then stabilizes. The method’s feasibility is supported by the good agreement between the gradation curves of rock fragments obtained through onsite sieving tests and simulations in the 50–300 mm range. Additionally, the approach was used to optimize blasting parameters, ensuring that the fragment size distribution curve met the project requirements. Overall, this method can be used for research and analysis of rock blasting fragmentation.

1. Introduction

Rock blasting fragmentation is a crucial indicator for evaluating the blasting effect, directly impacting excavation efficiency. After blasting, the rock forms fragments of various sizes. Oversized fragments require secondary crushing, while undersized fragments lead to over-crushing [1,2,3]. However, predicting the results of rock blasting fragmentation is challenging due to the brief detonation time and the complex physical and chemical reactions involved. Therefore, it is essential to develop simulation and analysis methods to predict rock blasting fragmentation more accurately.
The most common methods for predicting and researching rock blasting fragmentation include empirical formulas, such as the widely used Kuz–Ram model [4], modified Kuz–Ram [5], and Rosin–Rammler models [6]. For example, Yilmaz O [5] applied these models to estimate average fragment sizes and validated their feasibility through onsite experiments. However, because the Kuz–Ram model assumes rock mass integrity, its practical applicability in engineering contexts is limited. To address this limitation, scholars modified the Kuz–Ram theoretical model and proposed the KCO model [7] and xp-frag model [6]. Nevertheless, significant prediction errors persist, primarily due to two factors: the spatial variability of rock mass distributions and the inherent variability in the physical parameters of rock masses encountered in real-world engineering scenarios. As a result, predictions based on deterministic parameters may lack the required accuracy.
Another method involves the use of artificial intelligence to predict rock blasting fragmentation. This approach uses rock parameters and data from multiple blasting results to train models for forecasting fragmentation results. For instance, Schenk et al. [8] employed a deep learning approach for rock fragmentation recognition. Similarly, 9. Bamford et al. [9] applied deep learning to analyze rock fragmentation, evaluating the accuracy of a deep neural network (DNN) model as an automated tool for rapid analysis. Their findings showed that the DNN model outperformed manual image labeling in prediction accuracy. Additionally, Ramezani et al. [10] used DNN to identify fragment boundaries before watershed segmentation. By comparing DNN results with screening data, they confirmed that neural networks are viable for rock blasting fragmentation analysis. Other researchers have also used neural network methods to study rock blasting fragmentation [11]. However, the use of neural networks requires large datasets for effective analysis. Additionally, during training, the artificial statistics of rock fragmentation must be compared with DNN results to adjust model parameters, a process that is time-consuming. The lack of sufficient test data also presents challenges in training the model effectively.
The third method involves numerical simulation techniques to predict and analyze rock fragmentation. Yi et al. [12] investigated the impact of in situ stress on blasting-induced fracture patterns. They found that high in situ stress inhibited far-field crack development, resulting in smaller fragments as stress increased. Similarly, Xie et al. [13,14] developed a two-dimensional numerical model to examine crack propagation and damage evolution during deep-buried tunnel excavation. Their studies showed that in situ stress resisted radial blasting pressure near boreholes, thereby reducing the damage zone area. Tao et al. [15] combined theoretical analysis and numerical simulation to study the effects of in situ stress on rock response to blasting. Their findings revealed that in situ stress enhanced dynamic pressure by altering the loading path of the blast while suppressing fractures through circumferential compression. This suppression was most pronounced along the minor principal stress direction, with fractures concentrating along the principal stress as its disparity increased. In a subsequent work, Tao et al. [16] combined finite element simulation and image processing to analyze fragmentation under different blasting parameters. Their results showed that decreasing fragment size was associated with increased roundness and uniformity, and at smaller scales, higher energy density and reduced ductility promoted crack bifurcation, generating finer fragments until reaching the unbreakable limit. Other studies have further validated numerical simulation methods for blasting-induced fragmentation analysis [17,18,19]. Collectively, these studies highlight the crucial role of numerical simulations in balancing predictive accuracy and computational efficiency for optimizing blasting.
With the continuous advancement of Unmanned Aerial Vehicle (UAV) technology, UAVs are increasingly used to measure rock blasting fragmentation. The photogrammetry method involves using UAVs to scan and analyze the shape of muck piles and the fragmentation. Based on this analysis, blasting parameters can be optimized and improved prior to subsequent operations. Bamford et al. [20] found that using UAVs to collect images of rock fragments improves the quality of the image data and automates the data collection process. However, because rock fragments are typically in a piled-up state, it is challenging to accurately scan the fragments at the bottom of the pile. Consequently, the generated rock blasting fragmentation curve may lack accuracy, reducing the reliability of this method.
To predict and analyze rock blasting fragmentation results and provide guidance for onsite blasting parameters, a method for simulating and analyzing rock fragmentation is proposed in this study. Then, onsite blasting experiments were conducted to validate the reliability of this method. Finally, the method was used to optimize rock blasting parameters.

2. Problem Description

Various indicators, such as rock fragmentation, vibration, and dust, are used to evaluate the rock blasting effects. Among these, rock fragmentation directly impacts excavation efficiency, which is most essential for evaluating rock blasting effects. By analyzing the distribution of rock fragmentation, valuable insights can be gained to optimize blasting parameter designs. Selecting appropriate parameters can significantly improve both project progress and economic efficiency.
Explosives undergo detonation reactions in an extremely short time, involving complex physical and chemical processes that are difficult to observe directly [21,22]. However, with the rapid advancement of computational power and software technologies, the rock blasting process can be reproduced though numerical simulation. By simulating rock blasting results based on site-specific conditions, this method provides crucial feedback for optimizing blasting parameter designs. This approach not only saves significant time and cost but has also become a widely adopted tool for studying rock blasting effects [23,24].
The most commonly used numerical simulation methods in current research include the finite element method (FEM), which assumes medium continuity. The most widely used FEM software, including LS-DYNA and AUTODYN, can accurately simulate the relationship between volume and energy during explosive detonation by incorporating built-in detonation equations. These programs perform well in simulating stress waves, loads, vibrations, and explosion-induced damage [25]. However, due to the continuum assumption in their formulation, FEM have limitations in simulating large deformation failures, such as rock fragmentation and ejection. In contrast, the discrete element method (DEM), which assumes medium discontinuity, models the system as a collection of discrete elements. Software such as PFC and 3DEC allows elements to separate, translate, and rotate during simulations [26]. DEM is widely employed to study rock fragmentation and ejection during blasting [27,28].
However, a significant limitation of DEM tools is the absence of built-in explosion equations. As a result, rock blasting is often simplified as a static load applied within the rock mass, which fails to capture dynamic gas–rock interactions. This leads to less accurate representations of failure mechanisms, particularly in the near-blast hole zone where pressure gradients are most severe [29,30,31].
The continuous–discontinuous method, used in numerical simulation software such as GDEM and FDEM, offers better accuracy in simulating rock failure under detonation. However, this approach has several limitations. First, the failure process in this method is highly sensitive to mesh division. Second, the software requires complex parameter settings, demanding extensive calibration and resulting in lower computational efficiency. Additionally, GDEM and FDEM struggle to simulate complex jointed rock masses due to their simplified representations of discontinuities. A comprehensive comparison of the advantages and disadvantages of current numerical simulation methods for rock blasting is provided in Table 1.

3. Methodology

3.1. Simulation of Explosive Detonation

The model has dimensions of 4 m × 2 m, with a blast hole (70 mm in diameter) positioned at its center. The blast hole features a coupled charge structure, with an explosive length of 1.0 m and a plugging length of 0.3 m. To minimize the influence of reflected stress waves on the simulation results, non-reflecting boundary conditions were applied to the lateral and bottom surfaces, while the top surface was treated as a free boundary. The front and rear surfaces were defined as symmetric boundaries.
To analyze the blasting load along the blast hole wall during detonation, five measurement points (L1–L5) were spaced at 0.2 m intervals from the detonation point. Furthermore, the rock and fluid elements were spatially overlapped during modeling to ensure effective fluid–solid coupling. The model was finely discretized with a minimum mesh size of 5 mm × 5 mm, resulting in 998,382 elements and 1,504,380 nodes. The two-dimensional plane strain configuration is shown in Figure 1.
The relationship between the pressure, volume, and energy of the detonation products during the calculation process is modeled using the Jones–Wilkins–Lee (JWL) equation of state [32], as shown in Equation (1).
P d = A 1 ( 1 ω R 1 V ) e R 1 V + B 1 ( 1 ω R 2 V ) e R 2 V + ω E 0 V
where Pd represents the pressure of the detonation products and A1, B1, R1, and R2 are constants determined by the properties of the explosive. V is the relative volume of the detonation products, and E0 is the internal energy of the initial volume. The detailed parameters of the explosive are provided in Table 2.
The RHT material model [33] is chosen as the constitutive model for rock. Compared to the HJC model, the RHT model is capable of describing the entire material behavior process, from elasticity to failure. It is widely used to simulate the dynamic response, damage, and fracture characteristics of concrete and rock under impact loads [34]. The failure equation is given by Equation (2):
σ e q ( p , θ , ε ) = Y T X C p R 3 θ F r a t e ε Y T X C p = A ( p p s p a l l F r a t e ( ε ) ) N p s p a l l = p s p a l l / f c
where σ*eq represents the equivalent stress intensity on the failure surface; p, θ, and ε denote pressure, Lode angle, and strain rate, respectively; R3(θ) is the angular even function on the deviatoric plane; Frate(ε) is the strain rate strengthening factor; Y*TXC(p) is the equivalent stress intensity on the compression meridian; p* is the normalized static pressure; fc is the uniaxial compressive strength; pspall is the spalling strength; and p*spall is the normalized spalling strength. A and N are material constants. The values of the relevant physical and mechanical parameters for the RHT material model of rock are provided in Table 3.
The air material is modeled using the *MAT_NULL material model available in LS-DYNA software. The pressure variation process is described using the *EOS_LINEAR_POLYNOMIAL equation of state.
P = C 0 + C 1 V e + C 2 V e 2 + C 3 V e 3 + C 4 + C 5 V e + C 6 V e 2 E 0
Here, C0~C6 represent the parameters of the equation of state, with C4 = C5 = 0.4, E0 = 2.5 × 10⁹ J/m3, and an air density of 1.29 kg/m3. In the computational setup, ALE (arbitrary Lagrange–Eulerian) elements are used to model explosives and compressible fluids such as air, while Lagrange elements are employed for solid materials, including stemming and rock. The interaction between these domains is handled through a fluid–solid coupling algorithm.
Similar to air, water, as a fluid material, requires both a constitutive equation and an equation of state to define its thermodynamic state and pressure evolution. The material behavior of water is defined using the *MAT_NULL keyword, with its pressure response described by the *EOS_GRUNEISEN formulation. The parameters for the Gruneisen equation of state are set as follows: ρ = 1000 kg/m3, C = 1480 m/s, S1 = 2.56, S2 = −1.986, S3 = 0.227, GAMAO = 0.5, and A = 1.3937. Additionally, E1 = 256 J/kg specifies the initial internal energy, and V0 = 1.0 defines the initial relative volume. Notably, parameters C, S1S3, GAMAO, and A are solver-specific constants in LS-DYNA, while E1 and V0 are physical initial conditions. The stemming material was modeled using the MAT_SOIL_AND_FORM keyword.
Figure 2 illustrates the detonation process in a coupled charge. The detonation wave, initiated at the detonation position, propagates along the direction of energy flow, influenced by the directional and temporal limitations of detonation velocity in cylindrical charges [35]. The detonation position dictates both the propagation direction of the detonation wave and the flow direction of the detonation products. As the detonation wave propagates, the blast hole expands due to the interaction between the detonation products and the hole wall. This expansion results in explosion pressure being transmitted to the surrounding rock, causing compressive deformation and fracture development. The expansion process creates space that is eventually occupied by the detonation products [36]. As shown in Figure 2d, when detonation waves transition from the explosive to the rock, the impedance mismatch between the two media leads to partial reflection and transmission at the interface. This impedance contrast causes wave superposition phenomena that significantly influence the pressure distribution in the surrounding rock medium.
Figure 3 illustrates the blasting load curve on the blast hole wall under bottom detonation conditions. Five measurement points (L1–L5) were positioned 0.2 m apart from the detonation point in a straight line (Figure 1) to analyze the blasting load during detonation. The simulation results show that the blasting load gradually increases from the initiation point to the top of the explosive, eventually stabilizing at its maximum value. This behavior is attributed to the high length-to-diameter ratio of the columnar explosive, which induces both directional and time effects during the detonation process. In the early stages of detonation, the explosive reaction is incomplete, resulting in a lower detonation velocity and, consequently, a reduced blasting load. As the reaction progresses, the detonation velocity increases, causing the blasting load to rise until the system stabilizes at a steady detonation state, where the blasting load reaches its maximum value.
Furthermore, the theoretical peak value of the blasting load during detonation can be calculated using the formula below. Based on the Chapman–Jouguet (C-J) theory of detonation waves in condensed explosives [37], the peak blasting load, Pb, is expressed as follows:
The peak blasting load, Pb, under the coupled charge condition, is
P b = ρ 0 D 2 2 ( γ + 1 )
The peak blasting load, Pb, under the uncoupled charge condition, is
P b = ρ 0 D 2 2 ( γ + 1 ) a b 2 γ
Here, ρ0 represents the density of the explosive; D is the detonation velocity of the explosive; γ is the isentropic adiabatic index. When the pressure in the hole exceeds the critical pressure of the explosive, γ = 3; when the pressure in the hole is below the critical pressure, γ = 4/3; a is the diameter of the charge; b is the diameter of the blast hole.
According to previous studies [38], the blasting load increases when the detonation of the explosive transitions from the detonation products to the rock medium. In the case of one-dimensional explosive detonation flow, the detonation wave is initiated at the detonation position. Upon reaching the interface with the rock medium, reflection occurs due to differences in material wave impedance, resulting in a superposition effect. This phenomenon causes a sudden pressure increase, leading to a pressure multiplication effect [39]. In this numerical simulation, the peak load was determined to be 3.5 GPa. The incident pressure, calculated using the formula, was 3.168 GPa, yielding a pressure increase factor of 1.1.
The detonation characteristics of explosives are influenced by their charge structure. For example, the blasting effect of explosives varies with different uncoupling coefficients and charging media [39]. Furthermore, variations in initiation positions and charge structures can optimize the blasting effect under different conditions. To further investigate the detonation characteristics of explosives, the detonation processes of explosives with various charge structures were examined.
Figure 4 illustrates the detonation wave propagation process under two-point initiation. Similar to bottom initiation, the detonation wave is triggered at the initiation positions and propagates through the explosive material. Following detonation, the two detonation waves travel in opposite directions and collide at t = 90 μs. At the moment of collision, an angle exists between the two detonation waves. After the collision, the detonation waves reflect off one another, and the angle between them transitions from inclined to horizontal due to their interaction [40].
Figure 5 illustrates the blasting load curve on the hole wall under two-position detonation. As shown in the figure, the blasting loads at measuring points L1 and L5 are identical, as are the loads at L2 and L4. Similar to the detonation process of bottom-initiated explosives, the blasting load starts relatively low at the initiation of detonation and gradually increases as the detonation reaction progresses. Upon collision of the two opposing detonation waves, the blasting load experiences a sudden, sharp increase.
Compared to coupled charges, uncoupled charges can effectively reduce the peak load on the blast hole wall, enhance the utilization of explosive energy, and improve the overall blasting effect [39]. To investigate the detonation characteristics of explosives under different charge structures, detonation models for air-coupled and water-coupled charges were established using identical explosive parameters. The propagation of detonation waves and the loading characteristics on the blast hole wall were then analyzed.
Figure 6 illustrates the propagation of the detonation wave when air is used as the uncoupled charging medium, with uncoupling coefficients of 1.29 and 1.57. As shown in Figure 6a, the detonation wave originates at the detonation position, and the explosion energy propagates along the explosive. Due to the directional and temporal effects of the cylindrical charge’s detonation process, the detonation position determines both the propagation direction of the detonation wave and the flow direction of the explosion energy, as depicted in Figure 6b,c. In the case of an uncoupled charge, the shock wave generated by the explosion reflects transparently at the interface between different media, leading to the superposition of detonation waves, as shown in Figure 6d. The difference between uncoupling coefficients of 1.29 and 1.57 lies in the timing of this superposition. When air is used as the uncoupled medium, a higher uncoupling coefficient delays the superposition of the detonation waves. This delay occurs because the wave propagation speed in a solid is greater than in air. As a result, a higher uncoupling coefficient increases the time for the detonation wave to reflect off the gun hole wall, causing the superposition of detonation waves to occur later. This delay leads to uneven energy release and reduces the effectiveness of the blasting.
Figure 7 illustrates the propagation of the detonation wave in water as the uncoupled medium, with decoupling coefficients of 1.29 and 1.57. The propagation pattern is similar to that observed in air, but the differences occur due to the physical properties of the water. As shown in Figure 7d, the detonation wave originates at the ignition position and propagates along the explosive, with wave superposition occurring during the process. In contrast to air, water has lower compressibility, higher viscosity, and a faster stress wave velocity. These properties reduce the time for stress wave reflection at the blast hole wall, thereby accelerating the superposition of detonation waves. Additionally, the energy concentration at the wavefront becomes more evenly distributed during propagation. This more uniform energy release improves coupling efficiency with the blast hole wall by mitigating localized pressure peaks. As a result, using water as the decoupling medium significantly enhances blasting effectiveness.
Figure 8 illustrates the time–history curve of the blasting load on the hole wall for water and air as uncoupled charging media. The figure shows that, with a constant explosive diameter, the peak blasting load decreases as the uncoupling coefficient increases. For a given uncoupling coefficient, the blasting load on the hole wall varies based on the charging medium. When water is used as the uncoupled charging medium, the explosion energy grows significantly faster than when air is used. This difference is due to water’s lower compressibility and higher viscosity compared to air. As a result, the blasting load is slightly higher when water is the medium, and the explosion energy is released more uniformly. This leads to better energy transfer to the hole wall, enhancing the blasting effect compared to air as the uncoupled charging medium.

3.2. Simulation of Rock Blasting Fragmentation

To investigate rock blasting fragmentation, the finite element software LS-DYNA was used to model the process. As group hole blasting is more commonly applied in engineering, a group hole blasting model was developed to simulate rock fragmentation.
In practical engineering, the detonation of explosives generates both stress waves and detonation gases, which lead to the formation of macroscopic cracks in the rock. These cracks break the intact rock mass into fragments of varying sizes, resulting in rock fragmentation. To simulate this process, LS-DYNA was employed to model the rock fragments. The *MAT_ADD_EROSION keyword was used to remove mesh elements that exceed a damage threshold [16], which is widely used for simulating the macroscopic cracks in rock blasting.
The plane strain model for group hole blasting, shown in Figure 9, was developed using the finite element software LS-DYNA. The model had dimensions of 4.9 m in length and 4.1 m in width, with a fine mesh grid size of 5 mm × 5 mm. The explosive had a diameter of 70 mm, and a coupled charge structure was used. The RHT model was employed as the rock constitutive model. The relevant parameters are detailed in Table 2. The detonation process of the explosive was described using the JWL equation of state.
The plane strain model for group hole blasting was established and solved to simulate the distribution of rock fragments induced by blasting. During the simulation, mesh elements that reached the damage threshold were removed to represent the cracks in the rock caused by explosive detonation. Based on relevant data, when the damage variable Dc reaches 0.8 under slope blasting excavation conditions, the rock mass is considered to be fully fractured [41]. Therefore, the damage variable threshold for the rock mass in this numerical simulation was set at 0.8. The simulated rock fragmentation results in the simulation are shown in Figure 10.
The image processing software WipFrag (version 3.3.14.0) was used to analyze the simulated rock fragmentation images. The blank regions in the image represent areas where the rock was completely fractured and were excluded from further analysis. WipFrag employs thresholding and fuzzy algorithms to identify the boundaries of the rock fragments. However, some of the recognition results deviated from the actual boundaries, requiring manual adjustments to align the results with the true conditions. The manually refined recognition results are shown in Figure 11, while the original recognition results from WipFrag for the rock fragments are displayed in Figure 12.
As shown in Figure 12, the recognition results obtained from WipFrag software for the rock fragments are presented. The software uses color coding to indicate the size of the rock fragments, with red representing the larger fragments. Due to the explosive detonation effect, the rock near the blast hole is completely fractured, and this region is excluded from the analysis of rock fragments. In Figure 12, the black regions correspond to these excluded regions, which are not included in the statistical analysis of the rock fragmentation results.
Figure 13 shows the block grading curve generated by WipFrag after analyzing the rock blasting fragment image. Due to the directional effects of cylindrical explosive detonation, the explosion energy propagates primarily forward, resulting in a higher concentration of larger blocks at the base of the blast hole. The block grading curve indicates that larger fragments are more abundant, with rock pieces exceeding 1 m in diameter accounting for 21% of the total. By integrating numerical simulation and image processing, a novel method for simulating and analyzing rock fragments is proposed.

3.3. Flow of Fragmentation Effect Simulation and Analysis Method

To predict rock blasting fragmentation before onsite blasting and provide guidance for blasting parameter design, a simulation and analysis method for rock blasting results is proposed. The specific process is outlined in Figure 14.
Step 1: Based on actual conditions and blasting parameters, a numerical calculation model is created and imported into LS-DYNA software.
Step 2: Constitutive models and parameters for rocks, explosives, and uncoupled media are defined to simulate the rock fragmentation result.
Step 3: The numerical calculation of the blasting load is compared with the theoretical formula. If the results align, the process moves to the next step; if not, material parameters are adjusted and recalculated.
Step 4: After simulation, the rock fragmentation images are imported into the image processing software WipFrag for statistical analysis of the fragments.
To simulate the macroscopic cracks formed by explosive detonation, mesh elements reaching the damage threshold are removed during the calculation process to represent the rock fragments. When using image processing software to identify the rock fragments, manual adjustment and fine-tuning of the identified rock boundaries can improve accuracy.

4. Onsite Blasting Experiments

Compared to mining and tunnel drilling, rockfill dam blasting has unique characteristics. Specifically, it must meet stringent design requirements, with the grading curve after screening tests needing to fall within the designated grading envelope. To ensure compliance with these standards, accurate prediction of rock fragmentation results is crucial for optimizing onsite blasting parameters. To verify the feasibility and accuracy of the proposed simulation method, the rock blasting fragmentation results from the Shuangjiangkou Hydropower Station’s rockfill dam project were experimentally tested and analyzed.

4.1. Engineering Background

The Shuangjiangkou Hydropower Station is located in Jinchuan County, Aba Tibetan, and Qiang Autonomous Prefecture, Sichuan Province. It serves as an upstream-controlled reservoir project for the hydropower cascade development in the Dadu River basin. The riverbed’s covering layer consists of three layers, from bottom to top: the drift–gravel layer, the (sand) gravel layer, and another drift–gravel layer. These layers generally range in thickness from 48 m to 57 m, with a maximum thickness of 67.8 m.
The rockfill dam at Shuangjiangkou Hydropower Station is a gravel core wall rockfill dam with a height of 312 m. The primary distinction between rockfill dam blasting and other types of blasting, such as mining or drilling and blasting, lies in the requirement that the graded materials produced through blasting must meet strict design specifications. Specifically, the rock grading curve from screening tests must fall within the predetermined design grading envelope. To meet this requirement, several onsite experiments on rock blasting fragmentation were conducted at Shuangjiangkou Hydropower Station. These onsite blasting experiments allow for the determination of blasting parameters that meet engineering requirements with minimal testing, ensuring that the graded raw materials produced align with the required design standards.

4.2. Blasting Design

The detonation network used in the onsite experiments is shown in Figure 15. Three onsite experiments were conducted. The blasting parameters for the first experiment were as follows: the blast hole spacing was 3 m, the row spacing was 2 m, and the detonation mode employed a 17 ms micro differential and equal interval delay, implemented using a digital electronic detonator. The charging structure used was an uncoupled charging structure, as depicted in Figure 16. The explosive used was a 90 mm emulsion explosive, with a blast hole diameter of 115 mm, an explosive length of 12.5 m, and a stemming length of 2.5 m. The detailed blasting parameters are provided in Table 4. It should be noted that, to prevent excessive or distant fly rocks caused by variations in the resistance line during actual construction, the layout of the blast holes near the slope and the design of the charge structure were adjusted based on the specific site conditions.
The onsite experiment images are shown in Figure 17. Figure 17a depicts the site before blasting, while Figure 17b shows the site after blasting. Under the influence of explosives, the rocks are fractured into fragments of varying sizes. As shown in Figure 17b, some large rocks remain partially unbroken in the onsite experiment. The presence of these large rocks, which require secondary breaking, impacts subsequent excavation efficiency. Therefore, it is crucial to develop a method for predicting the rock blasting fragmentation results in advance, providing guidance and reference for onsite parameter design.

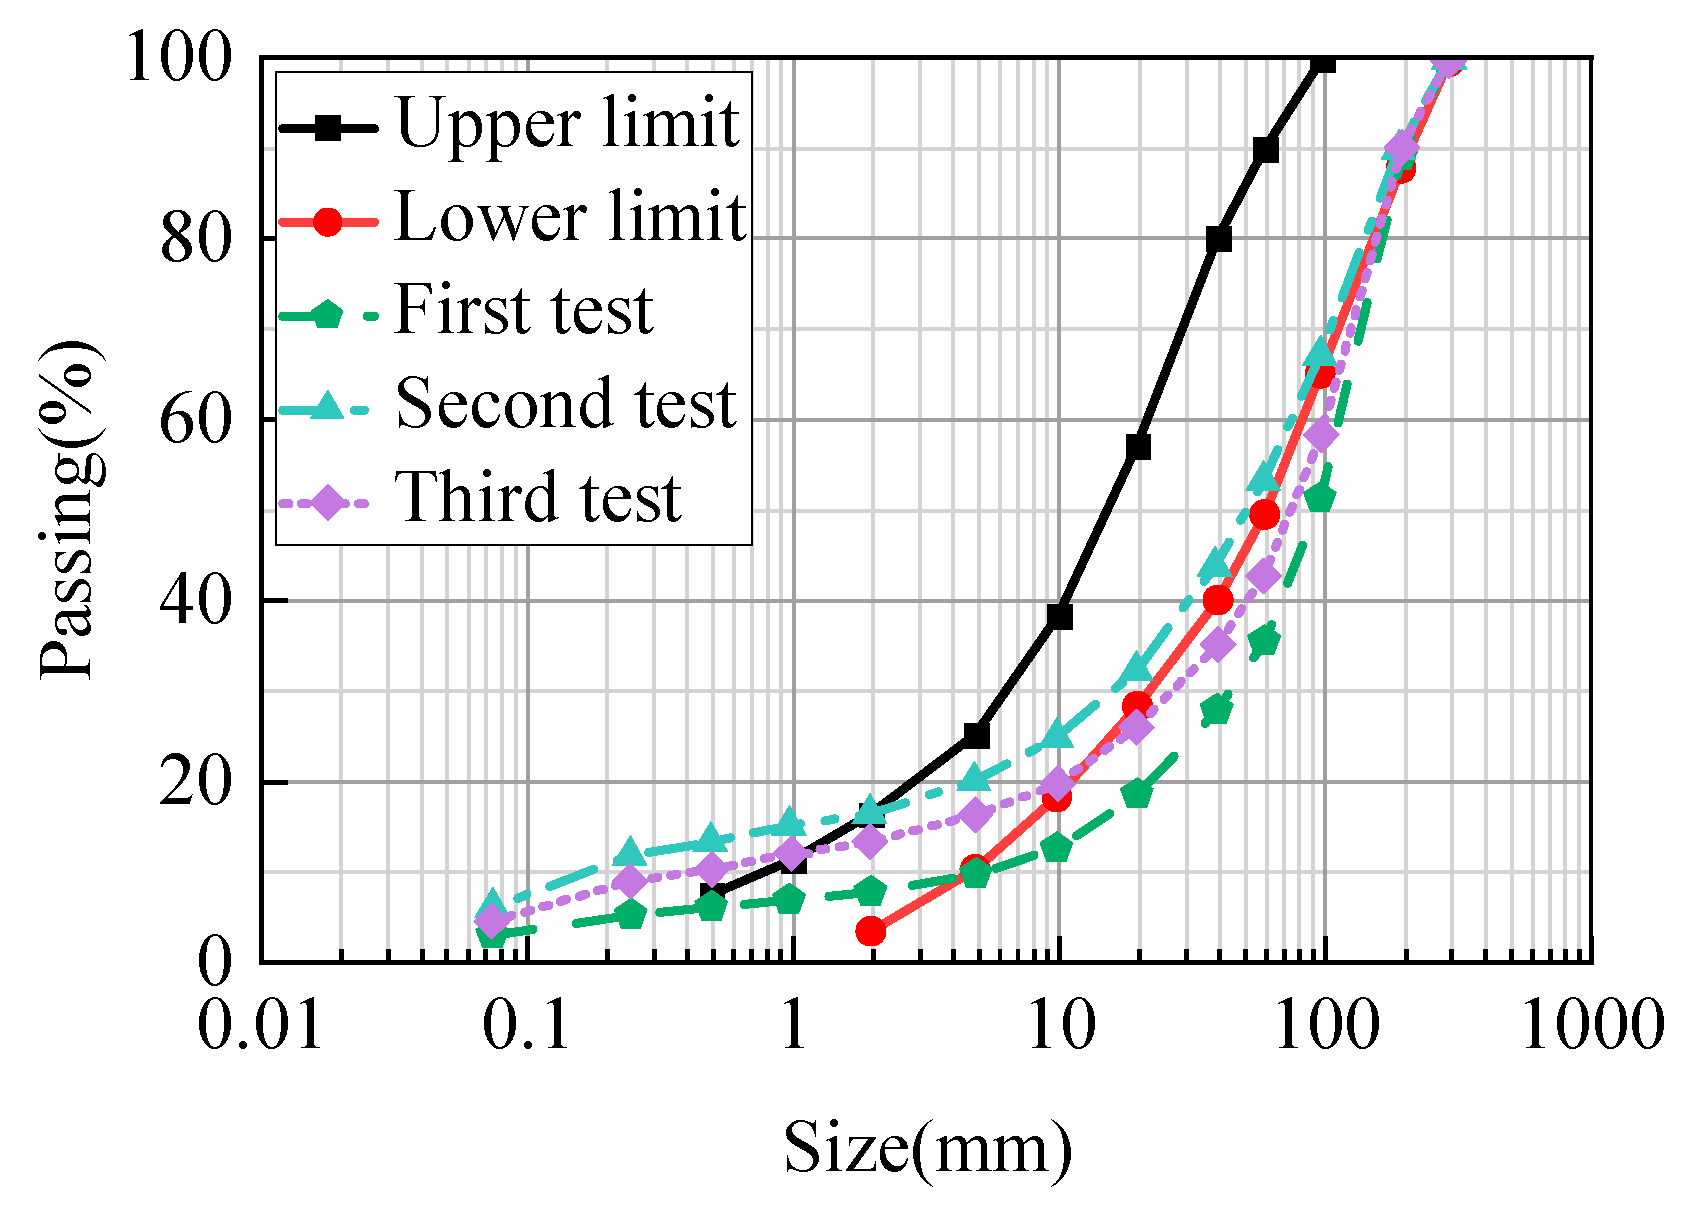
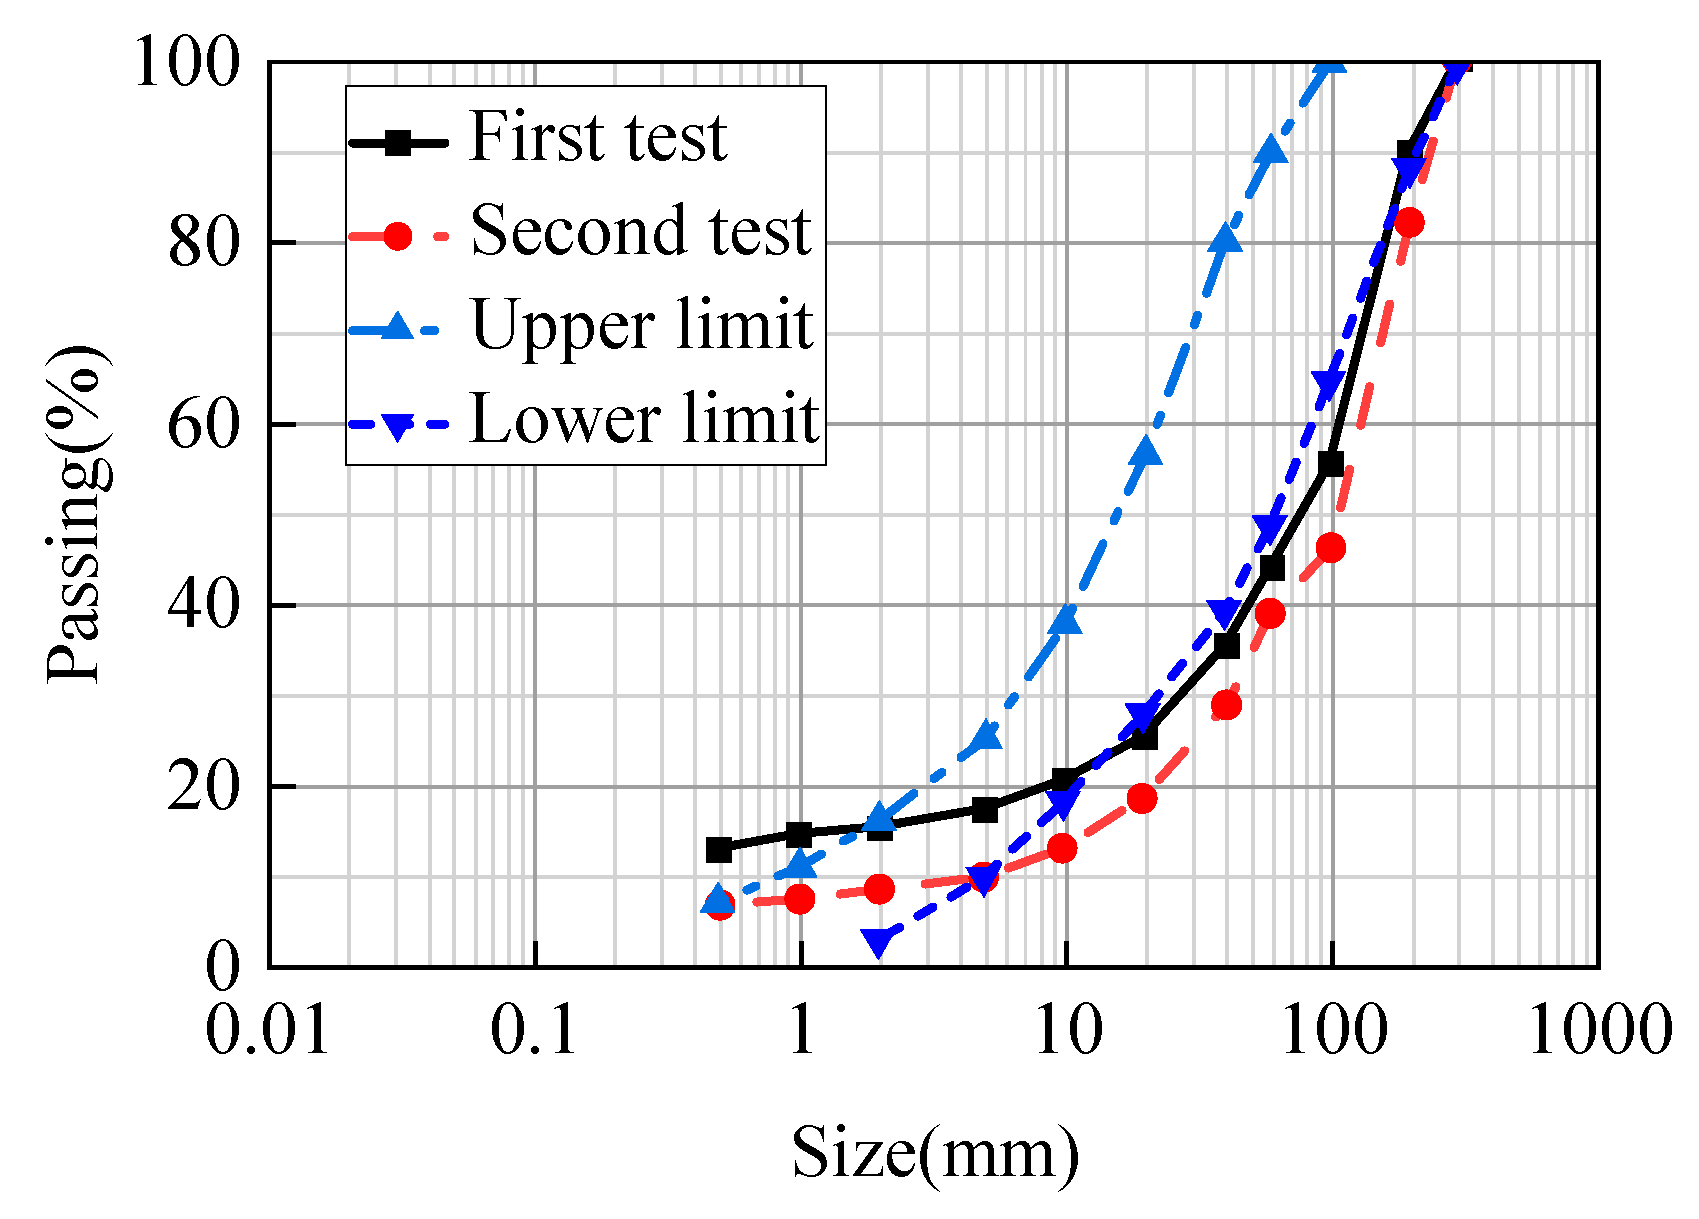
4.3. Results Analysis

After the onsite experiment, the results were statistically analyzed. The rock blasting fragmentation results are shown in Figure 18a. Under the influence of explosive detonation, the rock was fragmented into varying sizes. The postblasting area was divided into several regions, with one region selected for further analysis, as shown in Figure 18b. A screening test of the rubble in this section was then conducted, as illustrated in Figure 18c.
The screening process was conducted sequentially from larger to smaller particle sizes, ranging from 300 mm to 0.075 mm. The weight percentage of each particle size range was recorded, and a grading curve was generated based on the screening data. As shown in Figure 19, the resulting rock fragment distribution curve is plotted alongside the standard-prescribed envelope, where the lower and upper boundaries represent the allowable grading limits. For compliance, the rock fragment grading curve from blasting operations must lie entirely within these boundaries. However, the onsite experimental curve exceeded the envelope boundaries, failing to meet the required standard. As a result, a systematic analysis of the discrepancies was conducted to identify the root causes. The findings will be used to optimize onsite blasting parameters for future operations, ensuring adherence to design specifications.
The results from the first onsite blasting experiment revealed two key issues: a lack of fine particles and a rock fragment grading curve (10–100 mm range) that fell below design specifications. This discrepancy is mainly due to the experiment being conducted during the early stages of mining, when no standardized procedures had been established. Additionally, the test results were significantly influenced by terrain, geological, and environmental factors. Another contributing factor is the rock composition, which predominantly consists of particles within the 10–100 mm range, leading to a higher proportion of such fragments after blasting. The data from the onsite experiment highlight the importance of considering rock fragment size distribution when designing blasting schemes. Predictive simulations of fragment sizes should be conducted in advance to ensure alignment with design requirements. Because the grading curve from the first experiment did not meet the standard, further studies were undertaken to explore the relationship between various blasting parameters and particle grading curves. To validate this approach, two additional onsite experiments were conducted, and the particle grading curves obtained from these tests are shown in Figure 20 and Figure 21, demonstrating progressive alignment with design targets.
The blasting parameters for the second onsite experiment were as follows: blast hole spacing of 2.2 m, row spacing of 2.0 m, drilling diameter of 115 mm, and the use of 90 mm emulsion explosives. An electronic detonator network was employed, and the blasting area was classified as loose blasting. The results of the second onsite experiment are shown in Figure 20. From the particle grading curve of the test results, it can be observed that parts of the grading curve for the sampled material slightly exceed the design envelope. The proportion of material in the 10–300 mm size range is slightly lower, indicating an excess of coarse particles. Specifically, d10, d30, d50, d60, and d63.21 fall outside the design requirements for particle fragment size distribution. Additionally, the nonuniformity coefficient (Cu) and the curvature coefficient (Cc) also fall outside the specified design requirements.
The blasting parameters for the third onsite experiment were as follows: blast hole spacing of 1.8 m, row spacing of 1.8 m, drilling diameter of 115 mm, and continuous charging with 90 mm emulsion explosives. The plugging length was 2.5 m, and an electronic detonator network was used for initiation. The results of the third onsite experiment are shown in Figure 21.
From the particle grading curve of the experiment results shown in Figure 21, it can be observed that the grading curve for the sampled material partially exceeds the design envelope range. The proportion of materials with a particle size smaller than 5 mm is only 6%, which falls short of the design requirements. Additionally, the content of pulverized materials generated during the blasting process is relatively high. The particle size range of 3–200 mm in the grading curve falls below the design requirements and outside the design envelope, indicating that the particle size of the blasted material is too large. The screening data for d10, d30, d50, d60, and d63.21 all fall outside the design specifications. Furthermore, the nonuniformity coefficient (Cu) and the curvature coefficient (Cc) exceed the design requirements. To address these issues, optimization of the current blasting parameters is needed.

5. Method Verification

5.1. Model and Parameters

To optimize the blasting parameters and verify the simulation and analysis method for rock blasting fragmentation, a three-dimensional numerical model was established based on the actual parameters of the blasting test site, as shown in Figure 22. The model dimensions are 9.0 m × 6.0 m × 16.0 m. It is divided into fine elements, with a minimum size of 5 cm × 5 cm and a maximum size of 6.5 cm × 6.5 cm. The model consists of 2,094,777 nodes and 2,010,504 elements. To ensure proper transmission of the blasting stress wave and improve the fluid–structure coupling effect, some elements of the rock material and ALE fluid material are overlapped. To mitigate the impact of reflected stress waves from the artificial cut-off boundary, the top and front surfaces are designated as free boundaries, while the other surfaces are treated with non-reflective boundaries.
In this study, the RHT model is selected to simulate the behavior of rock material. Based on the actual conditions at the test site, the parameter values for the rock RHT material are provided in Table 5.
To simulate the macroscopic rock cracks induced by blasting, the *MAT_ADD_EROSION keyword is employed to remove elements that exceed the damage threshold. According to the relevant reference [16], the damage threshold is defined as the point at which the tensile stress reaches 3.5 MPa or the tensile strain exceeds 0.1. Mesh elements that meet these criteria are then deleted.
The explosive material is modeled using the *MAT_HIGH_EXPLOSIVE_BURN keyword. The relationship between pressure, volume, and energy of the detonation products during the explosive detonation process is simulated using the JWL equation. Detailed parameters for the explosives are provided in Table 2
Air is used as the medium for the decoupled charge and as the filling material in the fluid–structure coupling region. It functions as the material for the fluid elements, enabling material exchange between the explosive and rock materials. During the modeling process, fluid elements and air units are connected to improve the accuracy of the numerical simulation. The material model for air is defined using the *MAT_NULL keyword, and its equation of state is specified by the *EOS_LINEAR_POLYNOMIAL keyword. The stemming material was defined with the MAT_SOIL_AND_FORM keyword.

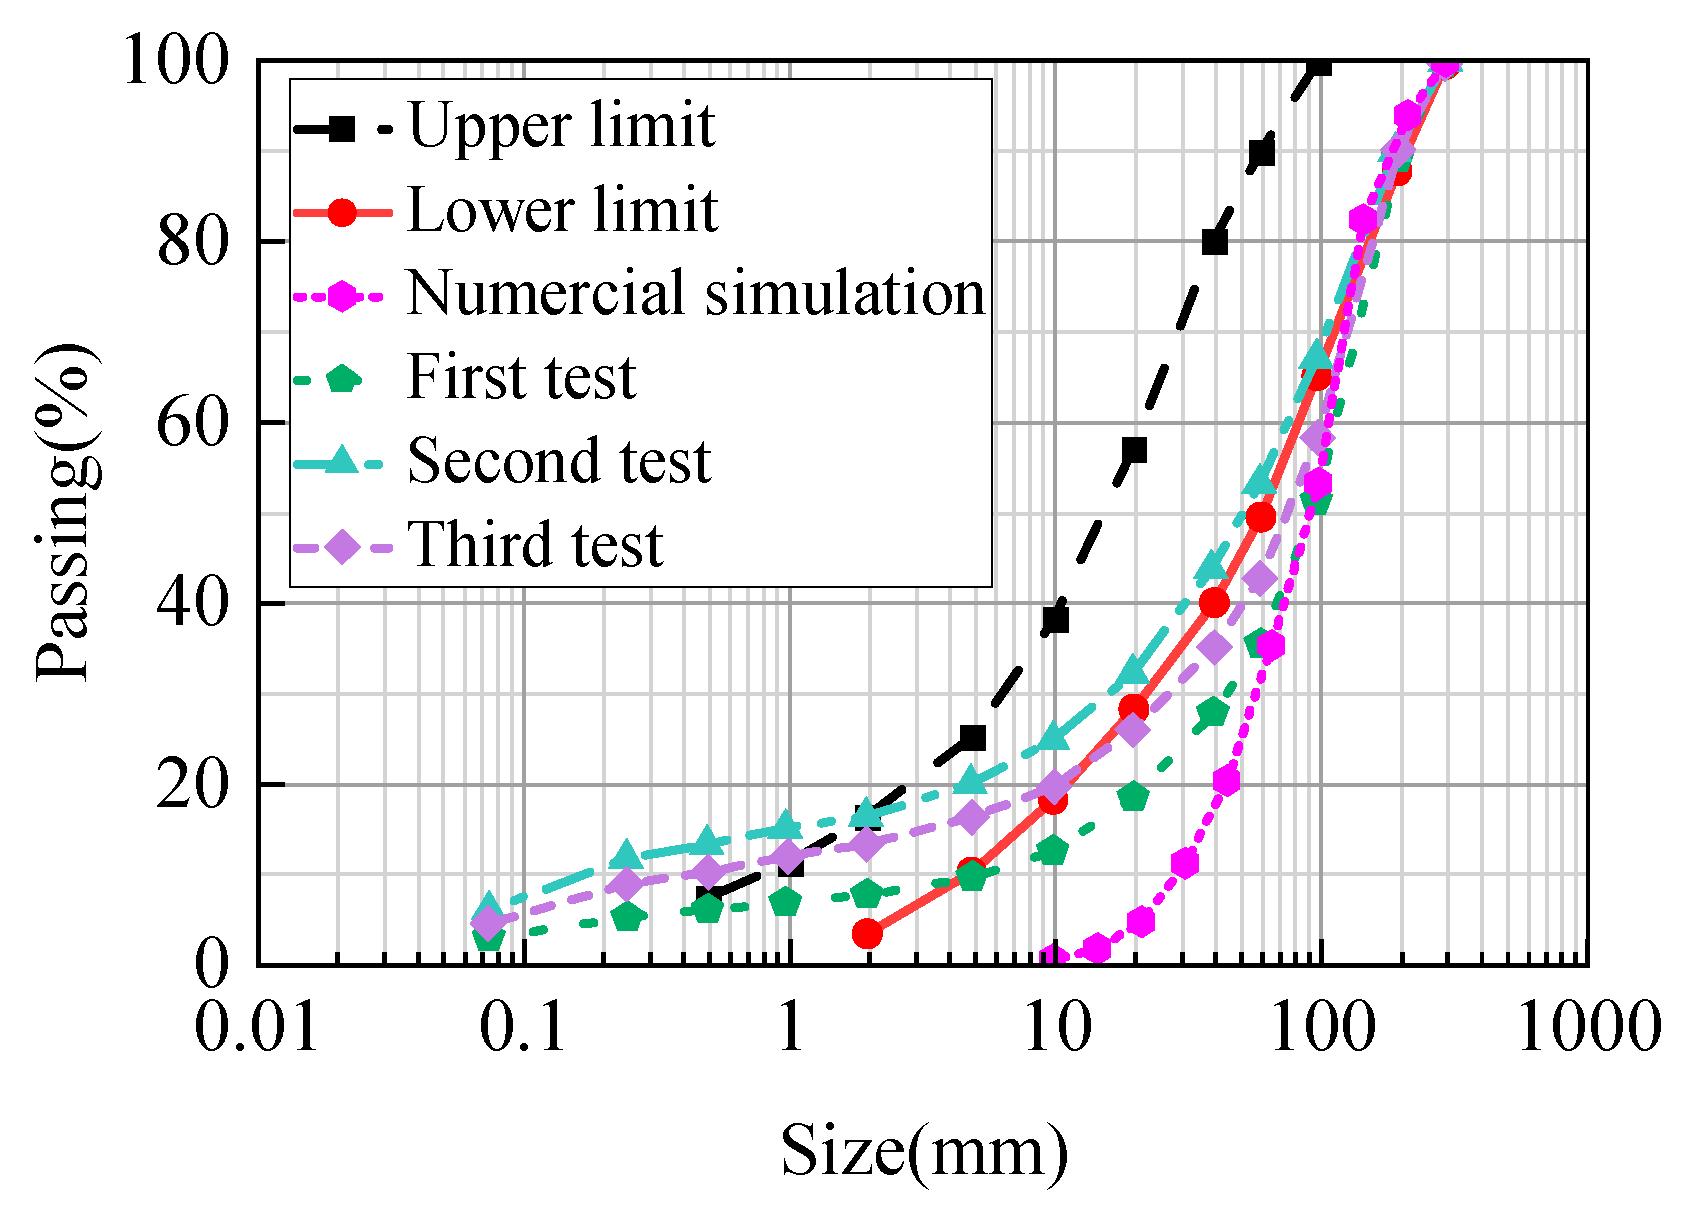
5.2. Simulation Results Analysis

Under the action of explosive detonation, some damaged elements are deleted, and the gaps in these elements represent macroscopic cracks in the rock. The simulation results are shown in Figure 23. The model is fragmented into many small pieces by the cracks, which reflect the crushing of the rock due to detonation, resulting in rubble of varying sizes. After the numerical simulation, the distribution of the blasted rock fragments is statistically analyzed and compared with the grading curve specified by the standard.
The rock fragment analysis workflow is illustrated in Figure 24. Specifically, Figure 24a shows a three-dimensional numerical simulation model with crack networks. This model was sectioned to generate a rock fragmentation distribution image, as shown in Figure 24b, which highlights a significant void zone—interpreted as a fully crushed region induced by the blasting energy. Figure 24c demonstrates the analysis of this image using WipFrag software for fragment size quantification. However, due to limitations in the software’s automated boundary detection, manual refinement of the fragment edges was necessary to ensure accurate statistical results. The resulting rock fragment size grading curve, shown in Figure 24d, provides essential data for assessing compliance with design benchmarks.
To validate the accuracy and feasibility of the simulation and analysis method for rock blasting fragmentation, the gradation curve obtained from numerical simulation is compared with that from onsite experiments, as shown in Figure 25. The comparison reveals that the gradation curve from the numerical simulation closely aligns with the onsite experiment results in the 50–300 mm particle size range. However, there is a notable discrepancy in the 0.1–50 mm range. This difference can be attributed to some rocks being crushed a second time when moved by the excavator during the onsite experiment. Additionally, the numerical simulation is constrained by the relatively large element size, which creates a large void area indicating fully crushed rocks that are not counted. As a result, the gradation curve for the 0.1–50 mm range does not align well in the simulation. Despite this, the gradation curves from both the numerical simulation and onsite experiment show good agreement in the 50–300 mm range, with consistent variation trends. Therefore, it can be concluded that the numerical model results are in general agreement with the onsite experiment results, supporting the feasibility of the simulation method for rock blasting fragmentation based on image processing in this study.

6. Case Study

Based on the actual blasting parameters, a rock fragmentation calculation model is established, as shown in Figure 26. The charging structure consists of a 90 mm diameter charge and a 115 mm diameter blast hole. In the three-dimensional numerical model simulating explosive cracks in the rock, the element size is set to 6 cm to manage computational costs. However, this coarse mesh resolution prevents the simulation of smaller rock fragments, resulting in noticeable discrepancies between numerical and actual blasting outcomes. To improve accuracy and efficiency, a two-dimensional plane strain model is adopted. In this model, the maximum element size is refined to 1.3 cm, while the stemming and explosive column lengths are set to 2.5 m and 12.5 m, respectively. In Figure 26, the variable L represents the distance between adjacent blast holes, which significantly influences stress wave interactions. Non-reflective boundaries are applied to the left, right, and bottom surfaces to prevent reflected stress waves, while the top surface remains a free boundary.
The RHT model is employed as the constitutive model for the rock, with the specific material parameters provided in Table 5. To simulate explosion-induced cracks in the rock, the *MAT_ADD_EROSION keyword is used to delete elements that exceed the damage threshold.
For the explosive material, the *MAT_HIGH_EXPLOSIVE_BURN keyword is applied. The relationship between pressure, volume, and energy of detonation products is modeled using the JWL equation of state. The detailed parameters for the explosives are listed in Table 2.
The simulated rock blasting fragments results are shown in Figure 27. Due to the non-reflective boundaries on the sides and bottom of the model, damage at the edges of the blast hole is minimal. In practical engineering, the primary focus is on the rock fragments between adjacent blast holes. Therefore, this simulation specifically examines the rock fragments in the central region between the blast holes. As shown in Figure 27, when the distance between adjacent blast holes is 3.0 m, the shock waves from the explosive detonation cause the rock between the two blast holes to collide, enhancing fragmentation in the middle. However, large rock fragments are still present in the model. As the distance (L) between the blast holes decreases, the size of the larger rock fragments gradually reduces. The WipFrag software is used to process the simulated rock blasting fragments images, calculate the size and distribution for various distances (L), and generate the fragment gradation curve, as illustrated in Figure 28.
In Figure 28, the black curve represents the grading curve envelope for rockfill dam materials stipulated by state regulations, while the red curve indicates the lower envelope line. The grading curve of rock blasting fragments obtained directly through blasting must fall between these two curves.
As shown in Figure 28, when the distance between adjacent blast holes is 3.0 m, there are more rock blocks, and the grading curve does not meet the required standards. As the distance (L) decreases, the size of the rock fragments gradually becomes smaller. At a distance of L = 2.0 m, the grading curve lies between the upper and lower envelope lines, meeting the standard requirements. However, when the distance L is further reduced to 1.75 m, the maximum rock size becomes smaller than the standard, and excessive crushing occurs. Based on this analysis of the distance L in terms of blasting damage, the optimal distance between adjacent blast holes is found to be 2.0 m.

7. Conclusions

This study presents a rock blasting and fragmentation effect simulation and analysis method. The accuracy and validity of this method were confirmed through onsite experiments, and this study also provided valuable recommendations for optimizing rock blasting parameters. The useful conclusions that can be drawn are as follows:
(1)
A new simulation and analysis method for rock blasting fragmentation is proposed. The finite element analysis software LS-DYNA was used to simulate rock blasting fragmentation, and the resulting fragmentation images were imported into WipFrag for statistical analysis. This approach offers valuable insights for optimizing blasting parameters.
(2)
Due to the directional effects along the cylindrical charge, the explosive loading on blast hole wall first increases and then stabilizes. Furthermore, the detonation processes are different, with varying charging structures. Therefore, it is essential to select charge structures based on the specific site conditions.
(3)
The proposed simulation and analysis method was validated though onsite blasting experiments. The fragmentation effects from the simulation and image analysis were used to provide recommendations for optimizing rock blasting parameters.
It is important to note that this study aims to propose a simulation and analysis method for rock blasting fragmentation that overcomes the limitations of existing numerical simulation methods. Further research is needed to explore the variation trends of rock fragmentation in the presence of joint surfaces and to examine fragmentation characteristics in areas with uneven rock distribution.

Author Contributions

Methodology, Q.Y.; Validation, Q.Y.; Formal analysis, H.Z.; Investigation, X.G.; Data curation, W.J.; Writing—original draft, Q.Y. and H.Z.; Writing—review and editing, Q.Y., H.Z., X.M., Q.G. and Y.J.; Supervision, Q.G.; Funding acquisition, Q.G. All authors have read and agreed to the published version of the manuscript.

Funding

This study was financially supported by the National Natural Science Foundation of China (52379096), the State Key Laboratory of Precision Blasting, Jianghan University (BL2021-08), Research Funds for the Interdisciplinary Projects, CHU (300104240925), the Innovation Capability Support Program of Shaanxi (2023-CX-TD-35), and the Key Research and Development Program of Shaanxi (2023KXJ-159).

Data Availability Statement

The original contributions presented in the study are included in the article, further inquiries can be directed to the corresponding author.

Conflicts of Interest

The authors state that they have no conflict of interest with respect to the research, authorship, and publication of this article.

Correction Statement

This article has been republished with a minor correction to the existing affiliation information and Conflicts of Interest Statement. This change does not affect the scientific content of the article.

References

  1. Yan, P.; Zhou, W.; Lu, W.; Chen, M.; Zhou, C. Simulation of bench blasting considering fragmentation size distribution. Int. J. Impact Eng. 2016, 90, 132–145. [Google Scholar] [CrossRef]
  2. Baranowski, P.; Kucewicz, M.; Gieleta, R.; Stankiewicz, M.; Konarzewski, M.; Bogusz, P. Fracture and fragmentation of dolomite rock using the JH-2 constitutive model: Parameter determination, experiments and simulations. Int. J. Impact Eng. 2020, 140, 103543. [Google Scholar] [CrossRef]
  3. An, H.M.; Liu, H.Y.; Han, H.; Zheng, X.; Wang, X.G. Hybrid finite-discrete element modelling of dynamic fracture and resultant fragment casting and muck-piling by rock blast. Comput. Geotech. 2017, 81, 322–345. [Google Scholar] [CrossRef]
  4. Gheibie, S.; Aghababaei, H.; Hoseinie, S.H.; Pourrahimian, Y. Modified Kuz-Ram fragmentation model and its use at the Sungun Copper Mine. Int. J. Rock Mech. Min. Sci. 2009, 46, 967–973. [Google Scholar] [CrossRef]
  5. Yilmaz, O. Rock factor prediction in the Kuz–Ram model and burden estimation by mean fragment size. Geomech. Energy Environ. 2023, 33, 100415. [Google Scholar] [CrossRef]
  6. Ouchterlony, F.; Sanchidrián, J.A.; Moser, P. Percentile fragment size predictions for blasted rock and the fragmentation–energy fan. Rock Mech. Rock Eng. 2017, 50, 751–779. [Google Scholar] [CrossRef]
  7. Ouchterlony, F. The Swebrec function: Linking fragmentation by blasting and crushing. Min. Technol. 2005, 114, 29–44. [Google Scholar] [CrossRef]
  8. Schenk, F.; Tscharf, A.; Mayer, G.; Fraundorfer, F. Automatic muck pile characterization from UAV images. ISPRS Ann. Photogramm. Remote Sens. Spat. Inf. Sci. 2019, 4, 163–170. [Google Scholar] [CrossRef]
  9. Bamford, T.; Esmaeili, K.; Schoellig, A.P. A deep learning approach for rock fragmentation analysis. Int. J. Rock Mech. Min. Sci. 2021, 145, 104839. [Google Scholar] [CrossRef]
  10. Ramezani, M.; Nouranian, S.; Bell, I.; Sameti, B.; Tafazoli, S. Fast rock segmentation using artificial intelligence to approach human-level accuracy. J. Explos. Eng. 2017, 34, 28–32. [Google Scholar]
  11. Sanchidrián, J.A.; Segarra, P.; Ouchterlony, F.; López, L.M. On the accuracy of fragment size measurement by image analysis in combination with some distribution functions. Rock Mech. Rock Eng. 2009, 42, 95–116. [Google Scholar] [CrossRef]
  12. Yi, C.; Johansson, D.; Greberg, J. Effects of in-situ stresses on the fracturing of rock by blasting. Comput. Geotech. 2018, 104, 321–330. [Google Scholar] [CrossRef]
  13. Xie, L.X.; Lu, W.B.; Zhang, Q.B.; Jiang, Q.H.; Wang, G.H.; Zhao, J. Damage evolution mechanisms of rock in deep tunnels induced by cut blasting. Tunn. Undergr. Space Technol. 2016, 58, 257–270. [Google Scholar] [CrossRef]
  14. Xie, L.X.; Lu, W.B.; Zhang, Q.B.; Jiang, Q.H.; Chen, M.; Zhao, J. Analysis of damage mechanisms and optimization of cut blasting design under high in-situ stresses. Tunn. Undergr. Space Technol. 2017, 66, 19–33. [Google Scholar] [CrossRef]
  15. Tao, J.; Yang, X.G.; Li, H.T.; Zhou, J.W.; Fan, G.; Lu, G.D. Effects of in-situ stresses on dynamic rock responses under blast loading. Mech. Mater. 2020, 145, 103374. [Google Scholar] [CrossRef]
  16. Tao, J.; Yang, X.G.; Li, H.T.; Zhou, J.W.; Qi, S.C.; Lu, G.D. Numerical investigation of blast-induced rock fragmentation. Comput. Geotech. 2020, 128, 103846. [Google Scholar] [CrossRef]
  17. Pál, G.; Varga, I.; Kun, F. Emergence of energy dependence in the fragmentation of heterogeneous materials. Phys. Rev. E 2014, 90, 062811. [Google Scholar] [CrossRef]
  18. Diehl, A.; Carmona, H.A.; Araripe, L.E.; Andrade, J.S., Jr.; Farias, G.A. Scaling behavior in explosive fragmentation. Phys. Rev. E 2000, 62, 4742. [Google Scholar] [CrossRef]
  19. Wittel, F.; Kun, F.; Herrmann, H.J.; Kröplin, B.H. Fragmentation of shells. Phys. Rev. Lett. 2004, 93, 035504. [Google Scholar] [CrossRef]
  20. Bamford, T.; Esmaeili, K.; Schoellig, A.P. A real-time analysis of post-blast rock fragmentation using UAV technology. Int. J. Min. Reclam. Environ. 2017, 31, 439–456. [Google Scholar] [CrossRef]
  21. Chang, X.; Shan, Y.; Zhang, Z.; Tang, C.; Ru, Z. Behavior of propagating fracture at bedding interface in layered rocks. Eng. Geol. 2015, 197, 33–41. [Google Scholar] [CrossRef]
  22. Chen, D.F.; Feng, X.T.; Xu, D.P.; Jiang, Q.; Yang, C.X.; Yao, P.P. Use of an improved ANN model to predict collapse depth of thin and extremely thin layered rock strata during tunnelling. Tunn. Undergr. Space Technol. 2016, 51, 372–386. [Google Scholar] [CrossRef]
  23. Xu, B.; Zhang, W.; Shi, W.; Hao, G.; Liu, X.; Mei, J. Experimental study of parameters of tunneling blasting in jointed layered rock mass. J. China Univ. Min. Technol. 2019, 48, 1248–1255. [Google Scholar] [CrossRef]
  24. Lisjak, A.; Grasselli, G.; Vietor, T. Continuum-discontinuum analysis of failure mechanisms around unsupported circular excavations in anisotropic clay shales. Int. J. Rock Mech. Min. Sci. 2014, 65, 96–115. [Google Scholar] [CrossRef]
  25. Xie, L.X.; Yang, S.Q.; Gu, J.C.; Zhang, Q.B.; Lu, W.B. JHR constitutive model for rock under dynamic loads. Comput. Geotech. 2019, 108, 161–172. [Google Scholar] [CrossRef]
  26. Itasca Consulting Group, Inc. Three-Dimensional Distinct Element Code: User’s Guide; Itasca Consulting Group, Inc.: Minneapolis, MN, USA, 2003. [Google Scholar]
  27. Gao, W.; Zhang, J.; Li, C.; Cheng, L.; Liu, P. Study on Muck Pile Shape of Open-Pit Bench Blasting Based on PFC. Shock Vib. 2023, 2023, 2859668. [Google Scholar] [CrossRef]
  28. Yu, R.; Zhang, Z.; Gao, W.; Li, C.; Wu, C. Numerical simulation of rock mass blasting vibration using particle flow code and particle expansion loading algorithm. Simul. Model. Pract. Theory 2023, 122, 102686. [Google Scholar] [CrossRef]
  29. Zhao, X.; Zhao, J.; Cai, J.; Hefny, A.M. UDEC modelling on wave propagation across fractured rock masses. Comput. Geotech. 2008, 35, 97–104. [Google Scholar] [CrossRef]
  30. Ning, Y.; Yang, J.; An, X.; Ma, G. Modelling rock fracturing and blast-induced rock mass failure via advanced discretisation within the discontinuous deformation analysis framework. Comput. Geotech. 2011, 38, 40–49. [Google Scholar] [CrossRef]
  31. Ning, Y.; Yang, J.; Ma, G.; Chen, P. Modelling rock blasting considering explosion gas penetration using discontinuous deformation analysis. Rock Mech. Rock Eng. 2011, 44, 483–490. [Google Scholar] [CrossRef]
  32. Lee, E.L.; Hornig, H.C.; Kury, J.W. Adiabatic Expansion of High Explosive Detonation Products (No. UCRL-50422); Univ. of California Radiation Lab. at Livermore: Livermore, CA, USA, 1968. [Google Scholar]
  33. Riedel, W.; Thoma, K.; Hiermaier, S.; Schmolinske, E. Penetration of reinforced concrete by BETA-B-500 numerical analysis using a new macroscopic concrete model for hydrocodes. In Proceedings of the 9th International Symposium on the Effects of Munitions with Structures, Berlin-Strausberg, Germany, 3–4 May 1999; Volume 315, pp. 315–322. [Google Scholar]
  34. Zhou, H.; Gao, Q.; Fan, Y.; Lu, W.; Wang, Y.; Yang, Y.; Leng, Z. Analysis of causes of vibration differences induced by different kinds of blastholes based on the interpretation of blasting parameters: A case study in dam foundation excavation. Rock Mech. Rock Eng. 2023, 56, 7237–7254. [Google Scholar] [CrossRef]
  35. Knock, C.; Davies, N. Blast waves from cylindrical charges. Shock Waves 2013, 23, 337–343. [Google Scholar] [CrossRef]
  36. Saadatmand Hashemi, A.; Katsabanis, P. The effect of stress wave interaction and delay timing on blast-induced rock damage and fragmentation. Rock Mech. Rock Eng. 2020, 53, 2327–2346. [Google Scholar] [CrossRef]
  37. Jayasinghe, L.B.; Shang, J.; Zhao, Z.; Goh, A.T.C. Numerical investigation into the blasting-induced damage characteristics of rocks considering the role of in-situ stresses and discontinuity persistence. Comput. Geotech. 2019, 116, 103207. [Google Scholar] [CrossRef]
  38. Ye, Z.; Chen, M. Characteristics of Peak Load on a Borehole Wall in Water-Coupling Blasting. J. Eng. Mech. 2023, 149, 04022087. [Google Scholar] [CrossRef]
  39. Chen, M.; Ye, Z.; Lu, W.; Wei, D.; Yan, P. An improved method for calculating the peak explosion pressure on the borehole wall in decoupling charge blasting. Int. J. Impact Eng. 2020, 146, 103695. [Google Scholar] [CrossRef]
  40. Leng, Z.; Sun, J.; Lu, W.; Xie, X.; Jia, Y.; Zhou, G.; Chen, M. Mechanism of the in-hole detonation wave interactions in dual initiation with electronic detonators in bench blasting operation. Comput. Geotech. 2021, 129, 103873. [Google Scholar] [CrossRef]
  41. Liu, L.; Lu, W.; Chen, M.; Yan, P.; Wang, G.H. Statistic damage threshold of critical broken rock mass under blasting load. Chin. J. Rock Mech. Eng. 2016, 35, 1133–1140. (In Chinese) [Google Scholar] [CrossRef]
Figure 1. Two-dimensional plane strain model.
Applsci 15 03365 g001
Figure 2. Detonation process in a coupled charge.
Applsci 15 03365 g002
Figure 3. Load curve of blast hole wall.
Applsci 15 03365 g003
Figure 4. Two-point detonation initiation process.
Applsci 15 03365 g004
Figure 5. Blast hole wall load at two points of detonation.
Applsci 15 03365 g005
Figure 6. Detonation wave propagation of air-uncoupled charge at uncoupling coefficients of 1.29 and 1.57.
Applsci 15 03365 g006
Figure 7. Detonation wave propagation of water-uncoupled charge at uncoupling coefficients 1.29 and 1.57.
Applsci 15 03365 g007
Figure 8. Time–history curve of hole wall pressure under different charging structures.
Applsci 15 03365 g008
Figure 9. Plane strain model of group hole blasting.
Applsci 15 03365 g009
Figure 10. Rock fragmentation results.
Applsci 15 03365 g010
Figure 11. Boundary identification of rock fragments.
Applsci 15 03365 g011
Figure 12. Recognition of blast-induced fragment.
Applsci 15 03365 g012
Figure 13. Rock blasting block grading curve.
Applsci 15 03365 g013
Figure 14. Simulation and analysis process of rock blasting fragmentation.
Applsci 15 03365 g014
Figure 15. Onsite rock blasting network experiment.
Applsci 15 03365 g015
Figure 16. Charge structure.
Applsci 15 03365 g016
Figure 17. Photos of the onsite experiment.
Applsci 15 03365 g017
Figure 18. Onsite screening test. (a) After onsite blasting; (b) rock fragments in the selected region; (c) onsite screening test.
Applsci 15 03365 g018
Figure 19. Results of the first onsite blasting experiment.
Applsci 15 03365 g019
Figure 20. Results of the second onsite blasting experiment.
Applsci 15 03365 g020
Figure 21. Results of the third onsite blasting experiment.
Applsci 15 03365 g021
Figure 22. Three-dimensional numerical calculation model.
Applsci 15 03365 g022
Figure 23. Three-dimensional numerical simulation result.
Applsci 15 03365 g023
Figure 24. Rock blasting fragment identification and analysis process. (a) Simulation result; (b) image of rock fragments; (c) rock fragments identified by WipFrag; (d) rock fragment size grading curve.
Applsci 15 03365 g024
Figure 25. Comparison of numerical simulation and onsite experiment results.
Applsci 15 03365 g025
Figure 26. Two-dimensional rock blasting fragment calculation model.
Applsci 15 03365 g026
Figure 27. Rock fragmentation distribution under different blast hole spacings.
Applsci 15 03365 g027
Figure 28. Grading curves of rock fragments under different blast hole spacings.
Applsci 15 03365 g028
Table 1. Advantages and disadvantages of common numerical simulation methods for rock blasting.
Numerical Simulation MethodsSoftwareAdvantagesDisadvantages
Finite element methodLS-DYNAThese methods excel in simulating stress waves, loads, vibrations, and damage resulting from explosions.They are limited in simulating large deformation failures, such as rock ejection.
ANTODYN
ANSYS
Discrete element method3DECThese methods are capable of simulating phenomena such as rock fragmentation and ejection during blasting.It is not capable of accurately simulating the detonation process of explosives.
DDA
PFC
Continuous–discontinuous methodCDEMThese methods effectively simulate the rock failure process under the influence of explosive detonation.The parameter configuration is complex, computational efficiency is relatively low, and the rock failure criterion has not yet been widely accepted.
FDEM
CDM
Table 2. Explosive materials and state equation parameters.
ρ/(kg∙m−3)VoD/(m∙s−1)A1/GPaB1/GPaR1R2E0/GPa
11004800214.40.1824.20.94.192
Table 3. Parameters of rock materials used in the RHT model.
Density/(kg·m−3)Young’s Modulus/GPaPoisson’s RatioYield Strength/MPaShear Modulus/GPaHardening Index β
20602.50.2524510.50.5
Table 4. Detailed blasting parameters.
Blasting ParameterContent
Bench height13.5 m
Blast hole layoutRectangle
Drilling diameter115 mm
Drilling angle90°
Drilling depth15 m
Blast hole spacing3 m
Array pitch2 m
Front resistance line2.0 m
Explosive type2# emulsion explosive
The main blasting charge structureContinuous charging
Stemming length2.5 m
Explosive length12.5 m
Delayed initiation modeDigital electronic detonator 17 ms delayed initiation
Table 5. Related parameters of rock materials.
Density/(kg·m−3)Young’s Modulus/GPaPoisson’s RatioYield Strength/MPaShear Modulus/GPaHardening Index β
24402.50.2524510.50.5
Disclaimer/Publisher’s Note: The statements, opinions and data contained in all publications are solely those of the individual author(s) and contributor(s) and not of MDPI and/or the editor(s). MDPI and/or the editor(s) disclaim responsibility for any injury to people or property resulting from any ideas, methods, instructions or products referred to in the content.

