Article

Real-Time State Evaluation System of Antenna Structures in Radio Telescopes Based on a Digital Twin

1
College of Mechanical Engineering, Xinjiang University, Urumqi 830047, China
2
School of Mechano-Electronic Engineering, Xidian University, Xi’an 710071, China
3
Xi’an Institute of Optics and Precision Mechanics, Chinese Academy of Sciences, Xi’an 710119, China
*
Author to whom correspondence should be addressed.
Appl. Sci. 2025, 15(6), 3325; https://doi.org/10.3390/app15063325
Submission received: 19 February 2025 / Revised: 15 March 2025 / Accepted: 16 March 2025 / Published: 18 March 2025

Abstract

:
To enhance the intelligence and digital management level of radio telescopes and ensure the safe and stable operation of antennas, this paper proposes a real-time state evaluation method for the antenna structure of radio telescopes based on digital twin (DT) technology. Firstly, based on the five-dimensional model of DT, a digital twin system (DTs) framework for radio telescopes is designed. Secondly, the quadric error metrics (QEM) mesh-simplification algorithm and mesh-reconstruction technology are employed to obtain a lightweight twin model of the antenna. Furthermore, a random forest (RF) regression surrogate model is established using finite element point cloud data samples. The K-nearest neighbor (KNN) algorithm and radial basis function (RBF) interpolation algorithm are utilized to construct the virtual–physical mapping model of the antenna, enabling rapid prediction and evaluation of the antenna structure state. Finally, a DT for real-time antenna structure state evaluation is developed using the Unity3D engine, with an experimental prototype of a reflector antenna as the object. Experimental results show that the average prediction accuracy of the physical field surrogate model of the system is 0.98, and the average computation time is 0.4 s. The system meets the precision and computational efficiency requirements for the real-time and accurate evaluation of the antenna structure state.

1. Introduction

The radio telescope is the basic equipment for observing and studying radio waves from celestial bodies, and it is widely used in astronomy, radar, communication, and other fields [1]. With the rapid development of radio astronomy technology, the design, construction, and feeding technology of the antenna have been significantly upgraded, and the requirements for the working performance of the antenna are getting higher and higher. The radio telescope is gradually developing in the direction of large aperture, high gain, and high-frequency bands [2]. However, a radio telescope will be subjected to external loads such as wind and temperature, along with its self-weight, during operation, causing deformation of the antenna structure. This deformation will not only cause the antenna surface accuracy to deteriorate but will also reduce the antenna’s pointing accuracy. Consequently, the reflective surface deformation and pointing error double superposition will ultimately significantly affect the antenna’s receiving sensitivity and signal-focusing ability [3]. At the same time, as a high-precision radio astronomical observation platform, the radio telescope has a complex engineering structure, difficult operation and maintenance, a remote location, and a long cycle [4]. Although the current monitoring system of the radio telescope adopts a distributed control method and realizes remote monitoring of equipment, there are still some problems, such as low integration, insufficient intelligence, weak interaction, and poor visualization. As a new round of scientific and technological revolution and industrial transformation evolves rapidly, higher requirements have been put forward for the antenna monitoring system, which makes the condition monitoring and evaluation of modern radio telescopes develop in the direction of intelligence and digitization.
In response to these challenges, many institutions and experts have invested significant effort into researching more intelligent and effective control methods. The Nanshan 26 m radio telescope, shown in Figure 1, focuses on pulsar observations, molecular spectral line studies, very long baseline interferometry (VLBI) [5], and deep space exploration. It employs a distributed management system based on the native GUI mode for monitoring, enabling the real-time oversight of certain equipment. Madanayake A et al. [6] have enhanced the efficiency of high-frequency signal processing in radio telescopes by implementing multi-dimensional signal processing and the real-time optimization of Field-Programmable Gate Array (FPGA) and digital very large-scale integration (VLSI) architectures. This has led to a substantial improvement in imaging accuracy and anti-interference performance. The Sardinian Radio Telescope in Italy has developed a set of primary reflector system control software based on the Python 2.7 language [7], which uses 1008 electromechanical actuators to dynamically adjust its active surface panels [8]. Guo et al. [9] designed a comprehensive online monitoring system for the Shanghai Tianma radio telescope, which realized the monitoring and protection of lightning waveforms. Despite the achievements of these monitoring methods, there are still deficiencies in terms of globalization, digitization, visualization, and rapid two-way interaction.
The emergence of digital twin (DT) technology provides a new idea for digital management and full lifecycle monitoring of radio telescopes. Based on the Internet of Things technology, DT uses digital methods to build a high-fidelity twin model for physical entities. Through data collection, fusion, and mapping, the twin model can reflect the attributes, behaviors, states, and performance of physical entities in real time and perform rapid simulation and prediction [10]. Guerra-Zubiaga et al. [11] used DT technology to optimize the drilling process, and through simulation analysis, identified the critical impact of robot model joints on drilling operations. It is demonstrated that DT technology has great potential to optimize manufacturing production. Hartwell A et al. [12] proposed an aero-engine fault monitoring scheme based on DT technology, which realizes online fault detection based on a convolutional neural network. Tripathi V et al. [13] created a virtual DT method that can reconstruct the entire flight scenario and can predict signal and interference reception, which in turn dramatically improves the reliability and safety of navigation systems. The above examples prove that DT can play a huge role in the engineering field.
At present, many scholars have introduced DT technology into the field of radio telescopes. Aiming at the problem of the low automation management of radio telescopes, Zhang et al. [14] designed a digital twin system (DTs) for the whole-lifecycle supervision of feed cabins by taking Tianyan as an example. Taljaard C et al. [15] created a virtual model of the radio telescope system based on DT technology. This was simulated and analyzed in order to optimize the maintenance schedule, improve the availability of the system, and guarantee the reliable operation of the radio telescope in remote and harsh environments. Li et al. [16] developed a set of FAST cable-net-operation quasi-real-time evaluation DTs for FAST cable-net structure. Pelham T [17] used DT technology to create virtual models of radar antennas and platforms, using LyceanEM 0.0.7 to rapidly predict antenna radiation patterns and maximum directivity, enabling efficient virtual prototyping performance evaluation. Although the above research has realized the intelligent and digital monitoring of the radio telescope, the monitoring and evaluation of the overall structural state of the reflector antenna still needs further research.
Therefore, based on DT technology, a real-time monitoring and evaluation system for the DT structure state of a radio telescope is established in this paper. Through mesh simplification and mesh reconstruction technology, a lightweight virtual model of a radio telescope is constructed. The kinematic model of the radio telescope and the data-driven high-fidelity random forest (RF) regression surrogate model are established to realize the rapid prediction and evaluation of the antenna structure state. At the same time, the intelligent algorithm is used to realize the virtual shape–performance mapping of the antenna. Finally, based on the visualization platform, through the communication, transmission, and storage of twin data, the construction of the DT visualization system of the radio telescope is completed, and the feasibility of the system is verified by an example.

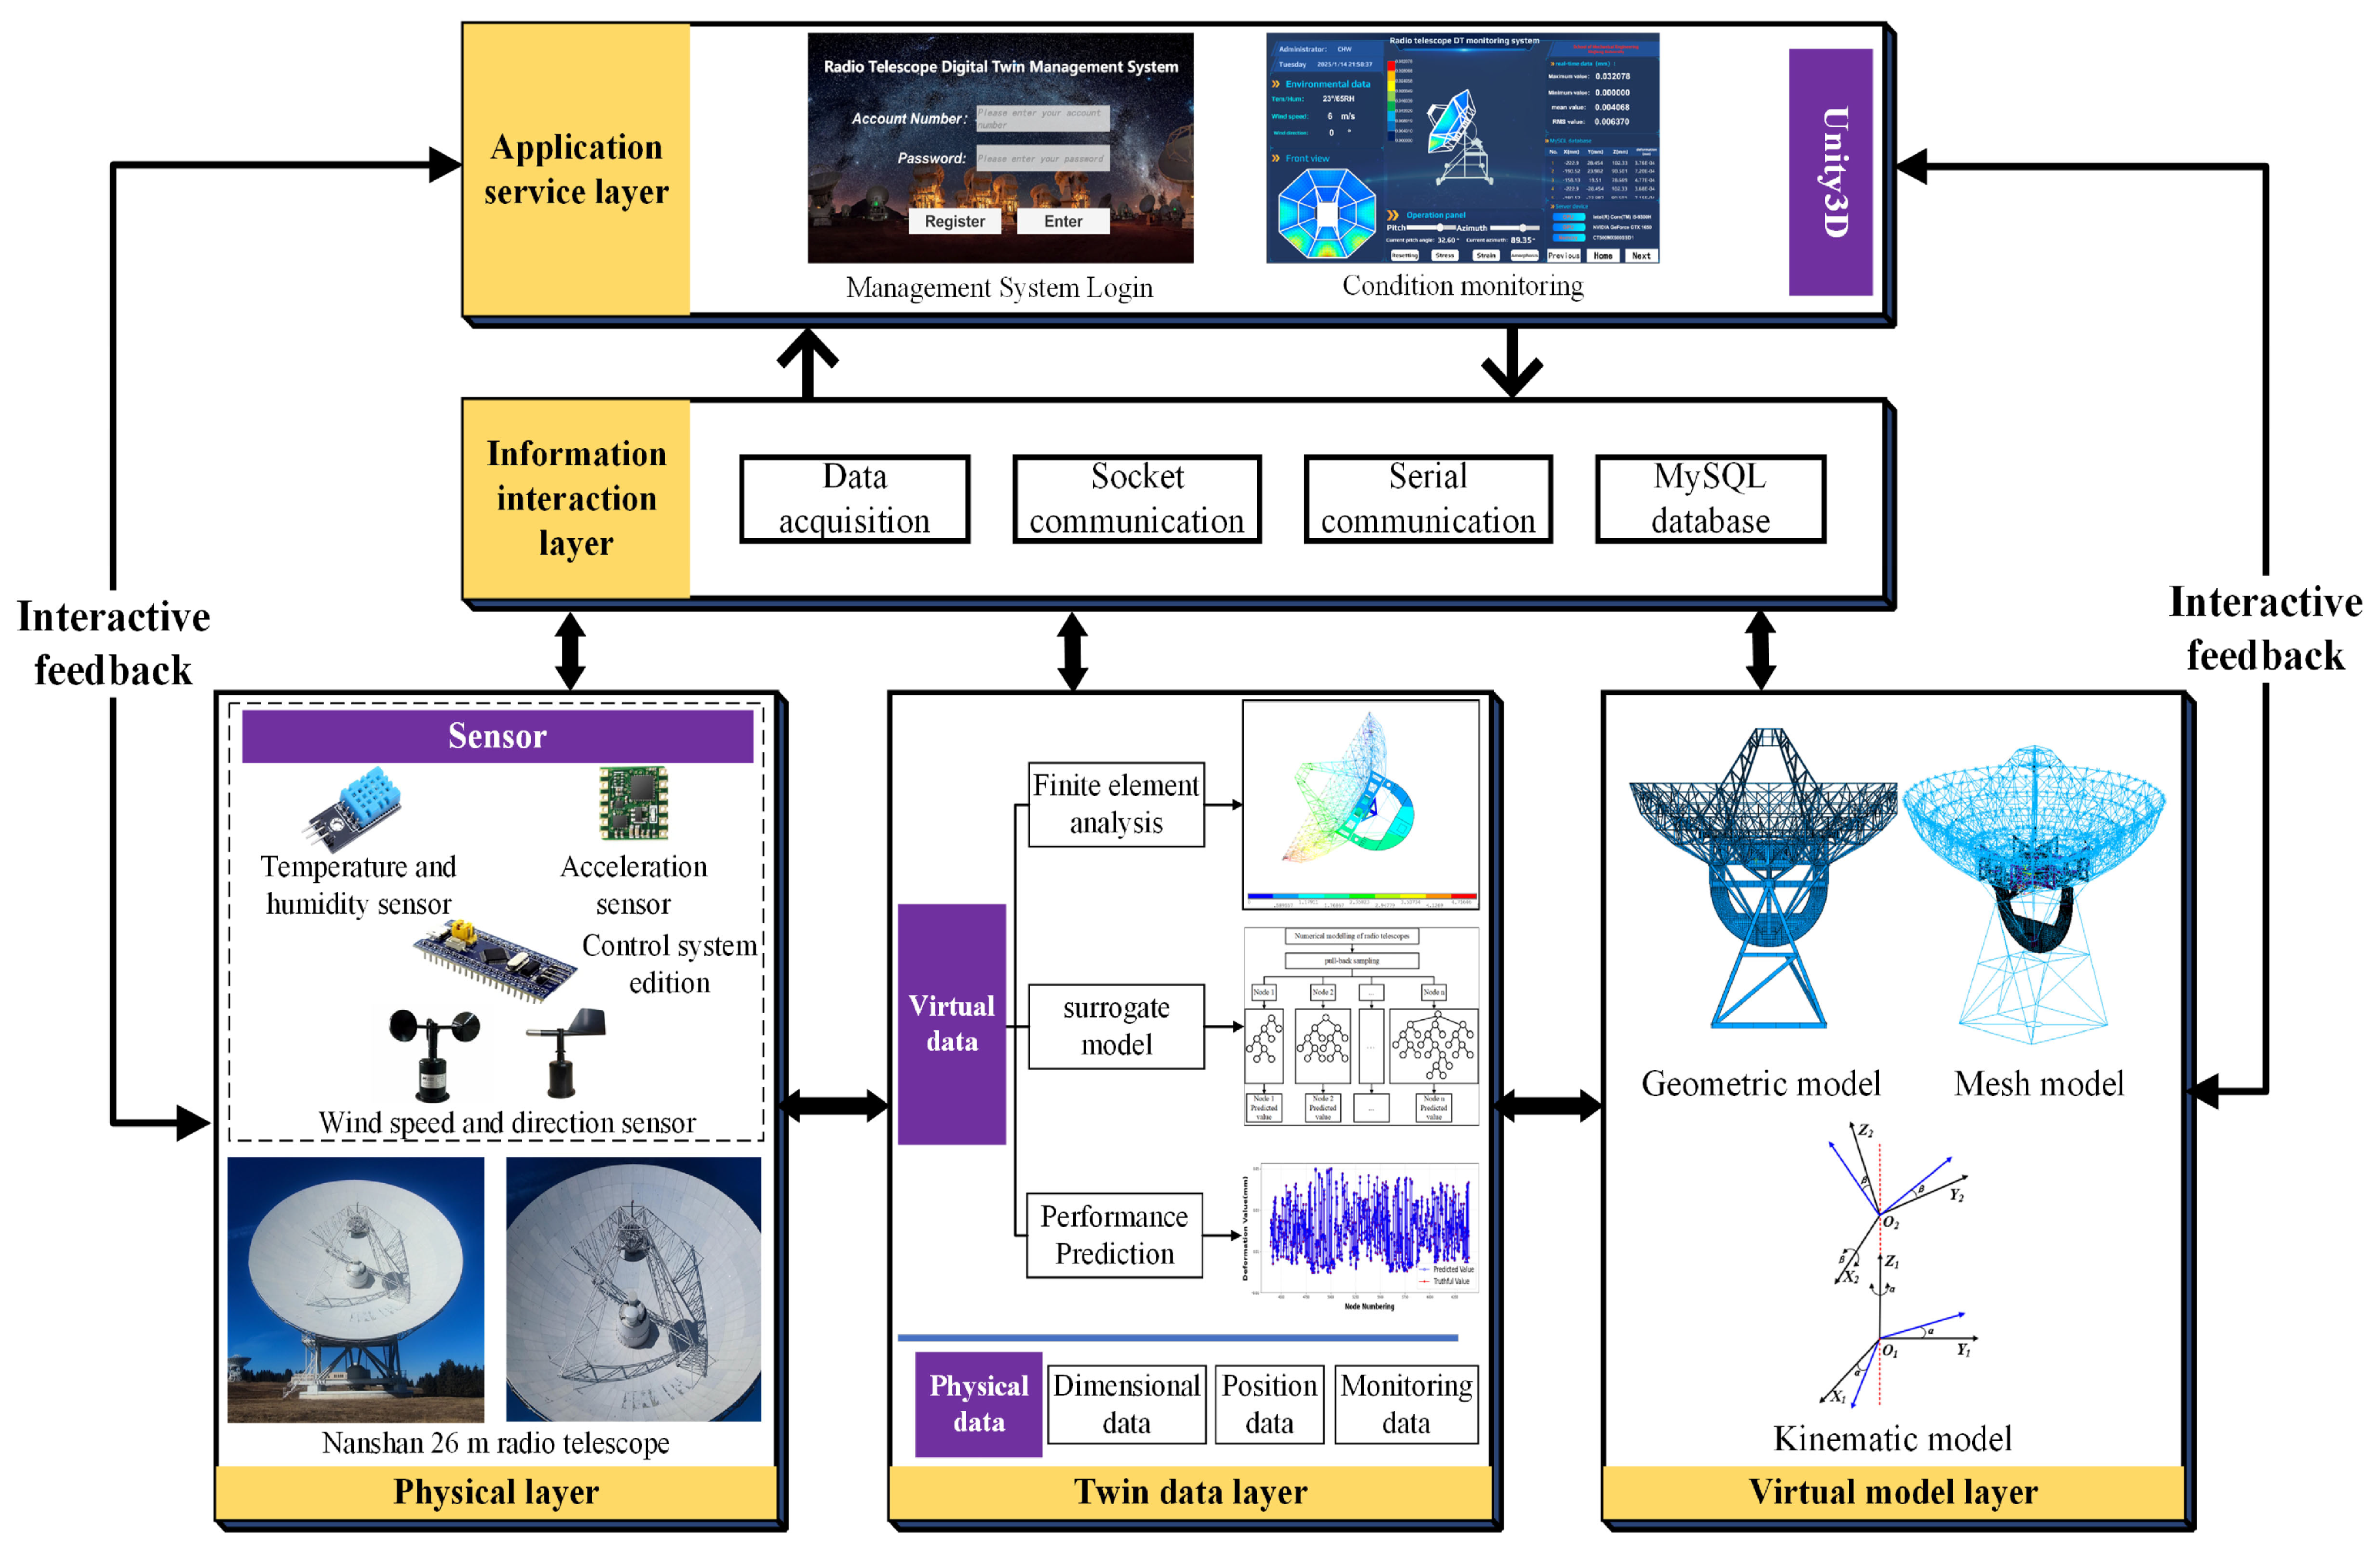
2. DTs Framework of the Radio Telescope
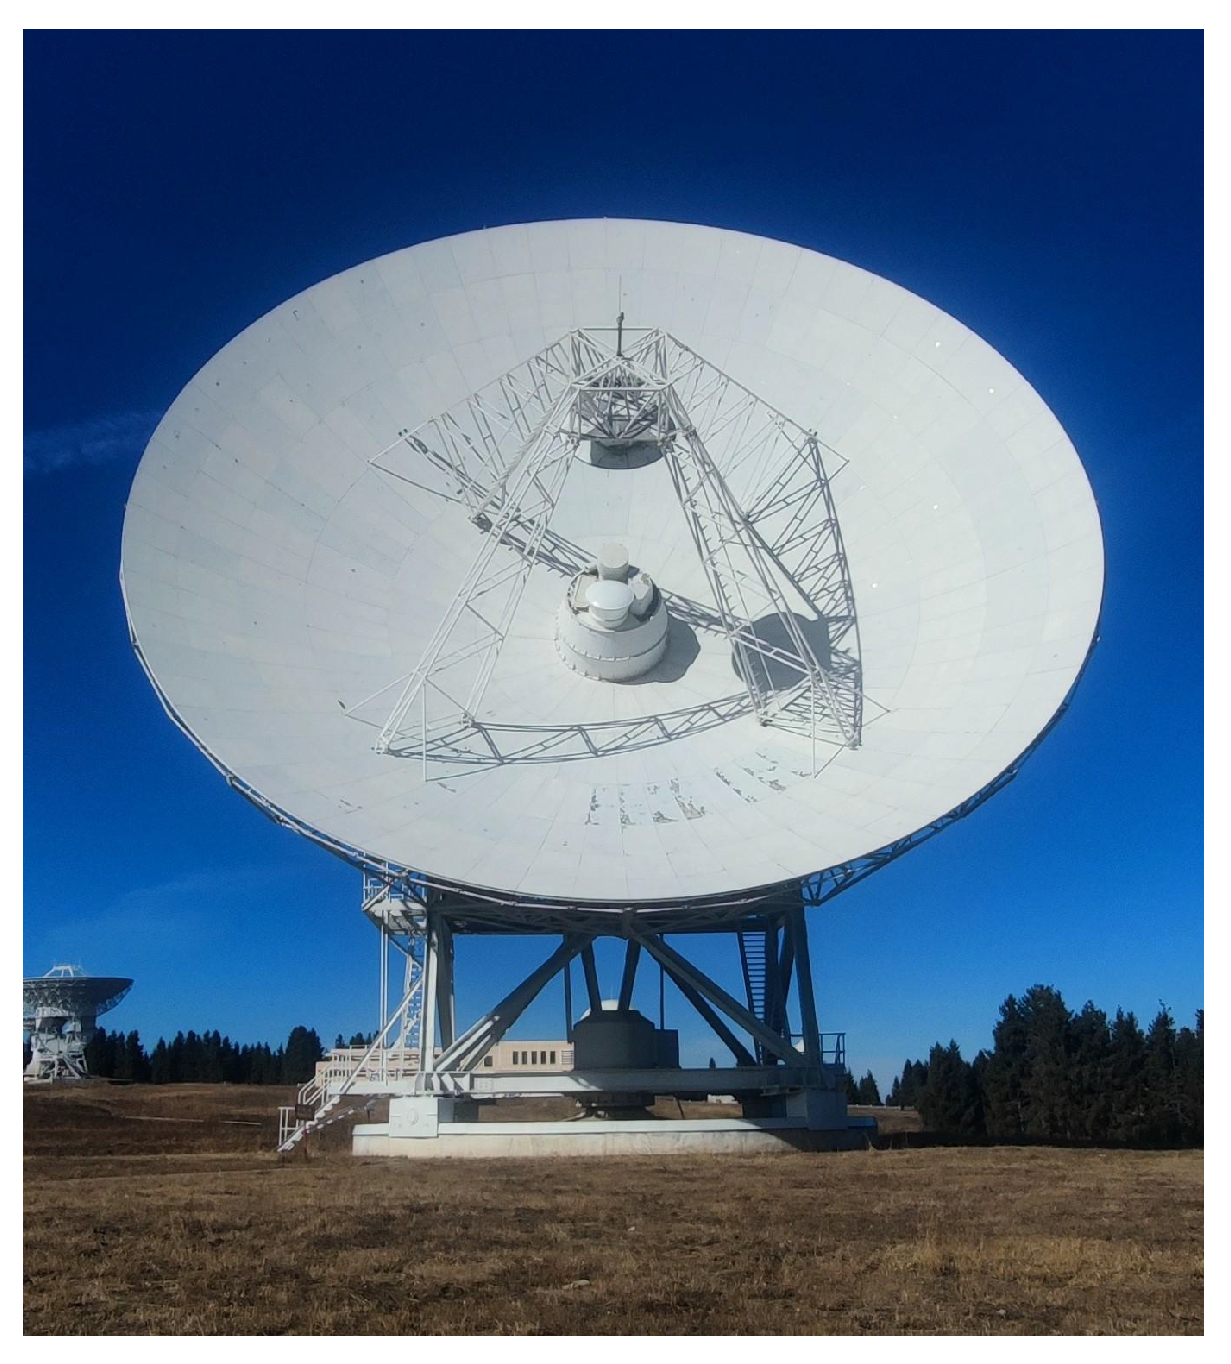
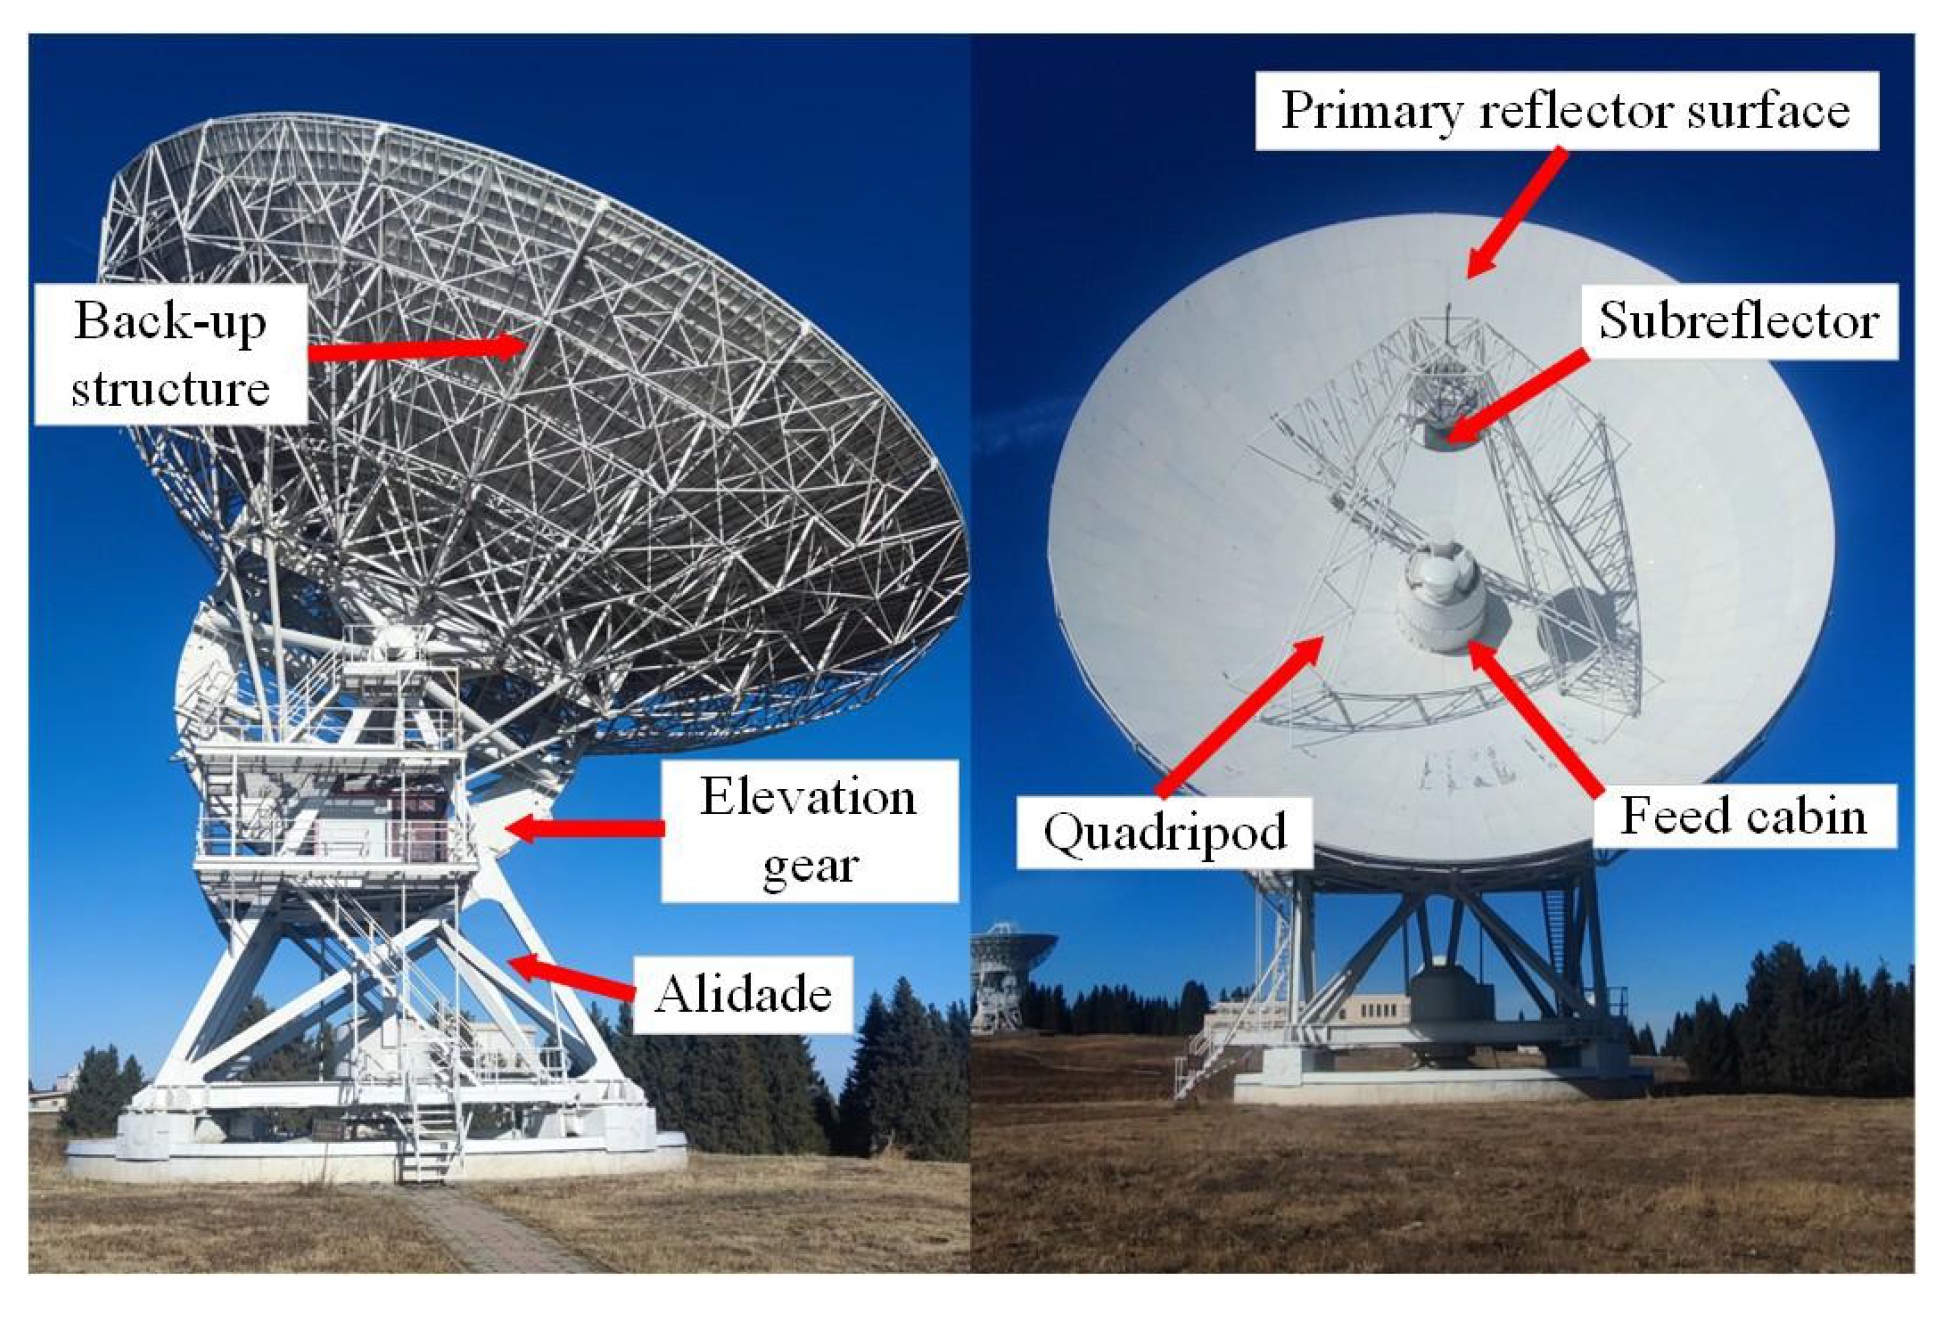
The current DT technology lacks a common reference model. The DT five-dimensional model system proposed by the Beihang University team has been proven to have good practicability and universality through experimental exploration, and its model structure is shown in Equation (1):
M D T = L P E , L V E , L C N , L D D , L S S
where L P E represents the physical entity layer, L V E represents the twin model layer, L C N represents the information transmission layer, L D D represents the twin data layer, and L S S represents the application service layer [18].
Therefore, to realize the monitoring and evaluation of the real-time state of the radio telescope, this paper constructs the DTs of the radio telescope based on the above model framework system and the actual working state of the antenna. The system’s framework is shown in Figure 2.
  • Physical entity layer
    The physical entity layer is the foundation of the DTs, which mainly includes the radio telescope entity, sensor, and control system. The entity is mainly composed of the primary reflector, the subreflector, the backup structure, the panel, the elevation gear, the center body, the alidade, and so on. The sensor includes an acceleration sensor, wind speed and direction sensor, temperature and humidity sensor, etc. The control system includes servo motors and control algorithms that drive the elevation and azimuth motion of the antenna.
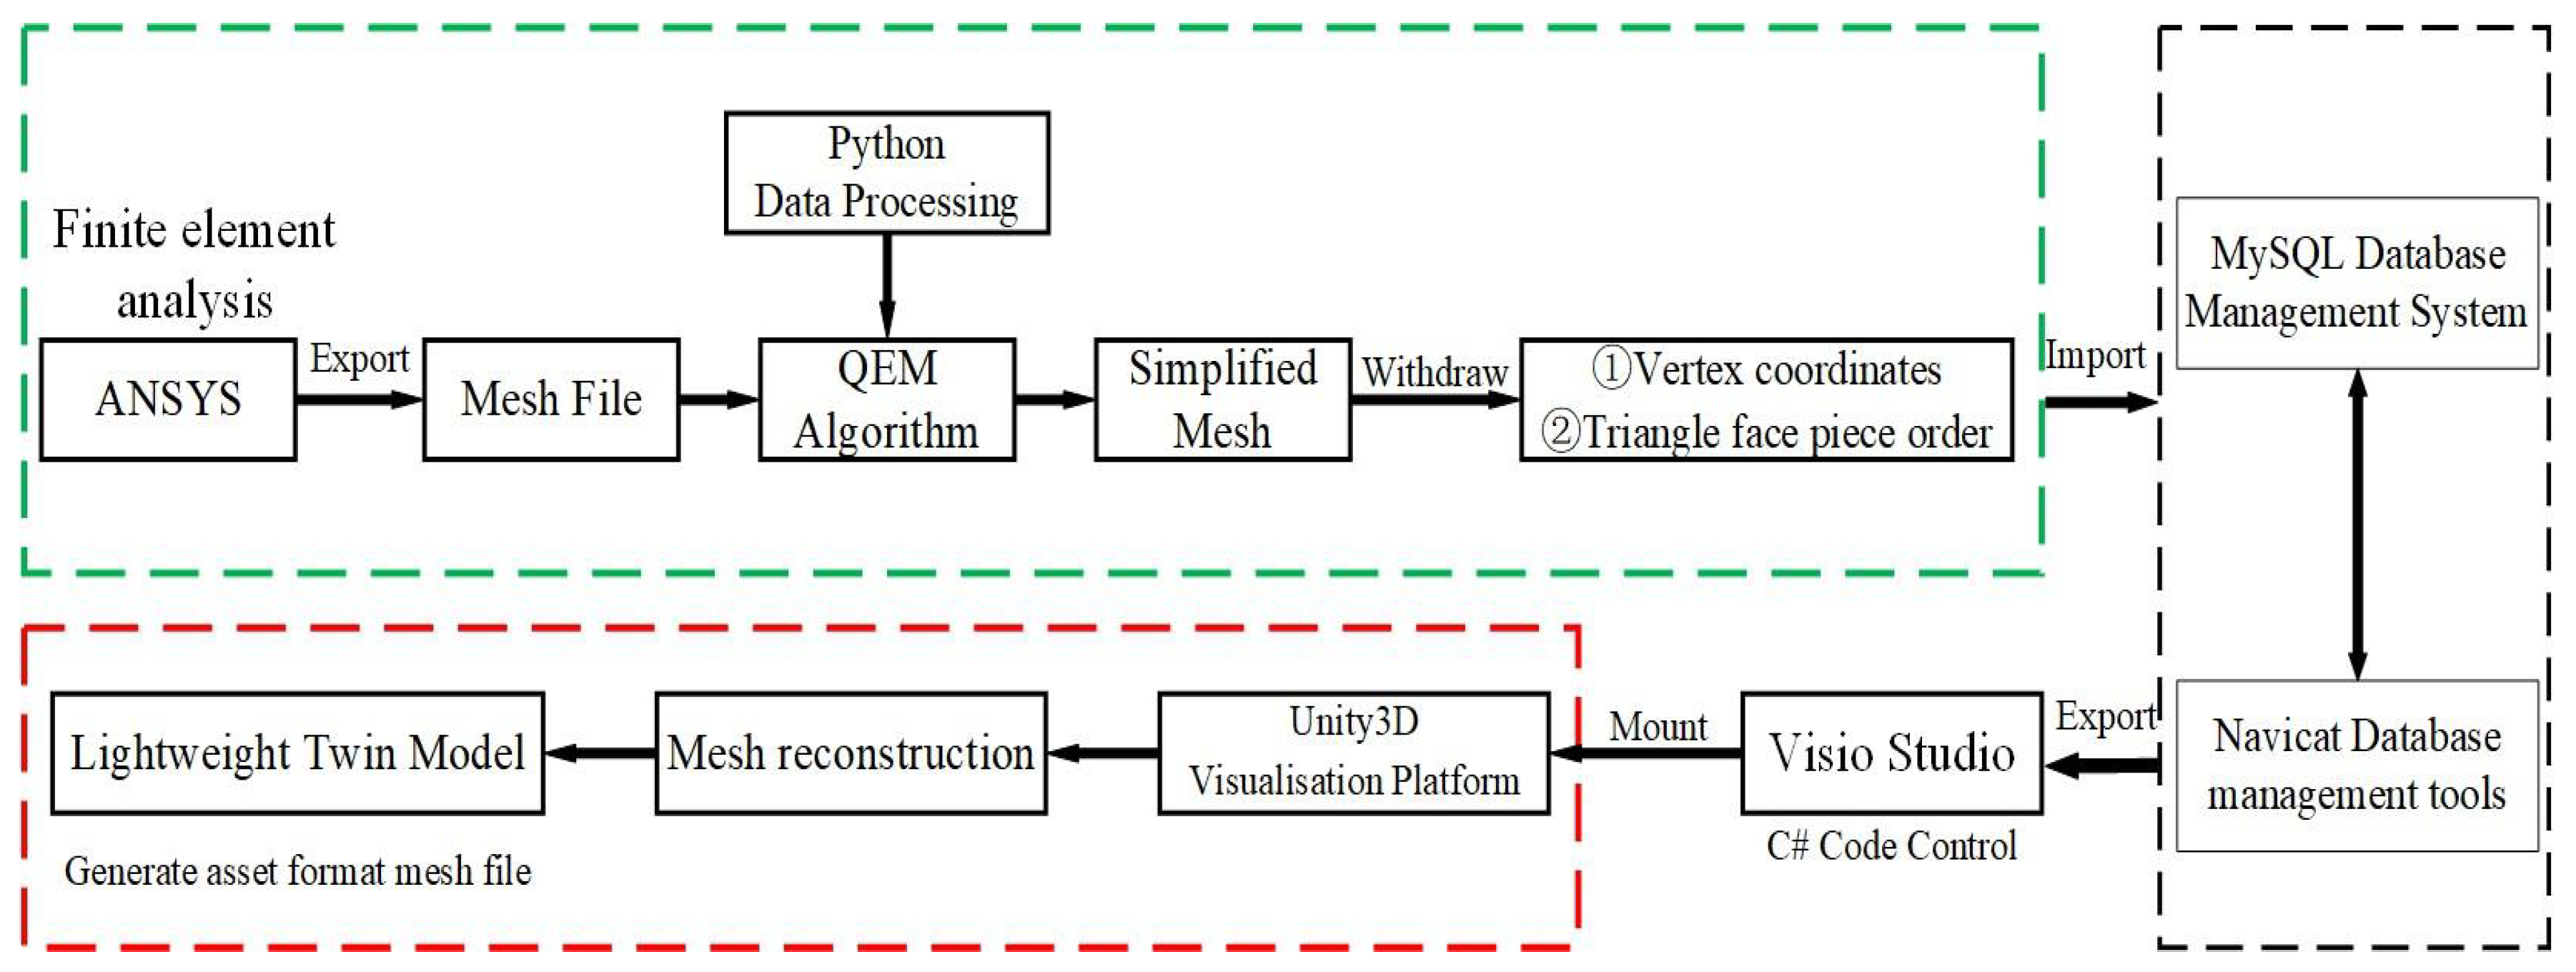
  • Twin model layer
    The twin model layer is the mapping of physical entities in the virtual space, which mainly includes the geometric model, kinematics model, and mechanism model of the radio telescope. The geometric model is obtained by modeling the real size of the entity in equal proportion, and the lightweight twin model is constructed by mesh simplification technology and mesh reconstruction algorithm. The kinematics model reflects the position, attitude, trajectory, and other motion state information of the radio telescope during operation, as well as the internal constraints of the system. The mechanism model contains the mechanical behavior and state information of the radio telescope in the coupled physical field.
  • Twin data layer
    The data layer is the key to ensuring the stable operation of the entire DT, including physical data and virtual data. Physical data comprise to the static attribute data and dynamic pose data of the radio telescope, sensor monitoring data, environmental data, etc. Virtual data comprise finite element simulation data, surrogate model prediction data, etc.
  • Information interaction layer
    The information interaction layer aims to realize efficient and accurate data interaction between physical entities and twin models. It mainly includes a communication module and database management module, which can realize the functions of data collection, processing, analysis, and storage in the system.
  • Application service layer
    The application service layer is the integration of various functions of the DTs. Based on the Unity3D visualization engine, this layer can realize core functions such as monitoring, evaluation, and human-computer interaction of the motion state and structural state in the DTs of the radio telescope.
Based on the above description, the construction of a real-time monitoring and evaluation system for radio telescopes mainly applies three key technologies: surrogate model technology, twin model lightweight technology, and virtual–real mapping. The surrogate model technology realizes the rapid and accurate prediction of the structural state by constructing a high-fidelity mathematical model based on finite element data. The lightweight twin model is the basis for realizing the rapid interaction between virtuality and reality. The virtual–real mapping realizes the interaction between real physical entities and twins through intelligent algorithms, data communication, data storage, etc.

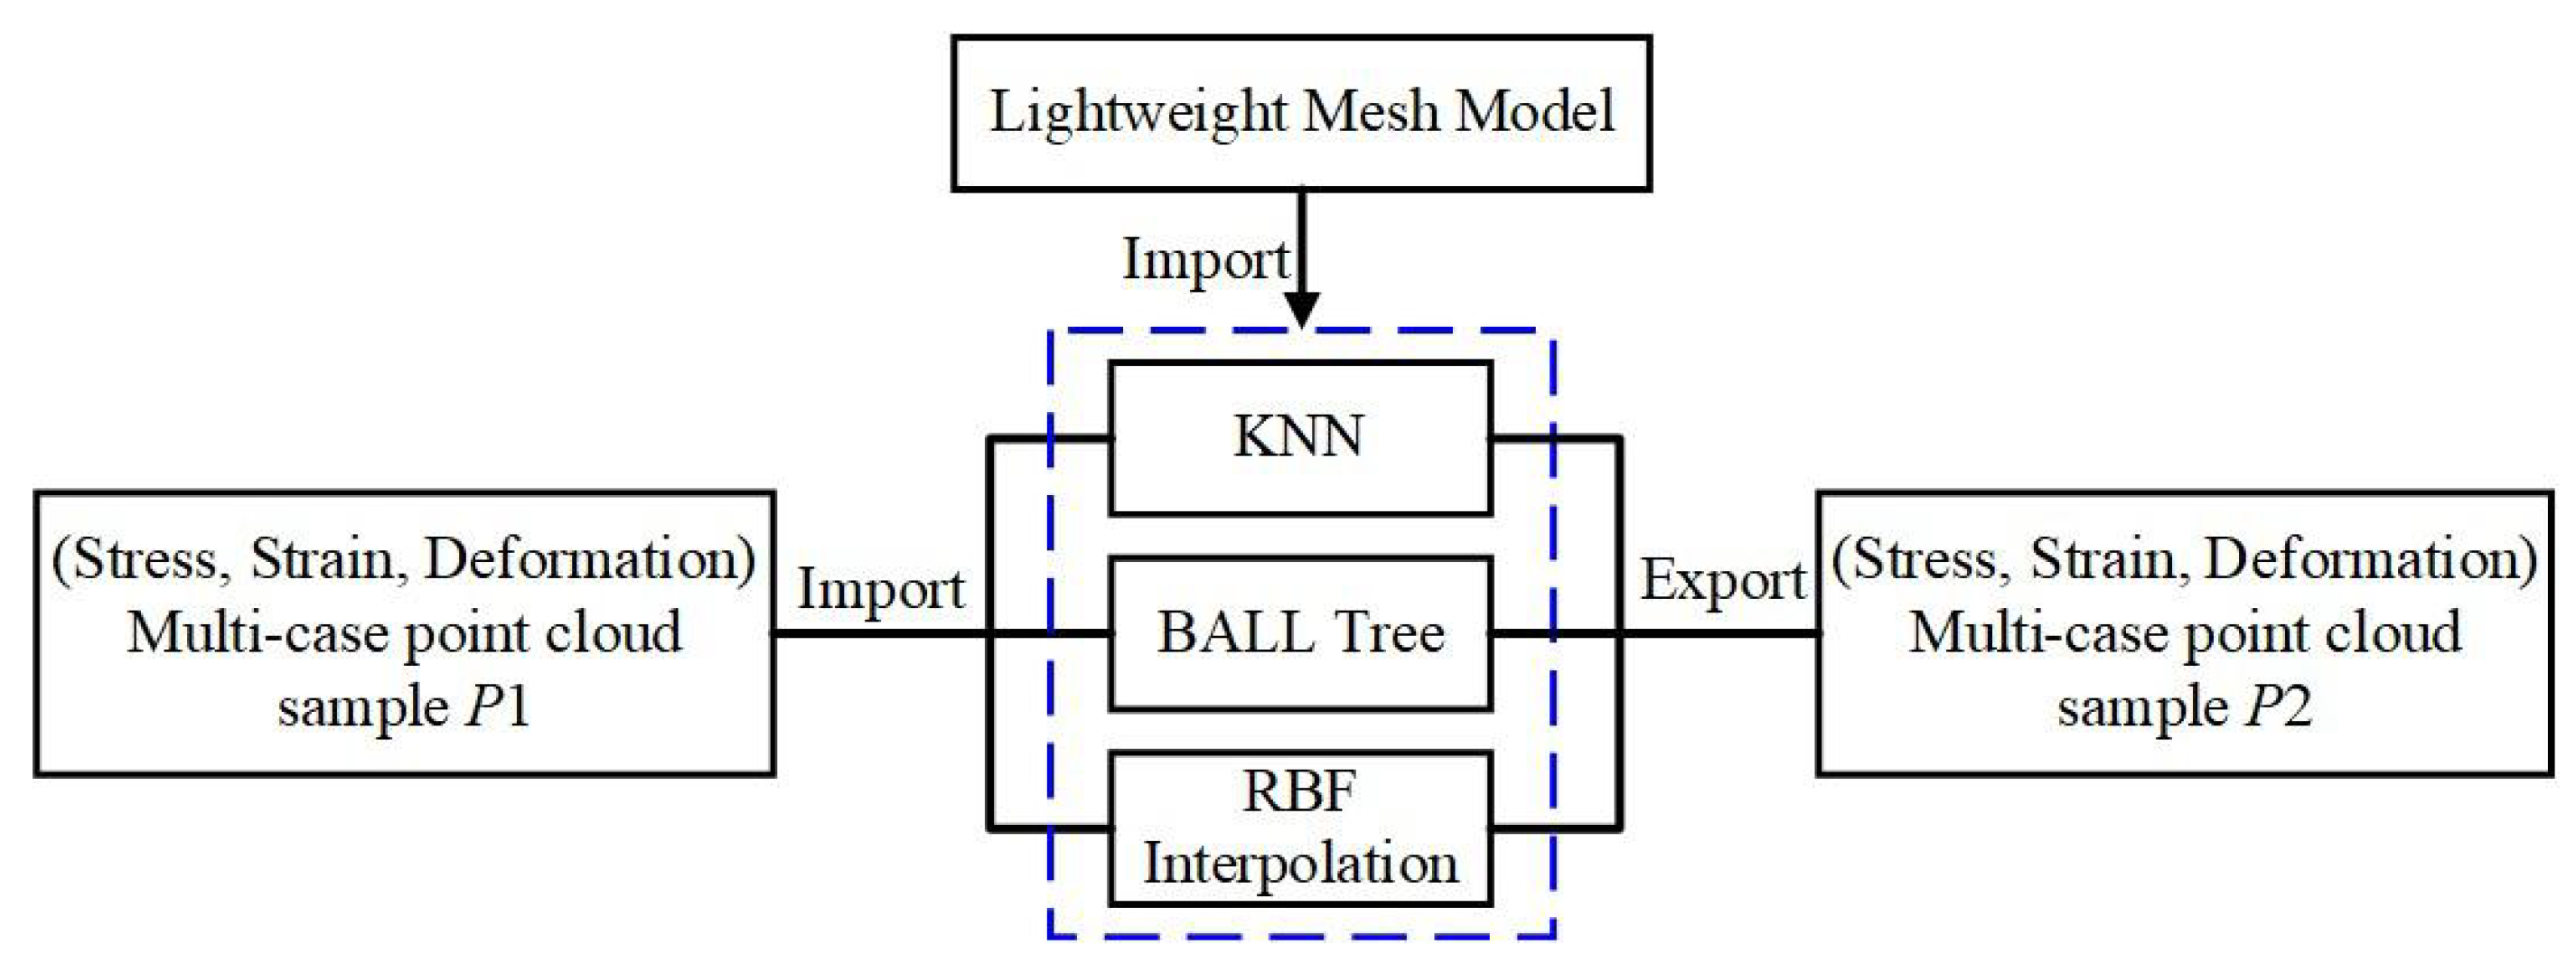
3. Construction of a Lightweight Twin Model

DT technology focuses on efficient real-time data mapping between physical entities and their corresponding twin models. There are a large number of triangular facets in the mesh model of a large antenna, and too many triangular facets need to spend a long calculation time in data processing and transmission, which does not meet the real-time requirements of DT technology. Therefore, to make the antenna twin model quickly and accurately map the current actual state of the physical entity, it is necessary to reduce the dimensions of the mesh model, that is, under the premise of ensuring the original geometric characteristics of the model, the number of vertices and faces is appropriately reduced, thereby reducing the amount of data and shortening the operation time.
The overall construction technical route of the lightweight twin model is shown in Figure 3. Firstly, based on the ANSYS APDL 2022 R2 mesh model, the improved quadric error metrics (QEMs) are used to simplify the mesh. Secondly, after extracting the vertex coordinates of the simplified mesh and the construction order of triangular facets, the mesh data are stored in the MySQL database. Finally, based on the mesh reconstruction algorithm of the Unity3D engine, the three-dimensional coordinates of the mesh and the node index are imported and assigned to the Mesh Filter component, and finally, the construction of the lightweight twin model is realized.
The key technology to build a lightweight model is the QEM algorithm. The core idea is to use edge contraction to reduce the number of triangular mesh faces. Each time, the edge with the smallest contraction cost is selected and iterated many times to achieve mesh simplification [19]. The algorithm process is shown in Figure 4.
Considering the one-time edge collapse, wherein the v 1 and v 2 points in the graph are shrunk into a point v i , the optimization objective v i is
ν i = a r g min ν p P ( ν 1 ) P ( ν 2 ) D ( ν , p ) 2 = a r g min ν p P ( ν 1 ) P ( ν 2 ) ν T K p ν
K p = p p T = a 2 a b a c a d a b b 2 b c b d a c b c c 2 c d a d b d c d d 2
Q ( v ) = p p ( v ) K p
where P ( v i ) denotes the original triangular face corresponding to v i , and p = a , b , c , d T denotes the set of all faces. The expression is a x + b y + c z + d = 0 , and a 2 + b 2 + c 2 = 1 . D ( v , p ) 2 denotes the distance from v i to the original triangle. K p denotes the fundamental error quadratic form of plane p. Q represents the quadratic error measure matrix, that is, the square of the distance from the vertex to the triangular surface is calculated according to K p . Then the collapse cost of the v 1 , v 2 points contracted to v i is
Δ ( v i ) = v T ( Q v 1 + Q v 2 ) v v T Q v i v
After the above steps, the triangular patches of the simplified model show uniformity, and the meshes obtained by ANSYS are different in size. Therefore, the feature details of the small meshes are lost after simplification, resulting in appearance distortion. Therefore, the triangular patch area constraint factor S is introduced, and a new folding cost is obtained. Equation (5) is updated as
Δ ( ν i ) = ν T ( i = 1 n S ν i Q ν i ) ν = ( i = 1 n S i ) ν T Q ν i ν i = 0 , 1 , 2 . . . n

4. Real-Time Simulation Construction of Antenna Physical Field

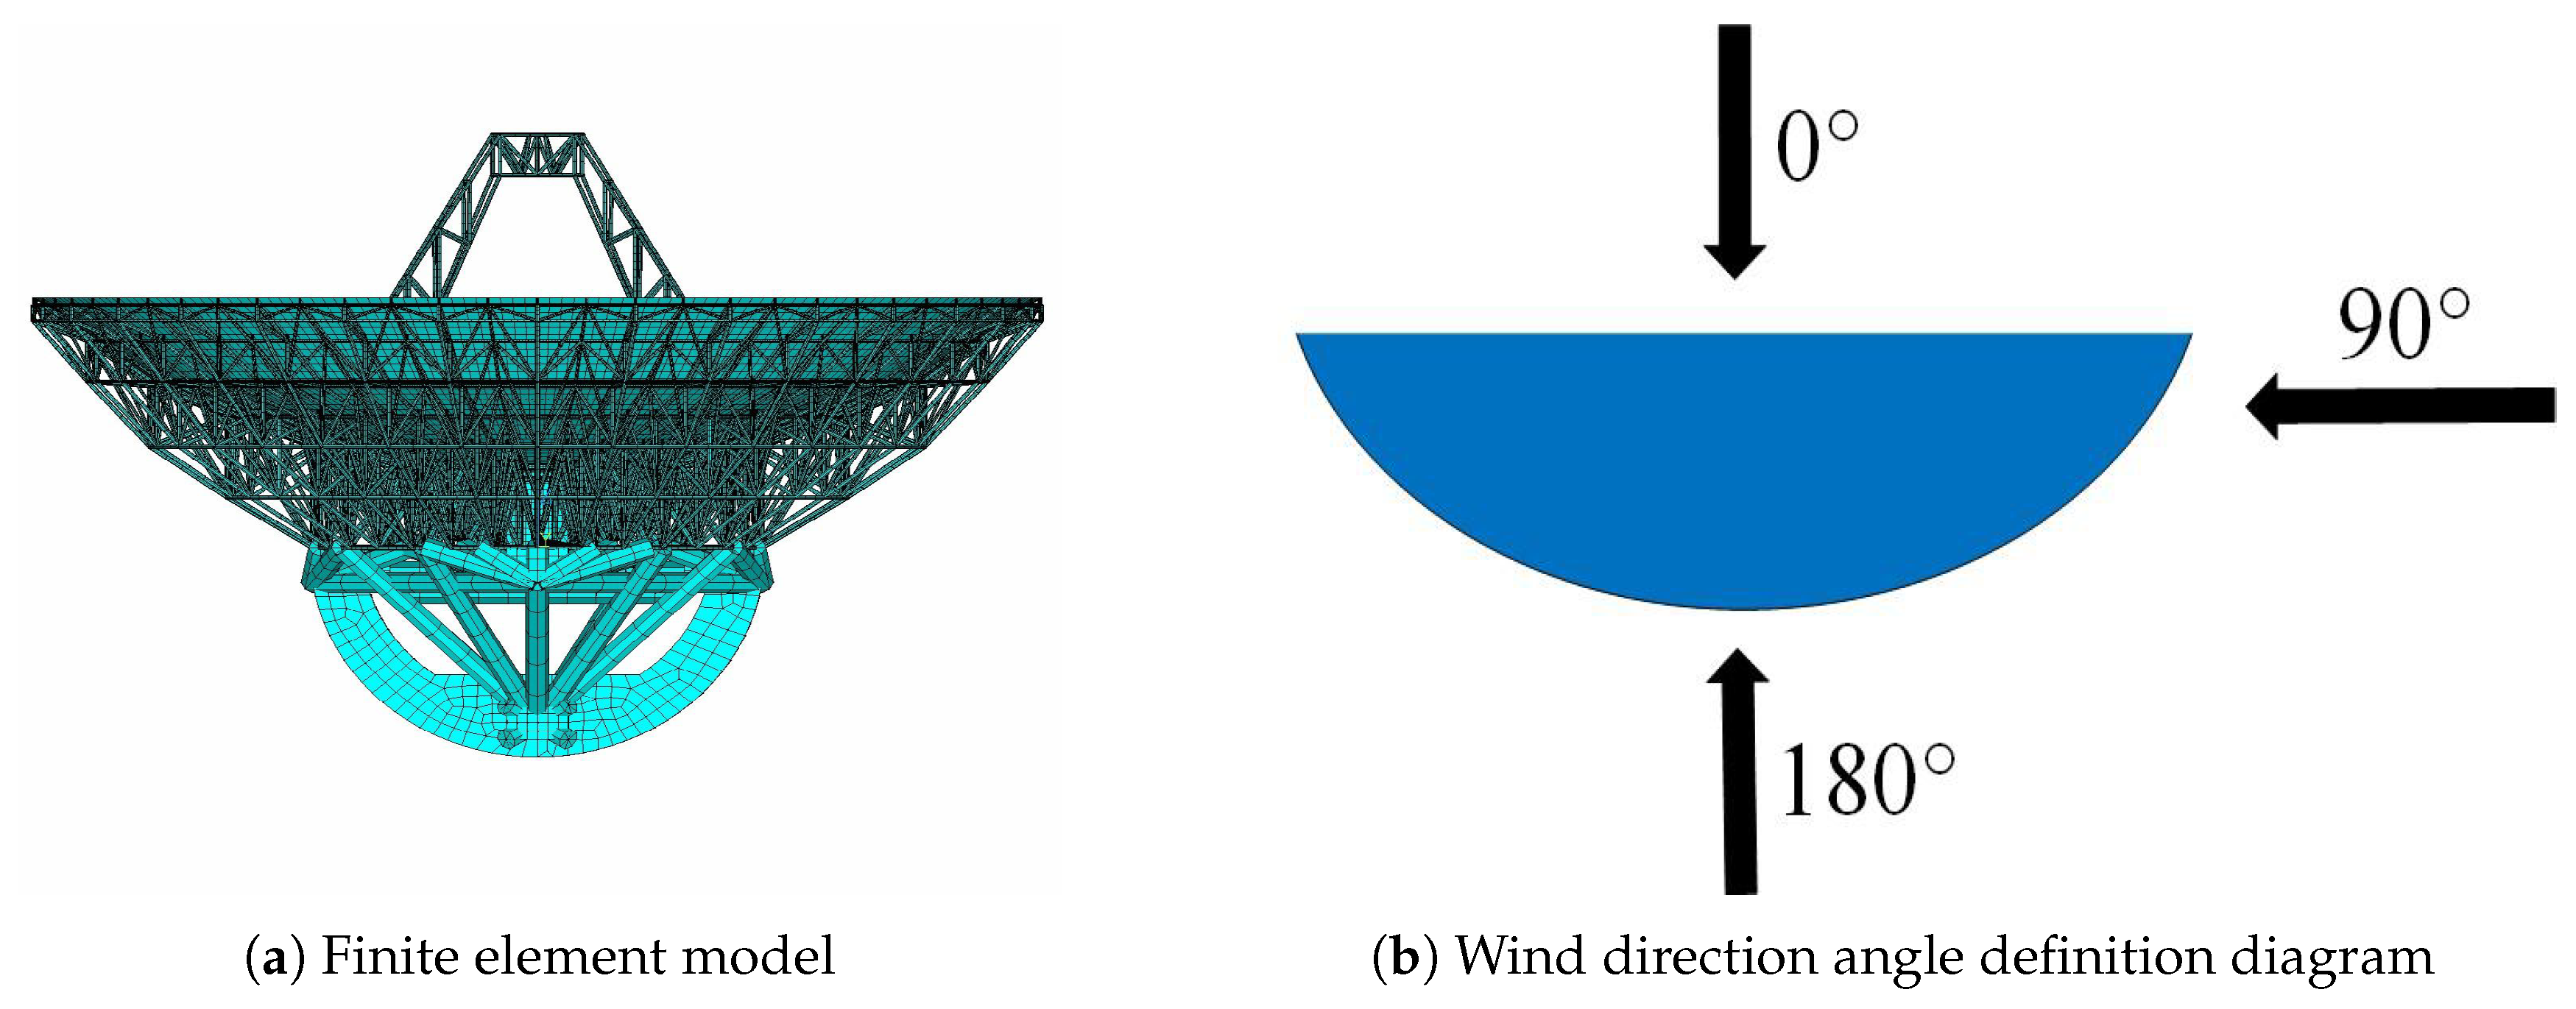
4.1. Finite Element Simulation

The structure of the 26 m radio telescope is shown in Figure 5. The structure adopts a modified Cassegrain antenna and an omnidirectional controllable central body symmetrical azimuth–elevation wheel–rail antenna seat. Among them, the primary reflector is the key part of antenna design and optimization, and it is also the main load-bearing mechanism for many kinds of loads, so the structure of the primary reflector of the antenna is taken as a research object for further investigation.
To verify the feasibility and effectiveness of the DT state monitoring and evaluation method, this paper mainly studies the static structural state of the antenna primary reflector under gravity and steady-state wind load.
The steady-state wind load can be calculated as follows:
F = 0 . 5 ρ v 2 C F A
where ρ is the air density at standard atmospheric pressure; v denotes wind speed; C F is the wind coefficient; A is the characteristic area. The wind coefficient C F is obtained according to the wind tunnel test data of the approximate body [20].
Based on the above conditions, the finite element model of the primary reflector of the antenna is established, and the load and boundary conditions are applied at the same time. For the wind load, the wind pressure is equivalent to the concentrated load of each node of the reflector. The concentrated load is calculated according to the load area of the node, and it is decomposed in three directions along the coordinate axis to complete the node load assignment. Figure 6 is the finite element model and wind direction definition diagram of the primary reflector of the 26 m antenna. Among them, the wind direction angle is defined as the angle between the normal vector of the center of the elevation axis in the horizontal plane and the inverse vector of the incoming wind direction.
Taking 10 m/s steady wind as an example, the deformation of the antenna back-up structure under different elevation angles is calculated. The results are shown in Figure 7. Figure 7a represents the axial structural deformation under the condition of a 90° elevation angle and a 0° wind direction; Figure 7b represents the axial structural deformation under the condition of a 45° elevation angle and a 45° wind direction; Figure 7c,d respectively represent the axial deformation cloud diagram of the structure under the equivalent fluid–solid coupling field when gravity is applied at the same time under the above two conditions. The results show that the deformation of the antenna backup structure increases gradually from the center to the periphery under the condition of a 90° elevation angle, and the maximum deformation position appears at the outermost edge. Under the condition of a 45° elevation angle, the deformation of the top and bottom edges of the antenna back-up structure is the largest. At the same time, under the action of only wind load, its deformation trend corresponds to the changing trend of the wind pressure coefficient [21].

4.2. Training Sample Construction

The data training samples are obtained for specific working conditions. Considering the influence of three external conditions of wind speed, wind direction, and elevation angle on the structural deformation of the radio telescope, the wind speed range is defined as 0~15 m/s and the characteristic working conditions are selected every 5 m/s for a total of four kinds. Considering the symmetry of the structure, the range of the wind direction is defined as 0°~180°, and the characteristic conditions are selected every 45° for a total of five kinds; the elevation range of the primary reflector is 5°~90° and seven elevation angles of 90°, 75°, 60°, 45°, 30°, 15°, and 5° are selected. Therefore, based on the above description, a total of 140 sets of working conditions are generated as the original training data set P 1 .
The original data set P 1 contains the node coordinates of the original finite element mesh and the corresponding mechanical performance data of the node. After the original mesh simplification process, its vertex position changes, so it is necessary to update the point cloud information, that is, to obtain the mechanical performance value corresponding to the vertex of the reduced model. Therefore, this paper uses the K-nearest neighbor (KNN) and the radial basis function (RBF) interpolation algorithm to construct the matching model of the original finite element mesh and the lightweight mesh [22], and the construction process is shown in Figure 8.
That is, P 1 is used as the basic sample, and the three-dimensional coordinates of the lightweight mesh are used as input. The Ball tree search method in the KNN algorithm is used to search and calculate the Euclidean distance d ( x , y ) between the center point and its nearest n P 1 sample data points. The distance is arranged from small to large, and K instances with the smallest distance are found in the data set. At the same time, the eigenvalues of the K instances are used to construct an RBF interpolation function f ^ ( x ) with the three-dimensional coordinates of the P 1 node as the input and the equivalent mechanical data corresponding to the lightweight mesh node as the output. The kernel function uses the Gaussian function ϕ ( r ) , and the equation is provided below:
d ( x , y ) = i = 1 n x i y i 2
f ^ ( x ) = i = 1 N w i φ ( r )
ϕ ( r ) = e ( ε r ) 2
where r represents the Euclidean distance between the two position vectors, and w i represents the weight of the original data point relative to the target data point.
After the above process, the point cloud sample data set P 2 of the mechanical performance of the antenna primary reflector structure after data dimensionality reduction is obtained.

4.3. Surrogate Model Training

The structural performance of a radio telescope antenna has a large amount of data and takes a long time, which cannot meet the needs of real-time calculation and analysis. To solve the above problems and meet the real-time requirements of DT technology, the present study utilizes the structural performance data sample P 2 of the antenna’s primary reflector, which was obtained in Section 4.2, as the data support. The machine learning RF regression model training data are employed to establish the surrogate model, thereby forming the mapping relationship between the input and output of the structural performance. The surrogate model is used to directly predict its structural performance, to improve the computational efficiency, and to realize the structural performance prediction of the antenna primary reflector under any working conditions.
RF is an ensemble learning technique that consists of several decision trees, which can effectively capture the complex relationship between input and output responses. In this paper, the regression tree is utilized to achieve high-precision prediction by learning the mapping relationship between the input features and the mechanical response of the antenna model [23].
The flow of the RF regression algorithm is illustrated in Figure 9. Taking the structural deformation value of the primary reflector of the antenna as an example, based on the Section 4.2 data set, the bootstrap sampling method is used to form the subsequent training set through N times of sampling. The training set is set to D = { ( x 1 , y 1 ) , ( x 2 , y 2 ) , , ( x N , y N ) } , where x i = { x i ( 1 ) , x i ( 2 ) , , x i ( n ) } represents the input feature vector, and N is the sample size and represents the deformation value of each node of the antenna model under N working conditions. For the above data sets, the key is to select the appropriate partition points.
The deformation value in the data set is divided into m nodes R m , and each node corresponds to an output prediction deformation value c m . The regression tree model can be represented as
f ( x ) = m = 1 M c m I ( x R m )
where I ( x R m ) represents the indicator function; that is, when x falls in the region of the node R m , the value is 1, otherwise it is 0.
At each node, the split is chosen to minimize the sum of squared residuals. Therefore, the best c ^ m is the average of y i in region R m .
c ^ m = a v e ( y i x i R m )
The selection of the optimal partition point is as follows: choose the j t h variable X j and its value s as the segmentation variable and point, and define two regions as follows. Region 1: all data points satisfying X j s , denoted as R 1 ; region 2: all data points satisfying X j > s are denoted as R 2 . Therefore, the sum of squared errors (SSE) for the candidate segmentation is calculated according to the following equation:
S S E total ( j , s ) = min j , s min c 1 x i R 1 ( j , s ) ( y i c 1 ) 2 + min c 2 x i R 2 ( j , s ) ( y i c 2 ) 2
the values j and s that minimize the sum of square errors of the two regions can be obtained. Here, c 1 and c 2 represent the established output values for the two regions after the division. Therefore, based on Equation (13), the SSE for conditional optimization is expressed as
S S E optimized ( j , s ) = min j , s x i R 1 ( j , s ) ( y i c ^ 1 ) 2 + x i R 2 ( j , s ) ( y i c ^ 2 ) 2
where
c ^ 1 = 1 N 1 x i R 1 ( i , s ) y i c ^ 2 = 1 N 2 x i R 2 ( i , s ) y i
After finding the optimal partition point through the above steps, the deformation values of the nodes within the input space are partitioned into two distinct regions, and the above procedures are iteratively applied to each of these regions until the specified conditions are met. The final form of the regression tree model is given as:
f ( x ) = m = 1 M c ^ m I ( x R m )
After the training is completed, two evaluation indexes of the root average square error ( R M S E ) and decision coefficient ( R 2 ) are introduced to judge the accuracy of the surrogate model:
R M S E = 1 n i = 1 n ( y i y ^ i ) 2 R 2 = 1 i = 1 n ( y i y ^ i ) 2 i = 1 n ( y i y ¯ i ) 2
where n is the number of nodes in the finite element model; y i is the simulation value; y ¯ is the simulation average value; and y ^ i is the predicted value.

5. Virtual and Real Mapping

Virtual-real mapping includes motion behavior mapping and mechanical property mapping. The motion behavior mapping needs to construct the motion model of the radio telescope and fuse it with the angle data of the acceleration sensor. With the help of the communication module, the real-time interaction of the motion is realized. The mechanical property mapping is to ensure that the DTs can quickly, accurately, and intuitively reflect the mechanical state of the current actual working conditions on the twin model.

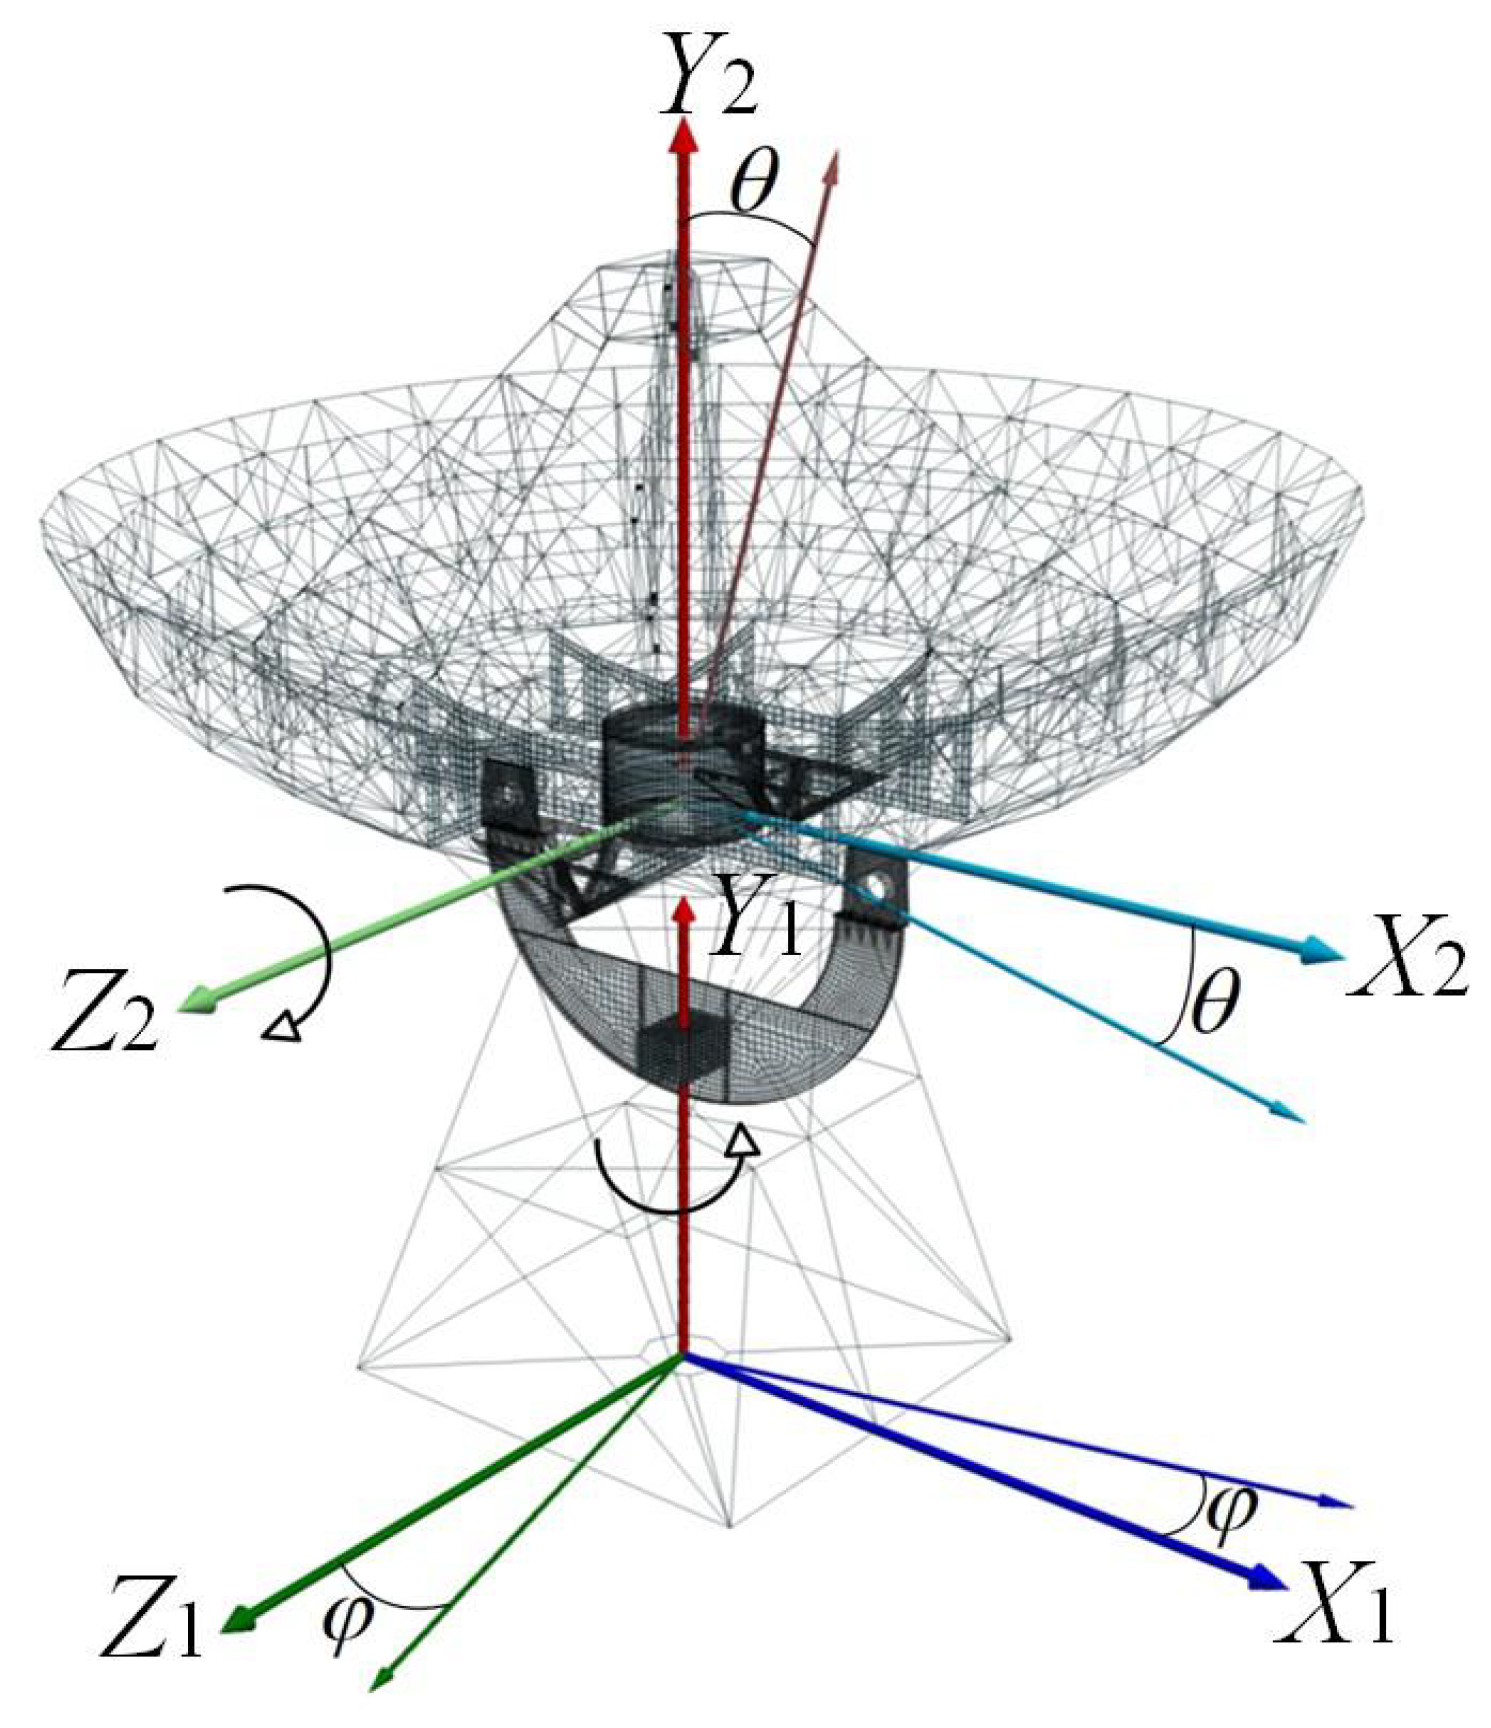
5.1. Motion Behavior Mapping

The motion transformation of the twin model is based on the geometric transformation matrix. In contrast to the ground coordinate system W [24], which typically employs a right-handed convention, Unity3D utilizes a left-handed world coordinate system with the Y-axis pointing vertically upwards [25]. Therefore, the base of the radio telescope is defined to rotate around the Y axis, the coordinate transformation matrix is R Y ( ϕ ) , the elevation body rotates around the Z axis, and the coordinate transformation matrix is R Z ( θ ) , where ϕ and θ are the azimuth and elevation angles, respectively. The coordinate relationship of the motion model is shown in Figure 10.
R Y ( ϕ ) = cos ( ϕ ) 0 sin ( ϕ ) 0 0 1 0 0 sin ( ϕ ) 0 cos ( ϕ ) 0 0 0 0 1 R Z ( θ ) = cos ( θ ) sin ( θ ) 0 0 sin ( θ ) cos ( θ ) 0 0 0 0 1 0 0 0 0 1
The coordinate transformation matrix T H between the primary reflector and the base is obtained by multiplying the above transformation matrix in turn:
T H = R Y ( ϕ ) · R Z ( θ ) = cos ( ϕ ) cos ( θ ) cos ( ϕ ) sin ( θ ) sin ( ϕ ) 0 sin ( θ ) cos ( θ ) 0 0 sin ( ϕ ) cos ( θ ) sin ( ϕ ) sin ( θ ) cos ( ϕ ) 0 0 0 0 1

5.2. Mechanical State Mapping

The technical route of mechanical state mapping is shown in Figure 11.
The RF surrogate model trained in Section 4.3 is packaged into PKL format and stored. After real-time sensor data transmission, the predicted deformation values are output and constructed into a color array through TCP/IP communication between Pycharm and Unity3D. By normalizing each node’s predicted value between the maximum and minimum deformation range, the values are linearly mapped to the HSV hue spectrum from red (H = 0°) to blue (H = 240°). The Unity shader implements this color conversion with vertex data transmission and HSV-to-RGB transformation in the patch function, combined with vertex color interpolation defined in Equation (20). This process drives the mesh model nodes to generate finite element cloud images reflecting real-time deformation patterns. The conversion equation is as follows [26]:
c = 2 3 1 r m i n m a x m i n
where c represents the HSV color value, m a x and m i n are the upper and lower limits within the set of predicted values, respectively, and r is the predicted result value of the current node.

6. Example Analysis and Results

6.1. Experimental Prototype and Interface Construction

To verify the real-time evaluation method of the antenna structure state of the radio telescope based on DT proposed in this paper, the prototype of antenna structure state monitoring DTs is built and tested. The system integrates a wind speed/direction sensor (0~60 m/s range, ±0.3 m/s accuracy), a temperature/humidity sensor (−40~80 °C range, ±2% RH accuracy), and an MPU6050 acceleration sensor (the device supports a configurable sampling rate up to 100 Hz, with an acceleration sensitivity of 0.5 mg/LSB and an angular velocity sensitivity of 0.061 (°/s)/LSB). The hardware and software overview of the experimental prototype system is shown in Figure 12. Note: The product MPU6050 was manufactured by Shenzhen Global Easy Technology Co., Ltd., located in Shenzhen, China. It was purchased through Alibaba in China.
The system software part adopts the server based on Python development and the client based on Unity3D 2023.2.1f1c2. The TCP/IP communication protocol is used between the client and the server to send and receive the proxy model prediction data. Serial communication is used between the sensor and the client to obtain the real data of the physical entity layer. Data storage uses the MySQL database to realize data recording and query functions. The operation interface is based on the UGUI module. The human–computer interaction interface of the client is shown in Figure 13.

6.2. Operating Pesult

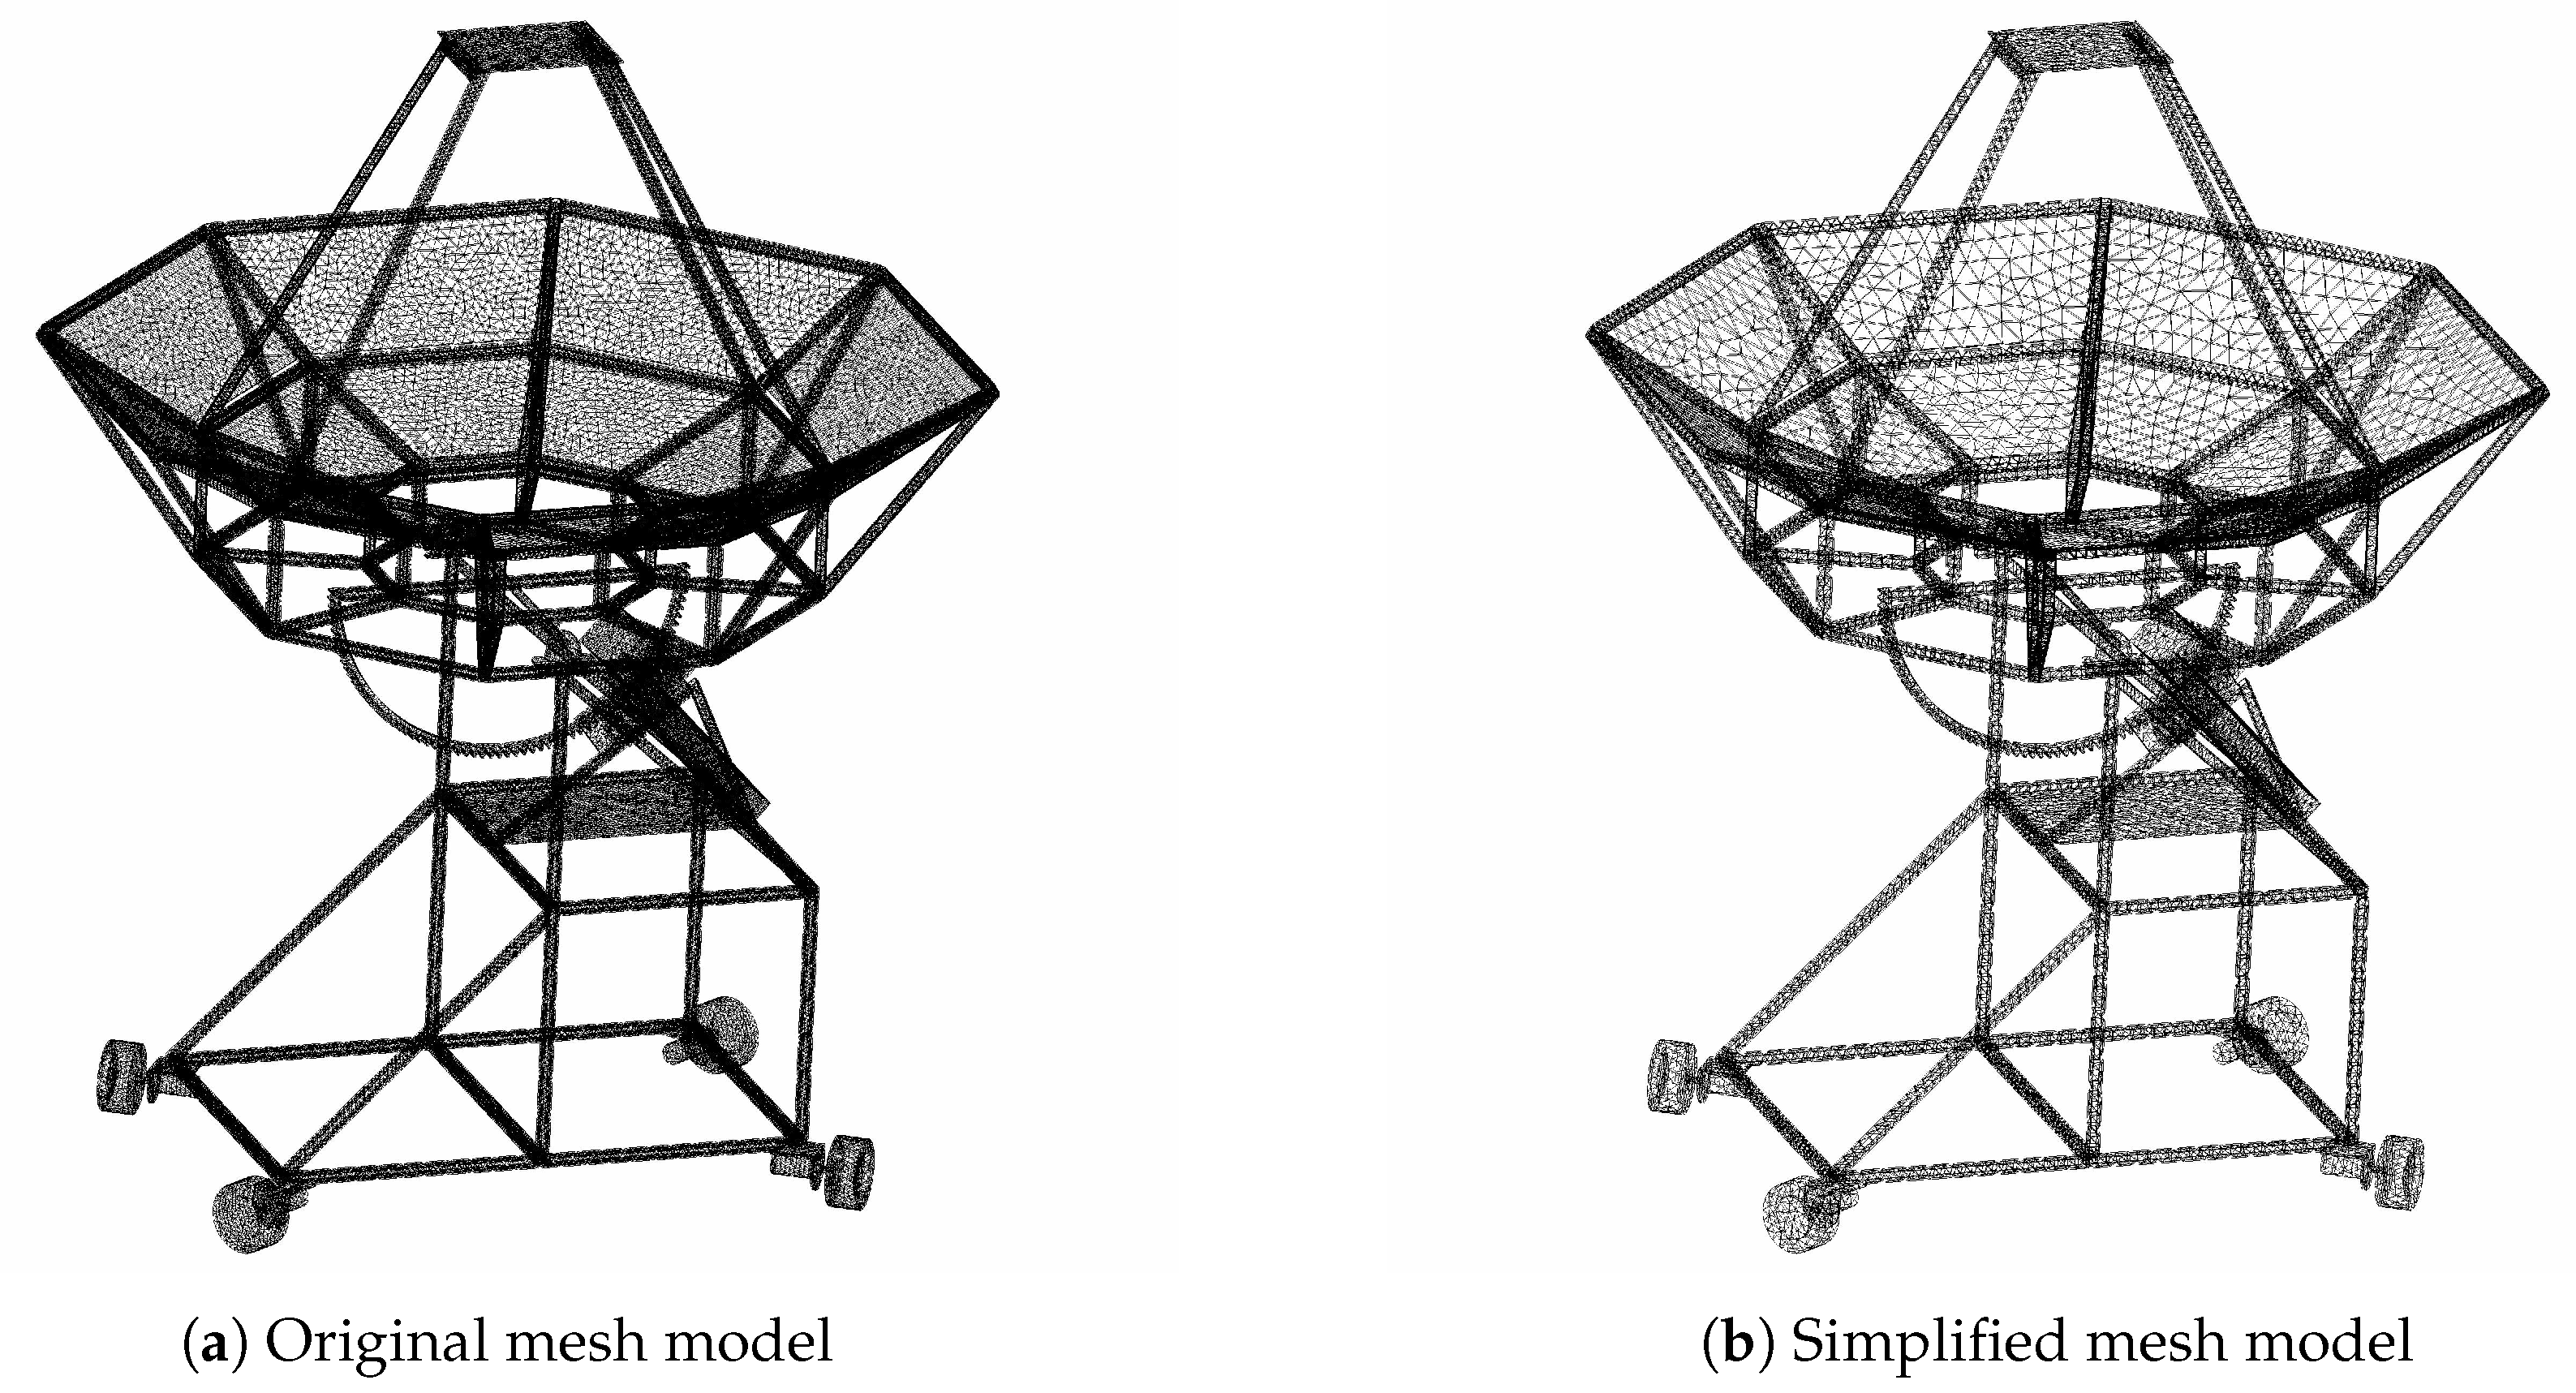
6.2.1. Lightweight Model Results

After the original finite element mesh model is processed by the mesh simplification process described in Section 2, the number of vertices and triangles of the model is simplified. Figure 14 is a comparison of the simplification effect of the three-dimensional model of the experimental prototype. Among them, Figure 14a is the original mesh model and Figure 14b is the simplified mesh model. Table 1 provides simplified data on the key structure of the experimental prototype, revealing that the number of triangular patches is reduced by approximately 47.9% on average.

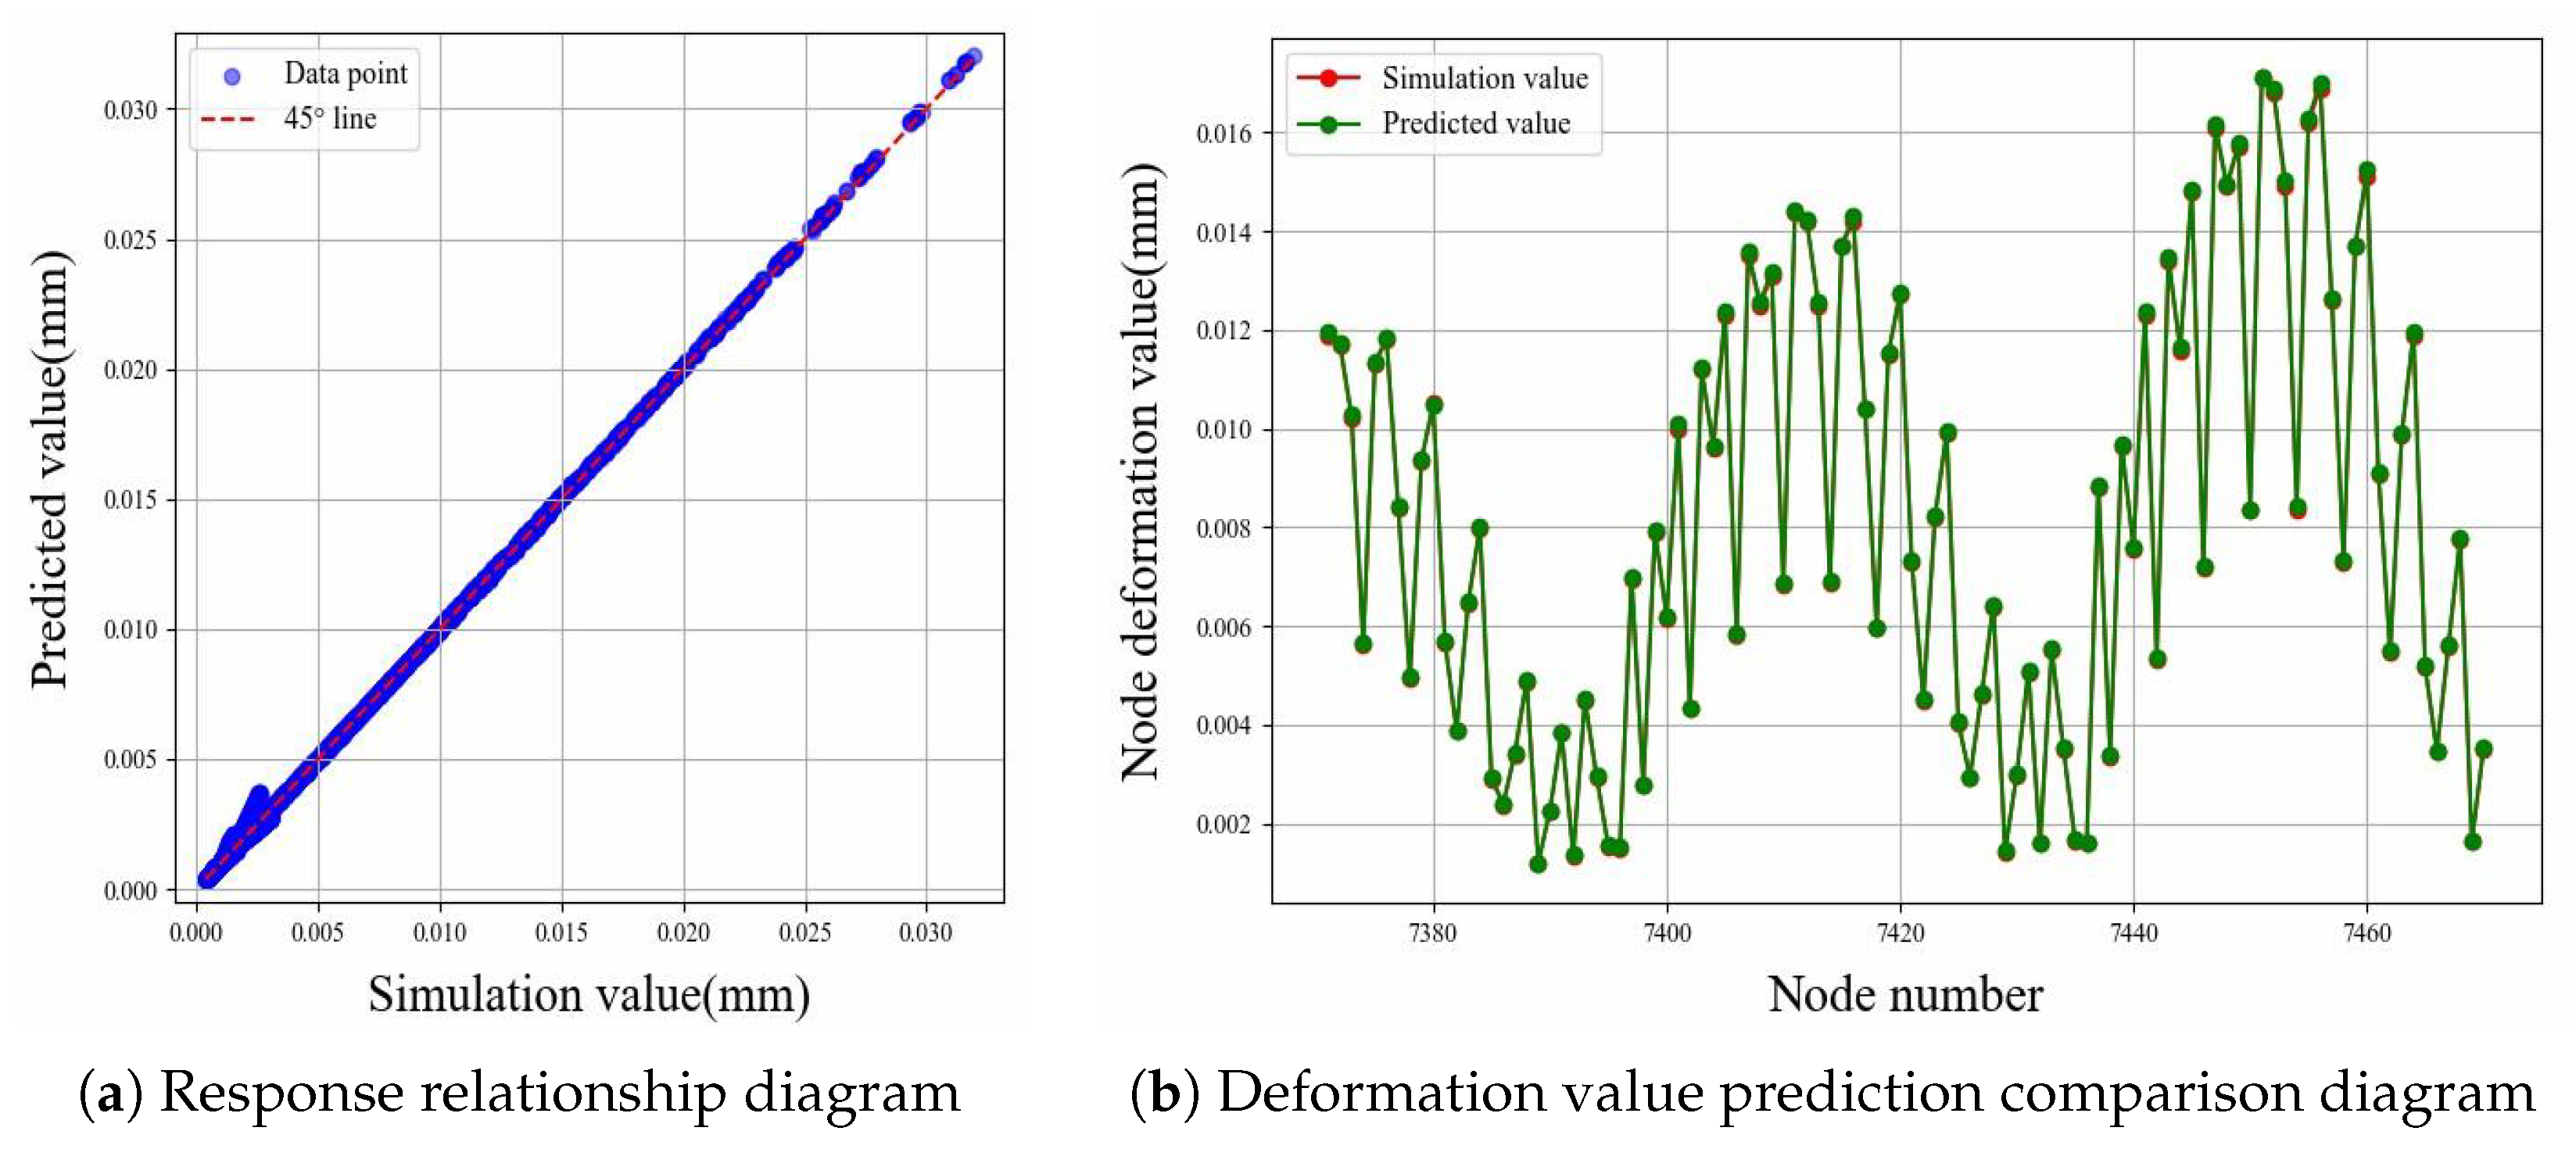
6.2.2. The Training Results of the Surrogate Model

Figure 15 is the mechanical state cloud diagram of the primary reflector of the experimental prototype, where Figure 15a represents the wind pressure cloud diagram at a 90° elevation angle, a 90° wind direction, and a 15 m/s wind speed. Figure 15b,c represent the total deformation cloud diagram of the coupling field at the elevation angles of 90° and 5° under the above wind field, respectively. From the results, it can be seen that the panel is greatly affected by the wind and is the main wind-bearing part; from the total deformation cloud diagram, it can be seen that the overall deformation of the panel is linearly correlated with the angle of elevation.
According to the real-time simulation field construction method described in Section 3, an RF regression model is established and its prediction accuracy is verified. Two random conditions are selected, namely, working condition 1: 60° elevation, 5 m/s wind speed, 90° wind direction; condition 2: 15° elevation, 10m/s wind speed, 0° wind direction. The R M S E and R 2 between the predicted value and the simulated value are compared.
Table 2 shows the evaluation data under two test conditions; Figure 16a shows the response relationship between the actual value and the predicted value under the first working condition. Figure 16b shows the comparison diagram of the prediction effect of 100 consecutive node-deformation values. Through analysis and comparison, it can be seen that, compared with the finite element analysis results, the R M S E of the prediction results of the RF model is at a low level, and the average R 2 is greater than 0.97, indicating that the random forest regression model has a more accurate prediction effect and has certain reliability.

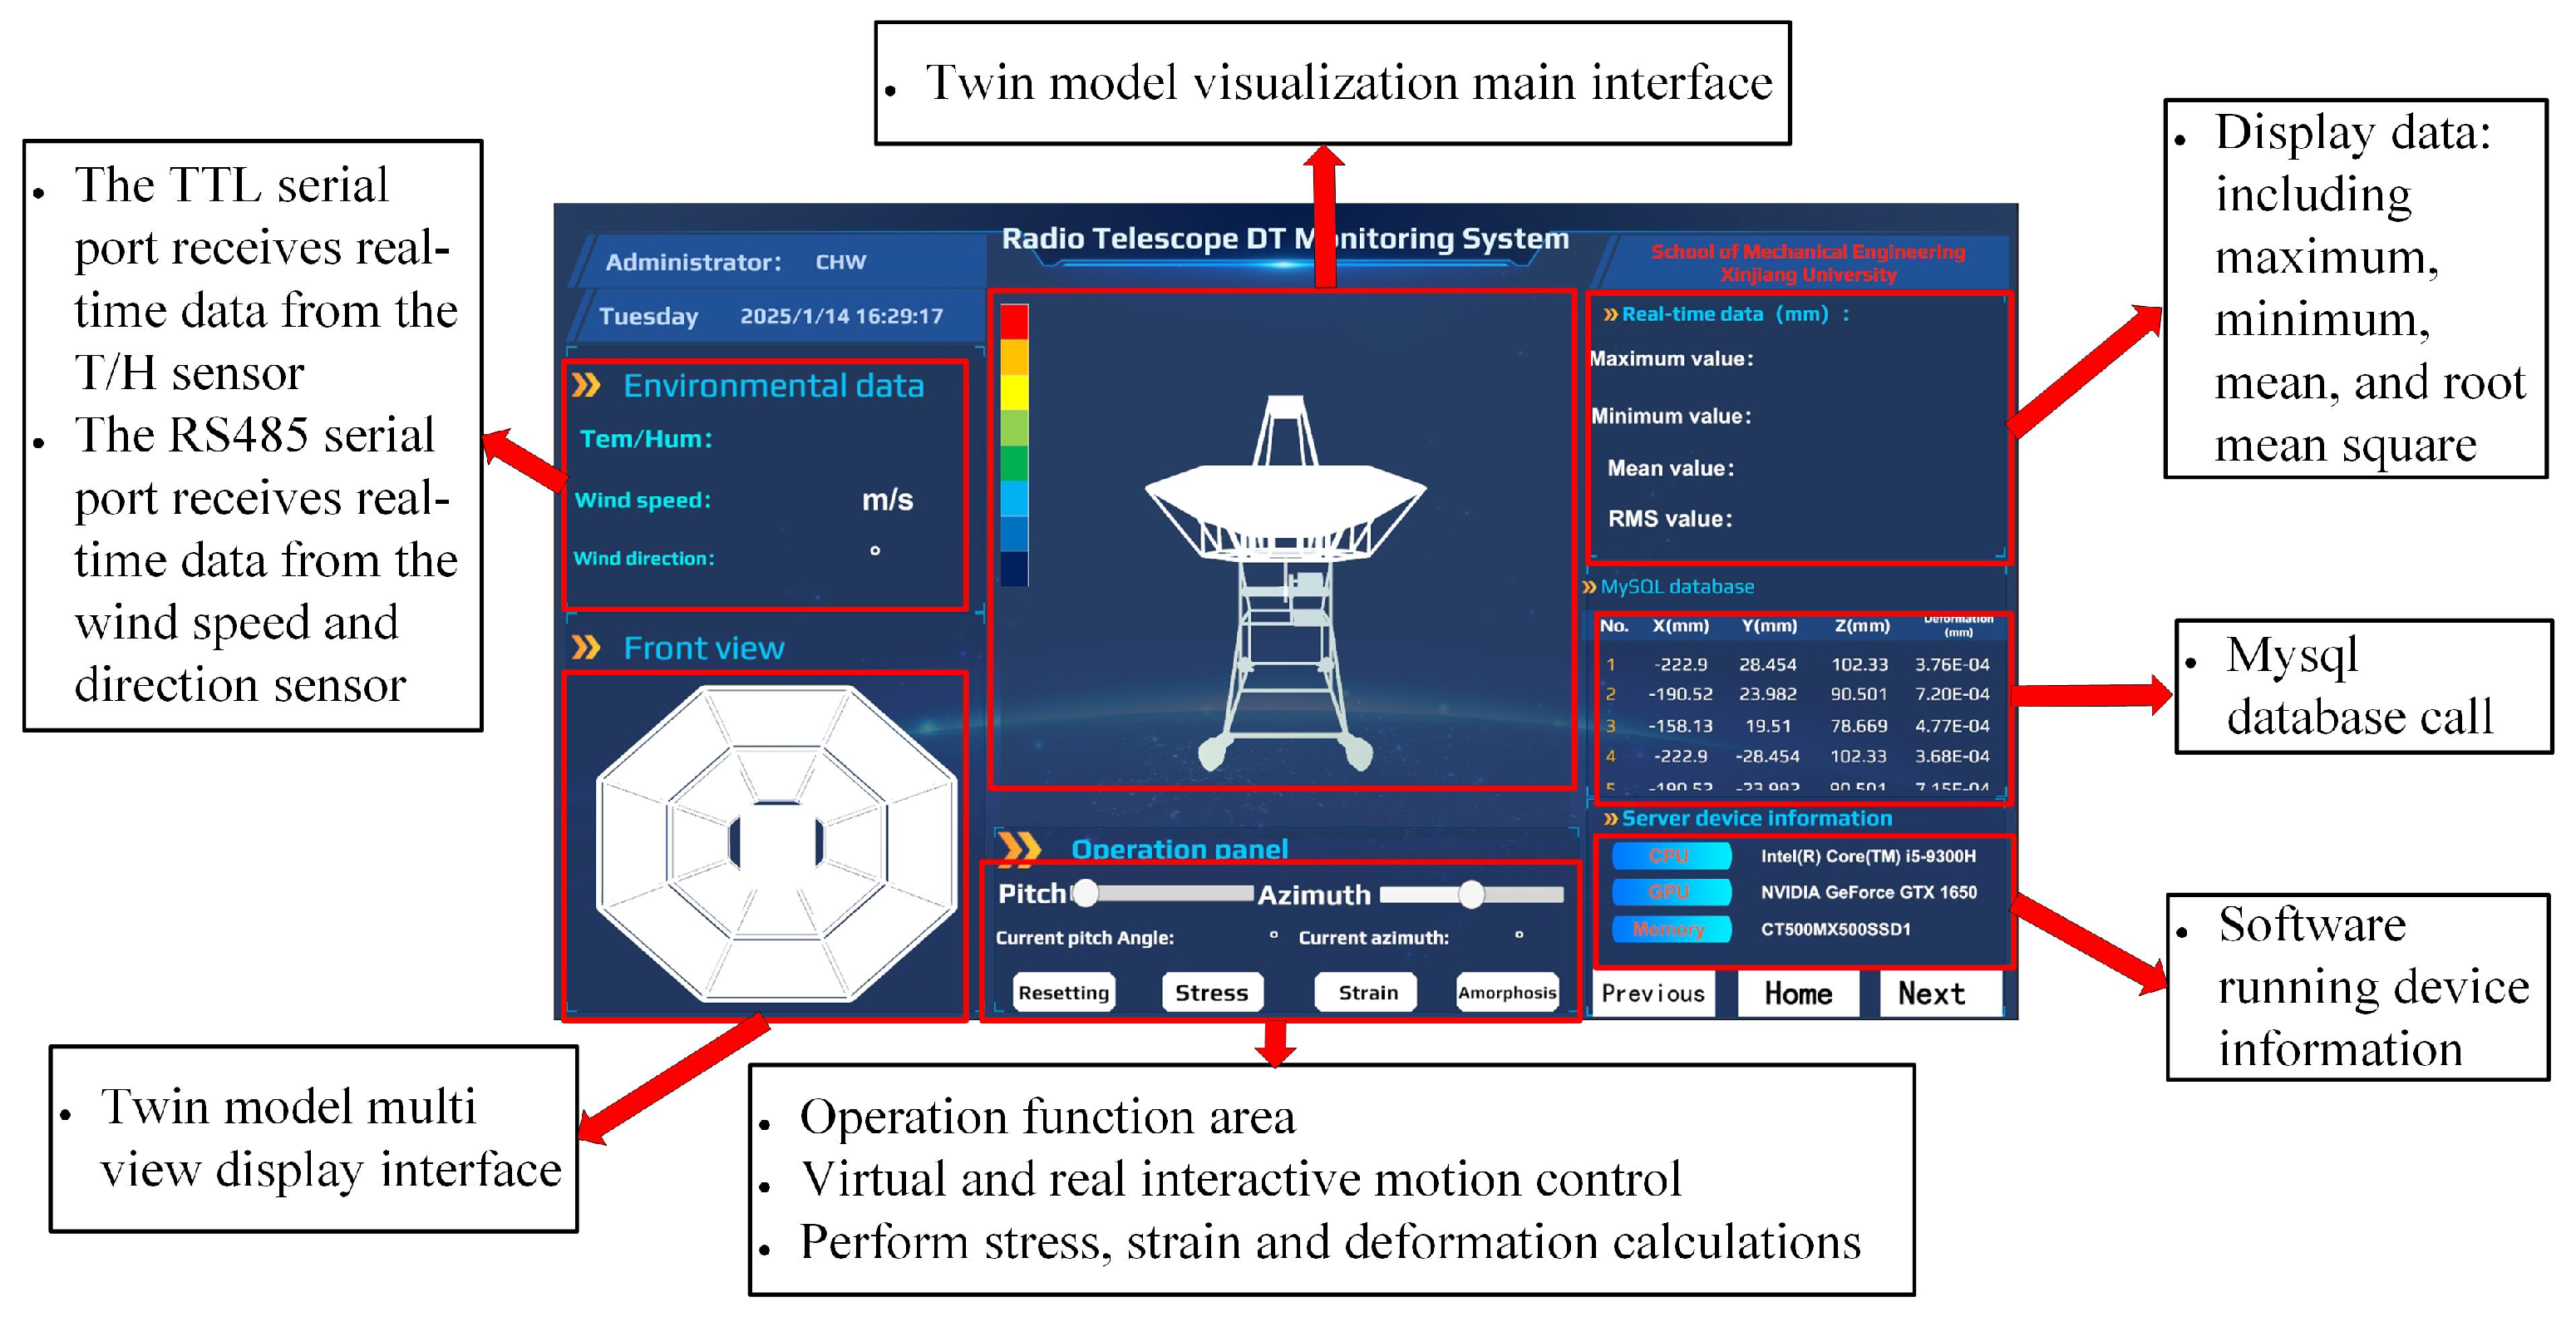
6.2.3. Interface Operation Results

The real-time rotation angle of the antenna of the prototype system is obtained by the MPU6050 acceleration sensor, and the real-time data are sent to the Unity3D client by serial communication. The client assigns the received rotation Euler angle to the rotation attribute of the twin model and realizes the motion state interaction between the twin model of the radio telescope and the actual model. For mechanical state monitoring, Figure 17 shows the visual interface of panel structure deformation under the current twin model at 6 m/s wind speed, 0° wind direction, and 32.6° elevation state. The lower right corner is the output cloud diagram of finite element analysis under this working condition. By comparing the two, it can be seen that the change trend is consistent, indicating that the DTs can show the more real structural state of the antenna in the current environment.
From the data point of view, as shown in Table 3, the relative error between the maximum deformation prediction value and the simulation value is within 5%, the R 2 is close to 1, and the R M S E is at a lower value, which shows that the RF regression model has high prediction accuracy.

6.2.4. Real-Time Analysis Results of DTs

Under the premise of meeting the accuracy requirements, the calculation time of the two models is compared. The solution time is defined as the computational duration required to calculate deformation values for all nodes of the model using either the random forest (RF) method or the finite element method under a specific working condition. For the finite element method, the solution time does not include the pre-processing time. Table 4 shows the comparison of the average time of a single solution case (calculated as the mean value of 50 repeated simulations). It can be seen that the RF model improves the calculation efficiency by about 98.3% compared with the finite element model.
At the same time, the Unity Profiler performance analysis tool is used to analyze the resource occupancy during the operation of the DTs. Figure 18 is the analysis result. It can be seen that based on the local test environment, the maximum time for the CPU to process data is 270.4 ms, and the average time is 60 ms, which can meet the real-time requirements of data-driven DTs.

7. Conclusions

Aiming at the problems of low intelligence and poor state visualization in the current operation and maintenance supervision of radio telescopes, this paper develops a real-time monitoring and evaluation system of structural state based on the DT five-dimensional framework model, which provides a new digital supervision scheme for ensuring the safe and stable operation of antennas. The main work and achievements of this paper can be summarized as follows:
  • Based on the improved QEM mesh simplification algorithm, a lightweight twin model of the antenna is established. Under the premise of ensuring a high degree of consistency with the physical entity, the mesh is simplified by about 47.9%, which effectively reduces the calculation amount of structural performance data.
  • Based on the RF regression algorithm, the surrogate model of the structural performance of the antenna primary reflector is established. Through the example verification, the average prediction accuracy of the model is 0.98, and the root average square error value is at a low level, which has high prediction accuracy. At the same time, compared with the finite element model, its one-time calculation time is about 0.4 s, the efficiency is optimized by 98.3%, and the time cost is greatly reduced.
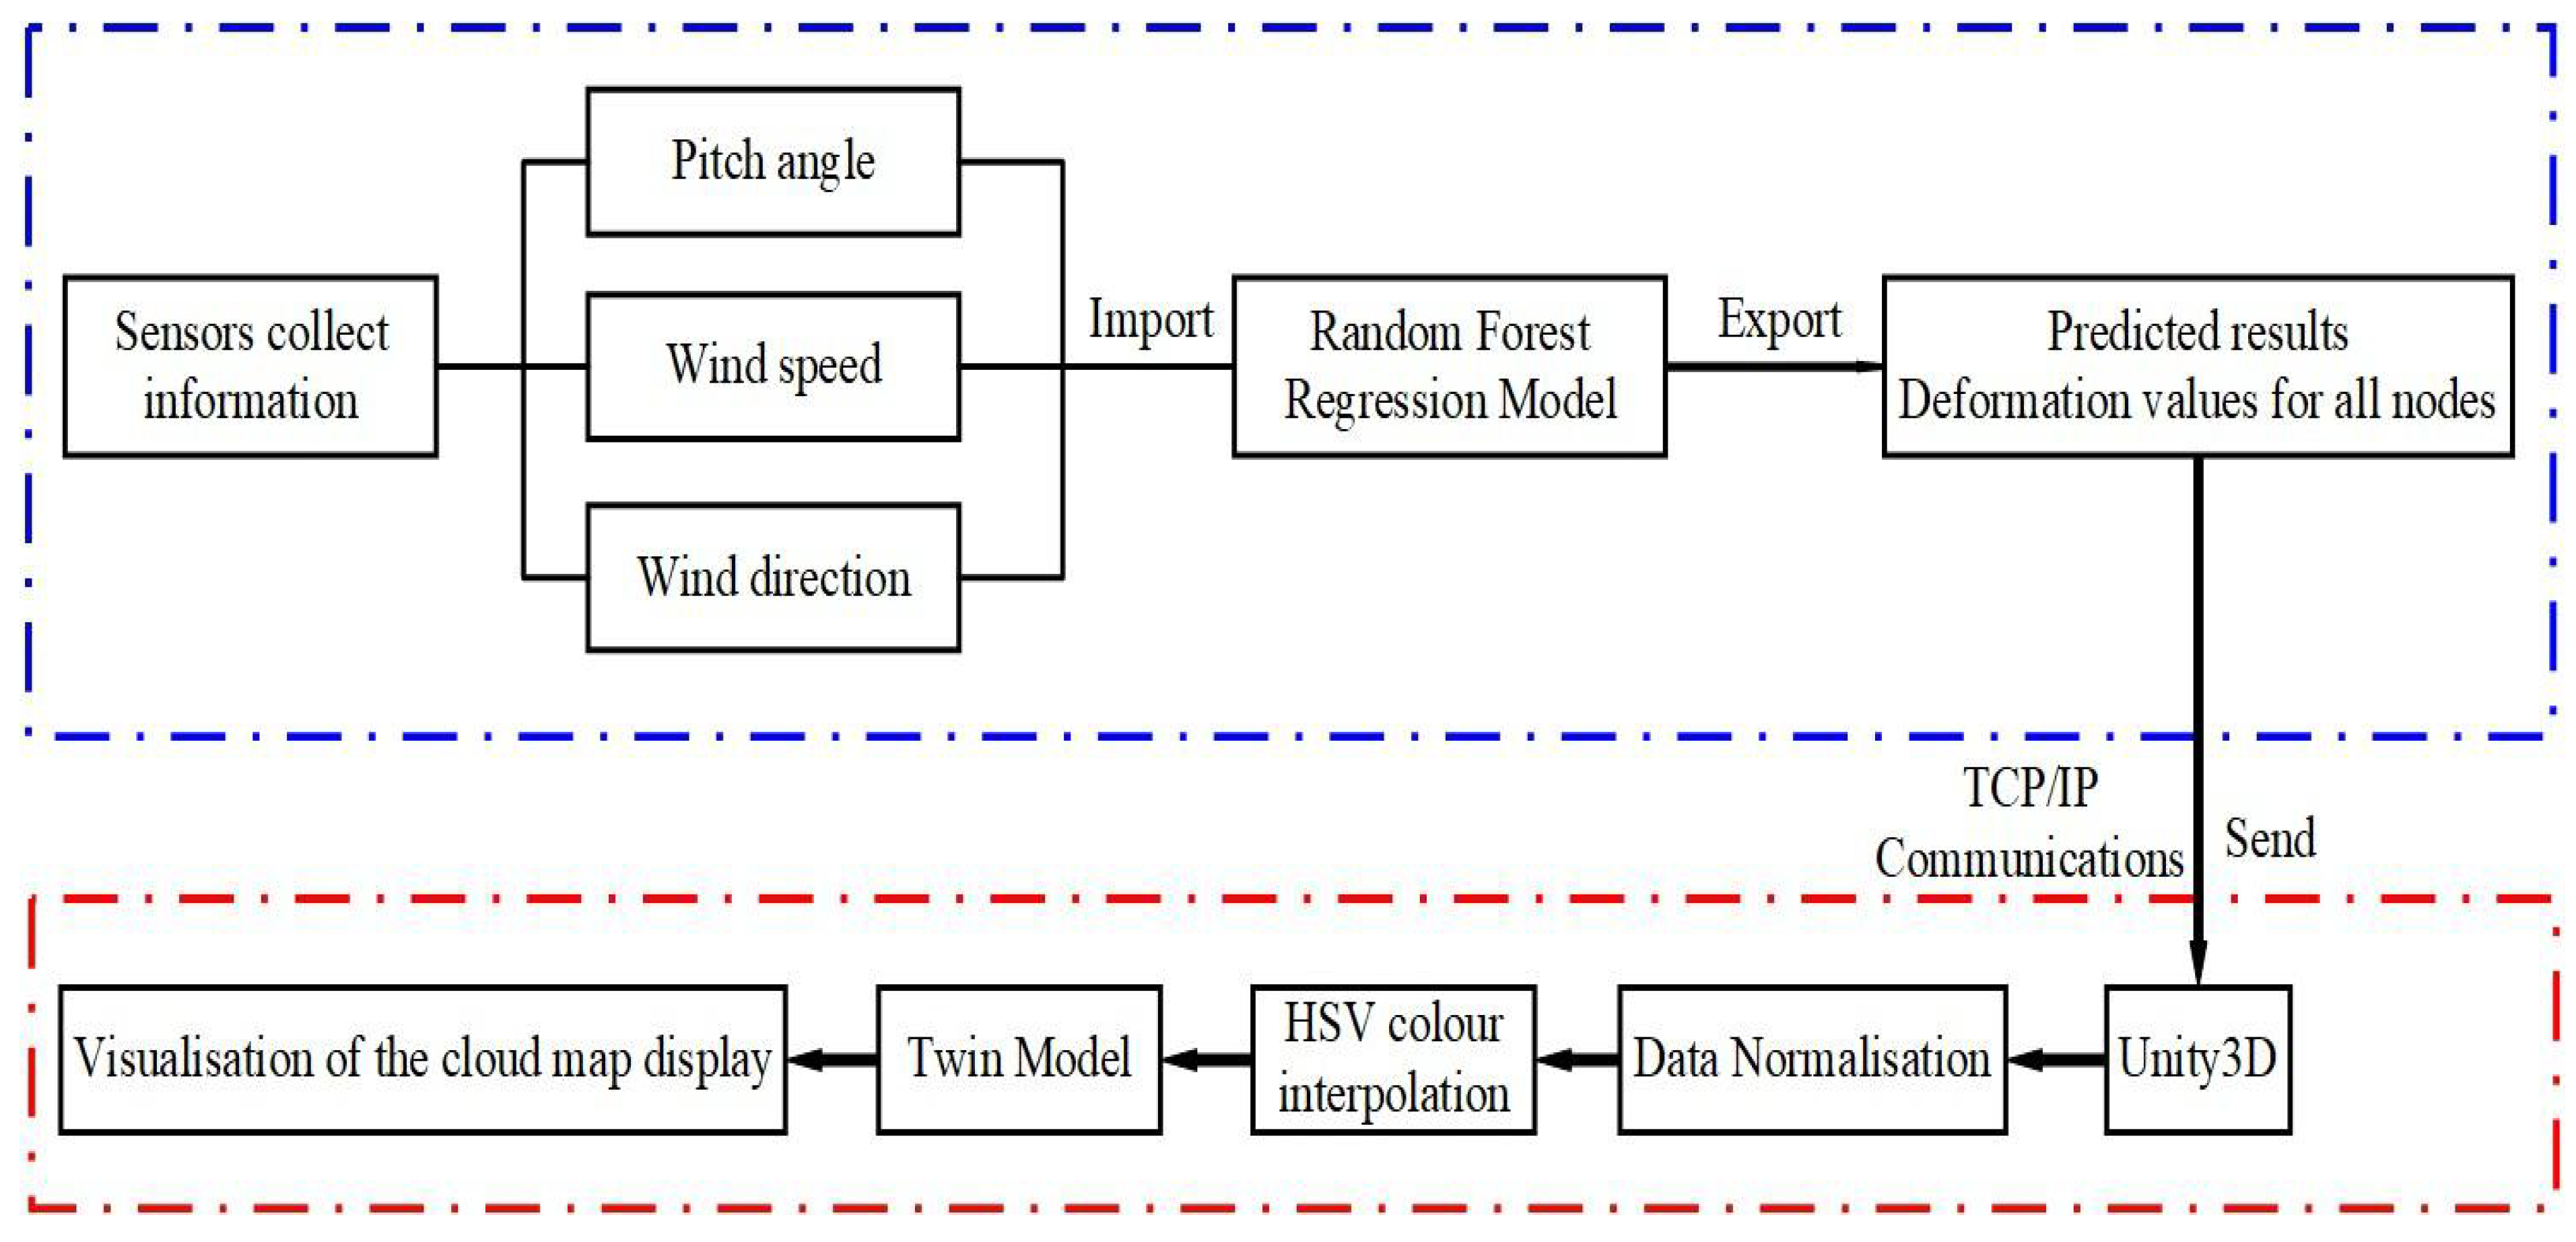
  • Based on the Unity3D engine, a human–machine interaction visualization operating system was built. By using data communication, the monitoring data from sensors and the predicted data from proxy models were mapped in real time to the twin model. This achieved a DT intelligent monitoring and evaluation system for radio telescopes that integrates real-time simulation and prediction assessment of the structural status, monitoring, and assessment of motion status, status visualization, and a human–machine interaction interface. Finally, through experiments with a prototype antenna, it was verified that the DT method described in this paper is feasible and effective.
Meanwhile, the limitations of the current research in this paper and the outlook on the future research direction include the following.
  • The working conditions studied in this paper are based on gravity and steady-state wind loads; however, in actual operation, the antenna will be subject to dynamic loads such as pulsating winds, sunshine temperature difference loads, and inertia loads. Therefore, the subsequent research will explore the structural mechanics of the antenna under multi-field coupling conditions with more comprehensive influencing factors and integrate the actual measurement data to establish a more accurate finite element model and high-fidelity predictive surrogate model so as to realize the accurate prediction and evaluation of antenna’s mechanical state, and truly realize the intelligent monitoring and operation and maintenance of the antenna.
  • The current study mainly focuses on establishing the theoretical framework of DTs and simulation verification. Future work will further expand the application scope of this technology, especially for the practical application of the Nanshan 26 m radio telescope and larger aperture antennas.

Author Contributions

Methodology, H.C. and B.X.; investigation, H.C.; validation, S.L. and P.L.; writing—original draft preparation, H.C.; writing—review and editing, B.X., W.W. (Wei Wang 1) and C.W.; data processing, S.M. and W.W. (Wei Wang 2). All authors have read and agreed to the published version of the manuscript.

Funding

This research was funded by the National Natural Science Foundation of China (NSFC, grant Nos. 12363011), Natural Science Foundation of Xinjiang Uygur Autonomous Region (No. 2023D01C22).

Institutional Review Board Statement

Not applicable.

Informed Consent Statement

Not applicable.

Data Availability Statement

The data that support the findings of this study are available on request from the corresponding author upon reasonable request.

Conflicts of Interest

The authors declare no conflicts of interest.

References

  1. Rahmat-Samii, Y.; Haupt, R. Reflector antenna developments: A perspective on the past, present and future. Antennas Propag. Mag. 2015, 57, 85–95. [Google Scholar] [CrossRef]
  2. Wang, C.; Xiao, L.; Xiang, B. Development of active surface technology of large radio telescope antennas. Sci. Sin.-Phys. Mech. Astron. 2017, 47, 059503. (In Chinese) [Google Scholar] [CrossRef]
  3. Gasparetto, V.E.; Reid, J.; ElSayed, M.S. Passive-tuned mass dampers for the pointing accuracy mitigation of VLBI earth-based antennae subject to aerodynamic gust. Appl. Mech. 2023, 4, 816–840. [Google Scholar] [CrossRef]
  4. Taljaard, C. Engineering performance management: Design to operation. In Observatory Operations: Strategies, Processes, and Systems X; SPIE: Bellingham, WA, USA, 2024; Volume 13098, pp. 264–276. [Google Scholar] [CrossRef]
  5. Artz, T.; Springer, A.; Nothnagel, A. A complete VLBI delay model for deforming radio telescopes: The Effelsberg case. J. Geod. 2014, 88, 1145–1161. [Google Scholar] [CrossRef]
  6. Madanayake, A.; Wijenayake, C.; Dansereau, D.G. Multidimensional (MD) Circuits and Systems for Emerging Applications Including Cognitive Radio, Radio Astronomy, Robot Vision and Imaging. Circuits Syst. Mag. IEEE 2013, 13, 10–43. [Google Scholar] [CrossRef]
  7. Prandoni, I.; Murgia, M.; Tarchi, A. The Sardinia Radio Telescope: From a Technological Project to a Radio Observatory. Astron. Astrophys. 2017, 608, A40. [Google Scholar] [CrossRef]
  8. Tofani, G.; Alvito, G.; Ambrosini, R. Status of the sardinia radio telescope project. In Ground-Based and Airborne Telescopes II; SPIE: Bellingham, WA, USA, 2017; Volume 7012, pp. 162–173. [Google Scholar] [CrossRef]
  9. Guo, W.; Zhang, B. Design and realisation of lightning protection and online monitoring system for large fully movable radio telescope. China Equip. Eng. 2023, 24, 103–105. (In Chinese) [Google Scholar]
  10. Barbie, A.; Hasselbring, W. From Digital Twins to Digital Twin Prototypes: Concepts, Formalization, and Applications. IEEE Access 2024, 12, 75337–75365. [Google Scholar] [CrossRef]
  11. Guerra-Zubiaga, D.; Santos, M.C.D.; Voicu, R.C. A digital twin approach to support a multi-task industrial robot operation using design of experiments. J. Braz. Soc. Mech. Sci. Eng. 2024, 46, 516. [Google Scholar] [CrossRef]
  12. Hartwell, A.; Montana, F.; Jacobs, W. Distributed digital twins for health monitoring: Resource constrained aero-engine fleet management. Aeronaut. J. 2024, 315, 1556–1575. [Google Scholar] [CrossRef]
  13. Tripathi, V.; Caizzone, S. Virtual Validation of In-Flight GNSS Signal Reception during Jamming for Aeronautics Applications. Aerospace 2024, 11, 204. [Google Scholar] [CrossRef]
  14. Zhang, Q.; Wu, P.; Zhao, Z. Design and application of digital twin system architecture for large radio telescope. Comput. Integr. Manuf. Syst. 2021, 27, 364–373. (In Chinese) [Google Scholar] [CrossRef]
  15. Taljaard, C.; Chrysostomou, A. Sculpting a maintenance twin for SKA. In Modeling, Systems Engineering, and Project Management for Astronomy IX; SPIE: Bellingham, WA, USA, 2020; Volume 11450, pp. 79–91. [Google Scholar] [CrossRef]
  16. Li, Q.; Jiang, P.; Li, H. Prognostics and health management of FAST cable-net structure based on digital twin technology. Res. Astron. Astrophys. 2020, 20, 67. [Google Scholar] [CrossRef]
  17. Pelham, T. Rapid antenna and array analysis for virtual prototyping. Int. Conf. Radar Syst. 2022, 2022, 278–282. [Google Scholar] [CrossRef]
  18. Bazaz, S.M.; Lohtander, M.; Varis, J. 5-Dimensional Definition for a Manufacturing Digital Twin. Procedia Manuf. 2019, 38, 1705–1712. [Google Scholar] [CrossRef]
  19. Liu, H.; Gillespie, M.; Chislett, B. Surface Simplification using Intrinsic Error Metrics. ACM Trans. Graph. (TOG) 2023, 42, 1–17. [Google Scholar] [CrossRef]
  20. Sidibe, F.M.; Lesnaya, L.; Streknev, D. Antenna Design and Maximum Operation Range of the Wind Profiler. In Proceedings of the 2023 IEEE Ural-Siberian Conference on Biomedical Engineering, Radioelectronics and Information Technology, Yekaterinburg, Russia, 15–17 May 2023; pp. 96–99. [Google Scholar] [CrossRef]
  21. Li, S.; Han, B.; Liu, S. Simulation-driven Wind Load Analysis and Prediction for Large Steerable Radio Telescopes. Res. Astron. Astrophys. 2023, 23, 024001. [Google Scholar] [CrossRef]
  22. Chai, X.; Eisenbart, B.; Nikzad, M. Application of KNN and ANN Metamodeling for RTM Filling Process Prediction. Materials 2023, 16, 6115. [Google Scholar] [CrossRef] [PubMed]
  23. Wu, D.; Jennings, C.; Terpenny, J. A Comparative Study on Machine Learning Algorithms for Smart Manufacturing: Tool Wear Prediction Using Random Forests. J. Manuf. Sci. Eng. 2017, 139, 071018. [Google Scholar] [CrossRef]
  24. Guillory, J.; Truong, D.; Wallerand, J.P. Determination of the reference point of a radio telescope using a multilateration-based coordinate measurement prototype. Precis. Eng. 2023, 83, 69–81. [Google Scholar] [CrossRef]
  25. Alremeithi, K.; Sealy, W. The use of digital twin for mobile robot swarm task allocation. Manuf. Lett. 2017, 41, 1200–1208. [Google Scholar] [CrossRef]
  26. Rasinta, I. Identification of tomato ripeness levels (Lycopersicum esculentum Miil) using android-based digital image processing. IOP Conf. Ser. Earth Environ. Sci. 2023, 1182, 012003. [Google Scholar] [CrossRef]
Figure 1. Nanshan 26 m radio telescope (self-made photo).
Applsci 15 03325 g001
Figure 2. DT framework of radio telescope.
Applsci 15 03325 g002
Figure 3. Technical route of the lightweight twin model construction.
Applsci 15 03325 g003
Figure 4. QEM algorithm diagram.
Applsci 15 03325 g004
Figure 5. Twenty-six-meter radio telescope.
Applsci 15 03325 g005
Figure 6. Finite element model and wind direction angle definition diagram of the primary reflector of the 26 m antenna.
Applsci 15 03325 g006
Figure 7. Axial deformation cloud diagram of back-up structure: (a,b) indicate that the structure is subjected to wind loads only, (c,d) indicate coupled wind and self-weight loads.
Applsci 15 03325 g007
Figure 8. Point cloud data matching update flow chart.
Applsci 15 03325 g008
Figure 9. Flow chart of the RF algorithm.
Applsci 15 03325 g009
Figure 10. Coordinate relationship diagram.
Applsci 15 03325 g010
Figure 11. Mechanical state mapping.
Applsci 15 03325 g011
Figure 12. Experimental prototype hardware and software system overview.
Applsci 15 03325 g012
Figure 13. Main interface of the system.
Applsci 15 03325 g013
Figure 14. Mesh simplification comparison diagram.
Applsci 15 03325 g014
Figure 15. The wind pressure cloud diagram and total deformation cloud diagram of the primary reflector of the experimental prototype.
Applsci 15 03325 g015
Figure 16. RF surrogate model prediction effect.
Applsci 15 03325 g016
Figure 17. Interface operation results.
Applsci 15 03325 g017
Figure 18. System performance analysis.
Applsci 15 03325 g018
Table 1. Comparison of the mesh-simplification effect.
StructureBefore SimplificationAfter SimplificationSimplification Rate
Panel27,32214,97645.2%
Back-up structure41,78622,46446.3%
Alidade51,52224,22453.0%
Subsurface12,872629651.1%
Elevation gear21,01011,79243.9%
Table 2. Accuracy evaluation of the surrogate model.
Working Condition RMSE (mm) R 2
working condition 11.20 × 10−40.982
working condition 21.47 × 10−40.977
Table 3. Predicted value and simulation value data comparison.
Predicted Value (mm)Simulative Value (mm)Relative Error (%)
Maximum0.0320780.0315891.54%
R 2 0.986
R M S E 1.16 × 10⁻⁴
Table 4. Comparison of calculation time length.
ModelAverage Solution Time (s)
Finite element model24
RF model0.39
Disclaimer/Publisher’s Note: The statements, opinions and data contained in all publications are solely those of the individual author(s) and contributor(s) and not of MDPI and/or the editor(s). MDPI and/or the editor(s) disclaim responsibility for any injury to people or property resulting from any ideas, methods, instructions or products referred to in the content.

