1. Introduction
In the research field concerning the effects of blasting on buried gas pipelines, domestic and foreign scholars have carried out extensive and in-depth exploration [
1,
2,
3]. However, due to the limitation of field test conditions, it is often difficult to fully consider various influencing factors in actual engineering. For example, key parameters such as buried depth, internal pressure, and pipe diameter of pipelines are often ignored in field tests, which limits the accuracy and universality of test results [
4,
5]. In the field test, although researchers strive to be detailed and comprehensive in the design scheme and operation process, there are still shortcomings [
6]. Limited by the existing monitoring technology and testing means, the data obtained from field tests are often limited in quantity and single in nature [
7]. Especially in the acquisition of key data such as stress distribution in pipelines, the existing test means often fail to meet the requirements [
8]. This further limits the ability of field tests to fully gauge the behavior of buried gas pipelines under blasting action. In order to make up for the shortcomings of field tests, scholars at home and abroad began to turn to numerical simulation research [
9,
10]. Numerical simulation technology, especially using dynamic finite-element software, can simulate complex blasting scenes [
11,
12]. A variety of influencing factors are considered to provide a more comprehensive and accurate pipeline response analysis. Through numerical simulation, researchers can obtain data that are difficult to measure in field tests, such as stress distribution and deformation inside pipelines [
13,
14]. Furthermore, the mechanism of blasting effect on buried gas pipelines can be more deeply understood [
15,
16]. In domestic and foreign research, numerical simulation has been widely used in pipeline response analysis under various blasting scenarios [
17,
18,
19,
20]. By comparing the results of numerical simulation with those of field tests, researchers can verify the accuracy of the numerical model [
21] and further optimize the model parameters to improve the reliability of the simulation results. In addition, numerical simulation can simulate pipeline response under different working conditions, providing important references for engineering design and safety protection [
22].
When analyzing the reliability of corroded pipes, scholars often assume that the random variables are independent. But this kind of assumption is unreasonable, will cause large errors, and can even engender incorrect conclusions. Thus, a reliability analysis method for corroded pipeline considering the correlation of random variables is proposed, and a sensitivity analysis of the correlation coefficient of random variables is carried out. The corrosion reliability model of long-distance pipeline under the condition of corrosion defect parameter correlation is established, and the pipeline failure probability is calculated. However, the existing studies focus on analyzing the influence of the correlation between the initial defect depth and length on the failure probability, and do not study the influence of the correlation between the corrosion defect depth and length on the inferred value of the corrosion parameters themselves. In fact, pipeline corrosion length can provide more comprehensive information for the prediction of pipeline corrosion depth, which can be used to analyze the reliability of corroded pipelines more accurately [
23]. However, although numerical simulation has made remarkable progress in the study of buried gas pipelines under blasting action, some challenges still remain. For example, how to accurately simulate complex blasting scenarios and how to consider the coupling effects of multiple influencing factors remain unclear. These are the current research difficulties and hot spots. Therefore, future research must continue to deeply explore the application of numerical simulation technology in this field to promote the further development of related research.
Under the action of blasting, the corrosion state and related parameters of the buried gas pipeline will change dynamically. The analysis of dynamic response can comprehensively consider the influence of these dynamic factors on the reliability of the pipeline, and make up for the lack of existing research. Therefore, in this paper, the dynamic response characteristics of buried gas pipeline under blasting are studied by combining the comprehensive research methods of a field test and numerical simulation. At the same time, the numerical model parameters are verified by field tests, and the stress distribution law of the pipeline under blasting is analyzed. Finally, the safety of the pipeline is analyzed according to the relevant specification requirements.
3. Theoretical Determination of Explosion Load
The tube–soil interaction is extremely complicated because of the complex nonlinear and inelastic characteristics of the soil medium. It is generally believed that the method of calculating the tube–soil interaction separately from the tube does sufficiently account for the tube–soil interaction. This does not accord with the actual stress state of the buried pipeline and affects the accuracy of the results. The pipe–soil interaction is a complex coupling system, and its exact working form is still unclear. At present, there is no universal force model which can be applied to any tube–soil force model. Therefore, it is necessary to simplify the design of different stress models to correspond to their respective stress characteristics.
According to the dynamic response monitoring data of ductile iron pipe under blasting vibration, the dynamic response of large-diameter cast iron pipe under a blasting load based on Timoshenko beam theory is calculated. The vibration response prediction model of large-diameter cast iron pipe under blasting vibration is established, and the accuracy of the simulation of the pipe–soil interaction by Kelvin foundation beam theory is verified.
The explosive detonates in the rock mass, and the stress wave propagates through the rock–soil interface and reaches the pipe after transmission. If the distance between the pipe and the explosion source is far enough, the explosion stress wave can be assumed to propagate on the plane formed by the pipe and the explosion source, that is, the explosion stress wave is considered as a plane wave, and the propagation path of the stress wave is shown in
Figure 4.
According to the research results of Abdoun, T.H. et al., the blasting load adopts exponential-decay-type load [
4]:
where
ps is the peak explosion pressure, and
m is the attenuation coefficient.
cp is the longitudinal wave velocity, and rf is the radius of the crushing zone.
When explosive explodes, it will instantly produce a large blasting pressure in the gun hole, directly acting on the hole wall. The formula of detonation pressure is as follows:
where
pb is the detonation pressure at the gun hole,
ρe is the explosive density,
D is the explosive detonation speed, and
γ is the isentropic index, usually 3.0.
In the process of rock blasting, the crushing zone and elastic zone will be produced under the action of explosion shock wave and stress wave with the detonation source as the center. When it reaches the crushing zone, the attenuation is due to the stress wave. Both the shock wave and stress wave show exponential attenuation, and the attenuation index is as follows [
11]:
In the formula, μr is the rock dynamic Poisson ratio, m1 is the attenuation index for the shock wave, and m2 is that for the stress wave.
After the stress wave reaches the edge of the crushing zone, it enters the elastic zone. At this time, the action of the stress wave can only produce elastic vibration, and the explosion pressure function is:
where
pe is the explosion pressure at the elastic boundary,
rb is gun hole radius, and
rc is crushing zone radius.
Assuming that the incident point at which the stress wave propagates to the rock–soil interface is
O, then the explosion pressure at point
O is:
where
po is the explosion pressure at the incident point
O of the rock–soil interface, and
r1 is the detonation center distance at point
O.
When the stress wave passes through the geotechnical interface, transparent reflection will occur. According to the Snell principle, the transparent reflection relationship is shown in the following formula. The location of the incident point can be obtained by calculating the spatial position relationship between the pipeline and the explosion source:
where
c1 and
c2 are the parameters of the equation:
Considering the energy dissipation after transmission of the rock and soil interface, the stress attenuation coefficient
η is introduced, and the value can be seen in the literature. The peak burst pressure acting on the pipeline point
G is obtained as follows:
Then, the peak bursting pressure acting on the pipe point
G can be further expressed as [
15]:
Due to the hysteresis that will occur when the stress wave reaches point
G relative to point
O, the Heaviside step function is introduced to obtain the explosion pressure at the pipeline:
Blast load pairs are used for buried pipelines. Therefore, only half of the part in the model where the stress wave directly acts on the pipeline is applied, and the component of the blasting load along the axial direction of the pipeline is not considered; thus, the explosion load of the pipeline is:
4. Numerical Simulation of Corroded Defective Gas Pipelines
4.1. Numerical Model Establishment
According to the actual field test, a 1:1 field modeling analysis of the pipeline was conducted. The dynamic response characteristics of the different pipelines were investigated. The model size is 40 m × 10 m × 20 m, and the model units adopt eight-node SOLID164 entity units, in the form cm–g–μ. A Euler grid was used by trial and error to study the influence of different grid sizes on the numerical simulation parameters. The pipeline mesh was refined using the minimum mesh method. Different contact surfaces adopt the contact mode. In addition, both ends of the pipeline and the surface of the model adopt the free surface mode, i.e., there is no reflection boundary condition. The numerical model is shown in
Figure 5 below. The defect diagram of the pipeline is shown in
Figure 6.
In the model, the explosive material used is exactly the same as the #2 rock explosive actually applied at the experiment site. The high explosive material model (MAT_HIGH_EXPLOSIVE_BURN) built into the software was used to build the explosive model. The detailed parameters of the explosives are shown in
Table 2. Samples were taken according to the site, and mechanical tests were carried out in the laboratory. The mechanical parameters of different materials were then studied, as shown in
Table 3. The linear elastic material model in LS-DYNA was used to simulate the stress–strain behavior of rock materials and cast-iron gas pipelines.
In order to accurately simulate the pressure, volume, and energy characteristics of explosive in the process of explosion, the equation of state (EOS_JWL) of the explosive is developed. The JWL equation can describe the relationship between the detonation pressure of the explosive and its relative volume and internal energy. The specific expression is shown in Equation (14), thus realizing the real simulation of the explosive process.
In the above formula,
p is the pressure of the explosive product;
V is the relative volume of the explosive product;
R1,
R2,
ω,
A, and
B are the parameters of the explosive material; and
E0 is the initial specific internal energy. The relevant parameters of explosive detonation products are shown in
Table 2.
4.2. Numerical Simulation and Field Test and Theoretical Comparison
In the study of pipeline dynamic response under blasting action, three methods—a numerical simulation, model test, and theoretical analysis—are comprehensively adopted to verify the accuracy and reliability of the research results. For this purpose, according to the data obtained from the field model test and the theoretical model, the monitoring points at the same position as in the model test are selected in the numerical model for data comparison. In particular, the key monitoring index of the peak stress of the pipeline is set.
During the comparison, the data obtained by numerical simulation showed high agreement with the field model test and theoretical analysis. The detailed comparison results are shown in
Table 4 and
Figure 7. Taking the peak stress as an example, the difference between the numerical simulation results and the model test results is small, with a maximum relative error of 11.36%. This shows that the numerical simulations have high accuracy in predicting the dynamic response of the pipeline under blasting.
This is because the numerical simulation method can fully consider many factors, including the nonlinear characteristics of the pipeline material, the dynamic change of the blasting load, and the interaction between the pipeline and the surrounding media. Thus, the dynamic response process of the pipeline under the action of blasting can be simulated more truly. At the same time, the model test also provides an important verification basis for the numerical simulation. By comparing the two results, the correctness of the numerical simulation model and the rationality of the parameters can be further verified. In the study of pipeline dynamic response under blasting action, the results of numerical simulation have high consistency with the results of model test and theoretical analysis data, and the error is within the acceptable range, which proves the accuracy and reliability of the numerical simulation method and the parameters used. The strain curve of the data of channel 1 under experimental conditions (
S1 measuring the axial point) is shown in
Figure 8.
According to the numerical calculation model, the overall effective stress distribution and change of the pipeline were studied. The effective stress distribution of the pipeline under the most dangerous working condition (3) is shown in
Figure 9 below. As can be seen from the analysis of
Figure 9, the blasting seismic wave begins to propagate in the pipeline at around 0.04 s, which causes the change of the effective stress of the pipeline unit, enhances the vibration of the pipeline, and gradually increases the effective stress of the pipeline. The blasting seismic wave energy reaching the pipeline peaks at around 0.1 s, and the effective stress of the pipeline also peaks. Then, the stress waves oscillate continuously in the pipe structure, causing the effective stress oscillation of the pipe. After 0.2 s, the blasting seismic wave energy in the pipeline medium gradually disappears, and the effective stress of the pipeline gradually decreases and stabilizes. When the blasting seismic wave propagates in the pipeline, the effective stress on the central section of the pipeline is the largest, and the effective stress takes the central section of the pipeline as the symmetric plane along the pipeline axis, making the central section of the pipeline the dangerous section. It can be seen that the effective stress corresponds to the distribution law of the vibration velocity of the pipeline.
4.3. Analysis of the Effect of Blasting on the Stress of Corroded Gas Pipelines with Different Elastic Moduli
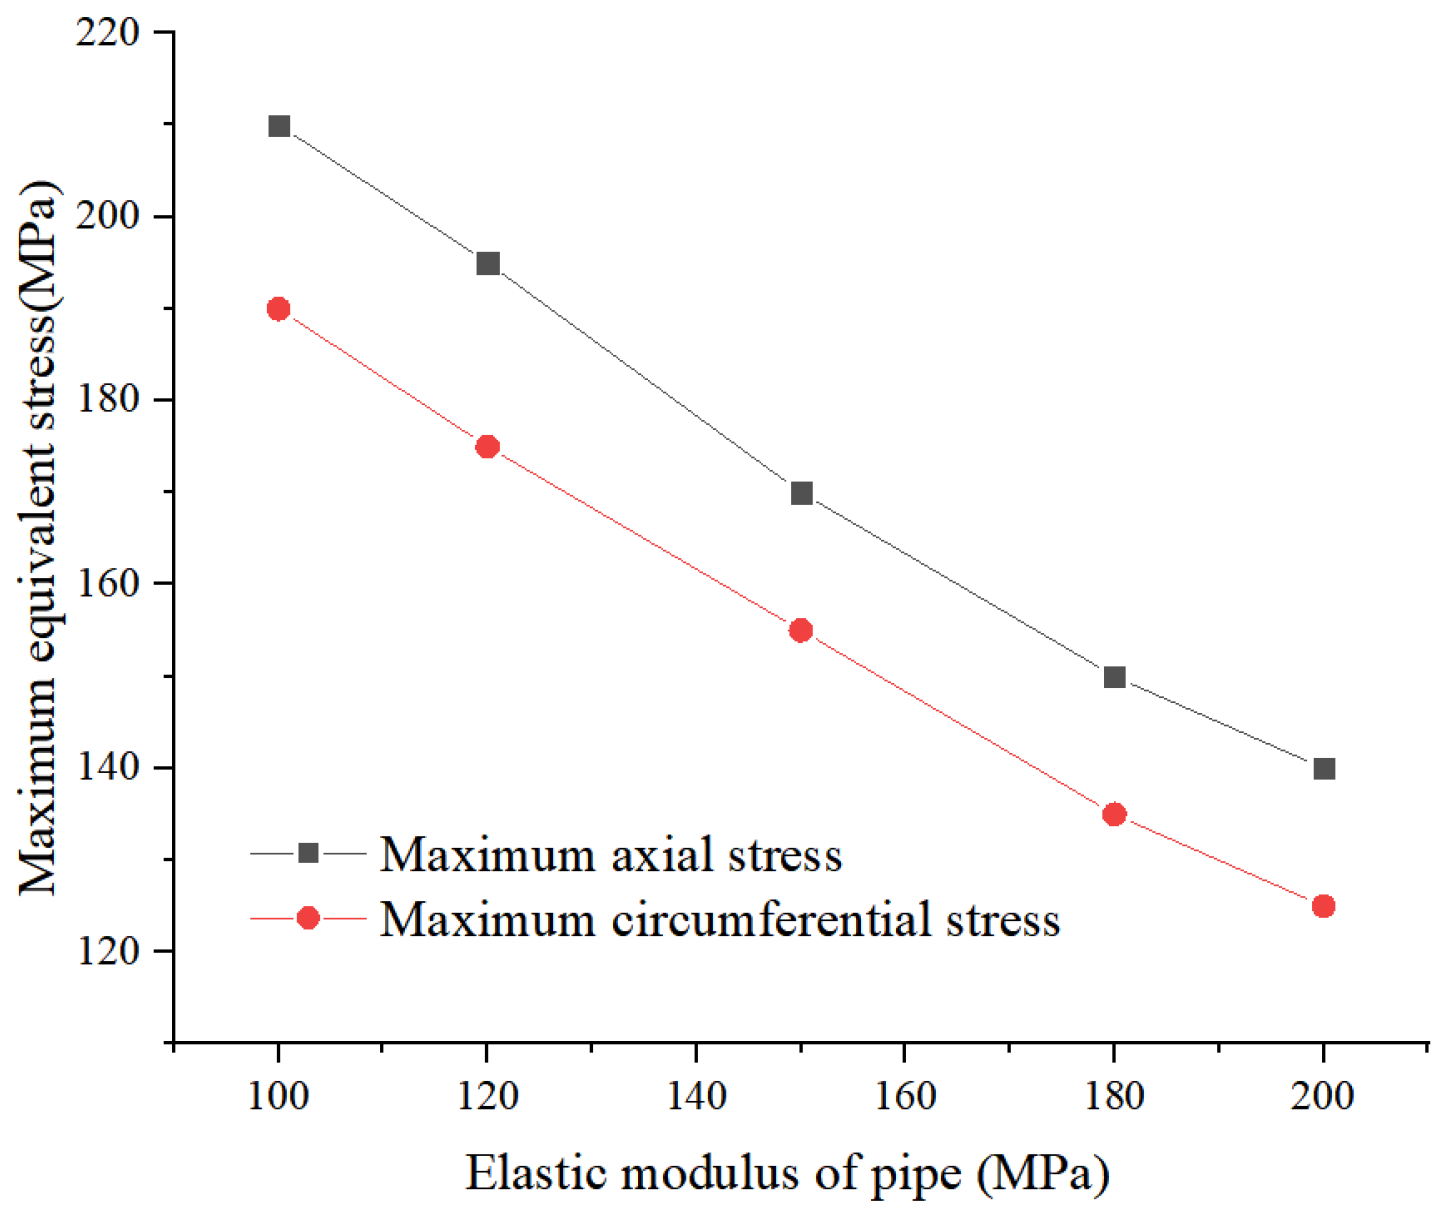
With the acceleration of urban infrastructure construction, blasting operations are becoming more and more frequent in urban construction. However, the vibration effect of blasting may pose a potential safety threat to nearby buried pipelines, especially corroded gas pipelines. As an important index to measure the ability of material to resist elastic deformation, elastic modulus has a significant effect on the stress change of pipeline under blasting vibration. Therefore, this paper aims to discuss the stress variation law of corroded gas pipeline under different elastic moduli. This paper provides a theoretical basis for the safety evaluation and maintenance of pipelines. In this paper, the stress changes of corroded gas pipelines due to different elastic moduli (100 GPa, 120 GPa, 150 GPa, 180 GPa, 200 GPa) under the same blasting parameters are studied. The experiment adopts the control variable method, by adjusting the elastic modulus of the pipeline. The maximum stress change of the pipeline under blasting vibration was observed and recorded in order to reveal the intrinsic relationship between the elastic modulus and the stress of the pipeline. The stress variation law of corroded gas pipeline under different elastic moduli of blasting is shown in
Figure 10 below.
Under the same blasting parameters, the stress response experiments of corroded gas pipelines with different elastic moduli (100 GPa, 120 GPa, 150 GPa, 180 GPa, 200 GPa) were carried out. The experimental results show that with the increase of elastic modulus, the maximum stress of the pipeline under blasting vibration increases first and then tends to be stable. Specifically, when the elastic modulus increases from 100 GPa to 150 GPa, the maximum stress of the pipeline increases significantly. For example, a pipe with a 100 GPa elastic modulus has a maximum stress of 250 MPa, while a pipe with a 150 GPa elastic modulus may have a maximum stress of 350 MPa, showing an increase of about 40%. The increase in this stage is mainly due to the increased rigidity of the material, which causes the pipe to produce a greater stress response when subjected to the same blasting vibration.
However, when the elastic modulus continues to increase from 150 GPa to 200 GPa, the maximum stress increase of the pipeline significantly slows down and even becomes stable. For example, the maximum stresses of pipes with 180 GPa and 200 GPa elastic moduli may be 370 MPa and 380 MPa, respectively, demonstrating an increase of only about 2.7%. This shows that after the elastic modulus reaches a certain level, the stress response of the pipeline to blasting vibration gradually tends to saturation, and the effect of additional elastic modulus increase on stress reduction is no longer significant.
In the design and maintenance of the gas pipeline, the elastic modulus of the material and the characteristics of the blasting vibration should be comprehensively considered to ensure the sufficient strength and stability of the pipeline under the blasting vibration. At the same time, future studies can further explore the stress variation law of corrosive gas pipelines under different blasting parameters, as well as the internal relationship between elastic modulus and other mechanical property parameters, so as to provide a more comprehensive theoretical basis for the safety design and maintenance of natural gas pipelines.
4.4. Analysis of the Effect of Blasting on the Stress of Corroded Gas Pipelines of Different Thicknesses
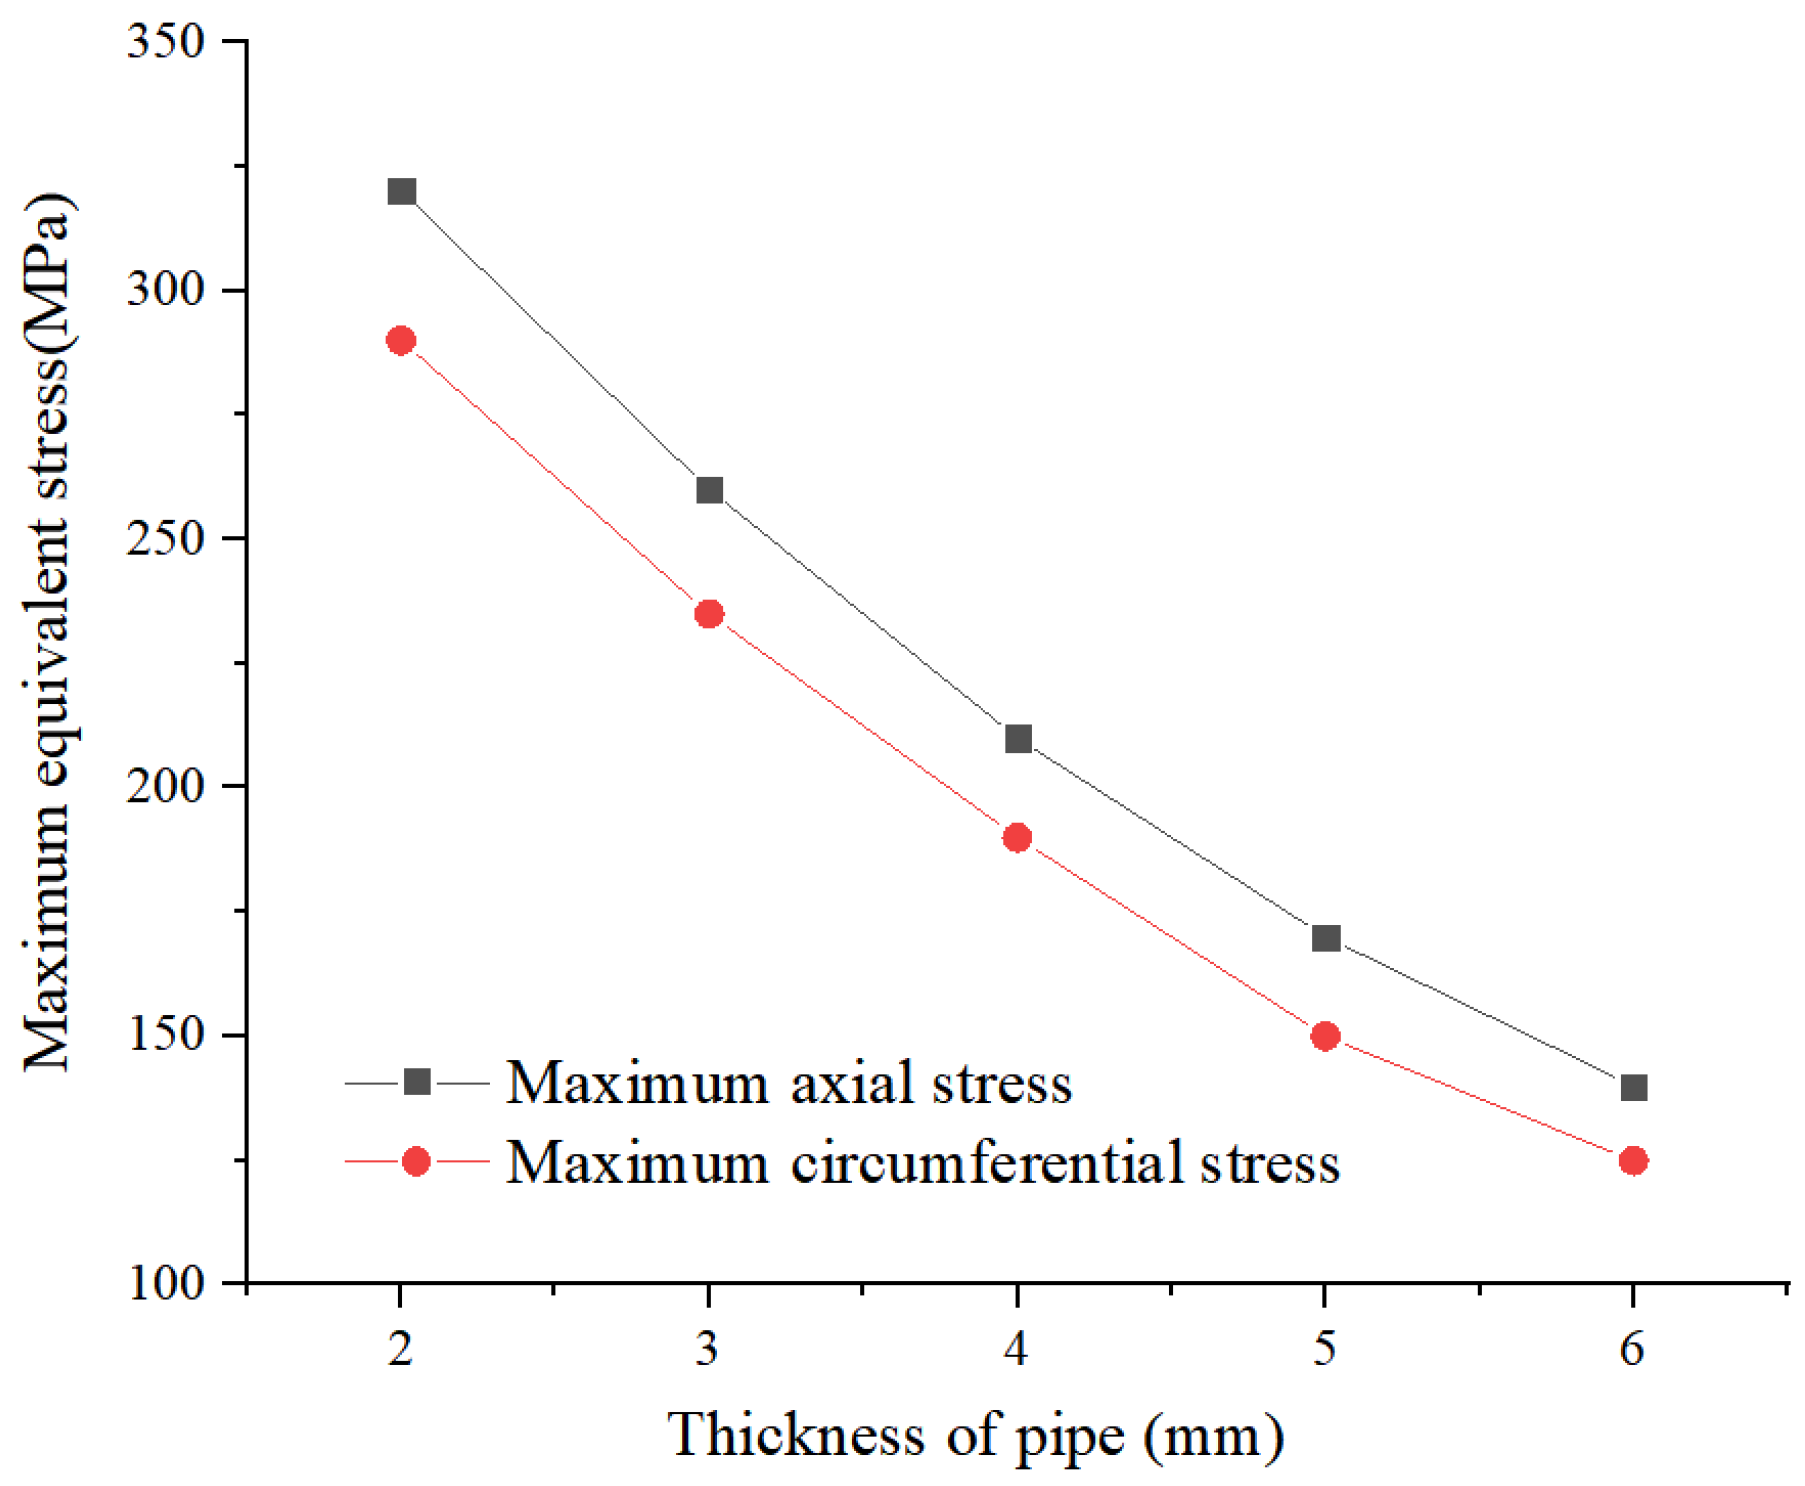
With the acceleration of urbanization, blasting operations are becoming more and more frequent in urban construction. However, the vibration effect of blasting may pose a potential safety threat to nearby buried pipelines, especially corroded gas pipelines. As an important index to measure the structural strength of the pipeline, the thickness of the pipeline has a significant influence on the stress change of the pipeline under blasting vibration. The stress changes of corroded gas pipelines with different thicknesses caused by blasting are shown in
Figure 11 below.
Under the same blasting parameters, the stress response experiments were carried out on corroded gas pipelines with different thicknesses (2 mm to 6 mm). The experimental results show that with the increase of pipe thickness, the maximum axial stress and the maximum circumferential stress both show a significant decreasing trend. Specifically, when the pipe thickness is increased from 2 mm to 6 mm, the maximum axial stress is reduced from 320 MPa to 140 MPa, a reduction of about 56.3%, and the maximum circumferential stress is reduced from 290 MPa to 125 MPa, a reduction of about 56.9%. This change law shows that thicker pipes can better absorb and disperse the energy generated by blasting vibration, reduce stress concentration and deformation, and thus improve their structural strength and stiffness.
Further analysis shows that with the increase of pipe thickness, the rate of stress reduction gradually slows down. This may be because with the increase of thickness, the deformation resistance of the pipe is gradually enhanced, so that the effect of additional thickness on stress reduction is gradually weakened. In addition, thicker pipes also have better fatigue resistance and can more effectively resist fatigue damage caused by blasting vibration, thus extending the service life of the pipes.
4.5. Analysis of Stress Effect of Blasting on Corroded Gas Pipelines with Different Defect Lengths
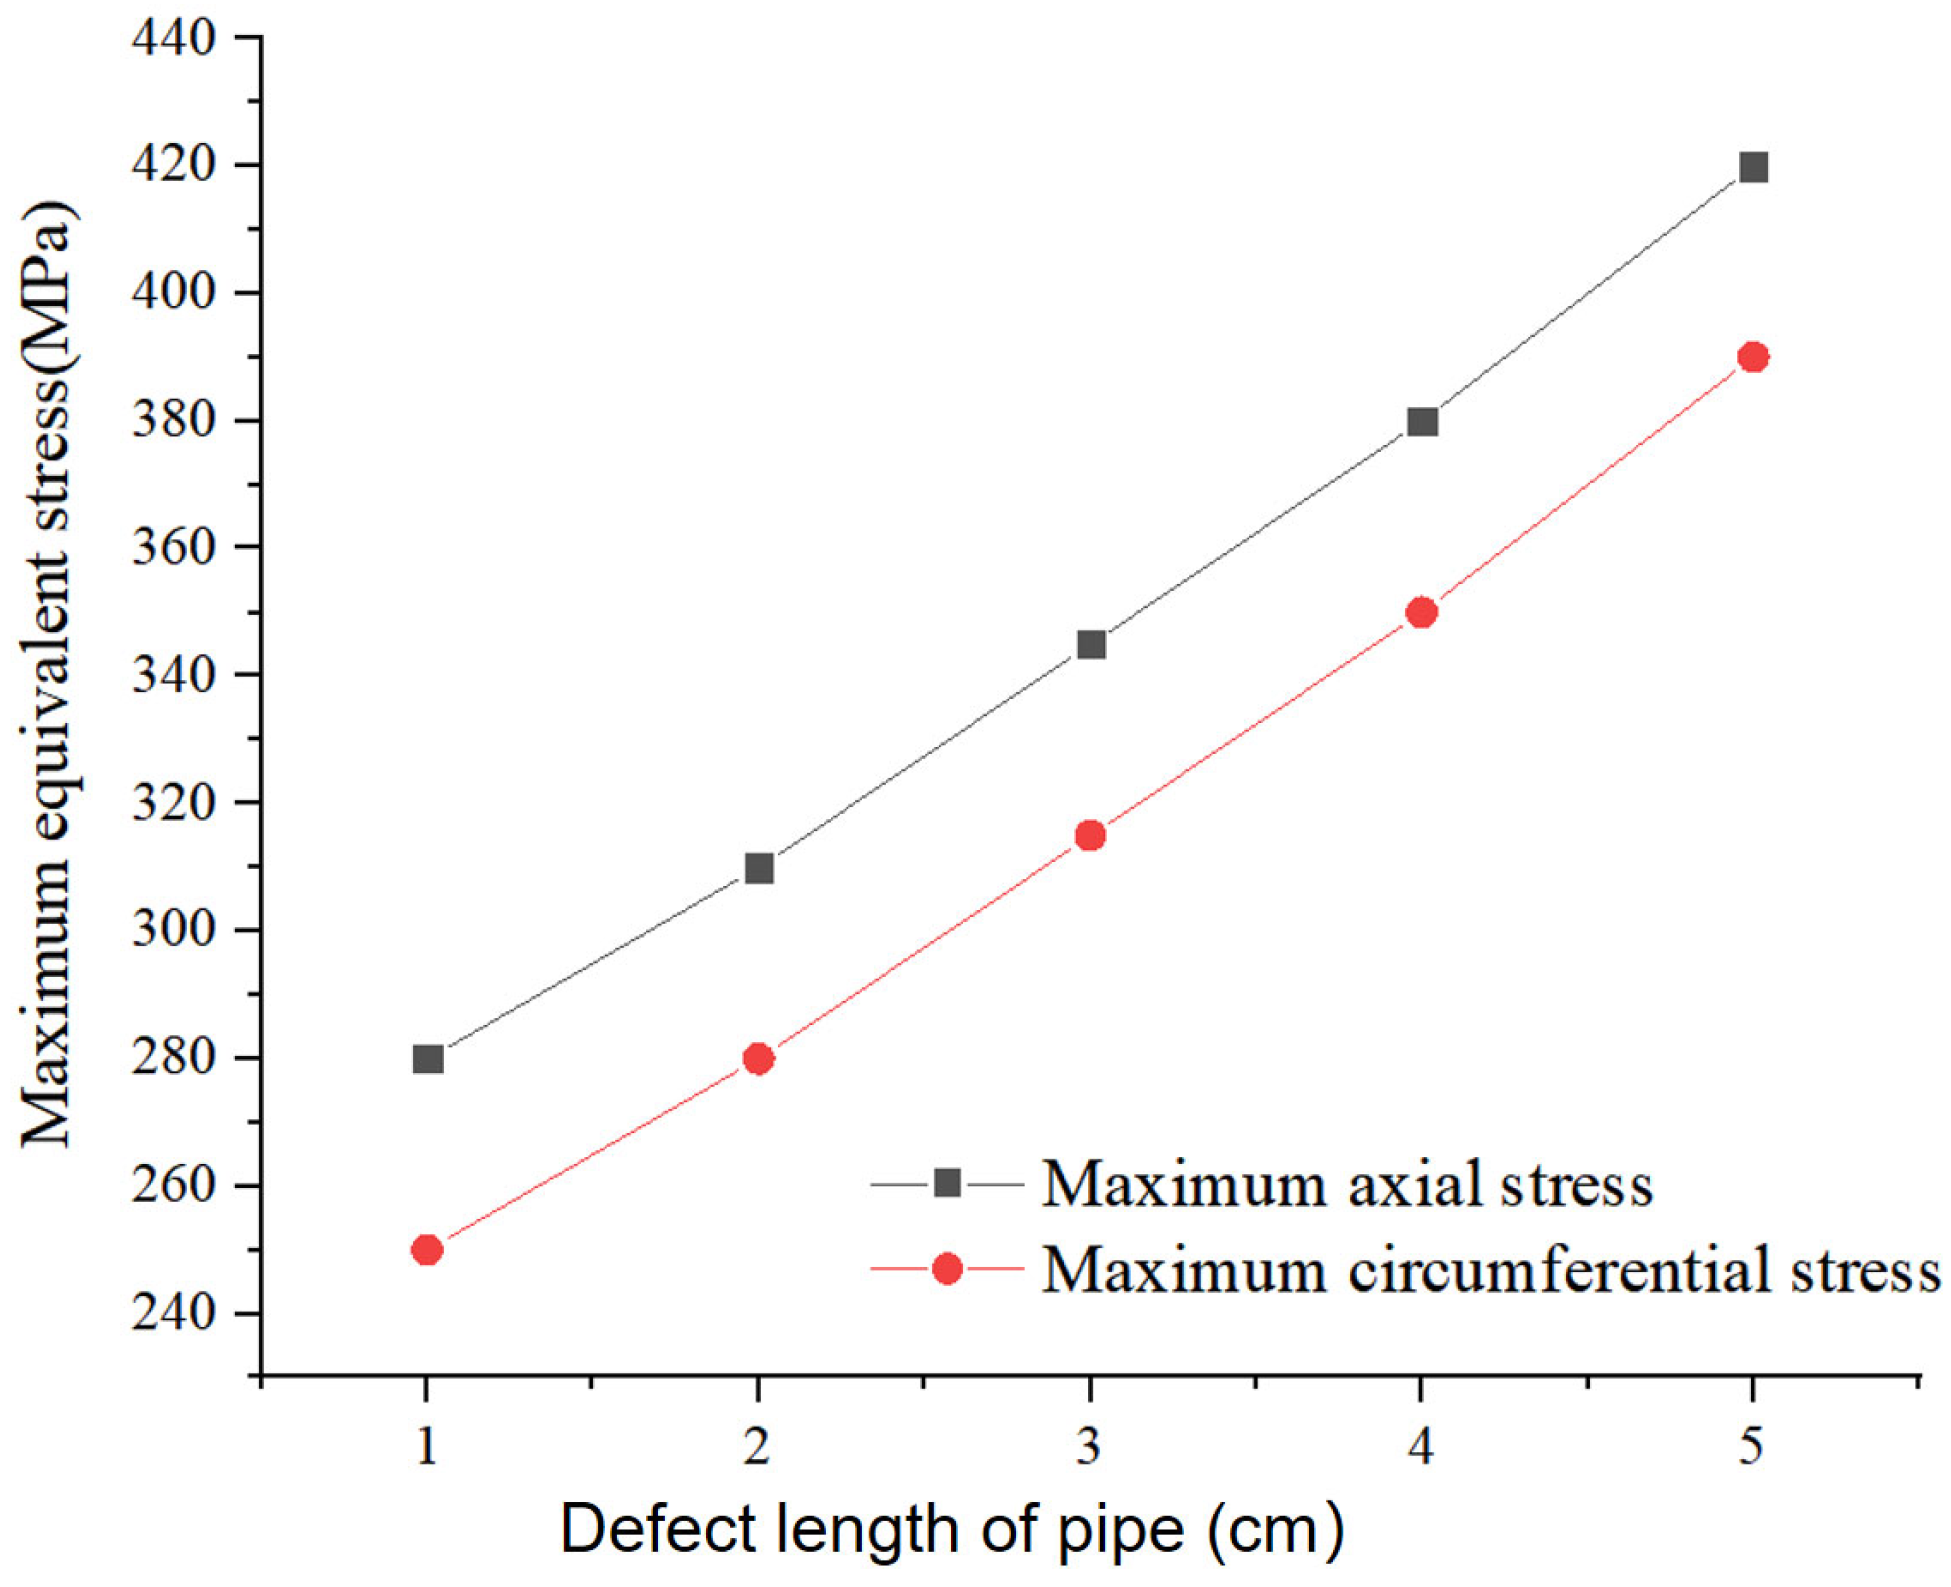
The stress variation rules of corroded gas pipelines with different defect lengths caused by blasting are shown in
Figure 12 below.
The stress variation law of corroded gas pipeline due to different defect lengths (1 cm, 2 cm, 3 cm, 4 cm, 5 cm) under the same blasting parameters is studied in this paper. Through accurate experimental measurement and data analysis, we reveal the internal relationship between the defect length and the pipeline stress. When the defect length is 1 cm, the maximum axial stress of the pipeline is 280 MPa, and the maximum circumferential stress is 250 MPa. At this time, due to the short defect length, the overall structural integrity of the pipeline has not been seriously damaged, so the stress level is relatively low.
With the defect length increasing to 2 cm, the maximum axial stress of the pipeline rises to 310 MPa and the maximum circumferential stress to 280 MPa. This indicates that the increase in defect length has begun to have a significant impact on the structural integrity of the pipeline, resulting in some increase in stress levels. When the defect length is further increased to 3 cm, the maximum axial stress of the pipeline reaches 345 MPa, and the maximum circumferential stress 315 MPa. At this time, the increase of defect length has a more obvious impact on the stress of the pipeline, and the stress level continues to rise.
When the defect length reaches 4 cm, the maximum axial stress of the pipeline jumps to 380 MPa, and the maximum circumferential stress is 350 MPa. This indicates that with increased defect length, the structural integrity of the pipeline is severely damaged, leading to a sharp increase in the stress level. When the defect length increases to 5 cm, the maximum axial stress of the pipeline finally reaches 420 MPa, and the maximum circumferential stress reaches 390 MPa. At this time, the stress level of the pipeline has reached or is close to its ultimate carrying capacity, and there are serious safety risks.
It can be seen from the above data that with the increase of defect length, the maximum stress of corroded gas pipeline under the action of blasting vibration presents a linear or approximately linear upward trend. This change law reveals the significant influence of defect length on pipeline stress, that is, the longer the defect length, the higher the stress level of pipeline under blasting vibration, and the greater the safety risk.
5. Analysis of the Safety Factor of Pipeline Under Different Working Conditions
With the acceleration of urbanization, blasting operations are becoming more and more frequent in urban construction. However, the vibration effect of blasting may pose a potential safety threat to nearby buried pipelines, especially corroded and defective gas pipelines. In order to evaluate the safety of pipeline under blasting vibration, the concept of a safety factor is introduced, that is, the ratio of the maximum stress of pipeline to its yield stress. Studying the variation law of the safety factor under different elastic moduli, pipeline thicknesses, and defect lengths provides a theoretical basis for the safety design and maintenance of gas pipeline.
According to the specification “Code for Design of Gas Pipeline Engineering” (GB50251-2015) [
24], the effective stress of ball mill cast-iron pipeline should meet the following:
In the formula,
σs is the minimum yield strength specified in the pipe standard, in MPa. According to China’s code on “ductile iron pipes, fittings and accessories for water and gas pipelines” (GB-T 13295-2008) [
25], in this experiment, the ductile iron pipe
σs is 300 MPa. It is calculated that [
σ] = 270 MPa, because
σe < [
σ], so the pipeline material is not damaged, the pipeline is in a safe state, and according to the field test inspection, there is no obvious deformation and damage of the pipe body, so the above formula is reasonable.
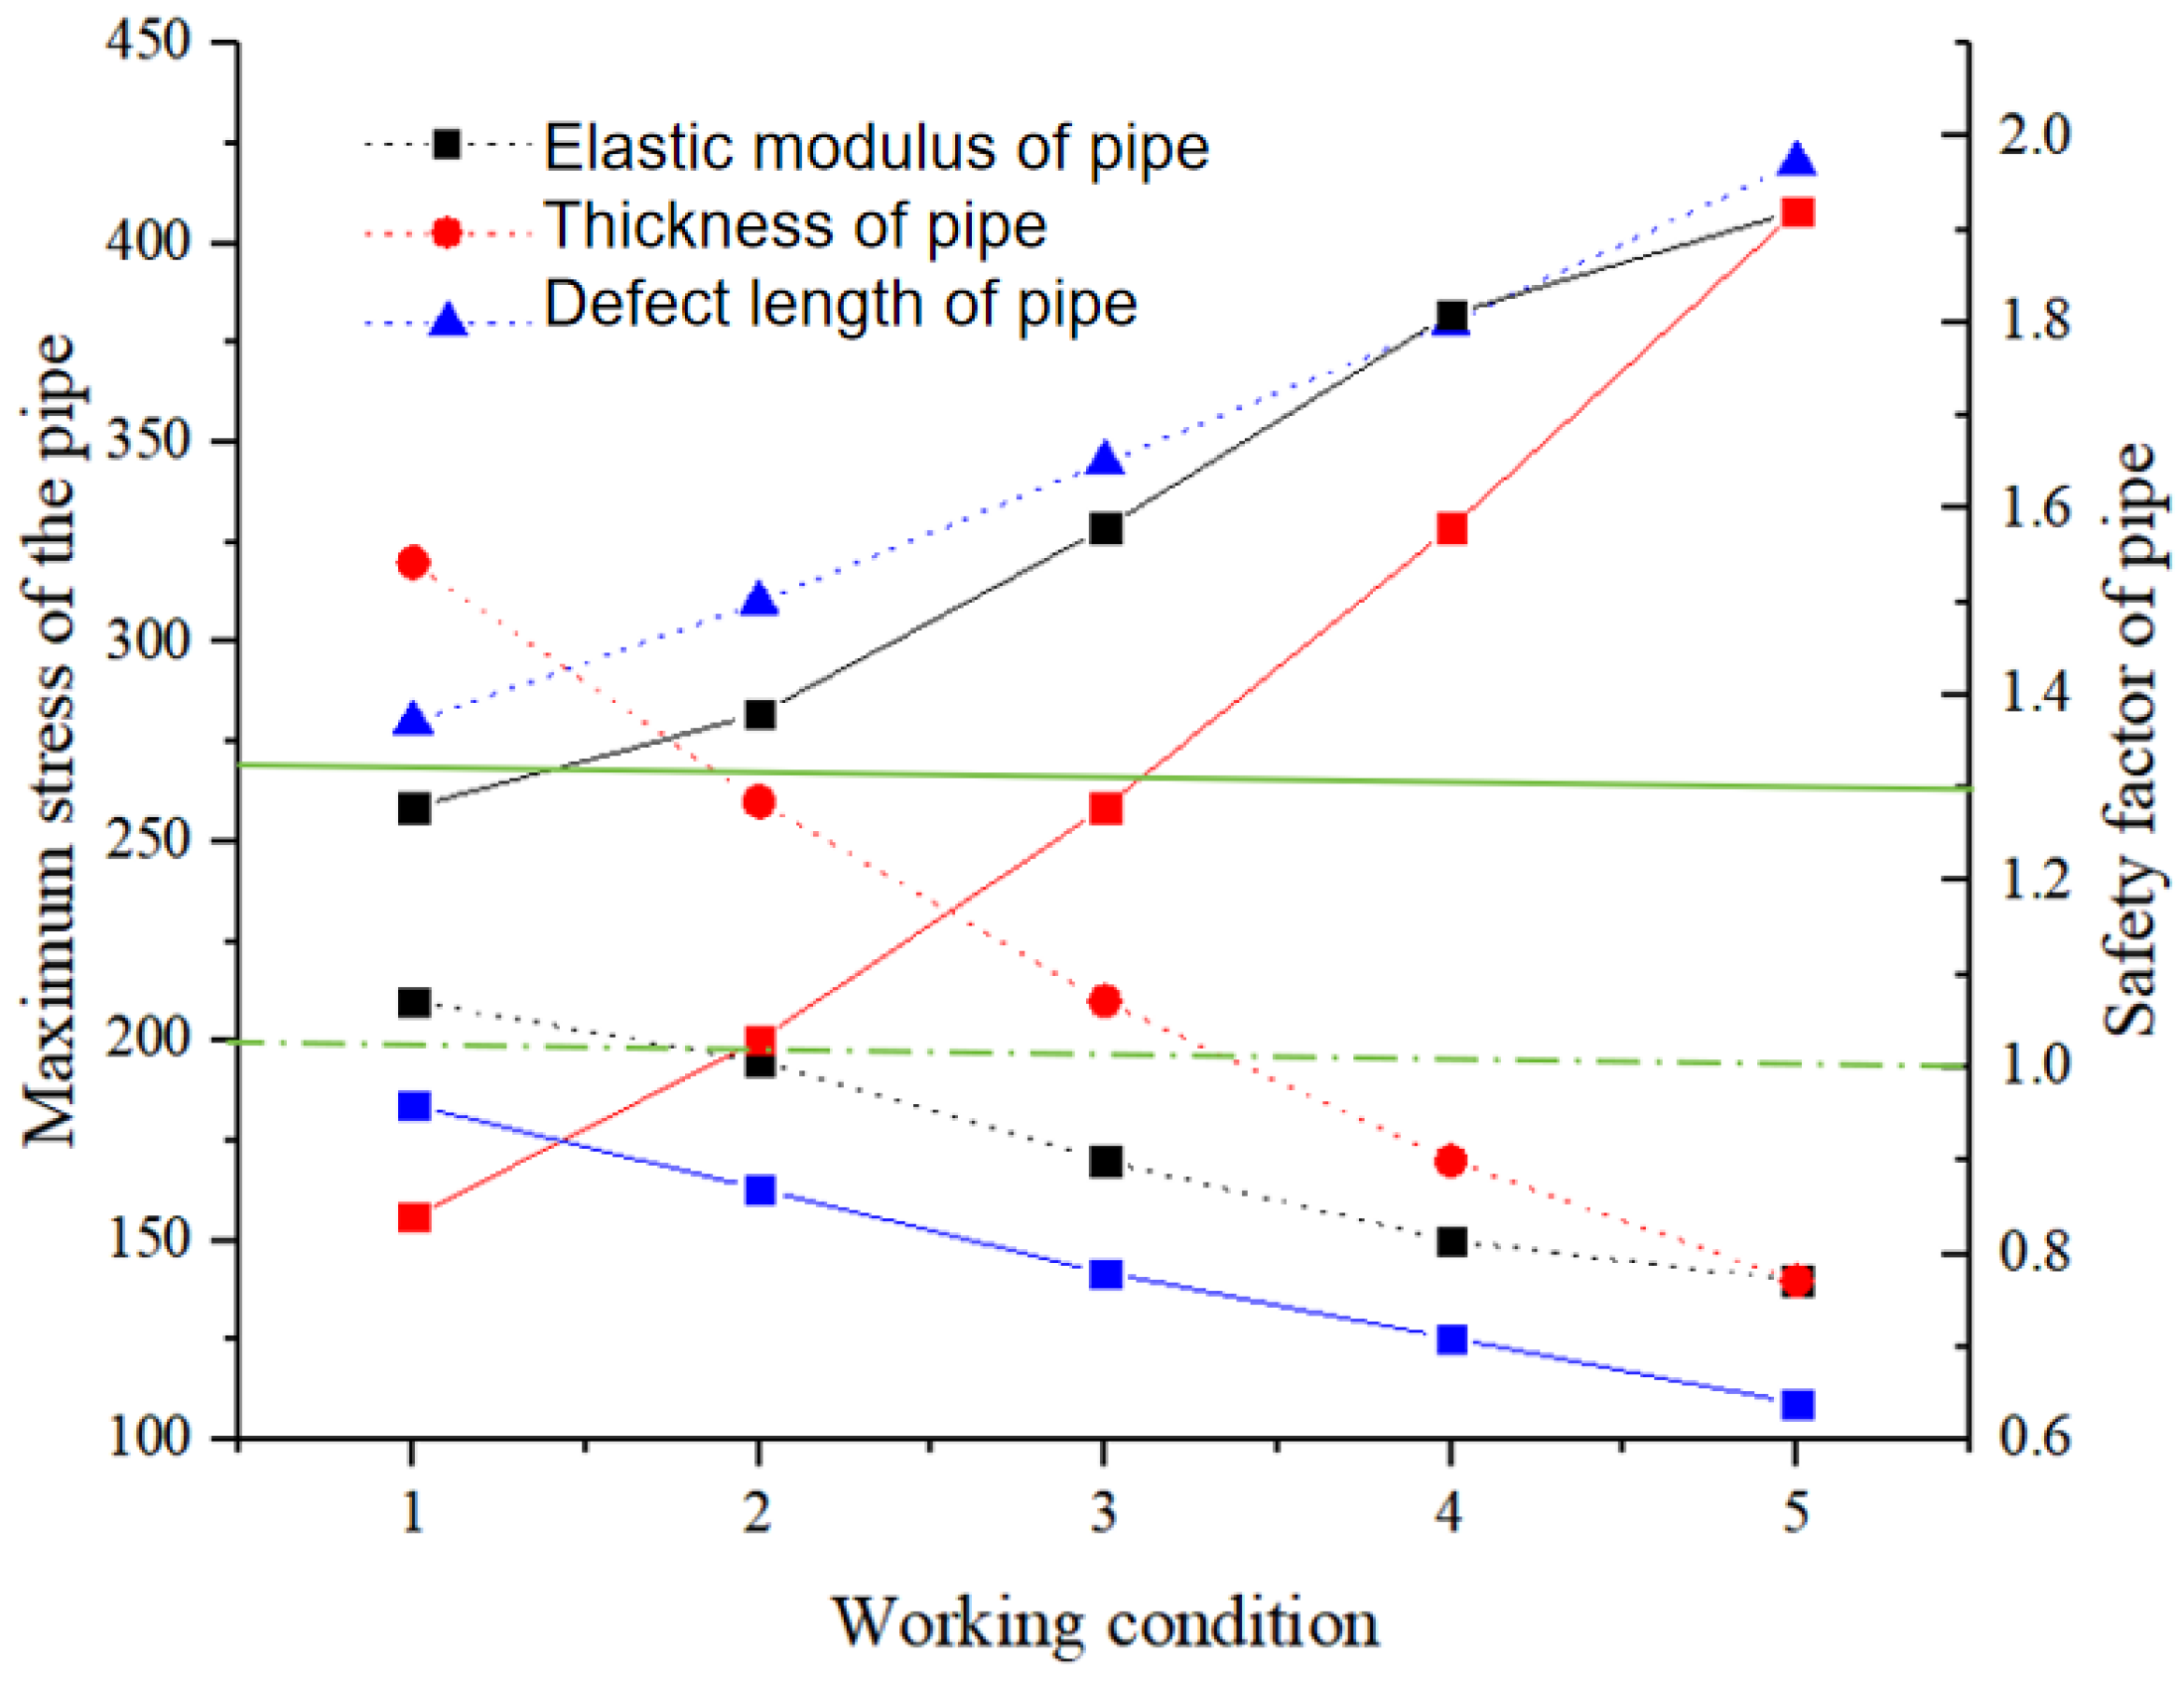
Under the same blasting parameters, the safety factor of the corrosive gas pipeline increases with the increase of the elastic modulus, as shown in
Figure 13 and
Table 5. In
Figure 13, it seems that solid lines show the safety factor while dashed lines show maximum stress. Specifically, when the elastic modulus increases from 100 GPa to 200 GPa, although the maximum stress of the pipeline decreases, the safety factor increases from 1.28 to 1.92 due to the constant yield stress. This change shows that the pipeline with a higher elastic modulus has a more stable structure when bearing the same blasting vibration, and can better resist the generation of stress, thus improving the safety performance of the pipeline. On the other hand, the influence of pipeline thickness on the safety factor shows a reverse changing trend. Under the assumed data, as the thickness of the pipeline increases from 2 mm to 6 mm, although the maximum stress should theoretically decrease from 320 MPa to 140 MPa, the yield stress remains unchanged. Therefore, the safety factor should theoretically increase.
In practice, attention should be paid to the real impact of the increase in thickness on the maximum stress. However, it should be emphasized that in the actual situation, with the increase of the thickness of the pipeline, its resistance to blasting vibration will be significantly enhanced, so as to effectively reduce the maximum stress and improve the safety factor. As for the defect length, its increase will lead to a significant increase in the maximum stress of the pipeline, thereby reducing the safety factor, which demonstrates the need for special vigilance.
6. Conclusions
It is found that the stress change of corrosive gas pipes is significantly affected by the elastic modulus, pipe thickness, and defect length under the same blasting parameters. An increase in elastic modulus and pipe thickness will reduce the maximum axial stress and circumferential stress of the pipe under the blasting vibration, while increasing defect length will lead to stress increase. The study results provide an important basis for pipeline safety evaluation and maintenance.
In pipeline design and material selection, materials with high elastic modulus should be given priority, and the thickness of the pipeline should be strictly controlled to ensure that it meets the design requirements. These measures can improve the overall structural stability and blasting vibration resistance of the pipeline, thus reducing the maximum stress of the pipeline and improving the safety factor.
For laid pipes, regular thickness measurement and defect inspection should be carried out to find and repair the pipe segments with insufficient thickness or defects in time. In particular, a pipeline section with a long defect length should be taken as the key object of monitoring, and the daily inspection and maintenance work should be strengthened to ensure safe operation.
To sum up, through reasonable selection of materials, strict control of pipeline thickness, timely repair of defects, and strengthening daily inspection and other measures, the safety factor of corroded gas pipelines under the action of blasting vibration can be effectively improved to ensure safe operation. These measures are of great significance for the safety evaluation and maintenance of gas pipelines.


