1. Introduction
Given the growing popularity of plant–based diets and the search for alternatives to traditional dairy products, there is a need to develop new, consumer–appealing products that combine the nutritional value of milk and oats [
1,
2,
3,
4,
5]. The development of plant–based beverages has gained significant attention in recent years, driven by consumer demand for dairy alternatives and functional food products. Among these, oat–based beverages have emerged as a popular choice due to their nutritional benefits, mild taste, and sustainable production methods. Historically, plant–based milk alternatives have evolved from traditional soy and almond beverages to more diverse options, including oat–, rice–, and pea–based formulations. The increasing prevalence of lactose intolerance, dairy allergies, and environmental concerns associated with dairy farming has further fueled the expansion of the plant–based beverage market. The integration of oats with dairy in fermentation processes can lead to the development of beverages with improved functional properties, offering health benefits and appealing flavors.
Oat–based beverages can be a source of valuable nutrients such as protein, dietary fiber, and beta–glucans, which have beneficial effects on health. Beta–glucans, in particular, have been widely studied for their role in reducing cholesterol levels and supporting heart health. Additionally, the dietary fiber in oats contributes to improved digestion and gut health, making oat–based beverages a compelling choice for health–conscious consumers. Furthermore, the reduced lactose content in products with a higher proportion of oat beverage can be beneficial for individuals with lactose intolerance, expanding their accessibility and appeal to a wider audience [
6]. The findings will contribute to the development of innovative dairy–oat beverages that balance nutritional value, sensory appeal, and storage stability, aligning with contemporary dietary trends and consumer preferences.
Fermentation with lactic acid bacteria can further improve the nutritional value of oat–based beverages by increasing the concentration of beneficial organic acids and reducing sugar content, thus enhancing the overall health benefits of the beverage [
7]. Organic acids such as lactic acid and acetic acid, produced during fermentation, contribute to gut microbiota health by promoting beneficial bacteria and inhibiting the growth of harmful pathogens. Moreover, these acids improve the digestibility of the beverage and enhance the bioavailability of essential nutrients.
Driven by the escalating consumer adoption of plant–centric dietary patterns and the consequent demand for substitutes for conventional dairy matrices, research and development efforts are warranted to engineer novel food formulations. These formulations should aim to synergistically integrate the nutritional profiles of dairy and oat–derived components, thereby yielding products that exhibit enhanced palatability and appeal to contemporary consumer preferences. The integration of oats with dairy in fermentation processes can lead to the development of beverages with improved functional properties, offering health benefits and appealing flavors [
5]. The fermentation process can also influence the texture and viscosity of the final product, making it more palatable and enjoyable for consumers. Proper strain selection of lactic acid bacteria is crucial to achieving a desirable sensory profile, as different bacterial strains can impact the taste, aroma, and mouthfeel of the fermented beverage. Additionally, incorporating probiotics into these beverages can provide an added health benefit, supporting gut microbiome balance and immune function.
There is a growing demand for plant–based and probiotic–rich beverages as alternatives to traditional dairy products, driven by health–conscious consumers who seek functional foods that provide both nutrition and wellness benefits [
8]. The development of co–fermented oat–dairy beverages aligns with these trends, offering a novel product that combines the benefits of both plant and dairy ingredients. Consumers are increasingly interested in foods that promote digestive health, cardiovascular well–being, and metabolic balance, making co–fermented oat–dairy beverages a promising addition to the functional food market.
Fermentation with lactic acid bacteria can further improve the nutritional value of oat–based beverages by increasing the concentration of beneficial organic acids and reducing sugar content, thus enhancing the overall health benefits of the beverage. Changes in the chemical composition of oat–based beverages, resulting from the addition of oat beverage, affect the fermentation process and the quality of the final product. The balance between oat and dairy components influences factors such as pH, microbial activity, and texture, which are critical to the sensory attributes and stability of the beverage. While the potential benefits of varying oat beverage ratios in fermented dairy–oat beverages are significant, challenges such as maintaining bacterial viability and optimizing sensory attributes must be addressed. Advanced food processing techniques and formulation strategies can help overcome these challenges, ensuring a high–quality final product that meets consumer expectations.
Further research could explore the balance between oat and dairy components to maximize health benefits while ensuring consumer acceptance. Investigating the effects of different fermentation conditions, bacterial strains, and oat–dairy ratios could lead to optimized formulations that enhance both nutrition and flavor. Additionally, consumer preference studies could provide insights into the ideal characteristics of co–fermented oat–dairy beverages, guiding product development to align with market demands.
In conclusion, the co–fermentation of oats and dairy presents an exciting opportunity to develop innovative functional beverages that cater to modern consumer needs. By combining the nutritional and sensory advantages of both ingredients, these beverages have the potential to become a valuable addition to the plant–based and probiotic beverage market, supporting health and well–being while offering a delicious and accessible alternative to traditional dairy products.
The aim of this study was to determine the effect of different proportions of oat beverage in cow’s milk on the physicochemical, textural, sensory, and microbiological properties of fermented dairy–oat beverages, as well as to assess the stability of these properties during cold storage. The obtained results can be used by food manufacturers to develop new, innovative oat–based products with optimized nutritional, sensory, and stability properties, meeting the needs of various consumer groups.
2. Materials and Methods
2.1. Raw Materials
The materials used to produce the dairy–oat beverages were a commercially available oat beverage from the brand Inka (GRANA Sp. z o.o., Skawina, Poland) and a UHT cow’s milk product from the brand Wypasione (Mlekovita, Wysokie Mazowieckie, Poland), with a fat content of 3.2%. According to the manufacturer’s declaration, the Inka oat beverage was made from water with a 10% oat addition, rapeseed oil, acidity regulators (dipotassium phosphate, calcium carbonate), sea salt, stabilizer (gellan gum), vitamins D, B12, and B2. The starter culture used to ferment the dairy–oat beverages was YC–X16 (Chr. Hansen, Hørsholm, Denmark), containing bacteria of the species Streptococcus thermophilus and Lactobacillus delbrueckii subsp. bulgaricus.
2.2. Primary Chemical Components of Beverages Prior to Fermentation
The preparation of dairy–oat beverages initially involved the precise measurement of cow’s milk and oat beverages into clean and sterilized glass jars in appropriate volumes (
Table 1). The final volume of each sample of the beverage variants was 150–160 mL.
In the received samples of dairy–oat beverages, the content of dry matter, protein, fat, carbohydrates, and lactose was analyzed, with all analyses performed in triplicate and reported to two decimal places. The dry matter content was determined by the drying method, drying the samples at a temperature of 105 °C to a constant mass, which took approximately 4 h [
9]. The protein content was determined by the Kjeldahl method, assuming a protein conversion factor of 6.38 for milk and 5.83 for oat proteins [
9,
10]. The crude fat content was determined by the Gerber method. Total carbohydrate content of foods was calculated by difference and is calculated by Formula (1) [
10]:
In the case of milk and oat beverage, it was assumed that the ash content is 0.7 g per 100 mL. The lactose content was determined by high–performance liquid chromatography (HPLC) [
11].
2.3. Beverages Fermentation
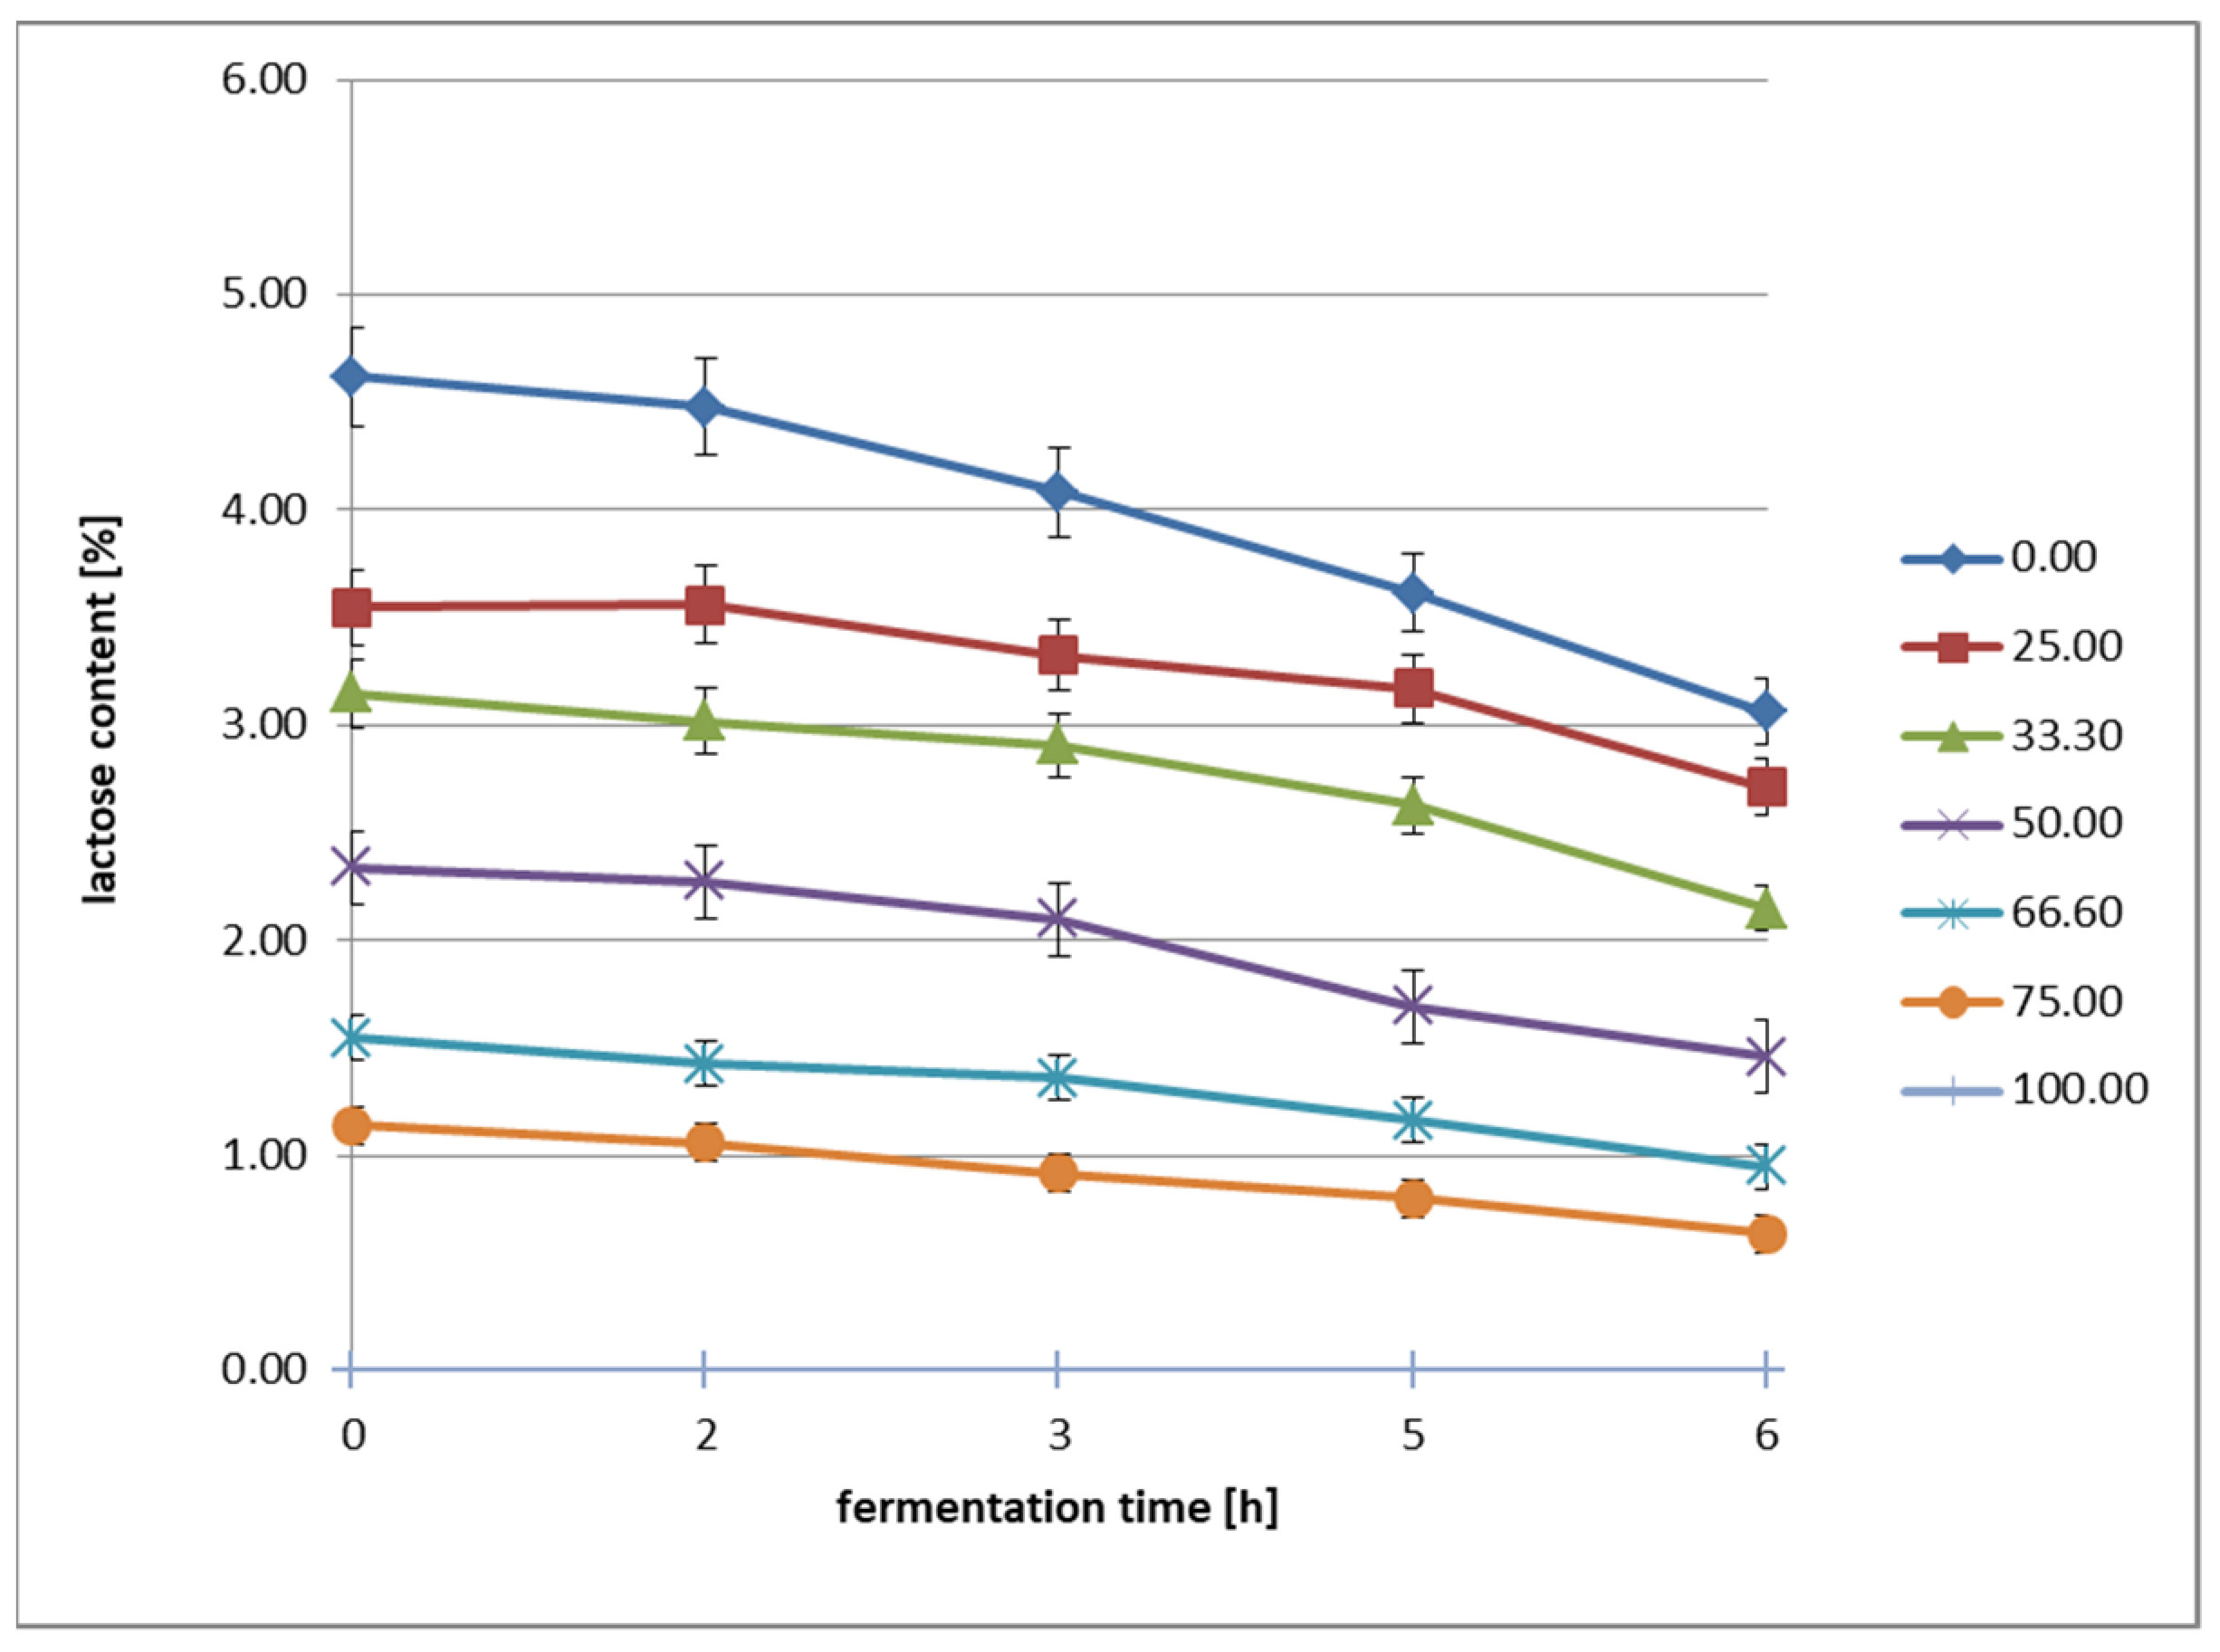
A starter culture was inoculated into the prepared dairy–oat beverage samples at a rate of 0.01%. Fermentation was carried out for 6 h at 37 °C. Following fermentation, the jars were transferred to a refrigerator and stored under refrigeration (6 °C) for 28 days. The entire experiment was repeated twice on independent batches of raw materials. Each resulting sample was analyzed in duplicate. Each fermentation was performed on newly prepared samples in separate experimental runs. During the fermentation process, pH values (an acidification curve was generated based on the results obtained at 1.5 h intervals throughout the process) and lactose content were determined using HPLC [
9]. In the resulting fermented beverages, color, pH, syneresis, texture (hardness, adhesiveness), and populations of thermophilic lactobacilli and streptococci were measured during 28 days of cold storage (6 °C).
2.4. Analysis of the Color Spectrum of Beverages Following Microbial Fermentation
The colors of the set yogurt samples were evaluated using a Color Meter (Contechity, Goteborg, Sweden) application, and the results were obtained using the CIELAB system. Prior to measurement, the device was calibrated using a white standard. During measurement, the device recorded the reflected light and converted it into L*, a*, and b* values. Measurements were taken at 3 points on each sample, and the results were then averaged to obtain a representative color value. The CIE LAB model defines color using three coordinates: L*, a*, and b*. The L* value describes the lightness of a color on a scale from 0 (black) to 100 (white), the a* value determines the hue direction between red (positive values) and green (negative values), while the b* value refers to the hue of yellow (positive values) and blue (negative values). This model allows for the precise determination of the color of a given object and measurement of color differences between samples.
2.5. Physicochemical Components of Beverages After the Fermentation
Initial measurements were taken immediately after fermentation was complete. Subsequent pH determinations were performed on days 7, 14, 21, and 28 of refrigerated storage. A CPO–505 pH meter (Elmetron, Zabrze, Poland) was used for these measurements. Results are presented to two decimal places.
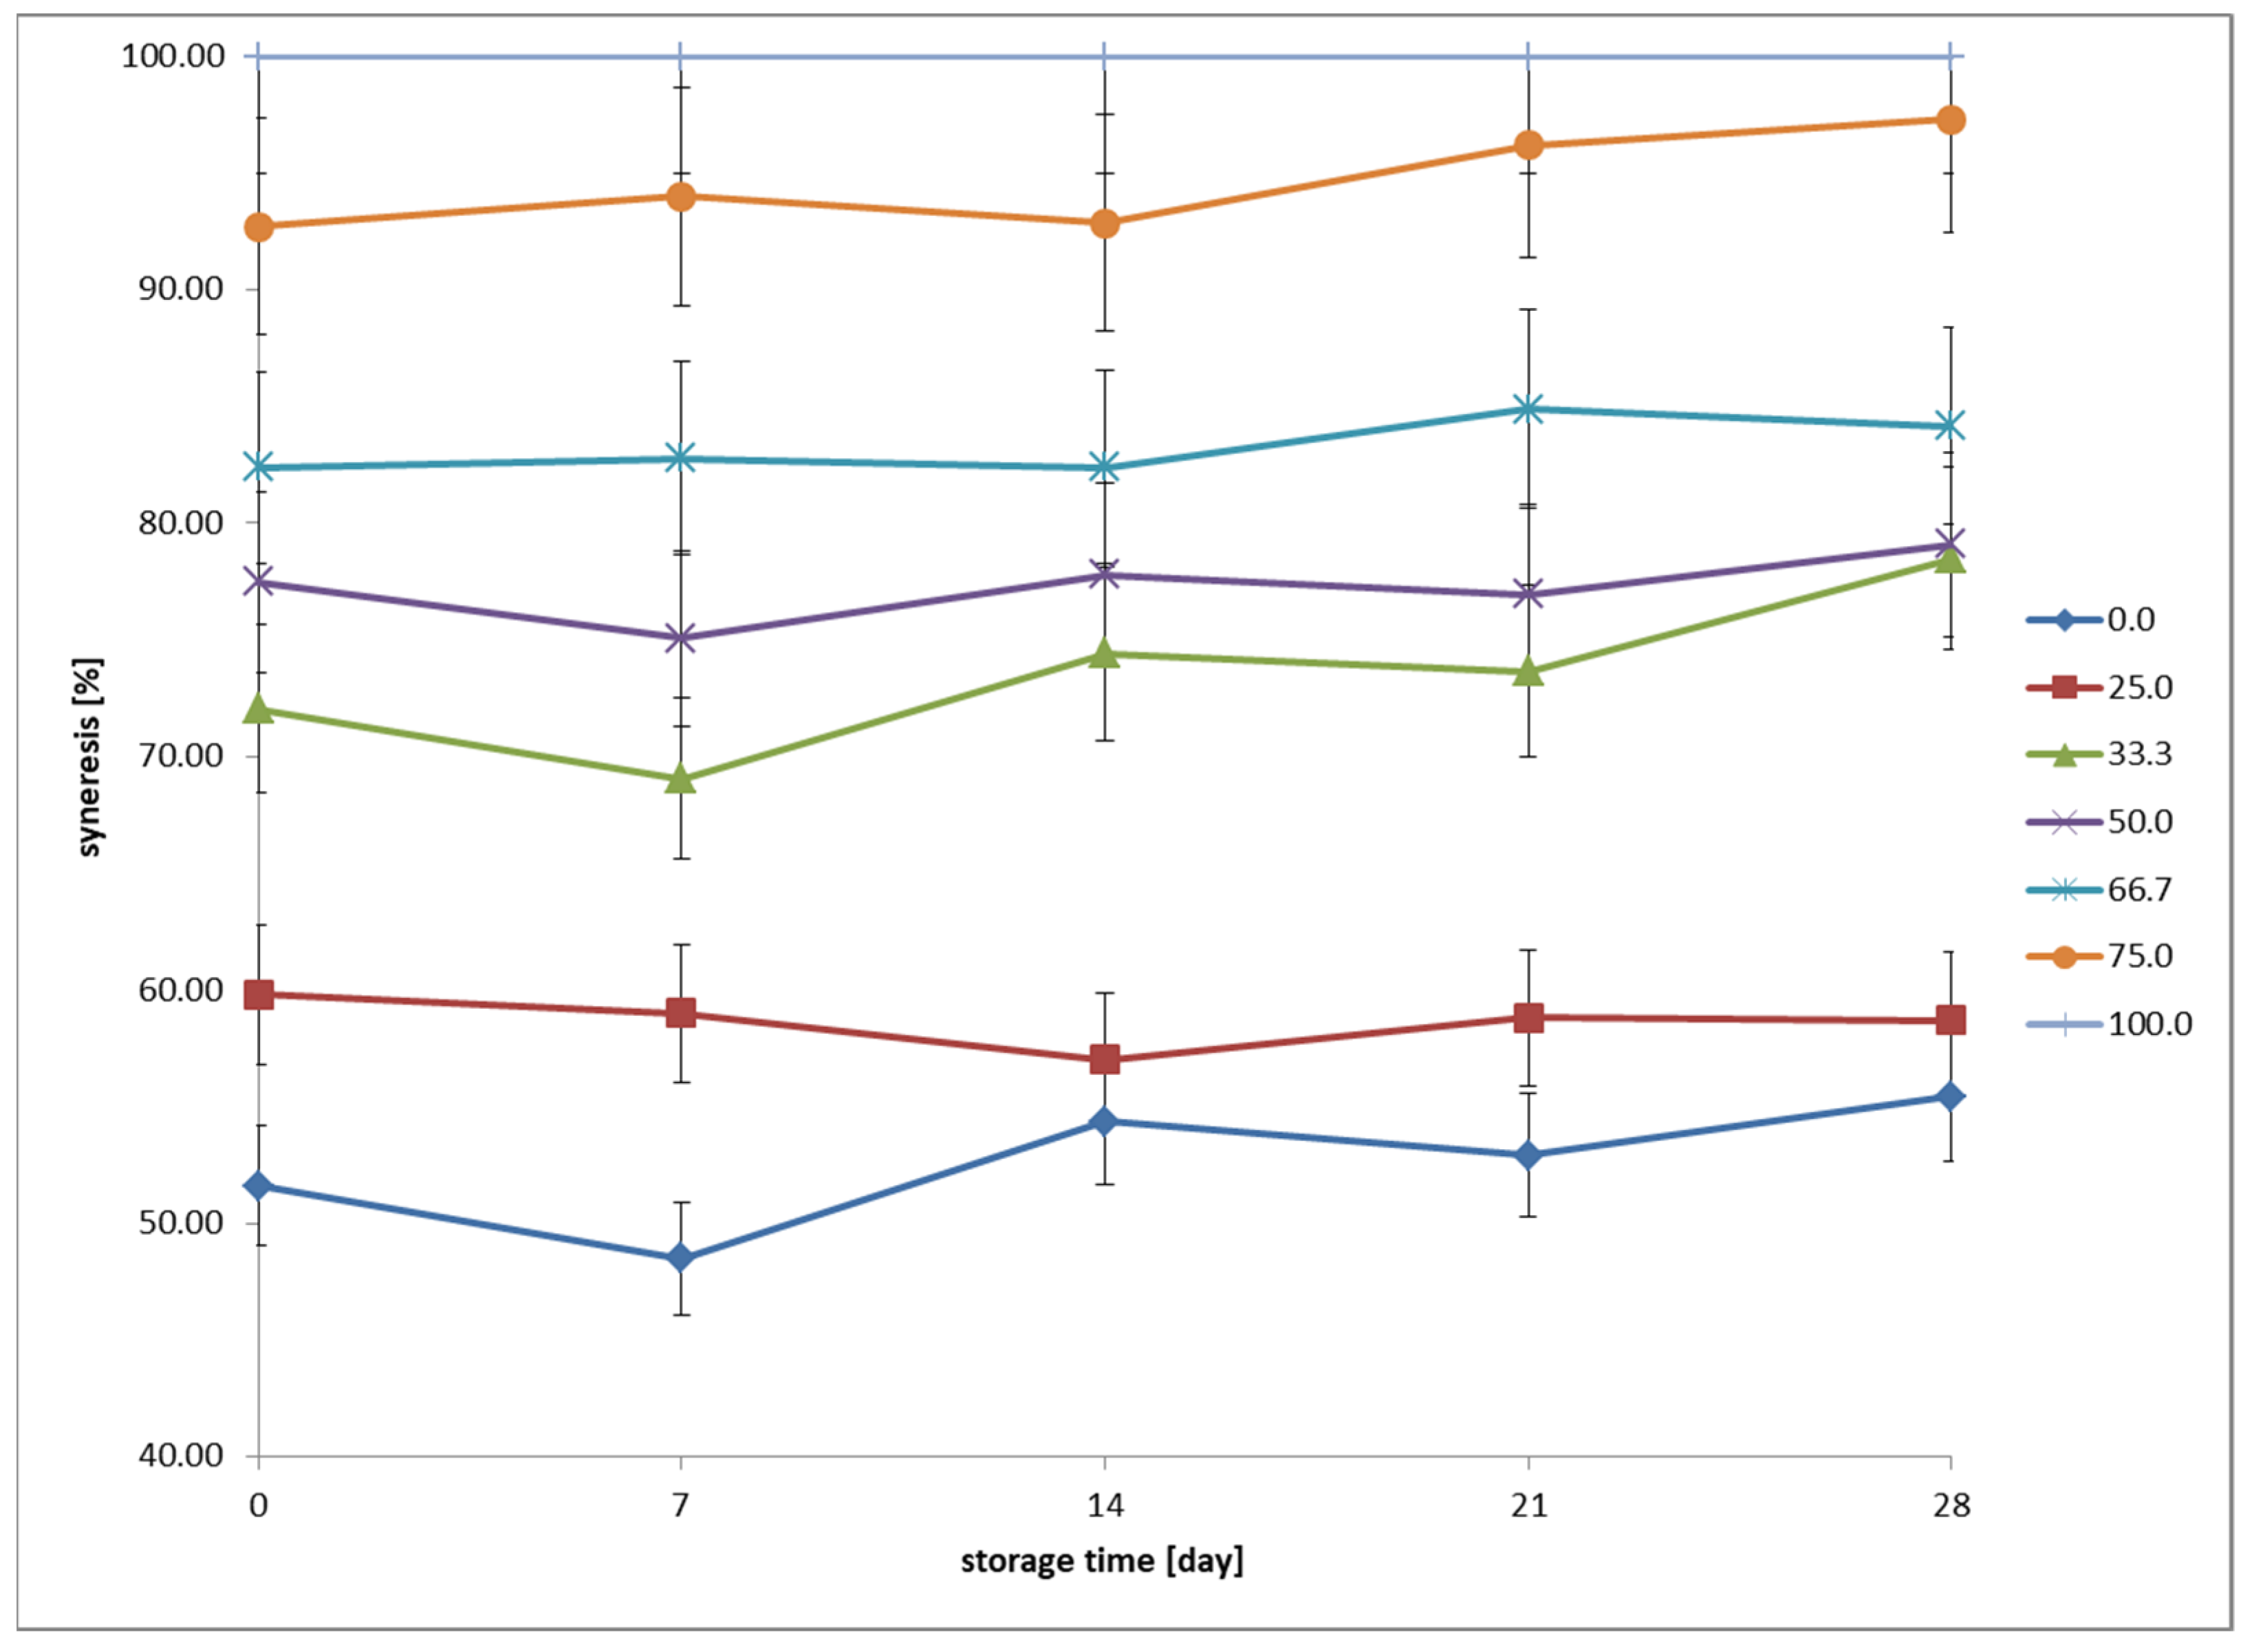
The amount of syneresis was determined after 7, 14, 21, and 28 days of refrigerated storage. Samples were prepared by weighing 40 g of fermented beverages into falcon tubes for centrifugation. A laboratory centrifuge, MPW–350R (MPW MED. INSTRUMENTS Spółdzielnia Pracy, Warsaw, Poland), was set to a speed of 12,200×
g, a temperature of 4 °C, and a run time of 20 min. After centrifugation, the supernatant was decanted and weighed. The measurement result was calculated as the ratio of the supernatant mass to the total sample mass before centrifugation, according to Formula (2):
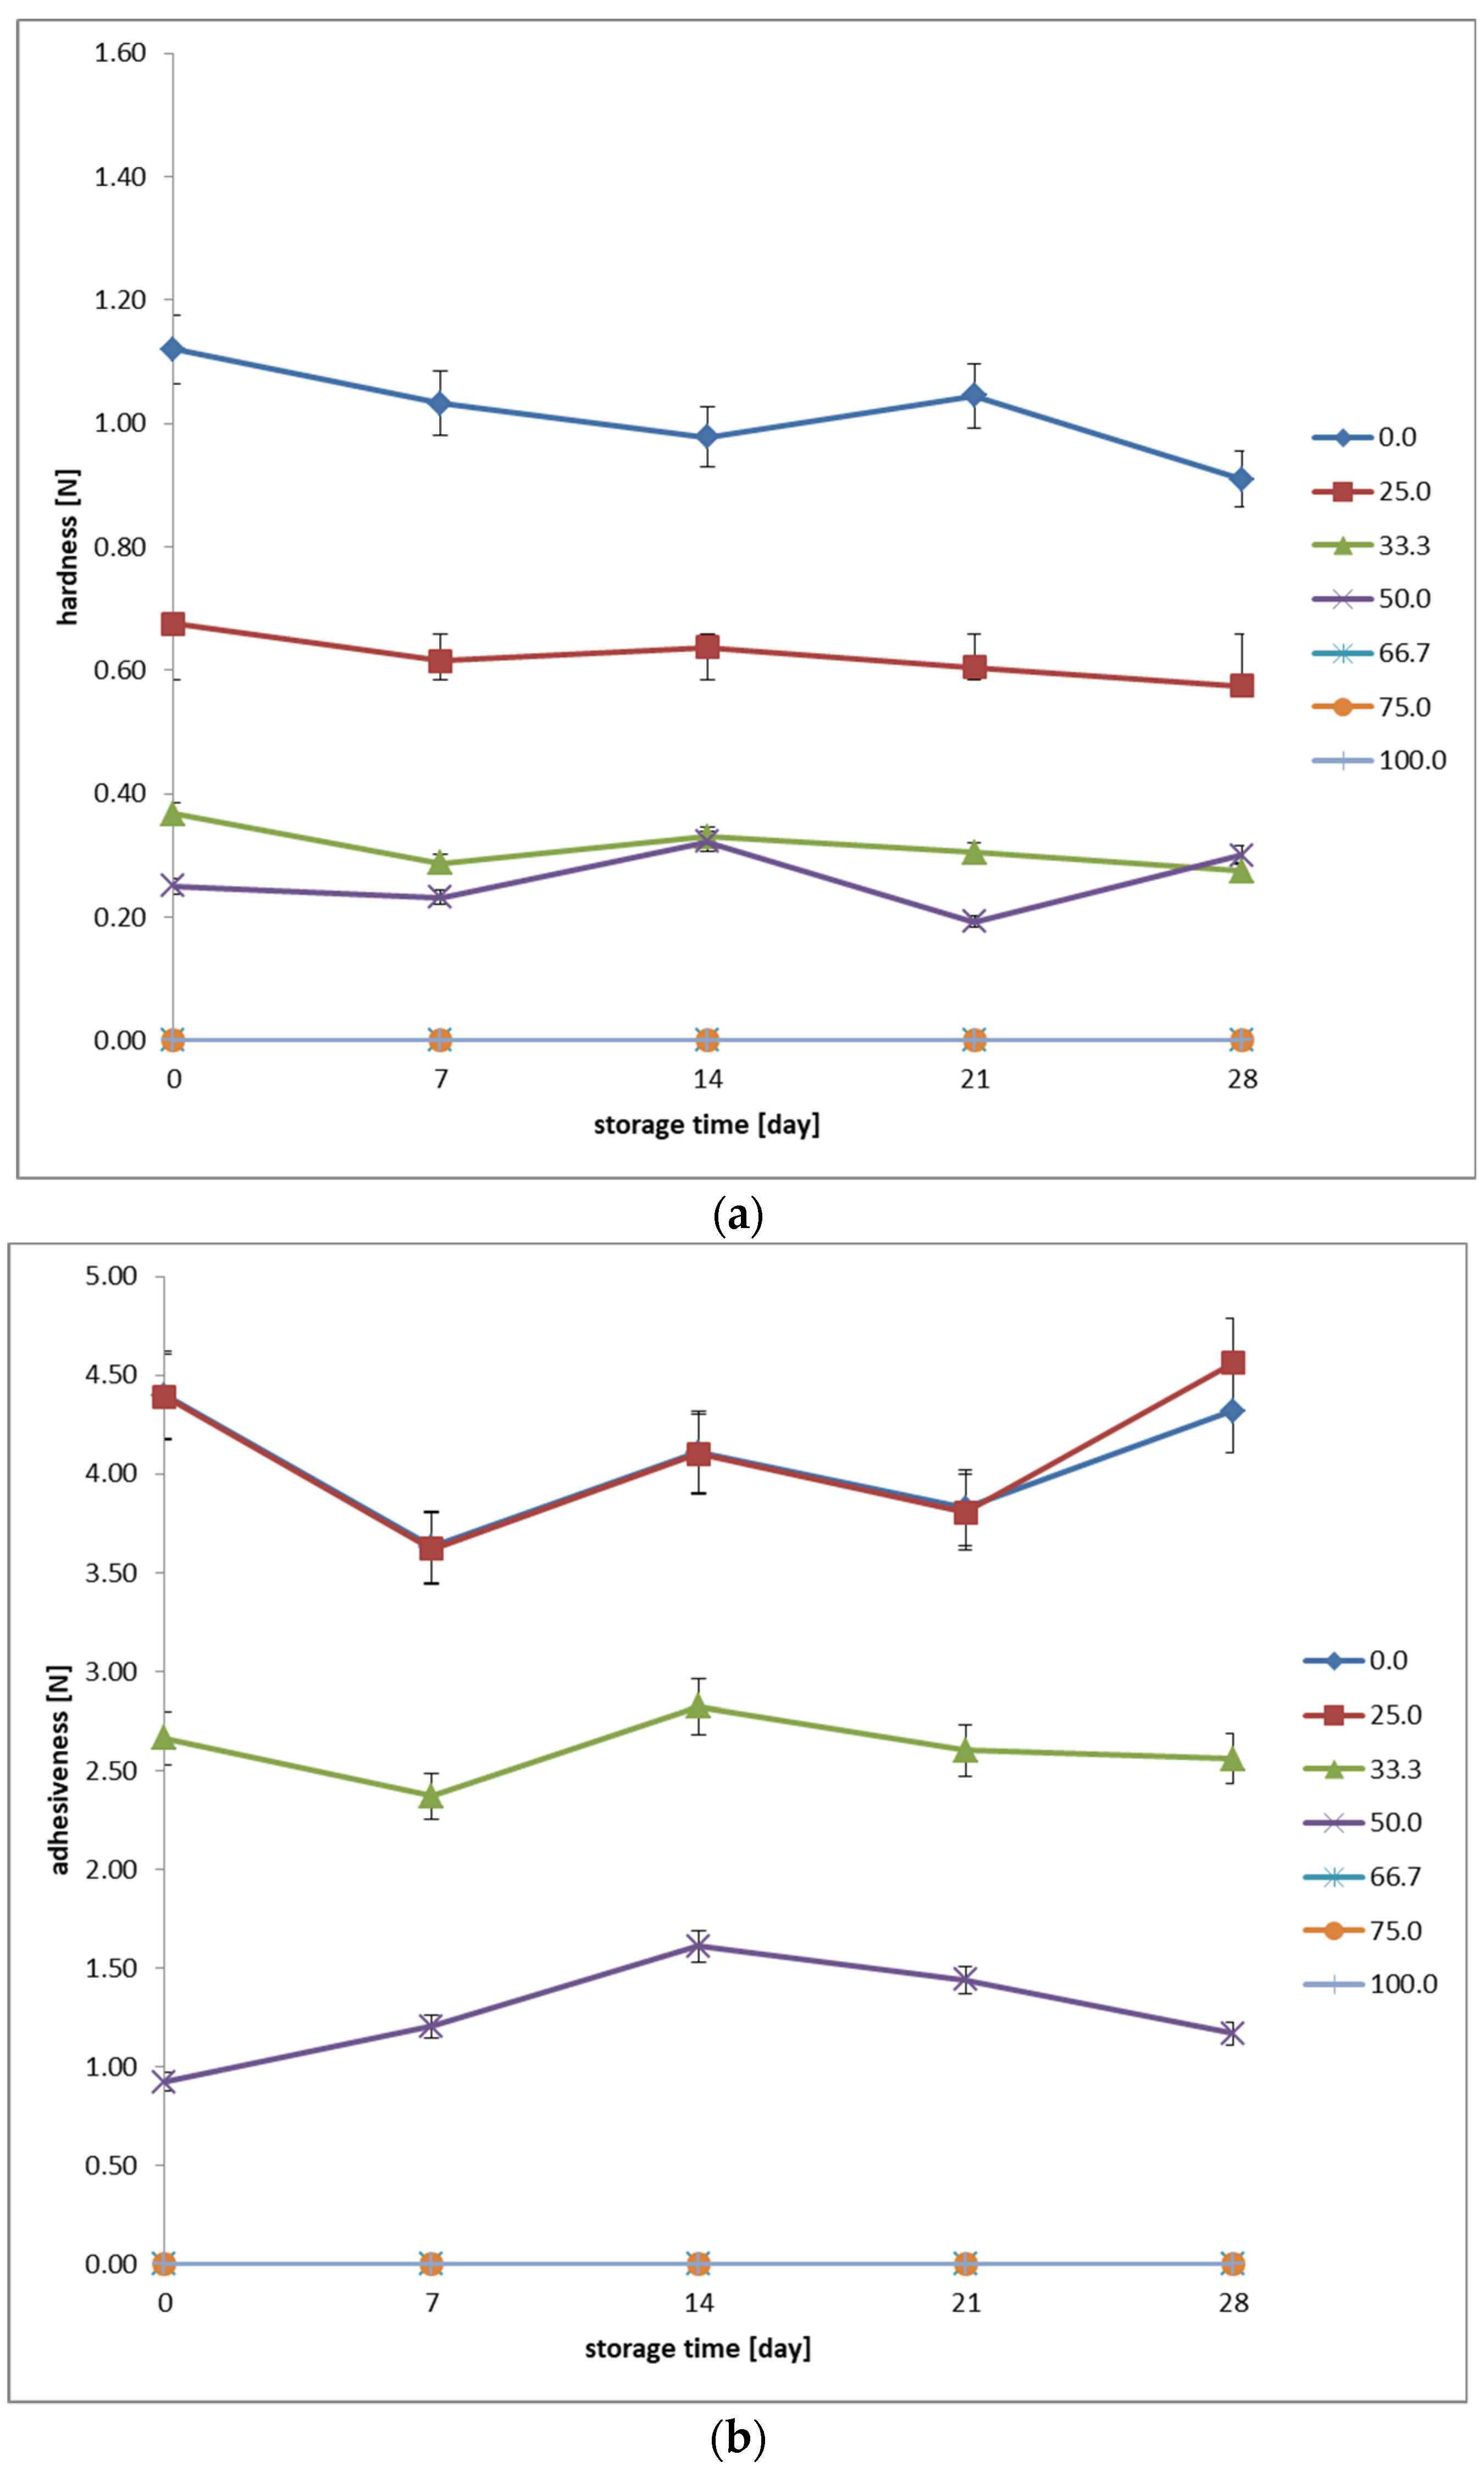
A Brookfield CT3 10K texture analyzer (Brookfield AMETEK Inc., Middleboro, MA, USA) equipped with a TA4/1000 cylindrical probe (diameter: 38.1 mm, height: 20 mm) was employed to investigate the rheological properties. Samples, previously conditioned at 6 °C, were subjected to a compressive force exerted by the probe. A force of 0.04 N was applied during the tests. The probe penetrated the sample at a speed of 2 mm/s and retracted at 4.5 mm/s. Ten measurements were conducted per second. From the beginning of the measurement, the probe traversed a distance of 25 mm into the sample at a speed of 1 mm/s. A single measurement cycle was performed for each type of fermented beverage. The applied compressive and tensile forces induced displacement of the sample’s volume, consequently disrupting its structure, allowing for the determination of its hardness. Hardness is defined as the force required to deform the sample. Adhesion, on the other hand, refers to the force necessary to separate the probe from the analyzed sample. The obtained results were graphically processed using TexturePro CT V1.4 Build 17 software (Brookfield AMETEK Inc., Middleboro, MA, USA), included in the measurement system. The reports present the final results with an accuracy of two decimal places.
2.6. Starter Culture Population After the Fermentation
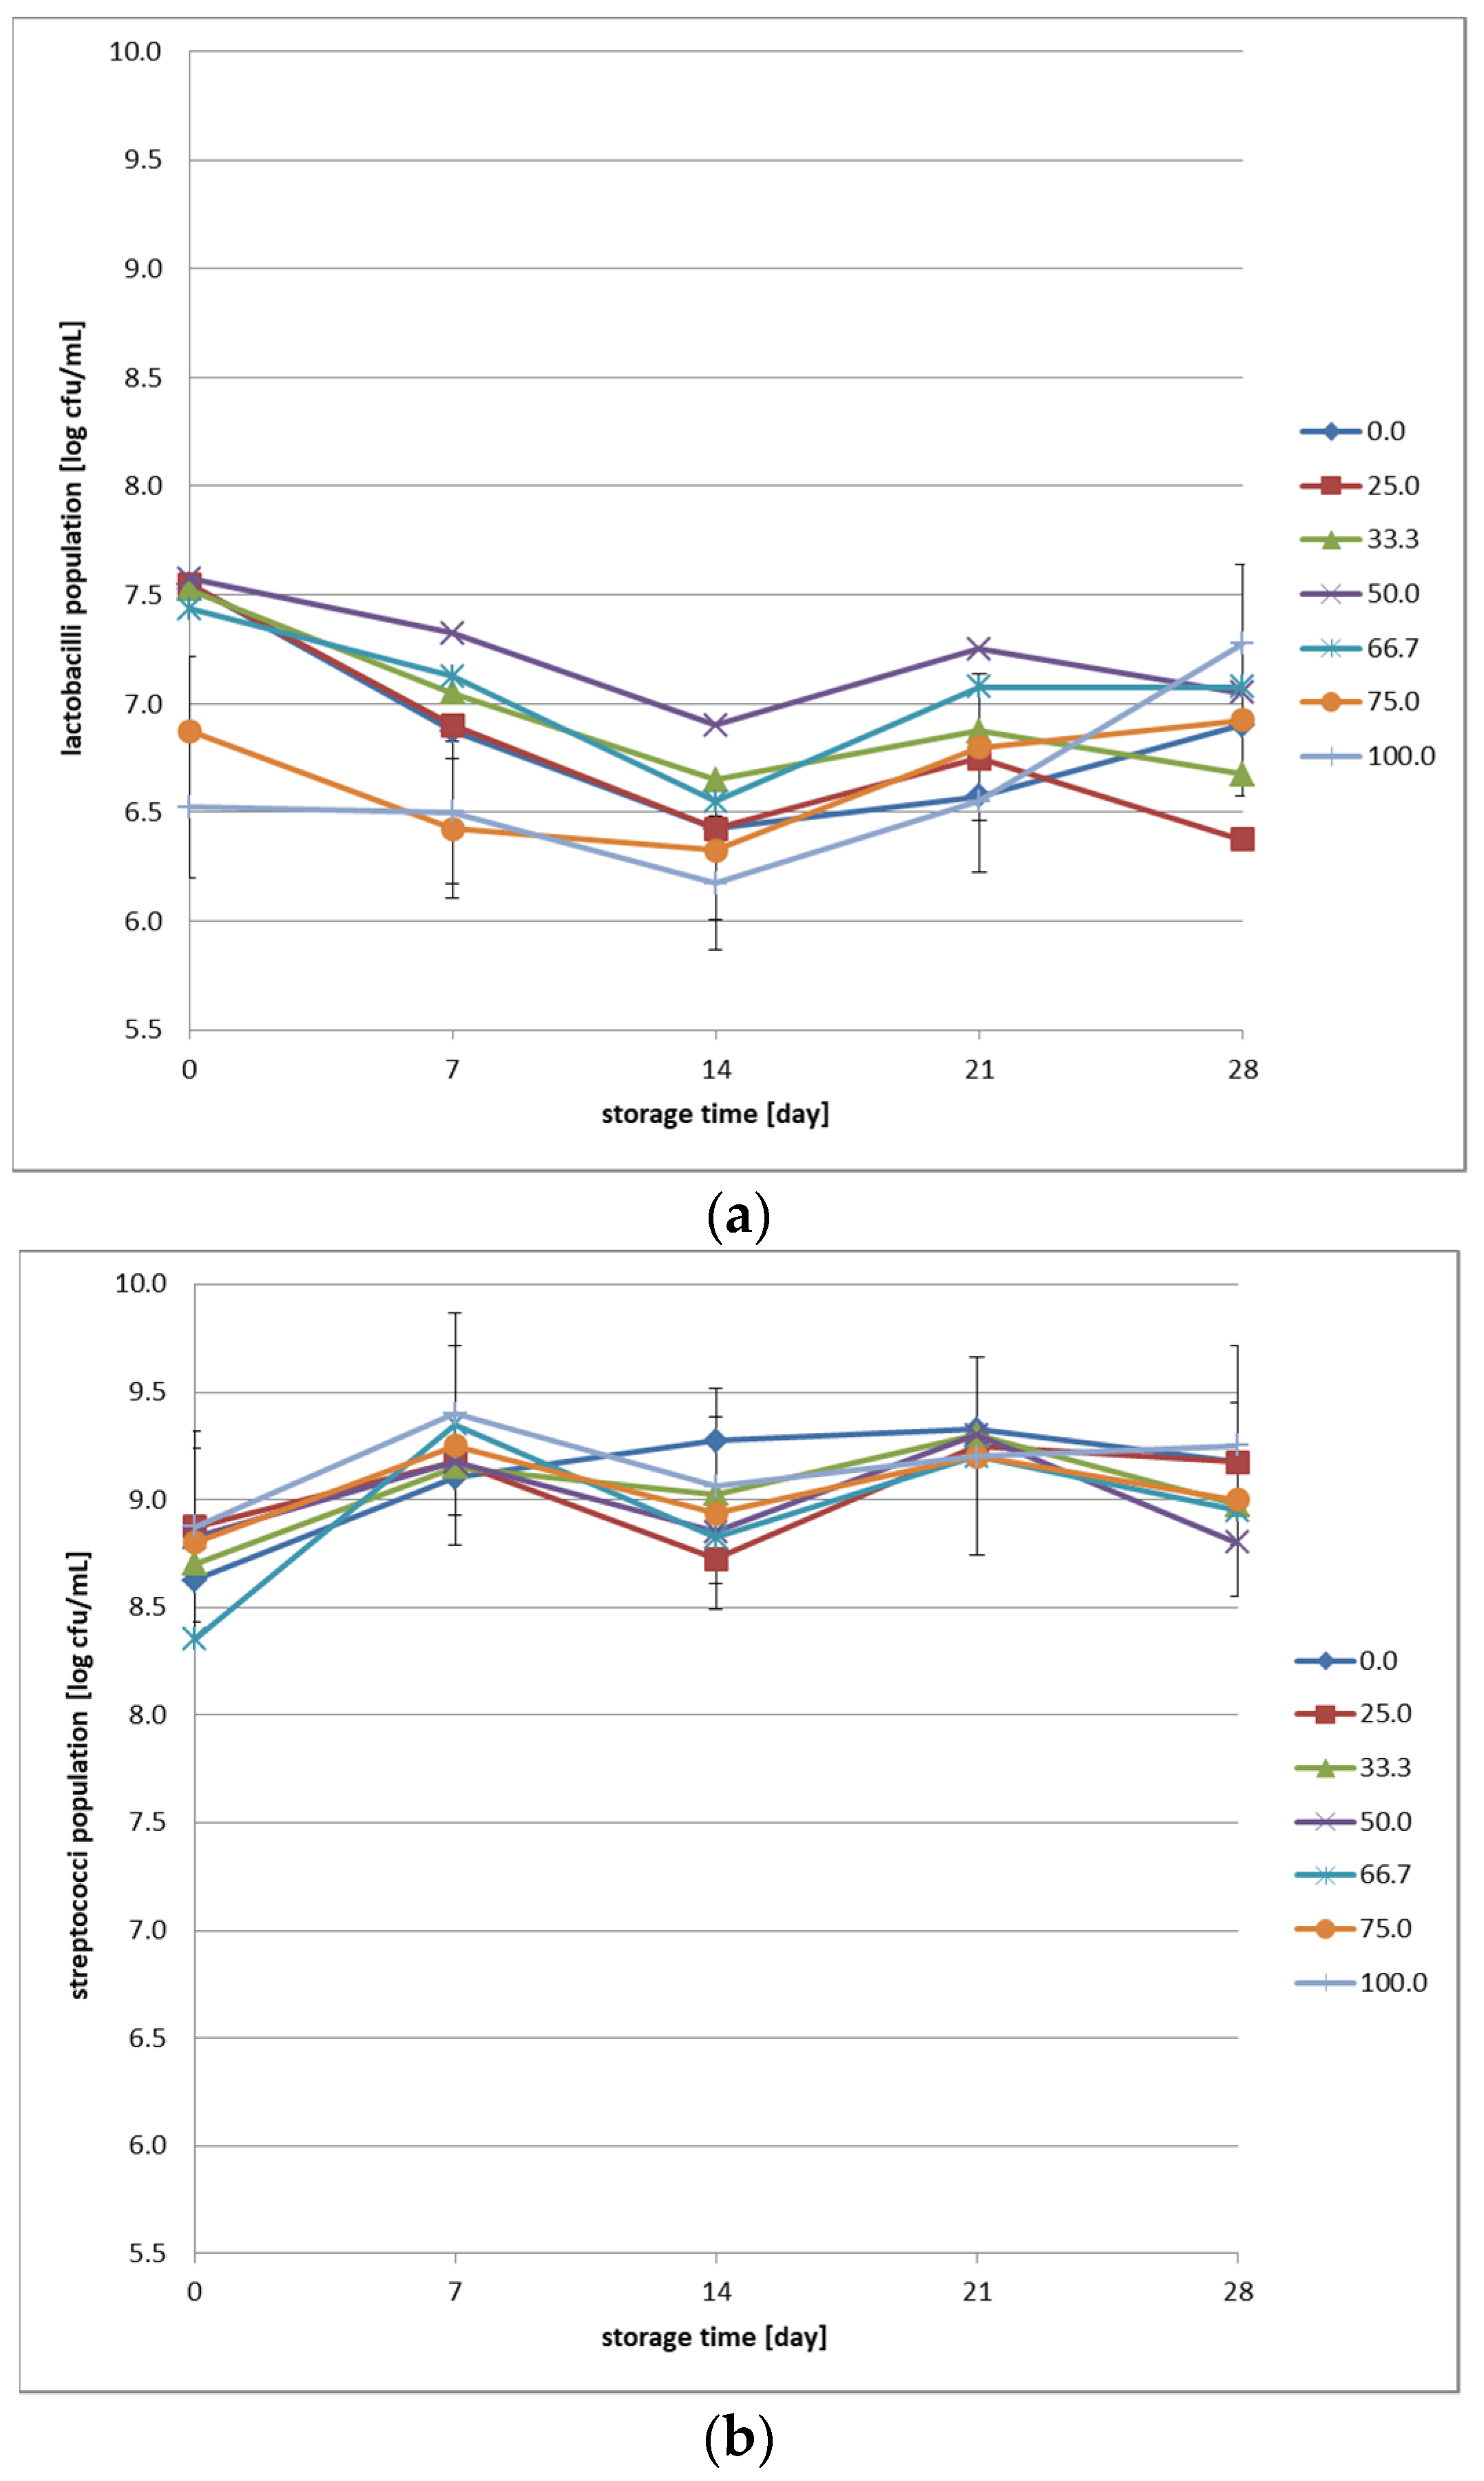
Enumeration was performed using the surface drop (plate) method on the following media: M17 agar (BioMaxima, Lublin, Poland) and MRS agar (Merck, Darmstadt, Germany). All media were prepared according to the manufacturer’s instructions. The prepared media were sterilized in an autoclave at 121 °C for 15 min. Sterile media were cooled in a water bath at 50 °C, mixed thoroughly, and poured into sterile plastic Petri dishes in approximately 15 mL portions. Petri dishes with solidified agar media were inverted and placed in an incubator at 37 °C for 48 h to dry. Petri dishes with prepared media were packed in groups of 10 in foil bags and stored at 6 °C until use. Before inoculation, ten–fold dilutions of the tested fermented beverages were prepared in sterile Ringer’s solution (Merck, Darmstadt, Germany). The solution was prepared according to the manufacturer’s instructions and then sterilized in an autoclave at 121 °C for 15 min. Petri dishes were prepared by dividing them into four equal parts and labeling them according to the predetermined dilutions. A single–use pipette was used to transfer 20 μL of the mixture onto each quadrant, and the mixture was allowed to absorb into the medium. Petri dishes with MRS agar for lactobacilli were placed in an Anaerojar jar (Merck, Darmstadt, Germany), where anaerobic conditions were provided using Anaerocult sachets (Merck, Darmstadt, Germany). Petri dishes with M17 agar for the enumeration of streptococci were incubated under aerobic conditions. All Petri dishes were incubated at 37 °C for 7 days. After this time, the number of colonies was counted, and the decimal algorithm was used to calculate the number of colony–forming units per gram of the original fermented beverage sample (CFU/g). The final result, obtained from the average of two replicates, was recorded to one decimal place.
2.7. Statistical Analysis
Statistical analysis of the obtained research results was performed using Statistica 13.3 (StatSoft Polska, Kraków, Poland) software with a significance level of α = 0.05. Tukey’s HSD test was used to compare the mean values obtained in individual measurements.
4. Discussion
The results of this study highlight the significant impact of varying oat beverage proportions on the physicochemical, textural, sensory, and microbiological properties of fermented dairy–oat beverages. The observed changes in fermentation kinetics, pH stability, syneresis, and microbial viability indicate that the interaction between dairy proteins and oat components plays a crucial role in determining the final product characteristics. In summary, the content of basic nutrients in dairy–oat beverages changes with an increasing proportion of oat beverage. The introduction of oat beverage to cow’s milk leads to a decrease in protein, fat, and lactose content, while simultaneously increasing the overall carbohydrate content [
1,
2]. These findings are consistent with previous studies, which have also demonstrated that plant–based ingredients influence the physicochemical properties and fermentation dynamics of dairy alternatives [
1,
3].
Changes in the chemical composition of dairy–oat beverages have significant consequences for fermentation and the quality of the final product [
12]. Various studies highlight how specific components, such as soluble fibers and probiotic cultures, enhance both the nutritional profile and sensory attributes of these beverages [
3,
4,
5]. In particular, the presence of oat–derived beta–glucans and fibers may contribute to changes in viscosity and gel structure, as previously reported in studies on plant–based fermented products [
4,
5]. An increased proportion of oat beverage may result in a longer fermentation time, a milder flavor, a more fluid consistency, and a greater tendency towards syneresis [
13]. Milk protein, especially casein, plays a crucial role in forming the gel structure during fermentation [
14,
15]. A smaller amount of protein in beverages with a higher oat beverage addition can lead to a weaker protein network, which will affect the consistency and texture of the final product [
16,
17]. Similar observations were made in oat–based probiotic drinks, where protein interactions influenced the microstructure and texture of the final product [
7].
Lactose is the primary substrate for lactic acid bacteria (
Lactobacillus,
Streptococcus). A smaller amount of lactose in beverages with a higher oat beverage content may slow down fermentation, extending the acidification time and changing the acid profile [
13]. This can result in a higher pH and milder flavor compared to classic dairy yogurt [
5]. On the other hand, oat beverage provides additional sugars, mainly starch and β–glucans [
18]. Starch can be hydrolyzed into simple sugars, which can be utilized by some bacterial strains, affecting the fermentation profile and extending the adaptation period of the microflora [
19,
20]. Studies on oat and buckwheat fermentation support this finding, indicating that starch hydrolysis contributes to alternative metabolic pathways for microbial growth [
7].
In our study, the fermentation was most vigorous in beverages containing 0–50% oats, suggesting that this oat content is optimal for maintaining the activity of fermenting bacteria. For individuals with lactose intolerance, fermented beverages with >75% oats could be a good alternative, as they contain very low levels of lactose after just a few hours of fermentation [
21,
22]. Further research is needed to fully understand the implications of oat–based products on diverse dietary needs. Additionally, investigating the enzymatic hydrolysis of oat starch may help optimize the fermentation process and enhance the bioavailability of key nutrients, as suggested in studies on enzyme–modified oat formulations [
23]. Oat beverage slows down lactose breakdown, suggesting that in products with a high oat content, the addition of lactase enzymes could be considered to further reduce lactose levels [
13,
23]. Further research is warranted into the effects of adding enzymes (e.g., lactase, amylase) on improving fermentation and reducing lactose in dairy–oat beverages. In our study, the addition of oat beverage slows down the acidification process in fermented dairy–oat beverages, which may affect their stability and texture. The most intense acidification (lowest pH) occurs in samples with 0–25% oats, suggesting that smaller amounts of oats do not significantly disrupt fermentation. The optimal oat addition range (25–50%) may allow for maintaining a proper fermentation process while enriching the beverage with oat components. With a high oat content (75–100%), fermentation is significantly slower, which may require technological modifications (e.g., longer fermentation time or the addition of starch–degrading enzymes) [
6]. Further research is needed on the impact of enzymatic hydrolysis of oat starch on the fermentation process and sensory acceptance of the final product. However, oat components such as β–glucans may contribute to viscosity and water retention, which suggests that alternative structuring agents (e.g., hydrocolloids) could be tested to improve the texture of high–oat formulations. In our study, a higher content of oat beverage causes a gradual darkening, yellowing, and increase in reddish hue. Optimal proportions of milk and oat beverage (25–50%) seem to be the best in terms of maintaining the typical color of a fermented dairy beverage, while avoiding excessive yellowing. Further research should investigate how these color changes affect consumer acceptance and what strategies can help maintain an attractive product color [
24].
The limited pH decrease in during low–temperature storage high–oat beverages may affect their microbiological stability and sensory perception, as acidity is a significant factor in shaping the flavor of fermented beverages. A mixture containing 25–50% oat beverage appears to be the optimal solution, as it retains the characteristic features of fermented dairy products while modifying the taste and nutritional values. The study confirmed that an increasing proportion of oat beverage slows the acidification process, as evidenced by the higher final pH values in samples with 75–100% oat content. This is likely due to the lower lactose availability, which serves as the primary fermentable sugar for lactic acid bacteria, as well as the buffering capacity of oat–derived components such as fiber and minerals. Mixtures of cow’s milk and oat beverage in proportions of 25–50% seem to be the most advantageous, as they allow for a moderate level of syneresis during cold storage, which may contribute to an acceptable texture. A recent study on the stability of oat–based dairy alternatives also found that a moderate oat ratio provides better consistency and microbial viability [
24].
Sensory characteristics such as texture, adhesiveness, and water–holding capacity are influenced by fermentation. High syneresis in samples dominated by oat beverage indicates limited ability to form a stable gel. This is likely due to a lower content of proteins with gelling properties (e.g., casein), which play a key role in water retention in cow’s milk [
25,
26]. The stability of parameters during low–temperature storage suggests that the fermentation and storage process does not drastically affect syneresis properties, but the presence of oat beverage weakens water retention in the gel structure. For optimal quality of the fermented dairy–oat beverage, recommended oat beverage proportions are 25–50%, which allows for reduced syneresis while maintaining the beneficial sensory characteristics of the product. In our study, an increasing the proportion of oat beverage significantly reduces the product’s hardness during low–temperature storage, a result of alterations in the protein composition and structural makeup of the mixture [
12]. An optimal balance between hardness and oat beverage content is likely to be found within the 25–50% range, suggesting the possibility of achieving a product with a desirable consistency while retaining the beneficial attributes of both milk and oats. Hardness demonstrates stability throughout the storage period, indicating that fermented dairy–oat beverages maintain their texture under refrigeration. The high adhesiveness in samples dominated by cow’s milk results from the presence of casein, which is responsible for forming a highly cohesive gel network. Oat proteins include globulins, albumins, prolamins, and glutelin [
27,
28]. Samples with a moderate content of oat beverage (33.3–50%) exhibited average adhesiveness values, which may suggest optimal proportions for achieving the desired consistency. Increasing the proportion of oat beverage leads to a significant decrease in adhesiveness, suggesting a lower gelling ability and a looser structure of the system [
6,
12]. The stability of parameters during refrigerated storage indicates the stability of the texture of fermented dairy–oat beverages. The optimal level of oat beverage may range from 25 to 50% to achieve a product with desirable textural properties while maintaining some typical characteristics of traditional yogurt. Comparing our results with prior studies on oat–fermented beverages, we observe that optimal stability is achieved when oat beverages are used in combination with dairy proteins [
29]. Future studies could explore enzymatic treatments, such as lactase or amylase addition, to enhance lactose and starch hydrolysis, thereby optimizing fermentation efficiency.
The stability of the lactobacilli population during low–temperature storage is greater in samples with a predominance of cow’s milk, suggesting that milk components promote better survival of fermentative bacteria. The addition of oat beverage affects the count of lactobacilli, with the optimal proportions for microbiological stability falling within the range of 50–66.7%. Streptococci demonstrate greater robustness to variations in media composition relative to lactobacilli, implying their crucial significance in safeguarding the microbiological stability of fermented dairy–oat products. The selection of an appropriate starter culture is crucial for achieving the desired pH in oat–based dairy beverages [
28,
29]. To enhance microbial viability, future research could explore the use of protective cultures, prebiotic fortification, or alternative bacterial strains with improved adaptability to oat substrates. Our results align with findings from prior research that demonstrated the protective role of dairy proteins in maintaining bacterial viability in probiotic beverages [
28]. Study [
28] demonstrated that the use of specific bacterial strains, such as
Bifidobacterium animalis subsp.
lactis Bb–12 and
Propionibacterium freudenreichii subsp.
shermanii PS–4, results in faster and more efficient acidification of the oat beverage, leading to a lower pH. This, in turn, has a significant impact on the quality and shelf life of the product. Additionally, the presence of propionibacteria improves the beverage’s water–holding capacity, while bifidobacteria reduce its viscosity [
28].
These findings provide a foundation for the development of innovative fermented dairy–oat beverages with enhanced functionality and consumer appeal. Further research should focus on the impact of enzymatic treatments, starter culture selection, and ingredient modifications to improve the stability and sensory characteristics of these beverages. Additionally, future studies could investigate consumer preferences regarding texture, acidity, and sweetness levels to optimize product formulation for different target groups.
5. Conclusions
This study comprehensively evaluated the impact of varying proportions of oat beverage in cow’s milk on the physicochemical, textural, sensory, and microbiological properties of fermented dairy–oat beverages. For the first time, this research conducted a detailed analysis of the interactions between oat components and milk proteins during fermentation, providing novel insights into the mechanisms influencing the quality of the final product. The results unequivocally indicate that the addition of oat beverage significantly modifies the chemical composition, fermentation process, and quality characteristics of the beverage. With increasing oat beverage content, a decrease in protein, fat, and lactose content was observed, accompanied by an increase in total carbohydrate content. Importantly, this study demonstrated that a higher proportion of oats slows down fermentation, as evidenced by higher pH and slower lactose breakdown. The finding may be crucial for optimizing the production process. The fermentation process was slower in higher oat concentrations, resulting in milder acidification, which could be beneficial for consumers preferring less acidic products.
The textural analysis revealed that with increasing oat beverage content, the beverages became darker, more yellowish, and acquired a reddish hue. Increased syneresis was also observed, indicating a weakening of the gel structure and a lower water–holding capacity. These changes highlight the need for formulation optimization to balance sensory appeal and stability. An innovative aspect of the research is the detailed determination of the influence of the milk–to–oat ratio on the stability of fermentative bacteria (lactobacilli and streptococci), providing new data on their adaptive abilities in altered environmental conditions. A key achievement of the study is the identification of the optimal range of proportions of cow’s milk and oat beverage (25–50% oat content), ensuring the best balance between microbiological stability, desired texture, and sensory properties. The obtained results can be applied in the development of new, improved formulations of fermented dairy–oat beverages, tailored to the needs of consumers seeking innovative and functional food products.
These findings are relevant for the food industry, as they provide a foundation for the development of innovative fermented dairy–oat beverages with enhanced functionality and consumer appeal. The obtained results can be used by food producers to develop new, innovative oat–based products with optimized nutritional, sensory, and stability properties, meeting the needs of various consumer groups. Further research may be needed to determine whether the findings can be generalized to other oat beverage types or starter cultures. Further research also should focus on the impact of the addition of enzymes (e.g., lactase, amylase) on improving fermentation and reducing lactose in dairy–oat beverages, as well as on assessing consumer acceptance and possibilities of modifying the product color. Moreover, studies assessing alternative oat beverage formulations or different starter cultures could provide deeper insights into improving product quality and market potential.


