Article

Mechanical Performance and Stress Redistribution Mechanisms in Photovoltaic Support Connections: A Finite-Element-Driven Design Optimization Study

by
Deli Zhang
1,
Ruwei Wang
2,
Juan Liu
3,* and
Xuanming Huang
1
1
China Academy of Building Research, Beijing 100013, China
2
CABR Testing Center Co., Ltd., Beijing 100021, China
3
China Institute of Building Standard Design & Research, Beijing 100048, China
*
Author to whom correspondence should be addressed.
Appl. Sci. 2025, 15(6), 3174; https://doi.org/10.3390/app15063174
Submission received: 17 February 2025 / Revised: 9 March 2025 / Accepted: 11 March 2025 / Published: 14 March 2025
(This article belongs to the Section Civil Engineering)

Abstract

:
The photovoltaic industry plays a critical role in promoting global sustainability. Enhancing the reliability of photovoltaic structures is essential for achieving sustainable development. This study involved the analysis of a photovoltaic power generation project in Hubei Province to compare differences in the structural loads of photovoltaic supports as outlined in Chinese, American, and European codes. Additionally, the ABAQUS numerical simulation was used to investigate the mechanical characteristics of photovoltaic support joint connections and analyze the causes of structural deformation. Innovative joint connections were proposed to optimize the structural performance of photovoltaic supports. The results showed that photovoltaic supports designed using Chinese codes exhibit lower reliability compared to those designed using American and European codes. Specifically, at least three bolts should be installed at the purlin hanger to connect the purlin and the beam. Z-shaped and Π-shaped purlin hangers are recommended for connecting beams and purlins, as they reduce joint deformation while preventing excessive stress in L-shaped purlin hangers. C-shaped steel is suggested for braces, offering both ease of construction and structural reliability. The proposed connection design minimizes additional steel consumption while enhancing overall performance.

1. Introduction

Sustainable development has gained significant global attention due to population growth and economic development [1]. Due to overconsumption, fossil fuels are no longer capable of meeting the demands of human social development [2]. A renewable-energy-dominated clean energy system has become an unavoidable necessity in the present era [3]. As the most abundant renewable energy source, solar energy is absorbed by the Earth in the form of heat and light, and its development and utilization can yield substantial social and economic benefits [4,5]. The photovoltaic power generation system leverages the photovoltaic effect to directly convert solar radiation into electrical energy, which is subsequently integrated into the power grid for societal use [6]. The photovoltaic power generation system offers advantages such as low cost, zero pollution, renewability, and broad application scenarios [7]. As of March 2022, 1 TW of photovoltaic modules were installed worldwide [8], and it is projected that this capacity will reach 14 TW by 2050 [9], establishing a huge industrial scale involving industries such as agriculture, fisheries, forestry, and construction (Figure 1). Therefore, the safe operation of photovoltaic power generation systems is particularly important.
The photovoltaic power generation system is primarily composed of photovoltaic panels and supports. Photovoltaic panels are mounted on these supports, with the arrangement and angles of the components adjusted to maximize power generation efficiency. Emerging technologies, such as tracking photovoltaic supports and flexible photovoltaic supports, offer distinct advantages [10,11]. However, fixed photovoltaic supports remain among the most widely used forms of reinforcement due to its better stability [12]. In recent years, advancements in photovoltaic module technology have significantly enhanced photovoltaic conversion efficiency, reduced investment costs [13], and accelerated the rapid growth of the photovoltaic industry. Nevertheless, safety concerns related to photovoltaic supports have become increasingly prominent [14,15]. The main reasons for the safety issues encountered in practical engineering are design defects in photovoltaic supports, which will be explained in detail below.
Currently, thin-walled steel structures are widely used for photovoltaic supports worldwide [16], and their design primarily follows general design specifications [17,18], such as Minimum Design Loads for Buildings and Other Structures (ASCE/SEI 7-10 [19]), North American Specification for the Design of Cold-Formed Steel Structural Members (AISC-S100-16 [20]), Eurocode 1: Actions on Structures, Part 1-4: General Actions, Wind Actions (BS EN 1991-1-4 [21]), Eurocode 3: Design of Steel Structures, Part 1-1 (BS EN 1993-1-1 [22]), Load Code for the Design of Building Structures (GB 50009-2012 [23]), and Standard for Design of Steel Structures (GB 50017-2017 [24]). Due to their relatively lightweight nature, photovoltaic supports are primarily governed by wind load [25]. While wind load values, in general, have design specifications that are well suited for civil buildings, the distinct structural systems and mechanical properties of photovoltaic supports necessitate further research to establish appropriate wind load values for their design [26].
Additionally, connection measures are critical factors influencing the safety of photovoltaic supports [27]. Overly conservative connection measures may result in excessive design and high installation costs, whereas less conservative measures can compromise the structural integrity of photovoltaic systems and pose risks to the surrounding structures. According to current statistics, the construction costs of photovoltaic supports and foundations account for a relatively small proportion of the total costs—11.99% in China and 14.50% in the United States [28]. Nevertheless, many investors have implemented unreasonable optimizations to support structures and cut costs [29,30]. An imperfect regulatory framework and the excessive pursuit of economic gains introduce significant risks to the design and construction of photovoltaic supports, reducing the lifespan of photovoltaic systems and potentially leading to the premature generation of photovoltaic waste [31] (Figure 2).
Based on a typical photovoltaic support failure case, this study involved detailed research on the design load and joint connection measures of photovoltaic supports. First, the general design software SAP2000 (V22.0.0) was utilized to compare the loads in photovoltaic support structure design among Chinese, American, and European codes. Next, ABAQUS numerical simulations were conducted to identify the reasons for the failure of photovoltaic support joints. Then, based on the mechanical behavior and connection characteristics of the support, different joint connection forms were innovatively introduced. The influence of different joint connection types on the mechanical performance of the photovoltaic support system was analyzed accordingly, and the effectiveness of the new joint connections in enhancing the safety of the photovoltaic support structure was verified. Finally, combining the analysis of design loads and joint connection forms, relevant recommendations were provided to ensure the safety and sustainability of photovoltaic structures.

2. Methodology

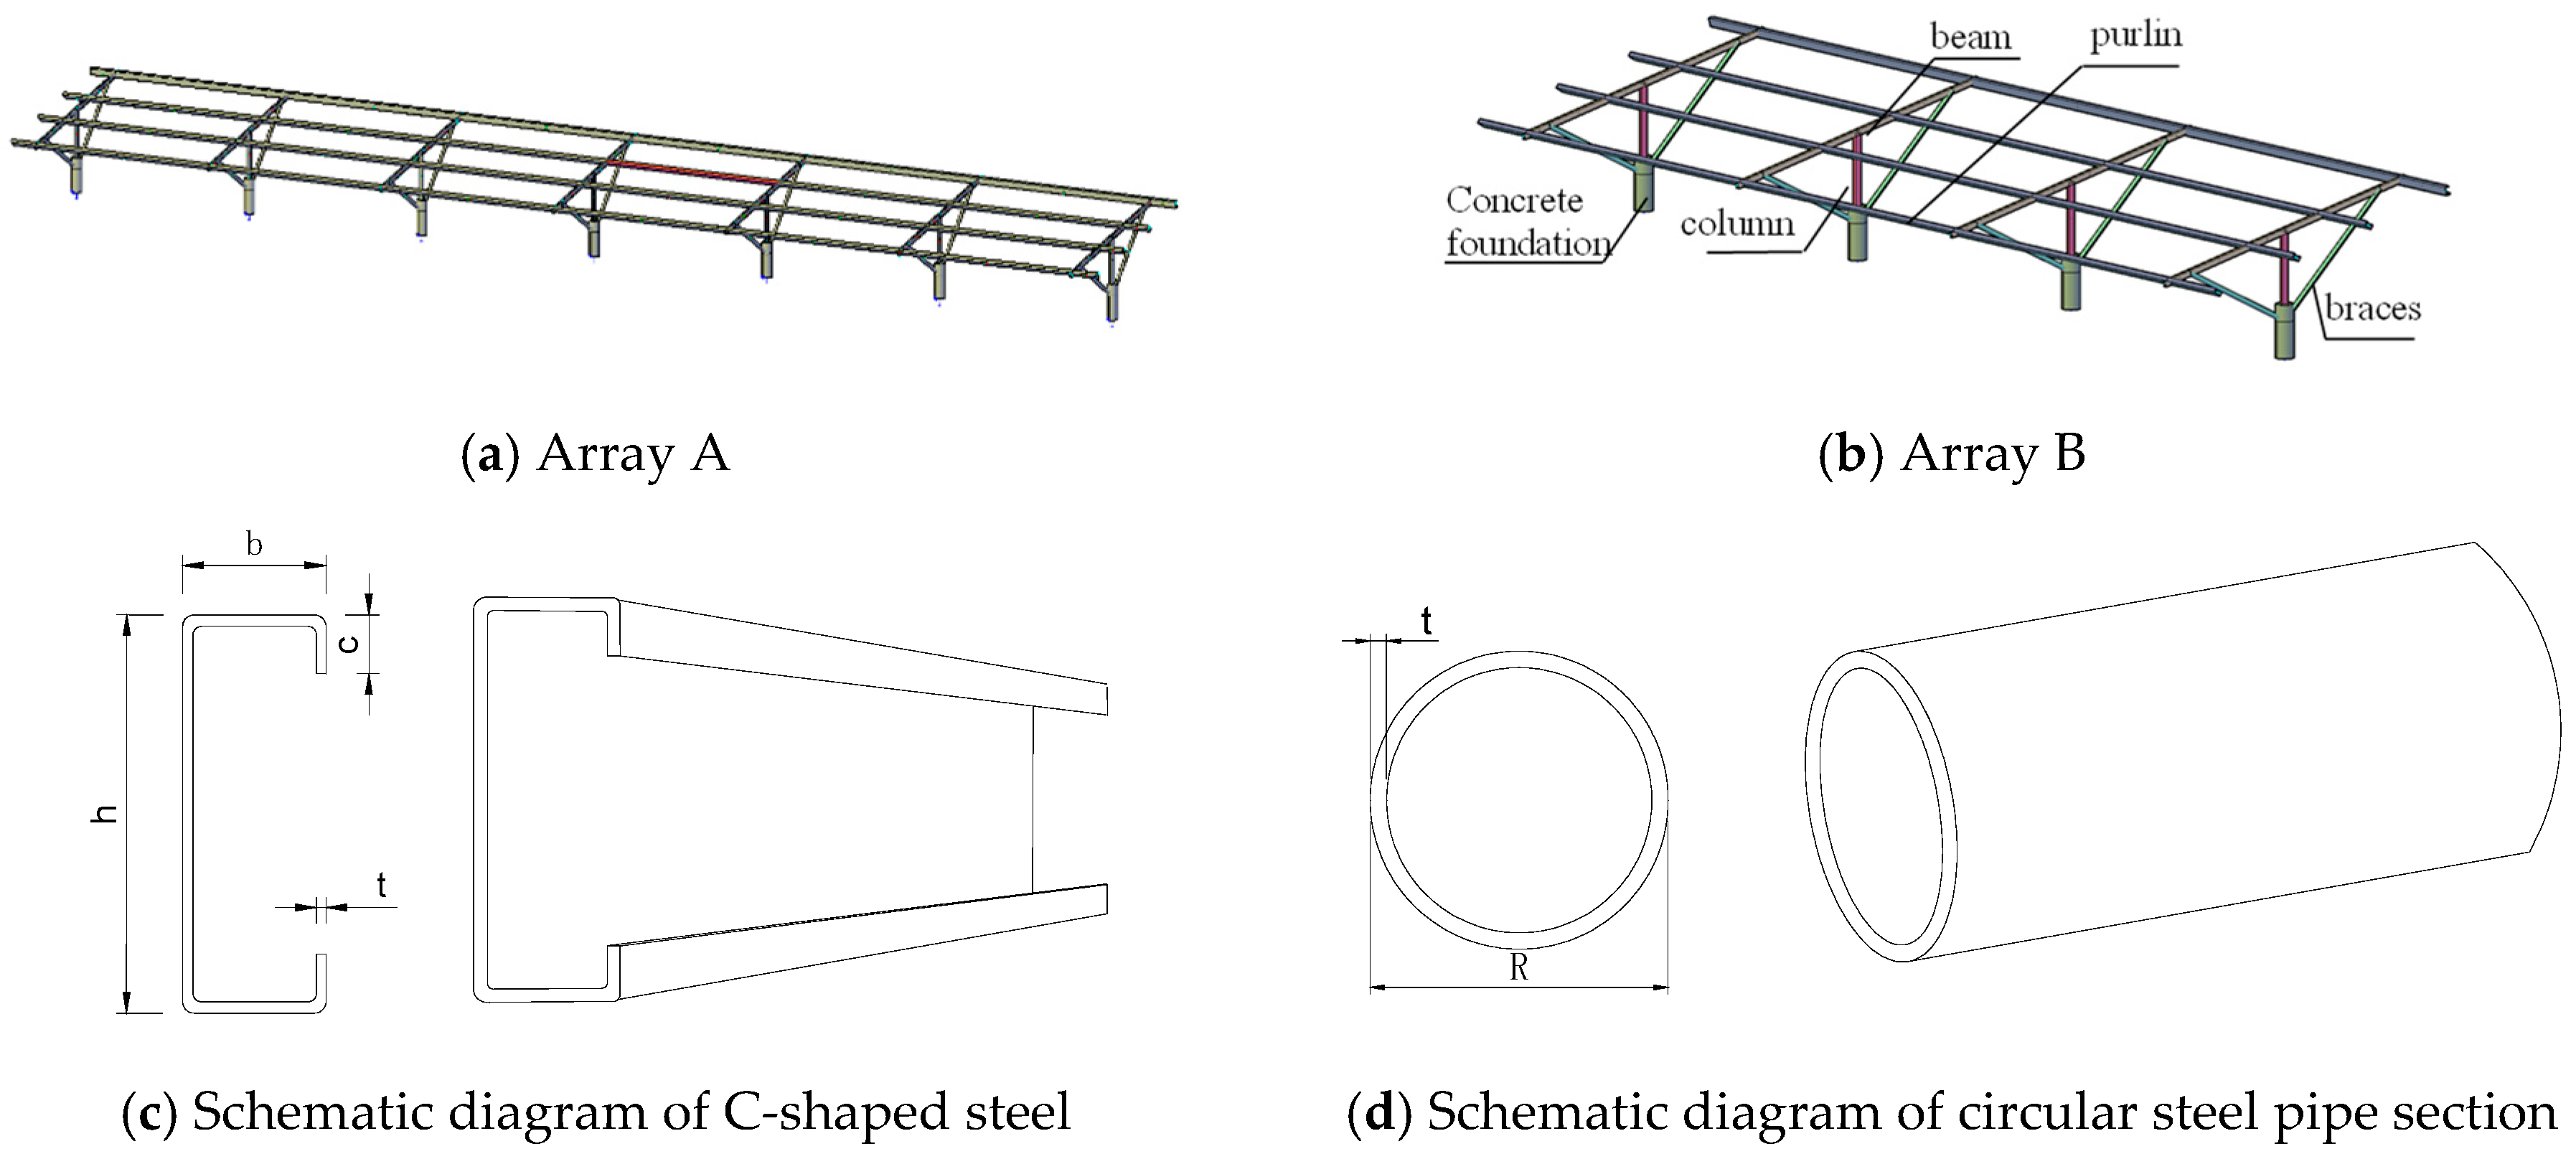
A photovoltaic power generation project located in Hubei Province, China, spans approximately 1000 acres. This project employs the operation mode of the fishery–photovoltaic complementation and has an annual power generation capacity of 40 MW. Two types of array arrangements were adopted, with the photovoltaic panel surface installed at an angle of 15°. Array A consists of 2 vertical rows and 26 vertical columns, with 52 photovoltaic panels per group of supports, supported by 7 single columns. Array B consists of 2 vertical rows and 13 vertical columns, with 26 photovoltaic panels per group of supports, supported by 4 single columns. Precast high-strength concrete pipe piles with a concrete strength grade of C80 are utilized as the foundation of the photovoltaic supports. Schematic diagrams of the support structures are shown in Figure 3a,b.
The photovoltaic supports used in Arrays A and B share identical components, with Q355B-grade steel utilized for the columns and Q420B-grade steel used for the purlins, beams, and braces. C-shaped steel was employed for the columns, beams, and purlins, with cross-sectional specifications of C80 × 40 × 12 × 2.5, C70 × 40 × 15 × 2.0, and C105 × 50 × 15 × 1.6, respectively. The letter “C” indicates the use of C-shaped steel as the cross-sectional profile of the components, with the parameters illustrated in Figure 3c. For the braces, round steel pipes with a diameter of 50 mm and a thickness of 1.6 mm were used, as shown in the schematic diagram in Figure 3d.
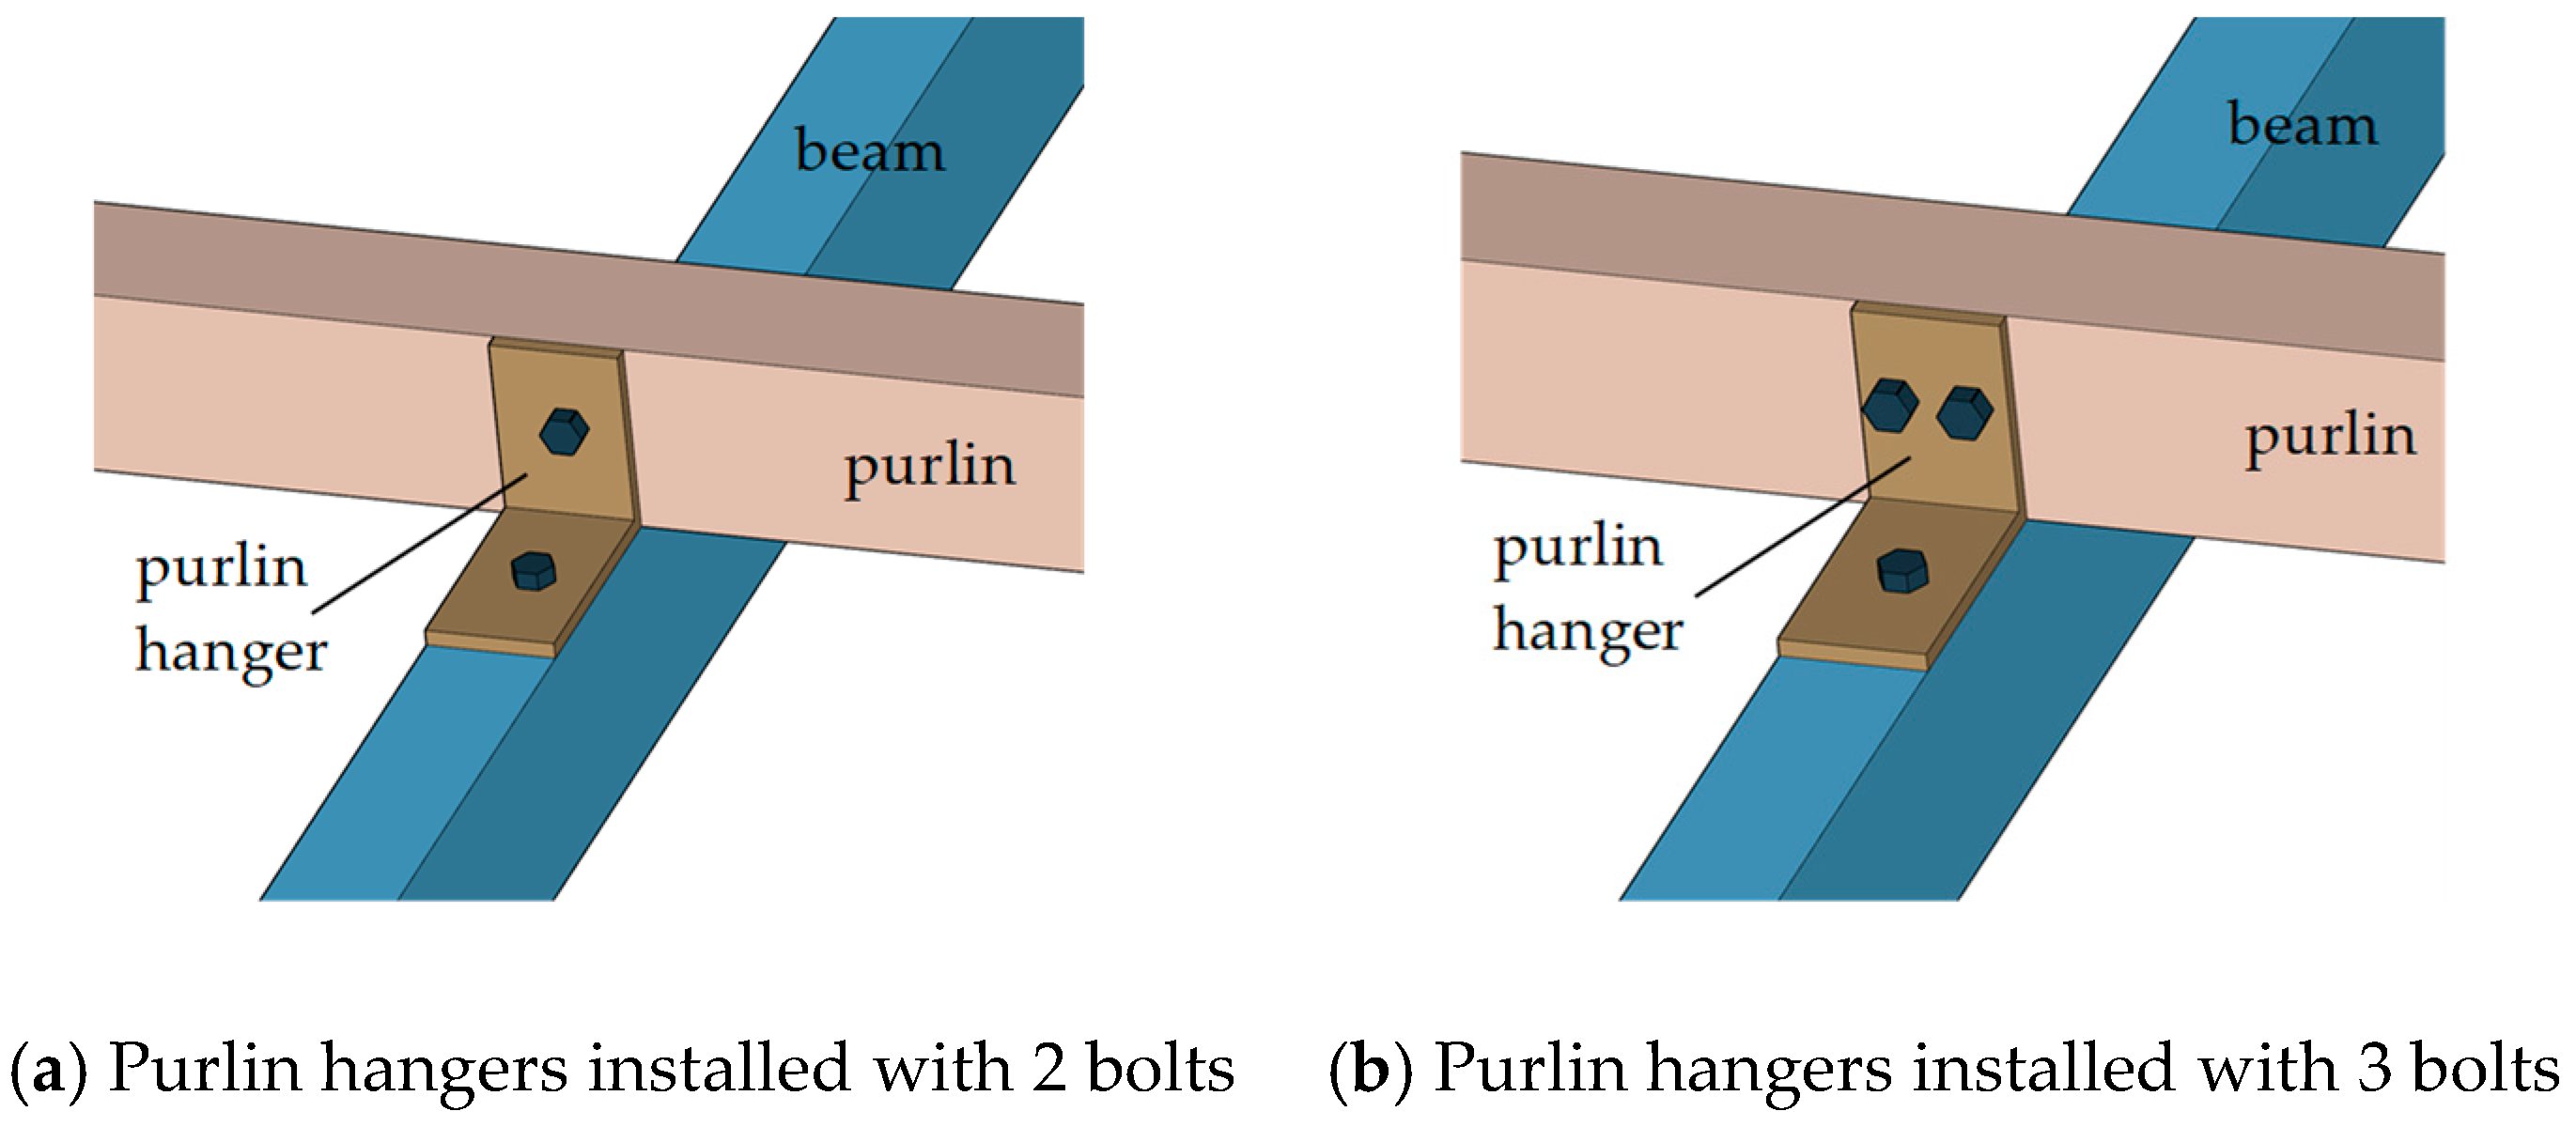
The columns were welded to the embedded steel components of the concrete foundation, while bolt connections were used to join the columns, purlins, beams, and braces. Photovoltaic panels were secured to the purlins using bolts. L-shaped steel was employed for the purlin hanger to connect the purlin and the beam. To facilitate construction, the ends of the round steel pipe braces were flattened and connected to the beams and concrete foundation. Specifically, the beams and purlins were joined using purlin hangers, as illustrated in Figure 4.
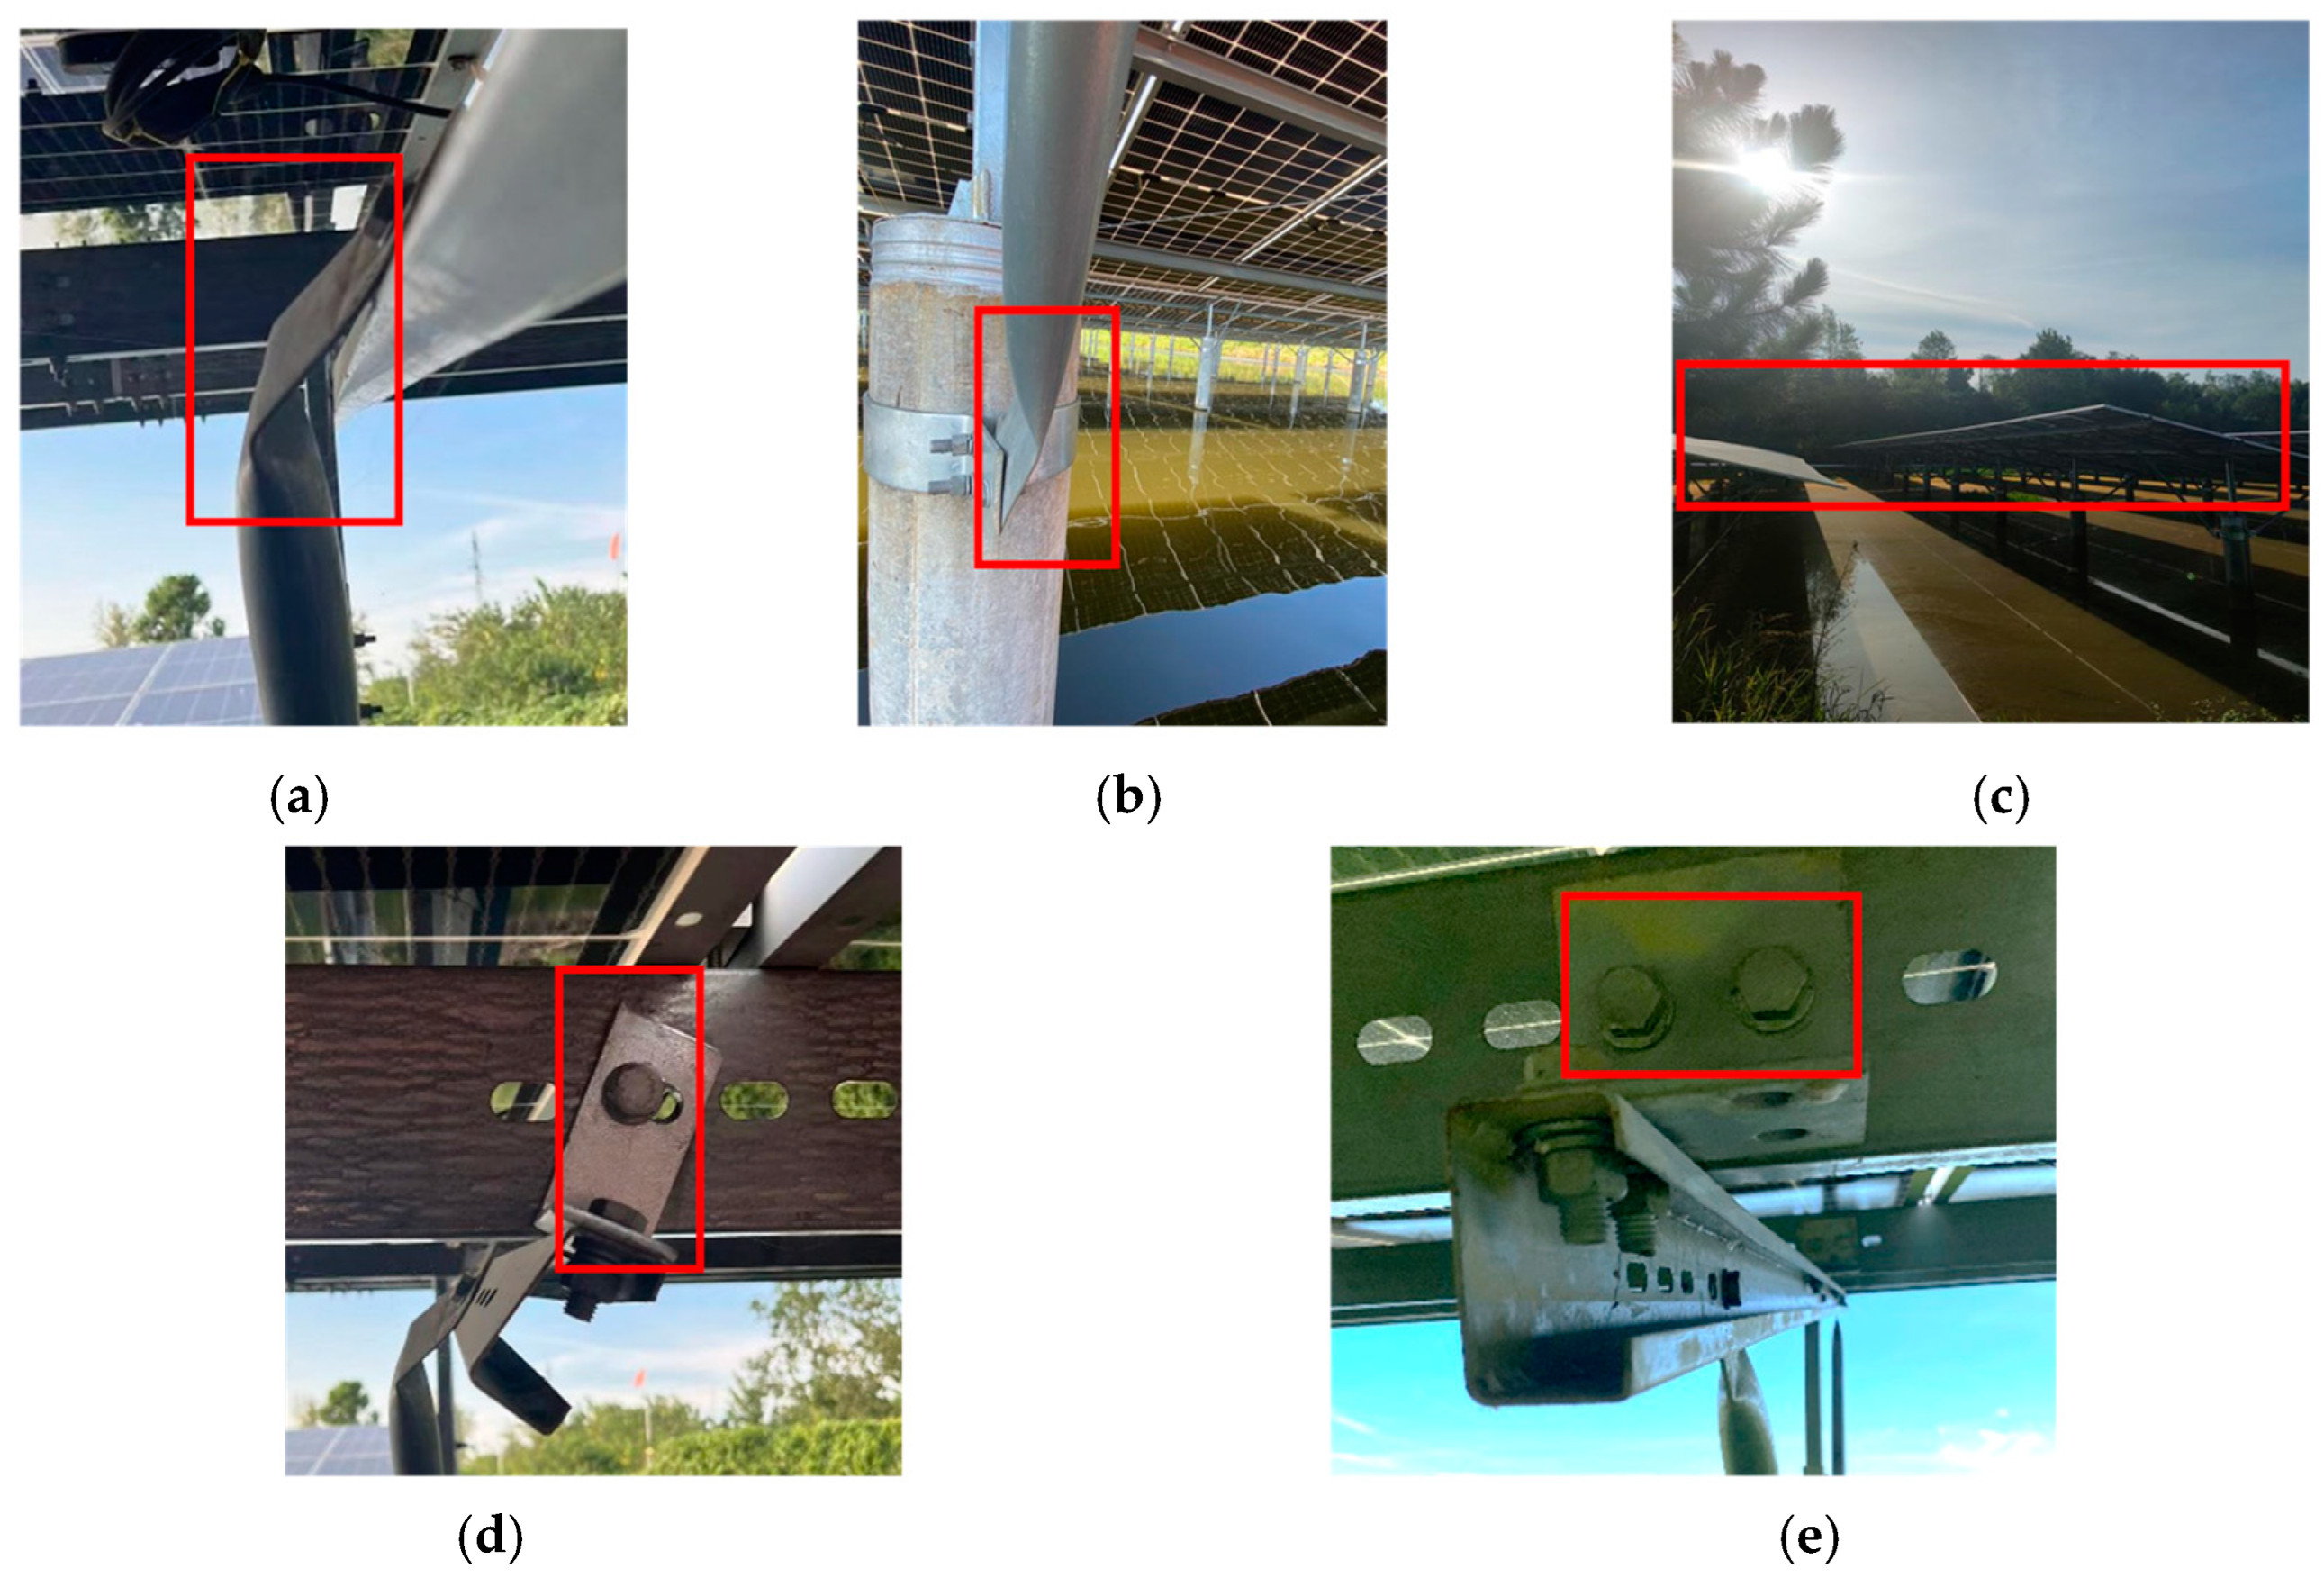
After the project was put into operation, significant deformation was observed at the joints of the photovoltaic supports. This deformation is primarily manifested as the rotation of the purlin hangers and bending at the ends of the braces. In some photovoltaic supports, the purlin hangers rotated around the bolt by nearly 90°, as shown in Figure 5, resembling a failed on-site experiment. The unexpected deformation highlighted an urgent need to identify its causes to ensure the structural safety of the supports and minimize investment losses.
The observed failure phenomena exhibited certain patterns. The deformation mainly occurred at the joints connected by a single bolt between the purlin hanger and the purlin, whereas the supports connected by two bolts exhibited significantly less deformation. To investigate the cause of the deformation, various factors were thoroughly analyzed.
(1)
Experimental analysis was conducted on the steel materials used in the project, and the results indicated that the section dimensions and mechanical properties of the support components largely conformed to the design requirements.
(2)
The load calculations in the structural design process were examined, and a comparison was made between the major load values for photovoltaic supports as specified in Chinese codes [23,24,32], American codes [19,20], and Eurocodes [21,22]. Additionally, SAP2000 was used to analyze the load-bearing capacity and deformation of the photovoltaic supports.
(3)
The finite element analysis (FEA) software ABAQUS (V6.14-5) was used to analyze the impact of different component connection designs on the deformation of photovoltaic supports. Innovative joint connections were proposed to optimize the structural design of the photovoltaic supports.

3. Load Analysis of Photovoltaic Support

3.1. Load Calculation

Based on design information and on-site observations, the loads acting on photovoltaic supports primarily include the weight of the photovoltaic panels, the wind load, the snow load, and the construction load. Additionally, the Chinese code NB/T 10115-2018 [32] mandates the consideration of the longitudinal wind load on photovoltaic supports. The load calculation method is given as follows:
(1)
Weight of photovoltaic panels
Based on specific design parameters, the dimensions of the photovoltaic module were 2285 mm × 1134 mm, with a thickness of 35 mm. The weight of the single module was calculated to be 31.6 kg. The self-weight of a single photovoltaic module was determined using the formula G = mg where m = 31.6 kg and g = 9.8 m/s2, yielding G = 31.6 × 9.8/1000 = 0.310 kN.
(2)
Wind load
Wind load is a critical external factor that significantly influences the mechanical stress distribution and structural integrity of photovoltaic support systems [33]. As shown in Equations (1)–(3), the theory of the wind load calculation in Chinese codes, American codes, and Eurocodes is largely similar [34], involving the determination of reference wind pressure based on the basic wind speed and subsequent adjustments to account for factors such as structural dynamic response, topography, terrain roughness, and others. βz in Equation (1), G in Equation (2), and cd in Equation (3) all represent the impact of wind pressure pulsation on structures. µs in Equation (1), Kd in Equation (2), and cf in Equation (3) represent the influence of wind direction on structures.
ω k = β z μ s μ z ω 0
Here, βz is the gust-effect factor, µs is the shape coefficient of the photovoltaic module, and µz is the height variation coefficient of wind pressure.
p = q h K d G C N
Here, qh is the velocity pressure evaluated at the mean roof height, q h = 0.613 K z K z t K t V 3 s 2 , Kd is the wind directionality factor, G is the gust-effect factor, and CN is the net pressure coefficient.
ω = c s c d c f q p
where cs is the size factor, cd is the dynamic factor, cf is the force coefficient, and qp is the peak velocity pressure.
However, the value of the influence coefficient varies among codes. In the Chinese code, the basic wind speed (V10min) is defined as the average wind speed measured at a height of 10 m above open, flat ground in the local area. The Eurocode shares a similar definition. In contrast, the basic wind speed (V3s) in ASCE7-10 refers to the gust wind speed corresponding to a 3 s return period at a height of 10 m in a Class C site, with an approximate ratio of V3s/V10min = 1.42:1 [15]. Although the basic wind speed is relatively high, the gust-effect factor G in ASCE7-10 is 0.85, which is smaller than that in [23] GB 50009-2012. The directional influence coefficient in BS EN 1991-1-4 is relatively large, while it is the smallest in NB/T 10115-2018. Additionally, it is noteworthy that in load combination analysis, the partial coefficient of the wind load is 1.0 in ASCE7-10, 1.4 in the Chinese codes [30], and 1.5 in BS EN 1991-1-4 [21]. These differences originate from distinct reliability targets, requiring designers to select reasonable safety factors based on a specific application context.
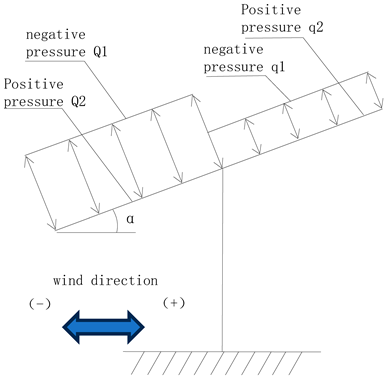
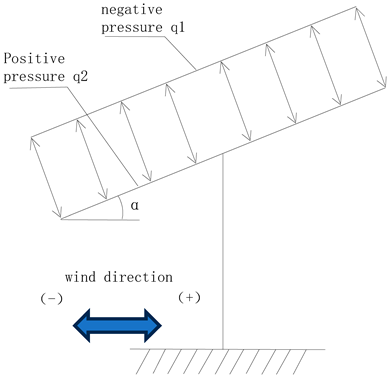
For this project, the reference wind pressure ω0 was calculated as 0.30 kN/m2 based on the Chinese code. Using Equations (1)–(3), the design wind loads were calculated according to different codes, as shown in Table 1. Higher wind loads calculated using various codes indicate greater reliability and increased costs when the basic wind pressure is the same.
(3)
Snow load
The reference snow pressure value for the project was 0.40 kN/m2. The values of the exposure coefficient, thermal factor, and shape factor varied slightly among the different codes. The design snow loads calculated using these codes are presented in Table 2.
(4)
The construction load was considered to be 1 kN and was applied to the most unfavorable position of the photovoltaic supports to ensure a conservative design approach.
(5)
According to NB/T 10115-2018, the longitudinal wind load, which acts along the longitudinal direction of the array due to longitudinal wind, must be considered. The value of the longitudinal wind load is calculated as 0.1Awh, where A represents the horizontal projection area of the photovoltaic panel and wh is the wind pressure at the height h of the photovoltaic panel.

3.2. Analysis and Results

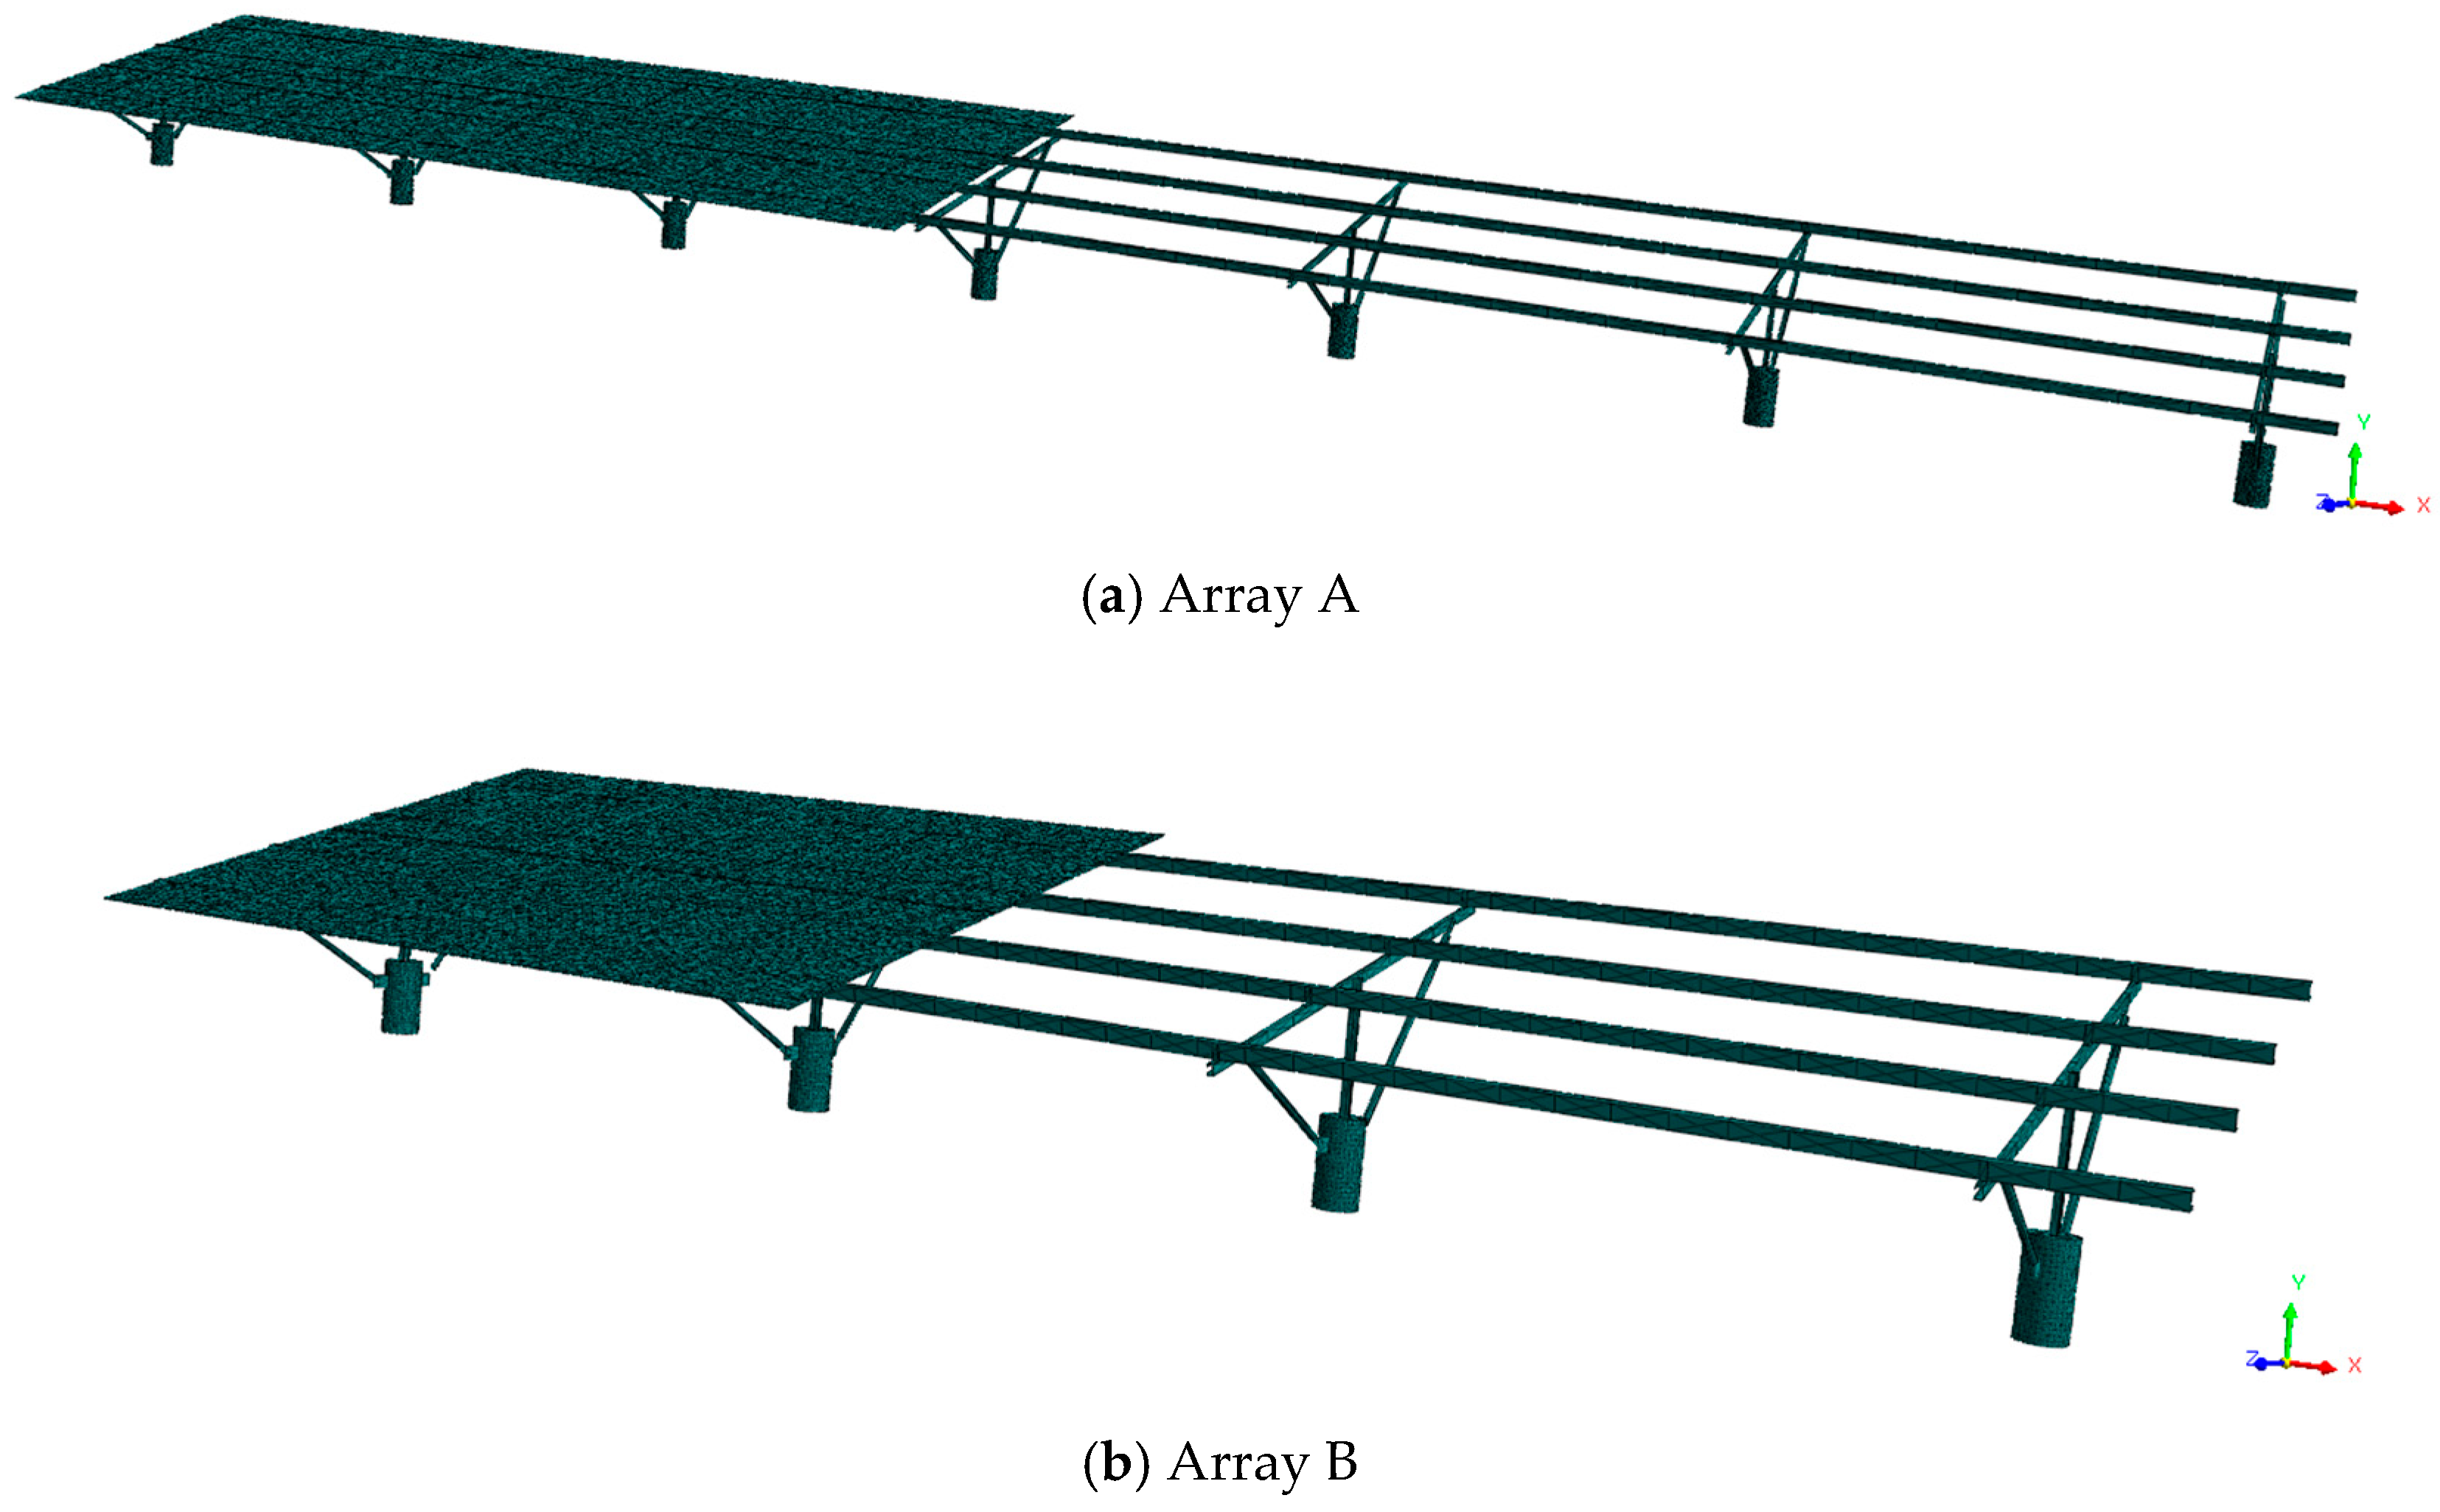
Three-dimensional computational models of Array A and Array B were developed, as shown in Figure 6. The specific modeling details are outlined below.
(1)
Frame elements with predefined steel sections were employed to simulate the main load-bearing members, with section properties automatically calculated by the built-in section database.
(2)
Rigid body constraints (6-DOF coupling) were assigned between different steel components, achieved through SAP2000’s Body Constraint command with all translational and rotational degrees of freedom constrained.
(3)
Material properties were defined according to the strength grades of different steel components. The fixed restraints with zero displacement tolerance were used as the boundary conditions of the bottom of the concrete column.
The load-carrying capacity was calculated under Chinese codes, American codes, and Eurocodes using the internationally recognized software SAP2000. The analysis revealed that the maximum stress for both Array A and Array B occurred at the joint connection between the beam and purlin. The maximum deformation also occurred at the mid-span of the purlin. These results indicate that the mid-span of the purlin and the joint between the purlin and the beam are the critical weak points in the model.
The specific results are summarized in Table 3. The maximum stress calculated according to the Chinese codes was less than 82% of that determined by the American codes and less than 78% of the Eurocodes. Similarly, the maximum deformation calculated according to the Chinese codes was less than 92% of the American codes and 87% of the Eurocodes. Among the three codes, the Eurocodes produced the highest stress and deformation values. Notably, when Array A was analyzed using the Eurocodes, the maximum stress of the purlin exceeded the material’s yield strength of 420 MPa. These results indicate that different design specifications yield varying results. Under identical conditions, the design results from the Eurocodes and American codes tended to be more conservative compared to those from the Chinese codes. This discrepancy arises because photovoltaic supports are highly sensitive to wind loads, and the calculated stress is closely tied to the wind load values. Consequently, photovoltaic supports designed using the Chinese codes are more likely to encounter structural failures under equivalent wind loads.

4. Finite Element Analysis

4.1. Model Establishment

To further analyze the deformation of photovoltaic supports, a numerical simulation was conducted using the ABAQUS finite element analysis software, which allows for a more realistic consideration of the connection conditions of components. All components of the photovoltaic supports were modeled using eight-node linear hexahedral solid elements (C3D8R). The simulation included parameters where two or three bolts were installed at the purlin hangers to investigate the effects of different connection methods on joint deformation; a schematic diagram is shown in Figure 7. Additionally, innovative connections were proposed to optimize the structural load-bearing performance of the photovoltaic support. The applied loads in the model were based on the calculation results derived from the Chinese codes. The specific modeling details are outlined below.
(1) During the assembly of the FEA model, one end of the column was tied to the concrete foundation, while the other end was tied to the beam. For purlin hangers connected with two bolts, on-site observations revealed bolt rotation between the purlin hanger and the purlin, indicating that this connection allowed rotational degrees of freedom. Consequently, the connection between the purlin hanger and the purlin was modeled as a hinged connection using multipoint constraints (MPC). Conversely, for purlin hangers connected with three bolts, no significant rotation or sliding was observed between the purlin hanger and the purlin, leading to the establishment of a fixed connection between the purlin and the purlin using tie constraints. Additionally, hinged connections were modeled at both ends of the braces, where they joined the beams and columns. Fixed connections were assumed between the purlins and the photovoltaic panels. The boundary condition at the bottom of the concrete foundation was set as a fixed end.
(2) The materials used in the model include concrete and steel, with the following main material properties, are given as follows:
Precast concrete foundation: The design strength grade of the precast concrete foundation is C80. According to the provisions of GB 50010-2010 [35], the elastic modulus for concrete of this strength grade is 3.80 × 10⁴ N/mm2, and Poisson’s ratio is 0.2.
Cold-formed thin-walled steel components: The columns, beams, braces, purlins, and other components of the photovoltaic support are fabricated from cold-formed thin-walled steel. The elastic modulus of steel is generally 2.06 × 10⁵ N/mm2, and Poisson’s ratio is 0.3. The yield strength of Q355B-grade steel is 355 N/mm2, while the yield strength of Q420B-grade steel is 420 N/mm2. The nonlinear steel behavior represented by the bi-linear stress–strain relationship was used to characterize the mechanical behavior of the steel components, which accurately captures both the elastic deformation and progressive yielding phenomena of the cold-formed thin-walled steel components under incremental loading [36]. The concrete damage plasticity model implemented in Abaqus was adopted to characterize the constitutive behavior of concrete materials, providing a robust computational framework for simulating their nonlinear mechanical responses under multiaxial stress conditions [37]. The FEA models were developed and are illustrated in Figure 8. In the following sections, the first letter of the model’s name represents the array type (A or B), the second letter indicates the number of bolts used for connecting the purlin hanger, the third letter denotes the type of purlin hanger (L-shaped or other), and the fourth letter specifies the cross-sectional form of the brace (circular steel tube or other).

4.2. Damage Analysis

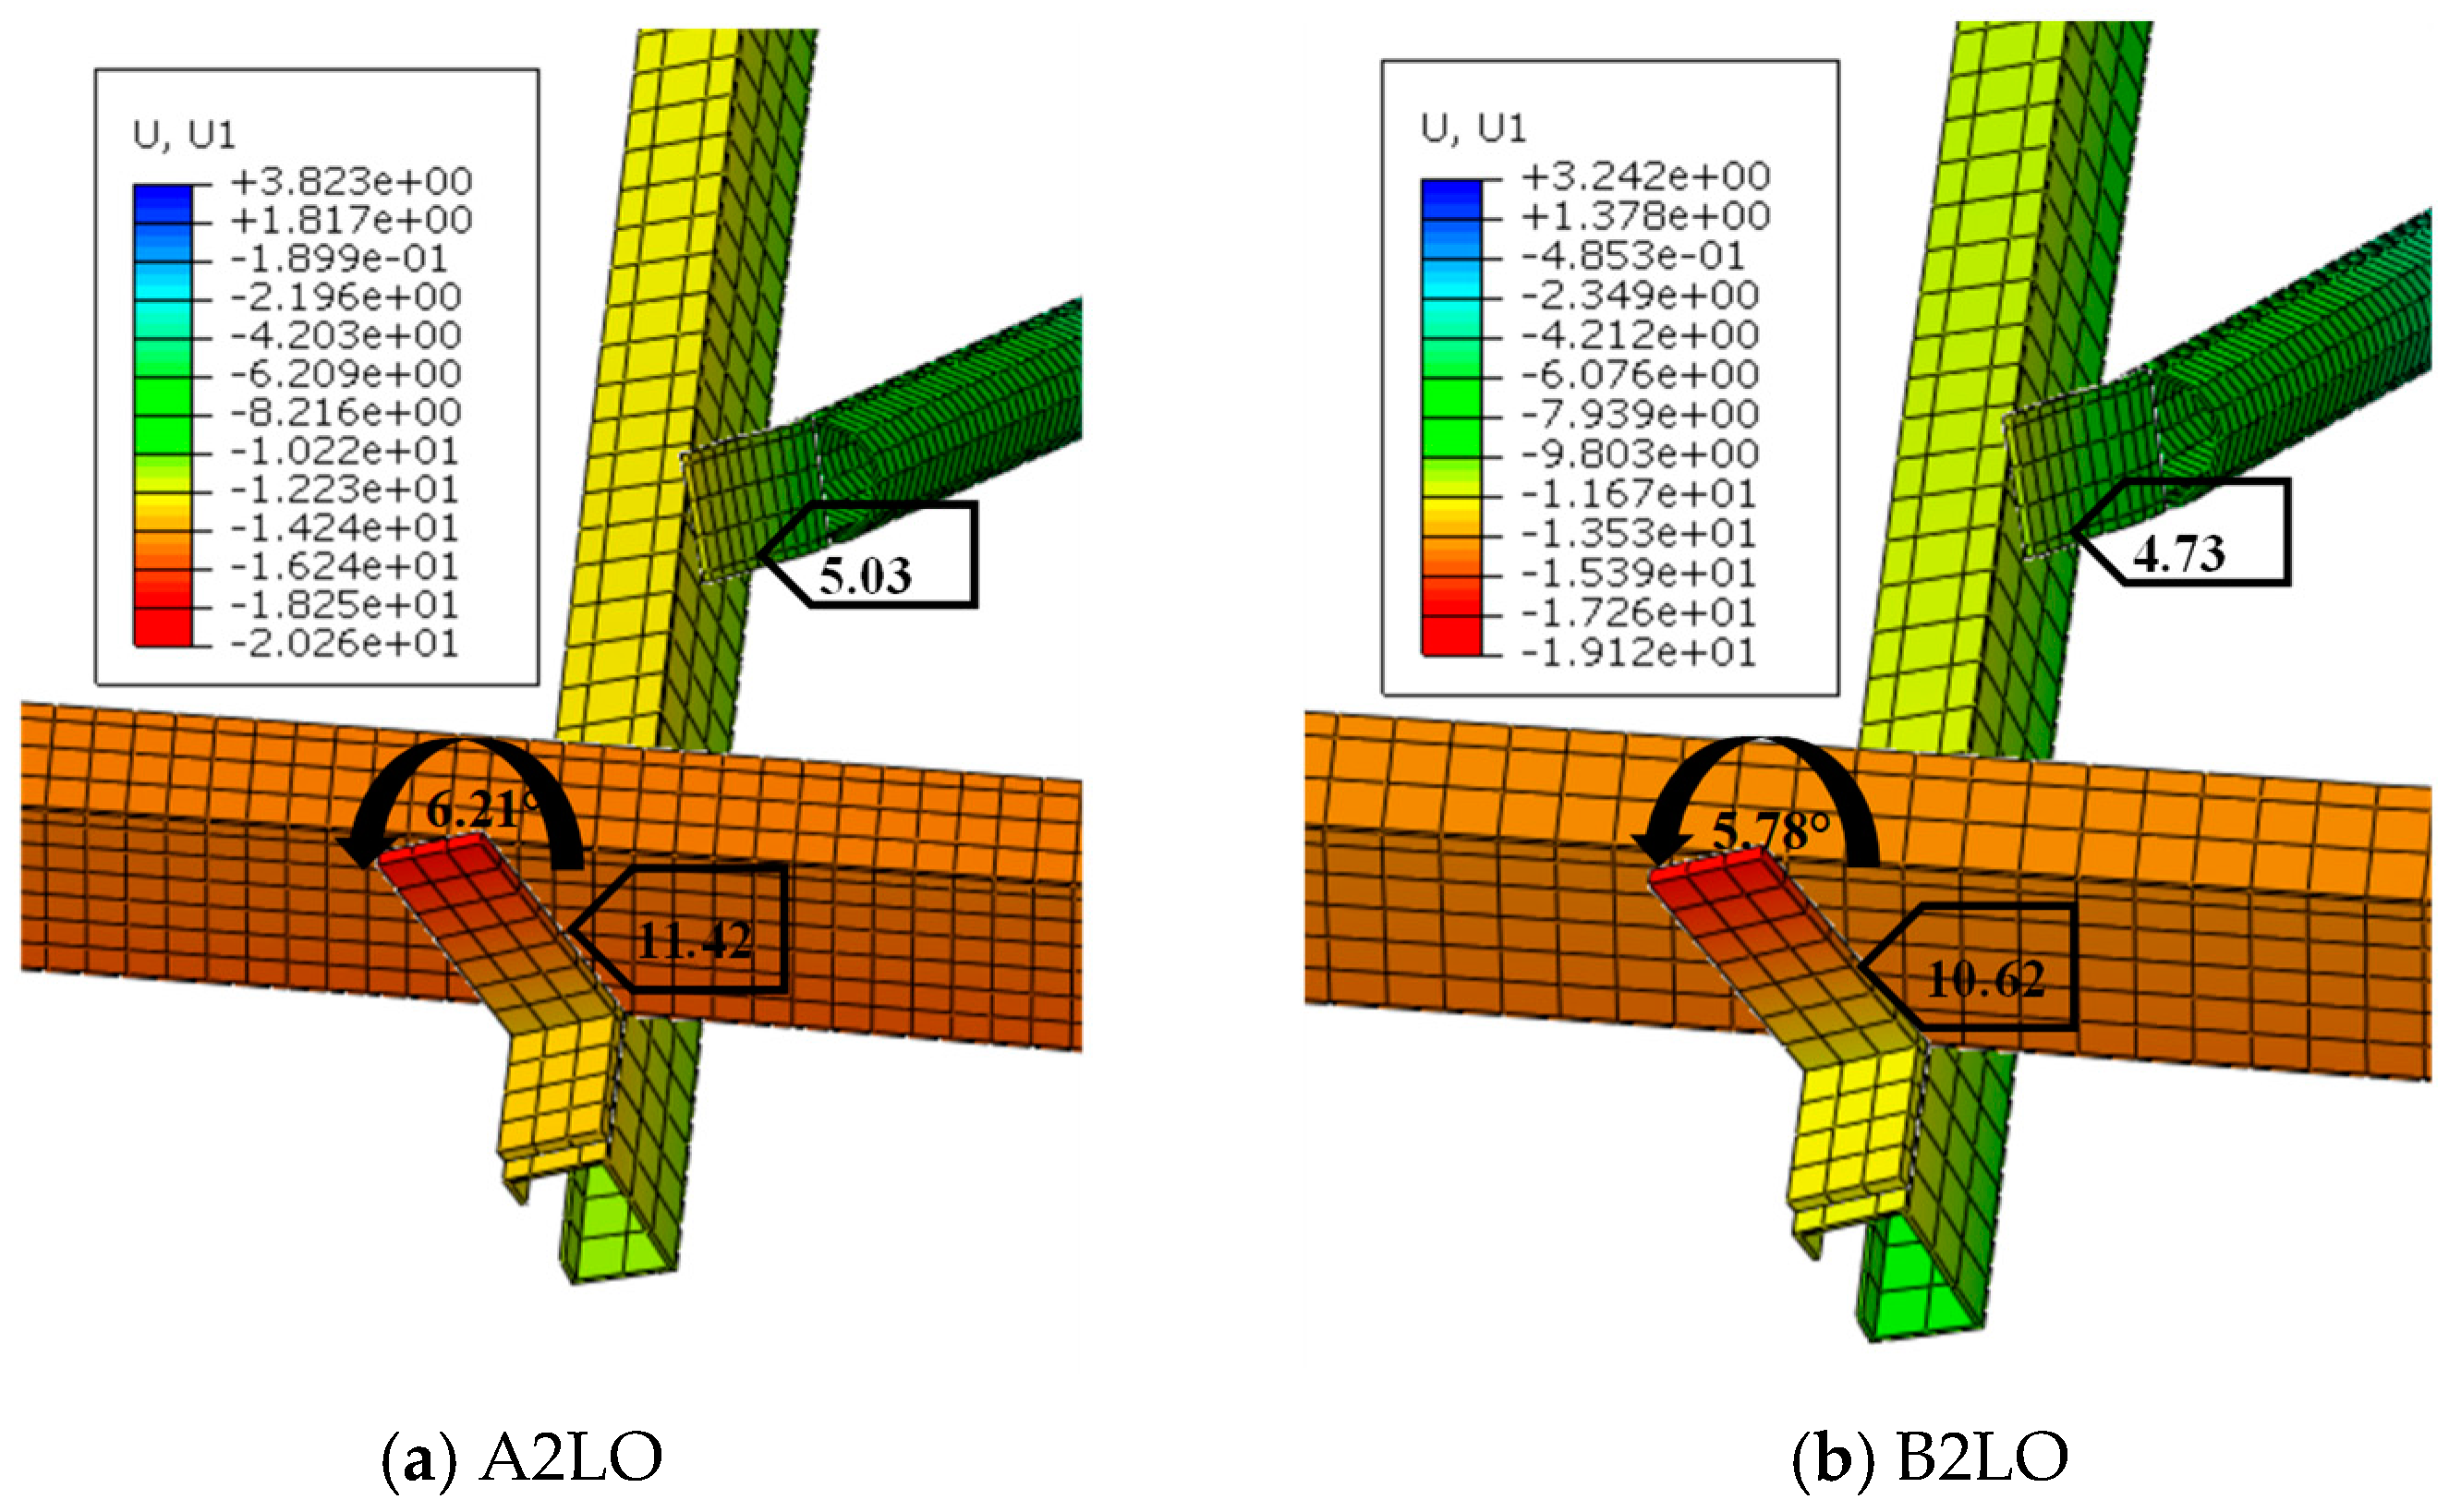
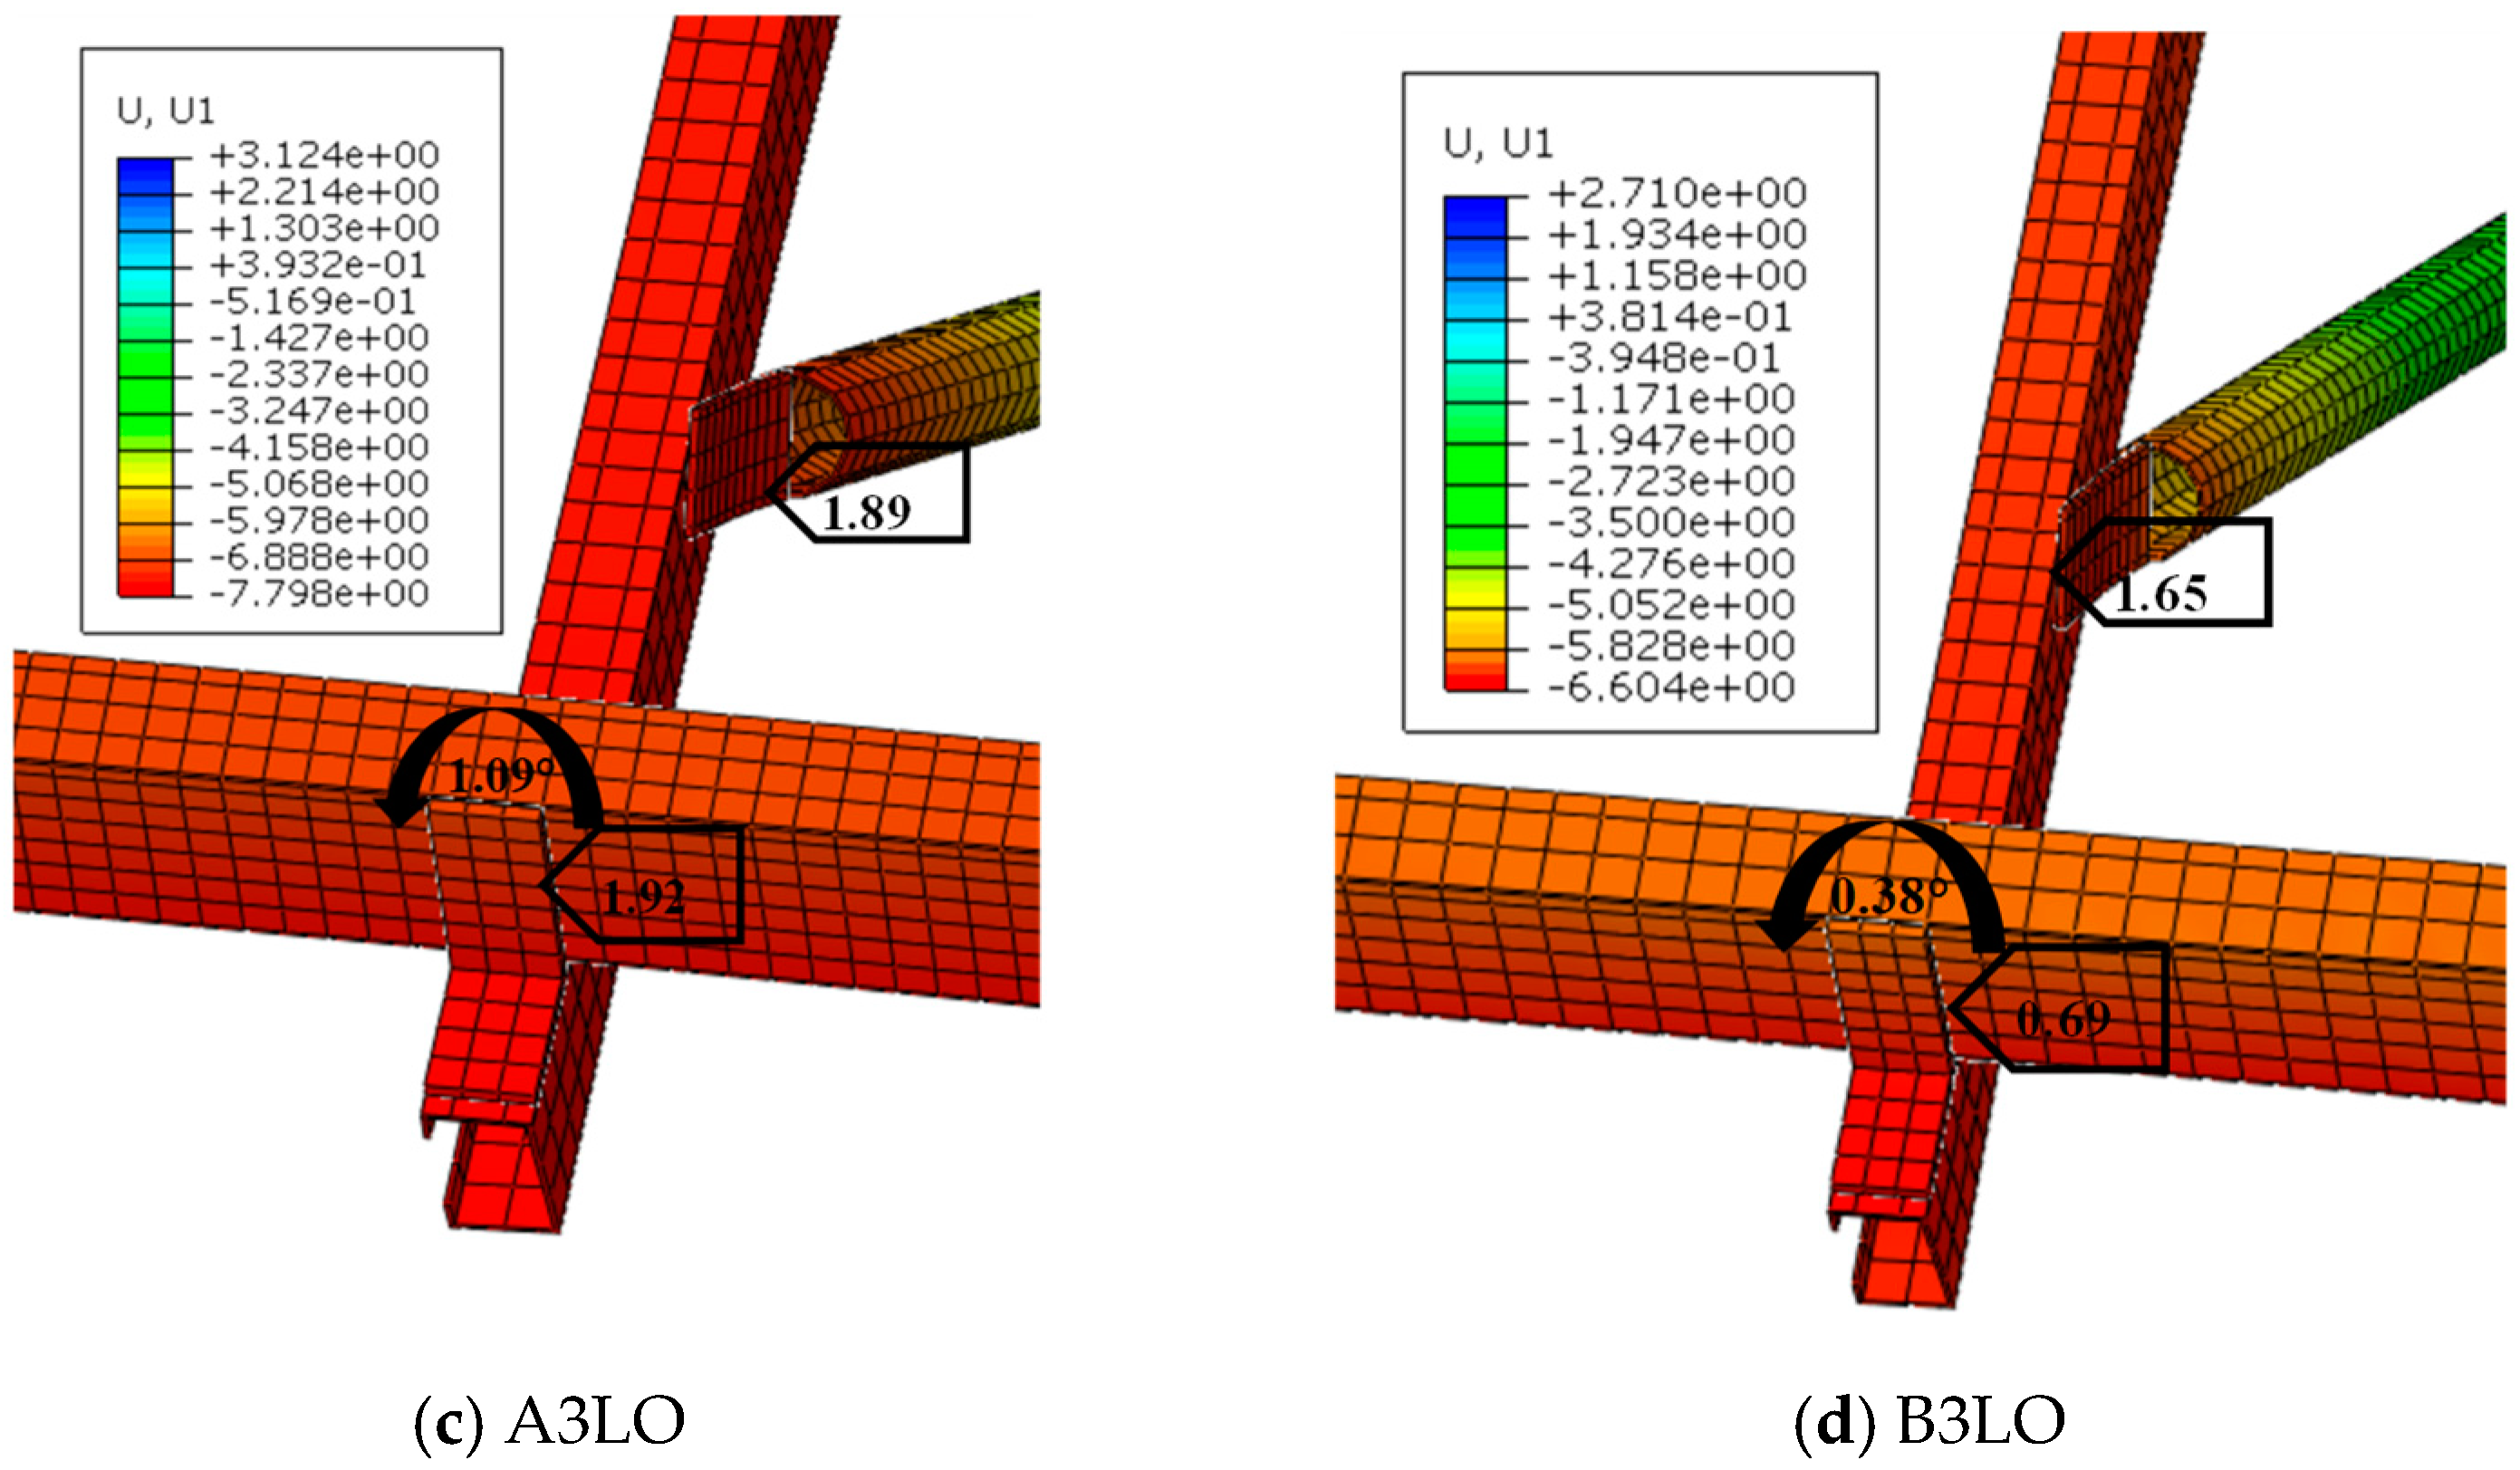
The calculation results for models A2LO and A3LO are shown in Figure 9 and Figure 10, respectively. The results indicate that the finite element analysis results calculated by ABAQUS were generally consistent with the results obtained from SAP2000. The maximum stress occurred at the purlin hanger joint connections, while the maximum deformation appeared in the mid-span region of the purlins. However, the finite element analysis results were slightly different from those from SAP2000. This discrepancy was because finite element analysis could not account for detailed structural measures of the joints or accurately capture minor deformations at the location of the purlin hanger. The deformation at the connections between the purlins and the beams, as well as at the ends of the braces, is illustrated in Figure 11.
As shown in Figure 11, the deformation occurred at the purlin hanger and the end of the braces, which is consistent with the damage observed in Figure 5. The finite element analysis effectively validated the relationship between the deformation of photovoltaic supports and their connection configurations. When the purlin hanger was connected using two bolts, significant lateral displacement along the purlin and rotation around the bolt were observed in A2LO and B2LO. Additionally, the lateral displacement at the end of the braces in A2LO and B2LO was significantly greater compared to models with three bolts at the purlin hanger. The lateral displacement and rotation angles of the purlin hanger in A2LO and B2LO were substantially higher than those in A3LO and B3LO. This indicated that the connection with the two bolts at the purlin hanger failed to provide effective constraints between the beams and purlins, resulting in the considerable rotation of the purlin hanger and beam around the bolt. The maximum rotation angles of the purlin hanger in A2LO and B2LO were 6.21° and 5.78°, respectively, which were more than 11 times greater than those in A3LO and B3LO.
Additionally, when the purlin hanger rotated, the brace connected to the beam experienced out-of-plane deformation. The deformation that occurred at the end of the brace was related to the deformation of the purlin hanger. The lateral displacement of the braces in A2LO and B2LO was significantly greater than in A3LO and B3LO. The maximum lateral displacements of the braces in Array A and Array B were 5.03 mm and 4.73 mm, respectively. The lateral displacements of the end of the braces in A3LO and B3LO were less than 38% of those in A2LO and B2LO. This demonstrates that using three bolts to connect the beam and purlin at the purlin hanger effectively limited the deformation of the purlin hangers.
The on-site damage observations and finite element analysis results are consistent. The deformations of photovoltaic supports were primarily due to inadequate joint connections. As depicted in Figure 12a, when the purlin hanger was connected to the purlin using a single bolt, the connection lacked sufficient stability, causing the purlin hanger to rotate under construction deviations and applied loads. Conversely, using two bolts for the joint connection, as shown in Figure 12b, effectively restricted the rotation of the purlin hanger, ensuring greater stability. Additionally, as illustrated in Figure 12c, flattening the ends of the round steel pipe braces reduced their out-of-plane stiffness, making them susceptible to out-of-plane instability and excessive deformation when the purlin hanger rotated. This, in turn, could lead to damage to the photovoltaic components and fluctuations in the panel surface, compromising the overall reliability of the photovoltaic supports. To address these issues, relevant design codes should emphasize enhancing node connections through improved construction measures to ensure the safety and durability of photovoltaic support structures. The finite element analysis results showed a high degree of consistency with the actual failure conditions and were closely aligned with the SAP2000 results, validating the accuracy of the established finite element model.

4.3. Optimization Analysis of Purlin Hangers

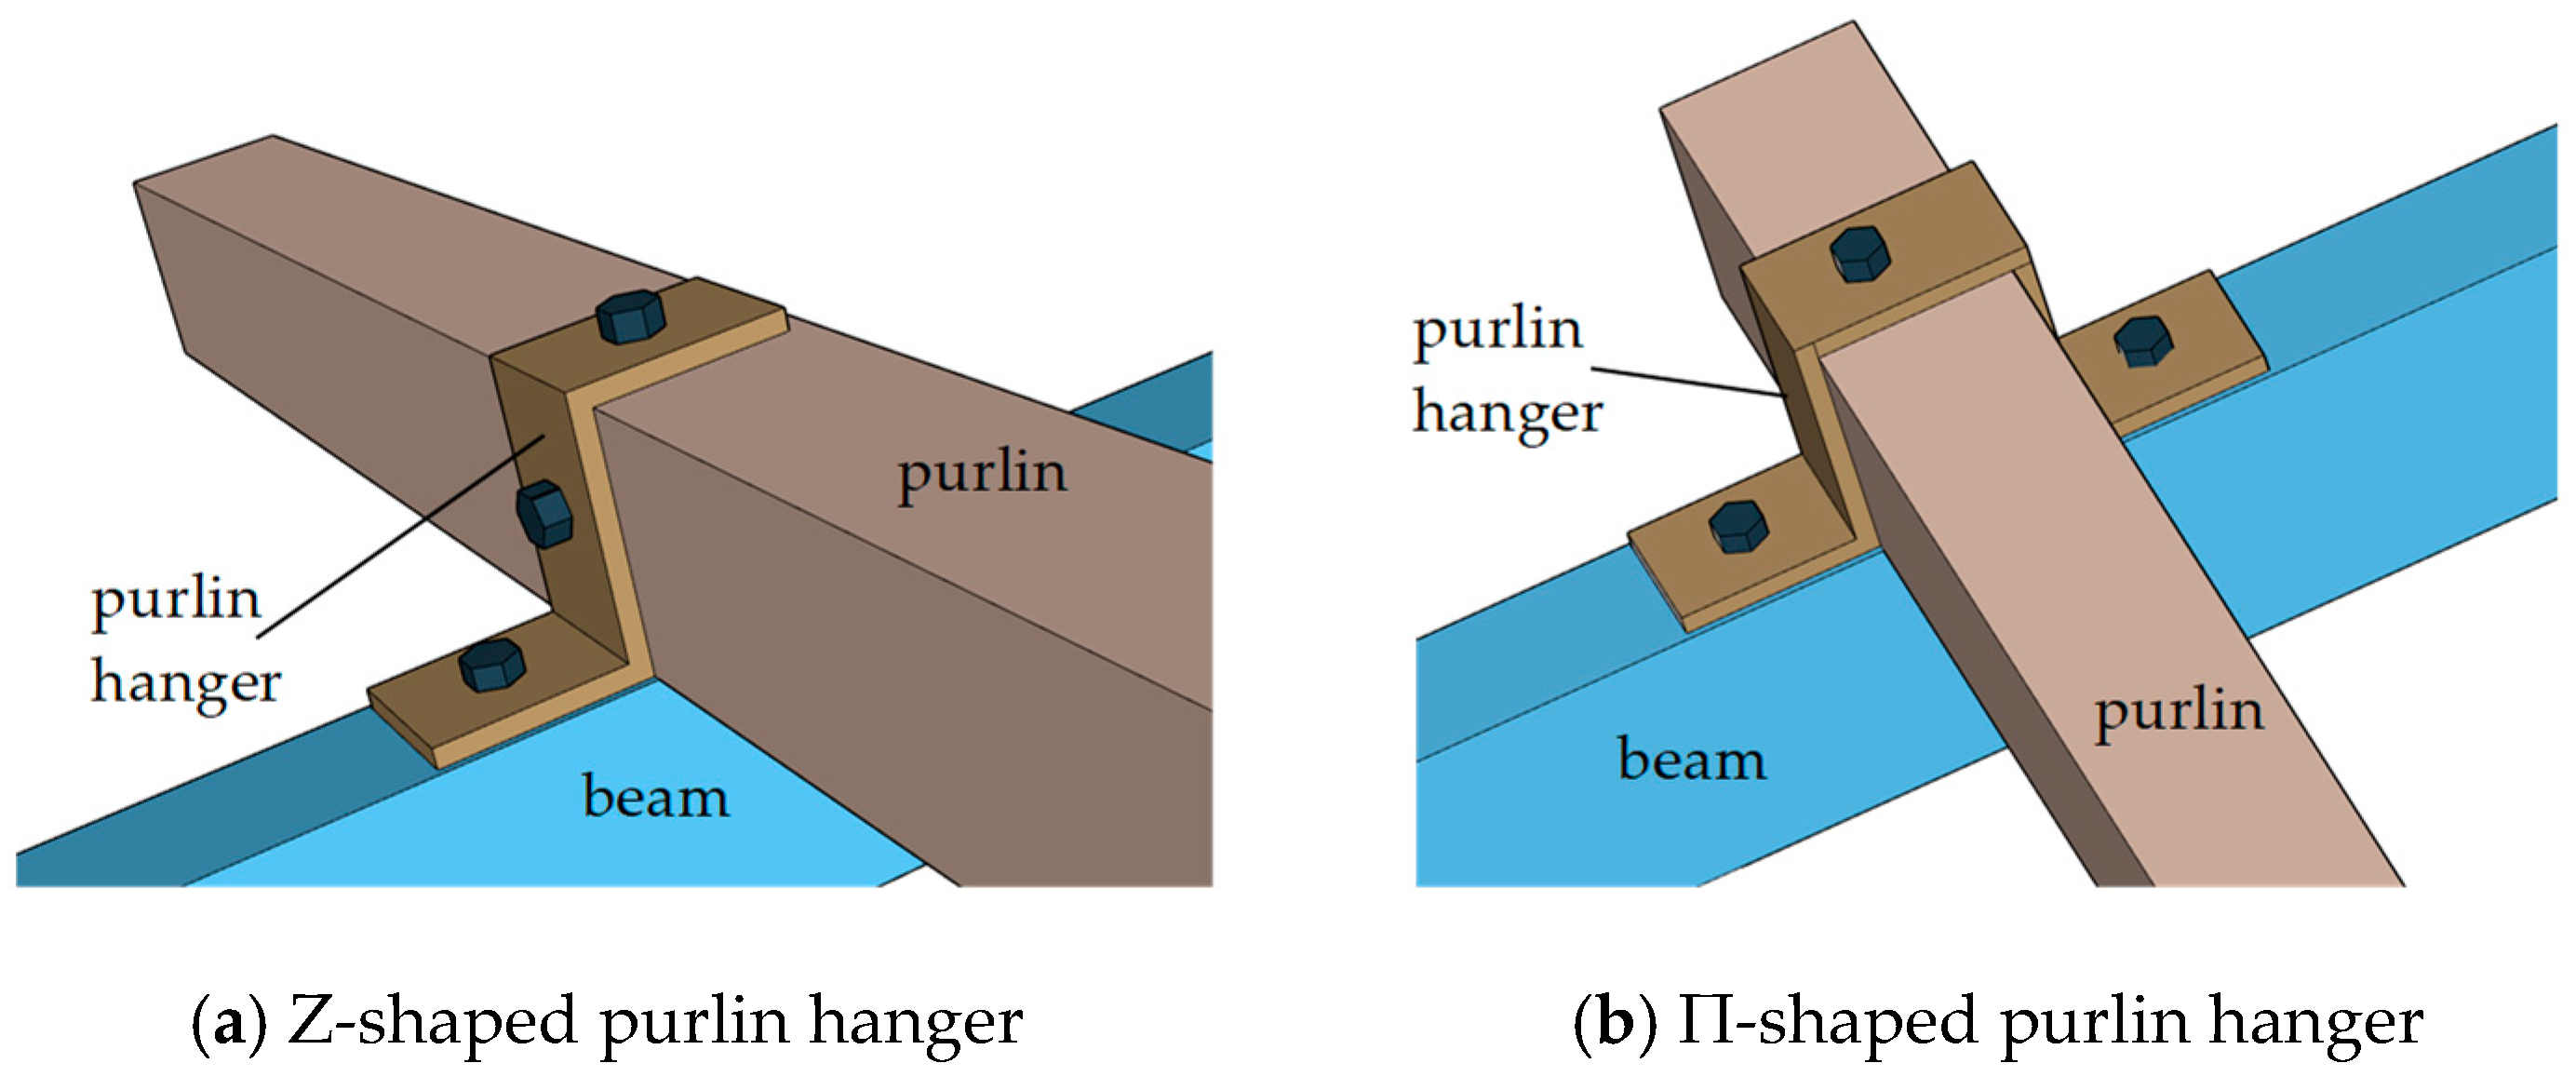
As noted in Section 4.2, one end of the purlin hanger was connected to the purlin, while the other end was connected to the beam, which is critical for the load-bearing capacity of the photovoltaic support structure. Just a slight rotational movement at the purlin hanger could easily compromise the stability of the structure. To enhance the stability of the joint connection of the purlin hanger, an innovative joint connection is proposed to connect the beam and the purlin. Schematic diagrams for the Z-shaped purlin hanger and Π-shaped purlin hanger are shown in Figure 13. Since the failure characteristics of Array A and Array B are similar when other parameters are the same, only Array A was analyzed further.
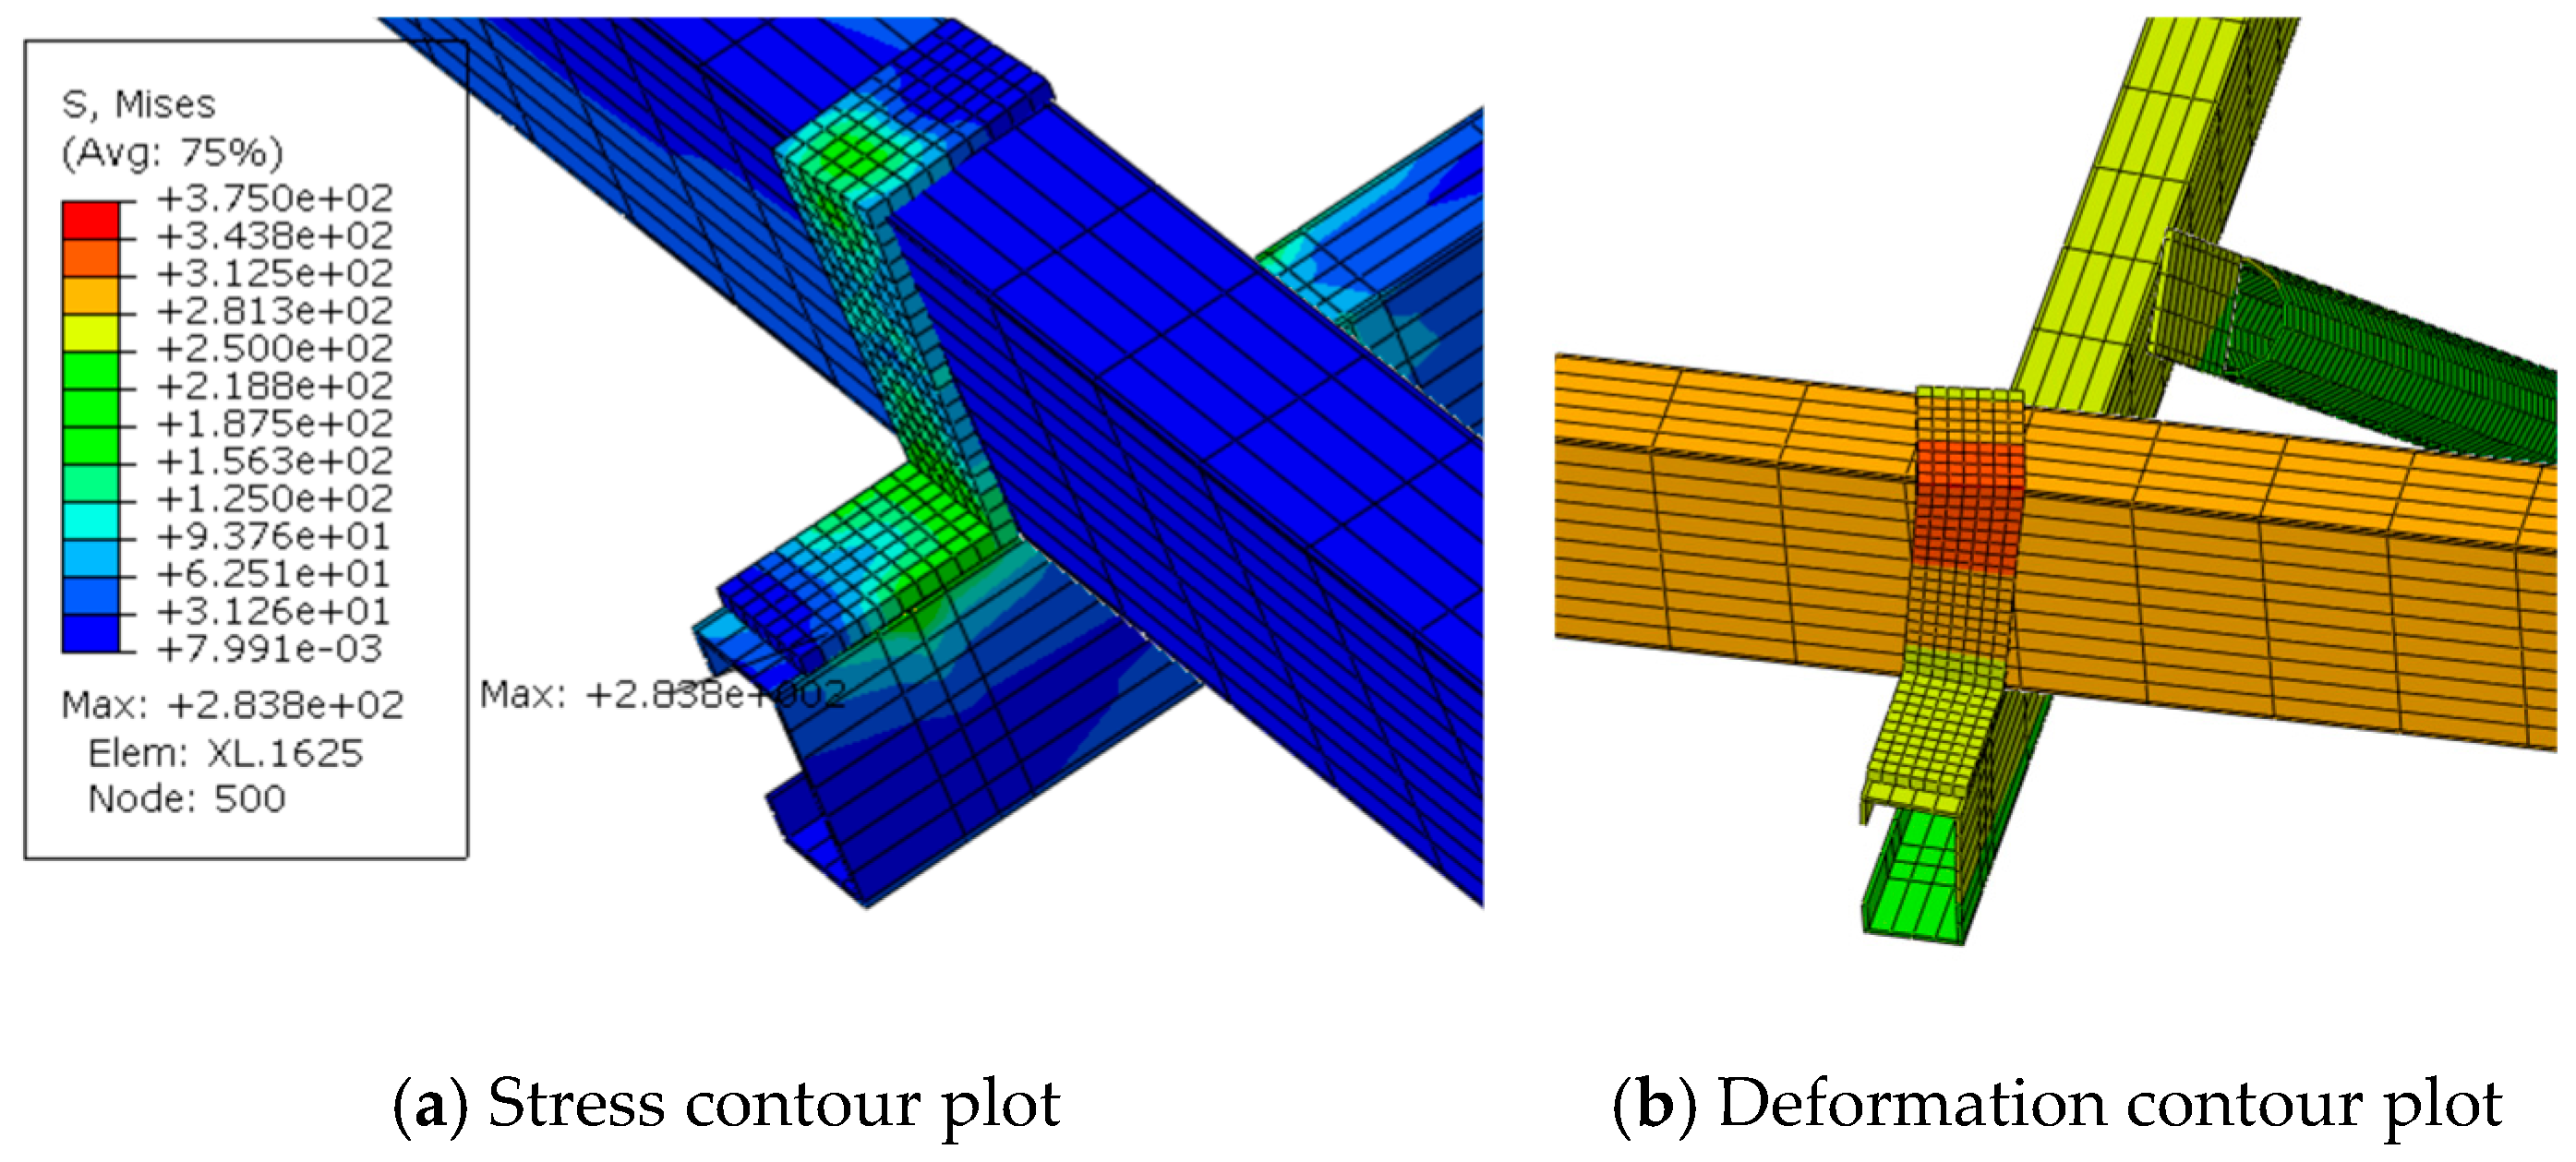
The L-shaped purlin hanger was replaced with Z-shaped and Π-shaped purlin hangers, and the new finite element models were named A3ZO and A3ΠO, respectively. Hinged connections were modeled when only one bolt was used to connect one side of the purlin hanger to the other side of the purlin. During the modeling process, all other parameters were the same as those of model A3LO. The stress and deformation calculated for the purlin hangers in each model are shown in Figure 14 and Figure 15. According to Figure 14, when the Z-shaped and Π-shaped purlin hangers were used to connect the beams and purlins, the maximum stress in the photovoltaic support structure occurred at the location of the purlin hanger. Under the applied loads, the purlin hanger was prone to deformation. The stress at the location of the purlin hanger and deformation along the purlin (U1) are summarized in Table 4.
As shown in Table 4, the maximum stress in A3ZO is 283.8 MPa, which is approximately 79% of the maximum stress in A2LO. The maximum stress in A3ΠO is 258.8 MPa, about 72% of that in model A2LO. Although A3LO, A3ZO, and A3ΠO all use three bolts at the location of the purlin hanger, the Z-shaped and Π-shaped purlin hangers effectively reduce the stress concentration at the location of the purlin hanger, with the maximum stress being only about 75% of that in A3LO. Additionally, the lateral displacement of the purlin hangers in A3LO, A3ZO, and A3ΠO are all less than 18% of those in A2LO. Notably, the lateral displacement of the purlin hanger in A3ΠO is only 9% of that in A2LO, and the purlin hanger experiences almost no rotation. The maximum stress and U1 in A3ΠO are smaller than those in A3ZO.
The analysis results indicate that the use of three bolts at the location of the purlin hanger is essential to prevent the deformation of the photovoltaic support under load. Moreover, compared to the L-shaped purlin hanger, the Z-shaped and Π-shaped hangers effectively reduce the maximum stress at the location of the purlin hanger. Although the steel usage for the Z-shaped and Π-shaped purlin hangers is slightly higher than that of the L-shaped hanger, this increase is negligible in the overall photovoltaic support structure.
A comparative analysis was conducted regarding the cost and practical application of the different purlin hangers. The cost of a steel structure is primarily determined by the amount of steel required. Table 5 presents the steel consumption calculations for the different purlin hangers. To comprehensively evaluate the steel consumption of Array A, the total steel consumption of the photovoltaic array (including purlin hangers) was also quantified. The results showed that the steel consumption of one L-shaped purlin hanger was 0.324 kg, while that of one Z-shaped purlin hanger and one Π-shaped purlin hanger was 0.418 kg and 0.742 kg, respectively, representing increases of at least 1.29 times compared to the L-shaped purlin hanger. Z-shaped and Π-shaped purlin hangers seem uneconomical from this perspective.
However, when comparing the total steel consumption of the photovoltaic supports of Array A, the amount of steel required for the Z-shaped purlin hanger only increased by 0.55% compared to the L-shaped purlin hanger, and the Π-shaped purlin hanger showed a mere 2.4% increase. These marginal increments become negligible when considering the significant improvement in joint mechanical performance. Furthermore, although L-shaped purlin hangers are more conventional, both Z-shaped and Π-shaped purlin hangers can be manufactured with comparable ease in factory settings. When purlin hangers are installed with three bolts, the on-site installation difficulty of Z-shaped and Π-shaped purlin hangers is comparable to that of L-shaped purlin hangers.

4.4. Optimization Analysis of Braces

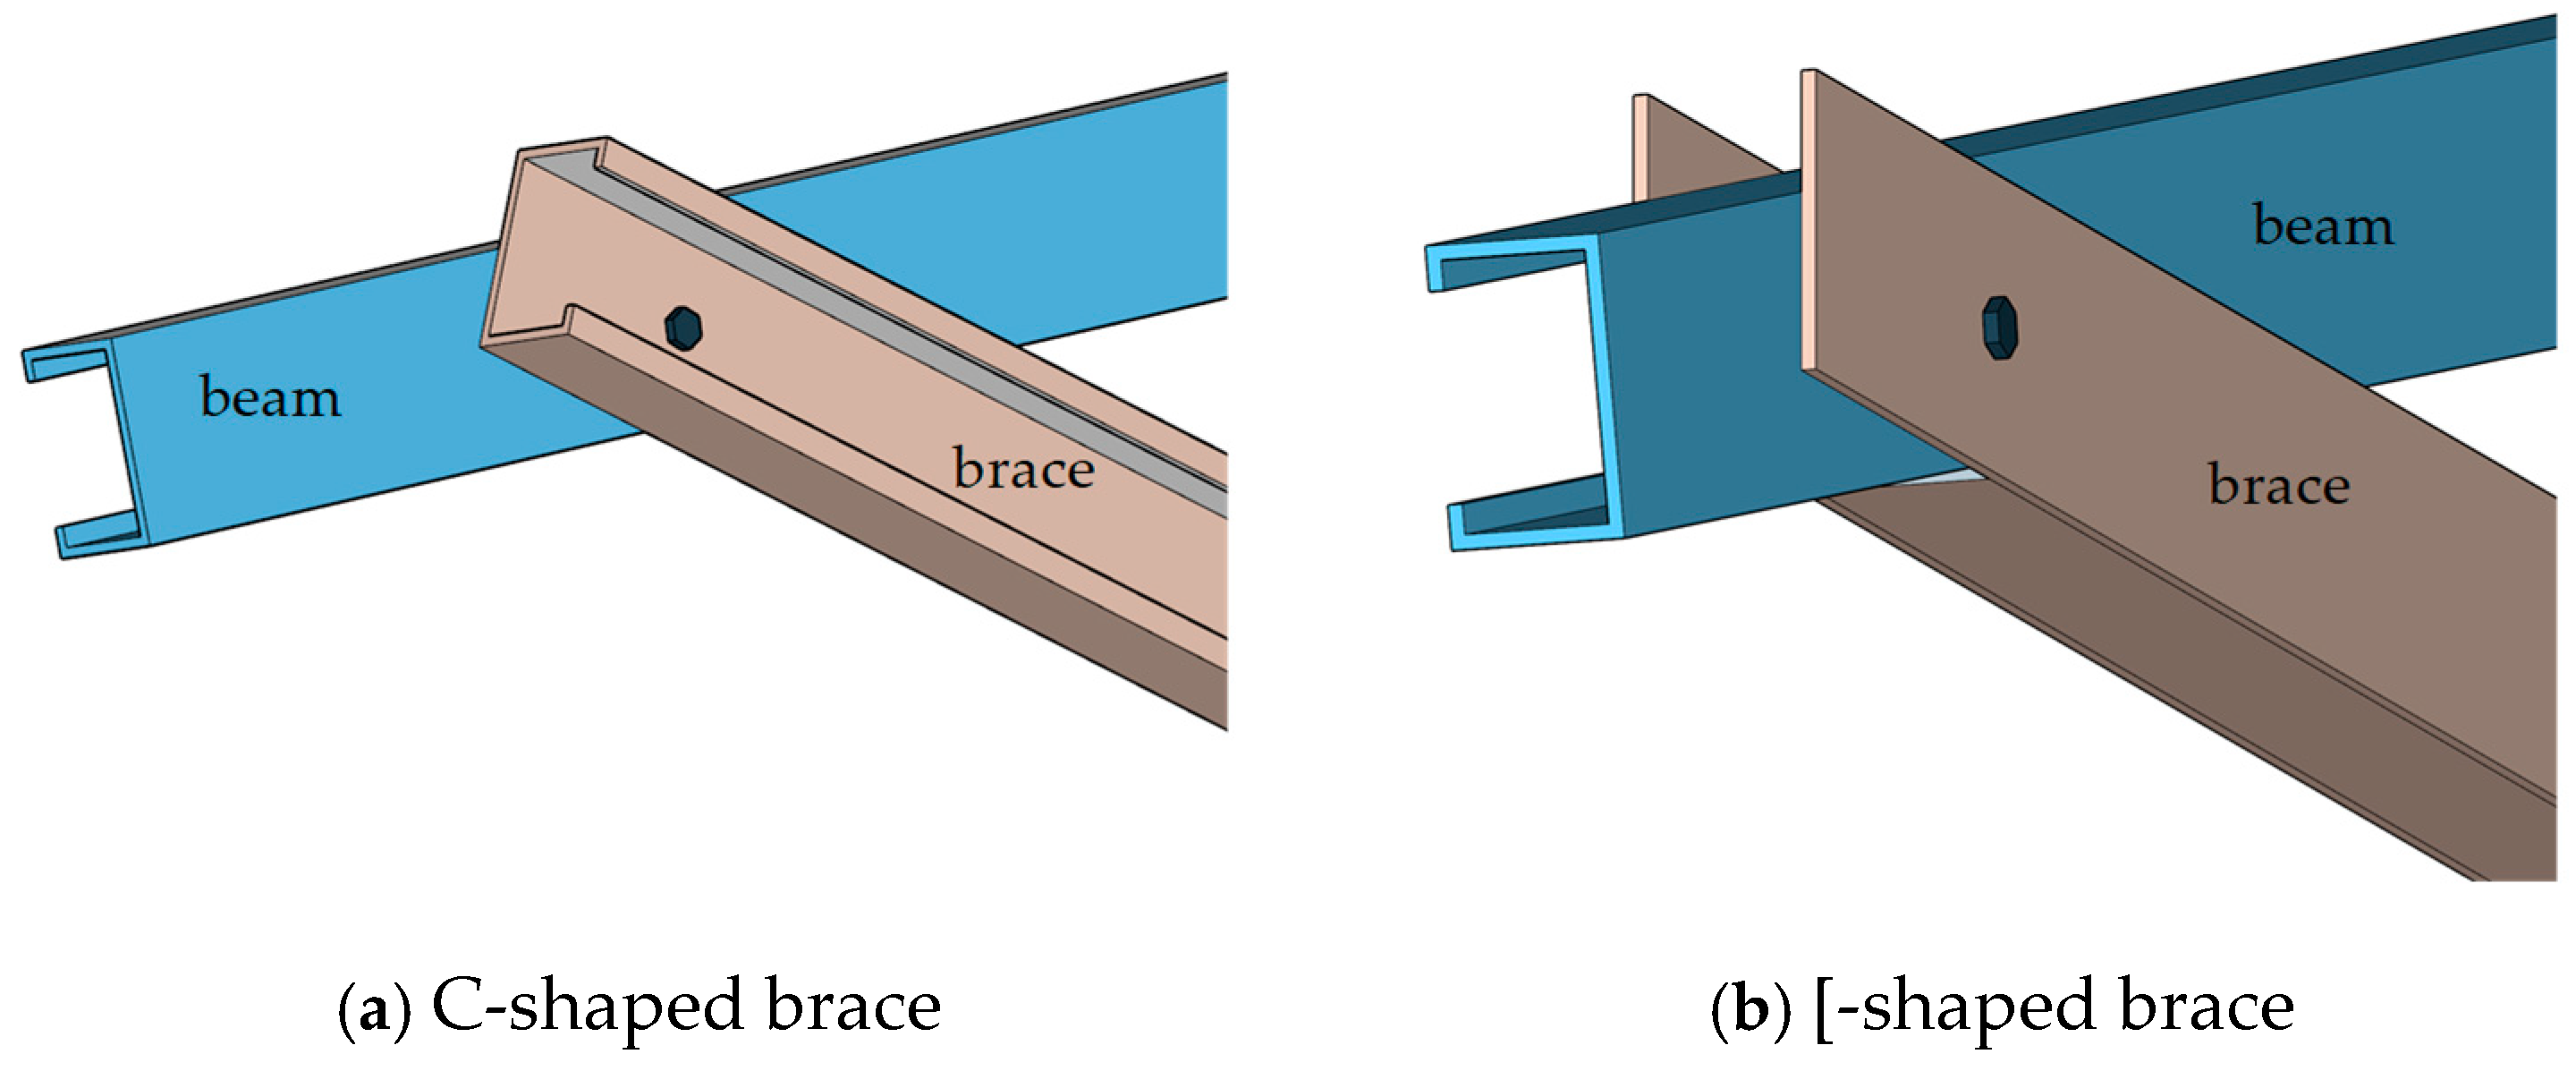
The support configuration at both ends is one of the key factors affecting the load-bearing capacity of photovoltaic support structures. A brace that is too weak can exacerbate the deformation of the structure, leading to greater damage. It is necessary to avoid out-of-plane deformation by optimizing the joint connection at the end of the brace. The innovative brace design was proposed to replace the steel pipe support. C-shaped steel (with section dimensions of C50 × 40 × 10 × 2) and [-shaped steel (with section dimensions of 45 × 65 × 2) were used as the braces for the photovoltaic supports, as shown in Figure 16. The steel consumption of C-shaped and [-shaped] braces is similar to that of circular steel tube braces. The web of the C-shaped steel could be easily connected to the web of the purlin, while the end of the [-shaped steel required a notch, with bolts passing through the upper and lower flanges of the [-shaped steel to connect to the diagonal beam.
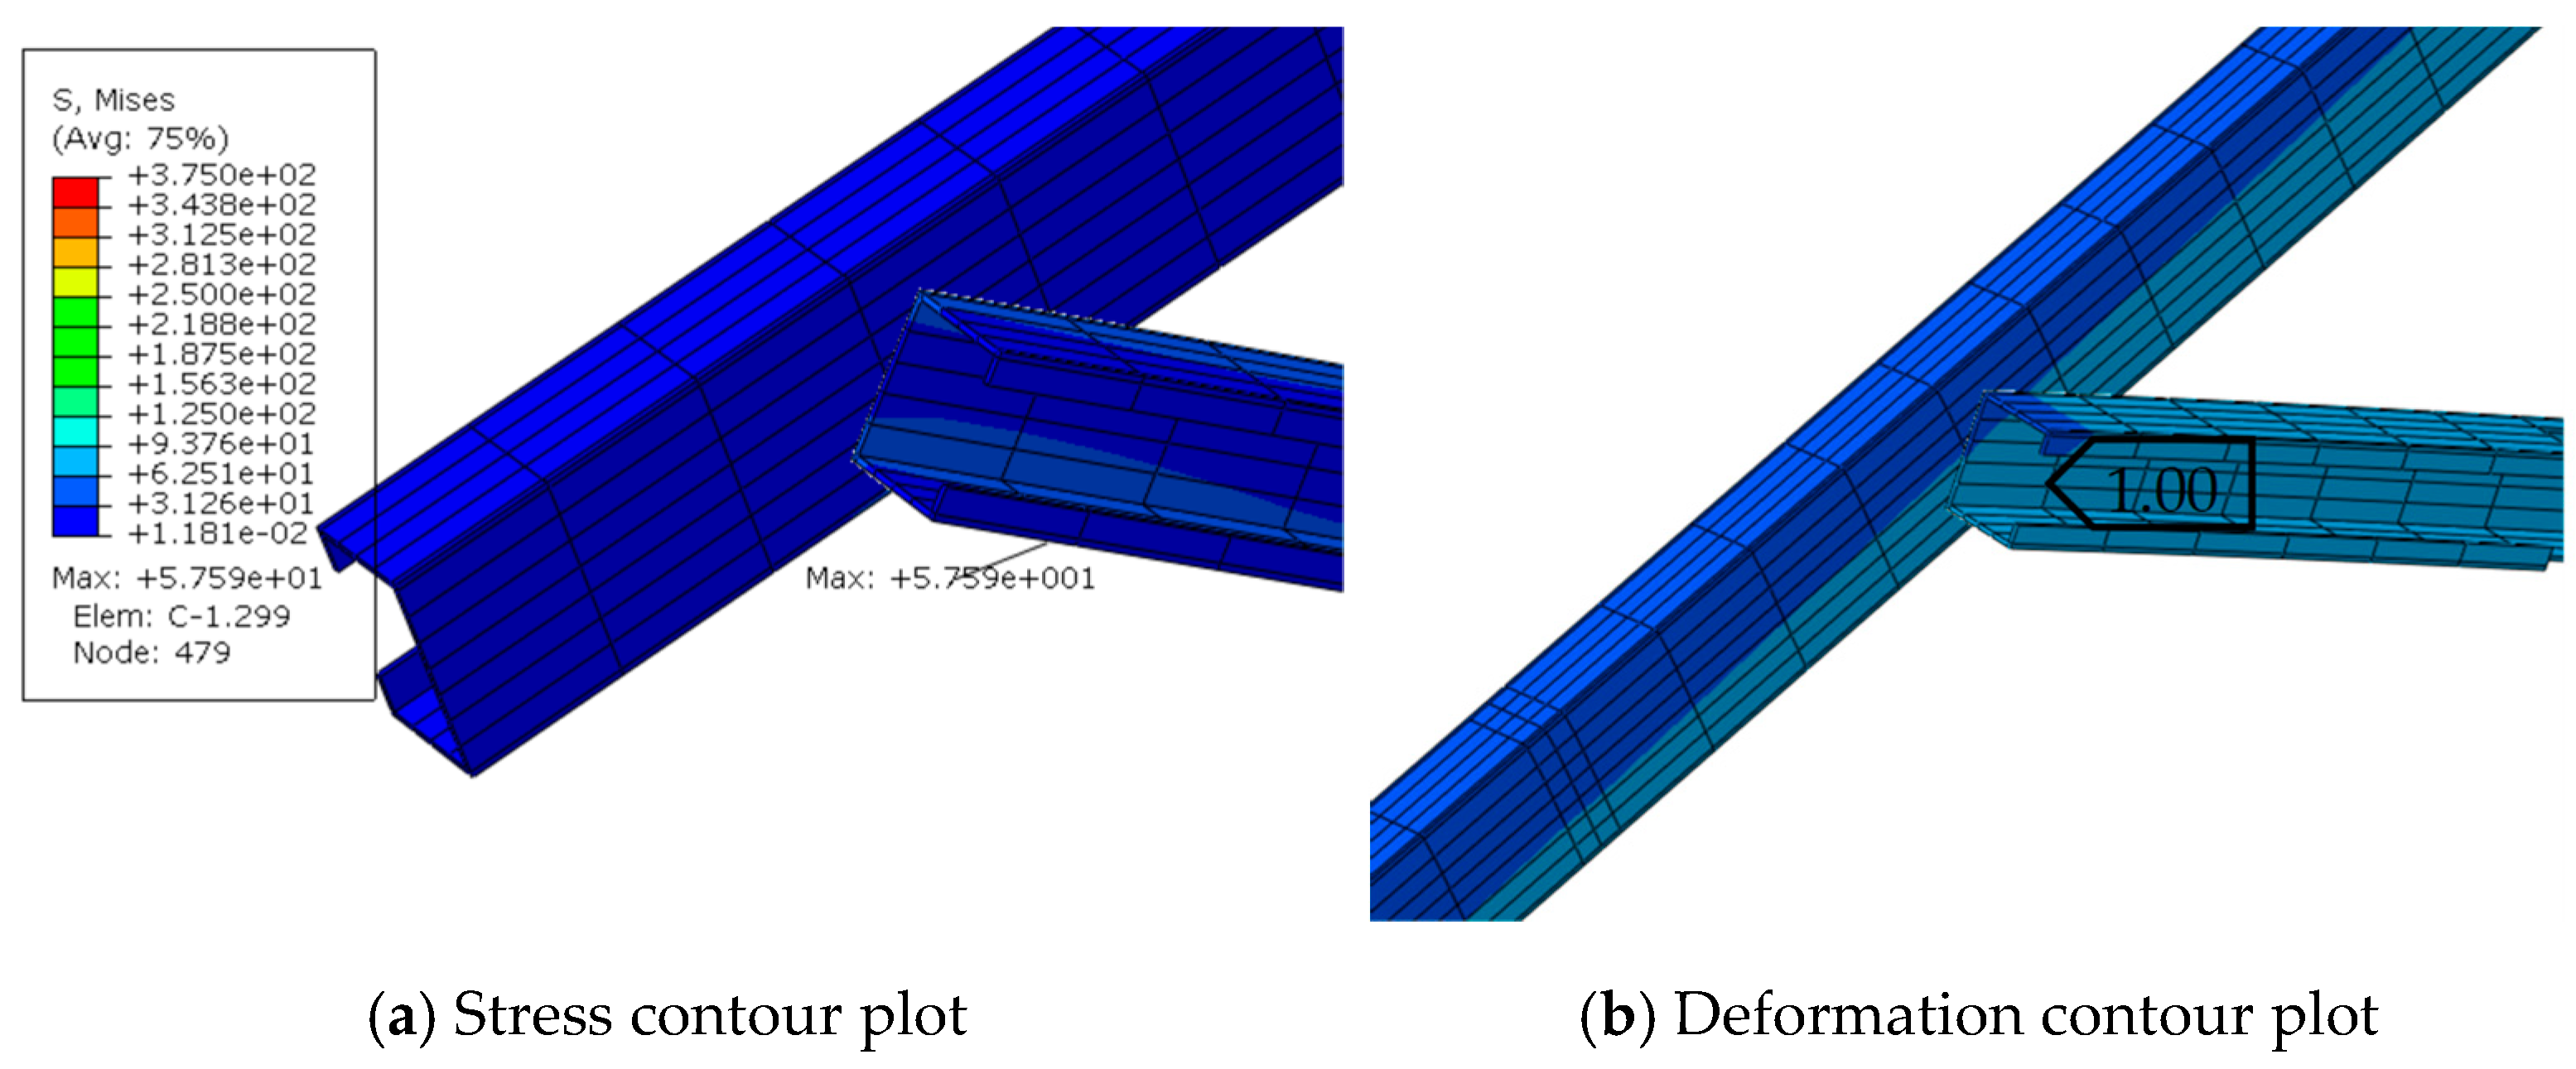
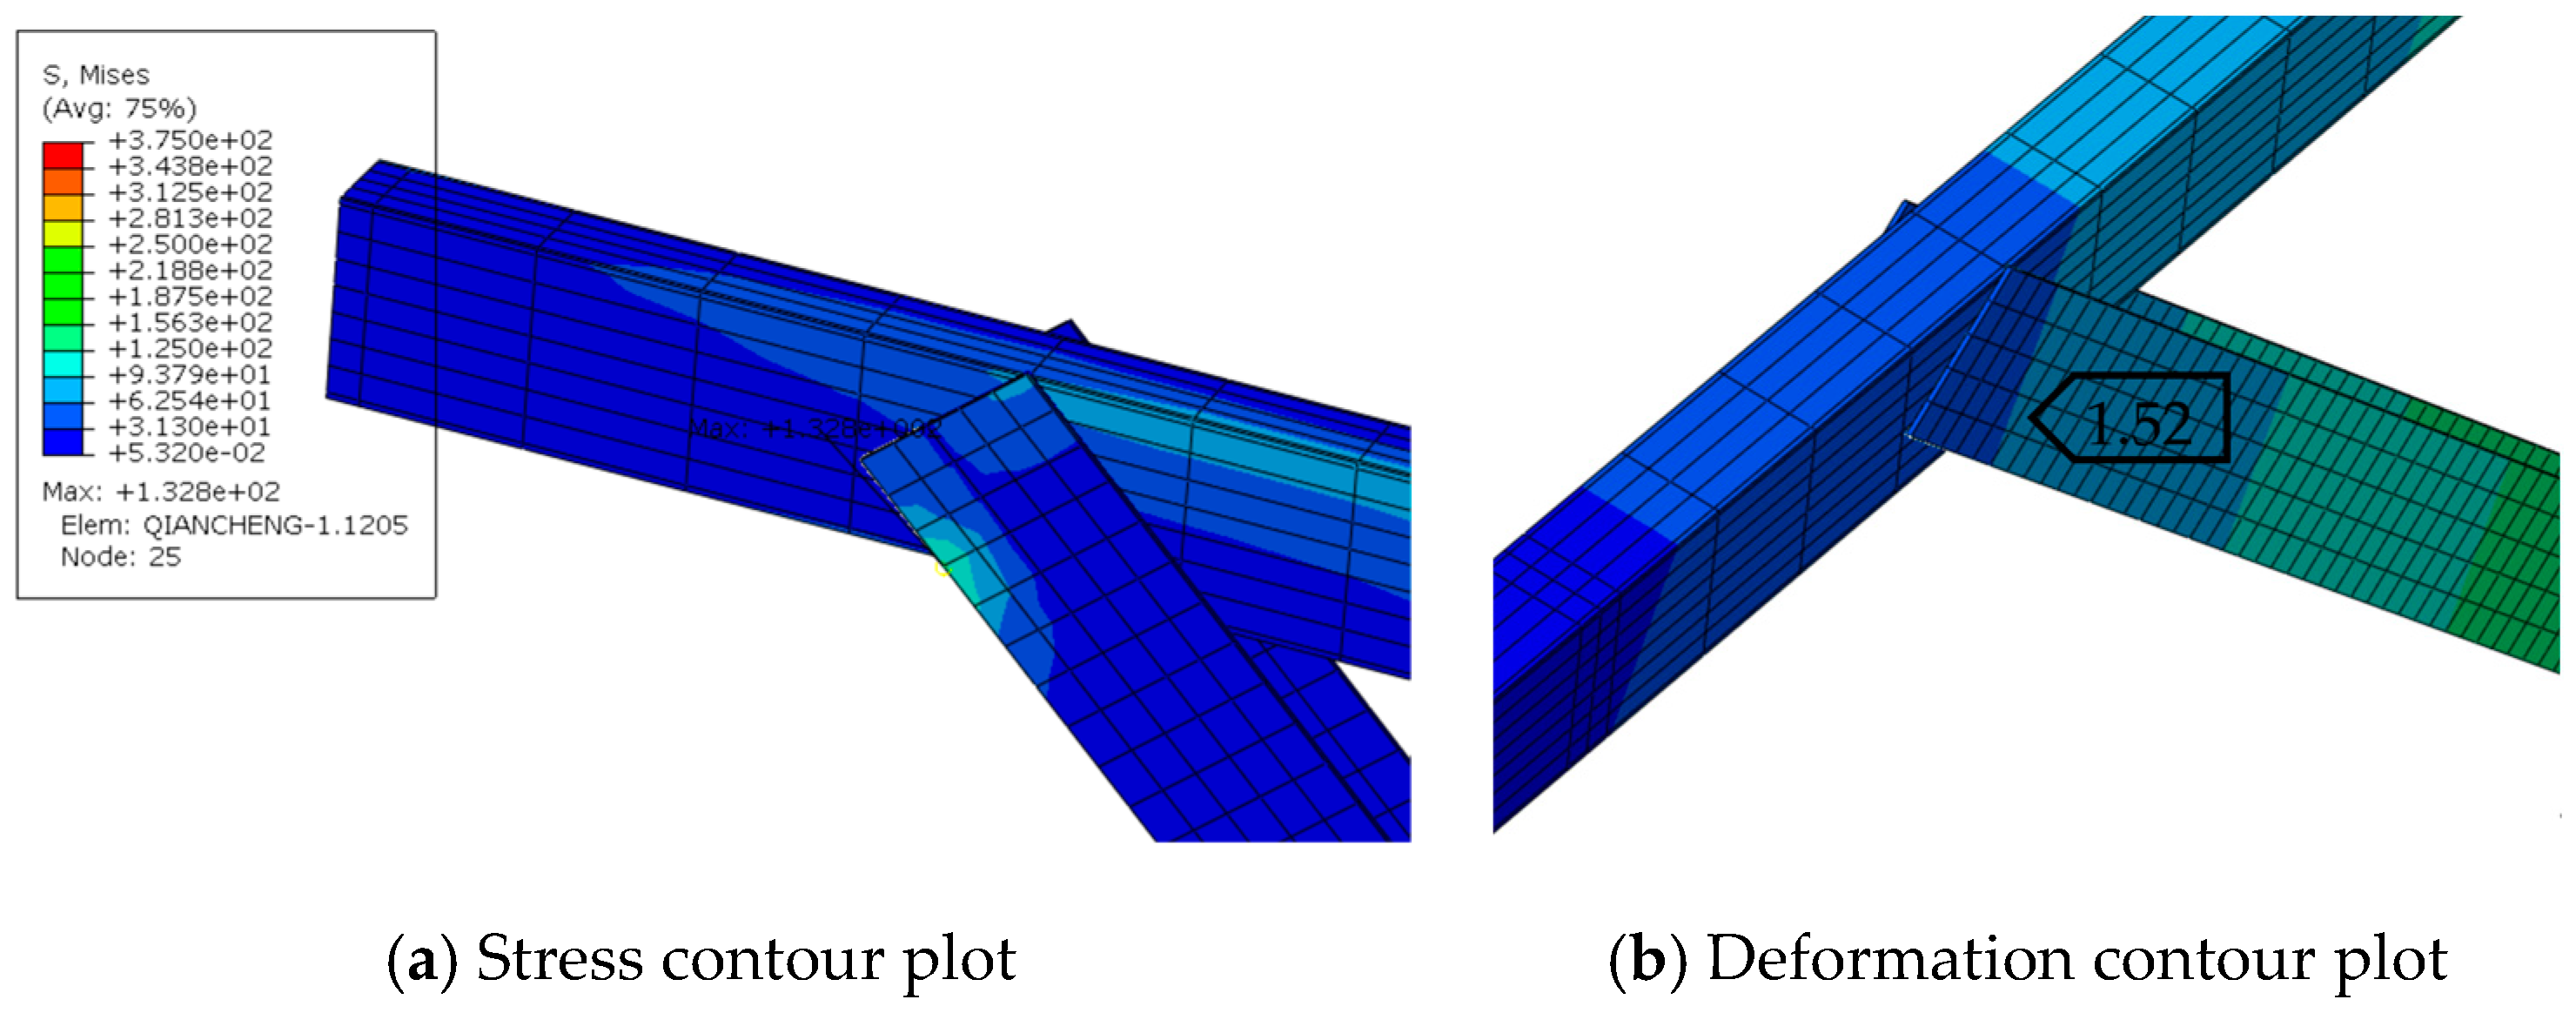
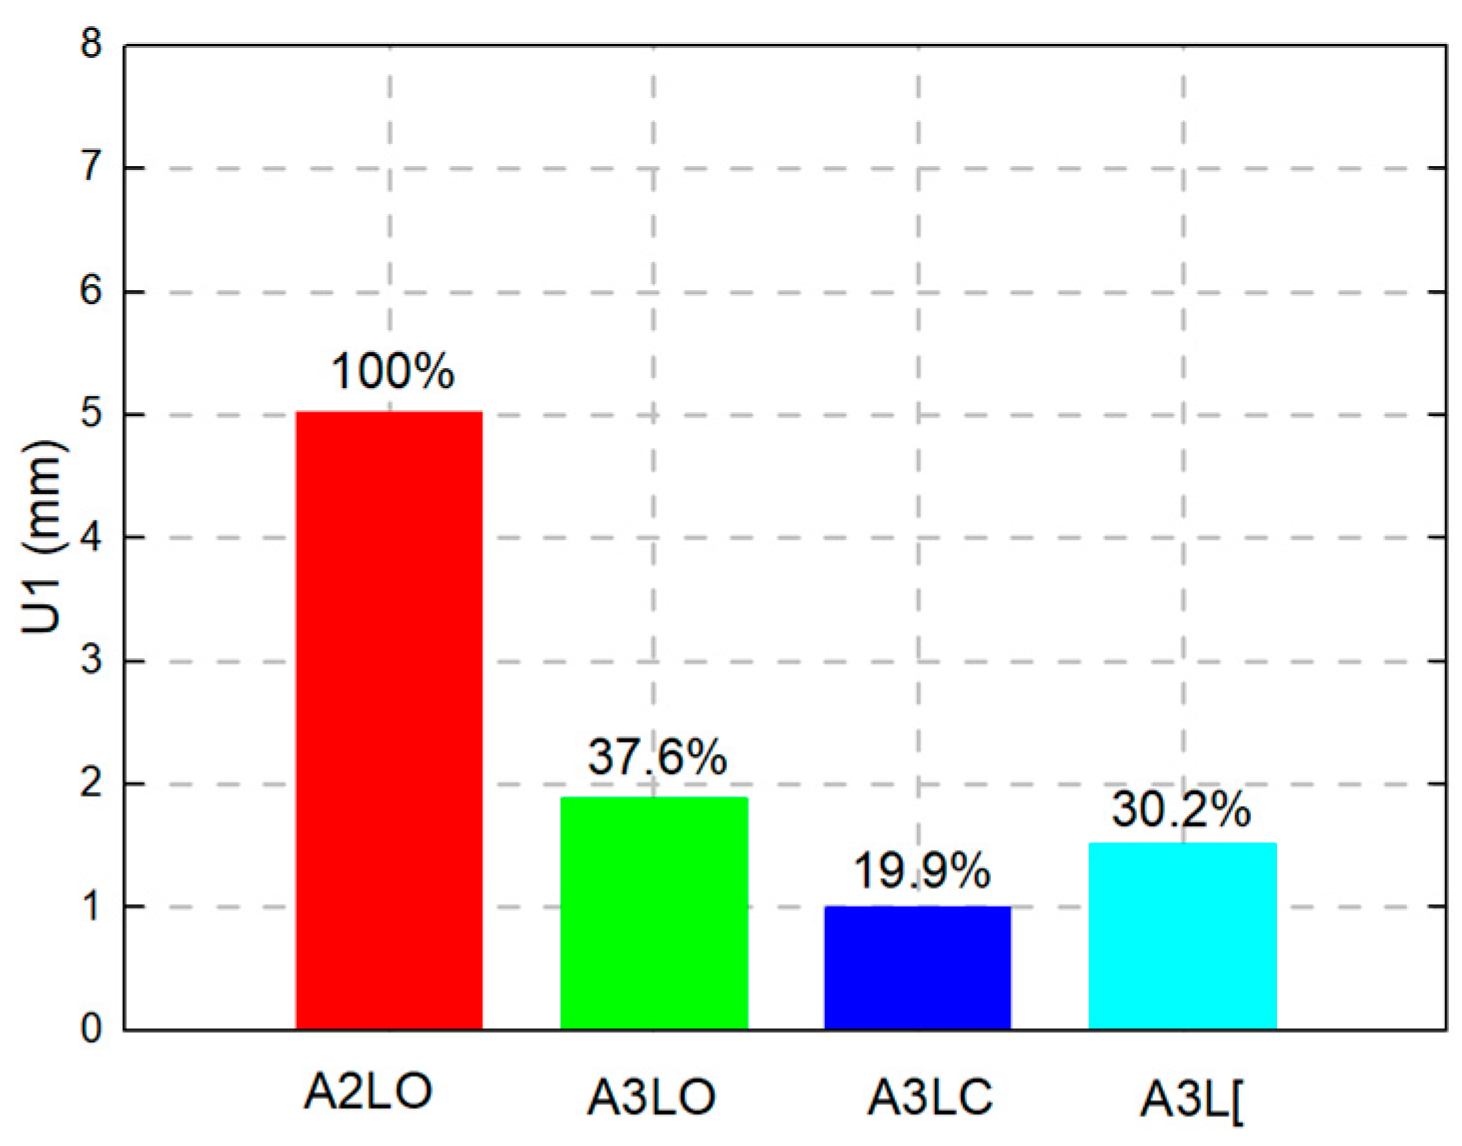
C-shaped and [-shaped braces were used to replace the end-flatted steel pipe braces, and the new finite element models were named A3LC and A3L[. During the modeling process, all other parameters remained identical to those of model A3LO. The calculation results are shown in Figure 17 and Figure 18. A comparison of the stress and deformation at the end of the braces for each model is presented in Figure 19.
As shown in Figure 17, Figure 18 and Figure 19, when three bolts were used to connect the purlin hangers, the deformation at the end of the braces in A3LO, A3LC, and A3L[ was significantly reduced, all exhibiting values less than 40% of that in A2LO. The deformation at the end of the brace in A3LC was the smallest, measuring only 1.00 mm, and less than 20% of that in A2LO. The deformation in A3L[ and A3LO was similar. While the [-shaped braces provided some stability, the C-shaped steel offered greater out-of-plane rigidity compared to the [-shaped brace. The stress at the end of the brace in A3LC is 57.6 MPa, only 43.4% of that in A3L[. The notched end is one of the factors that reduced the out-of-plane stiffness of the [-shaped brace, which is necessary for the installation. Compared to the flattened end of the circular steel pipe and the notched end of the channel steel, the C-shaped steel support is not only easier to construct but also safer and more reliable.

5. Conclusions

To investigate the causes of deformation in photovoltaic supports and ensure the safety and durability of photovoltaic structures, a detailed analysis was conducted on the loads borne by the supports and the joint connection forms. Using ABAQUS, the causes of damage in photovoltaic supports were analyzed, and the innovative joint connection of the purlin hanger and brace was proposed. The main conclusions are as follows:
(1)
Significant differences in wind load calculations for photovoltaic supports arise from variations in the partial coefficients and load action modes between different design codes. The maximum stress calculated using Chinese codes was less than 82% of that obtained with American codes and Eurocodes, indicating a less conservative approach.
(2)
The on-site damage observations and finite element analysis results both demonstrated that using two bolts to connect the beam and purlin at the purlin hanger position is unreliable. The node connection must be strengthened with at least three bolts recommended to secure the purlin hangers.
(3)
Thin-walled circular pipes used as braces for photovoltaic supports can lead to further deformation in the joint connection due to the reduced stiffness of their flattened ends when beam deformation occurs as a result of purlin hanger displacement. Z-shaped and Π-shaped purlin brackets are recommended for connecting beams and purlin, as they reduce purlin bracket deformation while preventing excessive stress in L-shaped purlin brackets. C-shaped steel is recommended for use as the support material, offering ease of construction and enhanced safety and reliability. The newly proposed joint connection results in minimal additional steel usage.

Author Contributions

Conceptualization, D.Z. and X.H.; methodology, J.L. and R.W.; software, D.Z.; validation, J.L.; formal analysis, R.W.; investigation, X.H.; resources, X.H.; data curation, J.L.; writing—original draft preparation, D.Z.; writing—review and editing, J.L.; visualization, R.W.; super-vision, X.H.; project administration, R.W.; funding acquisition, D.Z. All authors have read and agreed to the published version of the manuscript.

Funding

This study was supported by the Youth Research Fund of China Academy of Building Research (Grant Number: 20220112331030029).

Institutional Review Board Statement

Not applicable.

Informed Consent Statement

Not applicable.

Data Availability Statement

The data that support the findings of this study are not publicly available but can be made available on request from the corresponding author.

Acknowledgments

The author expresses sincere gratitude to the China Academy of Building Research for its invaluable support throughout this study. We are particularly thankful for the provision of the research objectives, venues, and funding, all of which are very important for our research.

Conflicts of Interest

Authors Deli Zhang and Xuanming Huang were employed by the company China Academy of Building Research Co., Ltd. Author Ruwei Wang was employed by the company CABR Testing Center Co., Ltd. Author Juan Liu was employed by the company China Institute of Building Standard Design & Research. All the authors declare that the research was conducted in the absence of any commercial or financial relationships that could be construed as a potential conflict of interest.

References

  1. Chen, T.Y.; Tian, Y.J.; Zhang, Z.M.; Yu, J.Q. Study on the Coupling and Coordination Relationship Between Urban Living Environment and Economic Development. Buildings 2024, 14, 3914. [Google Scholar] [CrossRef]
  2. Damiri, D.J.; Legino, S.; Amboro, S. Engineering design development of 52,5 KiloWatt peak solar photovoltaic system for industrial Rooftop building. In Proceedings of the 4th Annual Applied Science and Engineering Conference, Bali, Indonesia, 24 April 2019; Volume 1402, p. 033087. [Google Scholar] [CrossRef]
  3. Song, D.D.; Pei, H.T.; Liu, Y.W.; Wei, H.Y.; Yang, S.F.; Hu, S.G. Review on Legislative System of Photovoltaic Industry Development in China. Energies 2022, 15, 306. [Google Scholar] [CrossRef]
  4. Jia, Y.T.; Alva, G.; Fang, G.Y. Development and applications of photovoltaic–thermal systems: A review. Renew. Sustain. Energy Rev. 2019, 102, 249–265. [Google Scholar] [CrossRef]
  5. Mostakim, K.; Hasanuzzaman, M. Global prospects, challenges and progress of photovoltaic thermal system. Sustain. Energy Technol. Assess. 2022, 53, 102426. [Google Scholar] [CrossRef]
  6. Eum, J.; Choi, H.J. Analysis of Power Enhancement in Facade-BIPV Systems Through Module-Level Power Optimizer: Evaluating Performance Under Shading Conditions. Buildings 2024, 14, 3850. [Google Scholar] [CrossRef]
  7. Ni, S.Y.; Zhu, N.; Zhang, Z.Y.; Hou, Y.Z.; Li, S.Q. The operational performance of net zero energy wooden structure building in the severe cold zone: A case study in Hailar of China. Energy Build. 2022, 257, 111788. [Google Scholar] [CrossRef]
  8. Weaver, J. World Has Installed 1TW of Solar Capacity, pv Magazine USA. 2022. Available online: https://www.pv-magazine.com/2022/03/15/humans-have-installed-1-terawatt-of-solar-capacity/ (accessed on 1 March 2022).
  9. IRENA. World Energy Transition Outlook: 1.5 °C Pathway; International Renewable Energy Agency: Abu Dhabi, United Arab Emirates, 2021. [Google Scholar]
  10. He, X.H.; Ding, H.; Jing, H.Q.; Wu, X.P.; Wu, X.J. Mechanical characteristics of a new type of cable-supported photovoltaic module system. Sol. Energy 2021, 226, 408–420. [Google Scholar] [CrossRef]
  11. He, X.H.; Ding, H.; Jing, H.Q.; Zhang, F.; Wu, X.P.; Wu, X.J. Wind-induced vibration and its suppression of photovoltaic modules supported by suspension cables. J. Wind. Eng. Ind. Aerodyn. 2020, 206, 104275. [Google Scholar] [CrossRef]
  12. Wang, X.X.; Ji, G.J.; Gu, H.; Lv, S.S.; Ni, H.J.; Wang, P.; Chen, K.; Meng, Y. Research and Design of Fixed Photovoltaic Support Structure Based on SAP2000. In Proceedings of the 2nd International Conference on Mechanical, Aeronautical and Automotive Engineering, Singapore, 24–26 February 2018; EDP Sciences: Les Ulis, France, 2018; Volume 166, p. 03002. [Google Scholar] [CrossRef]
  13. Zhang, C.X.; Shen, C.; Wei, S.; Wang, Y.; Lv, G.Q.; Sun, C. A Review on Recent Development of Cooling Technologies for Photovoltaic Modules. J. Therm. Sci. 2020, 29, 1410–1430. [Google Scholar] [CrossRef]
  14. Giorges, A.G.; Amador, G.J.; Goodman, J. Numerical Study of Wind Loads on Residential Roof-Mounted Solar Photovoltaic Arrays. In Proceedings of the ASME 2014 International Mechanical Engineering Congress and Exposition, Montreal, QC, Canada, 14–20 November 2014; American Society of Mechanical Engineers: New York, NY, USA, 2015; Volume V06BT07A040. [Google Scholar] [CrossRef]
  15. Shi, M.; Lu, X.; Jiang, H.Y.; Mu, Q.; Chen, S. Opportunity of rooftop solar photovoltaic as a cost-effective and environment-friendly power source in megacities. iScience 2022, 25, 104890. [Google Scholar] [CrossRef]
  16. Meglio, E.; Formisano, A. Seismic Design and Analysis of a Cold-Formed Steel Exoskeleton for the Retrofit of an RC Multi-Story Residential Building. Appl. Sci. 2024, 14, 8674. [Google Scholar] [CrossRef]
  17. Jiang, S.X.; Wang, Y.Z.; Yan, X. Analysis of the differences in the structural design of PV supports in Chinese code, American code and European code. Build. Struct. 2020, 50, 699–703. [Google Scholar] [CrossRef]
  18. Li, M.G.; Tan, Y.J.; Liu, Y.L. Comparative study of ASCE7-10 and Chinese standards in photovoltaic (PV) mounting system design. Eng. J. Wuhan Univ. 2022, 55, 90–94. [Google Scholar]
  19. ASCE/SEI7-10; Minimum Design Loads for Buildings and Other Structures. American Society of Civil Engineers: Reston, VA, USA, 2010.
  20. AISI-S100-16; North American Specification for the Design of Cold-Formed Steel Structural Members. American Iron and Steel Institute: Washington, DC, USA, 2016.
  21. BS EN 1991-1-4; Eurocode1: Actions on Structures, Part1–4 General Actions, Wind Actions. European Committee for Standardization: Brussels, Belgium, 2005.
  22. BS EN 1993-1-1; Eurocode 3: Design of Steel Structures-Part 1-1. European Committee for Standardization: Brussels, Belgium, 2005.
  23. GB 50009-2012; Load Code for the Design of Building Structures. Ministry of Housing and Urban-Rural Construction of the People’s Republic of China: Beijing, China, 2012.
  24. GB 50017-2017; Standard for Design of Steel Structures. Ministry of Housing and Urban-Rural Construction of the People’s Republic of China: Beijing, China, 2017.
  25. Wittwer, A.R.; Podestá, J.M.; Castro, H.J.; Mroginski, J.L. Wind loading and its effects on photovoltaic modules: An experimental–Computational study to assess the stress on structures. Sol. Energy 2022, 240, 315–328. [Google Scholar] [CrossRef]
  26. Ferreira, L.G.G.B.; Alves, A.J.; Domingos, J.L. Analysis of Wind Loading on Photovoltaic Panels Mounting Brackets. In Proceedings of the International Conference on Environment and Electrical Engineering, Palermo, Italy, 12–15 June 2018. [Google Scholar] [CrossRef]
  27. Qu, Z.; Jiang, C.; Wang, Y.X.; Wang, R.; Zhao, Y.; Yang, S.C. China’s Photovoltaic Development and Its Spillover Effects on Carbon Footprint at Cross-Regional Scale: Insights from the Largest Photovoltaic Industry in Northwest Arid Area. Sustainability 2024, 16, 9922. [Google Scholar] [CrossRef]
  28. Ding, H.; He, X.H.; Jing, H.Q.; Wu, X.P.; Wu, X.J. Design Method of Primary Structures of a Cost-Effective Cable-Supported Photovoltaic System. Appl. Sci. 2023, 13, 2968. [Google Scholar] [CrossRef]
  29. Huang, W.S.; Lu, H.Q.; Peng, X.F. Research on optimized design of structure of photovoltaic supporting support. Eng. J. Wuhan Univ. 2018, 51, 72–76. [Google Scholar]
  30. Udell, M.; Toole, O. Optimal Design of Efficient Rooftop Photovoltaic Arrays. INFORMS J. Appl. Anal. 2019, 49, 281–294. [Google Scholar] [CrossRef]
  31. Tan, V.; Deng, R.; Egan, R. Solar photovoltaic waste and resource potential projections in Australia, 2022–2050. Resour. Conserv. Recycl. 2024, 202, 107316. [Google Scholar] [CrossRef]
  32. NB/T 10115-2018; Code for Design of Photovoltaic Modules Support Structures. National Energy Administration: Beijing, China, 2018.
  33. Aly, A.M. On the evaluation of wind loads on solar panels: The scale issue. Sol. Energy 2016, 135, 423–434. [Google Scholar] [CrossRef]
  34. Tamura, Y.; Chen, B.; Wu, Y.; Su, N.; Yang, Q.S. Classification of equivalent static wind loads: Comparisons and applications. Reliab. Eng. Syst. 2024, 251, 110403. [Google Scholar] [CrossRef]
  35. GB 50010-2010; Code for Design of Concrete Structures. Ministry of Housing and Urban-Rural Construction of the People’s Republic of China: Beijing, China, 2011.
  36. Nadeem, G.; Safiee, N.A.; Bakar, N.A.; Karim, I.A.; Nasir, N.A.M. Finite Element Analysis of the Stability of a Sinusoidal Web in Steel and Composite Steel-Concrete Girders. Appl. Sci. 2021, 11, 9277. [Google Scholar] [CrossRef]
  37. Śledziewski, K.; Górecki, M. Finite element analysis of the stability of a sinusoidal web in steel and composite steel-concrete girders. Materials 2020, 13, 1041. [Google Scholar] [CrossRef] [PubMed]
Figure 1. Development modes of photovoltaic industry. (a) Fishery and photovoltaic complementation. (b) Agriculture and photovoltaic complementation. (c) Forestry and photovoltaic complementation. (d) Building and photovoltaic complementation.
Applsci 15 03174 g001
Figure 2. Photos of photovoltaic support damage.
Applsci 15 03174 g002
Figure 3. Schematic diagram of photovoltaic support.
Applsci 15 03174 g003
Figure 4. Photovoltaic support component connection types.
Applsci 15 03174 g004
Figure 5. Photos of typical support damage. (a) Bending occurs at the upper end of the brace. (b) Bending occurs at the lower end of the brace. (c) The surface of the photovoltaic panel is uneven. (d) Two bolts used at the purlin hanger to connect the purlin and beam. (e) Three bolts used at the purlin hanger to connect the purlin and beam.
Applsci 15 03174 g005
Figure 6. Three-dimensional computational model developed in SAP2000.
Applsci 15 03174 g006
Figure 7. Schematic diagram of joint connections.
Applsci 15 03174 g007
Figure 8. FEA model established using ABAQUS.
Applsci 15 03174 g008
Figure 9. Analysis results for A2LO.
Applsci 15 03174 g009
Figure 10. Analysis results for A3LO.
Applsci 15 03174 g010
Figure 11. Deformation at the joints of the support.
Applsci 15 03174 g011aApplsci 15 03174 g011b
Figure 12. Deformation diagram. (a) One bolt used at the purlin hanger to connect the purlin and beam. (b) Two bolts used at the purlin hanger to connect the purlin and beam. (c) End of steel pipe was flattened.
Applsci 15 03174 g012
Figure 13. Innovative purlin hanger connection design.
Applsci 15 03174 g013
Figure 14. Analysis results for A3ZO.
Applsci 15 03174 g014
Figure 15. Analysis results for A3ΠO.
Applsci 15 03174 g015
Figure 16. Innovative connection design for the brace and beam.
Applsci 15 03174 g016
Figure 17. Analysis results for A3LC.
Applsci 15 03174 g017
Figure 18. Analysis results for A3L[.
Applsci 15 03174 g018
Figure 19. Comparison of deformation of different models.
Applsci 15 03174 g019
Table 1. Calculation results of wind load according to different codes.
Chinese CodeAmerican CodeEurocode
Applsci 15 03174 i001Applsci 15 03174 i002Applsci 15 03174 i003
q1 = −0.29 kN/m2(Case A: Q1 = −0.36 kN/m2, q1 = −0.52 kN/m2)
(Case A: Q2 = 0.52 kN/m2, q2 = 0.64 kN/m2)
q1 = −0.61 kN/m2
q2 = 0.24 kN/m2(Case B: Q1 = −0.76 kN/m2, q1 = 0 kN/m2)
(Case B: Q2 = 0.72 kN/m2, q2 = 0.24 kN/m2)
q2 = 0.43 kN/m2
Table 2. Design snow load according to different codes.
CodeReference Snow PressureExposure CoefficientThermal FactorShape FactorCharacteristic Value
Chinese code0.4 kN/m2//1.00.40 kN/m2
American code0.4 kN/m20.81.21.00.27 kN/m2
European code0.4 kN/m21.01.00.80.32 kN/m2
Table 3. Calculation results for different codes.
ModelChinese CodesAmerican CodesEurocodes
Stress (MPa)Deformation (mm)Stress (MPa)Deformation (mm)Stress
(MPa)
Deformation (mm)
Array A 329.3−11.53401.5−12.75421.6−13.29
Array B 275.1−7.82348.2−8.54382.5−9.28
Table 4. Analysis results for stress and deformation.
ModelStress (MPa)Ratio of StressU1 (mm)Ratio of U1
A2LO359.4111.421
A3LO351.00.981.920.17
A3ZO283.80.791.710.15
A3ΠO258.80.721.030.09
Table 5. Comparison of steel consumption for different types of purlin hangers.
Type of Purlin HangerSteel Consumption of One Purlin HangerRatio of One Purlin HangerSteel Consumption of Array ARatio of Array A
L-shaped0.324 kg1482.372 kg1
Z-shaped0.418 kg1.29485.004 kg1.005
Π-shaped0.742 kg2.29494.076 kg1.024
Disclaimer/Publisher’s Note: The statements, opinions and data contained in all publications are solely those of the individual author(s) and contributor(s) and not of MDPI and/or the editor(s). MDPI and/or the editor(s) disclaim responsibility for any injury to people or property resulting from any ideas, methods, instructions or products referred to in the content.