
Safety Performance Evaluation of Ultra-High-Performance Concrete Semi-Assembled Barrier

Abstract
1. Introduction
2. Structural Characteristics of Barrier
3. Collision Simulation System
3.1. Finite Element Modeling of Barrier
3.2. Introduction of the HJC Constitutive Model
- Basic physical parameters: , T, G, K
- 2.
- Strength parameters: A, B, N, C, SFmax
- 3.
- Equation of State (EOS) parameters: Pcrush, μcrush, Plock, μlock, K1, K2, and K3
- 4.
- Damage parameters: D1, D2, EFMIN
3.3. Vehicle Finite Element Modeling
3.4. Collision System Settings
4. Full-Scale Collision Test
5. Analysis of the Crash Simulation Results
5.1. Impact Force
- FXmax—Maximum lateral force acting on the barrier by a vehicle (kN);
- m—Mass of vehicle (kg);
- v1—Velocity of vehicle (m/s);
- θ—Collision angle of vehicle (°);
- C—Distance of the vehicle’s center of gravity from the front bumper (m);
- b—Half of the vehicle width (m);
- D—Maximum lateral dynamic deformation value of the barrier (m), D = 0 for concrete barrier.
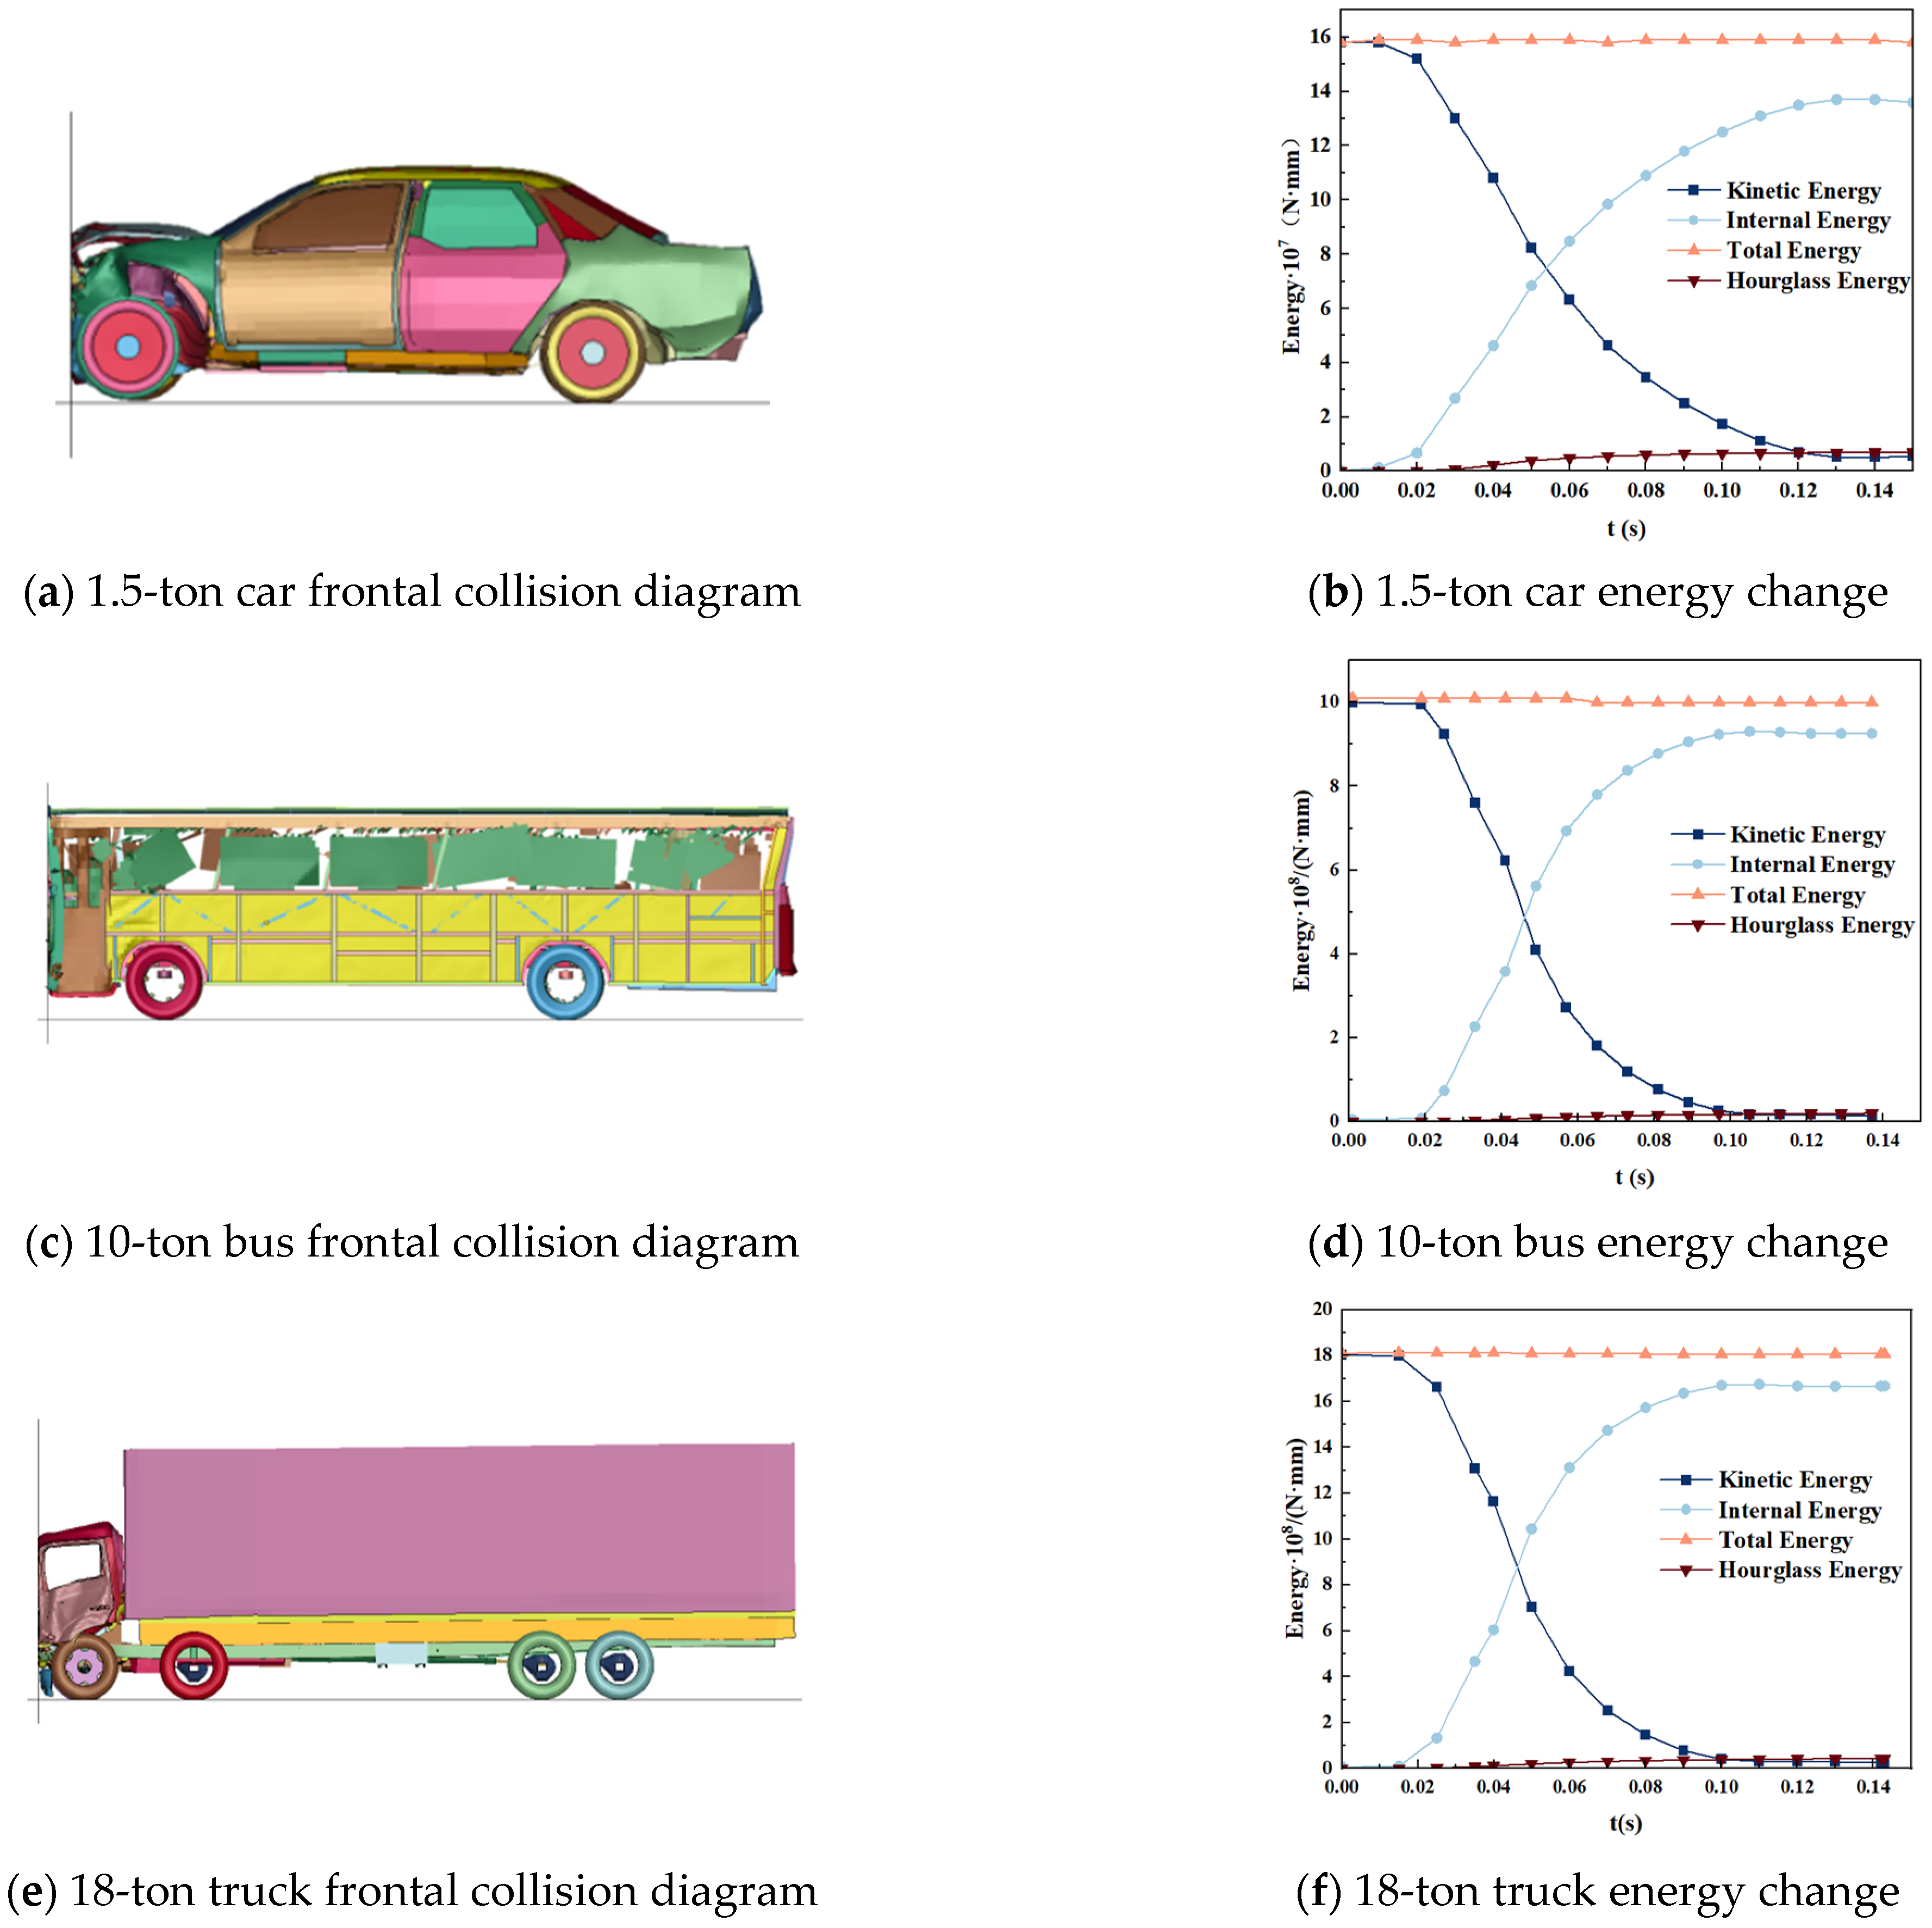
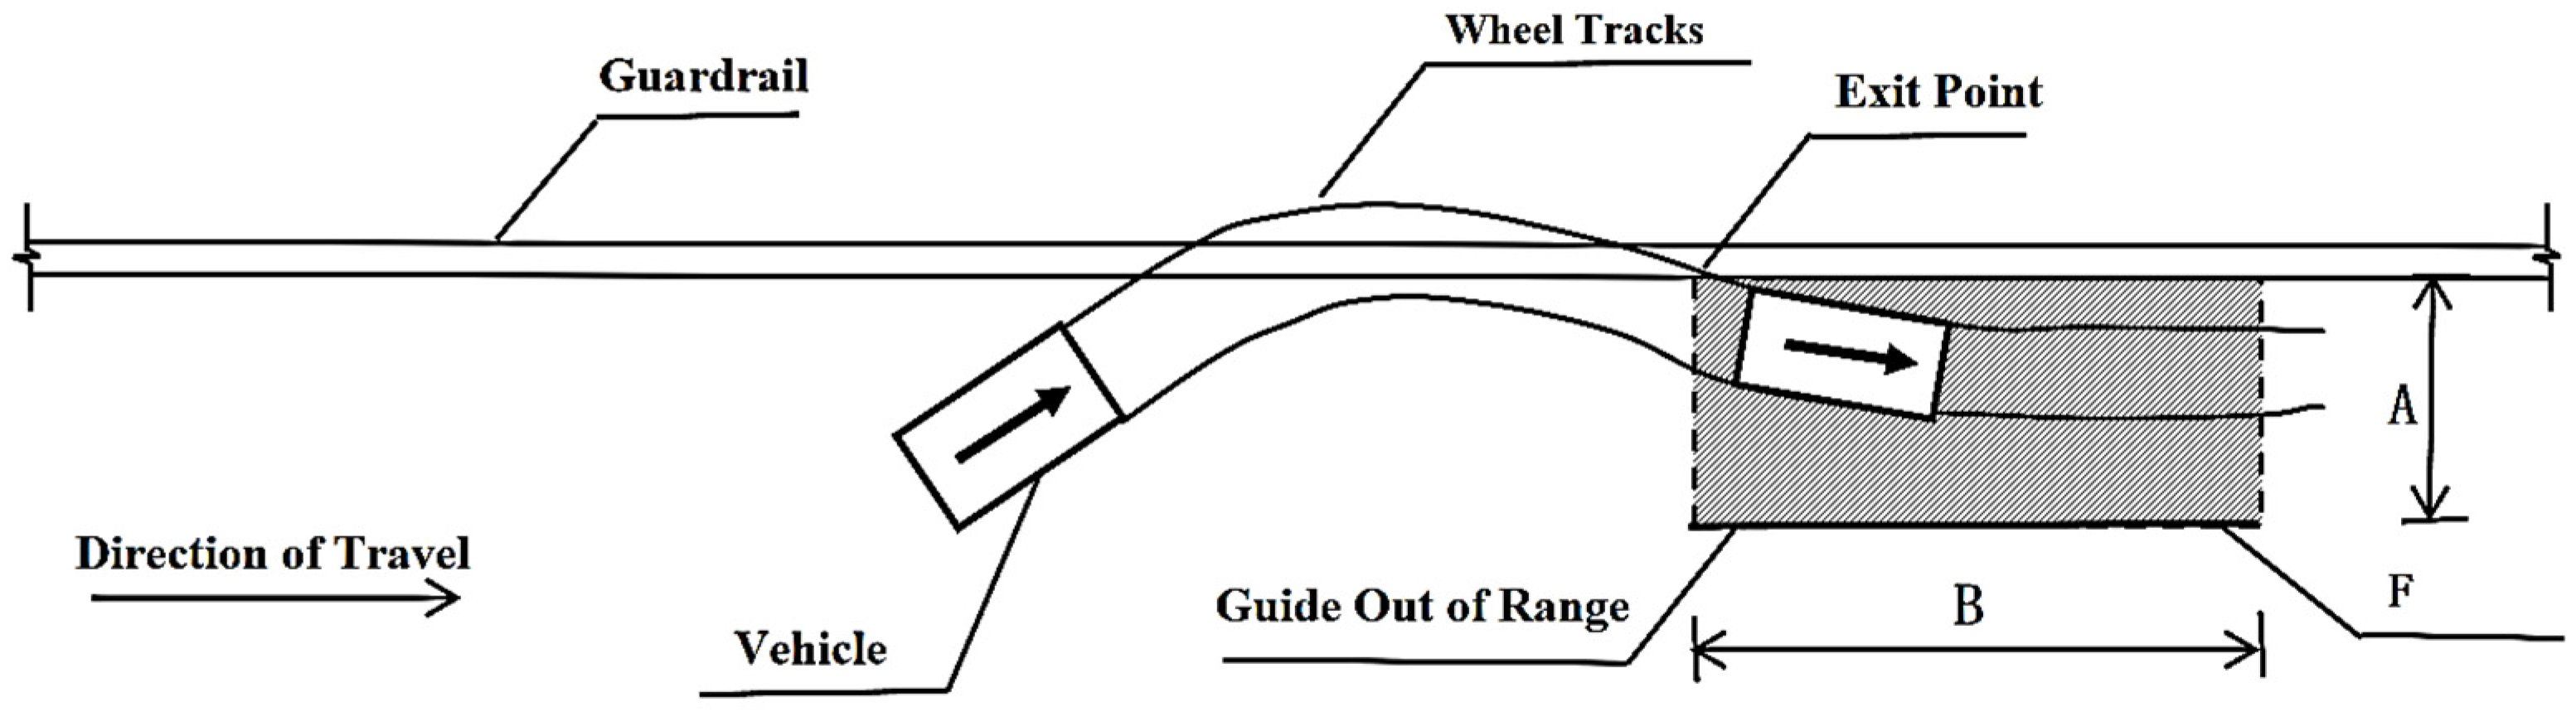
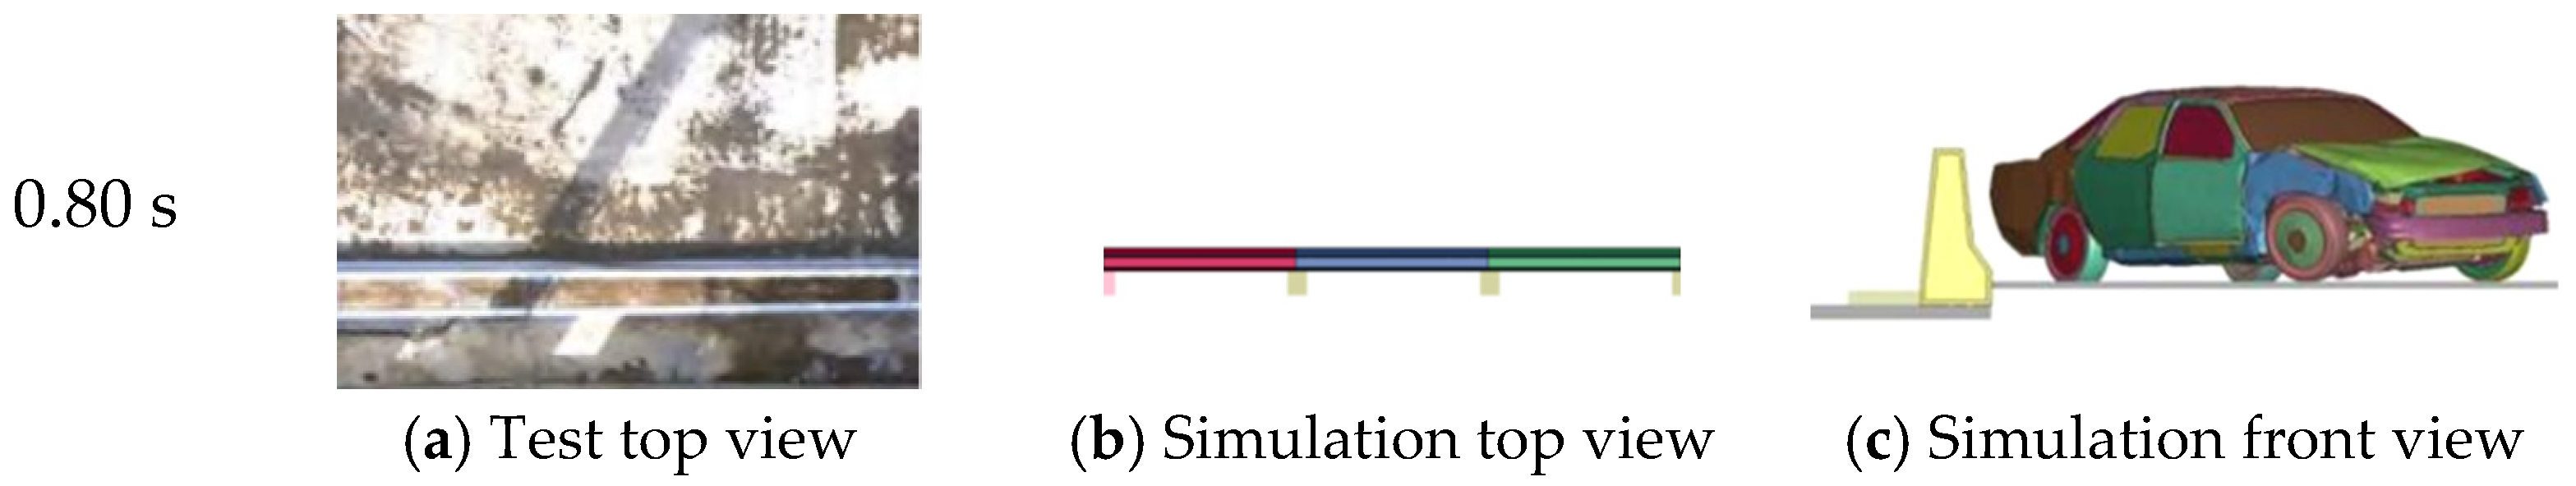
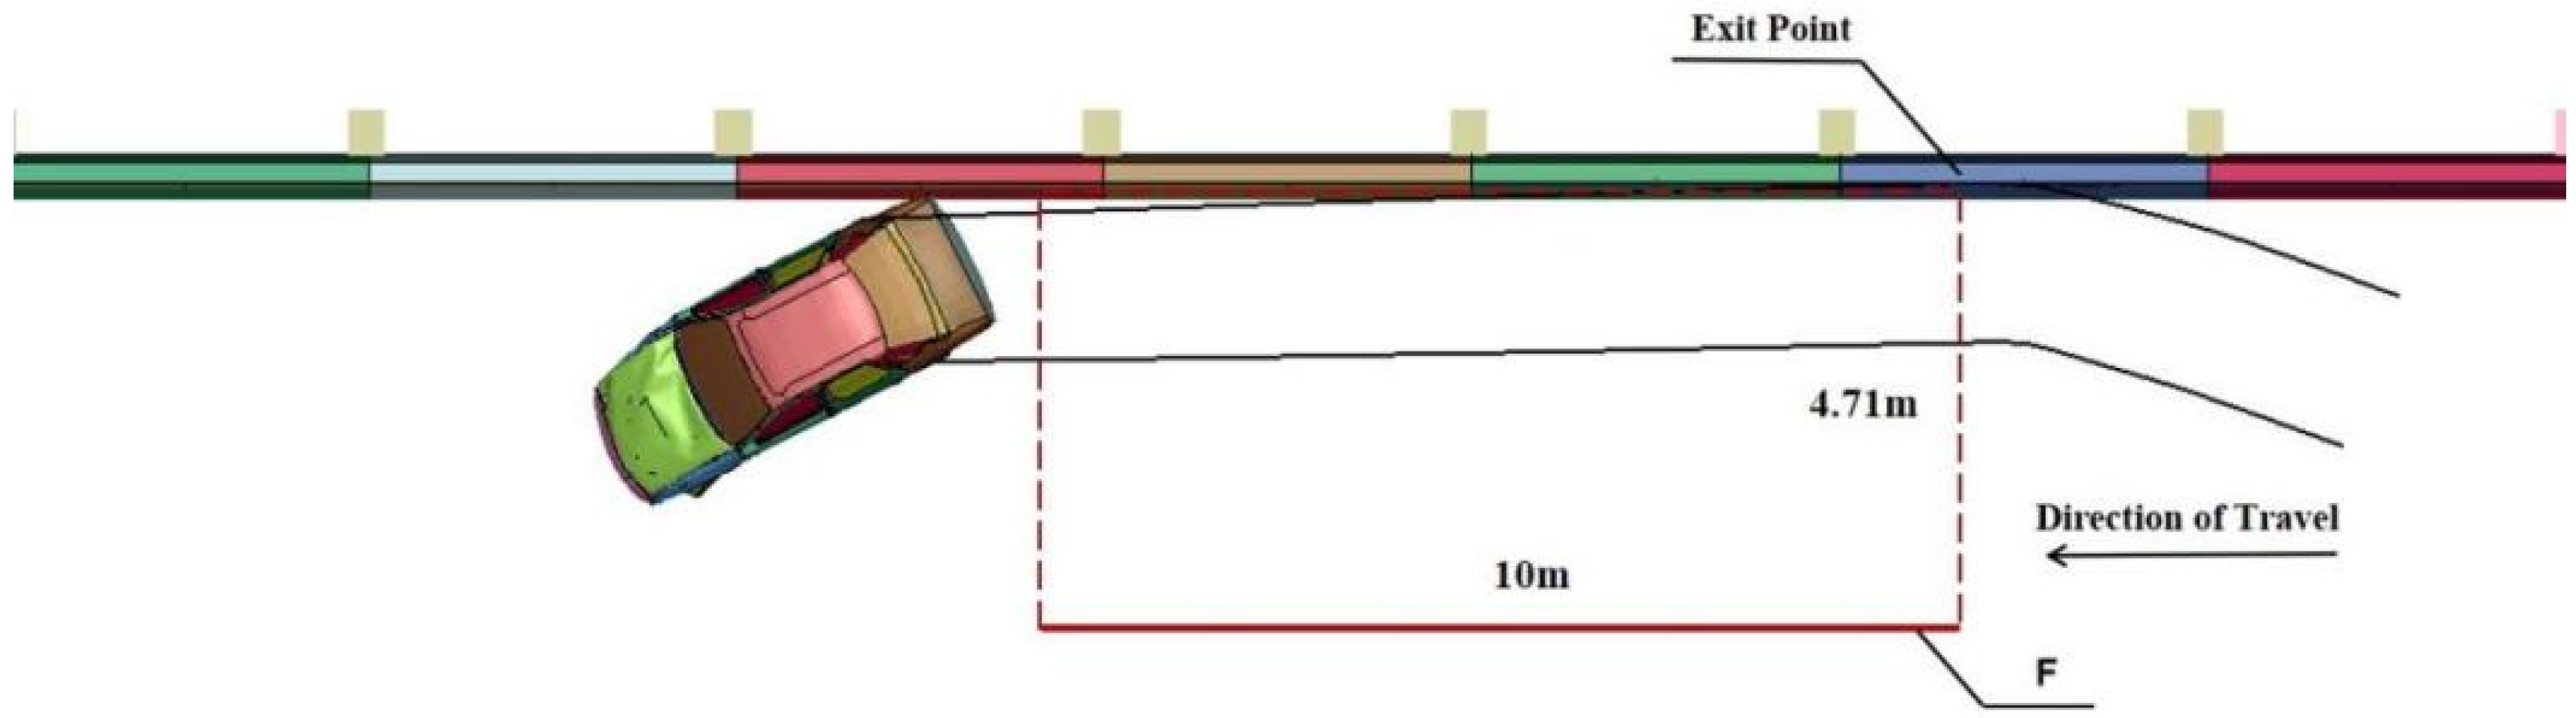
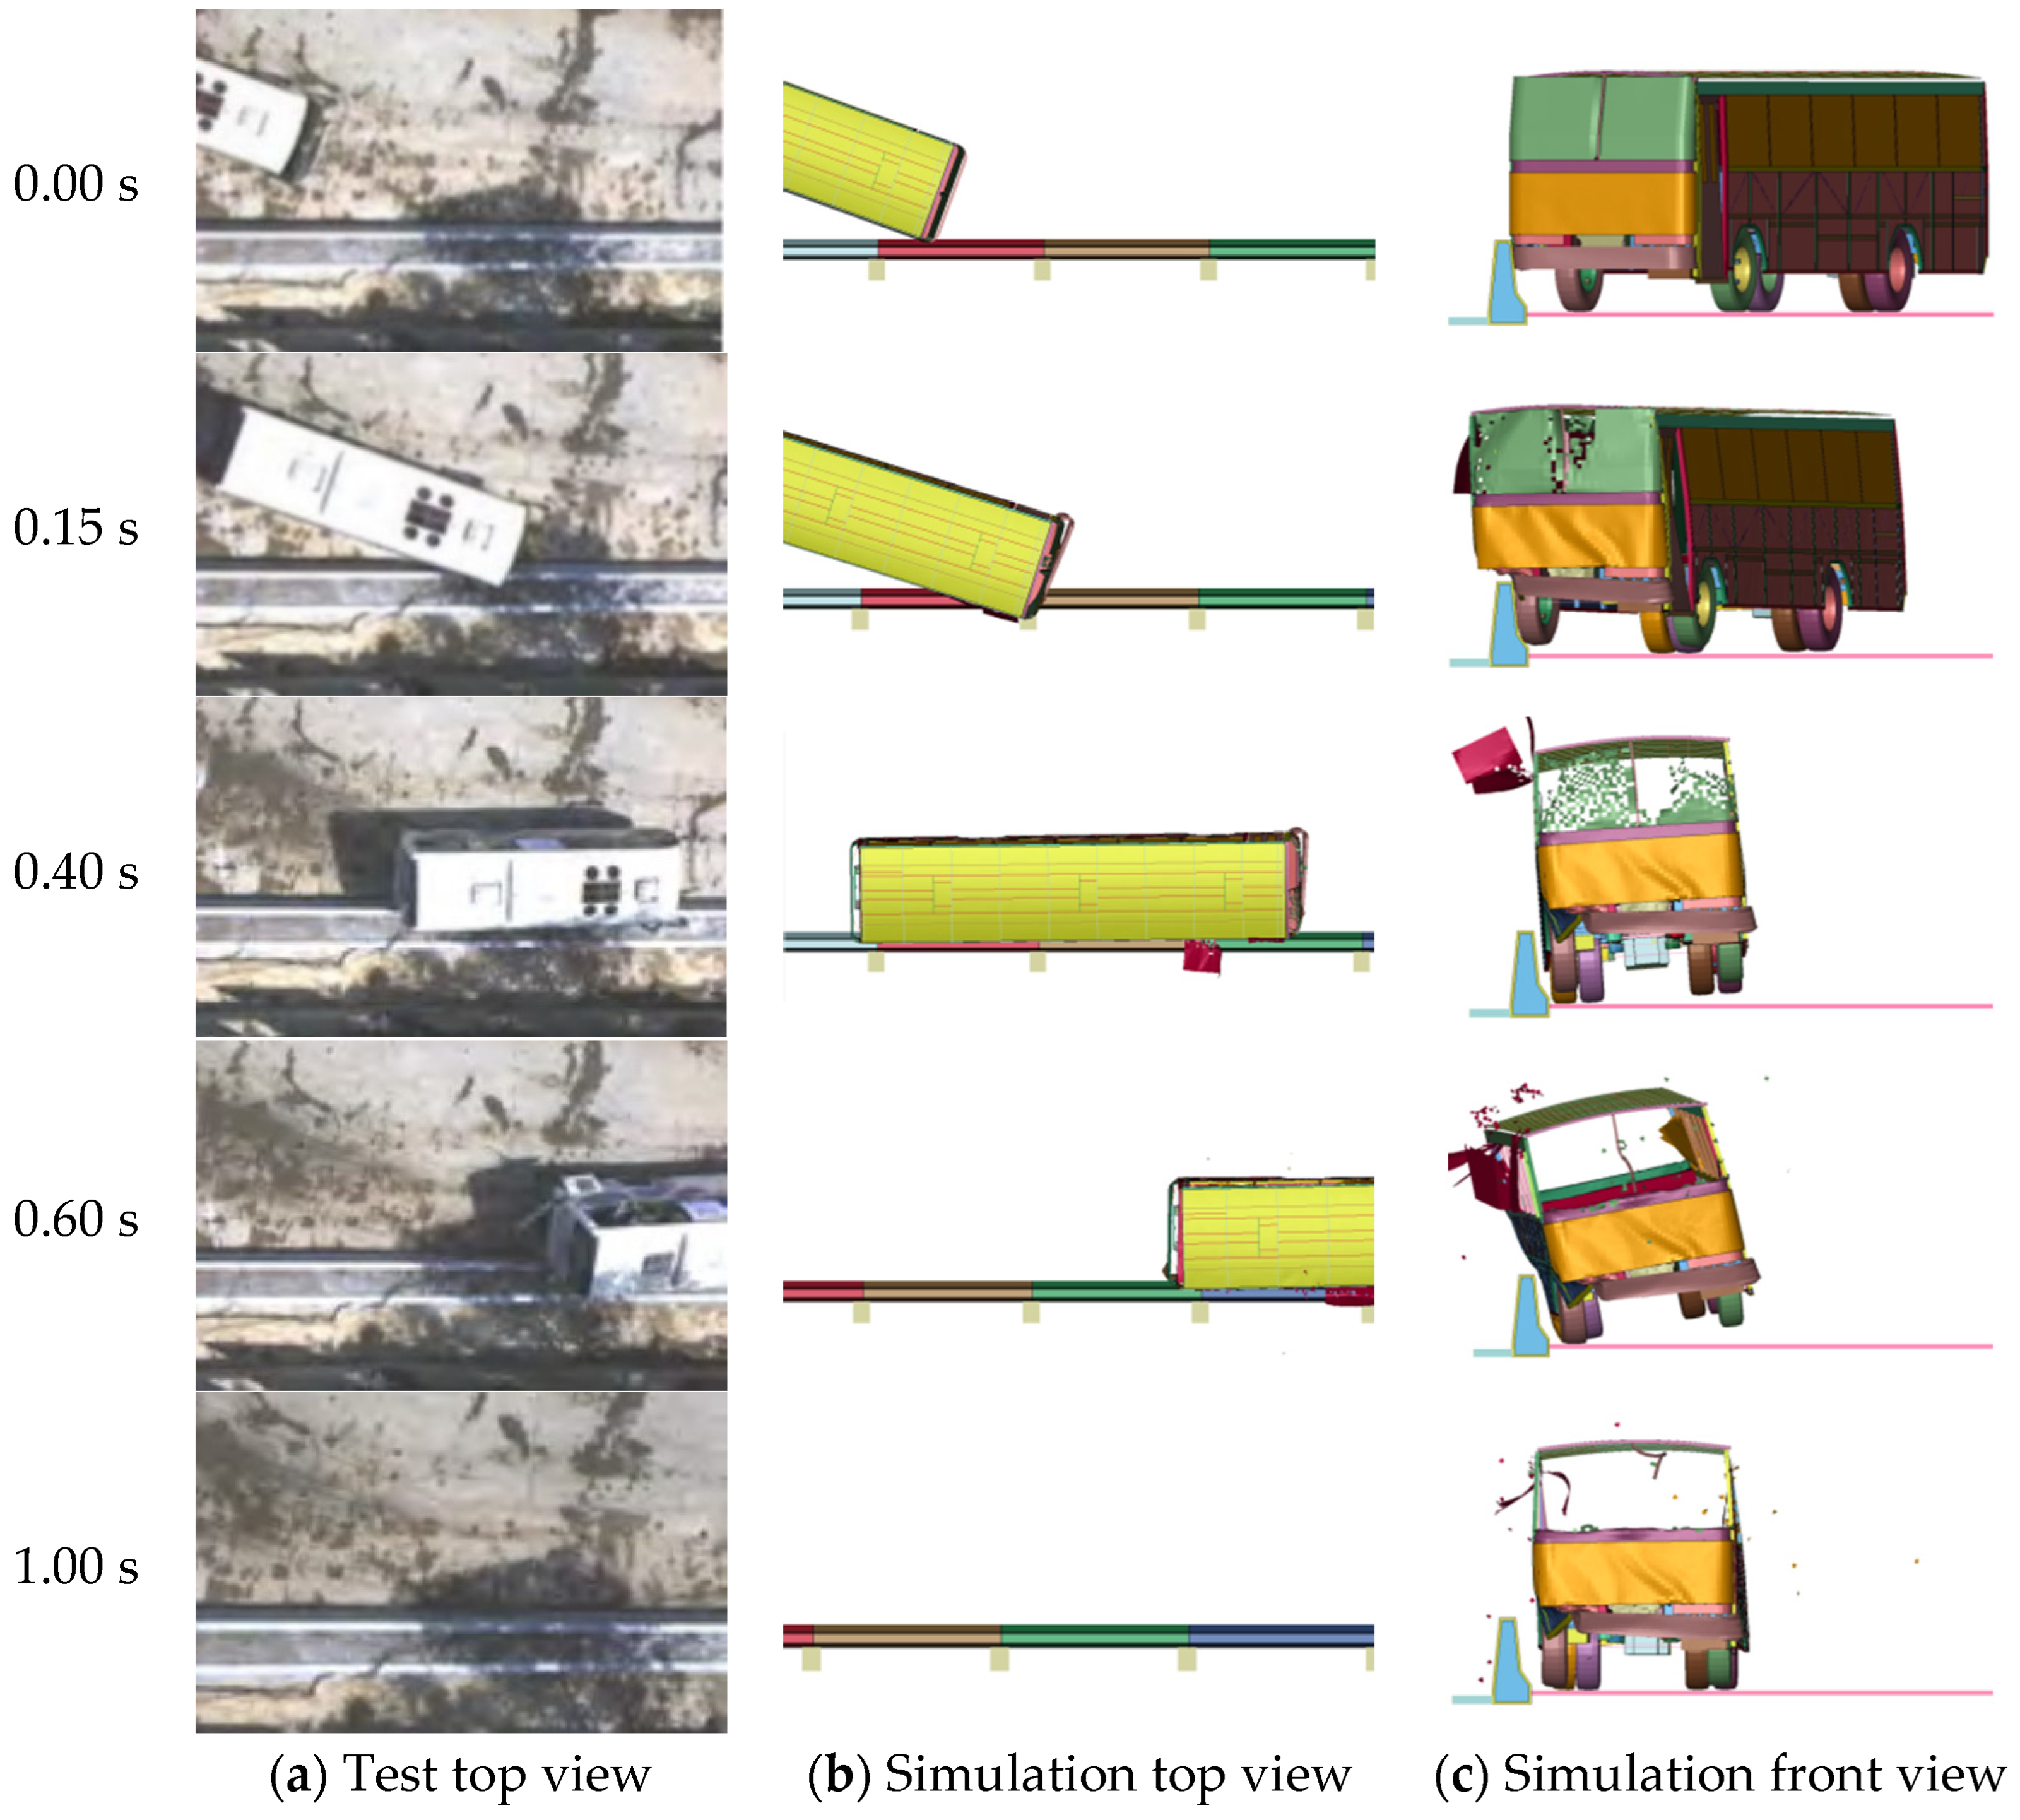
5.2. Barrier Guiding Ability
- A 1.5-ton car
- 2.
- A 10-ton medium bus
- 3.
- An 18-t truck
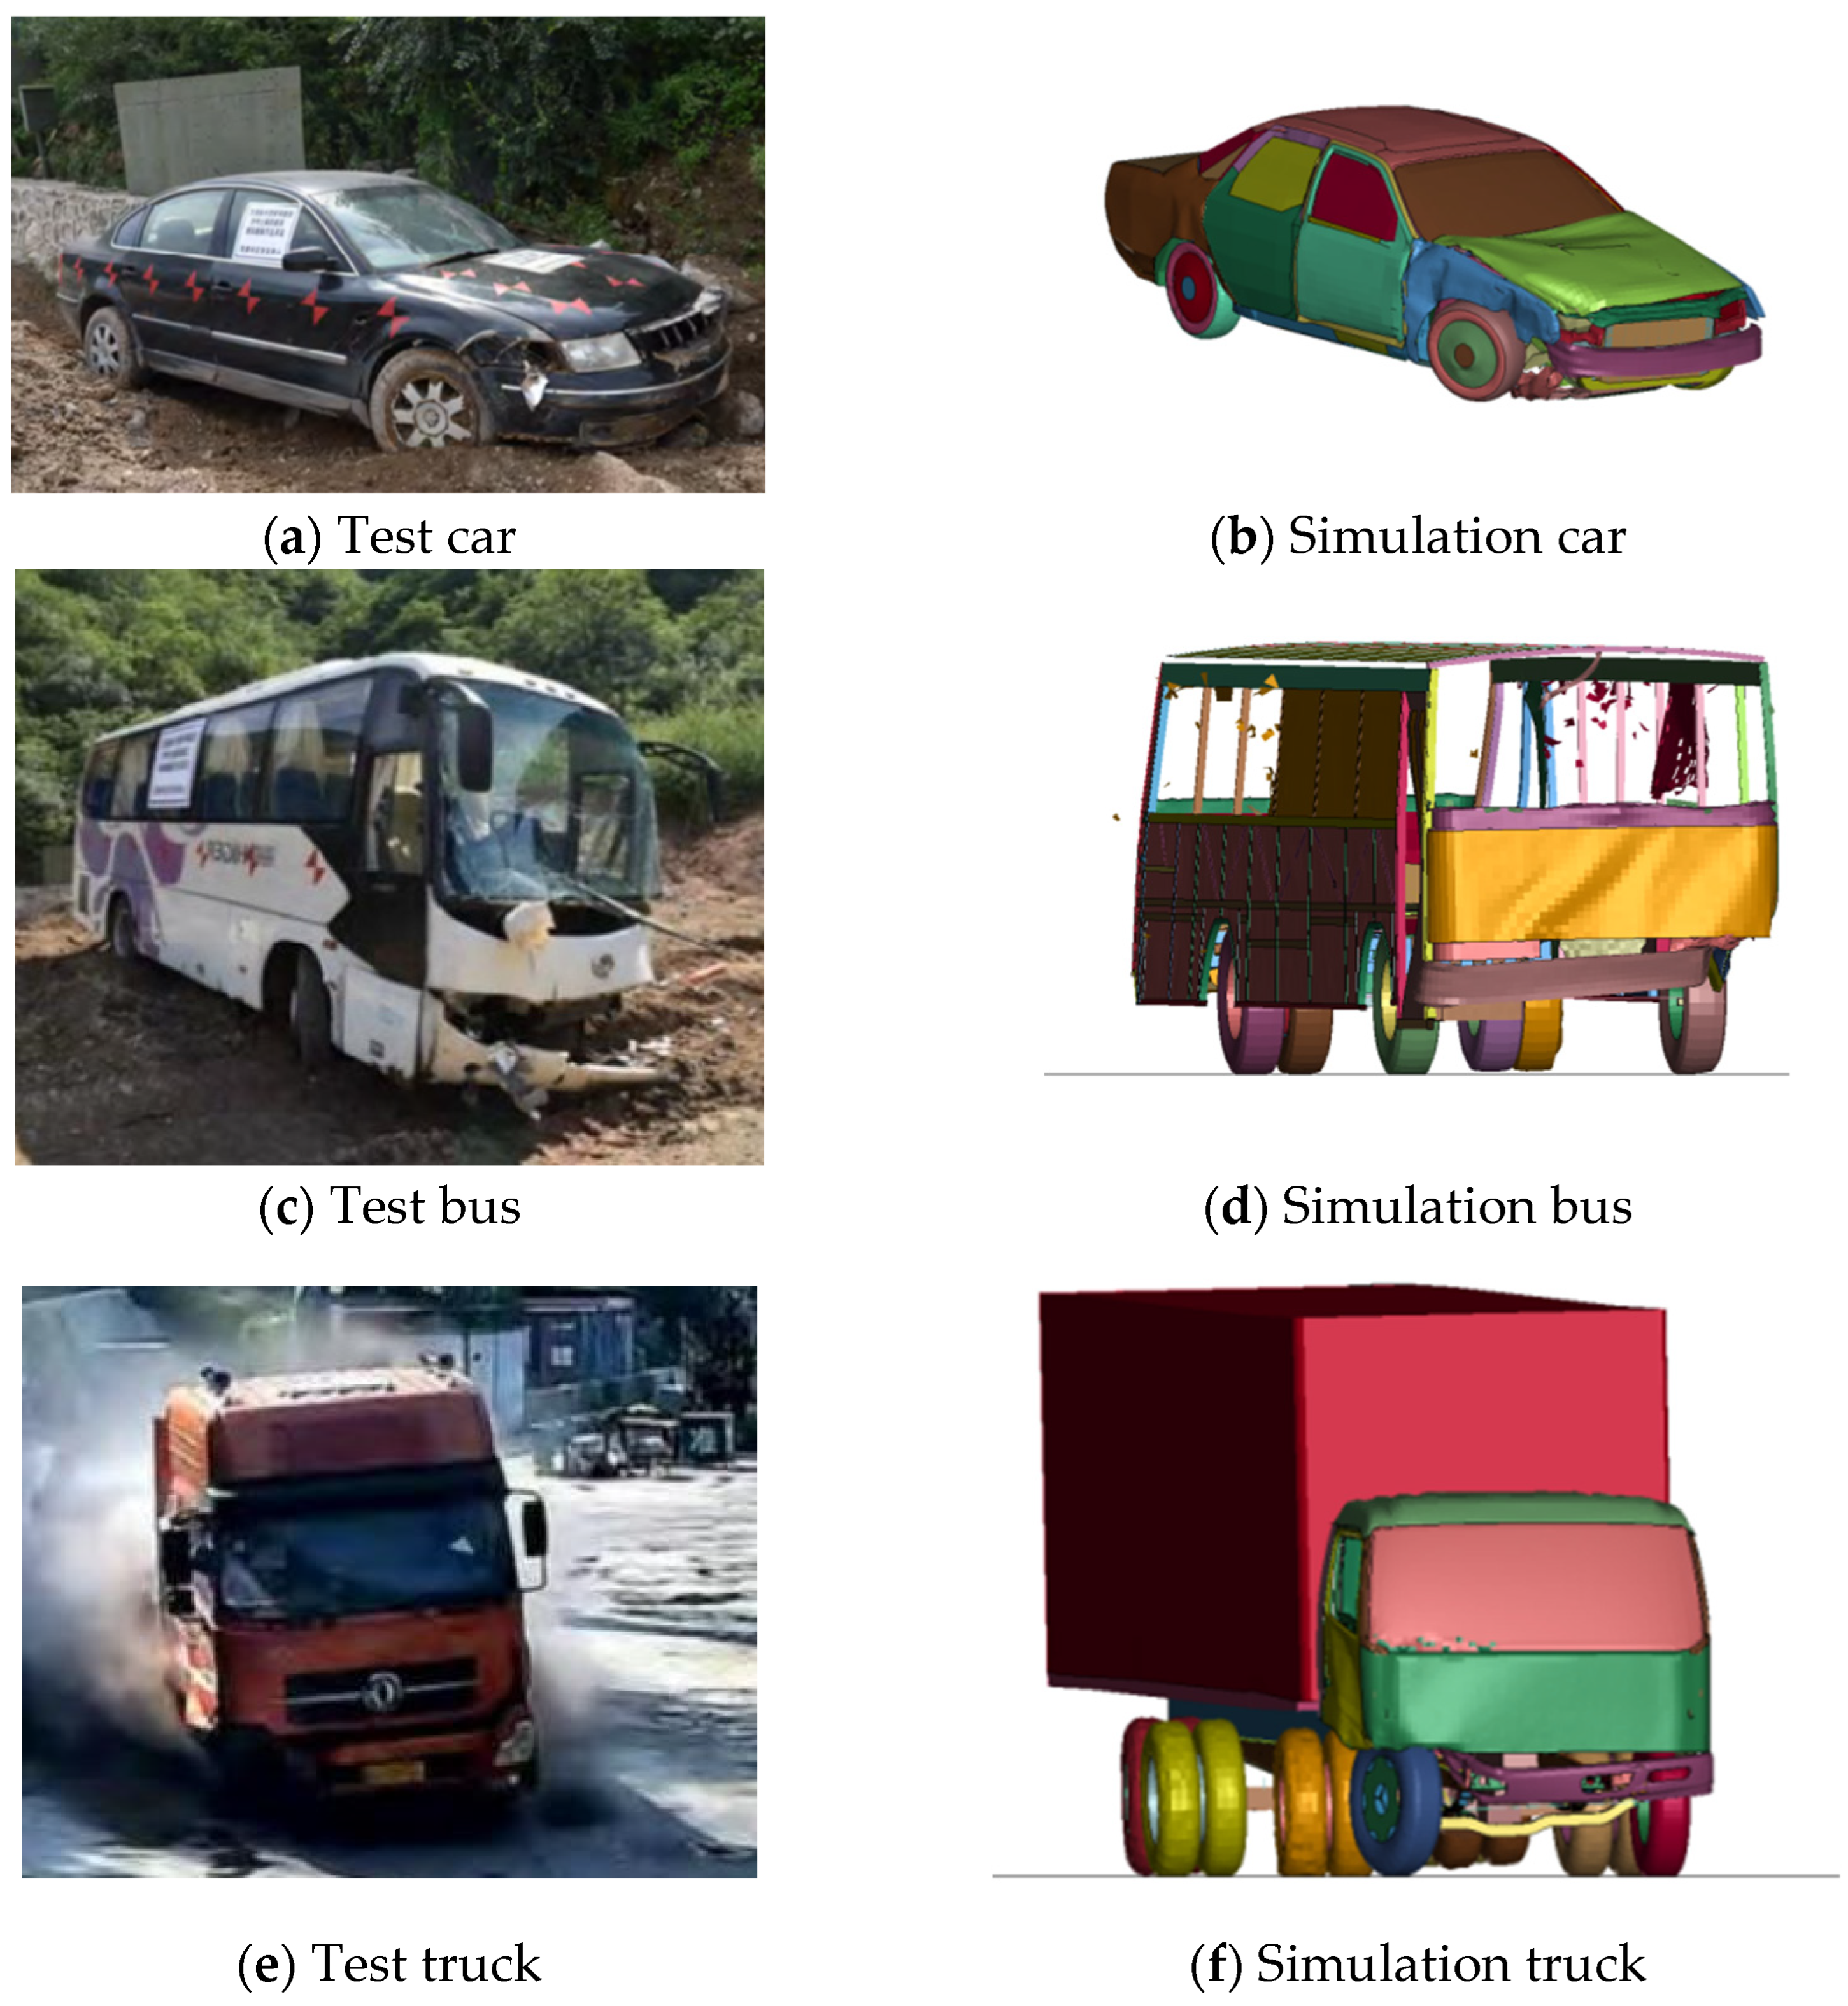
5.3. Vehicle Damage
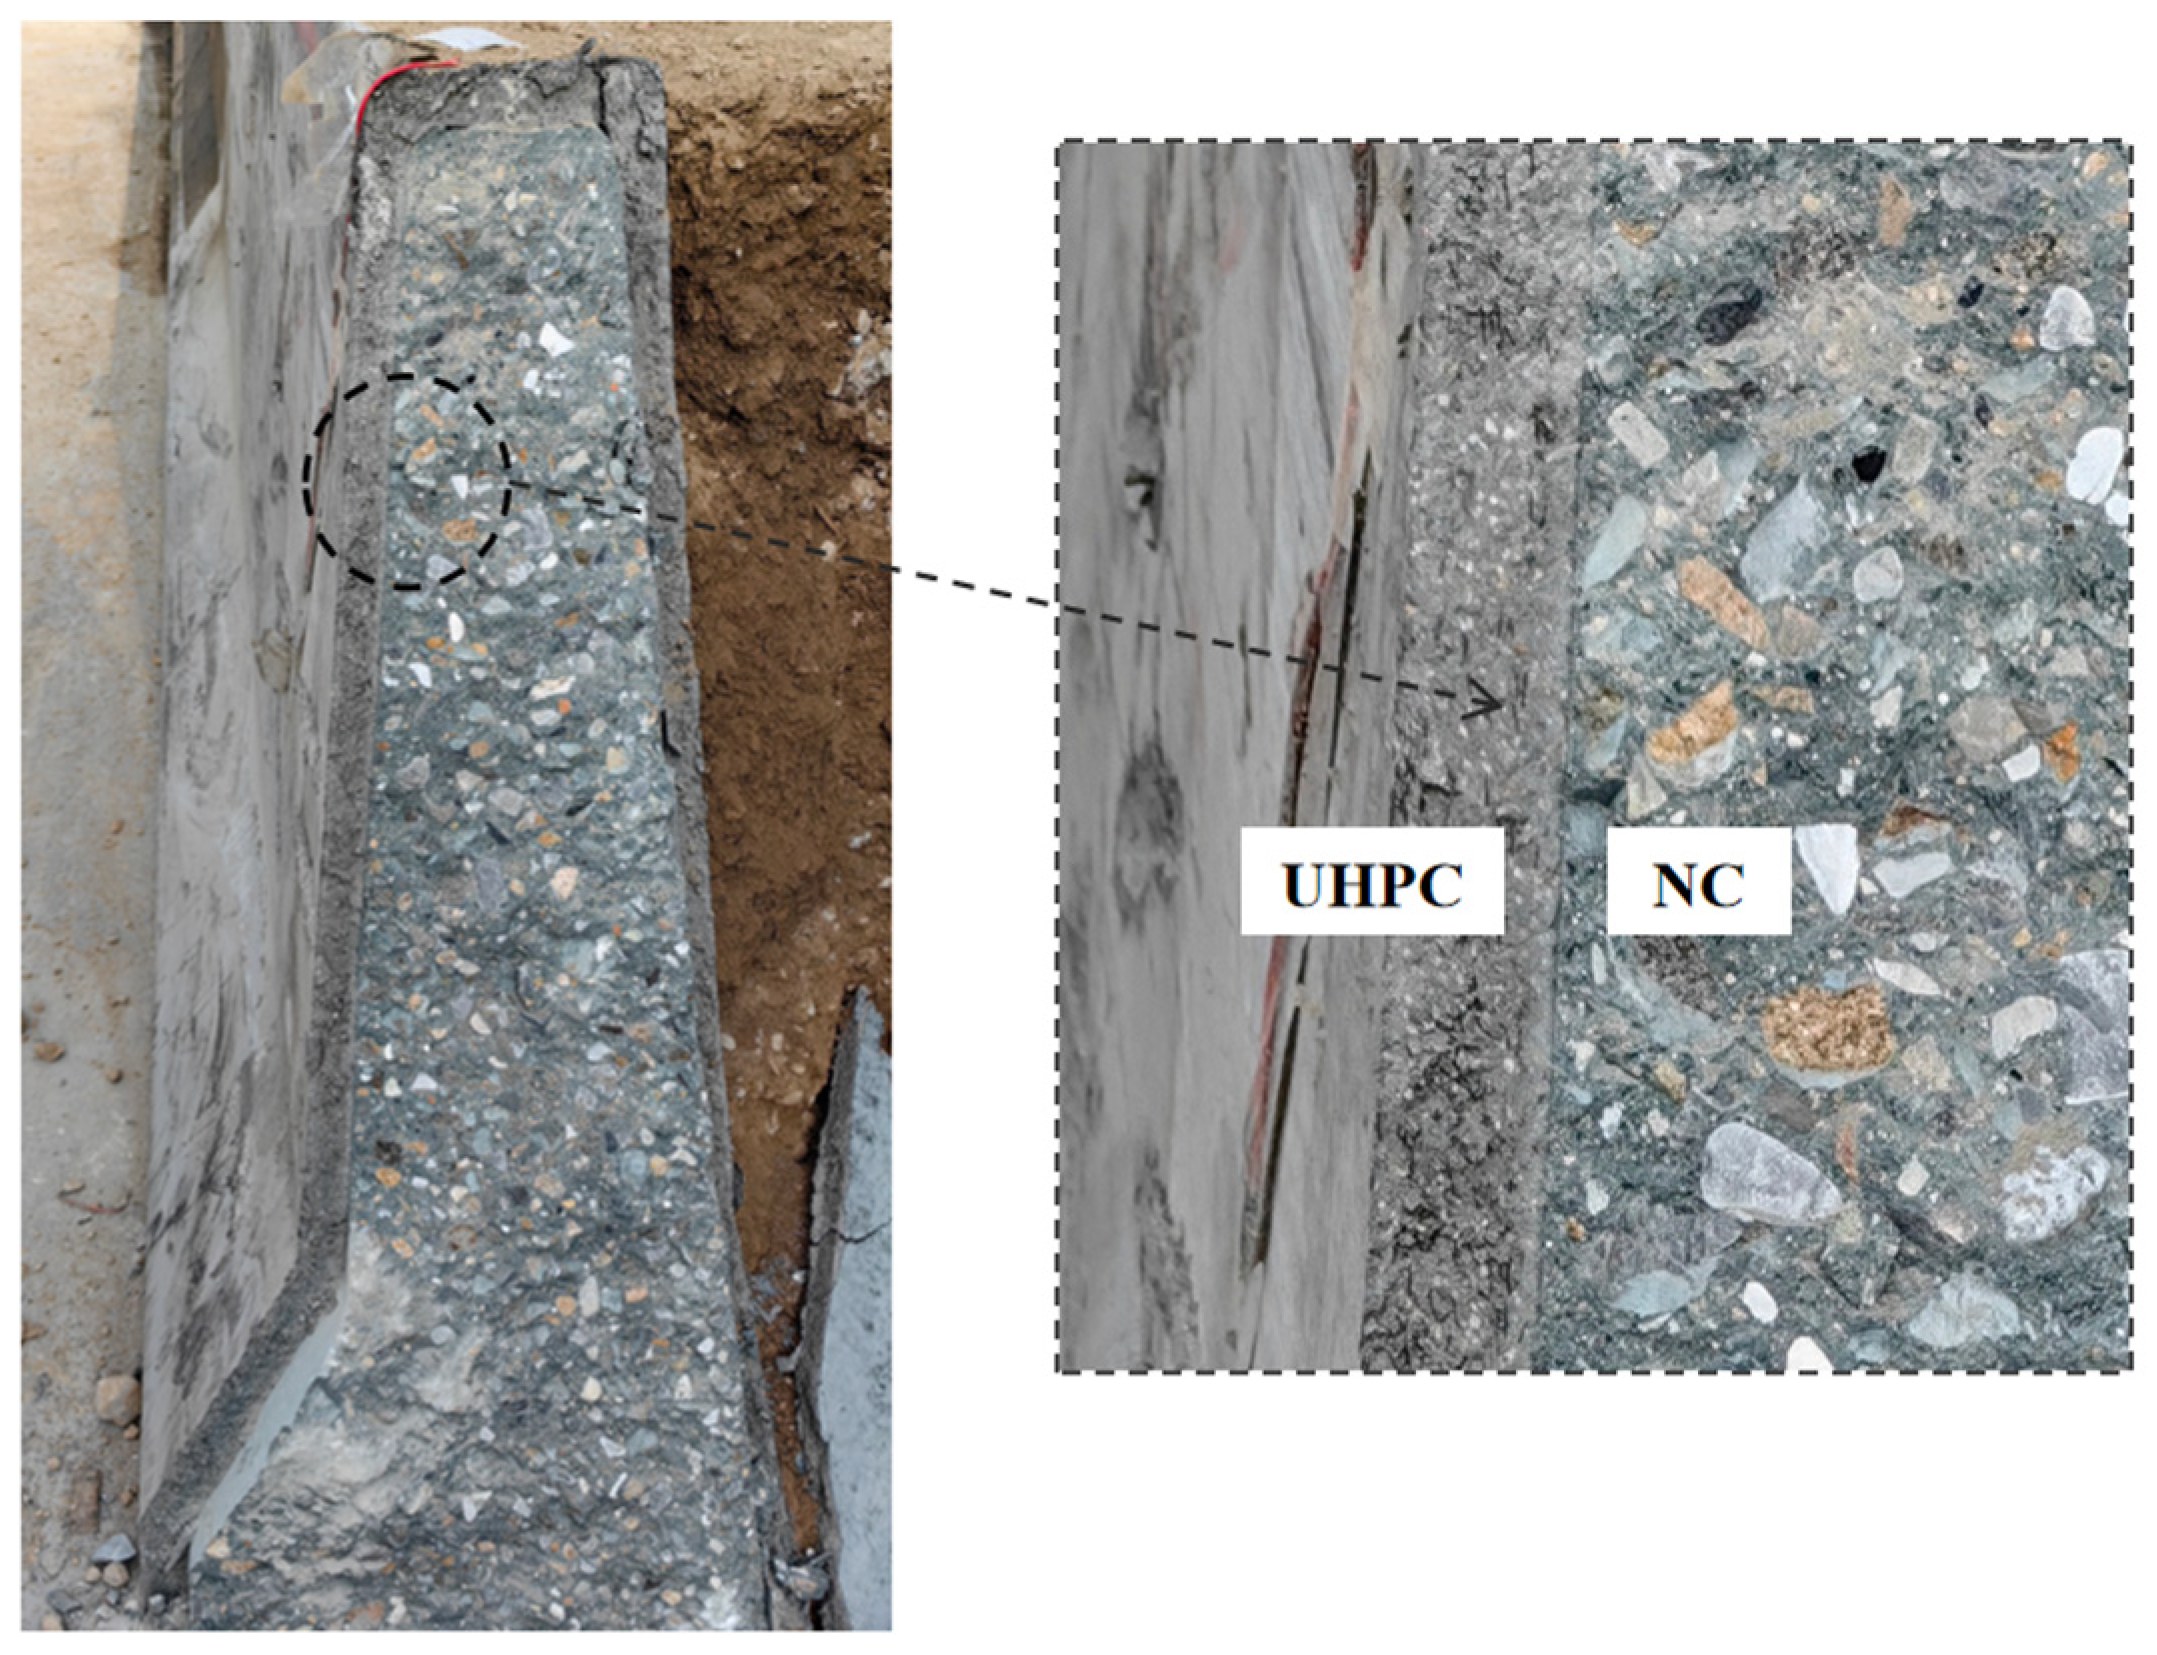
5.4. Barrier Damage
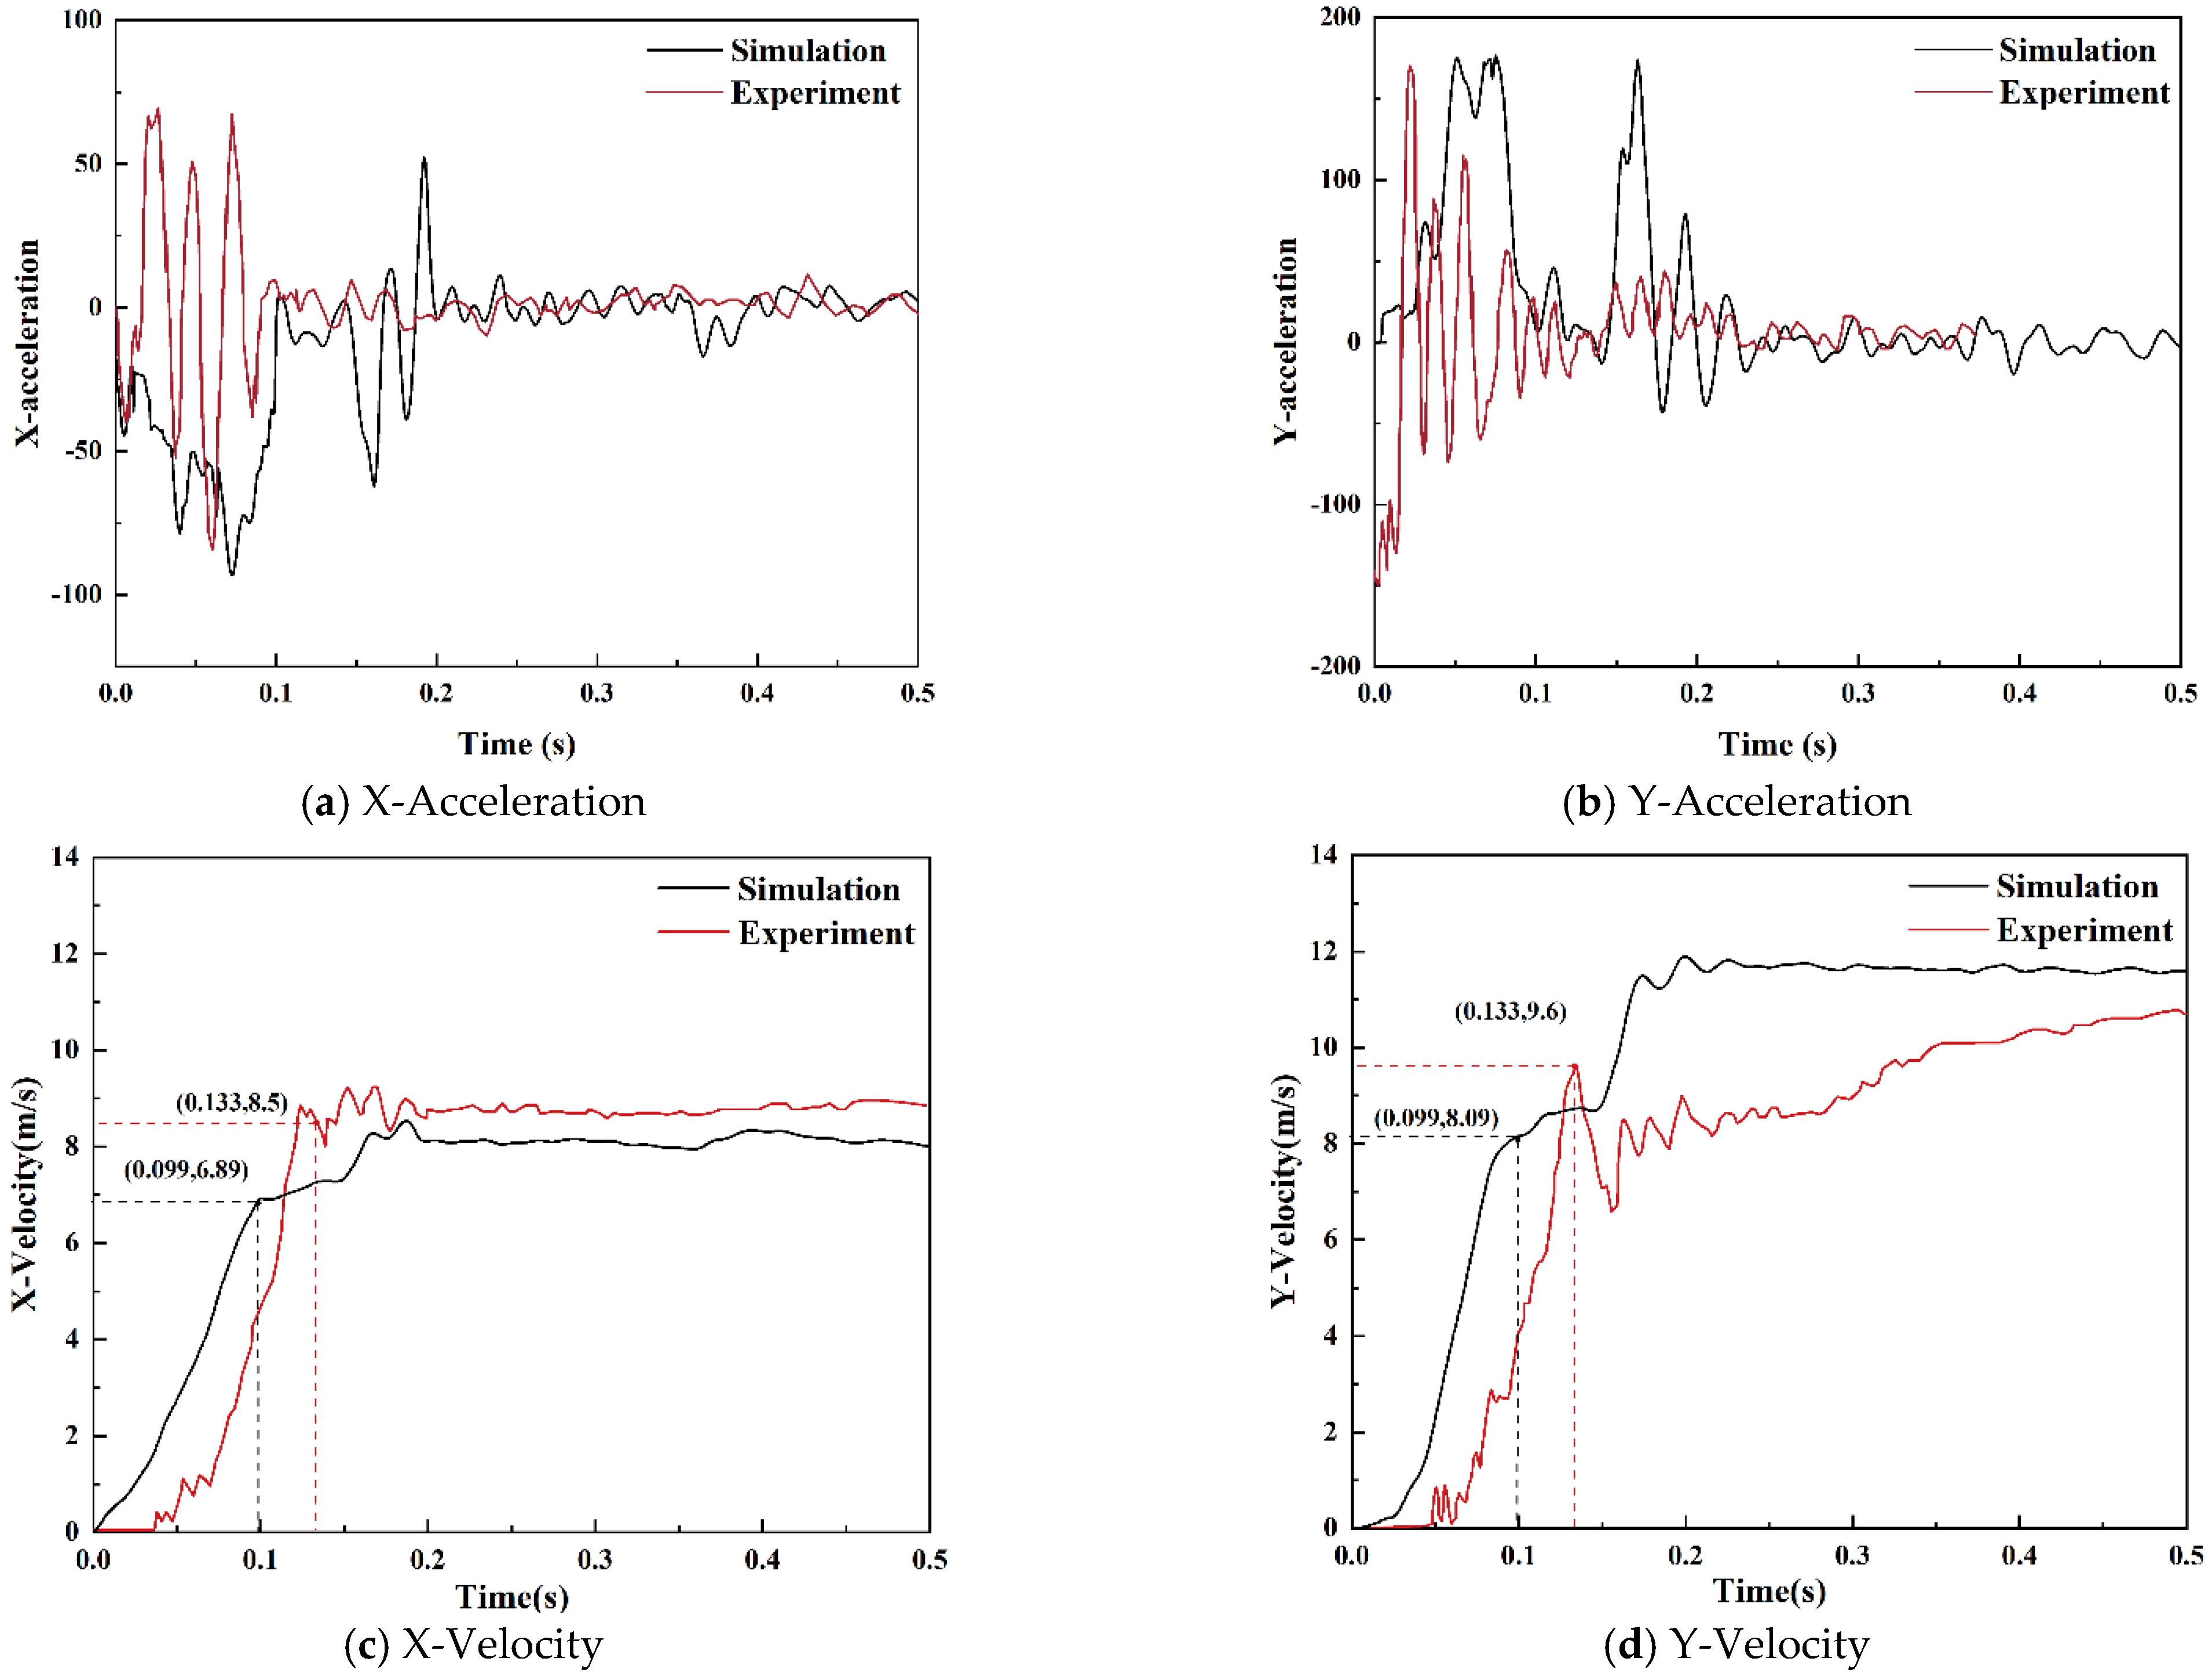
5.5. Buffering Function
- OIVx—X direction component of occupant impact velocity;
- OIVy—Y direction component of occupant impact velocity;
- ax—Vehicle acceleration in the X direction;
- ay—Vehicle acceleration in the Y direction;
- t0—The moment of impact, determined as the smaller of tx and ty, which are calculated by the following equations when an occupant comes into contact with the interior of the vehicle:
- ORA
- 2.
- OIV
6. Conclusions
- The collision force between the three models and the barrier was extracted and analyzed, and the average collision force peak of 25 ms was compared with the theoretical collision force, which has high consistency. It is considered that the peak value of the 25 ms collision force in this simulation can be used as the basis for static load design.
- A collision simulation of a new semi-assembled barrier was performed. It was found that the barrier provided good guidance and reduced damage to the occupant.
- After collision, the barrier did not show overall damage, which does not affect the continued use of the barrier. The maximum lateral dynamic deformation value of the barrier was 0 and the UHPC shell and the NC were in synergistic force during the collision.
- Whether numerical simulation or real vehicle crash test, the ORA and OIV were less than the standard allowable values, suggesting that the new semi-assembled barrier had a good buffering function for the vehicle.
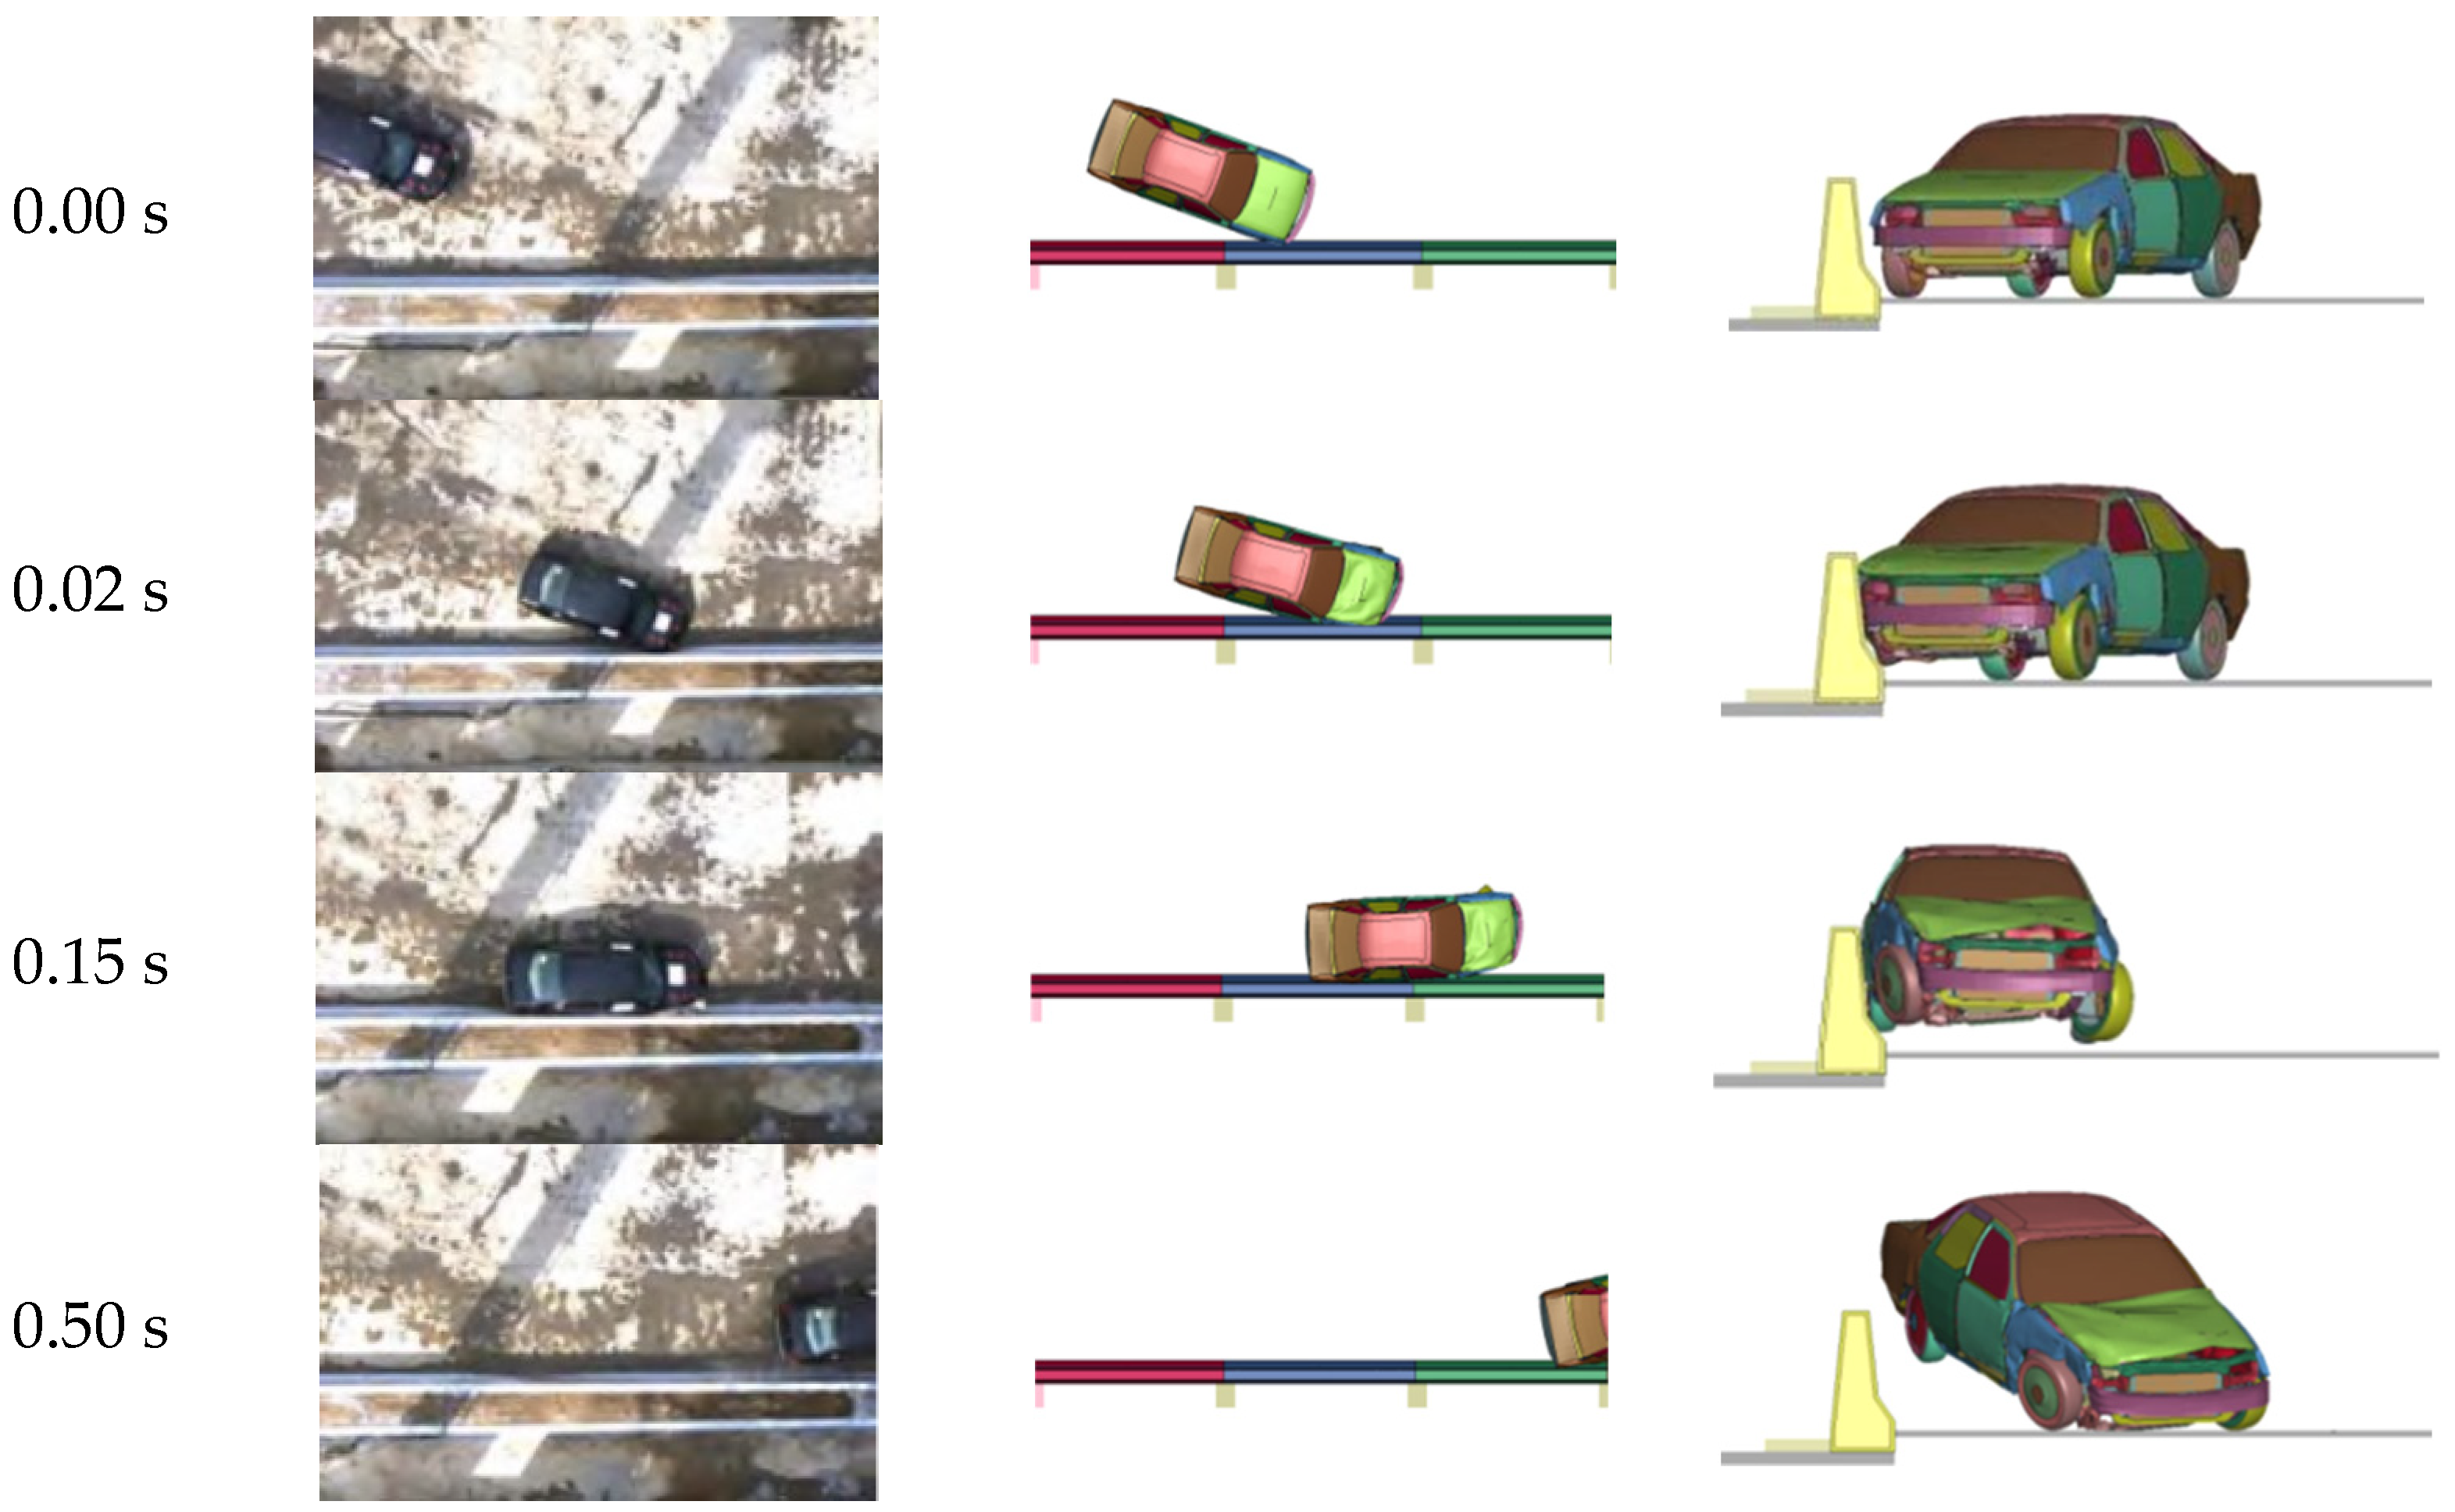
- The collision test results for the real vehicles were in good agreement with the simulation results by LS-DYNA software. This suggests that finite element simulation can predict real outcomes to some extent, which can serve as a basis for full-scale collision tests, potentially reducing unnecessary investments in such tests. The research findings can offer theoretical support for promoting the widespread adoption of this new type of barrier.
Author Contributions
Funding
Data Availability Statement
Conflicts of Interest
References
- Zhang, P. Numerical Simulation on Crash worthiness of New Type of Rigid barrier. China J. Highw. Transp. 2009, 22, 31–36. (In Chinese) [Google Scholar]
- Dinnella, N.; Chiappone, S.; Guerrieri, M. The innovative “NDBA” concrete safety barrier able to withstand two subsequent TB81 crash tests. Eng. Fail. Anal. 2020, 115, 104660. [Google Scholar] [CrossRef]
- Chen, F.; Rasmussen, J.D.; Bielenberg, R.W.; Lechtenberg, K.A.; Faller, R.K.; Linzell, D.G. Experimental and numerical investigation on deflection and behavior of portable construction barrier subjected to vehicle impacts. Eng. Struct. 2021, 235, 112071. [Google Scholar] [CrossRef]
- Yang, J.; Xu, G.; Cai, C.S.; Kareem, A. Crash performance evaluation of a new movable median barrier on highways. Eng. Struct. 2019, 182, 459–472. [Google Scholar] [CrossRef]
- Mohammed, H.J.; Zain, M.F.M. Experimental application of EPS concrete in the new prototype design of the concrete barrier. Constr. Build. Mater. 2016, 124, 312–342. [Google Scholar] [CrossRef]
- Song, X.M.; Pan, P.Y.; Rong, Y.W.; Tang, M. Protection Performance of New Fabricated barrier Based on Collision Simulation. J. South China Univ. Technol. (Nat. Sci. Ed.) 2021, 49, 41–49. (In Chinese) [Google Scholar]
- Jiang, L.; Wang, K.; Fang, H.; Chen, B.; Zhu, L.; Zhang, Q.; Zhang, X. Protection performance of a novel anti-collision barrier with recycled foamed concrete under vehicle collision. Eng. Struct. 2024, 305, 117795. [Google Scholar] [CrossRef]
- Yee, A.A.; Hon, D. Structural and Economic Benefits of Precast/Prestressed Concrete Construction. PCI J. 2001, 46, 34–42. [Google Scholar] [CrossRef]
- Hu, X.; Xue, W.; Lv, Y. Seismic behavior of a new type of precast concrete shear wall using UHPC connections at boundary elements. Eng. Struct. 2024, 302, 117468. [Google Scholar] [CrossRef]
- Yuan, Q.; Shi, C.; De Schutter, G.; Audenaert, K.; Deng, D. Chloride binding of cement-based materials subjected to external chloride environment—A review. Constr. Build. Mater. 2009, 23, 1–13. [Google Scholar] [CrossRef]
- de Larrard, F.; Sedran, T. Optimization of ultra-high-performance concrete by the use of a packing model. Cem. Concr. Res. 1994, 24, 997–1009. [Google Scholar] [CrossRef]
- Shafieifar, M.; Farzad, M.; Azizinamini, A. Experimental and numerical study on mechanical properties of Ultra High Performance Concrete (UHPC). Constr. Build. Mater. 2017, 156, 402–411. [Google Scholar] [CrossRef]
- Yoo, D.-Y.; Banthia, N. Mechanical properties of ultra-high-performance fiber-reinforced concrete: A review. Cem. Concr. Compos. 2016, 73, 267–280. [Google Scholar] [CrossRef]
- Vaitkevičius, V.; Šerelis, E.; Vaičiukynienė, D.; Raudonis, V.; Rudžionis, Ž. Advanced mechanical properties and frost damage resistance of ultra-high performance fiber reinforced concrete. Constr. Build. Mater. 2016, 126, 26–31. [Google Scholar] [CrossRef]
- Yu, R.; Zhou, F.J.; Yin, T.Y.; Wang, Z.Y.; Ding, M.; Liu, Z.; Leng, Y.; Gao, X.; Shui, Z. Uncovering the approach to develop ultra-high performance concrete (UHPC) with dense meso-structure based on rheological point of view: Experiments and modeling. Constr. Build. Mater. 2021, 271, 121500. [Google Scholar] [CrossRef]
- Fan, D.Q.; Rui, Y.; Liu, K.N.; Tan, J.H.; Shui, Z.; Wu, C.; Wang, S.; Guan, Z.; Hu, Z.; Su, Q. Optimized design of steel fibres reinforced ultra-high performance concrete (UHPC) composites: Towards to dense structure and efficient fibre application. Constr. Build. Mater. 2021, 273, 121698. [Google Scholar] [CrossRef]
- Alkaysi, M.; El-Tawil, S.; Liu, Z.; Hansen, W. Effects of silica powder and cement type on durability of ultra high performance concrete (UHPC). Cem. Concr. Compos. 2016, 66, 47–56. [Google Scholar] [CrossRef]
- Li, J.Q.; Wu, Z.M.; Shi, C.J.; Yuan, Q.; Zhang, Z. Durability of ultra-high performance concrete—A review. Constr. Build. Mater. 2020, 255, 119296. [Google Scholar] [CrossRef]
- Chen, Y.X.; Yu, R.; Wang, X.P.; Chen, J.; Shui, Z.H. Evaluation and optimization of Ultra-High Performance Concrete (UHPC) subjected to harsh ocean environment: Towards an application of Layered Double Hydroxides (LDHs). Constr. Build. Mater. 2018, 177, 51–62. [Google Scholar] [CrossRef]
- Sohail, M.G.; Kahraman, R.; Al Nuaimi, N.; Gencturk, B.; Alnahhal, W. Durability characteristics of high and ultra-high performance concretes. J. Build. Eng. 2021, 33, 101669. [Google Scholar] [CrossRef]
- Yu, R.; Zhang, J.J.; Liu, K.N.; Liao, M.Z.; Shui, Z.H.; Zeng, M.; Hu, F.; Hou, D.; Wang, X. Evaluation and regulation of Ultra-High Performance Concrete (UHPC) crack resistance based on physicochemical multi-factor coupling approach. Constr. Build. Mater. 2021, 301, 124100. [Google Scholar] [CrossRef]
- Luo, S.; Zhao, H.; Qiao, D.Q.; Liao, Z.; Hu, Z.; Zhou, C. Experimental and numerical investigation on deck system of a 102 m simply supported prestressed UHPC box-girder highway bridge. Eng. Struct. 2024, 316, 118601. [Google Scholar] [CrossRef]
- Liu, B.X.; Zhang, R.Z. Review of Mechanical Properties and Application on Ultra-High Performance Concrete, 2024th ed.; School of Highway, Chang’an University: Xi’an, China, 2024; pp. 35–44. [Google Scholar] [CrossRef]
- Hong, L.J.; Li, Z.Y.; Peng, Y. Application of lightweight steel-UHPC composite beam in bridge emergency repair. Adv. Bridge Eng. 2024, 5, 19. [Google Scholar] [CrossRef]
- JTG B05-01-2013; Standard for Performance Evaluation of Highway Barrier. China Communications Press: Beijing, China, 2013. (In Chinese)
- JTG D81-2017; Design Guidelines for Highway Safety Facilities. Ministry of Transport of the People’s Republic of China: Beijing, China, 2017. (In Chinese)
- LSTC—Livermore Software Technology Corporation. LS-DYNA Keyword User’s Manual; Livermore Software Technology Corporation: Livermore, CA, USA, 2013. [Google Scholar]
- Miller, P.; Iii, J.F.C. Computer Simulations of Roadside Crash Cushion Impacts. J. Transp. Eng. 1997, 123, 370–376. [Google Scholar] [CrossRef]
- Ren, Z.; Vesenjak, M. Computational and experimental crash analysis of the road safety barrier. Eng. Fail. Anal. 2004, 12, 963–973. [Google Scholar] [CrossRef]
- Yin, H.; Zhang, L.; Liu, Z.; Fan, W.; Wu, X.; Wen, G. Crash analysis and evaluation of a new separate W-beam barrier on highways using the finite element method. Eng. Struct. 2023, 278, 115551. [Google Scholar] [CrossRef]
- Holmquist, T.J.; Johnson, G.R.; Cook, W.H. A Computational Constitutive Model for Concrete Subjected to Large Strains, High Strain Rates and High Pressures. In Warhead Mechanisms, Terminal Ballistics; ADPA: Brussels, Belgium, 1993; Volume 2, pp. 591–600. [Google Scholar]
- Wan, W.; Yang, J.; Xu, G.; Liu, Y. Determination and evaluation of Holmquist-Johnson-Cook constitutive model parameters for ultra-high-performance concrete with steel fibers. Int. J. Impact Eng. 2021, 156, 103966. [Google Scholar] [CrossRef]
- Liu, J.; Liu, C.; Qu, K.; Li, J.; Wu, C. Calibration of Holmquist Johnson Cook (HJC) model for projectile penetration of geopolymer-based ultra-high performance concrete (G-UHPC). Structures 2022, 43, 149–163. [Google Scholar] [CrossRef]
- Xiong, Y.B.; Chen, J.J.; Hu, Y.L.; Wang, W.P. Determining Failure Surface Parameters of the Johnson-Holmquist Concrete Constitutive Model. Acta Armamentarii 2010, 31, 746–751. (In Chinese) [Google Scholar]
- Ren, L.; Yu, X.; Zheng, M.; Xue, Z.; Wu, B.; He, Y. Evaluation of typical dynamic damage models used for UHPC based on SHPB technology. Eng. Fract. Mech. 2022, 269, 108562. [Google Scholar] [CrossRef]
- Hanchak, S.J.; Forrestal, M.; Young, E.; Ehrgott, J. Perforation of concrete slabs with 48 MPa (7 ksi) and 140 MPa (20 ksi) unconfined compressive strengths. Int. J. Impact Eng. 1992, 12, 1–7. [Google Scholar] [CrossRef]
- Ghafari, E.; Costa, H.; Júlio, E.; Portugal, A.; Durães, L. Optimization of UHPC by adding nanomaterials. In Proceedings of the 3rd International Symposium on UHPC and Nanotechnology for High Performance Construction Materials, Kassel, Germany, 7–9 March 2012; pp. 71–78. [Google Scholar]
- National Crash Analysis Center (NCAC). Available online: https://www.nhtsa.gov/crash-simulation-vehicle-models (accessed on 10 February 2025).
- Sun, S.; Li, H.; Zhu, C.; Mei, K.; Jiang, H.; Sun, Y.; Huang, H. Study on the anti-collision performance of basalt fiber reinforced polymer beam–column barrier. Compos. Struct. 2021, 276, 114588. [Google Scholar] [CrossRef]
- Lei, Z.B. The Crashworthiness of Structure with Large Displacement and Large Deformation. Doctoral Dissertation, Central South University, Changsha, China, 2004. (In Chinese). [Google Scholar]


| Material | Mixing Ratio (kg/m3) | ||||||||||
|---|---|---|---|---|---|---|---|---|---|---|---|
| Cement | SF | LP | QP | C | S | Water | EA | AFA | SP | Steel Fiber | |
| UHPC | 820 | 111 | 111 | 111 | / | 1109 | 191 | 0.2 | 1.7 | 5.8 | 149 |
| NC | 360 | / | / | / | 1171 | 672 | 180 | / | / | 4.8 | / |
| σ3 | σ1 | Average Value |
|---|---|---|
| 0 | 142.22 | 142.48 |
| 145.34 | ||
| 139.89 | ||
| 5 | 181.97 | 183.62 |
| 186.31 | ||
| 182.59 | ||
| 10 | 194.87 | 190.68 |
| 187.53 | ||
| 189.63 | ||
| 15 | 195.61 | 204.01 |
| 203.14 | ||
| 213.30 | ||
| 20 | 260.75 | 232.28 |
| 212.92 | ||
| 223.18 |
| Component | ρ/(g/cm3) | G (GPa) | A | B | C | N | FC (MPa) |
|---|---|---|---|---|---|---|---|
| UHPC | 2.54 | 32.64 | 0.25 | 2.49 | 0.007 | 1.08 | 142.48 |
| C30 | 2.40 | 12.5 | 0.28 | 1.85 | 0.007 | 0.84 | 30.9 |
| Component | T (MPa) | EPS0 | EFMIN | SFmax | PC (MPa) | UC | PL (MPa) |
| UHPC | 9.81 | 1 × 10⁶ | 0.016 | 7.0 | 47.49 | 0.00187 | 1000 |
| C30 | 3.00 | 1 × 10⁶ | 0.01 | 7.0 | 10.00 | 0.0011 | 1210 |
| Component | UL | D1 | D2 | K1 (GPa) | K2 (GPa) | K3 (GPa) | FS |
| UHPC | 0.068 | 0.061 | 1.0 | 85 | −171 | 208 | 0 |
| C30 | 0.16 | 0.04 | 1.0 | 12 | 135 | 698 | 0 |
| Type | Weight (ton) | Length (mm) | Width (mm) | Height (mm) | Angle (°) | Velocity (km/h) |
|---|---|---|---|---|---|---|
| Car | 1.5 | 4600 | 1770 | 1430 | 20 | 100 |
| Bus | 10 | 9000 | 2450 | 3360 | 20 | 80 |
| Truck | 18 | 11,300 | 2500 | 3500 | 20 | 60 |
| Type | Parameters | /kN | |||||||
|---|---|---|---|---|---|---|---|---|---|
| m/kg | v1/m | θ/° | C/m | b/m | D/m | ||||
| Car | 1500 | 27.78 | 20 | 1.8 | 0.875 | 0 | 189 | 182 | 3.8% |
| Bus | 10,000 | 22.22 | 20 | 4.2 | 1.225 | 0 | 333 | 307 | 7.8% |
| Truck | 18,000 | 16.67 | 20 | 4.5 | 1.250 | 0 | 313 | 324 | 3.4% |
Disclaimer/Publisher’s Note: The statements, opinions and data contained in all publications are solely those of the individual author(s) and contributor(s) and not of MDPI and/or the editor(s). MDPI and/or the editor(s) disclaim responsibility for any injury to people or property resulting from any ideas, methods, instructions or products referred to in the content. |
© 2025 by the authors. Licensee MDPI, Basel, Switzerland. This article is an open access article distributed under the terms and conditions of the Creative Commons Attribution (CC BY) license (https://creativecommons.org/licenses/by/4.0/).
Share and Cite
Xue, W.; Liao, Z.; Liao, L.; Hao, R.; Shen, L. Safety Performance Evaluation of Ultra-High-Performance Concrete Semi-Assembled Barrier. Appl. Sci. 2025, 15, 3156. https://doi.org/10.3390/app15063156
Xue W, Liao Z, Liao L, Hao R, Shen L. Safety Performance Evaluation of Ultra-High-Performance Concrete Semi-Assembled Barrier. Applied Sciences. 2025; 15(6):3156. https://doi.org/10.3390/app15063156
Chicago/Turabian StyleXue, Wanwen, Zhiling Liao, Lin Liao, Ruiqing Hao, and Litao Shen. 2025. "Safety Performance Evaluation of Ultra-High-Performance Concrete Semi-Assembled Barrier" Applied Sciences 15, no. 6: 3156. https://doi.org/10.3390/app15063156
APA StyleXue, W., Liao, Z., Liao, L., Hao, R., & Shen, L. (2025). Safety Performance Evaluation of Ultra-High-Performance Concrete Semi-Assembled Barrier. Applied Sciences, 15(6), 3156. https://doi.org/10.3390/app15063156