
Study on Vertical Uplift Resistance Characteristics of Pre-Drilled Planted Piles in Boulder Strata


Abstract
1. Introduction
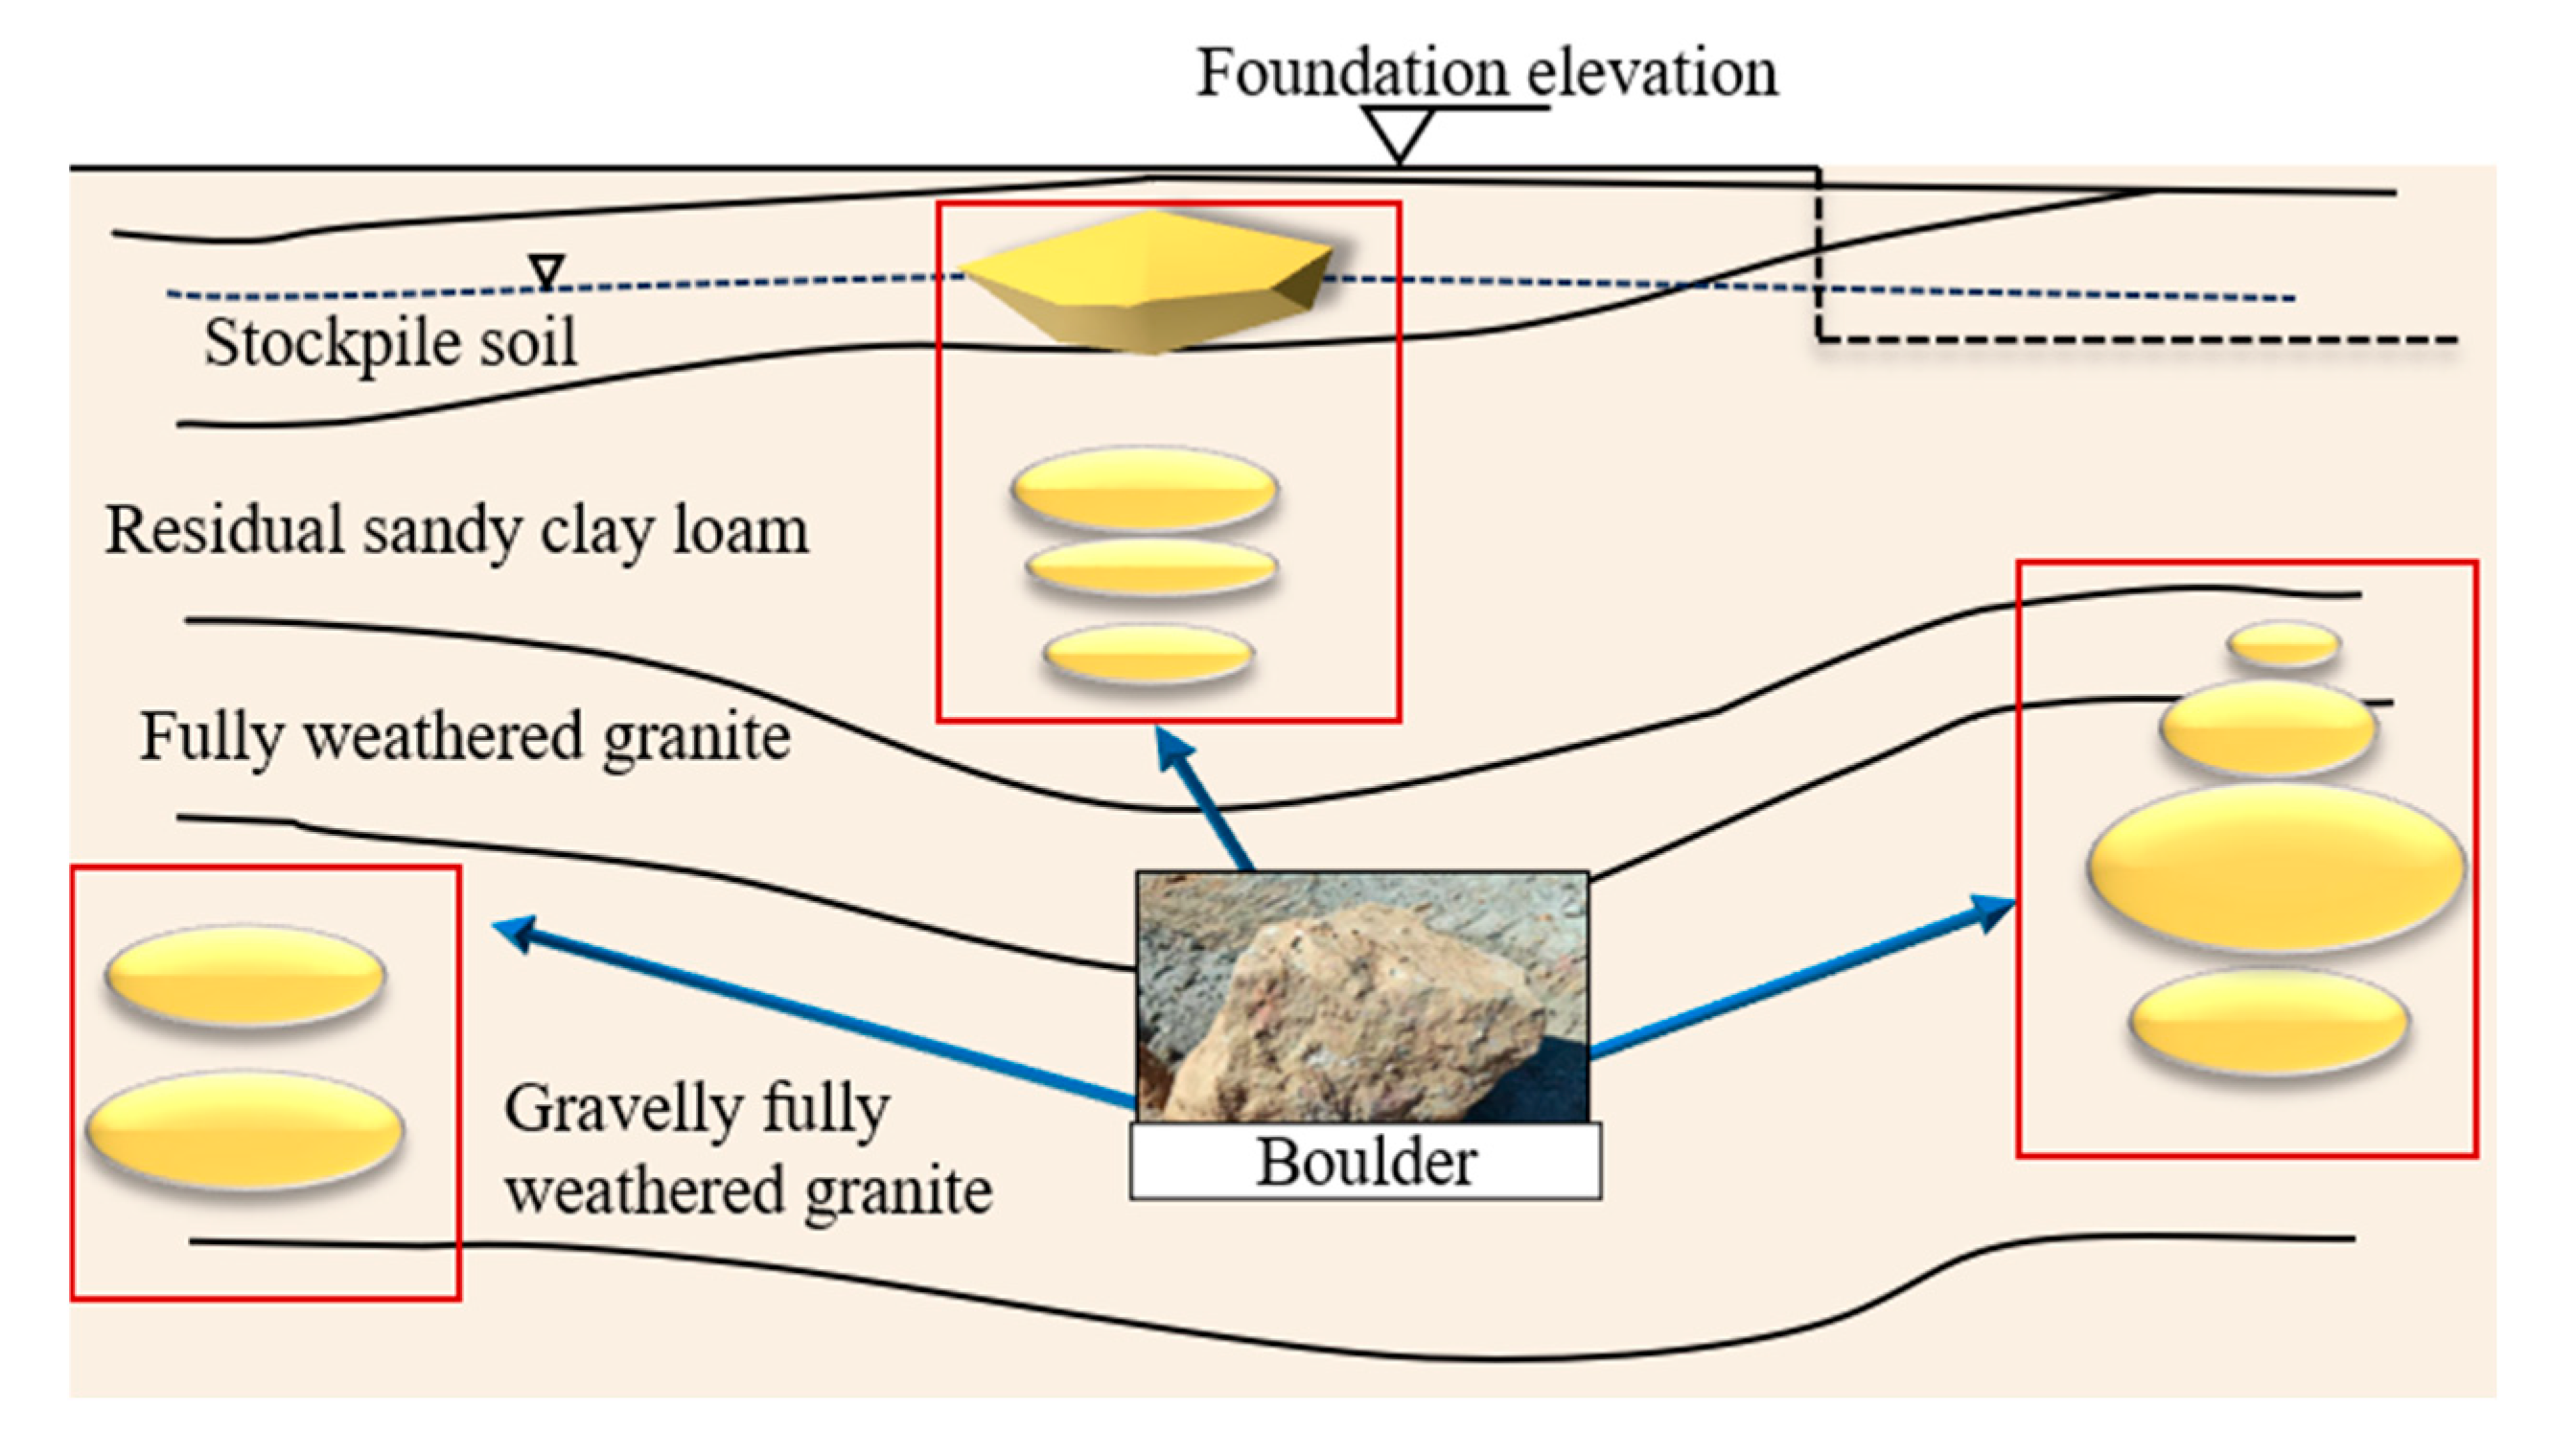
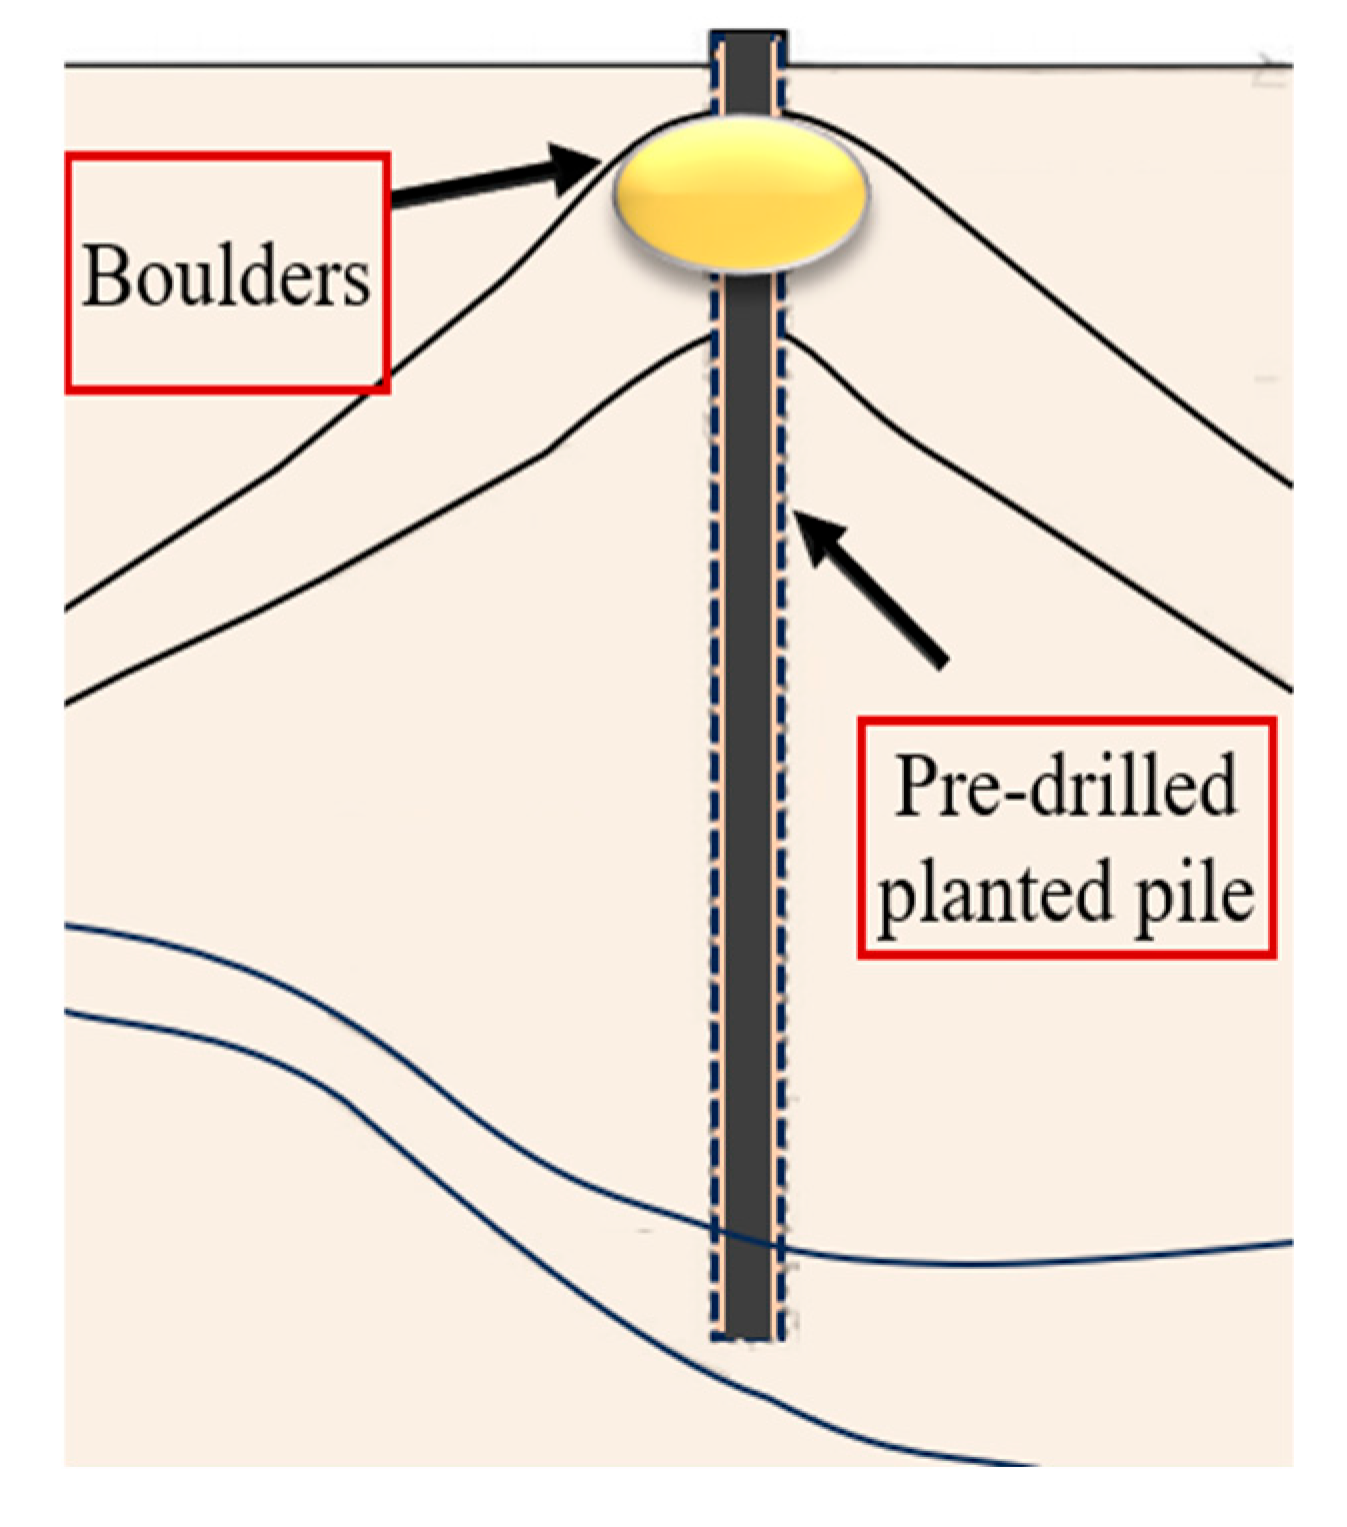
2. Project Overview
3. Design of the Planted Pile Model Tests Based on Transparent Soil
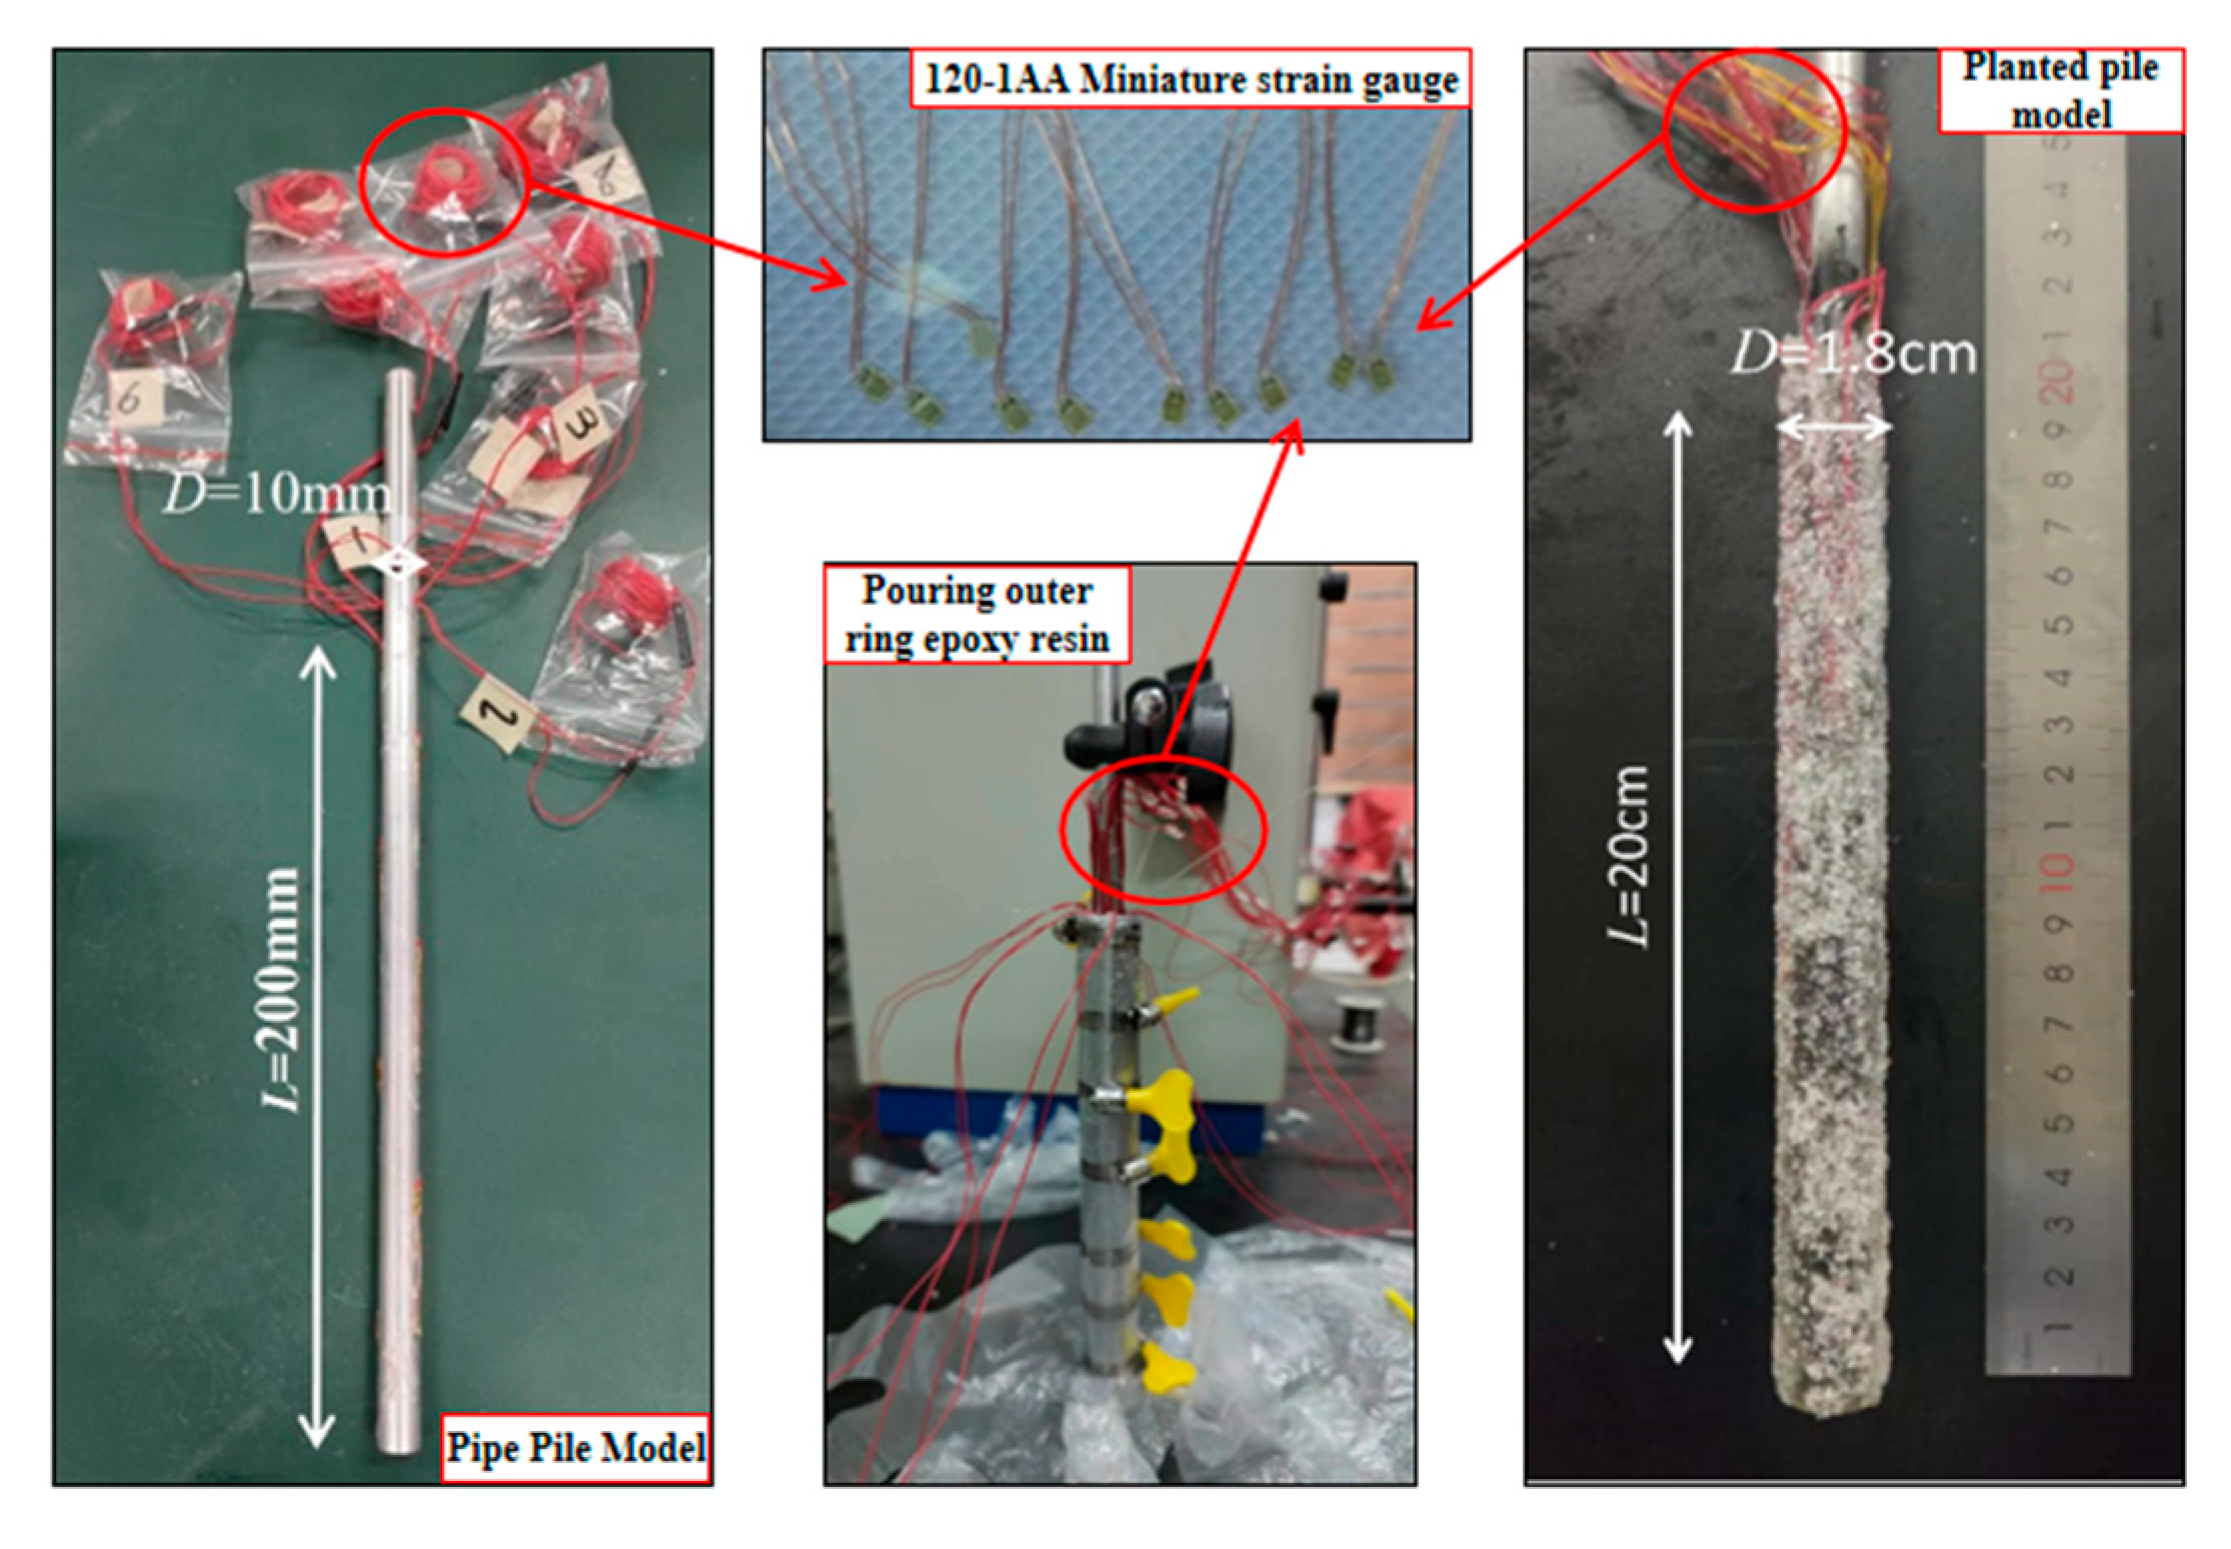
3.1. The Planted Pile Model Test Device and Transparent Soil Formulation
3.2. Pile Planted Model and Test Program
4. Numerical Modeling
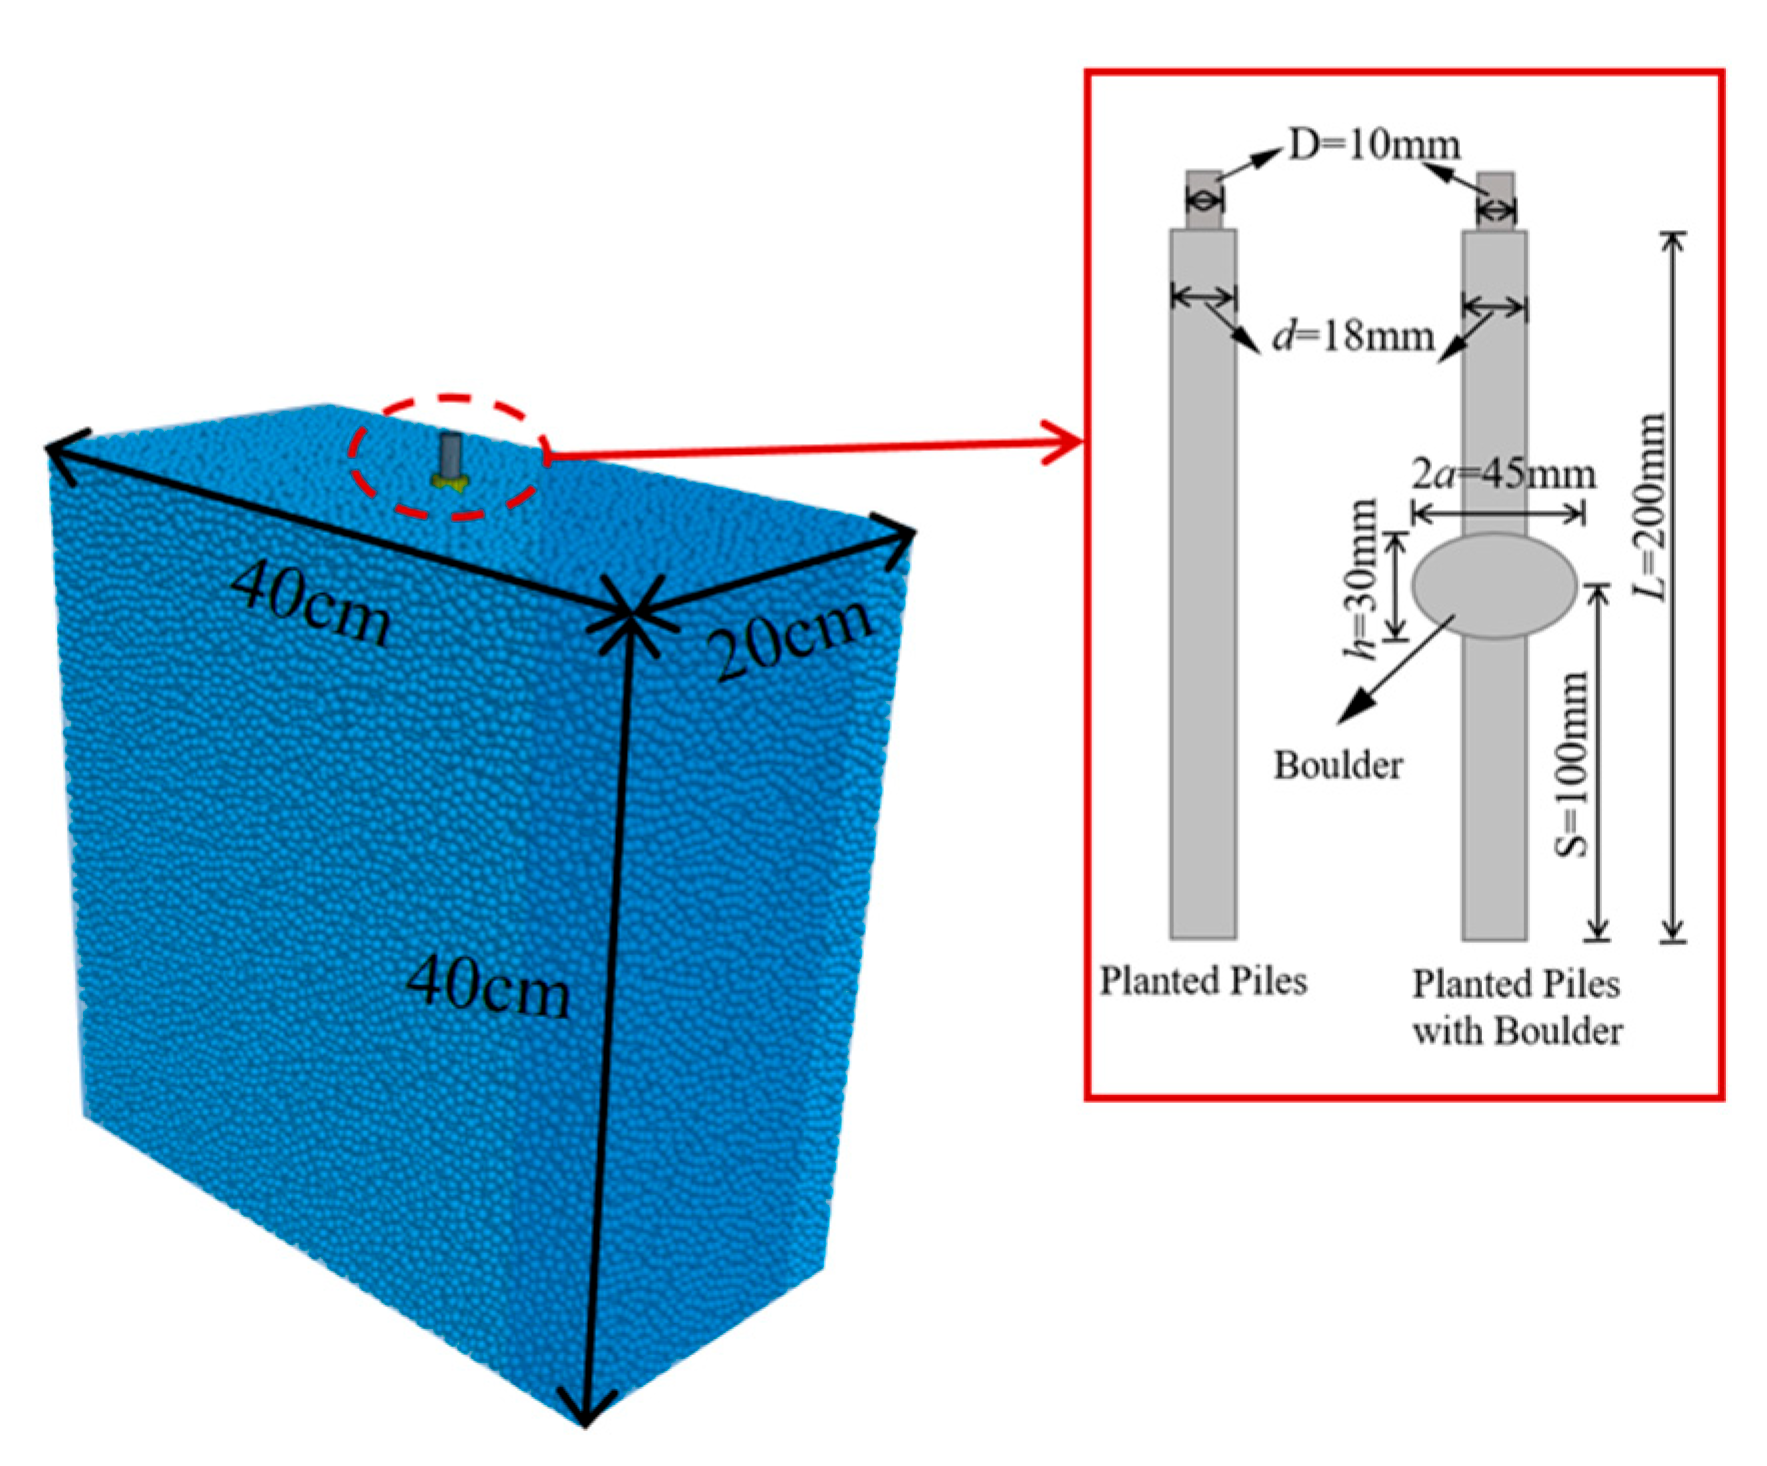
4.1. Model Construction
4.2. Constitutive Model and Material Parameters
5. Calculation Results and Analysis
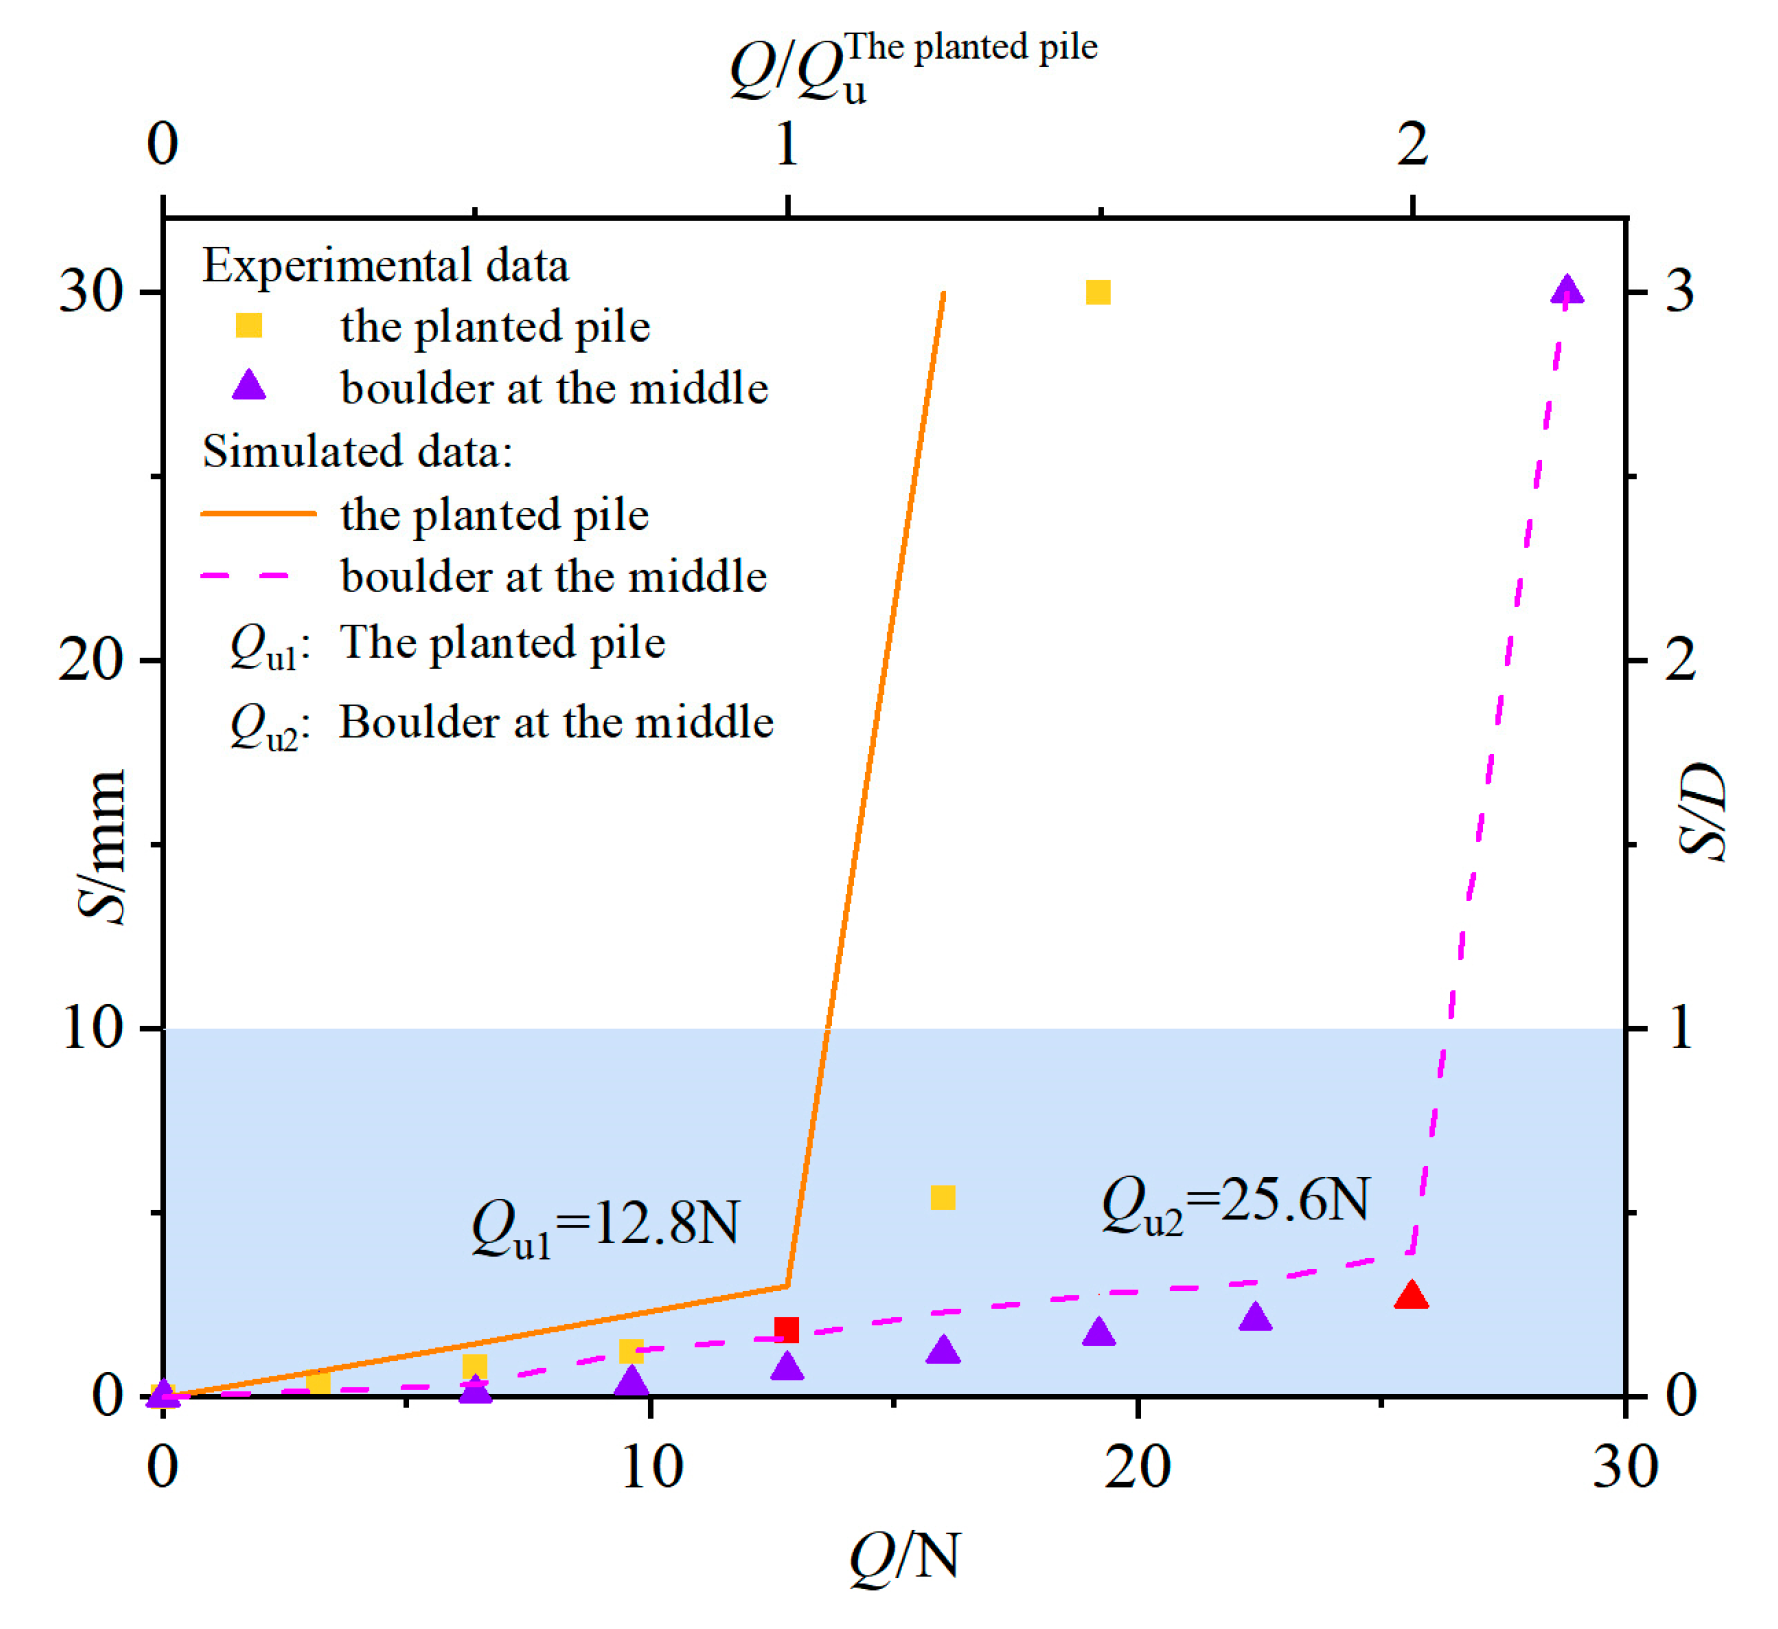
5.1. Q-S Curve Analysis
5.2. Axial Force Transmission Analysis of the Core Pile
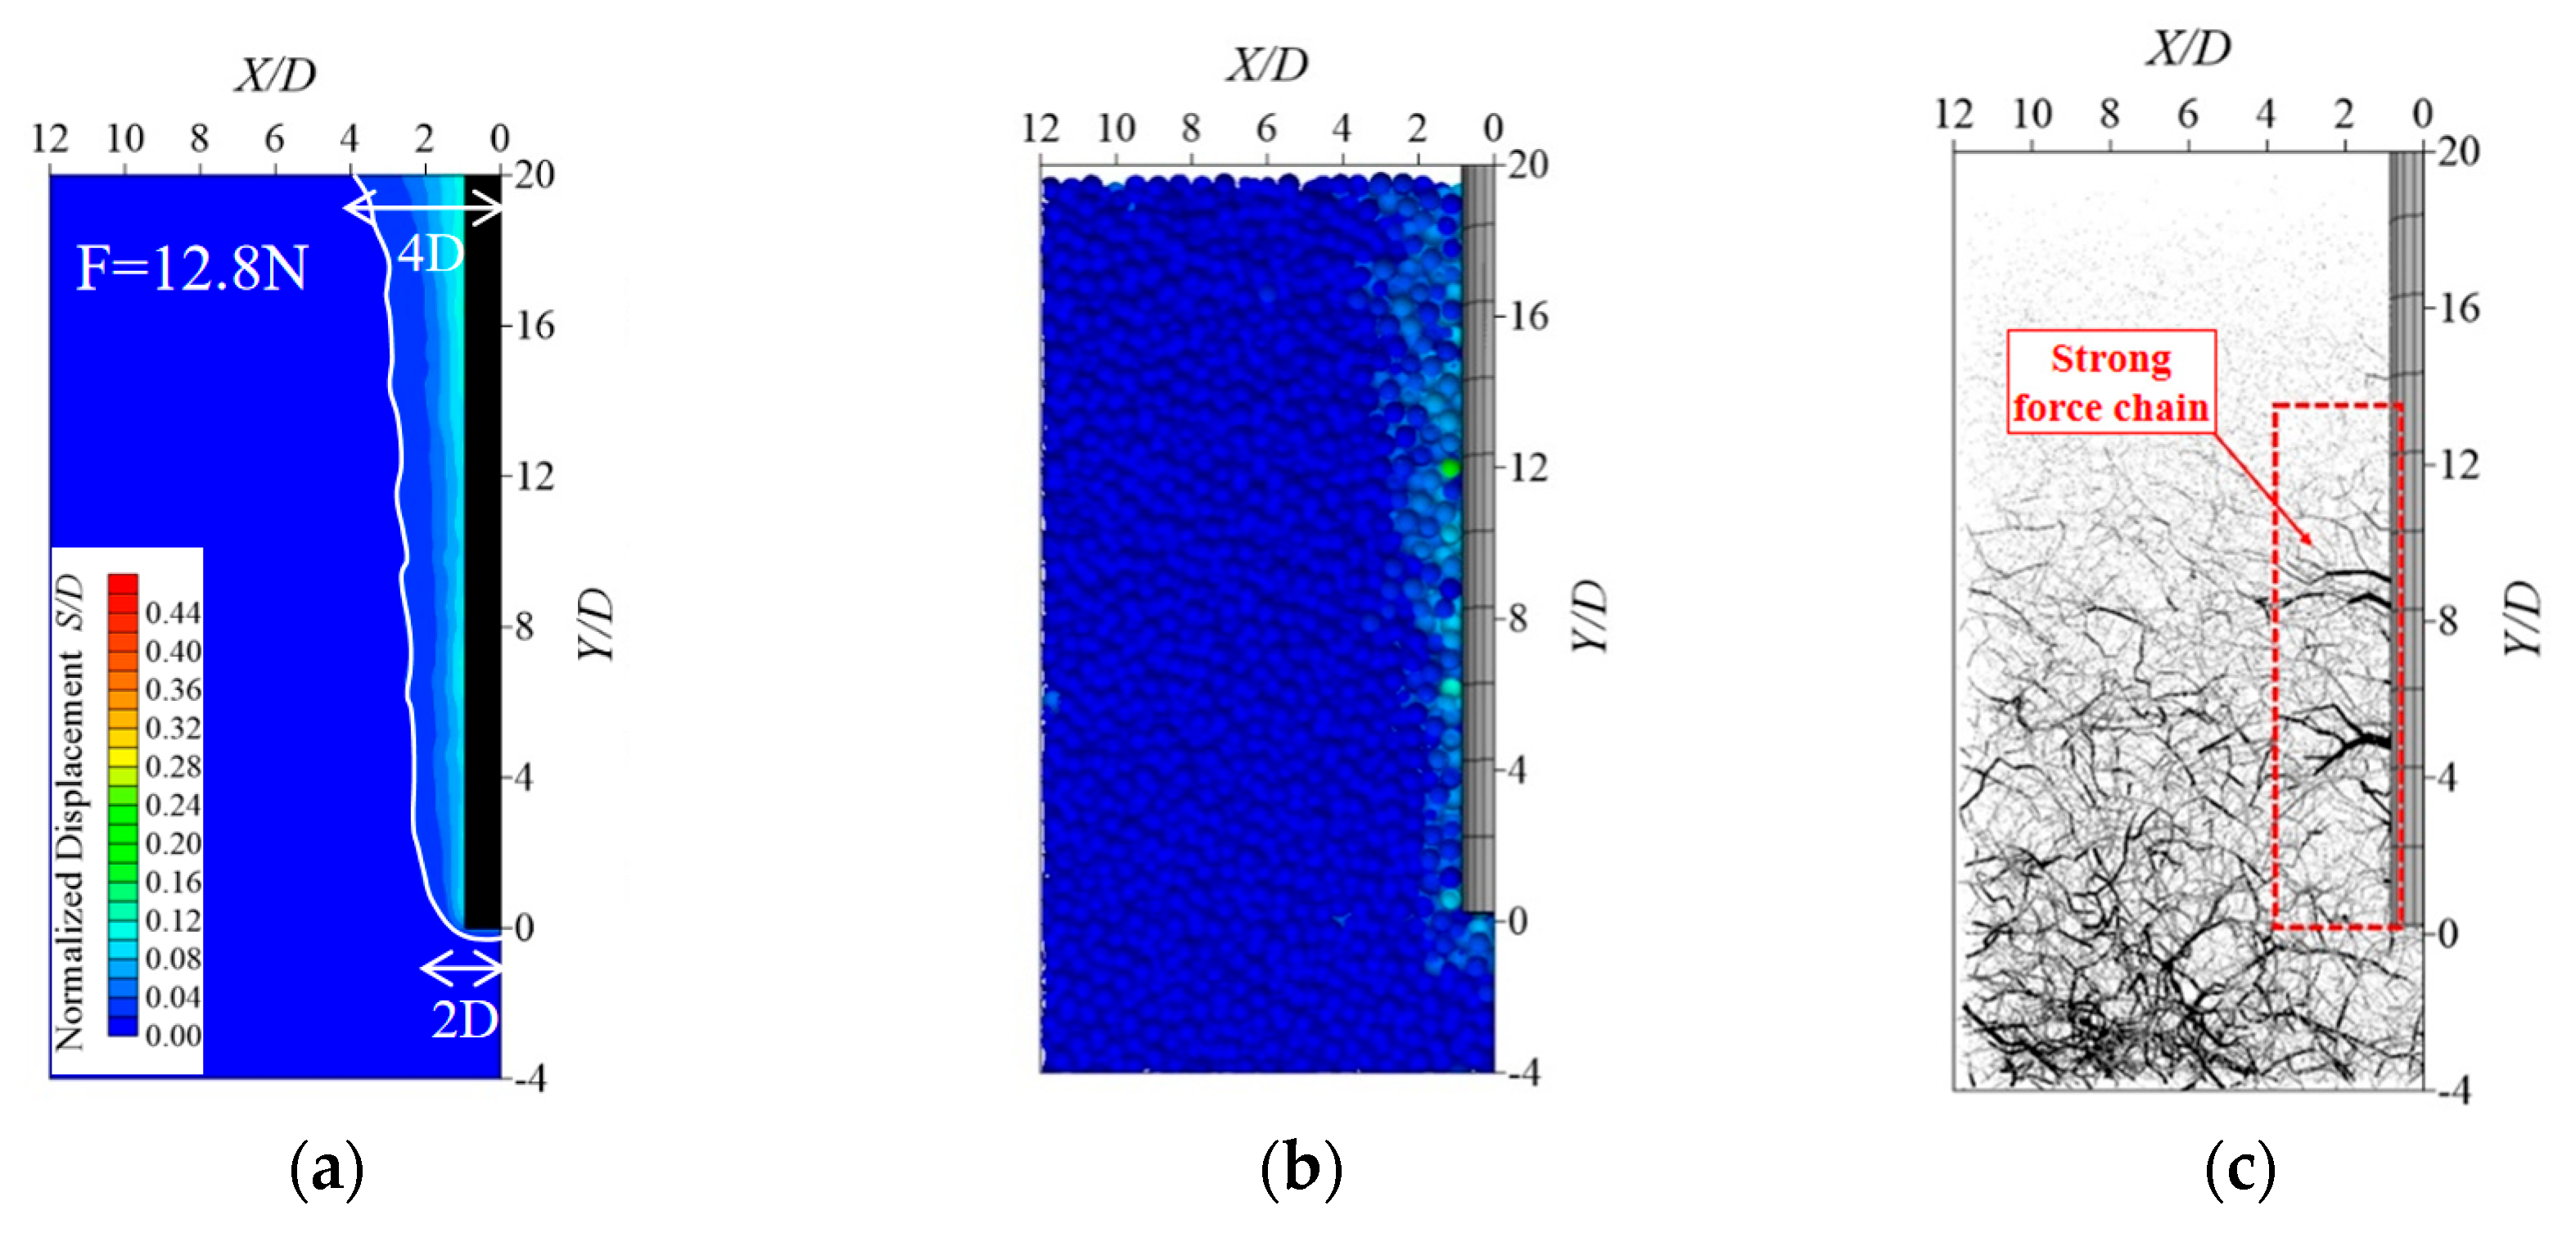
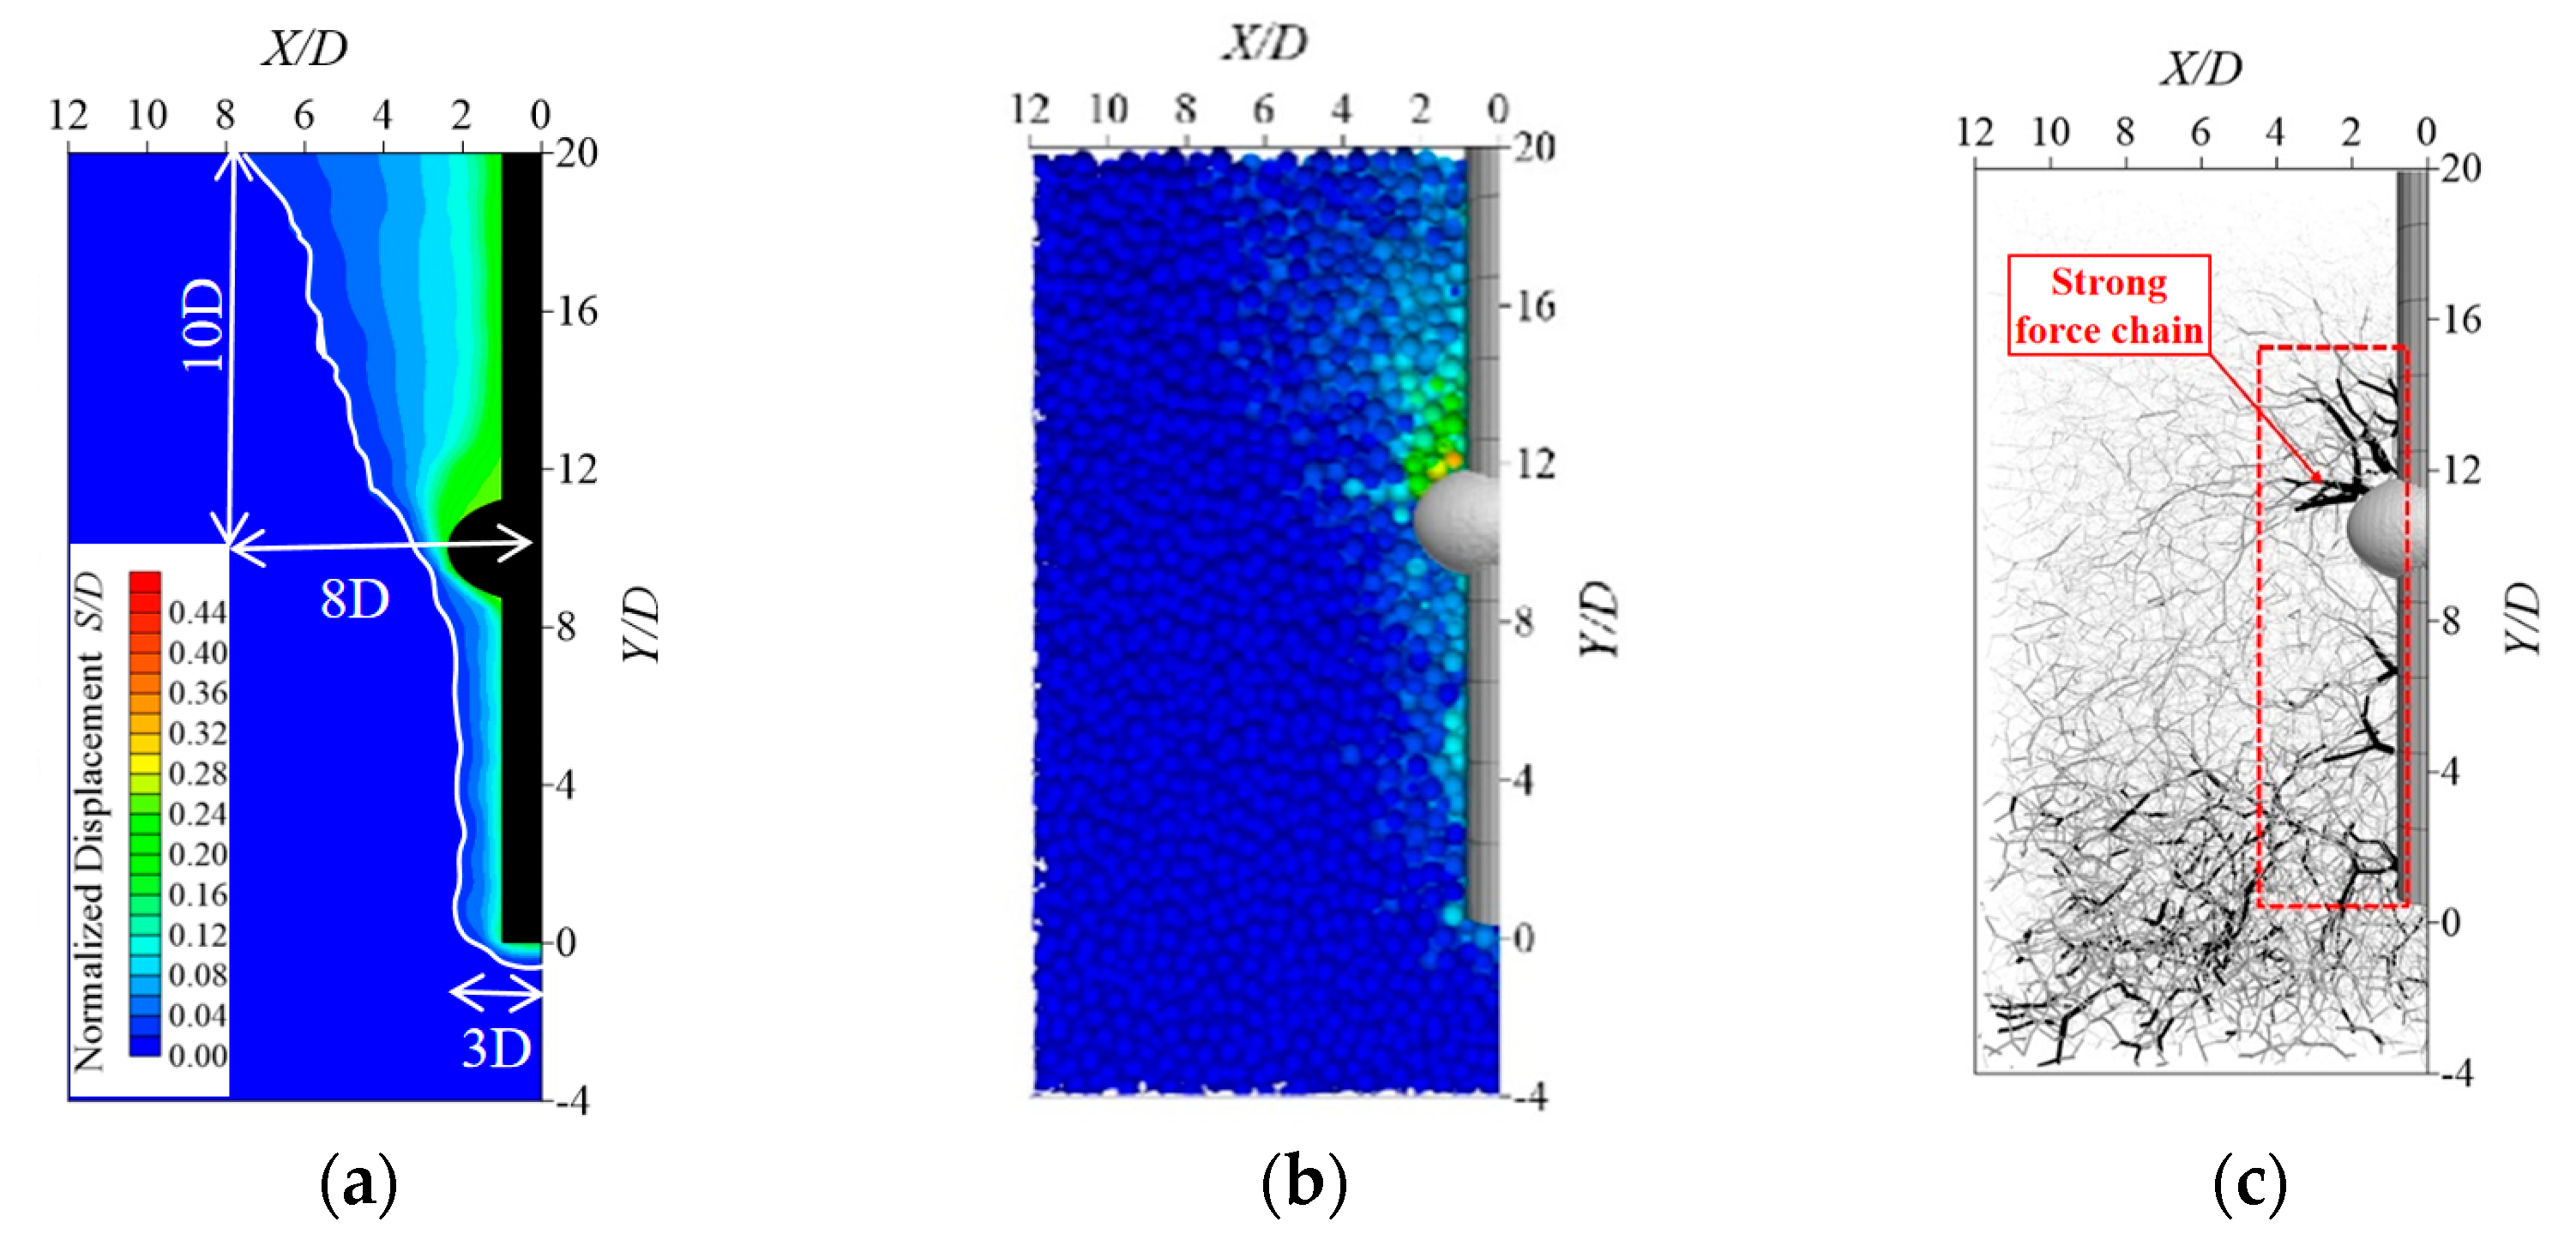
5.3. Soil Displacement Field Analysis
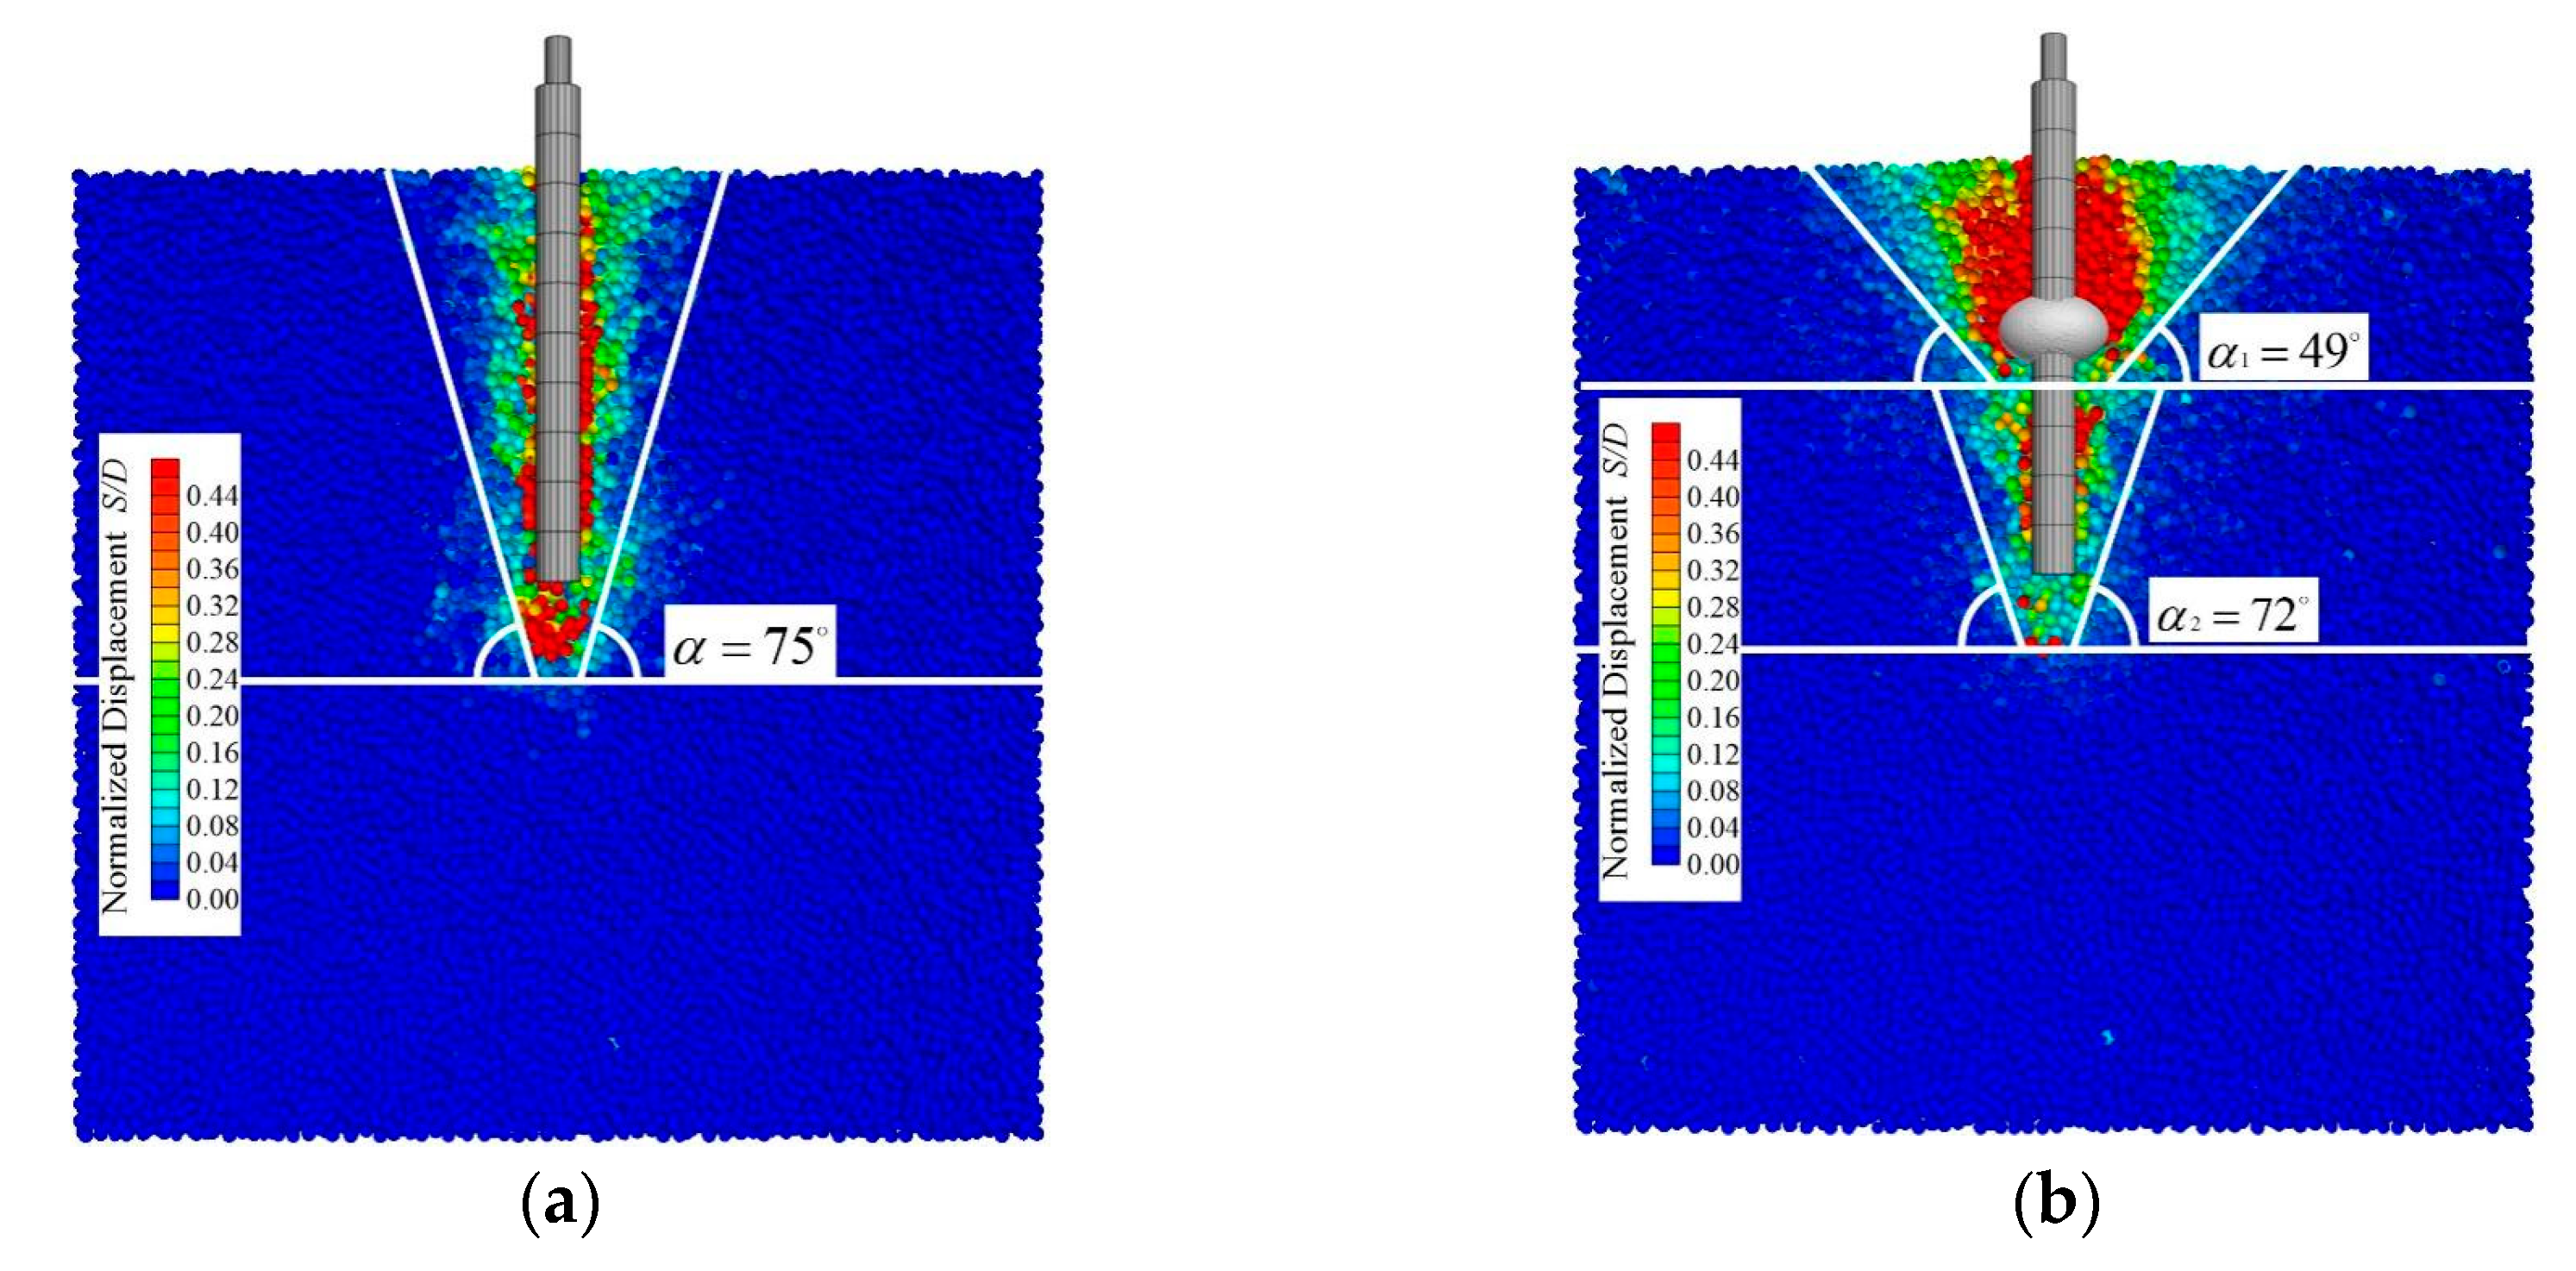
5.4. Analysis of Shear Damage Slip Fracture Surfaces and Surface Deformation
6. Analysis of the Influence of Boulder Position
7. Conclusions
- (1)
- The presence of boulders significantly enhances the overall bearing capacity of the pile. Specifically, boulders increase the effective cross-sectional diameter of the pile, providing additional vertical support. Additionally, boulders enhance load transfer pathways to the surrounding soil and expand the contact area, thereby extending the influence range of the pile on the surrounding soil.
- (2)
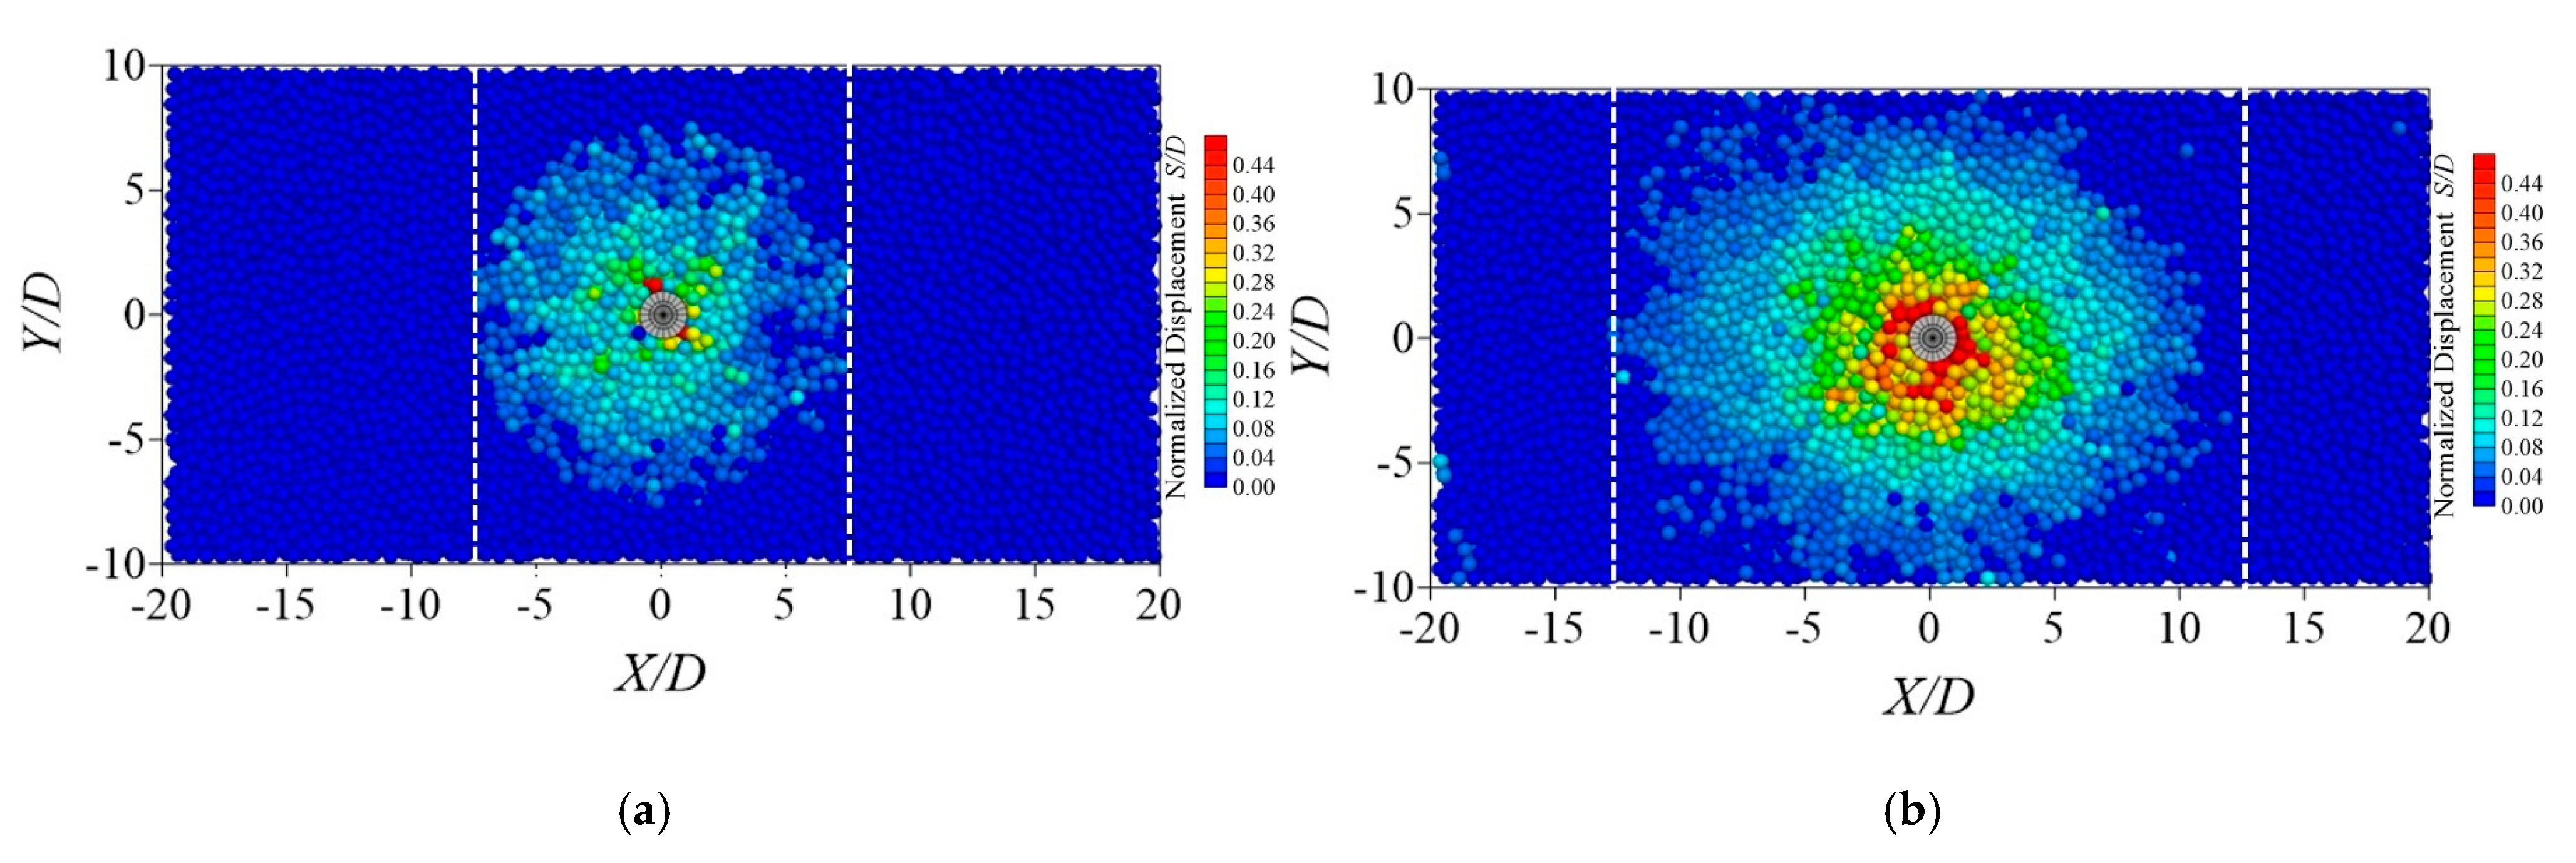
- During the pulling process of the planted pile, the vertical impact depth on the soil primarily concentrates within the length range of the pile body. The presence of boulders modifies the morphology and horizontal influence range of the soil displacement field. Under extreme uplift loads, the displacement field of the surrounding soil for piles without boulders exhibits an “inverted triangle” distribution, with the maximum horizontal influence range on the surface soil being approximately four times the pile diameter (4D). However, when a boulder is positioned within the pile, the displacement field around the pile shows an overall distribution of two “inverted trapezoids” with the horizontal influence range on the soil expanding from 6D above a boulder to 8D at the surface.
- (3)
- The presence of the isolated boulder can amplify the impact on the surrounding soil during the uplift failure of a grouted pile. When the cross-sectional area of an isolated boulder is approximately four times that of the pile and it is in the middle section of the pile, the distance to adjacent piles should be greater than eight times the pile diameter in engineering practice.
- (4)
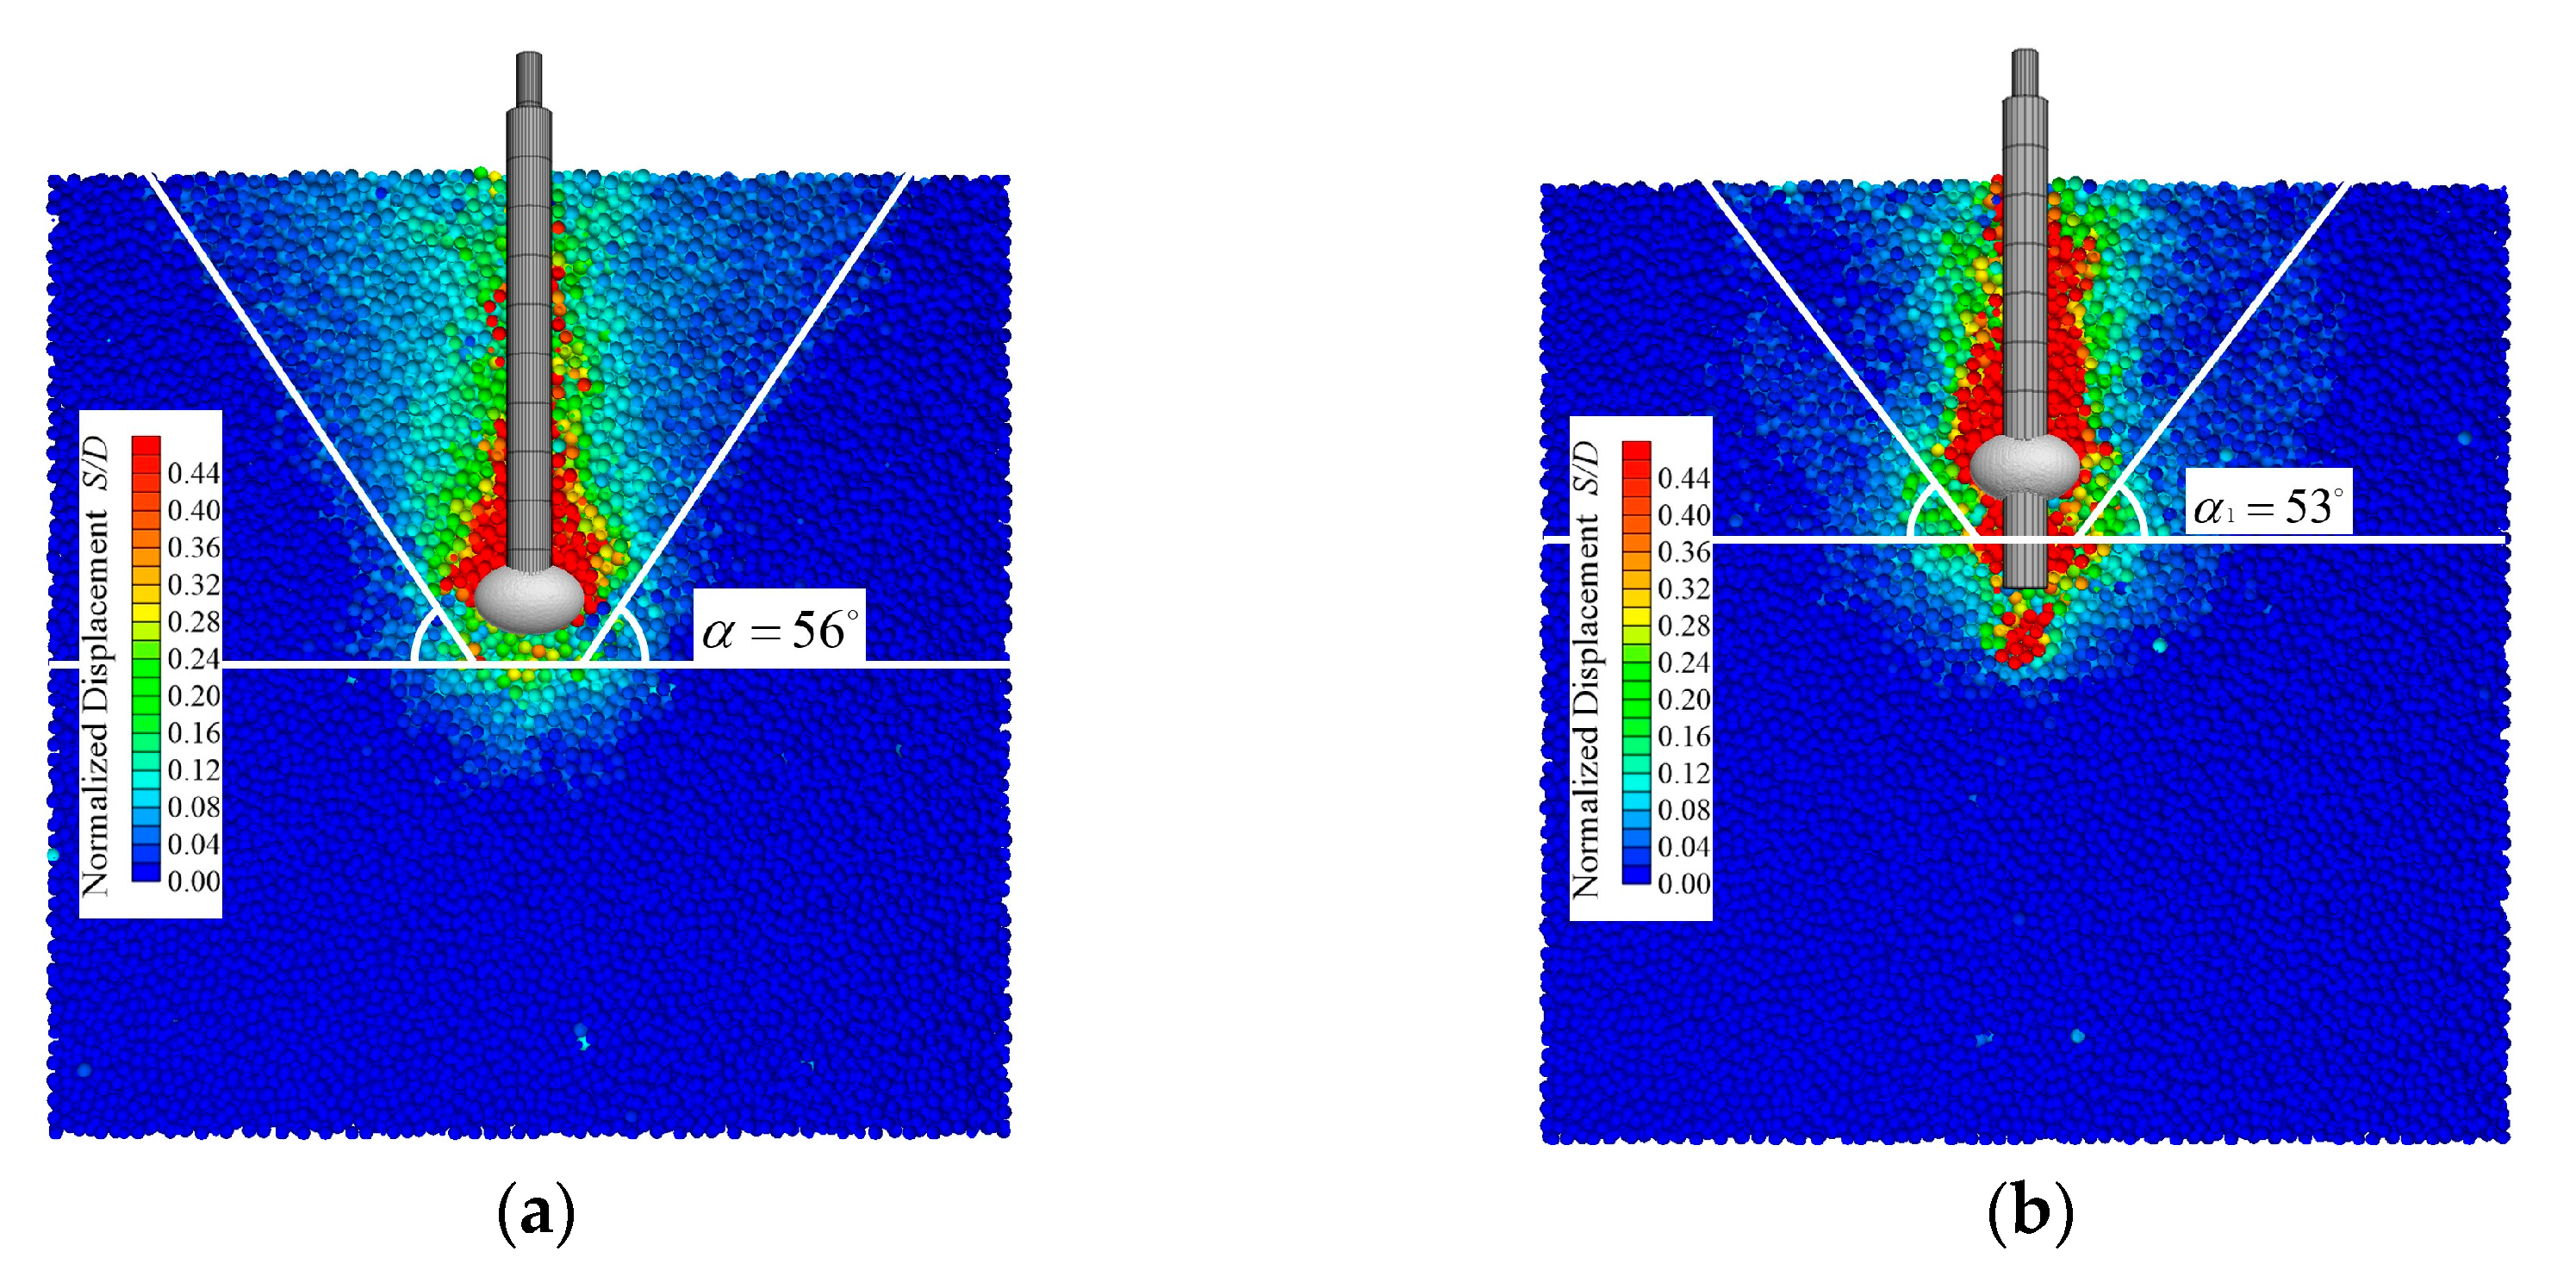
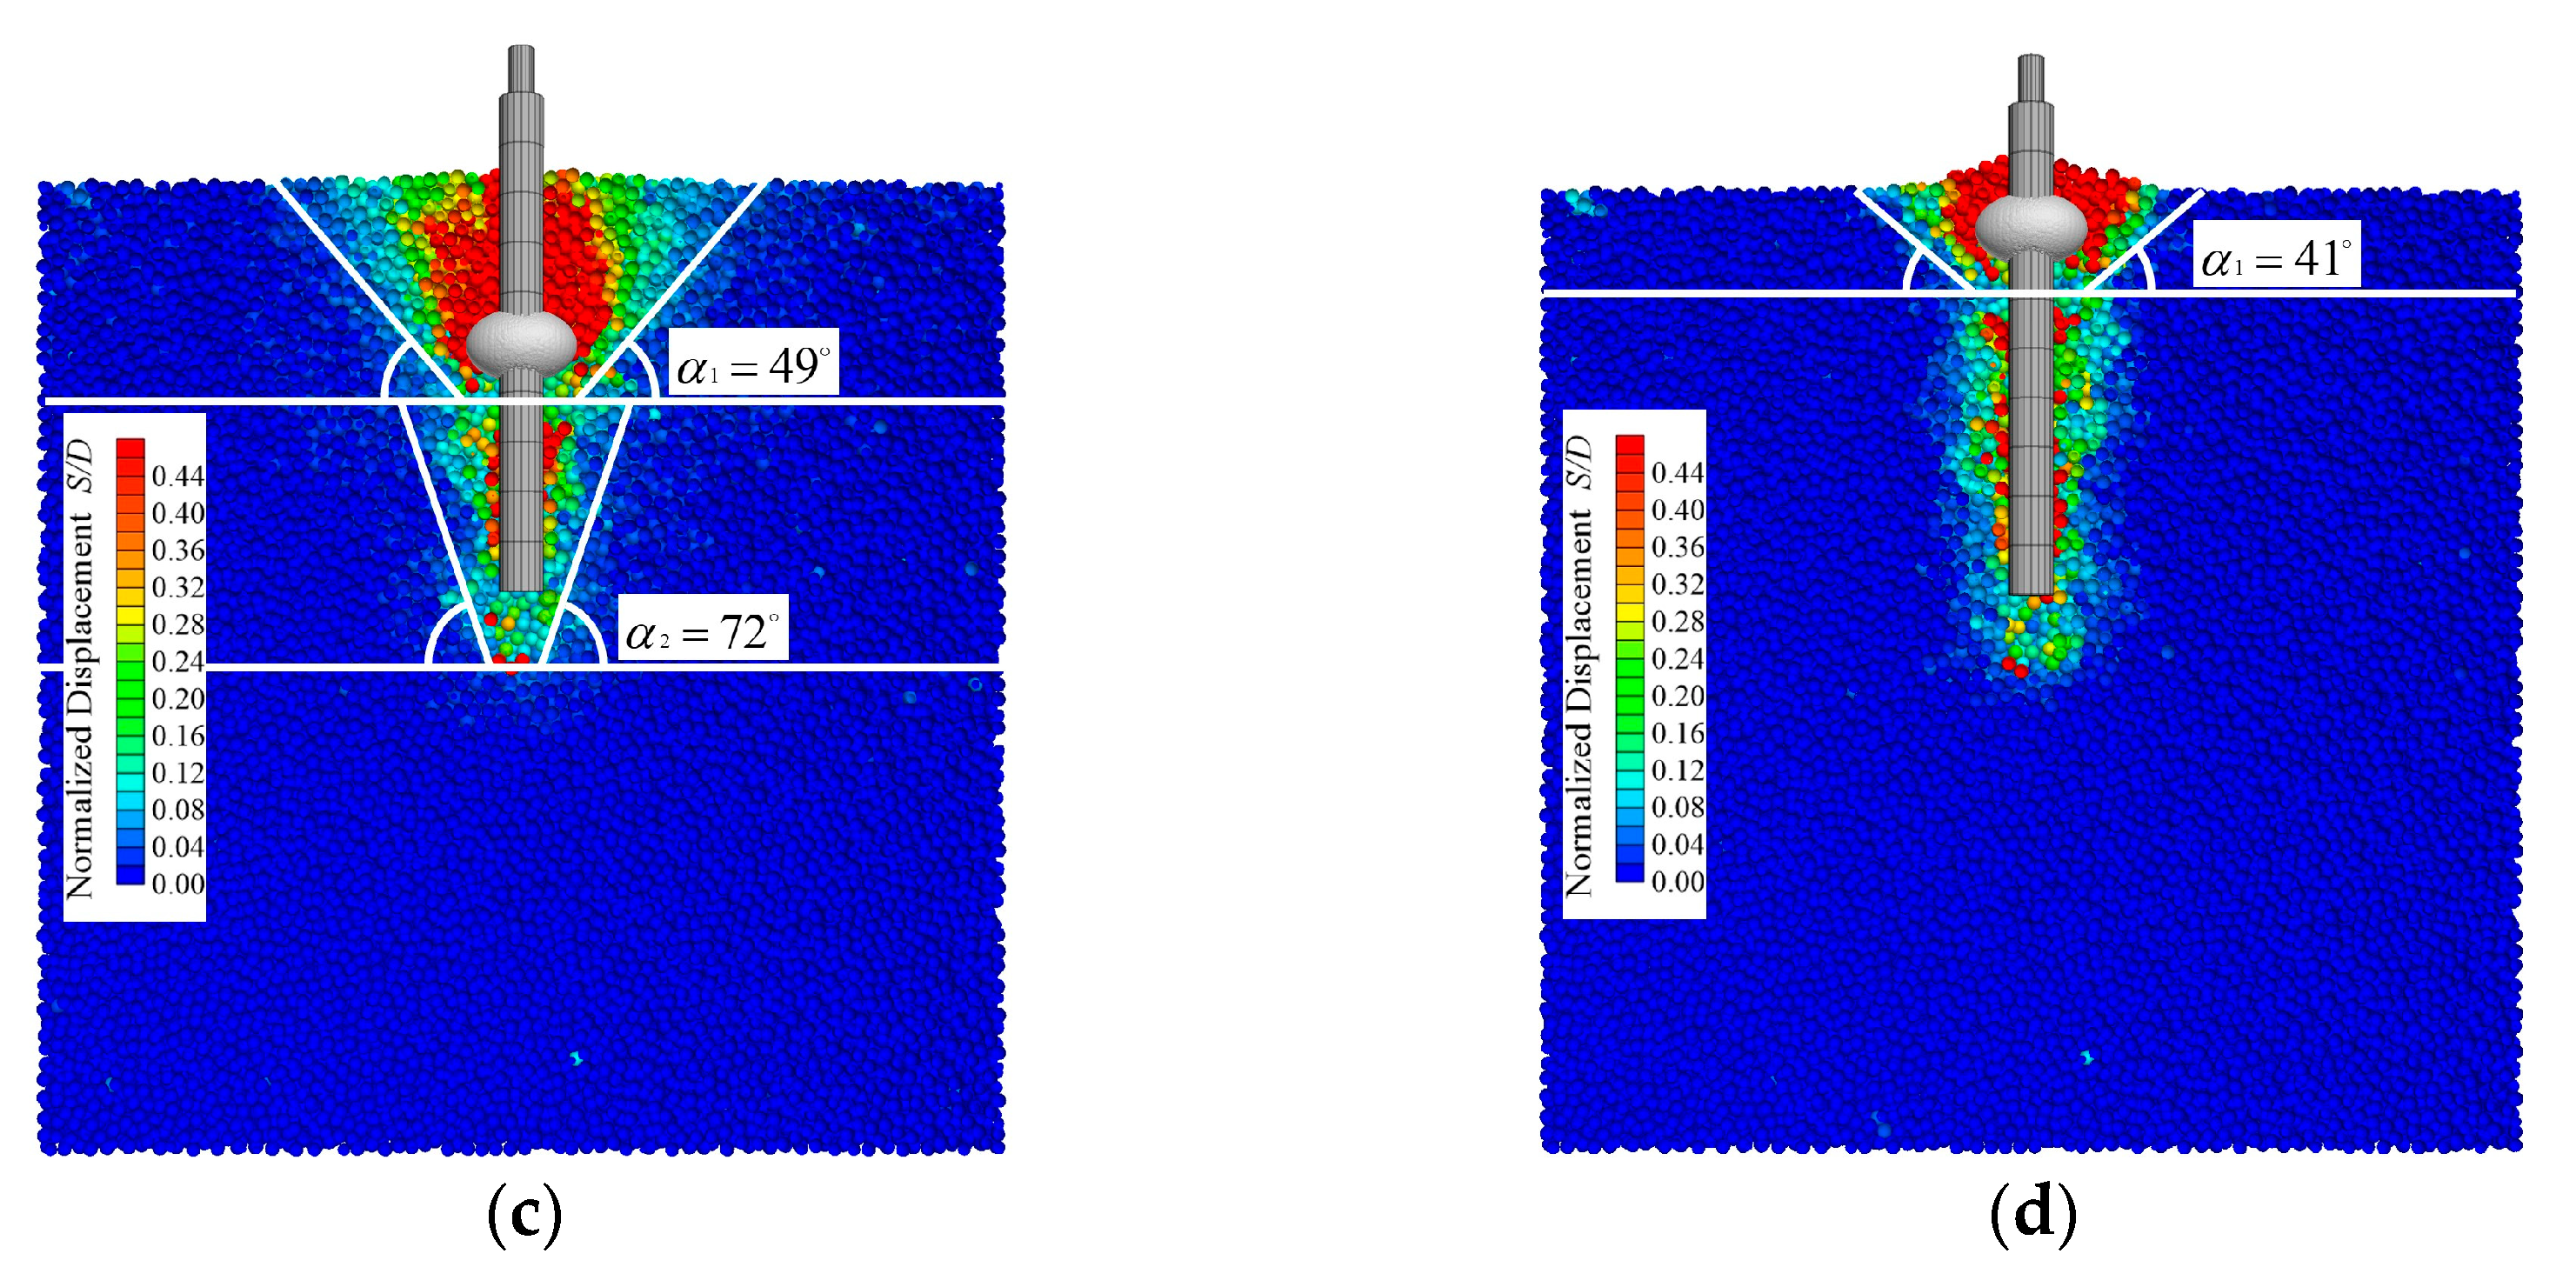
- The presence of a boulder alters the angle of the sliding failure surface of the pile, and as the burial depth of a boulder decreases, the angle of the sliding failure surface also gradually reduces. When the boulder is at distances of 0, 50, 100, and 150 mm from the end of the pile, the angles of the sliding failure surface of the pile are 56°, 53°, 49°, and 41°, respectively, whereas under the condition without a boulder, it is 75°.
- (5)
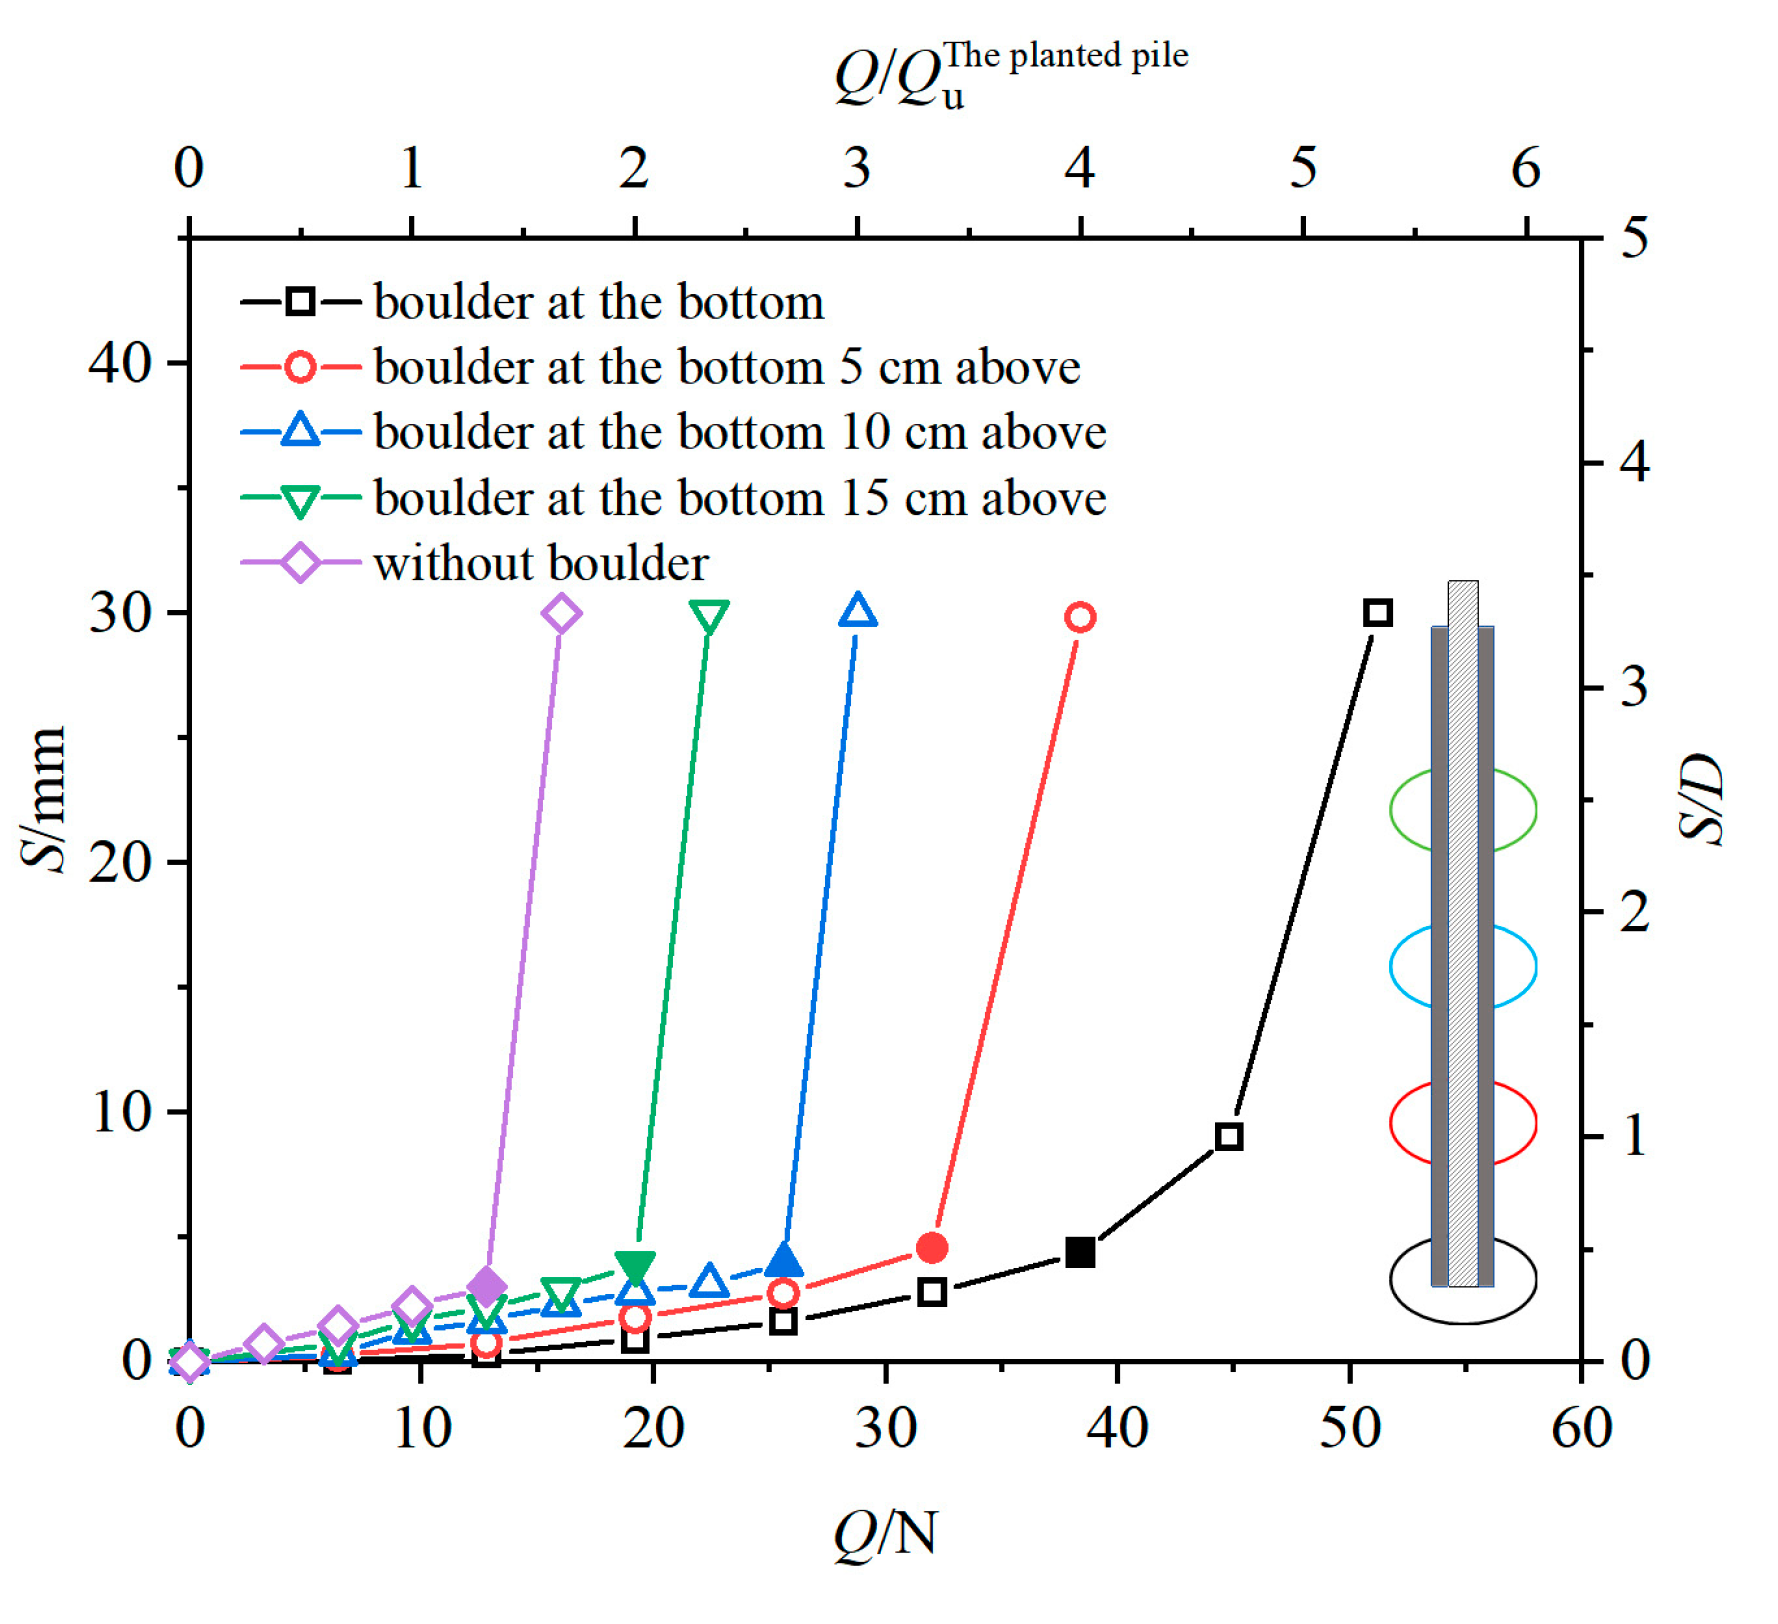
- Boulders significantly enhance the ultimate uplift bearing capacity of the pile. When a boulder is at distances of 0, 50, 100, and 150 mm from the end of the pile, the uplift bearing capacity of the pile increases by 3, 2.5, 2, and 1.5 times, respectively, compared to the piles without boulder. This is attributed to the additional uplift resistance provided by the overburden from the boulder. The thicker the overburden, the greater the vertical resistance, thereby significantly improving the uplift bearing capacity of the planted pile.
- (6)
- When the boulder is embedded in the middle or lower part of the pile, their effect on enhancing the bearing capacity of the pile is more pronounced. Therefore, in practical engineering, when considering the inclusion of the boulder in the bearing system, priority should be given to the boulder located near the design depth of the pile, with a preference for the boulder positioned at the pile tip.
Author Contributions
Funding
Institutional Review Board Statement
Informed Consent Statement
Data Availability Statement
Conflicts of Interest
References
- Doi, T.; Murono, Y.; Zhang, F.; Hirayama, Y. In-situ horizontal cyclic loading tests on composite foundation composed of soil bags and piles. Soils Found. 2023, 63, 101327. [Google Scholar] [CrossRef]
- He, Z.; Ye, A.; Wang, X. Local scour effects on seismic behavior of pile-group foundations in cohesionless soils: Insights from quasi-static tests. Ocean Eng. 2024, 311, 118886. [Google Scholar] [CrossRef]
- Karkee, M.B.; Kanai, S.; Horiguchi, T. Quality Assurance in bored PHC nodular piles through control of design capacity based on loading test data. In Proceedings of the 7th International Conference and Exhibition on Piling and Deep Foundations, Vienna, Austria, 15–17 June 1998. [Google Scholar]
- Zhang, Y.; Li, Z.; Mao, Y.; Zhao, W. Studies on applications of precast pile planting method. In Mart Geotechnics for Smart Societies; CRC Press: Boca Raton, FL, USA, 2023. [Google Scholar]
- Lu, Y.; Liu, H.L.; Ding, X.M.; Kong, G.Q. Field Tests on Bearing Characteristics of X-Section Pile Composite Foundation. J. Perform. Constr. Facil. 2012, 26, 180–189. [Google Scholar]
- Gao, S.; Chen, C.F.; Jiang, X.Q.; Zhu, S.M.; Cai, H.; Li, W. Transformer-based settlement prediction model of pile composite foundation under embankment loading. Comput. Geotech. 2024, 176, 106783. [Google Scholar] [CrossRef]
- Shao, W.; Shao, W.S.; Xu, Q.X.; Xu, X.Y.; Shi, W.H. Durability life prediction and horizontal bearing characteristics of CFRP composite piles in marine environments. Constr. Build. Mater. 2023, 367, 130116. [Google Scholar] [CrossRef]
- Wang, B.L.; Cui, C.Y.; Xu, C.S.; Meng, K.; Li, J.B.; Xu, L. A novel analytical solution for horizontal vibration of partially embedded offshore piles considering the distribution effect of wave loads. Ocean Eng. 2024, 307, 118179. [Google Scholar] [CrossRef]
- Li, J.B.; Cui, C.Y.; Xiao, Z.S.; Wang, B.L.; Xu, C.S. Reliability and sensitivity analyses of monopile supported offshore wind turbines based on probability density evolution method with pre-screening of controlling parameters. Ocean Eng. 2024, 310, 118746. [Google Scholar] [CrossRef]
- Cui, C.Y.; Liang, Z.M.; Xu, C.S.; Xin, Y.; Wang, B.L. Analytical solution for horizontal vibration of end-bearing single pile in radially heterogeneous saturated soil. Appl. Math. Model. 2023, 116, 65–83. [Google Scholar] [CrossRef]
- Aizebeokhai, A.P.; Olayinka, A.I.; Singh, V.S. Application of 2D and 3D geoelectrical resistivity imaging for engineering site investigation in a crystalline basement terrain, southwestern Nigeria. Environ. Earth Sci. 2010, 61, 1481–1492. [Google Scholar] [CrossRef]
- Hasan, M.; Shang, Y.J.; Meng, H.; Yi, X.T.; Shao, P. A novel approach to determine rock mechanical parameters using non-invasive geophysical methods. Int. J. Rock Mech. Min. Sci. 2022, 160, 105260. [Google Scholar] [CrossRef]
- Li, B.; Wu, L.; Xu, C.; Zuo, Q.; Wu, S.; Zhu, B. The Detection of the Boulders in Metro Tunneling in Granite Strata Using a Shield Tunneling Method and a New Method of Coping with Boulders. Geotech. Geol. Eng. 2016, 34, 1155–1169. [Google Scholar] [CrossRef]
- Zhou, J.J.; Wang, K.H.; Gong, X.N.; Zhang, R.H. Bearing capacity and load transfer mechanism of a static drill rooted nodular pile in soft soil areas. J. Zhejiang Univ. A Sci. 2013, 14, 705–719. [Google Scholar] [CrossRef]
- Zhou, J.P.; Huang, X.F.; Yuan, J.; Zhang, J.L.; Wang, X.M. Comparative Study on the Influence of Pile Length and Diameter on Bearing Capacity and Efficiency of Root Piles, Straight-Shaft Piles and Pedestal Piles. Arab. J. Sci. Eng. 2021, 46, 10439–10456. [Google Scholar] [CrossRef]
- Zhou, J.J.; Gong, X.N.; Wang, K.H.; Zhang, R.H.; Yan, T.L. A Model Test on the Behavior of a Static Drill Rooted Nodular Pile Under Compression. Mar. Georesources Geotechnol. 2016, 34, 293–301. [Google Scholar] [CrossRef]
- Engin, H.K.; Septanika, E.G.; Brinkgreve, R.B.J. Estimation of Pile Group Behavior using Embedded Piles. In Proceedings of the International Association for Computer Methods and Advances in Geomechanics, Goa, India, 1–6 October 2008; pp. 1–6. [Google Scholar]
- Dickin, E.A.; Leung, C.F. Performance of piles with enlarged bases subject to uplift forces. Can. Geotech. J. 1990, 27, 546–556. [Google Scholar] [CrossRef]
- Ilamparuthi, K.; Dickin, E.A.; Muthukrisnaiah, K. Experimental investigation of the uplift behaviour of circular plate anchors embedded in sand. Can. Geotech. J. 2002, 39, 648–664. [Google Scholar] [CrossRef]
- Schafer, M.; Madabhushi, S.P.G. Uplift Resistance of Enlarged Base Pile Foundations. Indian Geotech. Soc. 2019, 50, 426–441. [Google Scholar] [CrossRef]
- Abdelgwad, A.; Nasr, A.; Azzam, W. Utilization of enlarged base to improve the uplift capacity of single pile in sand—Model study. Innov. Infrastruct. Solut. Off. J. Soil-Struct. Interact. Group Egypt (SSIGE) 2022, 7, 317. [Google Scholar] [CrossRef]
- Jiang, Q.B.; Zhou, J.; Zeng, Q.Y. Model Test and PFC2D Numerical Analysis on Soil Arching Effects Surrounding Passive Laterally Loaded Piles. In Soil Behavior and Geo-Micromechanics; ASCE: Reston, VA, USA, 2010. [Google Scholar]
- Yang, T.T.; Zheng, W.C.; Xie, Y.L.; Zhang, H.G.; Yue, X.B. Evaluating screw-shaft pile composite foundations in round Gravelly soil: A study using model tests and numerical simulations. Heliyon 2023, 9, 20887. [Google Scholar] [CrossRef]
- Cai Jun Du, G.Y.; Xia, H.; Sun, C.S. Model Test and Numerical Simulation Study on Bearing Characteristics of Pervious Concrete Pile Composite Foundation. KSCE J. Civ. Eng. 2021, 25, 3679–3690. [Google Scholar]
- Lu, X.; Mengen, S.; Wang, P. Numerical simulation of the composite foundation of cement soil mixing piles using FLAC3D. Clust. Comput. 2019, 22, 7965–7974. [Google Scholar] [CrossRef]
- Zhao, H.; Zhang, J.; Qiu, P.; Ji, S. Hierarchical Modeling Method for DEM Simulation and Its Application in Soil–Pile–Cap Interaction and Impact Case. Int. J. Geomech. 2019, 19, 04019076. [Google Scholar] [CrossRef]
- Zhou, J.; Zhu, K.; Liu, C. Research on shear characteristics of pile–soil interface under cyclic loading. IOP conference series. Earth Environ. Sci. 2024, 1332, 12023. [Google Scholar]
- Gao, T.; Chen, Y.J.; Yan, F.; Li, Y.L. Meso-numerical analysis of pile and soil stability under discrete element-one finite difference cross-scale coupling. Comput. Aided Eng. 2021, 30, 10060871. [Google Scholar]
- Tan, X.; Hu, Z.B.; Feng, L.J.; Zhao, M.H. Three-dimensional discrete-continuous medium coupled numerical simulation of rubble pile model test in soft soil. Chin. J. Geotech. Eng. 2021, 43, 347–355. [Google Scholar]
- Guo, Y.; Cai, X.; Gu, M. Bearing Capacity and Deformation of the Tandem Compound Piles Improved Foundation: A Parametric Study. Materials 2023, 16, 5737. [Google Scholar] [CrossRef]
- Wang, Z.; Zhang, R.; Xie, X.; Wang, Z. Field Tests and Simplified Calculation Method for Static Drill Rooted Nodular Pile. Adv. Civ. Eng. 2019, 479, 5841840. [Google Scholar] [CrossRef]
- Yang, Y.; Lei, J.; Deng, D.; Zou, Y. Model test and analysis of soil displacement of cone-perforated column composite pipe pile under static pressure. IOP Conf. Ser. Earth Environ. Sci. 2021, 769, 32072. [Google Scholar] [CrossRef]
- Liu, R.; Liang, C. Study of the Bearing Capacity at the Variable Cross-Section of A Riser-Surface Casing Composite Pile. China Ocean Eng. 2021, 35, 262–271. [Google Scholar] [CrossRef]
- Ni, Q.; Hird, C.C.; Guymer, I. Physical modelling of pile penetration in clay using transparent soil and particle image velocimetry. Géotechnique 2010, 2, 121–132. [Google Scholar] [CrossRef]
- Hird, C.C.; Ni, Q.; Guymer, I. Physical modelling of deformations around piling augers in clay. Géotechnique 2011, 11, 993–999. [Google Scholar] [CrossRef]
- Liao, W.L.; Cai, Q.P.; Guo, X.Y.; Lin, H.; Zhou, J.J.; Su, S.Z. Experimental Study on the Uplift Bearing Capacity of Pre-Drilled Planted Piles in Isolated Stone Strata Based on Transparent Soil Technology. Appl. Sci. 2025, 15, 304. [Google Scholar] [CrossRef]
- Xiamen Geological Engineering Survey Institute. Geotechnical Investigation Report for the New Sports Center Project; Project No. XM-2020-009; Xiamen Geological Engineering Survey Institute: Xiamen, China, 2020. [Google Scholar]
- Cao, Z.H. Experimental study of soil displacement field modeling during pile sinking based on PIV technology. Eng. Mech. 2014, 31, 168–174. [Google Scholar]


| Material | Refractive Index |
|---|---|
| Fused quartz sand | 1.4585 |
| N-dodecane | 1.4215 |
| No. 15 white oil | 1.460 |
| Condition | Pile Type | Core Pile Outer Diameter D1/mm | Core Pile Wall Thickness t1/mm | Caliber D/mm | Core Pile Wall Thickness t2/mm | Pile Length L/mm |
|---|---|---|---|---|---|---|
| 1 | Planted piles without boulder | 10 mm | 1.5 mm | 18 mm | 4 mm | 200 mm |
| 2 | Planted piles with boulder | 10 mm | 1.5 mm | 18 mm | 4 mm | 200 mm |
| Name | Unit | Effective Modulus E MPa | Stiffness Ratio - - | Friction Coefficient F - |
|---|---|---|---|---|
| Soil–soil | Ball–Ball | 100 | 1.5 | 0.4 |
| Soil–boulder | Ball–Ball | 50 | 1.5 | 0.3 |
| Soil–pile | Ball–Ball | 50 | 1.5 | 0.5 |
| Pile–boulder | Ball–Ball | 500 | 1.5 | 0.7 |
| Name | Constitutive Model | Weight Density γ kN/m3 | Elastic Modulus E GPa | Poisson’s Ratio - - | Cohesion c kPa | Friction Angle φ ° |
|---|---|---|---|---|---|---|
| The core pile | Elasticity | 27 | 70 | 0.33 | - | - |
| The outer concrete | Elasticity | 12 | 2 | 0.38 | - | - |
Disclaimer/Publisher’s Note: The statements, opinions and data contained in all publications are solely those of the individual author(s) and contributor(s) and not of MDPI and/or the editor(s). MDPI and/or the editor(s) disclaim responsibility for any injury to people or property resulting from any ideas, methods, instructions or products referred to in the content. |
© 2025 by the authors. Licensee MDPI, Basel, Switzerland. This article is an open access article distributed under the terms and conditions of the Creative Commons Attribution (CC BY) license (https://creativecommons.org/licenses/by/4.0/).
Share and Cite
Liao, W.; Cai, Q.; Lin, H.; Zhou, J.; Su, S.; Guo, X. Study on Vertical Uplift Resistance Characteristics of Pre-Drilled Planted Piles in Boulder Strata. Appl. Sci. 2025, 15, 3150. https://doi.org/10.3390/app15063150
Liao W, Cai Q, Lin H, Zhou J, Su S, Guo X. Study on Vertical Uplift Resistance Characteristics of Pre-Drilled Planted Piles in Boulder Strata. Applied Sciences. 2025; 15(6):3150. https://doi.org/10.3390/app15063150
Chicago/Turabian StyleLiao, Wenli, Qipeng Cai, Hao Lin, Jiajin Zhou, Shizhuo Su, and Xiangyu Guo. 2025. "Study on Vertical Uplift Resistance Characteristics of Pre-Drilled Planted Piles in Boulder Strata" Applied Sciences 15, no. 6: 3150. https://doi.org/10.3390/app15063150
APA StyleLiao, W., Cai, Q., Lin, H., Zhou, J., Su, S., & Guo, X. (2025). Study on Vertical Uplift Resistance Characteristics of Pre-Drilled Planted Piles in Boulder Strata. Applied Sciences, 15(6), 3150. https://doi.org/10.3390/app15063150