1. Introduction
Achieving an effective shear connection between the various materials involved is the primary challenge in steel–concrete composite construction. Early studies in this field primarily utilized experimental techniques, particularly push-out tests, to evaluate shear performance [
1,
2,
3,
4]. Among the various types of shear connectors, the headed stud connector quickly gained the most attention due to its simple design and construction efficiency [
5,
6]. Scientific experiments and comprehensive research [
7,
8,
9] have provided valuable insights into shear connections employing headed studs, influencing their integration into applications and design standards such as Eurocode [
10]. However, ongoing laboratory investigations and numerical analyses continue to enhance our knowledge of the actual behavior of these connections.
Numerical methods are becoming increasingly important in the analysis of composite structures. It has become common practice in structural analysis to create numerical models that are validated by a small number of laboratory tests rather than conducting extensive laboratory experiments. Although three-dimensional finite element (FE) models offer many benefits, some configurations may lack accuracy due to their complexity and the wide range of possible parameters. Consequently, validation through laboratory experiments, as demonstrated in [
11,
12], has become an essential and widely accepted best practice; it offers both economic and sustainability benefits and additionally enables numerical models to support further scientific research, as shown in [
13,
14].
Previous investigations have revealed several parameters that influence the behavior of steel–concrete composite action [
15,
16]. The load–displacement performance of the connection is influenced by the shank diameter, height, and tensile strength of the studs, in addition to the compressive strength and elastic modulus of the concrete. According to Driscoll and Slutter [
17], the connector’s height to diameter (hd) ratio must be at least 4 in order to obtain the best shear performance. Improving the shear capacity of stud connectors in steel–concrete composite connection requires this minimum ratio. An and Cederwall [
18] performed a series of push-out tests to examine the behavior of stud shear connectors in both normal and high strength concrete. It has been demonstrated that the strength of the concrete has a considerable effect on the shear capacity of the studs. It was observed that the addition of transverse reinforcement had a minimal effect in high-strength concrete, while it exhibited more noticeable effects in normal-strength concrete. Based on these observations, a design formula has been developed that incorporates the interaction between the studs and the surrounding concrete. Numerous studies have examined this area more recently, with a particular emphasis on the importance of concrete properties in the steel–concrete composite connection. Du et al. [
19] carried out an extensive study on the effect of ultra-high-performance concrete (UHPC) on composite action, examining various height of shear studs, focused on the reduced thickness of UHPC bridge deck slabs, ranging from 35 to 60 mm. In such configurations, the h/d ratio can be less than 4. The study concluded that the shear performance of a stud is influenced by the mechanical properties of both the concrete and the stud. For a fixed stud strength, an increase in concrete strength results in a higher shear force, bringing closer to its maximum shear capacity. Although high-strength concrete improves the utilization of stud shear capacity, it simultaneously decreases the total slip of the shear connection. Therefore, it is crucial to achieve an optimal balance between the strengths of the concrete and studs in order to maximize the load–displacement performance of the connection. Qi et al. [
20] examined the numerical and experimental behavior of steel–concrete composite connections utilizing UHPC. This parametric study investigated the effects of concrete strength, stud diameter, and the height-to-diameter (h/d) ratio on the load–displacement performance of steel–concrete composite connections. The findings revealed that concrete strength plays a critical role in the behavior of the connection. Specifically, for concrete with a compressive strength of 160 MPa, the study emphasized the significant impact of stud diameter on connection performance, while the height-to-diameter (h/d) ratio was found to have a negligible effect under these concrete strength conditions. In the literature, it is observed that different modeling approaches are adopted, such as how materials are considered. Advanced numerical models take into account numerous parameters that influence the actual behavior of the connection [
21]. Variations or refinements of a single parameter can lead to different outcomes. For instance, the study [
20] does not address the descending stage of concrete’s post-load capacity due to its difficult modeling. However, other studies [
22,
23] emphasize the significant role of accurately modeling the real mechanical behavior of concrete. Kim et al. [
24] carried out static push-out tests on headed studs embedded in UHPC and observed that the aspect ratio could be reduced from 4 to 3.1 without compromising the shear strength. The absence of splitting cracks in the UHPC slab indicated that the connection functioned efficiently. The stud shear connectors primarily exhibited shearing behavior instead of bending, which can be ascribed to the enhanced stiffness and strength of the surrounding concrete. Wang et al. [
25] and Cao et al. [
26] have established that, within the context of UHPC, stud connectors with height-to-diameter (h/d) ratios between 2 and 6 exhibit similar behavior. Consequently, short shear studs are capable of developing full strength in UHPC slabs. Xu and Sugiura [
27] examined different stud diameters (d) and heights (h) alongside various compressive strengths of concrete (30, 40, 50 MPa) and highlighted that lower concrete strength could result in more noticeable bending deformation alongside shear deformation. Using finite-element numerical simulations, Nguyen et al. [
28] analyzed studs with diameters exceeding 22 mm. Their findings indicated that both the size of the studs and the strength of the concrete are critical factors influencing the load capacity of the connection.
Okada et al. [
29] used finite element simulations to investigate the shear performance of grouped-stud connectors and examined how longitudinal spacing affects the connection. A validated numerical parameter analysis was conducted, considering different longitudinal spacings and concrete strengths. The maximum load was observed when the stud spacing was 13d. At lower concrete compressive strengths (e.g., C25/30), variations in shear strength were significantly greater, whereas at higher compressive strengths (e.g., C50/60), these variations were considerably reduced, particularly when analyzed concerning longitudinal spacing. This observation highlights the dependency of shear performance on both material properties and stud configuration, warranting further investigation to optimize structural design parameters. Spremic et al. [
30] studied the longitudinal spacing and provided the work of Okada et al. [
29], especially regarding the reduction factor. Xu et al. [
31] conducted a parametrical FEM analysis incorporating damage plasticity. The analysis assessed lateral bending moments leading to maximum concrete crack widths of 0.1 mm and 0.2 mm, with shank diameters varying from 13 mm to 22 mm and stud heights of 80 mm and 100 mm. The study found that larger shank diameters reduced the impact of biaxial effects, while concrete cracks caused by initial bending negatively affected shear stiffness. Furthermore, push-out tests were conducted to examine the decrease in shear stiffness and shear capacity of grouped studs. Yasar et al. [
32] studied the optimum spacing and optimal positioning of the steel studs. Recently, Ding et al. [
33] investigated the shear performance of GSC embedded in UHPC. Seven sets of push-out tests have been performed, each with different parameters such as stud spacing, stud diameter, and h/d ratio. It was found that the stud diameter significantly affected the shear behavior of GSC, while reducing the stud spacing had minimal effect on shear strength and relative slip. It was observed that decreasing the spacing from 4d to 2.5d resulted in a noticeable decline in the load–displacement performance of the steel–concrete composite connection. The stud aspect ratio had little impact on shear strength or stiffness, with only slight variations in relative slip observed when the aspect ratio decreased from 4.2 to 3.2. The findings indicated that a stud with an aspect ratio of 3.2 is acceptable for GSC embedded in thinner UHPC slabs. Lu et al. [
34] investigated the shear performance of grouped-stud connectors, noting that the grouped stud effect is influenced by the overlapping compression-cracking zones within the concrete between the studs. They observed that when stud groups are closely spaced, the reduction in the average shear capacity of individual studs must be considered. If the stud spacing in the direction of load application is less than 13 times the stud diameter, the grouped-stud effect should be incorporated into the design to account for the reduction in shear force capacity. While they observed variations in concrete strength, the authors did not consider these variations to be of significant importance, which aligns with findings presented by Wang et al. [
35]. Wang et al. [
36] studied the mechanical behavior of steel-UHPC connections, examining factors such as stud configuration, casting method, infill material, precast deck strength, and transverse reinforcement ratio. Their push-out tests revealed that while the grouped arrangement of large studs caused only minor reductions in ultimate shear strength compared to individual stud specimens, group effects were more noticeable in the interfacial slip of normal-strength concrete (NSC) specimens. This was likely due to overlapping transverse stresses and splitting tensile cracks. In contrast, UHPC specimens showed minimal damage, with no visible cracks, indicating better confinement of the studs by the surrounding concrete and more efficient load transfer mechanisms.
It can be concluded that numerous influential studies have been conducted in this area, investigating the actual performance of steel–concrete composite action. A majority of these investigations utilized both laboratory and numerical testing to uncover new insights, and it is standard practice to validate numerical models through laboratory experiments, resulting in scientifically derived numerical outcomes. In the context of steel–concrete composite connections, the influence of several key factors on connection performance has been systematically examined, including stud geometry such as length, diameter, and their ratios; stud material; stud positioning; concrete compressive strength and stiffness; consideration of different nonlinear material models for concrete; and the role of transverse reinforcement on the connection behavior.
Based on the most important papers in this field, it can be stated that the laboratory and various numerical modeling of individual factors were typical, where the effect of each parameter was examined using traditional, manual modeling methods. In numerical modeling, the development of a new model for each parameter adjustment is often a time-intensive process due to the intricate nature of the modeling procedures, which also increases the potential for errors. The present study utilized Abaqus to develop a FE model, assembled through a Python script. This approach allows for the free selection and modification of key parameters, including the geometry, size, and position of each partition. The numerical model was constructed with a comprehensive understanding of the Python code at each modeling step. This methodology enables the automated generation of models with varying geometries without any failures. The numerical model was validated through experimental laboratory tests. The validated model was then used to systematically generate and analyze the effect of key parameters on the load–displacement performance of steel–concrete composite connections. The parameters employed in the article are applicable for normal (ambient) temperatures. However, when fire exposure is considered in high-temperature analyses, the use of the proposed parameters should be avoided. Bolina and Rodrigues [
37] conducted a comprehensive investigation into the relevant parameters that must be considered for the high-temperature analysis of structural interfaces.
For the reasons outlined above, the objective of the research is to investigate the effects of various geometric factors on steel–concrete composite structures through an automated modeling method for model generation. A consistent model should facilitate the modification of parameters, either individually or collectively, in such a manner that the other factors dynamically respond to and adapt to these parameter modifications during the model creation process, ensuring the acquisition of accurate results without errors. Within the same modeling environment, it should not only be possible to examine a single parameter, but, ideally, the effects of as many geometric parameters as possible on steel–concrete composite connections should also be investigated.
2. Experimental Program
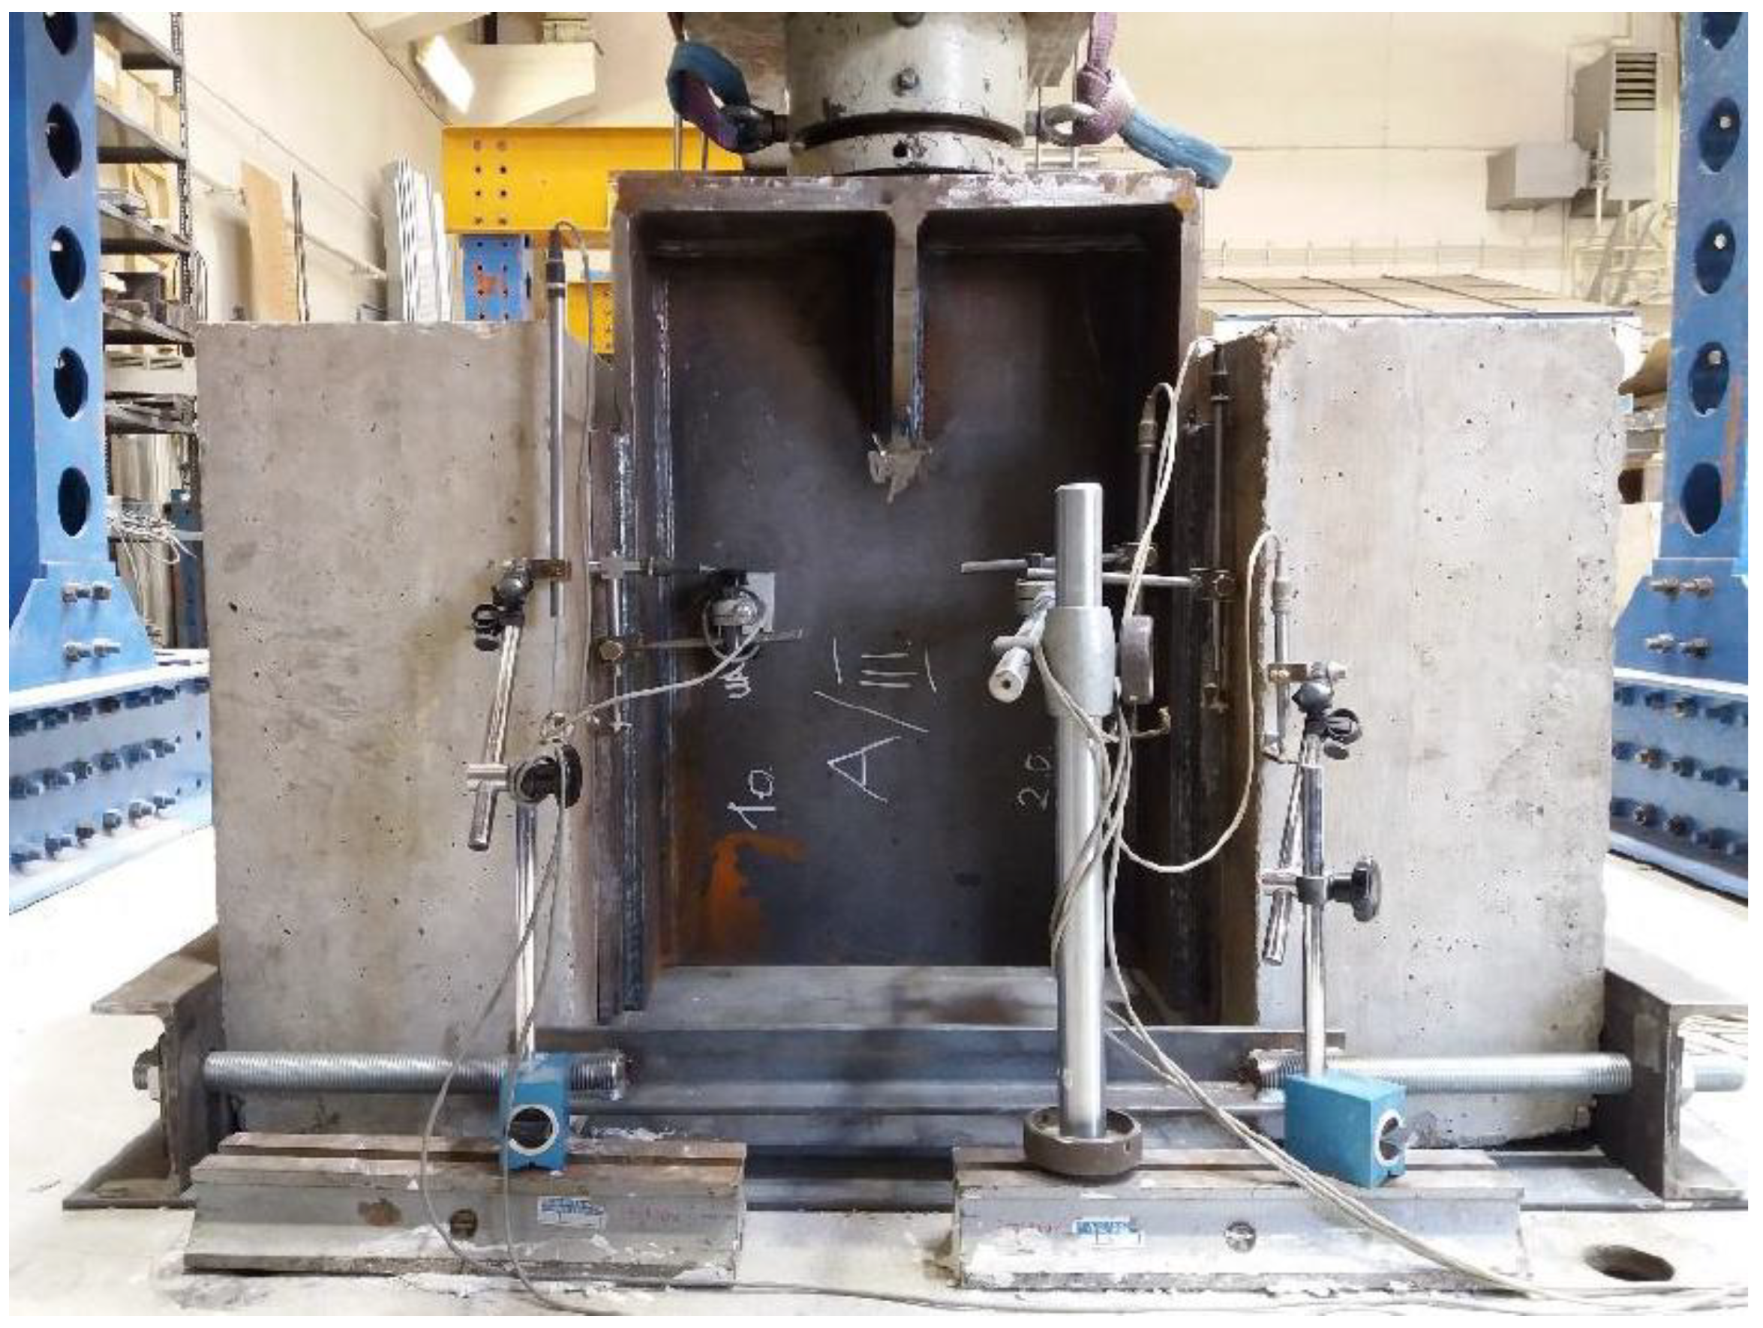
The research focuses on the development of a Python-based numerical model for steel–concrete composite connections, providing a comprehensive analysis of the effect of various geometric parameters. The FE model was calibrated and validated using the results of laboratory experiments, as illustrated in
Figure 1. The experimental program was previously reported in [
38]. The tests adhered to the standards outlined in Eurocode [
10], employing incremental load application and following the prescribed methodology.
Furthermore, this study includes an extensive evaluation of material properties through laboratory testing. The mechanical properties of concrete under tension and compression were systematically evaluated, playing a pivotal role in improving the accuracy of the finite-element model and validating the experimental outcomes. By effectively integrating detailed experimental characterization with advanced numerical simulations, this study delivers critical insights into the performance of steel–concrete composite systems under realistic loading scenarios, thereby advancing the reliability and relevance of the results.
The properties of the structural materials:
Concrete: C40/50;
Studs: SD1 (S235J2 + C470), (Es = 210.000 N/mm2, fy = 500 N/mm2, fu = 534 N/mm2);
Structural steel: S355J2 (Es = 210.000 N/mm2, fy = 500 N/mm2, fu = 563 N/mm2);
Reinforcing steel: B500B (Es = 200.000 N/mm2, fy = 500 N/mm2, fu = 550 N/mm2).
Figure 2 presents the measurement and experimental details of the push-out test. During the experimental test, the slip between the steel girder and concrete slab was measured, and these data were utilized to validate the numerical model. The slip measured at the same point in the experimental test was compared with the results from the numerical model.
During the experimental test, a modification in bridge construction technology was examined and compared with a commonly used steel-composite structure. The key aspect of the modification is the addition of a stud plate on the flange, which is welded to the structure. This technological modification had no significant effect on the results of the push-out test compared to conventional technology. The experimental results obtained during the test were utilized to validate the numerical model. In the experimental program, the interaction or tangential parameters were not measured, these parameters were utilized only during the numerical modeling in Abaqus.
3. Finite-Element Modeling (FE) and Validating
In the modeling process, ABAQUS was used. During the modeling, the program automatically generates a Python script for the given modeling task, which contains the steps required to complete the work. The goal of the modeling was to create a model that allows for extensive modifications and enables the examination of the questions presented in the literature review. In traditional methods, for example, relocating a stud, results in a considerable amount of modeling work (even 1–2 days), as this requires changes not only in the assembly module but also in the concrete geometry, since a hole must be created in the concrete where the stud is located. When such a change is made, it essentially requires restarting every step, such as geometry, assembly, loading, steps, interactions, and mesh. In such a complex model, manually modifying these kinds of changes can introduce many errors into the model. For this reason, other studies typically created only a few types of models and limited their examination to the effects of certain parameters. Our model was designed in such a way that the Python script generated during the design process can be easily modified and parameterized. In other words, a single change automatically updates the necessary model settings, ensuring that the model remains consistent in all aspects (e.g., mesh). Essentially, we have created a model in which any parameter can be simulated, such as stud placement, reinforcement bar locations, geometry, and materials.
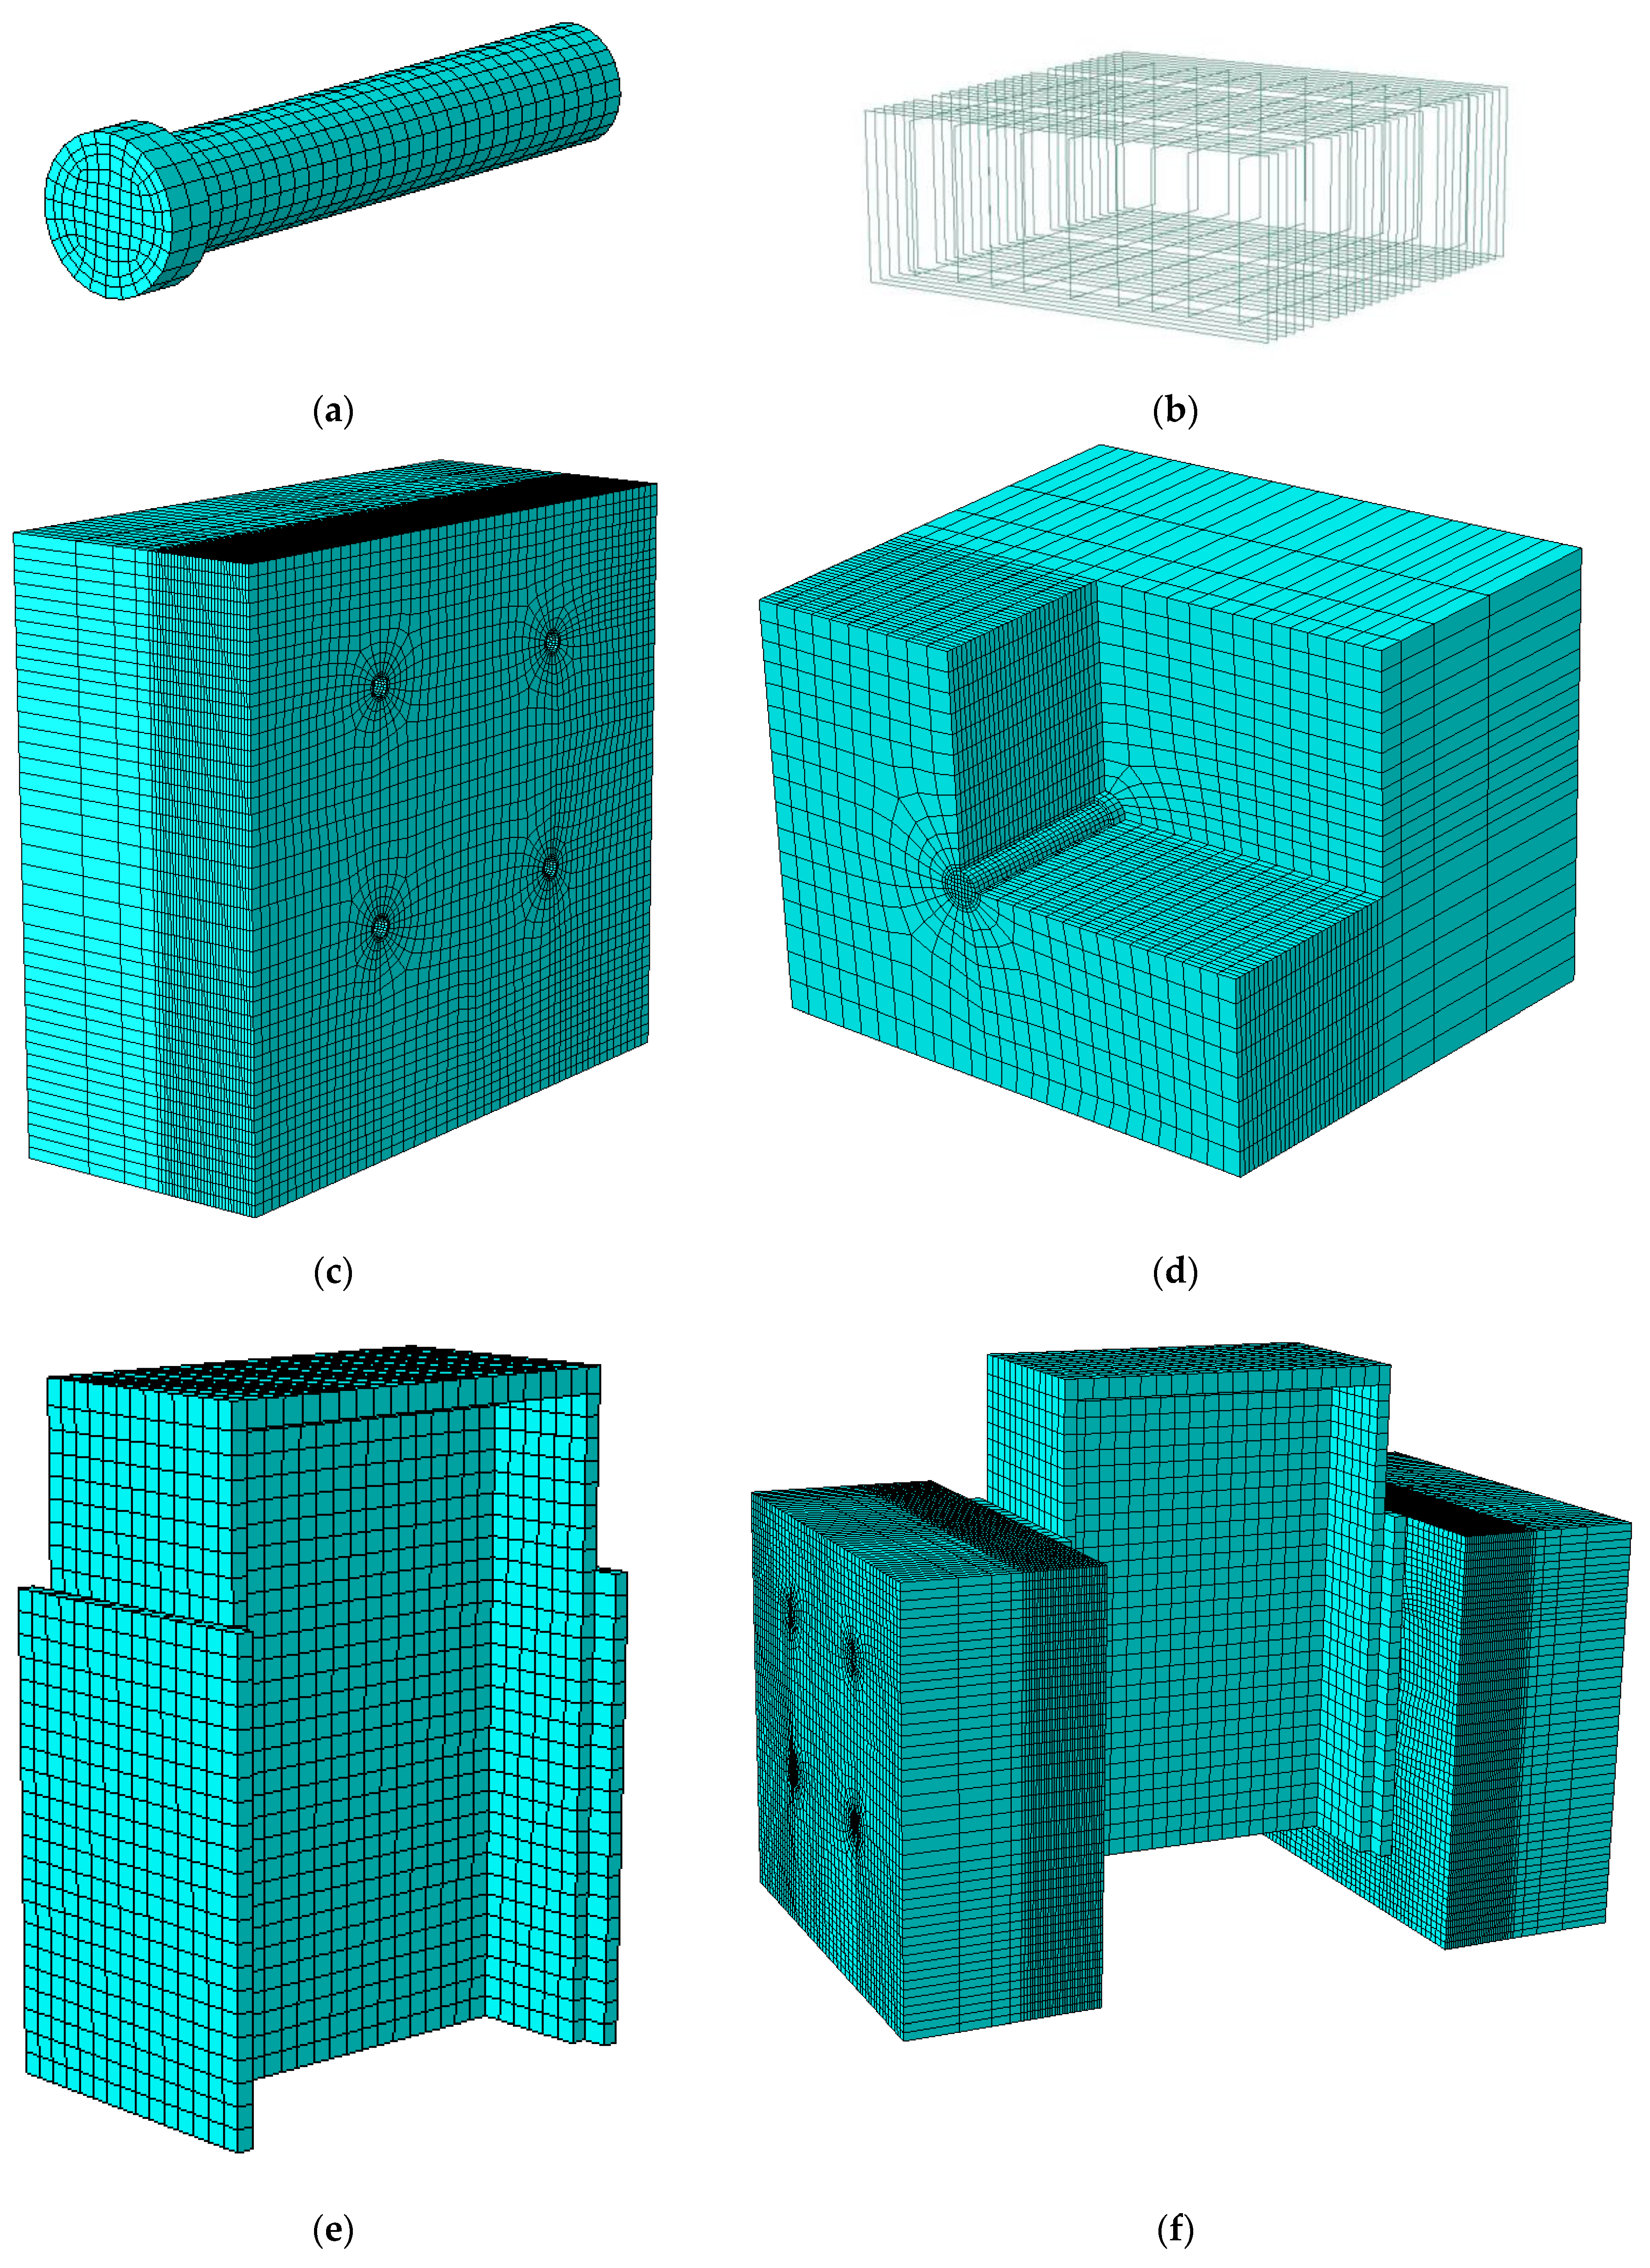
The finite-element modeling approach integrated advanced features, including the consideration of geometric nonlinearity and the application of a Concrete Damage Plasticity (CDP) model to accurately represent the behavior of concrete. These methods allow for the accurate modeling of the behavior of complex structures—such as this steel–concrete composite connection—focusing on stress conditions, deformations, and failure modes. The steel stud was simulated using a bilinear isotropic hardening model, which is governed by the von Mises yield criterion. The interaction between steel and concrete is modeled using the Coulomb friction approach to observe sliding and separation at the interfaces. Geometric nonlinearity is utilized to account for deformation, buckling, and bending effects. The push-out specimen consists of four parts, as shown in
Figure 3: steel girder, concrete, steel studs, and steel reinforcement. The concrete slab, steel studs, and steel components were represented using the C3D8R solid element from the ABAQUS 6.25 software library. This element is an eight-node brick configuration with reduced integration stiffness, which has been widely validated for modeling concrete behavior under intricate stress states [
39]. The C3D8R element is used for performing nonlinear analysis, which includes modeling contact interactions, large deformations, plasticity, and failure mechanisms. Each node in the element has three translational degrees of freedom (DOFs). The steel studs and girder were modeled separately and meshed together using the C3D8R solid element [
40]. To model the reinforcement bars, a 3D beam element, specifically the 2-node linear beam in space (B31: Timoshenko beam), was used. An embedded region constraint was applied to simulate the bond between the longitudinal and transverse reinforcements and the surrounding concrete, ensuring accurate force transfer and interaction between the reinforcements and the concrete matrix. Boundary conditions were imposed in accordance with the experimental constraints. The model shown in
Figure 1 was constructed by systematically assembling and precisely positioning the components.
A mesh sensitivity analysis was conducted to evaluate the impact of mesh size on both computational accuracy and time efficiency. The results of mesh sensitivity analysis indicated the utilization of a finer mesh size at locations where high stresses were expected. At the applied mesh refinement level, the structural behavior could already be observed with high precision, and further refinements would not significantly alter the response but would considerably increase computation time. Finer meshes were employed in areas expected to experience high stress, ensuring greater precision in the results. Areas with significant expected deformations, such as the loaded steel girder, were also refined with finer meshes. As illustrated in
Figure 3d, the stud and its adjacent concrete region were assigned the finest mesh. In the concrete, a more refined mesh was applied near the shank of the stud, extending to its endpoint. The finite-element boundaries along the stud and surrounding concrete were aligned to ensure convergence and accuracy in the simulation. Meticulous attention was given to maintaining complete symmetry of the mesh throughout the specimen. Appropriate separations and sets were used to create the most accurate mesh possible. The model’s mesh comprised roughly 867.012 variables in total.
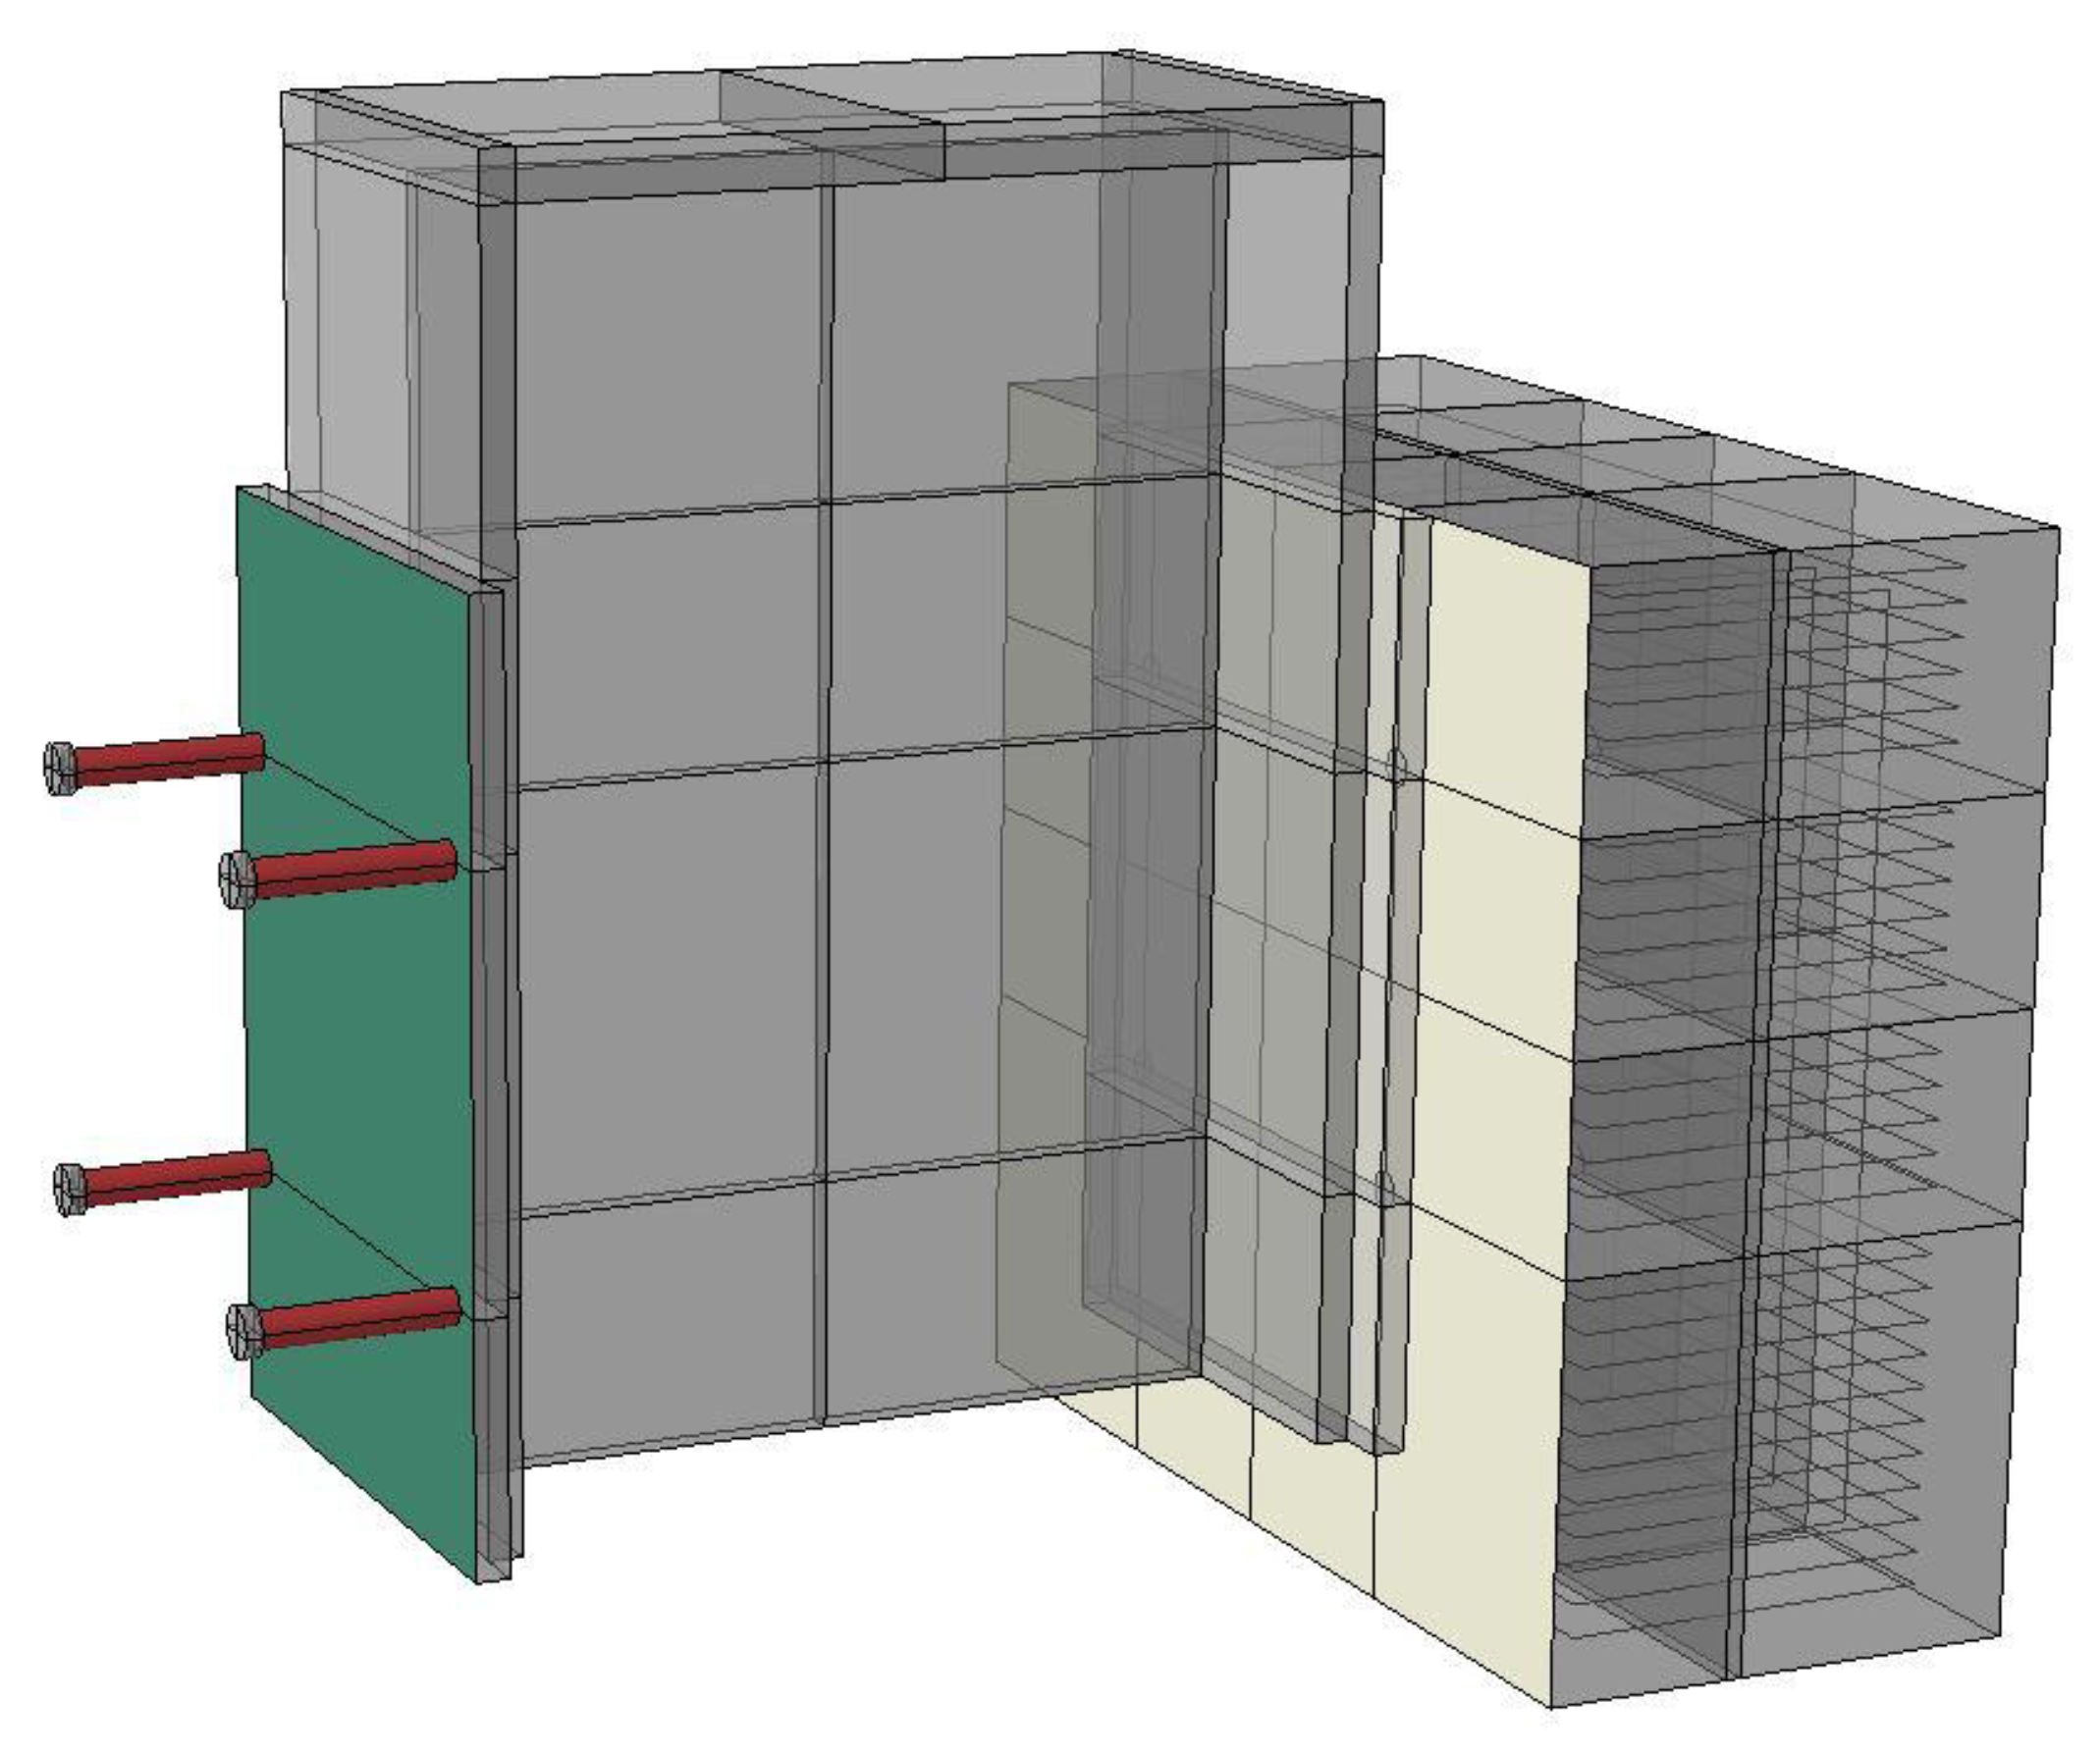
Figure 4 illustrates the interactions within the FE model. The model exhibited high accuracy in effectively simulating the contact behaviors. A surface-to-surface interaction was modeled, with the tangential behavior governed by a penalty friction formulation. Hard contact with a friction coefficient of 0.2 was defined for the interface between the shank of the steel stud and the concrete component. Furthermore, hard contact with a friction coefficient of 0.3 was applied at the interface between the steel and concrete, in accordance with relevant literature [
41,
42,
43] and prior empirical observation [
44]. Additionally, Gosztola et al. [
38] calibrated and validated their numerical model in their research, using iterations of the same friction coefficient values between the steel girder–concrete deck slab and the concrete deck slab–steel stud connections. Bolina et al. [
45] examined the variation in Coulomb friction parameters under high-temperature conditions, taking into account the complex interaction between steel and concrete. This numerical model is applicable solely to ambient temperature, as high-temperature effects are not considered in the analysis. However, all structures must be evaluated under both ambient and high-temperature conditions, where adjustments to the applied parameters, including Coulomb friction parameters, may be required.
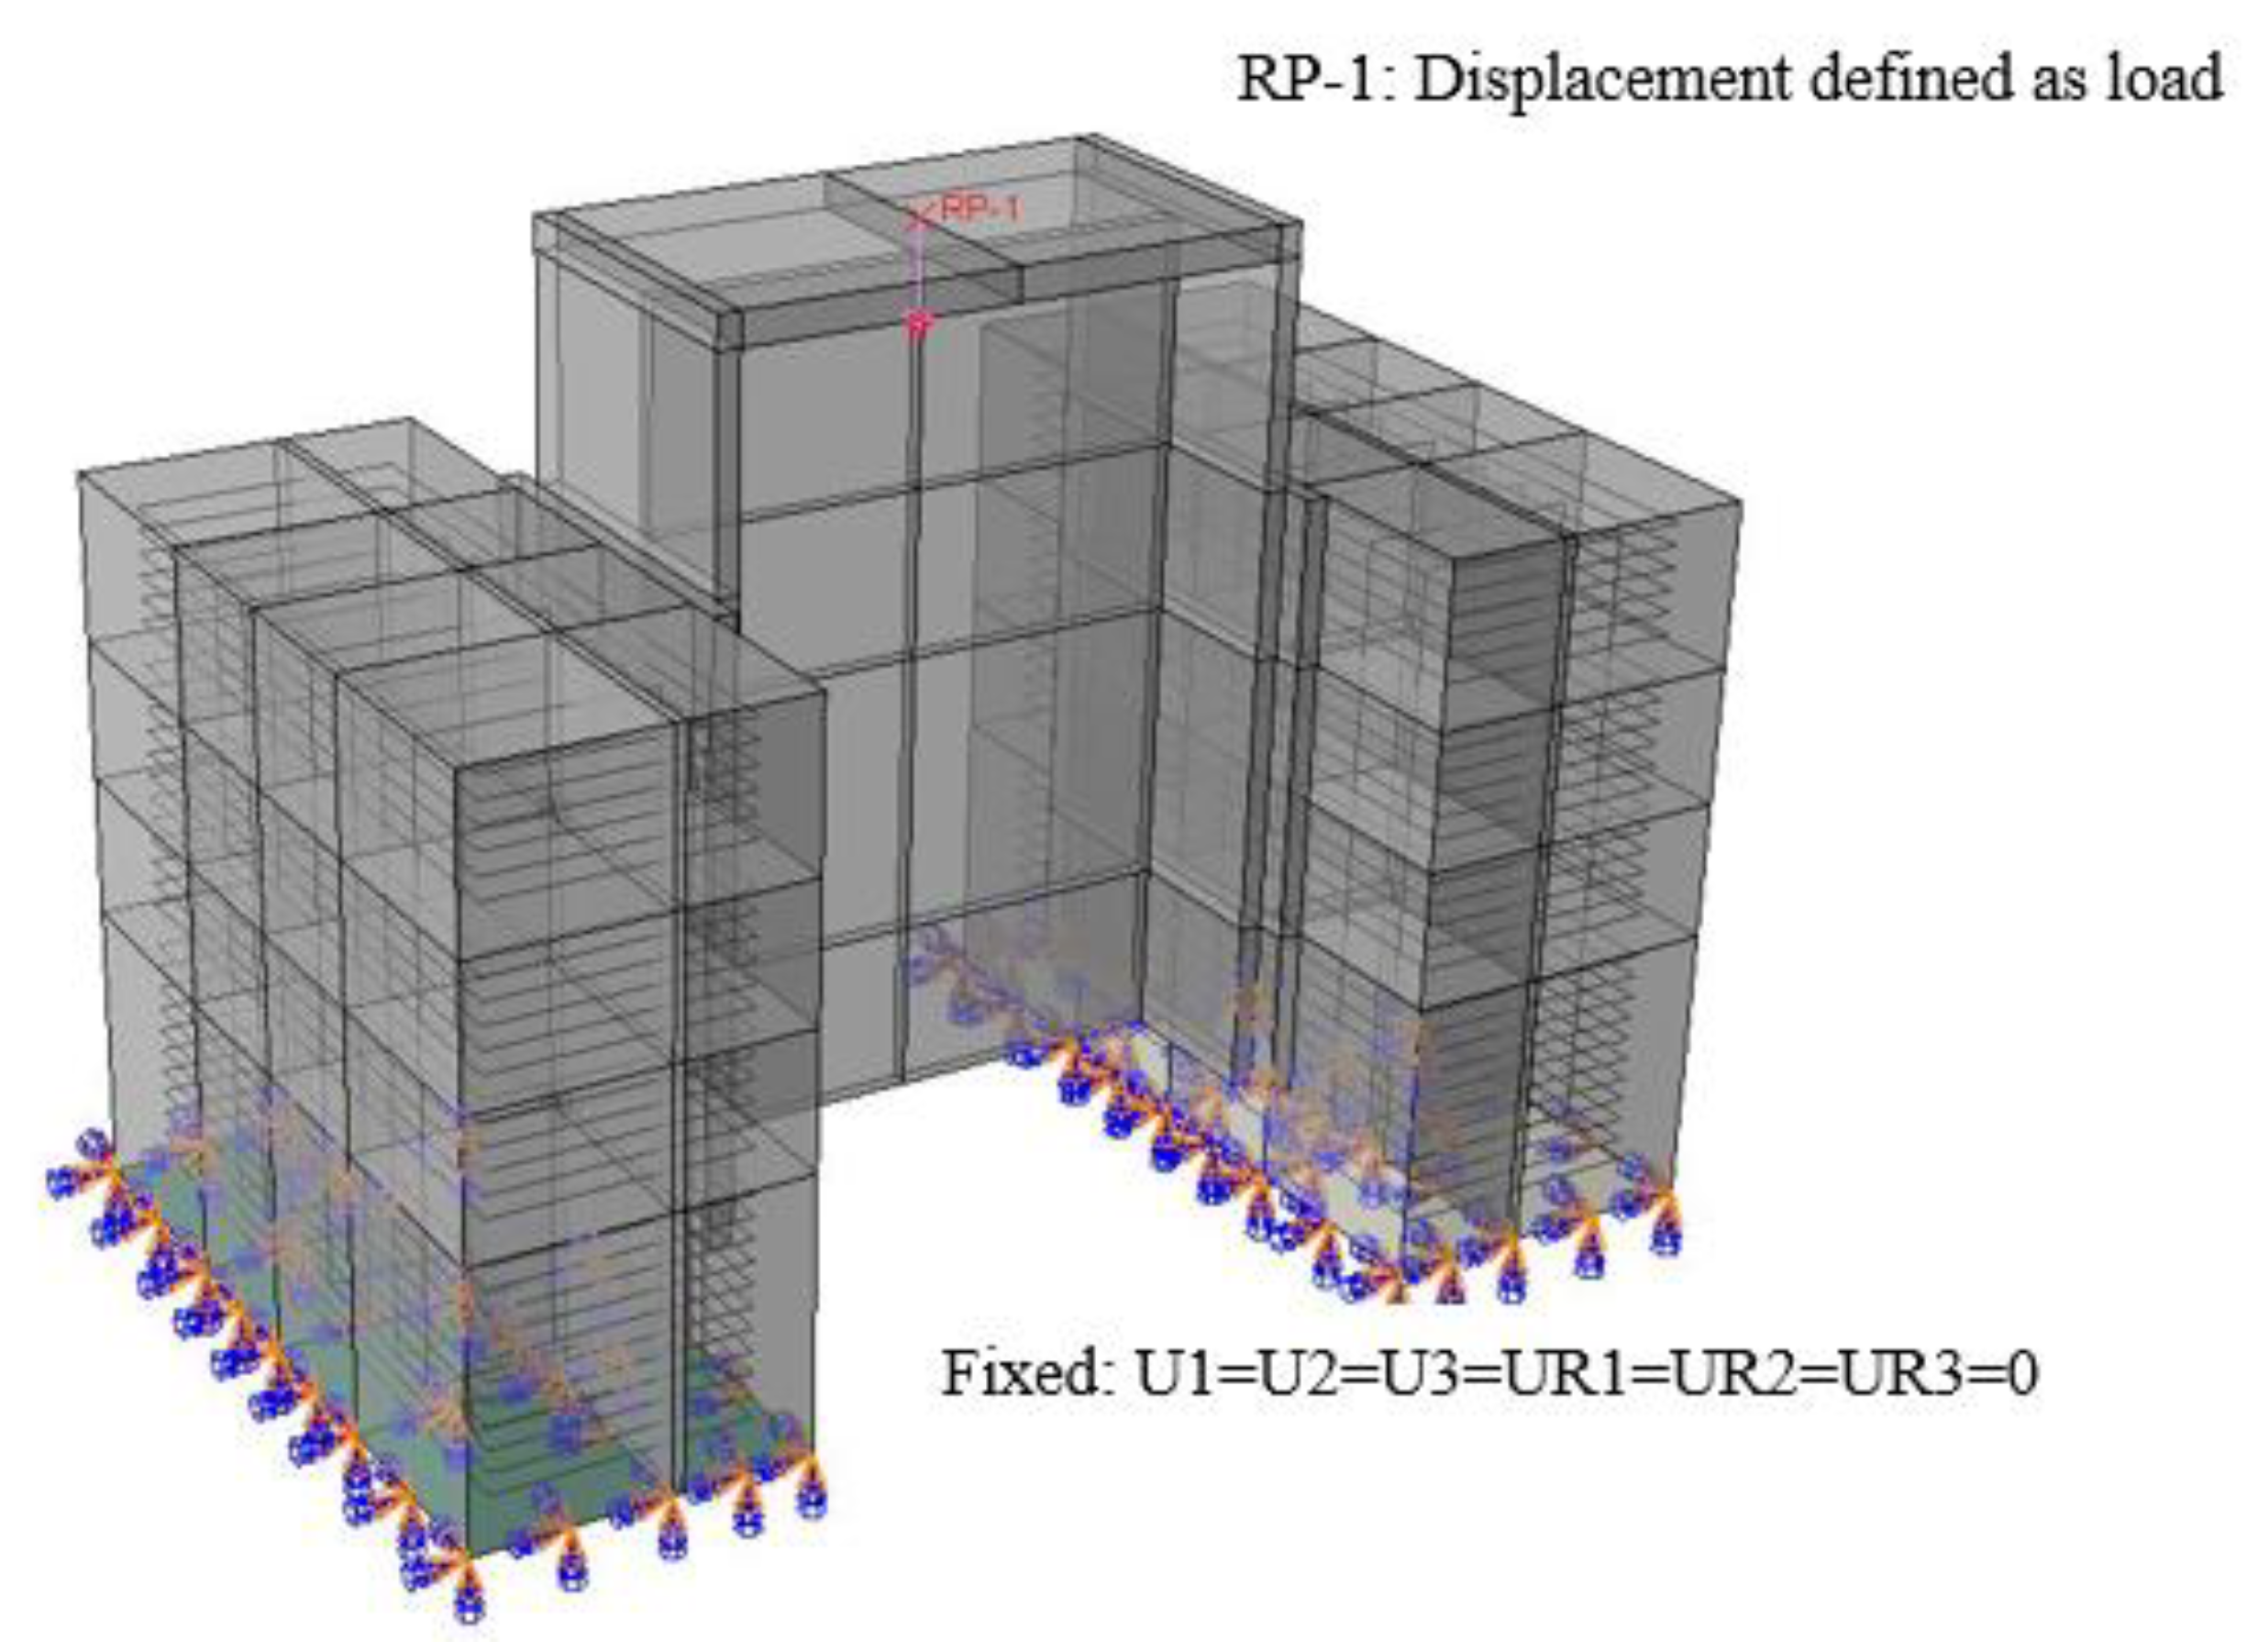
During the modeling process, Newton–Raphson iteration was applied using a displacement-controlled approach, with nonlinear analysis and a nonlinear material model. External loads were applied through imposed displacements corresponding to the experimental test setup.
Figure 5 presents the load and boundary conditions utilized in the FE model, which are identical to those implemented in the experimental test. The concrete part at the bottom were set as fixed.
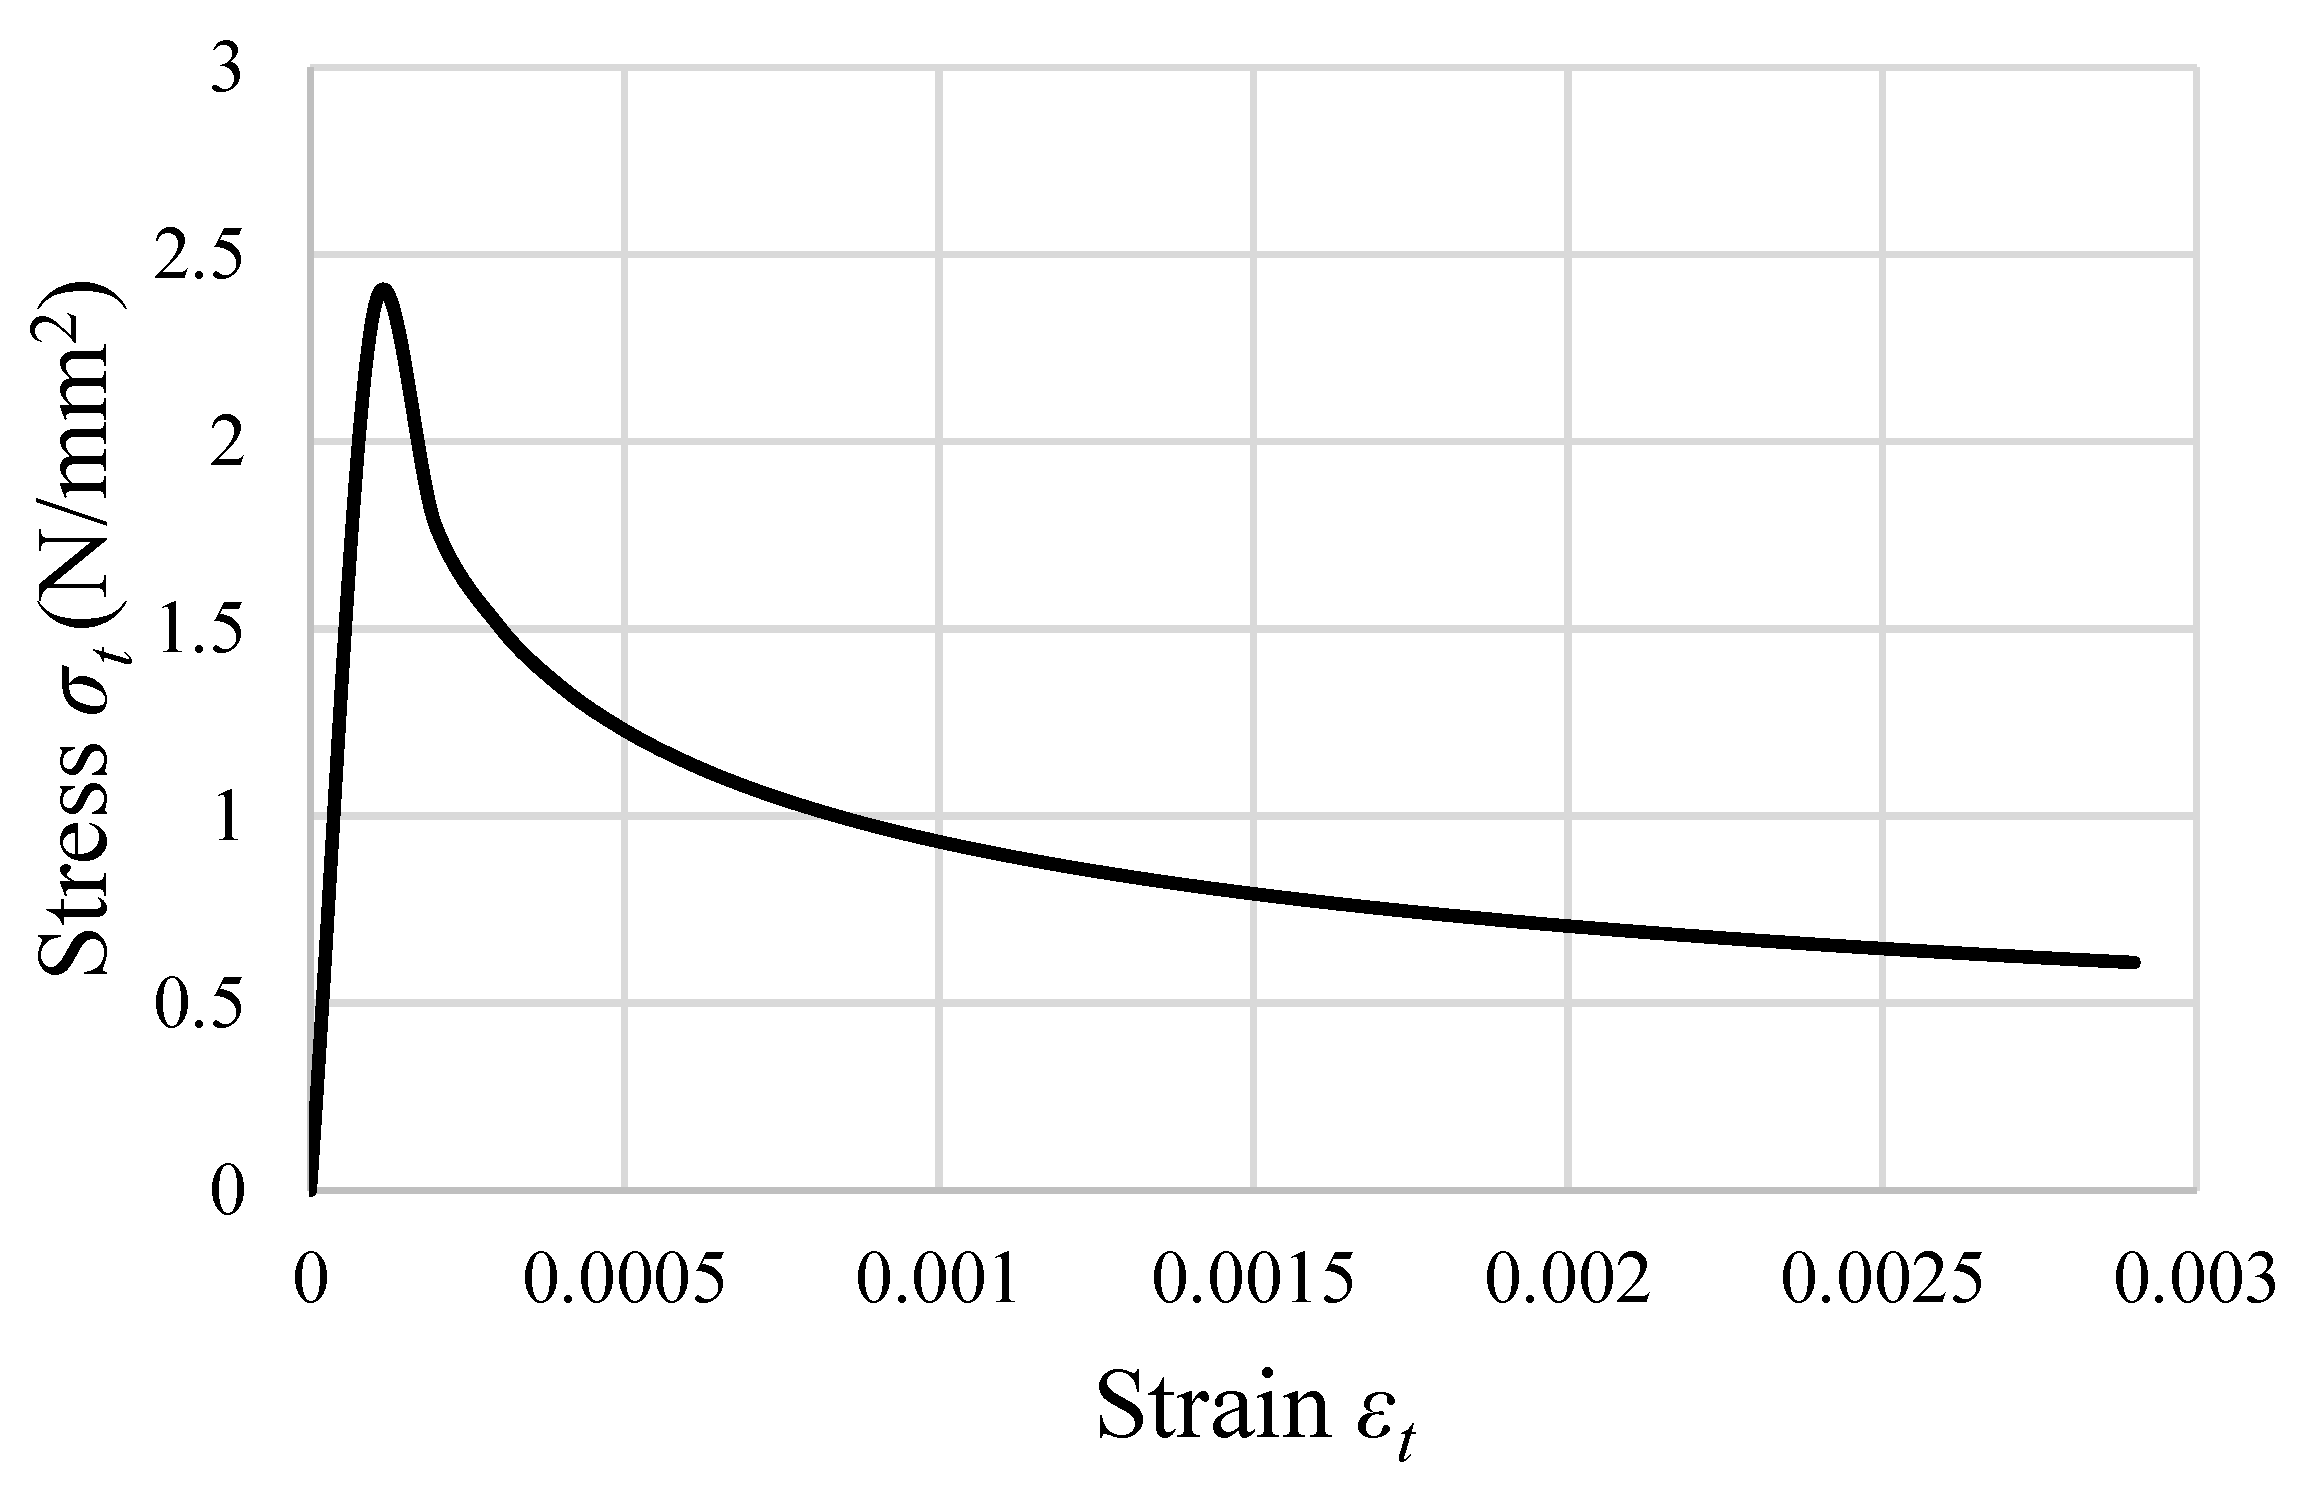
The compressive properties of concrete are presented in
Figure 6, while the tensile properties are shown in
Figure 7, both of which were utilized in the modeling process. The concrete damage plasticity (CDP) model is commonly used in finite-element (FE) modeling to accurately describe the nonlinear behavior of concrete, incorporating plastic deformation and damage under various stress conditions. The concrete damage plasticity model used in the current simulation is characterized by the following parameters: Poisson’s ratio of
v = 0.2, Young’s modulus of
E0 = 35,000 N/mm
2, dilation angle of 33°, an eccentricity value of 0.1, a f
b0/f
c0 ratio of 1.12, and a viscosity parameter (
K) of 0.667.
The concrete damage plasticity (CDP) formulation has two primary failure mechanisms: compressive crushing and tensile cracking, which represent the nonlinear behavior of concrete under various loading conditions. The CDP model effectively represents these failure mechanisms, and the plasticity component describes the inelastic strains resulting from irreversible deformation, utilizing a yield criterion to identify the shift from elastic to plastic behavior. Yield surfaces, such as the Mohr–Coulomb or Drucker–Prager criteria, are commonly applied to concrete to accurately define this transition.
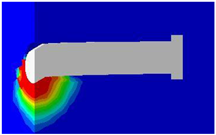
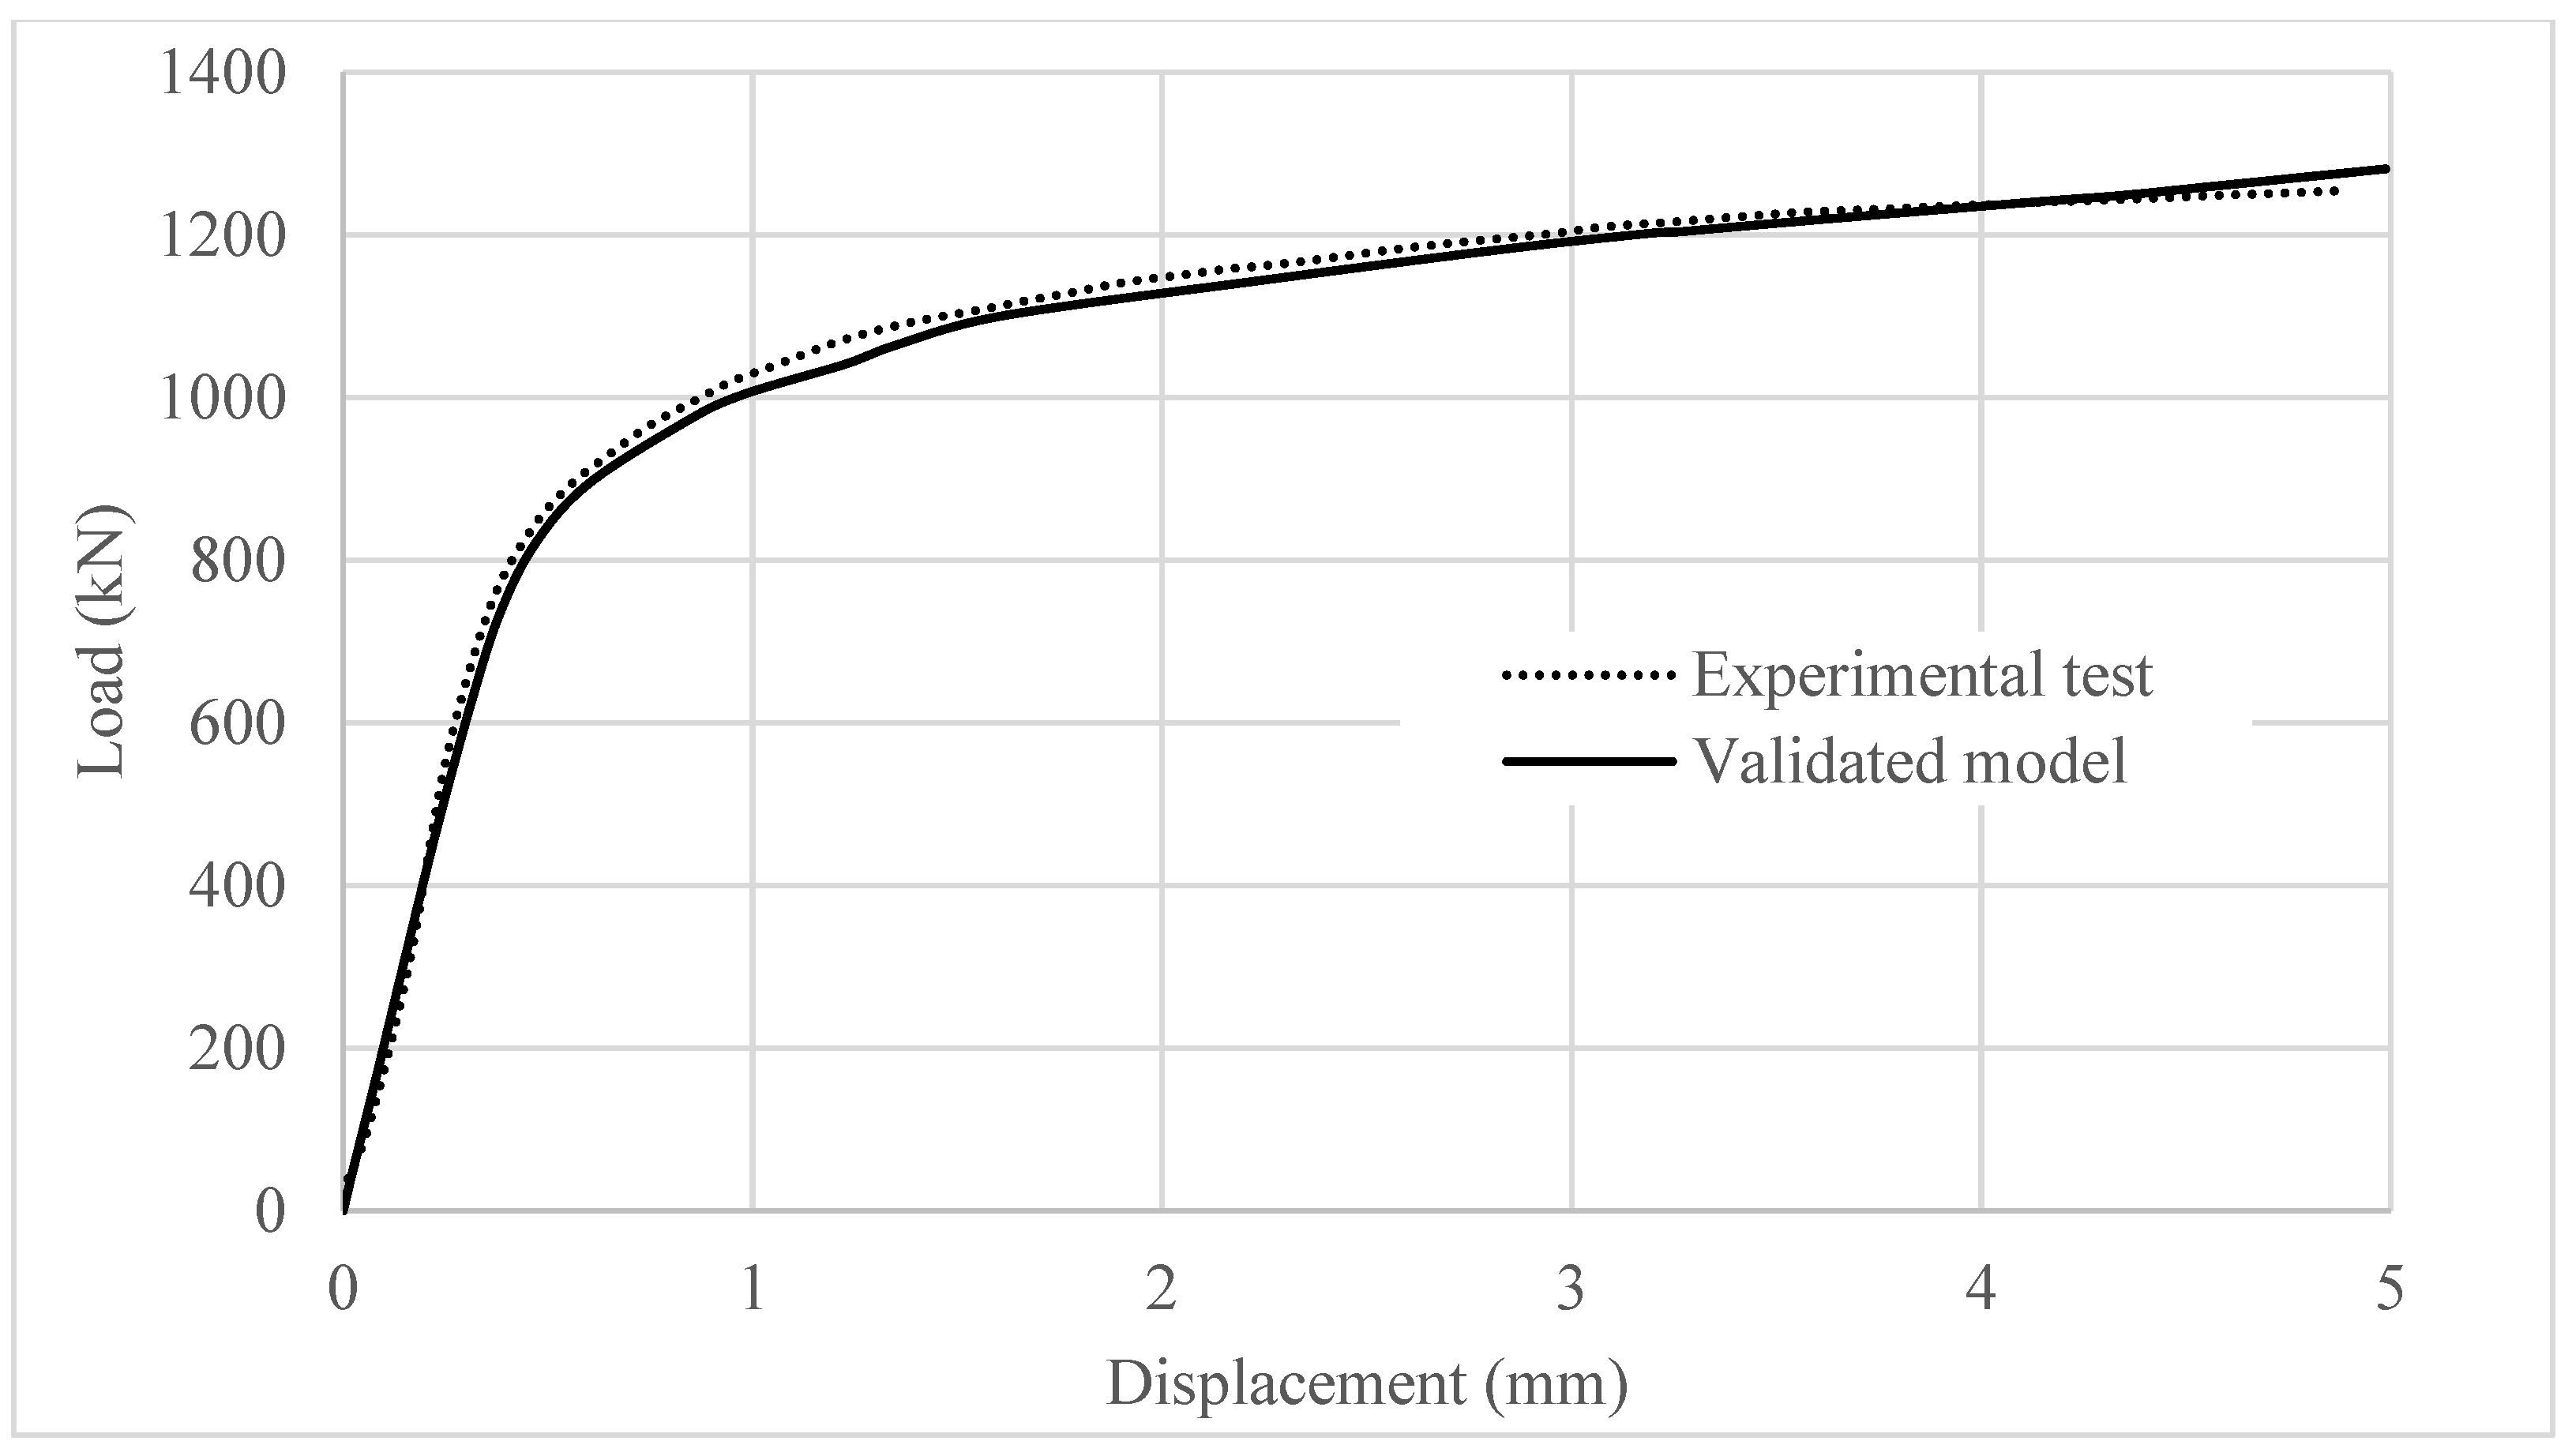
Figure 8 presents the force–displacement curve of the numerical model, compared with the experimental test results. It is clearly visible that the two curves align very well, confirming that the numerical model has been validated and is suitable for further investigations. The push-out tests consistently concluded with the failure of the studs, causing the load–displacement curve to suddenly drop after reaching the peak point. In the finite-element modeling, specifically within the Static Riks analysis, we aim to identify this point, which marks the end of the plastic behavior of the steel–concrete composite structure. The plastic failure observed in the numerical model occurred at the same displacement recorded during the push-out test.
In this research, the Python-based script for Abaqus has been developed, which integrates all essential model configurations, including geometry, material models, contact definitions, and meshing parameters. This comprehensive integration ensures consistency and reliability throughout the modeling process.
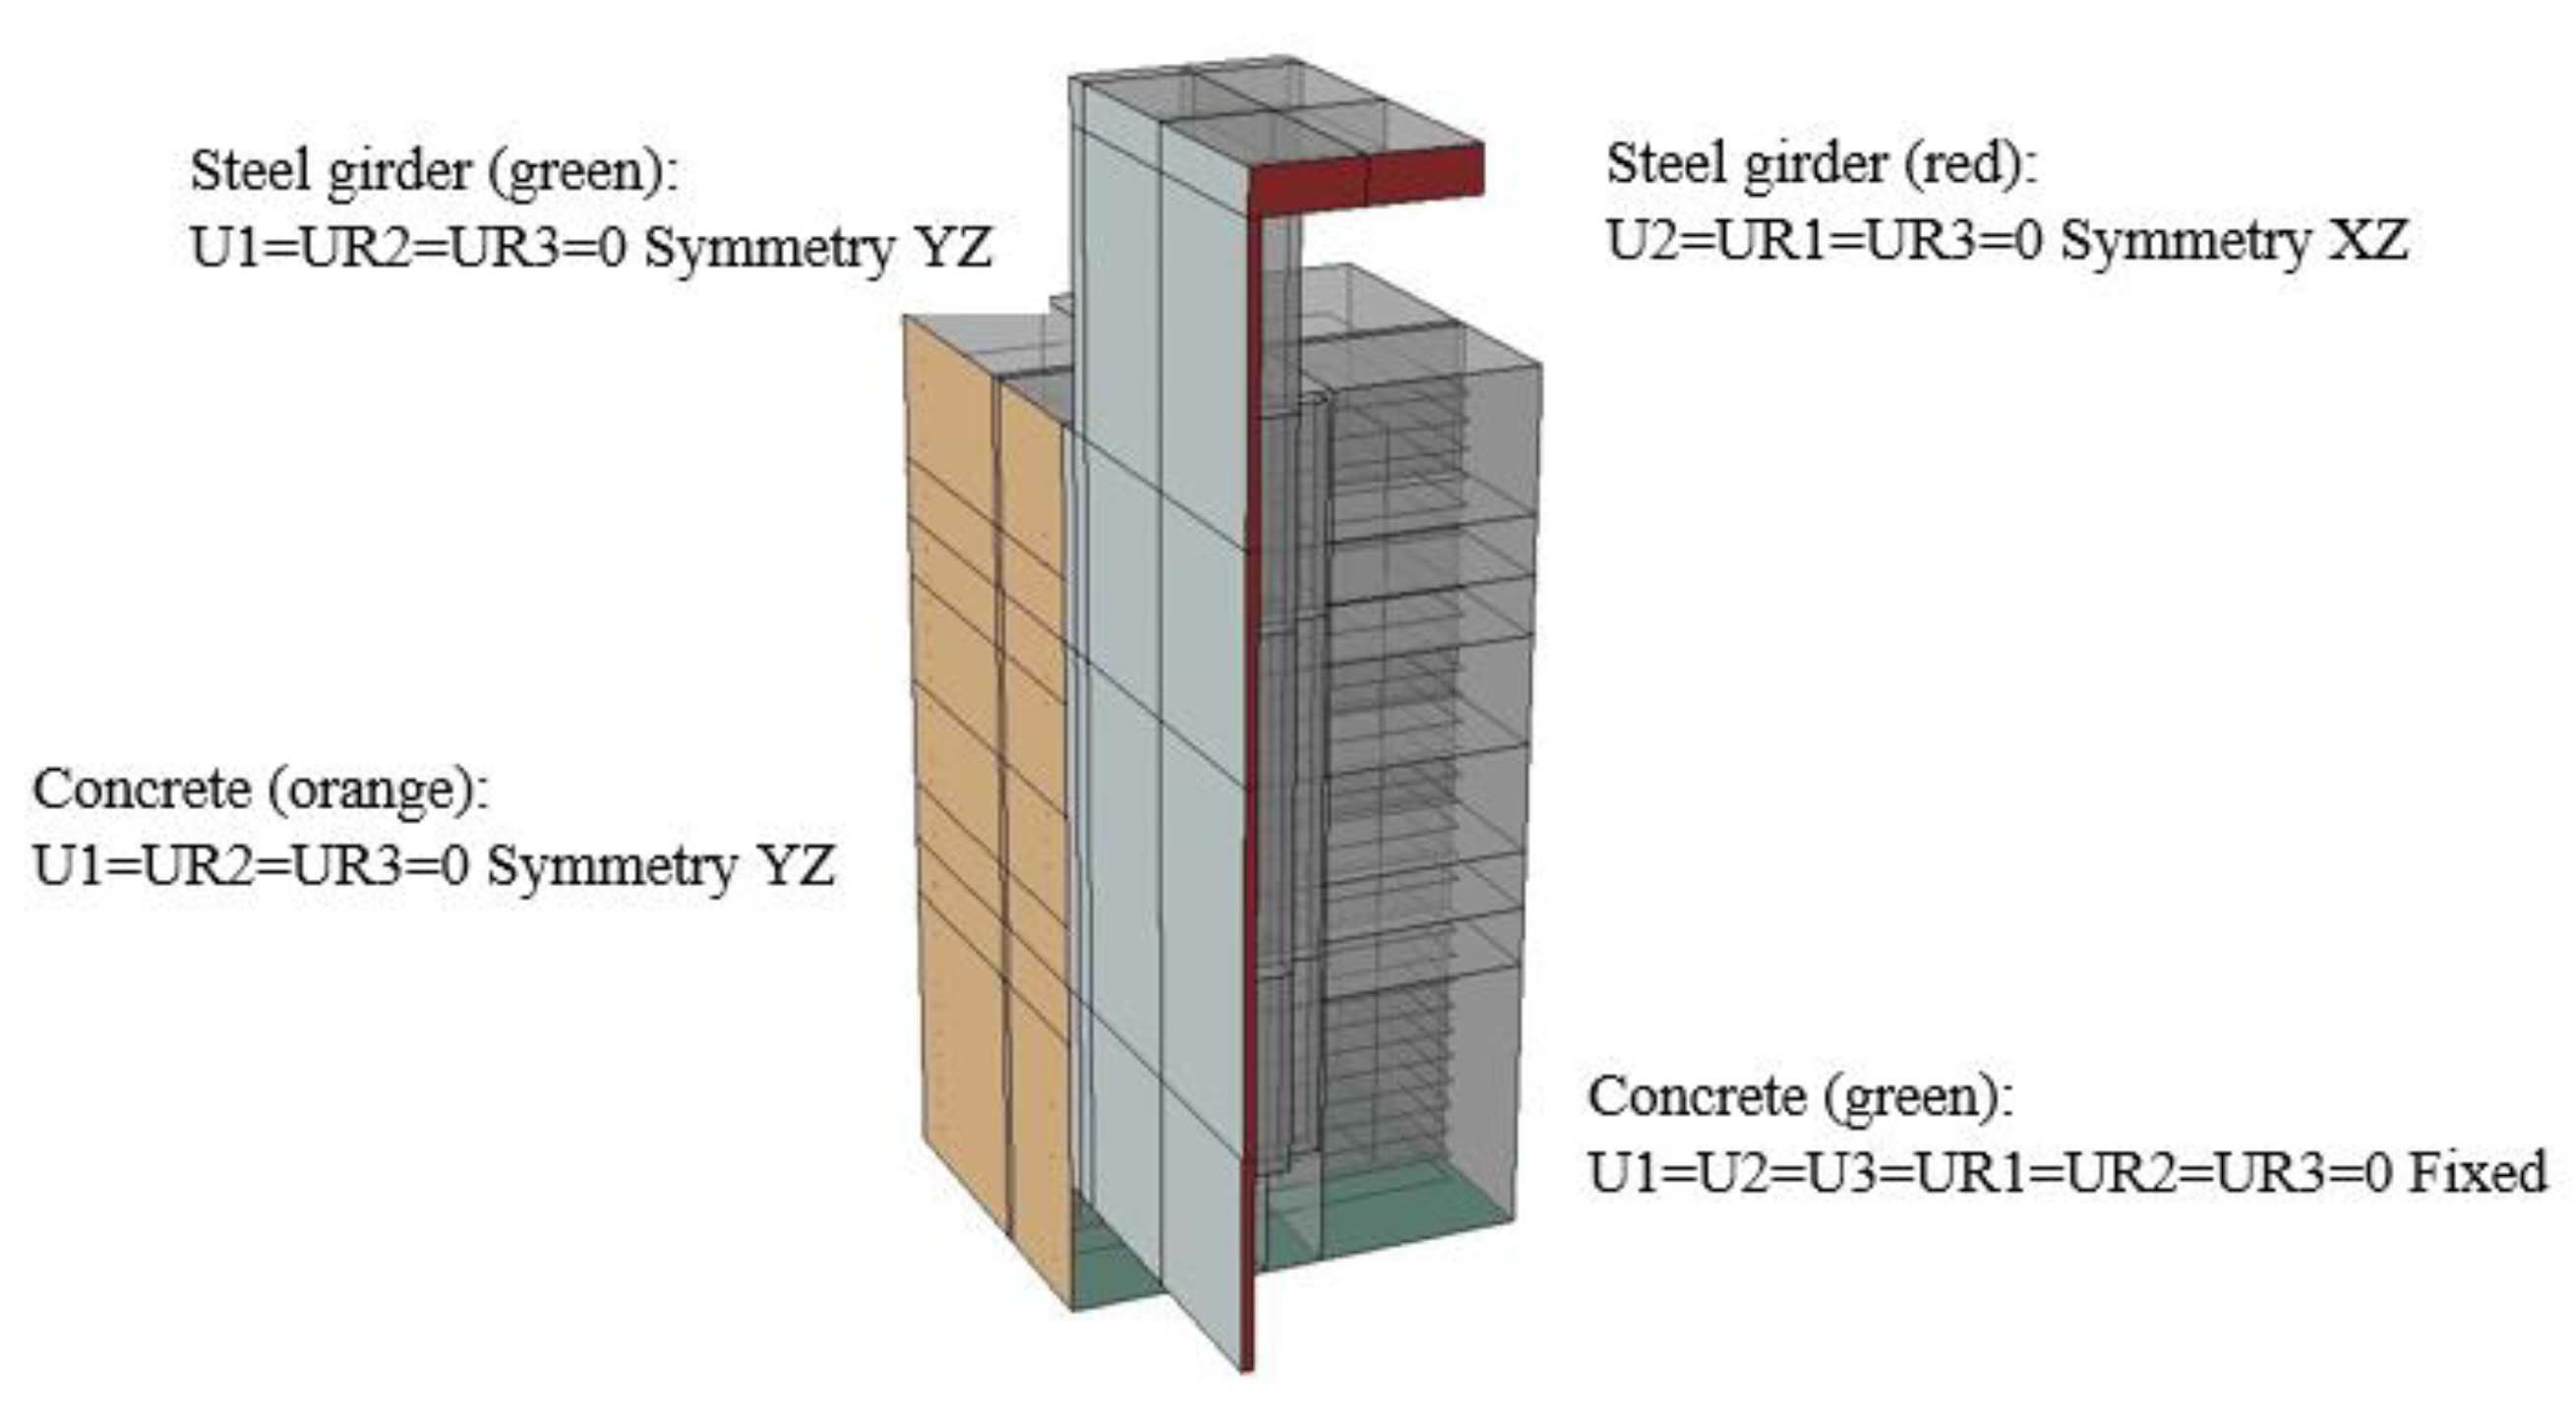
Following validation, the objective is for this Python-based parametrically constructed model to serve as a foundation for extensive studies similar to those referenced in the introduction. The validated model, due to its highly refined mesh comprising 868.012 variables, demands substantial computational resources. To enhance computational efficiency, the model was refined by focusing on a quarter of the model space, applying appropriate boundary conditions and symmetry settings, as illustrated in
Figure 9. This refinement reduced the number of variables to 215.409, significantly decreasing computational demands while maintaining model accuracy.
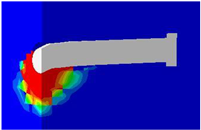
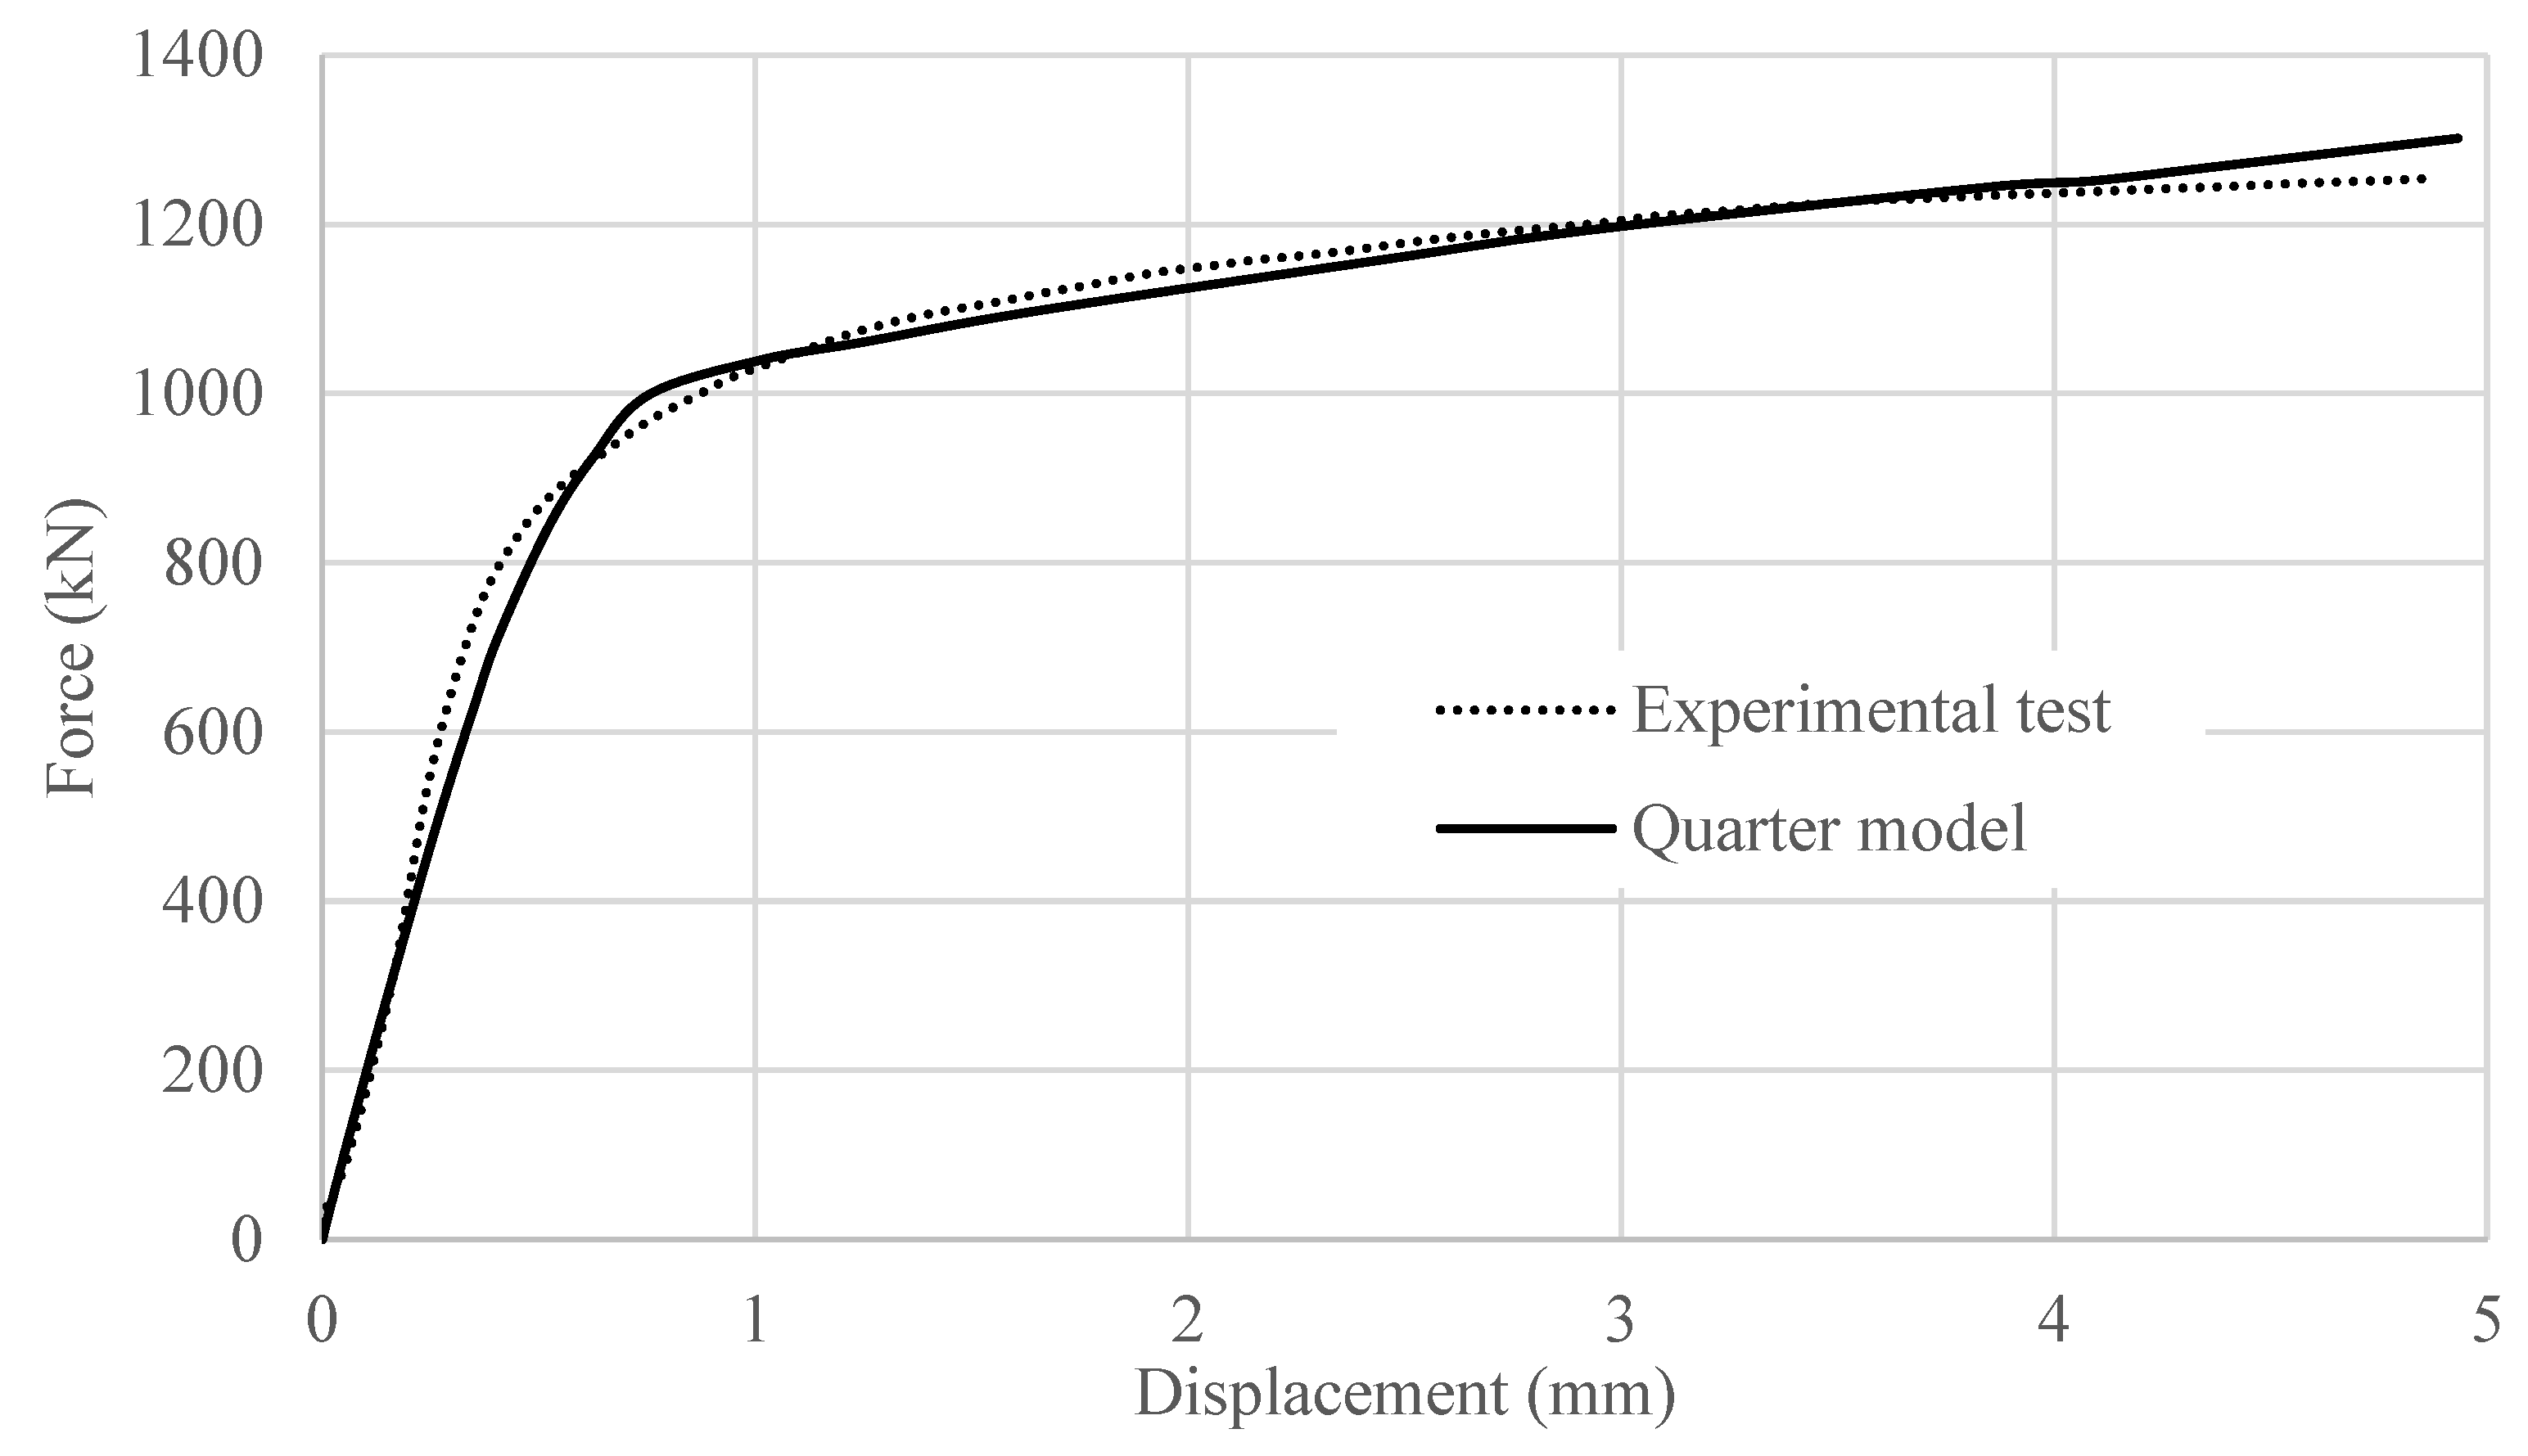
Figure 10 presents the force–displacement results of the previously introduced numerical model and experimental test, along with the corresponding results from the quarter model. This clearly demonstrates that the model accurately simulates real-world conditions. In addition to the force–displacement curve obtained from the numerical modeling, ABAQUS allows for the visualization of the states (such as stresses, deformations, displacements, and damages) that develop during each iteration of the Newton–Raphson process, step by step, across the entire structure at any given point. Thus, beyond the force–displacement validation between the experimental and numerical models, we placed significant emphasis on verifying the numerical model against real-world observations, such as stud deformations and concrete damages. It was found that these observations were fully consistent, further supporting the validation. The quarter model will be further utilized to investigate the effect of parameters, such as stud head diameter, stud length, shank length, shank diameter, and stud positioning on both the elastic and plastic behavior of the connection.
4. Detailed Analysis of the Effects of Geometric Variations on the Behavior of Steel–Concrete Composite Structures
This chapter presents the modeling results of steel–concrete joint connections, utilizing the finite-element model discussed in the preceding sections. The Introduction has presented significant research previously focused on the various geometric aspects of steel–concrete composite connections. Additionally, investigations have examined the effects of stud diameter and height, as well as the transverse and longitudinal arrangement of studs, on the structural behavior. The Python-based parametrically constructed model provides a detailed analysis of the effects of geometric variations on the behavior of composite connections.
In order to evaluate the research results in the area of geometric variables, it is useful to present the Eurocode specifications regarding the calculation and geometric design possibilities of connections. These specifications served as a basis for defining the parameters of the model experiments, and they are also crucial in the Discussion Section, where the results are often referenced back to the standard. According to Eurocode [
10], several constraints govern the geometry and spacing of connections. The total height of a stud must be at least three times the diameter of its shank (3d) to ensure effective shear transfer and adequate embedment within the concrete slab. The stud head diameter must be at least 1.5 times the diameter of the shank (1.5d), and its depth should be no less than 0.4 times the shank diameter (0.4d).
In the direction of shear force, the spacing between studs must not be less than five times the shank diameter (5d), ensuring an even distribution of shear loads without overstressing the concrete. In the transverse direction, the spacing must be a minimum of 2.5 times the shank diameter (2.5d) in solid slabs and four times the shank diameter (4d) in other cases to facilitate proper concrete flow and compaction around the studs.
In the calculation of the connection, two failure cases are compared: the failure of the individual stud and the failure of the concrete material. The smaller value between the two determines the load capacity that should be used.
with the smaller of these equations:
where
is the diameter of the shank of the stud,
;
is the partial factor;
is the specified ultimate tensile strength of the material of the stud maximum 500 N/mm
2,
is the characteristic compressive strength (cylinder) of the concrete at the age considered, of density not less than 1750 kg/m
3;
is the overall nominal height of the stud; and α is a reduction factor applied for studs with small height.
The standard clearly defines the load capacity for the individual stud, and the product of this force, along with the number of studs, determines the design value of the connection load capacity. Although the standard allows for the use of a stud height of at least 3d, in the event of concrete failure, a reduction factor is incorporated into the load capacity calculation. Therefore, a relationship can be inferred between concrete failure and stud length, which is more significant for lower concrete strengths and less so for higher strengths. In the case where the failure of the stud governs the design, the reduction factor due to the stud height is not considered. Indeed, the standard evaluates these two scenarios separately, accounting for the governing failure mode in each case. However, from the perspective of the actual structural behavior, both the stud and the concrete may incur damage under the increased load.
In the research, the numerical model was developed using an approach that allowed for a comprehensive understanding of the Python code associated with each modeling step. The model was systematically constructed to facilitate future modifications, enabling the automatic generation of models with altered geometries while adhering to the same modeling strategy and steps. This methodology ensures that, despite variations in a single parameter, all other parameters remain fixed and the model is executed within a consistent environment.
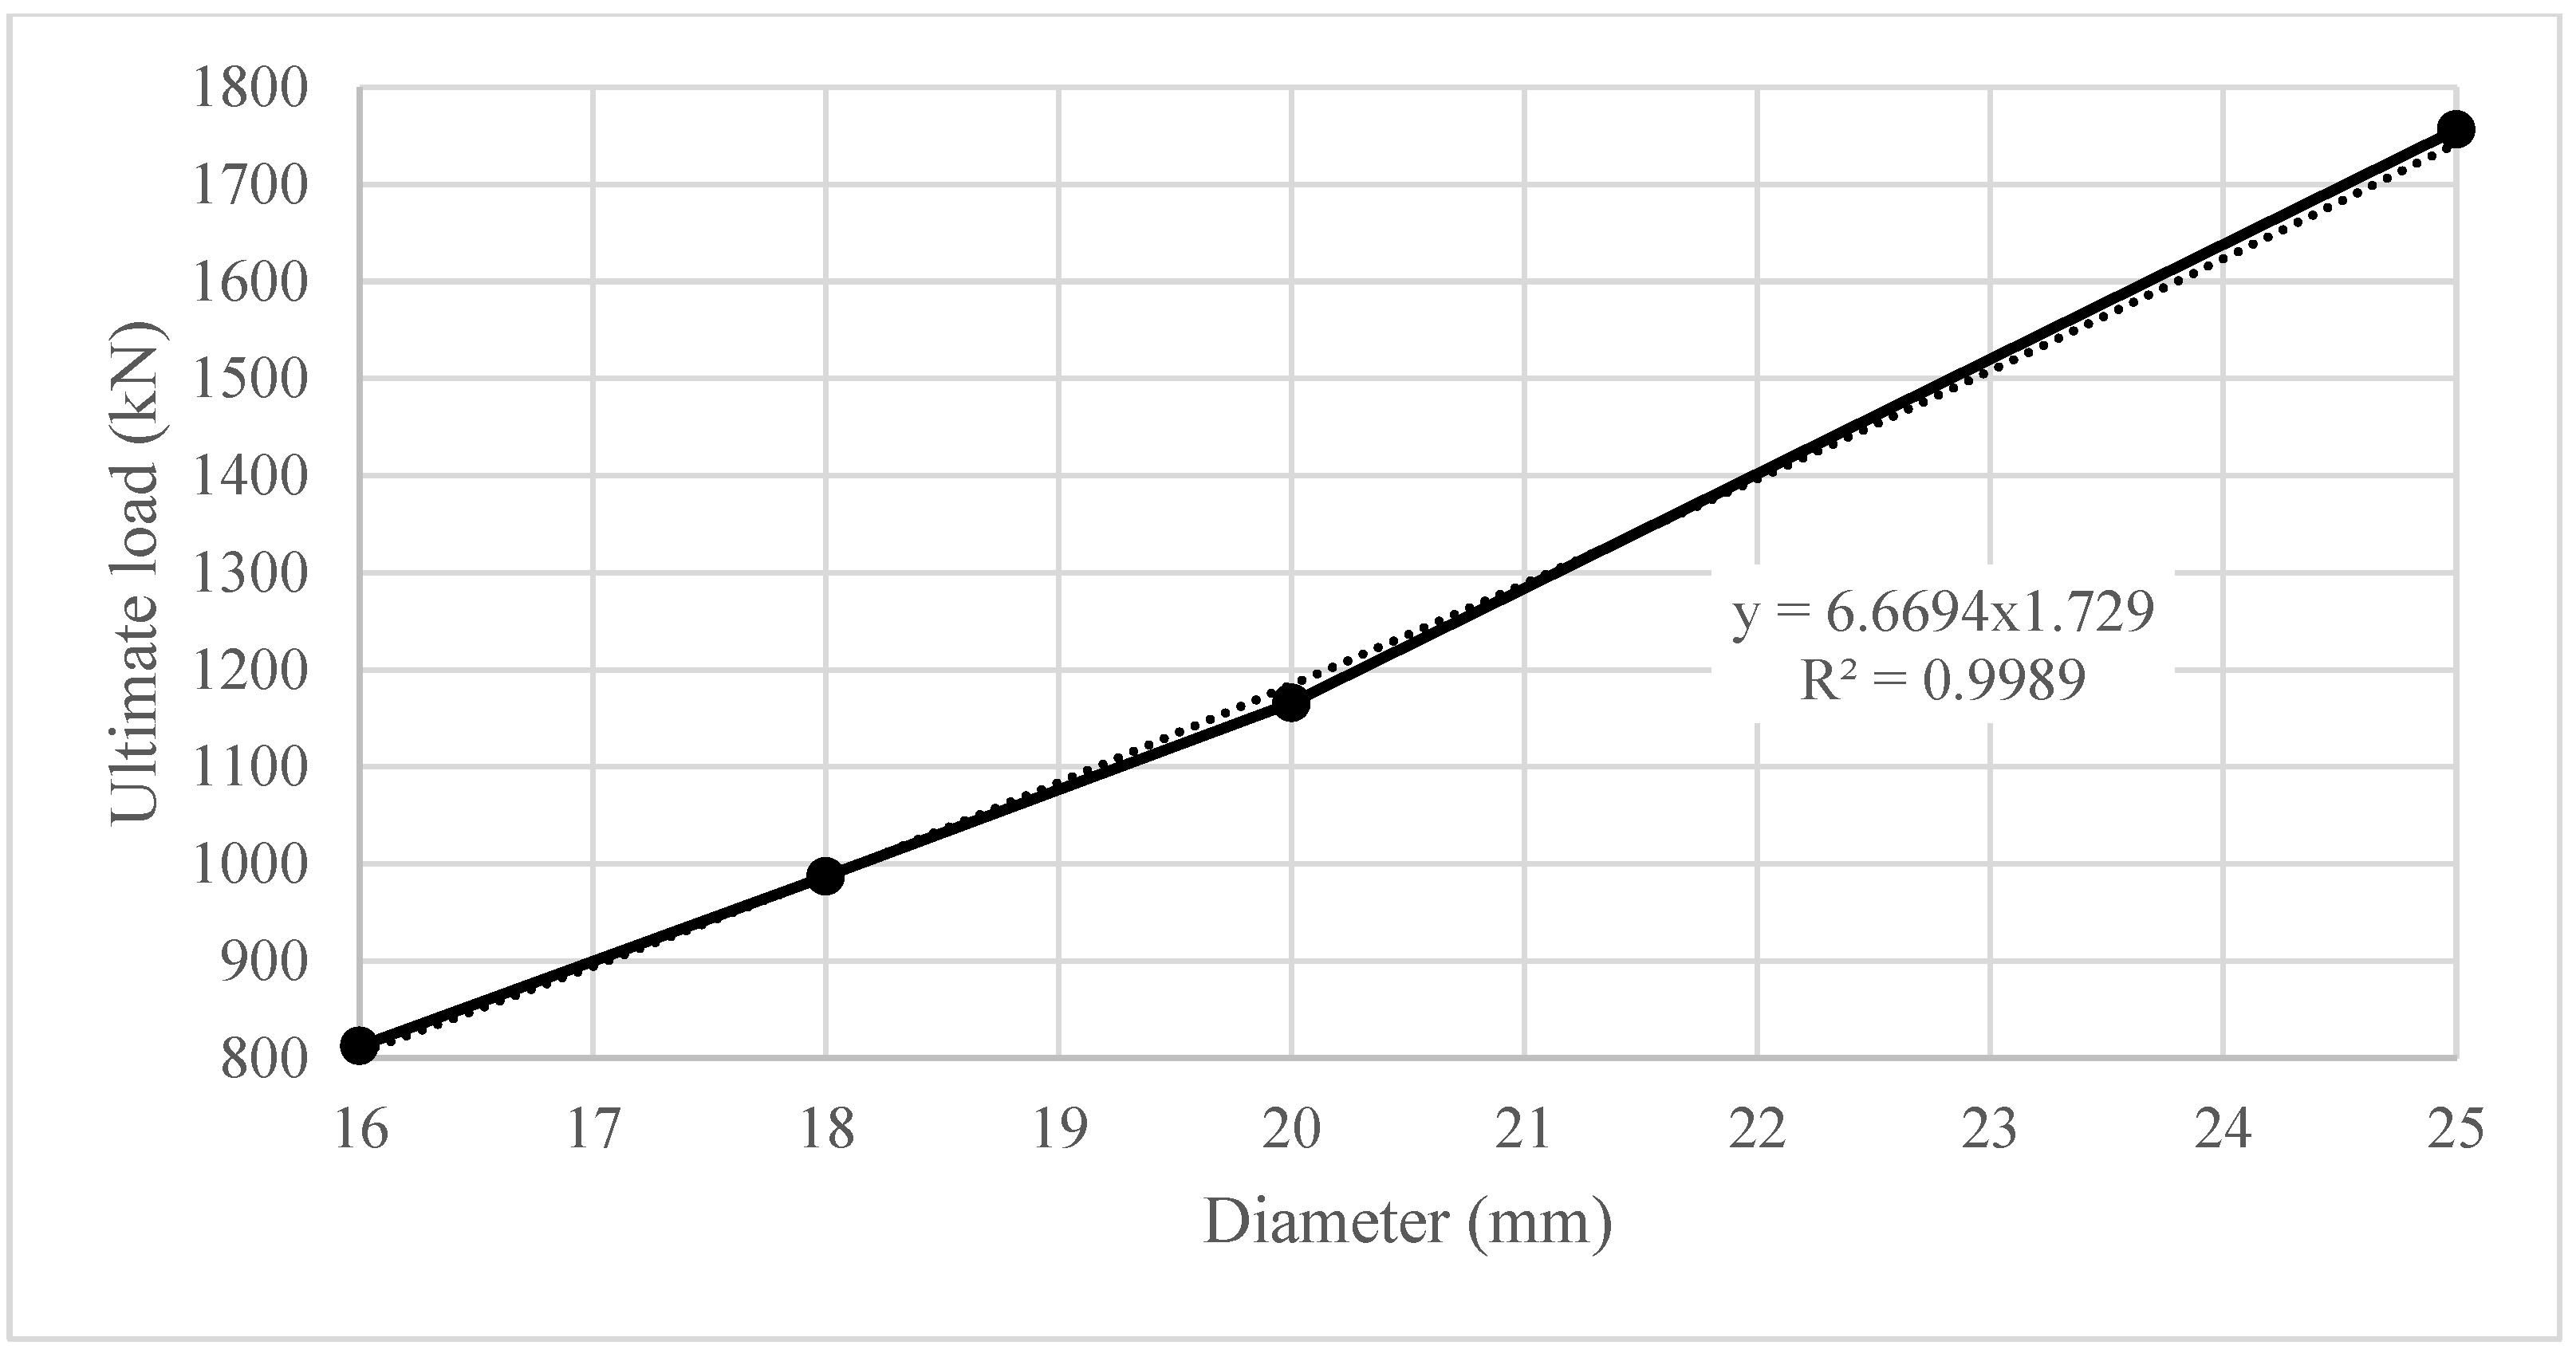
Table 1 presents the variations in shank diameters. In the validated model, the shank diameter was set to 22 mm.
Figure 11 and
Figure 12 illustrate the effect of changes in stud diameter on the load–displacement response and ultimate load of the steel–concrete composite connection. Alterations in stud diameter have a substantial impact on the overall behavior of the connection. These findings are consistent with prior research and align with the guidelines specified in the standard, which includes calculations for stud failure.
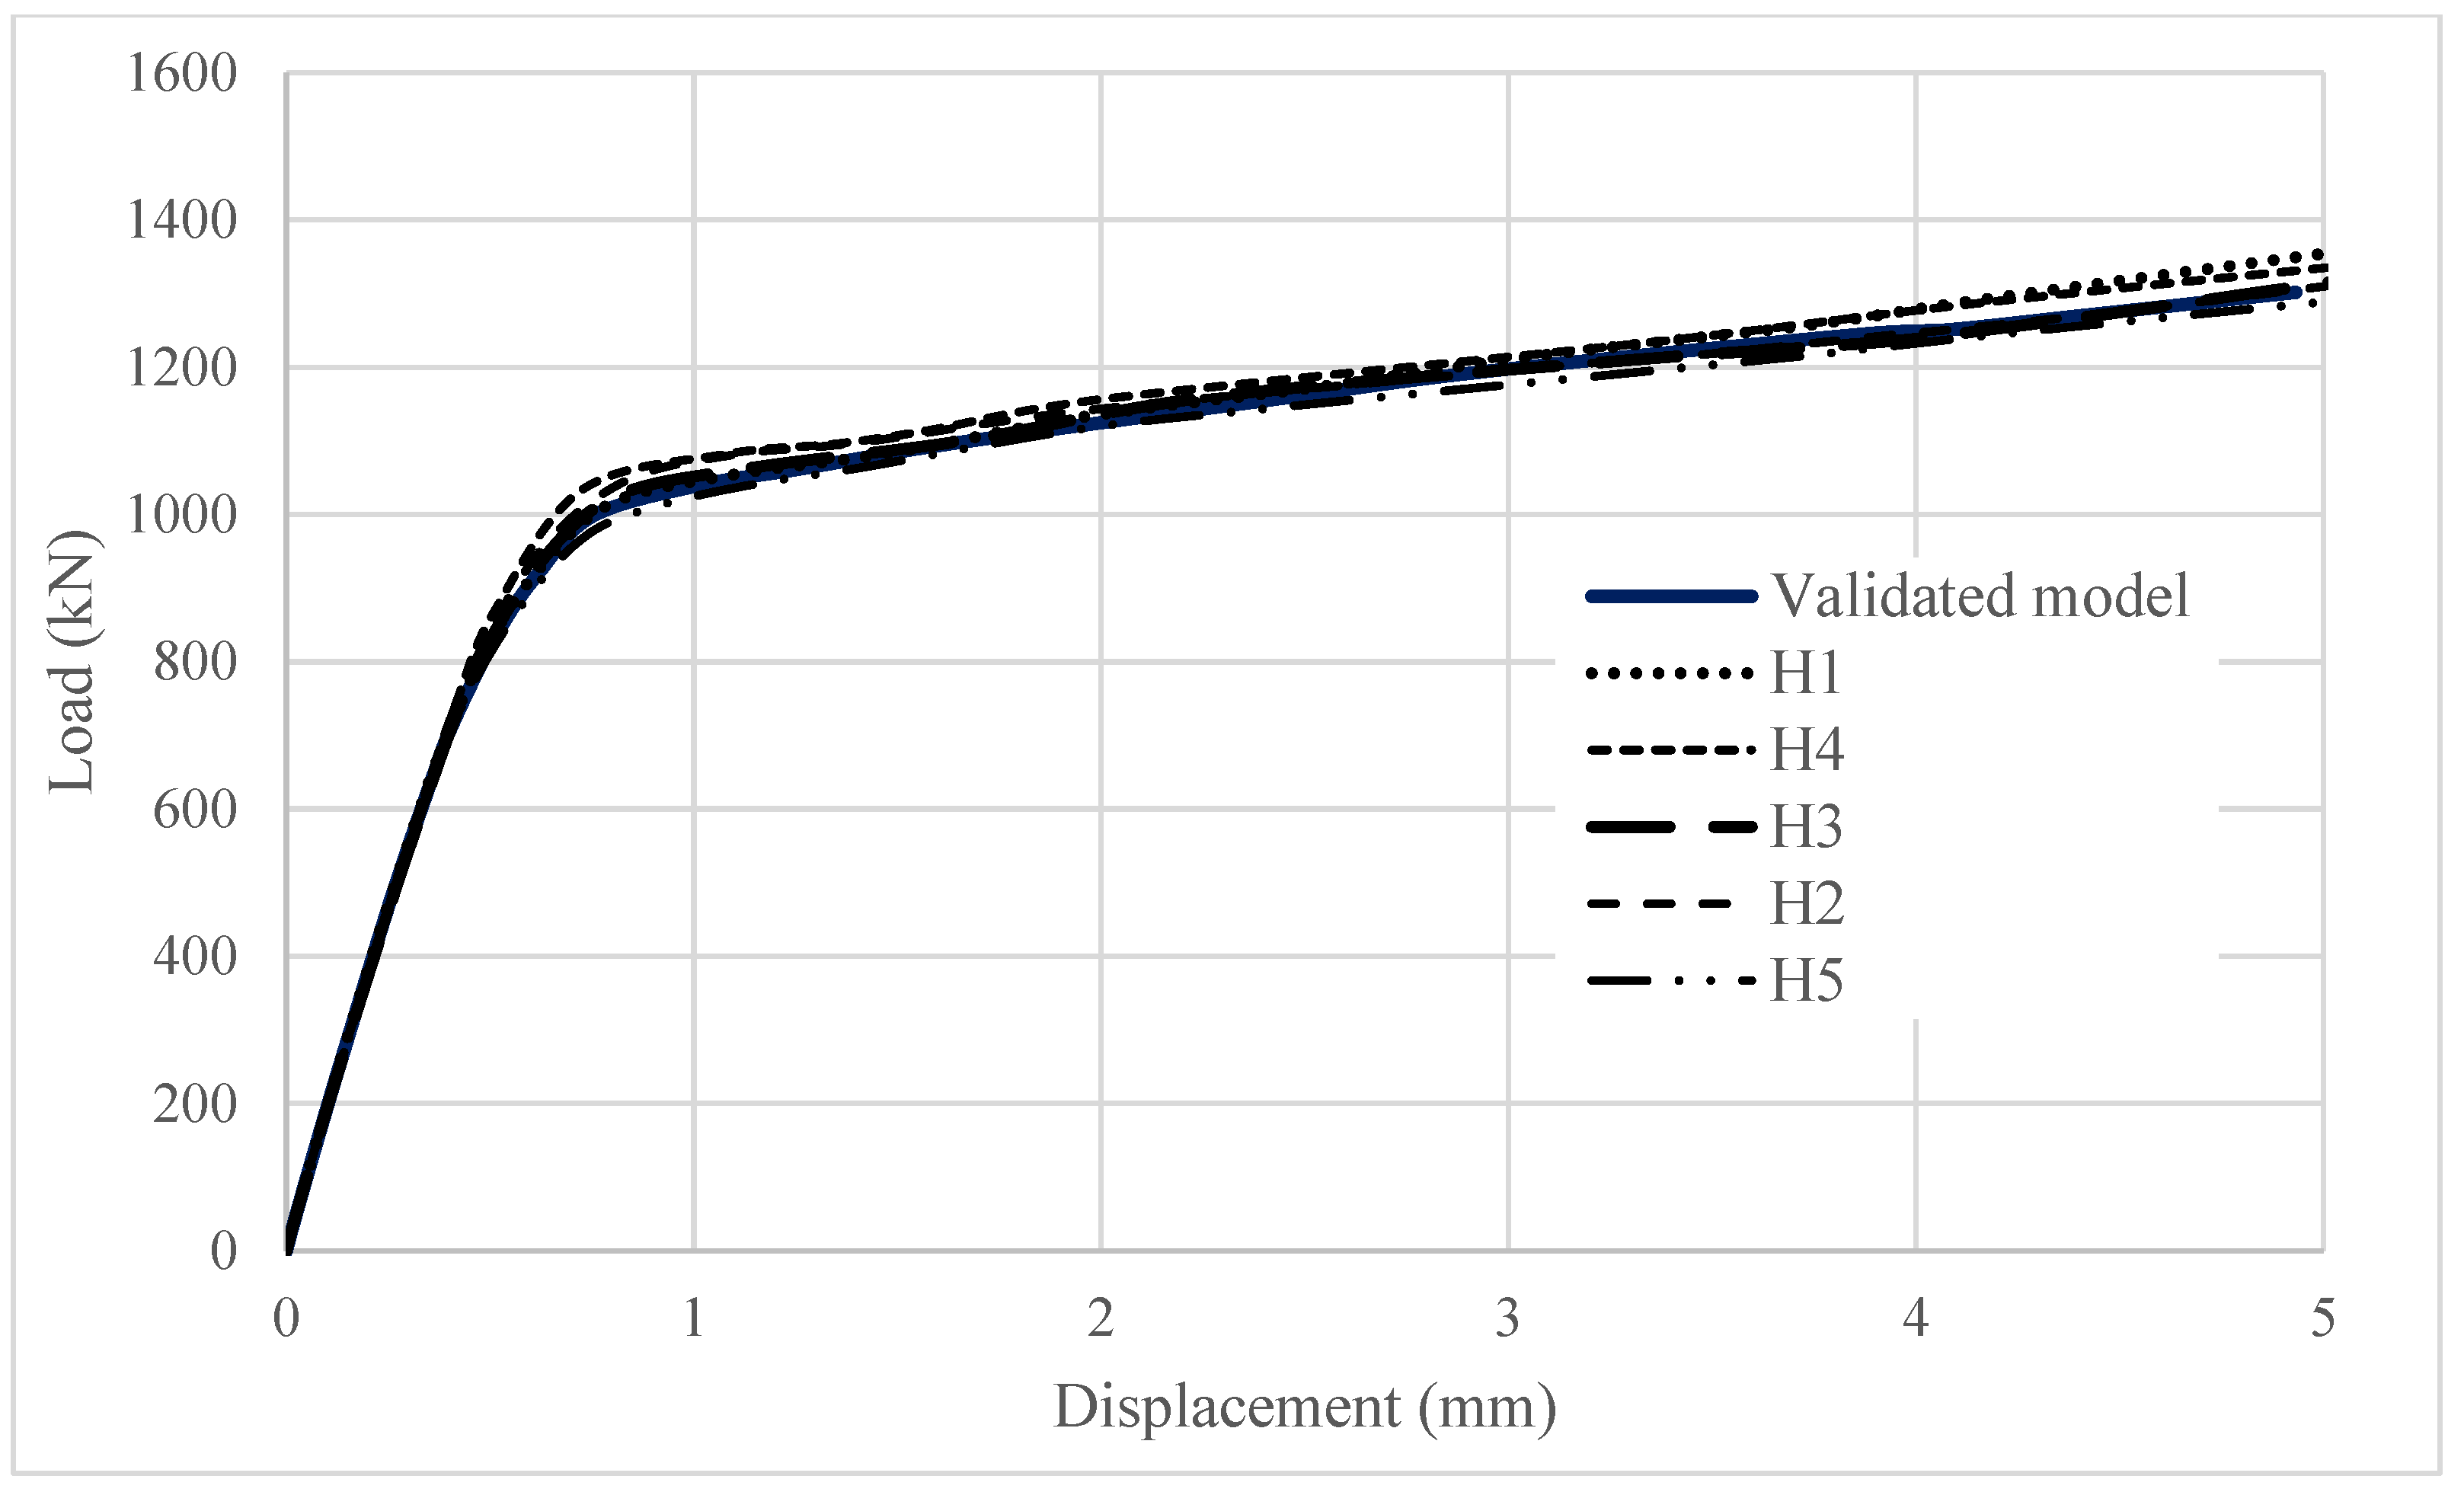
Table 2 presents the variations in the height of the stud shank, with the validated model utilizing a stud height of 115 mm.
Figure 13 depicts the results obtained from the numerical models incorporating these variations. While significant differences were anticipated due to the α correction factor specified in the standard, the results do not reveal substantial deviations when the stud height is altered. In the validated model, a C40/50 concrete strength was employed, in accordance with the experimental test, which was designed using the same materials and geometry as those in the bridge, and constructed by the bridge contractor in a manner identical to that of the bridge itself.
Previous studies [
3,
4] have demonstrated that, with increasing concrete strength, the influence of stud length diminishes, particularly when using UHPC. In such cases, stud failure becomes the dominant mode of failure. Conversely, for concrete grades typically used in bridge construction, where the concrete zone experiences considerably higher levels of damage (as compared to UHPC), the selection of stud length exerts a markedly reduced effect.
In the research, several variations were considered, including the geometry of the stud head. In the validated model, the head diameter was set to 31 mm, with the variations presented in
Table 3.
Figure 14 illustrates the results, where a negligible impact on the behavior of the steel–concrete connection was observed.
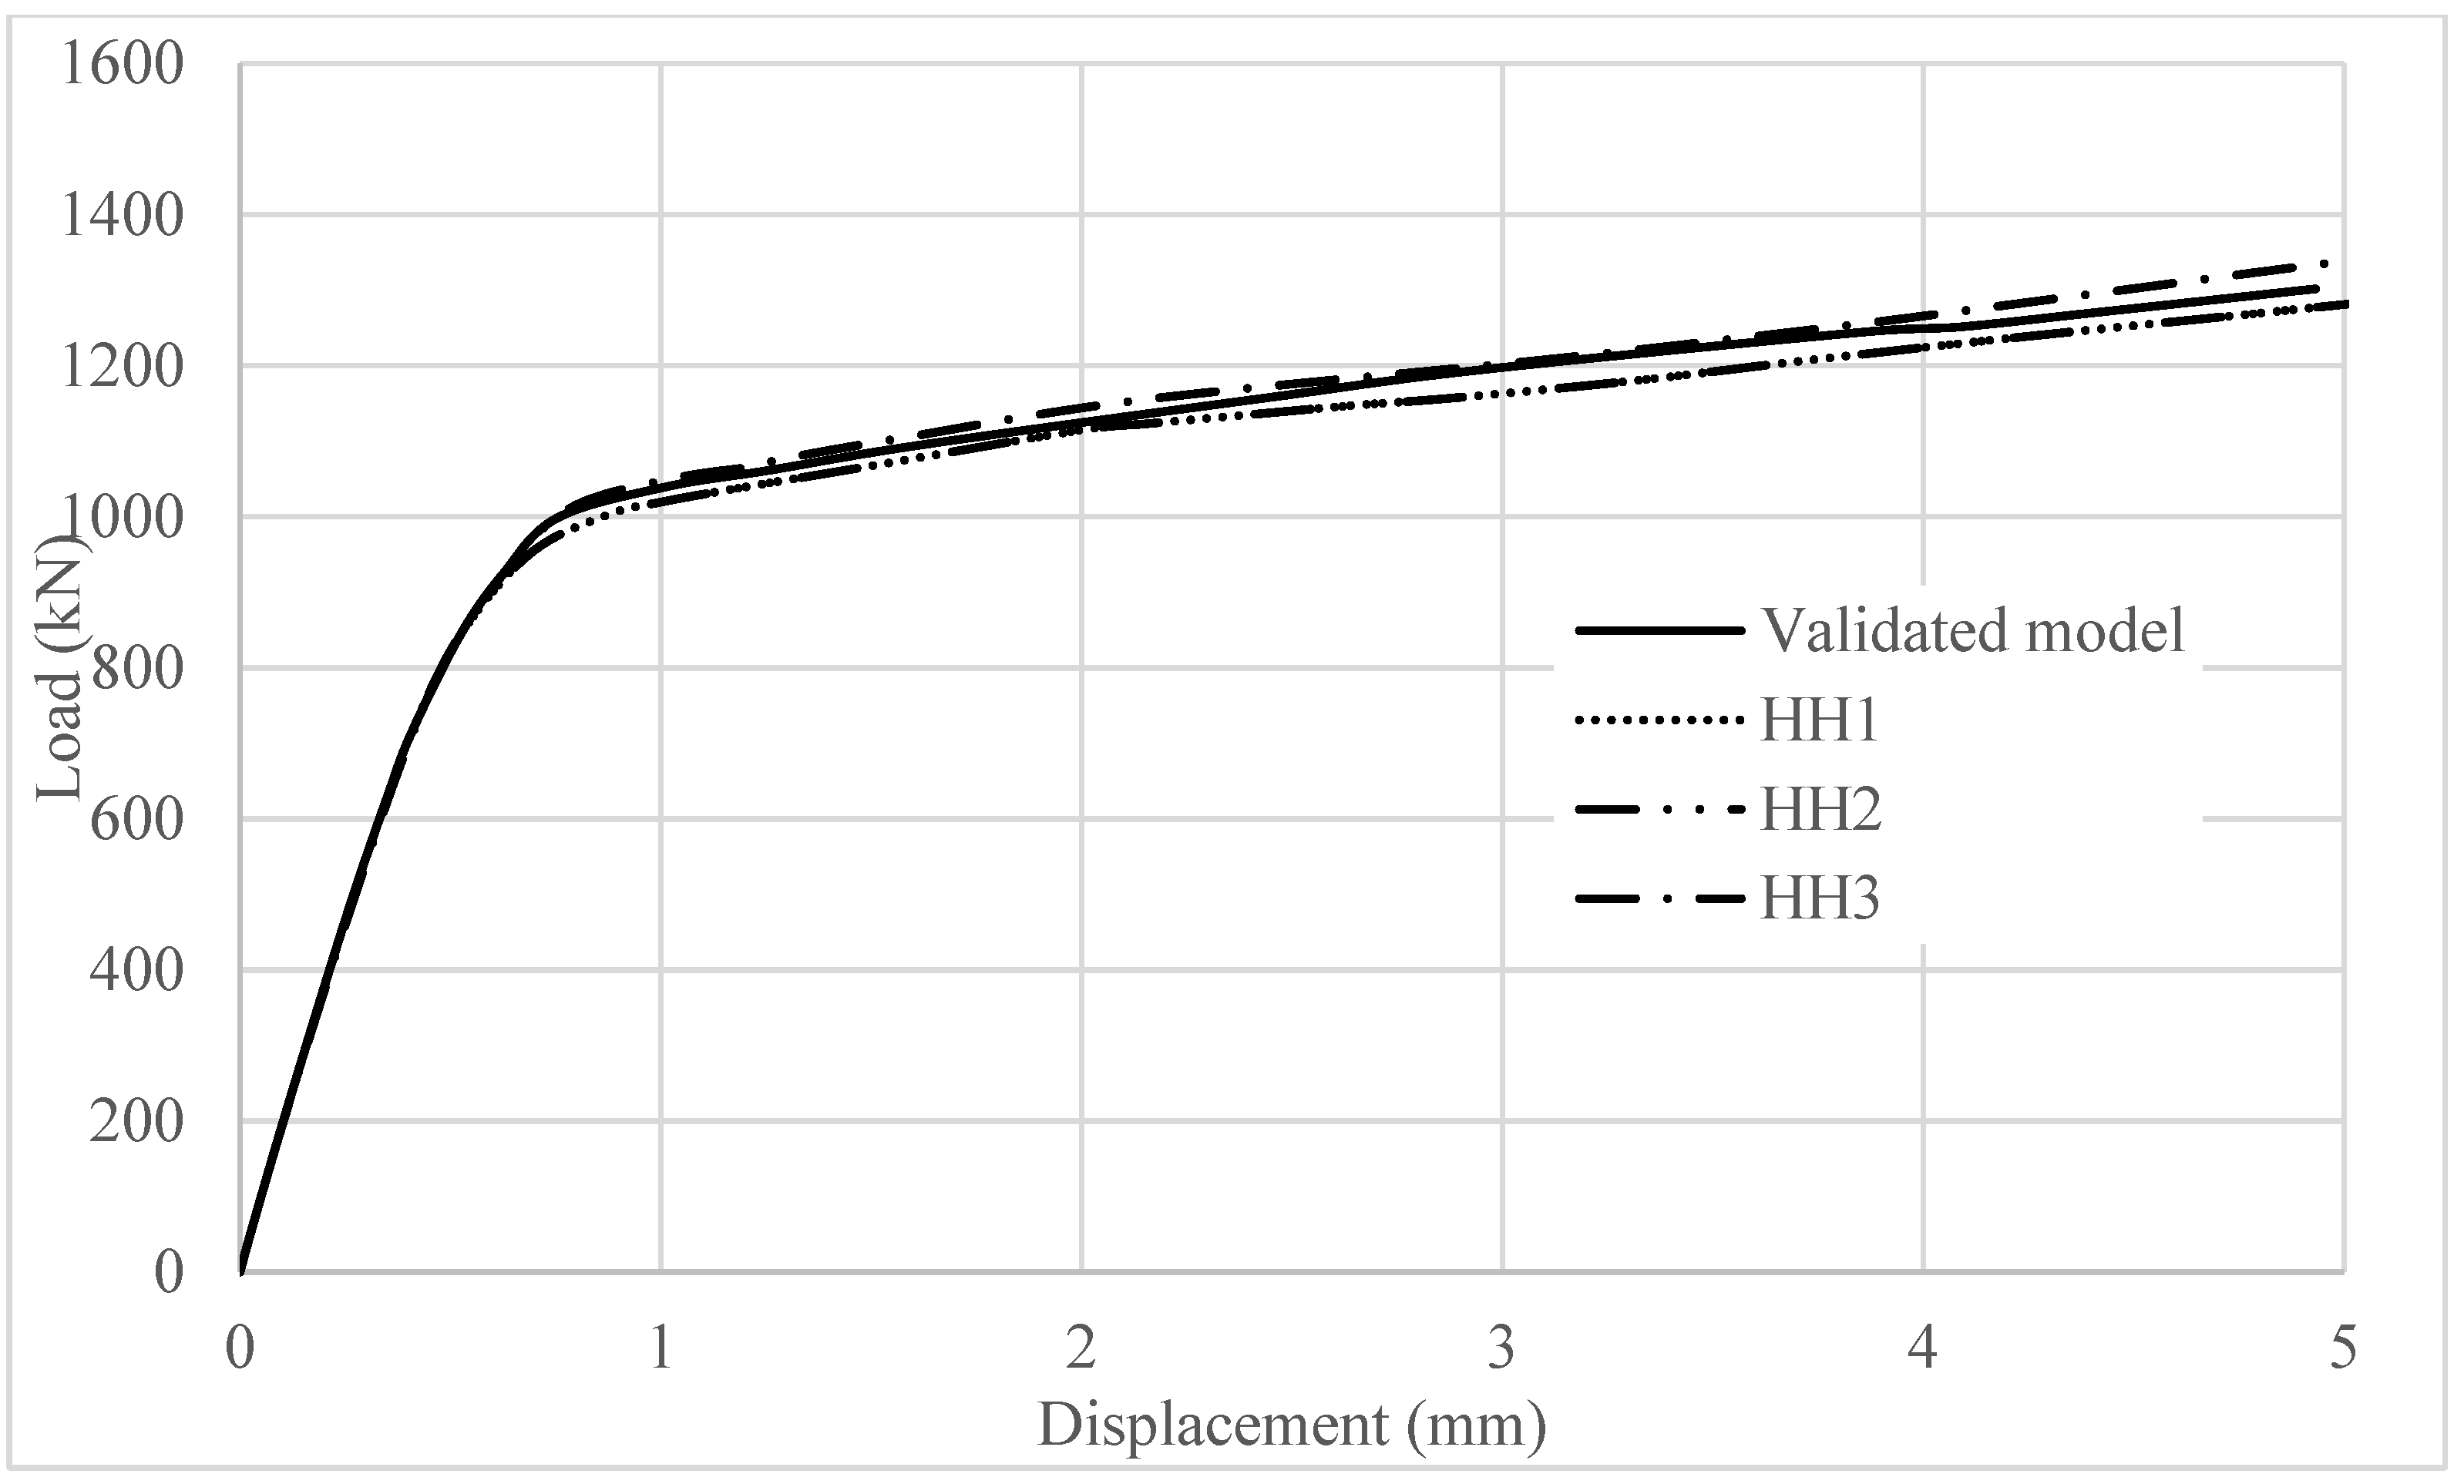
Several variations were examined in the investigation, as the height of the head of the stud.
Table 4 summarizes these variations, with the stud height set to 31 mm in the validated model. The results, shown in
Figure 15, indicate that the effects on the behavior of the steel–concrete composite structure were minimal.
In this research, longitudinal spacing was examined. Several studies, as introduced earlier, have addressed this topic, with the following being particularly noteworthy. Okada et al. [
29] conducted an analysis of the shear strength of grouped-stud connectors, highlighting the effect of longitudinal spacing. Their analysis, which considered varying spacings and concrete strengths, showed that the maximum load occurred when stud spacing was 13d. Similarly, Lu et al. [
34] investigated the shear performance of grouped studs and discovered that the grouped stud effect, caused by overlapping compression cracking zones, reduces the average shear capacity of individual studs. They suggested that the grouped stud effect should be considered in designs when the stud spacing is less than 13 times the stud diameter to account for the reduction in shear capacity.
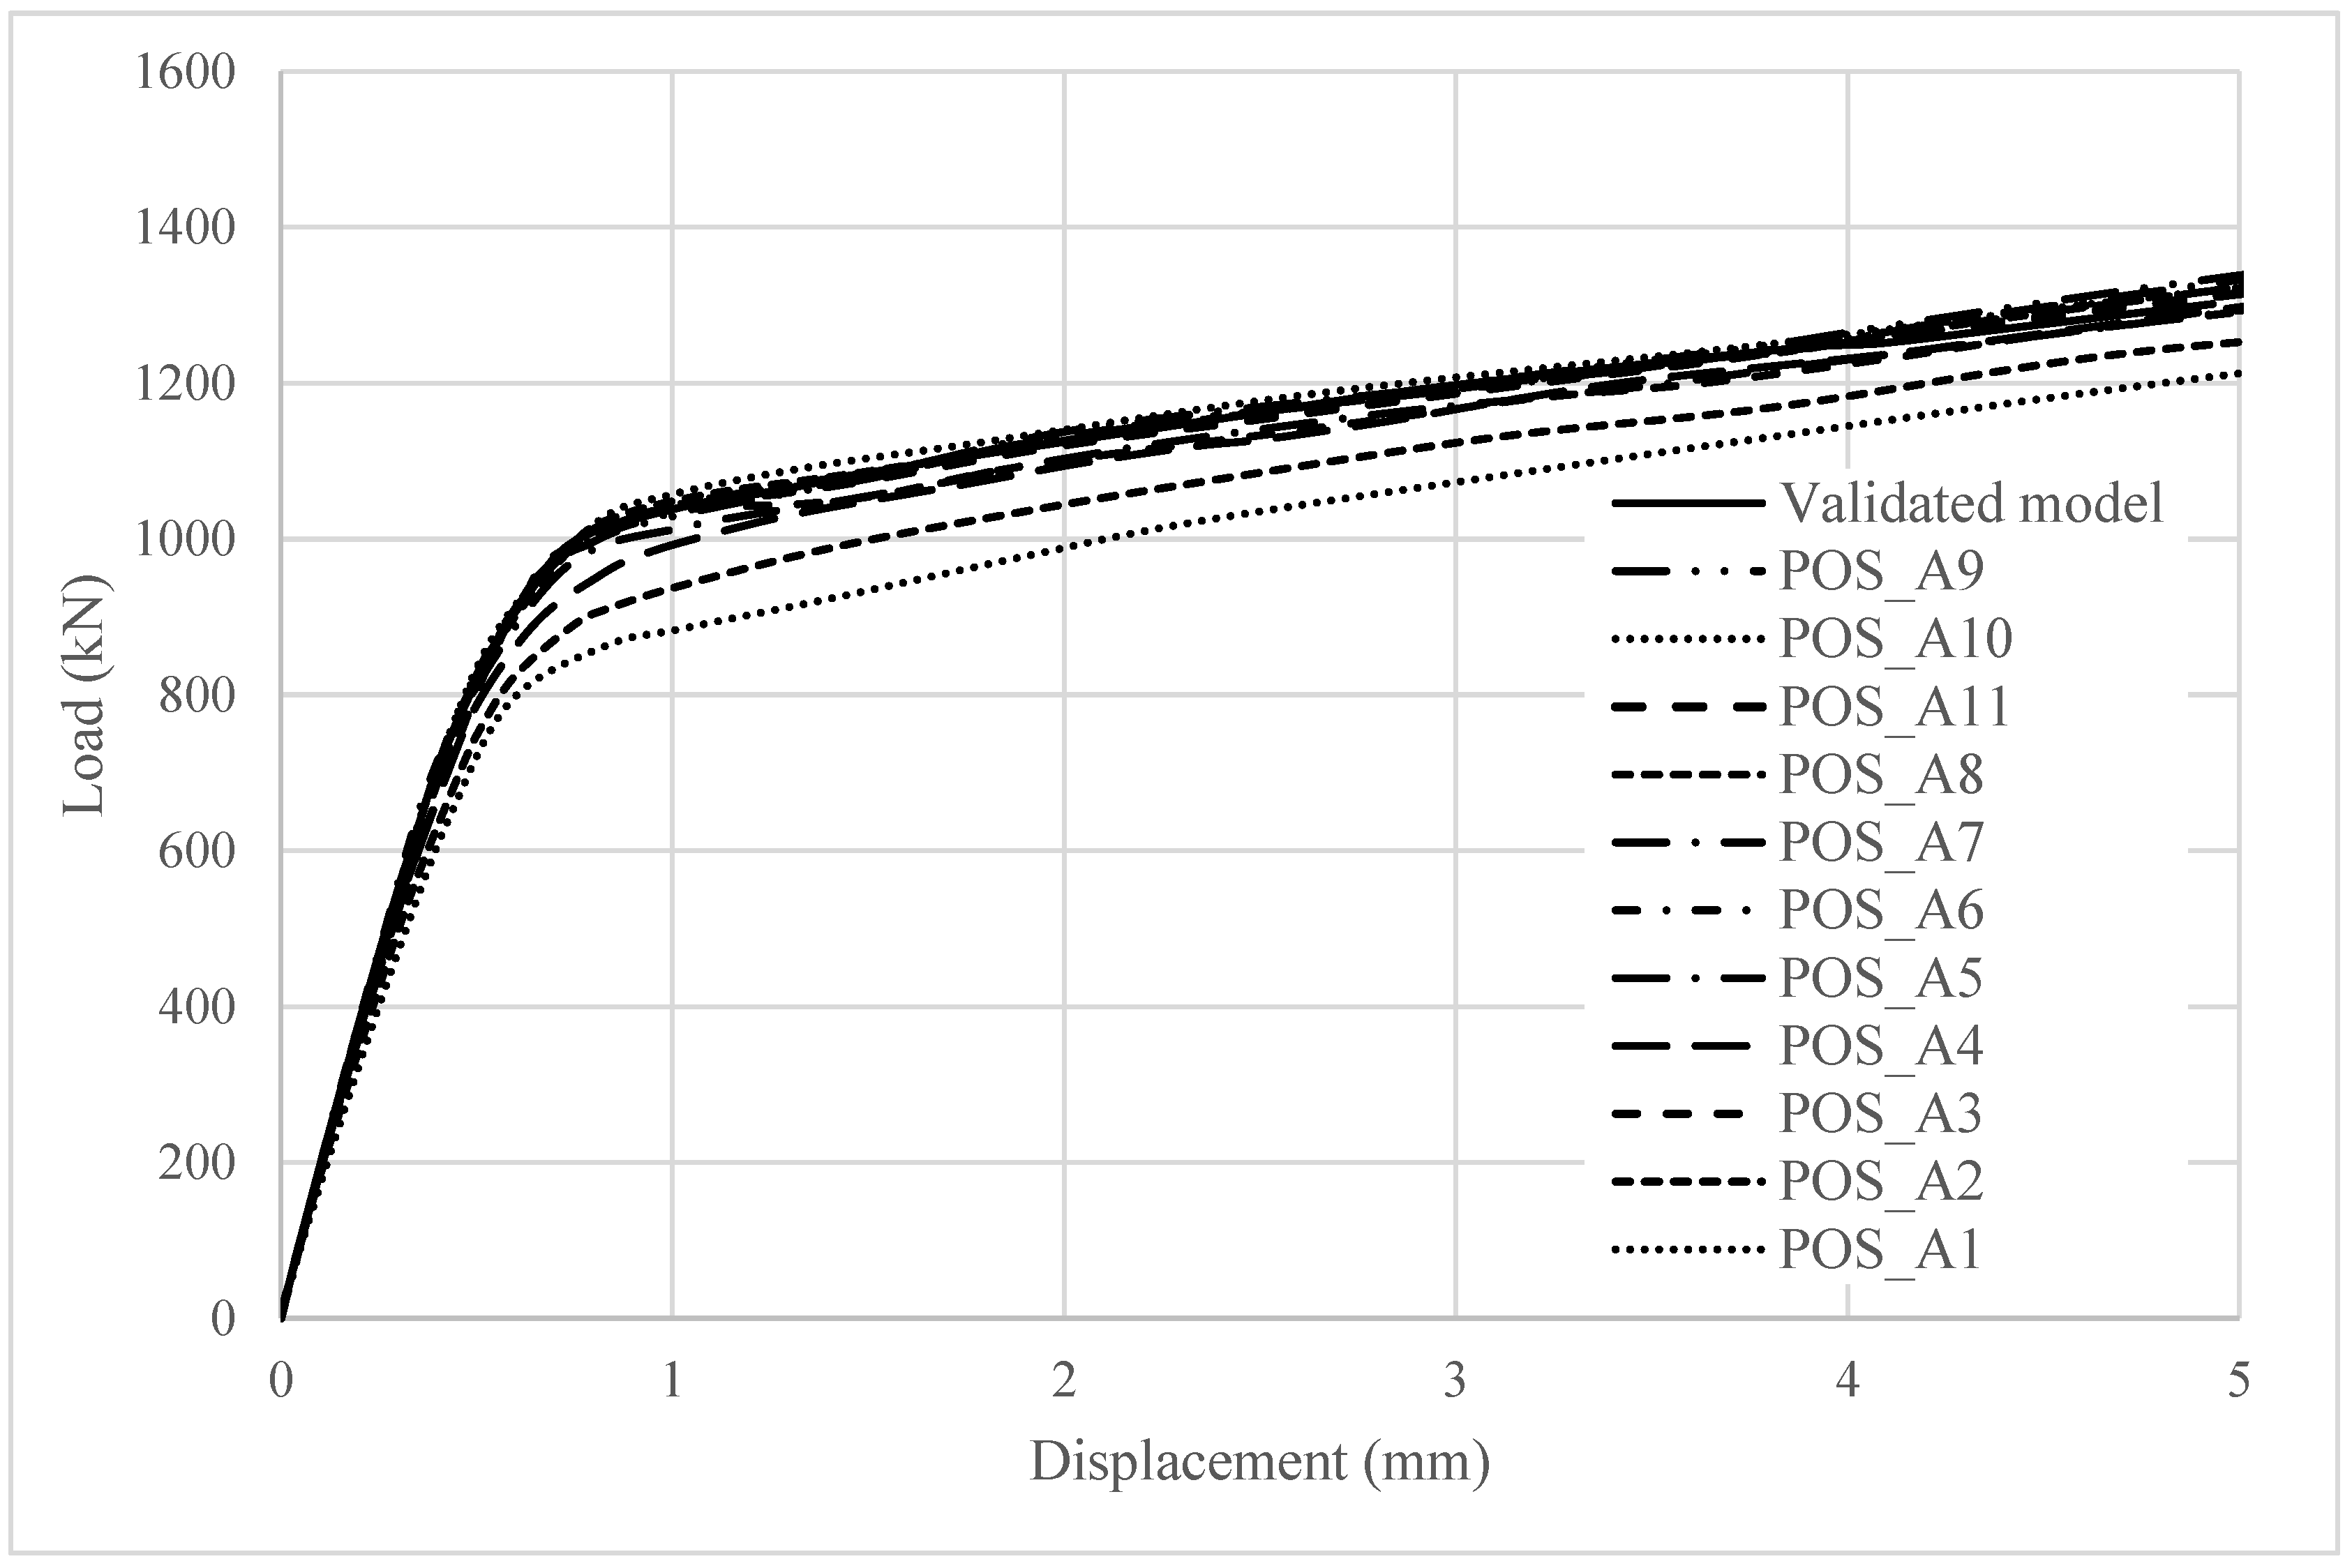
Table 5 presents the variations in longitudinal spacing, which was set to 250 mm in the validated model.
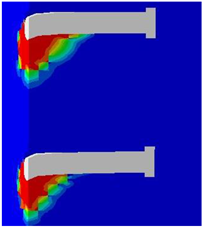
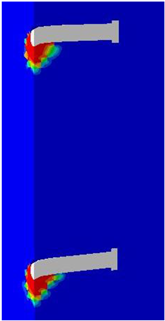
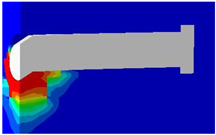
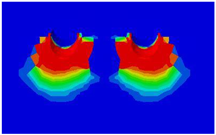
Figure 16 presents the results of the analysis, demonstrating the significant effect of closely spaced studs on load–displacement behavior, with an overlapping effect observed in the concrete damage zones. The sequence of variations presented in the figure’s legend aligns with the order of the ultimate loads, indicating that the highest value corresponds to the first-listed variation. Consistent with findings reported in the literature, the maximum value was observed at the 13d longitudinal spacing, identified as a local maximum. The curves corresponding to the 15d and 17d variations, positioned below this point, are nearly identical, as are those of the 12d and 10d variations. Below this threshold, a continuous and significant decrease in values can be observed.
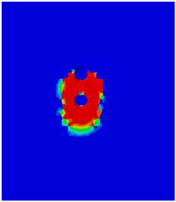
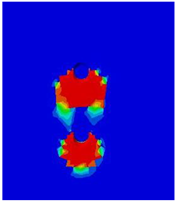
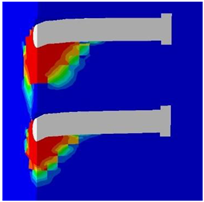
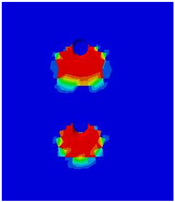
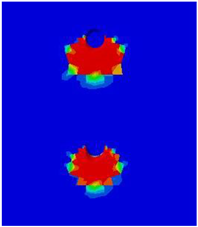
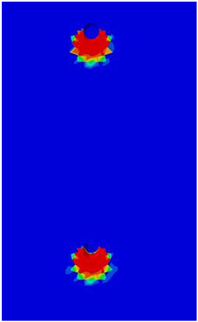
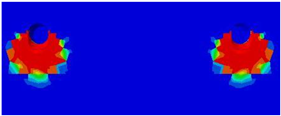
Table 6. illustrates this overlapping of the damage zones phenomenon, displaying detailed concrete damage diagrams from the numerical model for different longitudinal spacings.
Table 7 presents the variations in transverse spacing. In the validated model, this distance was 300 mm.
Figure 17 demonstrates the influence of transverse spacing on the load–displacement behavior of the connection. It was observed that the highest value occurred with the closest spacing, and as the distances increased, the load capacities decreased accordingly.
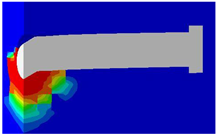
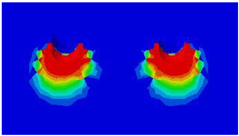
Table 8 shows the concrete damage zones visible in different models, clearly demonstrating that there is no overlapping effect in the transverse direction. The damage zones develop in the direction of the applied force and are concentrated in the area behind the stud.
Reduced stud spacing decreases the potential for slip at the steel–concrete interface, resulting in a more effective composite action, minimizing stress concentrations, improving structural performance, and reducing cracking in the concrete slab.
With the reduction in distance between studs, it becomes possible to apply a higher number of shear connectors, providing redundancy and ensuring improved performance. In the case of GSC, this is particularly advantageous, as the use of prefabricated slabs with concentrated stud groups and minimal transverse spacing can enhance composite action.
5. Conclusions
In this research, the numerical model was developed using an approach that allowed for a comprehensive understanding of the Python code associated with each modeling step. The model was systematically constructed to facilitate future modifications, enabling the automatic generation of models with altered geometries while adhering to the same modeling strategy. This methodology ensures that, despite variations in a single parameter, all other parameters remain fixed while the model is executed within a consistent environment. The numerical model, constructed using ABAQUS, incorporates advanced features such as geometric nonlinearity and the concrete damage plasticity (CDP), which allow for a detailed simulation the behavior of the structure. The use of the experimental data, material properties, and a refined finite-element approach enhances the reliability and accuracy of the model. The research examines the effect of geometric design parameters, including stud diameter and height, stud head dimensions (diameter and height), and both longitudinal and transverse spacing, on the structural behavior of steel–concrete composite connections. Using the Python-based, parametrically constructed model, the design parameters can easily be modified, without any failure of the modeling process, facilitating a more efficient investigation of their effects.
The research demonstrates the significance of changes in the stud diameter in accordance with Eurocode standards and other research. In our study, the issue of stud length was examined, and it was found that its significance is less pronounced when considering the properties of the concrete used in the study. As other researchers have shown with UHPC, smaller h/d ratios were investigated, and the suitability of smaller stud heights was demonstrated. Similarly, in bridge construction, with the applied concrete material model, it was found that stud length has no significant effect on the ultimate load. This holds true even though at lower concrete strengths, as in concrete used in the bridge field, the compressive failure of the concrete zone becomes much more significant. Other stud geometry factors, including stud head diameter and height, were also investigated; however, these did not have a notable effect on the behavior of steel–concrete composite connections.
Important investigations were carried out concerning the stud arrangement, which was automatically generated using a Python-based numerical model, thus minimizing modeling errors. The best structural performance was observed at a longitudinal spacing of 13d. At 2d, 3d, and 4d spacings, overlapping effects were observed, significantly reducing performance. This was confirmed by comparing the ultimate load and force–displacement results, and the overlapping effect was also substantiated by comparing concrete damage zones across the variations. The longitudinal spacing was shown with wide variations, considering the precise application of materials used in bridge construction, and their nonlinear material properties with CDP.
For transverse spacing, it was observed that reduced stud spacing decreases the probability of slip at the steel–concrete interface, resulting in more effective composite action, minimizing stress concentrations, improving structural performance, and reducing cracking in the concrete slab. Concrete damage zones were visible in different models, clearly indicating that no overlapping effect was observed in the transverse direction. The damage zones formed along the direction of the applied force and were concentrated in the region behind the stud. As the distance between studs decreases, it becomes possible to apply a higher number of shear connectors, providing redundancy and ensuring improved performance. This is especially beneficial in the case of grouped-stud connectors (GSCs), where the use of prefabricated slabs with concentrated stud groups and reduced transverse spacing can improve composite action.
The obtained results underscore the significance of model-based automated modeling, where parameter modifications, whether applied individually or collectively, dynamically influence and adapt other factors throughout the model creation process. This approach ensures the generation of accurate results while minimizing errors, even in highly complex and intricate modeling procedures.
Within the same modeling environment, geometric modifications can be implemented, facilitating a comprehensive analysis of structural alterations. Based on these findings, future design standards should incorporate insights derived from such finite-element modeling, particularly when independently validated by multiple researchers using various approaches. For example, this is especially relevant in the case of the results of this research in connection with longitudinal spacing.
Future research should consider the influence of different concrete types, particularly UHPC, in relation to key parameters such as steel stud length. While this study focused on a single concrete type—subjected to extensive laboratory testing and modeled using the CDP model to represent its nonlinear behavior—there remains a critical need for further investigation. Specifically, future studies could extend numerical modeling approaches to account for material variations.


