Article

On the Use of a Water Potential Probe for Suction and Temperature Measurements in Unsaturated Natural Clayey Soil

Department of Civil, Environmental, Land, Building Engineering and Chemistry, Polytechnic University of Bari, 70126 Bari, Italy
*
Author to whom correspondence should be addressed.
Appl. Sci. 2025, 15(6), 3021; https://doi.org/10.3390/app15063021
Submission received: 14 January 2025 / Revised: 13 February 2025 / Accepted: 6 March 2025 / Published: 11 March 2025

Abstract

:
The accurate measurement of soil suction is essential for understanding the behavior of unsaturated soils, particularly in soil–vegetation–atmosphere (SVA) interactions, where both energy and hydraulic gradients due to climatic action exhibit their maximum intensity. This study assesses the performance of the TEROS 21 probe, a capacitance-based water potential sensor, for measuring soil matric suction and temperature in clayey soils of the South Apennines, Italy. Laboratory tests were conducted on soil samples with varying moisture contents, and the results were compared with those obtained using the traditional filter paper (FP) method and high-capacity tensiometers (HCTs). The TEROS 21 (METER Group, Inc., Pullman, WA, USA) sensor demonstrated a reliable performance, especially at suction levels between 300 and 2000 kPa, though there was some dependency on the initial sensor conditions (wet or dry). The temperature data obtained from the TEROS 21 were verified by using a thermocouple, showing the high consistency of the readings. This study showed that the filter paper and sensor measurements aligned at a water content lower than 30% but diverged at higher levels due to method-specific accuracy limitations. The consistent sensor results confirmed the measurement’s reliability. The air-entry value (AEV) of the soil water retention data was identified at around 800 kPa, which is consistent with previous findings.

1. Introduction

The thermo-hydro-mechanical behavior of topsoil is decisive for the serviceability and stability of structures and infrastructure [1,2] as well as for landscape management [3], especially in view of climate change [4]. The upper portion of the soil, often in a partially saturated condition, is where exchanges of liquid, gas, and energy determine the so-called soil–vegetation–atmosphere (SVA) interactions [4]. Soil suction, which represents the negative pore water pressure, is a key state quantity governing the hydro-mechanical (HM) behavior of unsaturated soils [5,6]. In this respect, accurate matric suction measurements are essential for characterizing the properties of partially saturated soil [7,8], which allow for the prediction of water seepage in the soil [9], and for the assessment of slope stability conditions, especially for fine-grained soils, where high suction can occur, significantly influencing shear strength and volume change behavior [5].
The coupling of suction with the soil water content, which characterizes the partially saturated behavior of the soil, is fundamental in several geotechnical problems, for example, in slope stability analyses, especially when both the energy and the hydraulic gradients due to climatic action exhibit their maximum intensity in the topsoil. Continuous monitoring data on these parameters supports a range of stability models, including limit equilibrium-based closed-form equations [6,10], physically based models [11,12], and finite element models [1,13]. Such models usually require the knowledge of two constitutive relationships, i.e., the soil water retention curve (SWRC) and the soil hydraulic conductivity function, which relates the matric/total suction to the water content and the hydraulic conductivity, respectively. These relationships characterize the HM behavior in unsaturated soils [6]. However, the SWRC is characterized by a hysteretic nature, which occurs with cycles of wetting and drying processes [6,14,15], and that could be modeled by a major loop that extends between the two extreme soil water contents (ϑs; ϑr), bounded by two main curves: the main drying curve and a main wetting curve [16]. The hysteretic behavior of the soil has further implications for the water movement, soil deformation, and shear strength in unsaturated soils [17]. Thus, the retention curve is more accurate, the more precise and reliable measurements of suction and water content are, which evolve during drying or wetting processes.
The choice of a specific device for measurements of suction depends on several factors, such as the suction range, resolution, accuracy, equalization time, operating temperature, and stability/continuity in measurement [7,8,18,19,20,21,22,23]. Traditional methods for measuring matric suction, such as tensiometers [24,25] and high-suction probes, may have limitations, particularly in fine-grained soils, in terms of the equalization time and stability measurement, the latter being due to a greater sensitivity to the phenomenon of cavitation. Thus, in a complex geotechnical context, an approach based on combined measurement techniques should always be pursued to increase the reliability of the measured data.
In this respect, to allow a fair comparison between different measurement techniques, the choice of the sample volume becomes important On the one hand, the sample must have a sufficiently large volume to ensure that the measurements are representative. On the other hand, an excessively large volume could introduce too many material heterogeneities, thereby compromising the reliability of the measurements, especially in the context of the Southern Apennines [26,27,28], in which structurally complex formations [29] and heterogeneity are present. Among many, an example of the reliability of the filter paper (FP) technique is that reported by Cafaro et al. [30], who compared the matric suction measured by means of 13 filter papers placed “in-contact” on a Blue Clay sample (of about 7000 cm3) with the value obtained using a high-capacity tensiometer (HCT) [25]. Consistency was found between the latter and the mean suction value of 1692 kPa (with a standard deviation of 190 kPa) as calculated by averaging the 13 values obtained using the filter papers.
From this perspective, this study investigates the consistency of suction measurements using indirect measurement methods such as those obtainable through commercial sensors. The TEROS 21 is a water potential sensor widely used in agriculture as a cost-effective tool for in-situ monitoring of matric suction in unsaturated soils [22,31,32,33,34,35]. Specifically, the main objective of this study is to assess the response of the TEROS 21 probe in terms of the suction measurement range and equilibrium time, comparing its performance with established methods, such as the FP technique [36,37,38] and HCTs [25]. Following the approach of Tripathy et al. [7], this experimental study also examines the influence of the initial moisture conditions of the TEROS 21 porous stone (wet or dry) on the measured suction values. These initial conditions could impact in-situ measurements, potentially leading to the misinterpretation of the SWRC during drying or wetting processes. Finally, since the TEROS 21 also incorporates a sensor to log temperature (T), the temperature readings are compared with those obtained from a thermocouple sensor to further corroborate the consistency of the probe.

2. Materials and Methods

2.1. Outcropping Soil on Pilot Case Study: The Pisciolo Hillslope

The fine-grained soil used in this study results from the geotechnical characterization of the properties of topsoil in structurally complex formations largely present in the Southern Italian Apennines [1,26,28,39], which are often the location of weather-induced landslide [1]. Except for a few contributions [26,27,28], which offer water retention data on the outcropping soil on the Pisciolo hillslope, the natural unsaturated fissured clays have not yet been thoroughly studied. In this context, the characterization of the HM properties of the topsoil is of key relevance to better predict the thermo-hydro-mechanical response as a result of the slope–vegetation–atmosphere interaction [33,39]. The soil was sampled at the toe area of a Pisciolo landslide body [39] from a depth ranging between 0.3 and 1 m from a continuous borehole (660 mm diameter). The soil used is classified as silty clay with a slight sandy content, based on AGI (1994) [40] classification. Its composition includes 45% clay fraction, 30% silt fraction, 21% sand fraction, and 4% gravel fraction. The specific gravity, liquid limit, and plastic limit were found to be 2.61, 68%, and 33%, respectively.

2.2. Methods for Matric Suction Measurements

The water potential sensor used in this study [41] measures both the matric suction, by using two porous discs (i.e., ceramic) with a known pore size distribution (fixed-matric), and the soil temperature, using a surface-mounted thermistor (Figure 1). In particular, the sensor indirectly measures the water content of the two ceramic discs (dielectrics) spaced apart by a printed electrical circuit board by measuring their electrical resistivity and then returns a suction value of the ceramic discs according to their water retention curve [42]. The obtained value of the suction of the ceramic discs is then supposed to be equal to the soil suction, considering that the water potential equilibrium is established between the sensor and the soil that is in contact with it. According to the manufacturer’s specifications, the sensor is calibrated at a saturated state (0 kPa), at a dry state equivalent to 105 kPa, and four calibration points between 0 and 100 kPa, resulting in an accuracy of ±10% of reading +2 kPa over the range of 5 to 100 kPa [41]. At high suctions, the accuracy of the sensor depends on the water retention property of the ceramic disc [42], established based on mercury intrusion porosimetry [43]. The lower limit of the suction reading range for the sensor (i.e., 9 kPa) corresponds to the AEV of the largest pores in the ceramic discs. The operating temperature of the sensor is between 0 and 60 °C. A thermistor is located underneath the sensor overmold (resin) that enables monitoring of the temperature. The range, resolution, and accuracy of the temperature sensor are −40 °C to 60 °C, 0.1 °C, and ±1 °C, respectively [43].
In addition, Whatman No. 42 filter paper and high-capacity tensiometers were used to measure matric suctions, as described in Pedone et al. [28]. The filter paper technique was used in the range 100 kPa–25 MPa. Four in-contact filter discs, two on each side of the sample, were added. The two “protected-in-contact” filter paper discs were used to calculate one average suction value [28]. For at least 14 days, suction measurements were taken to allow the filter paper to equilibrate with the suction level in the soil specimen [25,38]. The HTC was used for suction values of less than 1500 kPa. Measurements involved fixing the tensiometer tip to a Perspex disc on the specimen base, applying kaolin paste for hydraulic contact, and wrapping the specimen in cling film to prevent evaporation. Measurements were often repeated on both specimen bases using different tensiometers, with the reported matric suction value representing the average of these readings.

2.3. Experimental Setup

Six soil samples, each with a volume of approximately 250 cm3, were prepared by adjusting their initial water contents through the addition of predefined amounts of distilled water to achieve six different soil moisture conditions. Before testing, the water contents were estimated based on approximately 20 g of fragments taken from each sample, using the gravimetric method (ASTM D2216-19 [44]). Based on the representative water content recognized during the in-situ investigation [39], the determined water contents were 22.1%, 26.7%, 28.8%, 34.4%, 37.4%, and 41%. The unit weight of the samples was determined to stay within the range of 15 and 17 kN/m3, considering the volume, mass, and water contents of the soil samples. As environmental conditions impact soil suction [16], the tests were carried out in a geotechnical laboratory with thermo-hygrometrically controlled conditions, with a temperature of 20 ± 1.5 °C and a relative humidity of around 50%.
To measure the matric suction, the hydraulic contact between the soil and the sensor is a prerequisite for efficient operation of the device. Therefore, part of the sample was used first to surround the sensor’s ceramic disc. Then, the sensor was inserted into the soil specimen and subsequently sealed in a plastic bag (Figure 2a). The plastic bag containing the sensor and the soil specimen were all placed inside a thermocol box. A type E thermocouple was also adopted to measure the temperature variation in the soil sample. A CR1000X (Campbell Scientific, Inc., Logan, UT, USA) series data logger was used to record and store the values of temperature and suction, with a data acquisition interval of 10 min.
In the first test, the 6 soil samples were divided to obtain 12 different samples based on initial water content. The measurement was concurrently conducted in two modes using the TEROS 21: under initially wet and initially dry conditions of the ceramic discs (i.e., six sensors for each condition). The initial states were achieved through two methods: for the series of measurements with initially saturated discs, prolonged immersion in distilled water was used; for the series of measurements with initially dry discs, natural drying was employed by exposing the sensors to the laboratory air. The suction readings of initially wet and dry sensors corresponded to about to 1 kPa and 25,800 kPa, respectively. An equilibrium condition was assumed to be reached when the variation in the measured suction remained within about ±2.0 kPa over a period of 6 h [7]. Some tests were run for a longer time interval, even after the suction equilibrium was attained. The long-term tests may provide information on the stability of the electrical signal of the sensors, corresponding to stability in terms of thermal and hydraulic equilibrium conditions [7]. At the end of the equilibrium time, part of the soil was taken from the 12 samples to re-measure the water content in order to evaluate the effect of the initial condition of the sensors (wet or dry).
Then, a second test was carried out. The six soil samples, together with the sensors, starting with the same initial water content, were put together (Figure 2b). In addition, Whatman No. 42 filter paper was used to measure matric suction (Figure 2c). At the end of the equilibrium time, part of the soil was taken from the six samples to measure the final water content.
In addition, a third test was carried out. Three undisturbed samples from the same material were subjected to drying paths, during which suction measurements were conducted with either the FP technique or the HTC. All suction measurements were performed on specimens of 56 mm diameter and 20–40 mm height. All the retention data determined from undisturbed samples were compared with the final water content–suction values of the specimens at equilibrium at the end of the first and second tests.

3. Results

3.1. Test 1: Suction Equilibrium Time

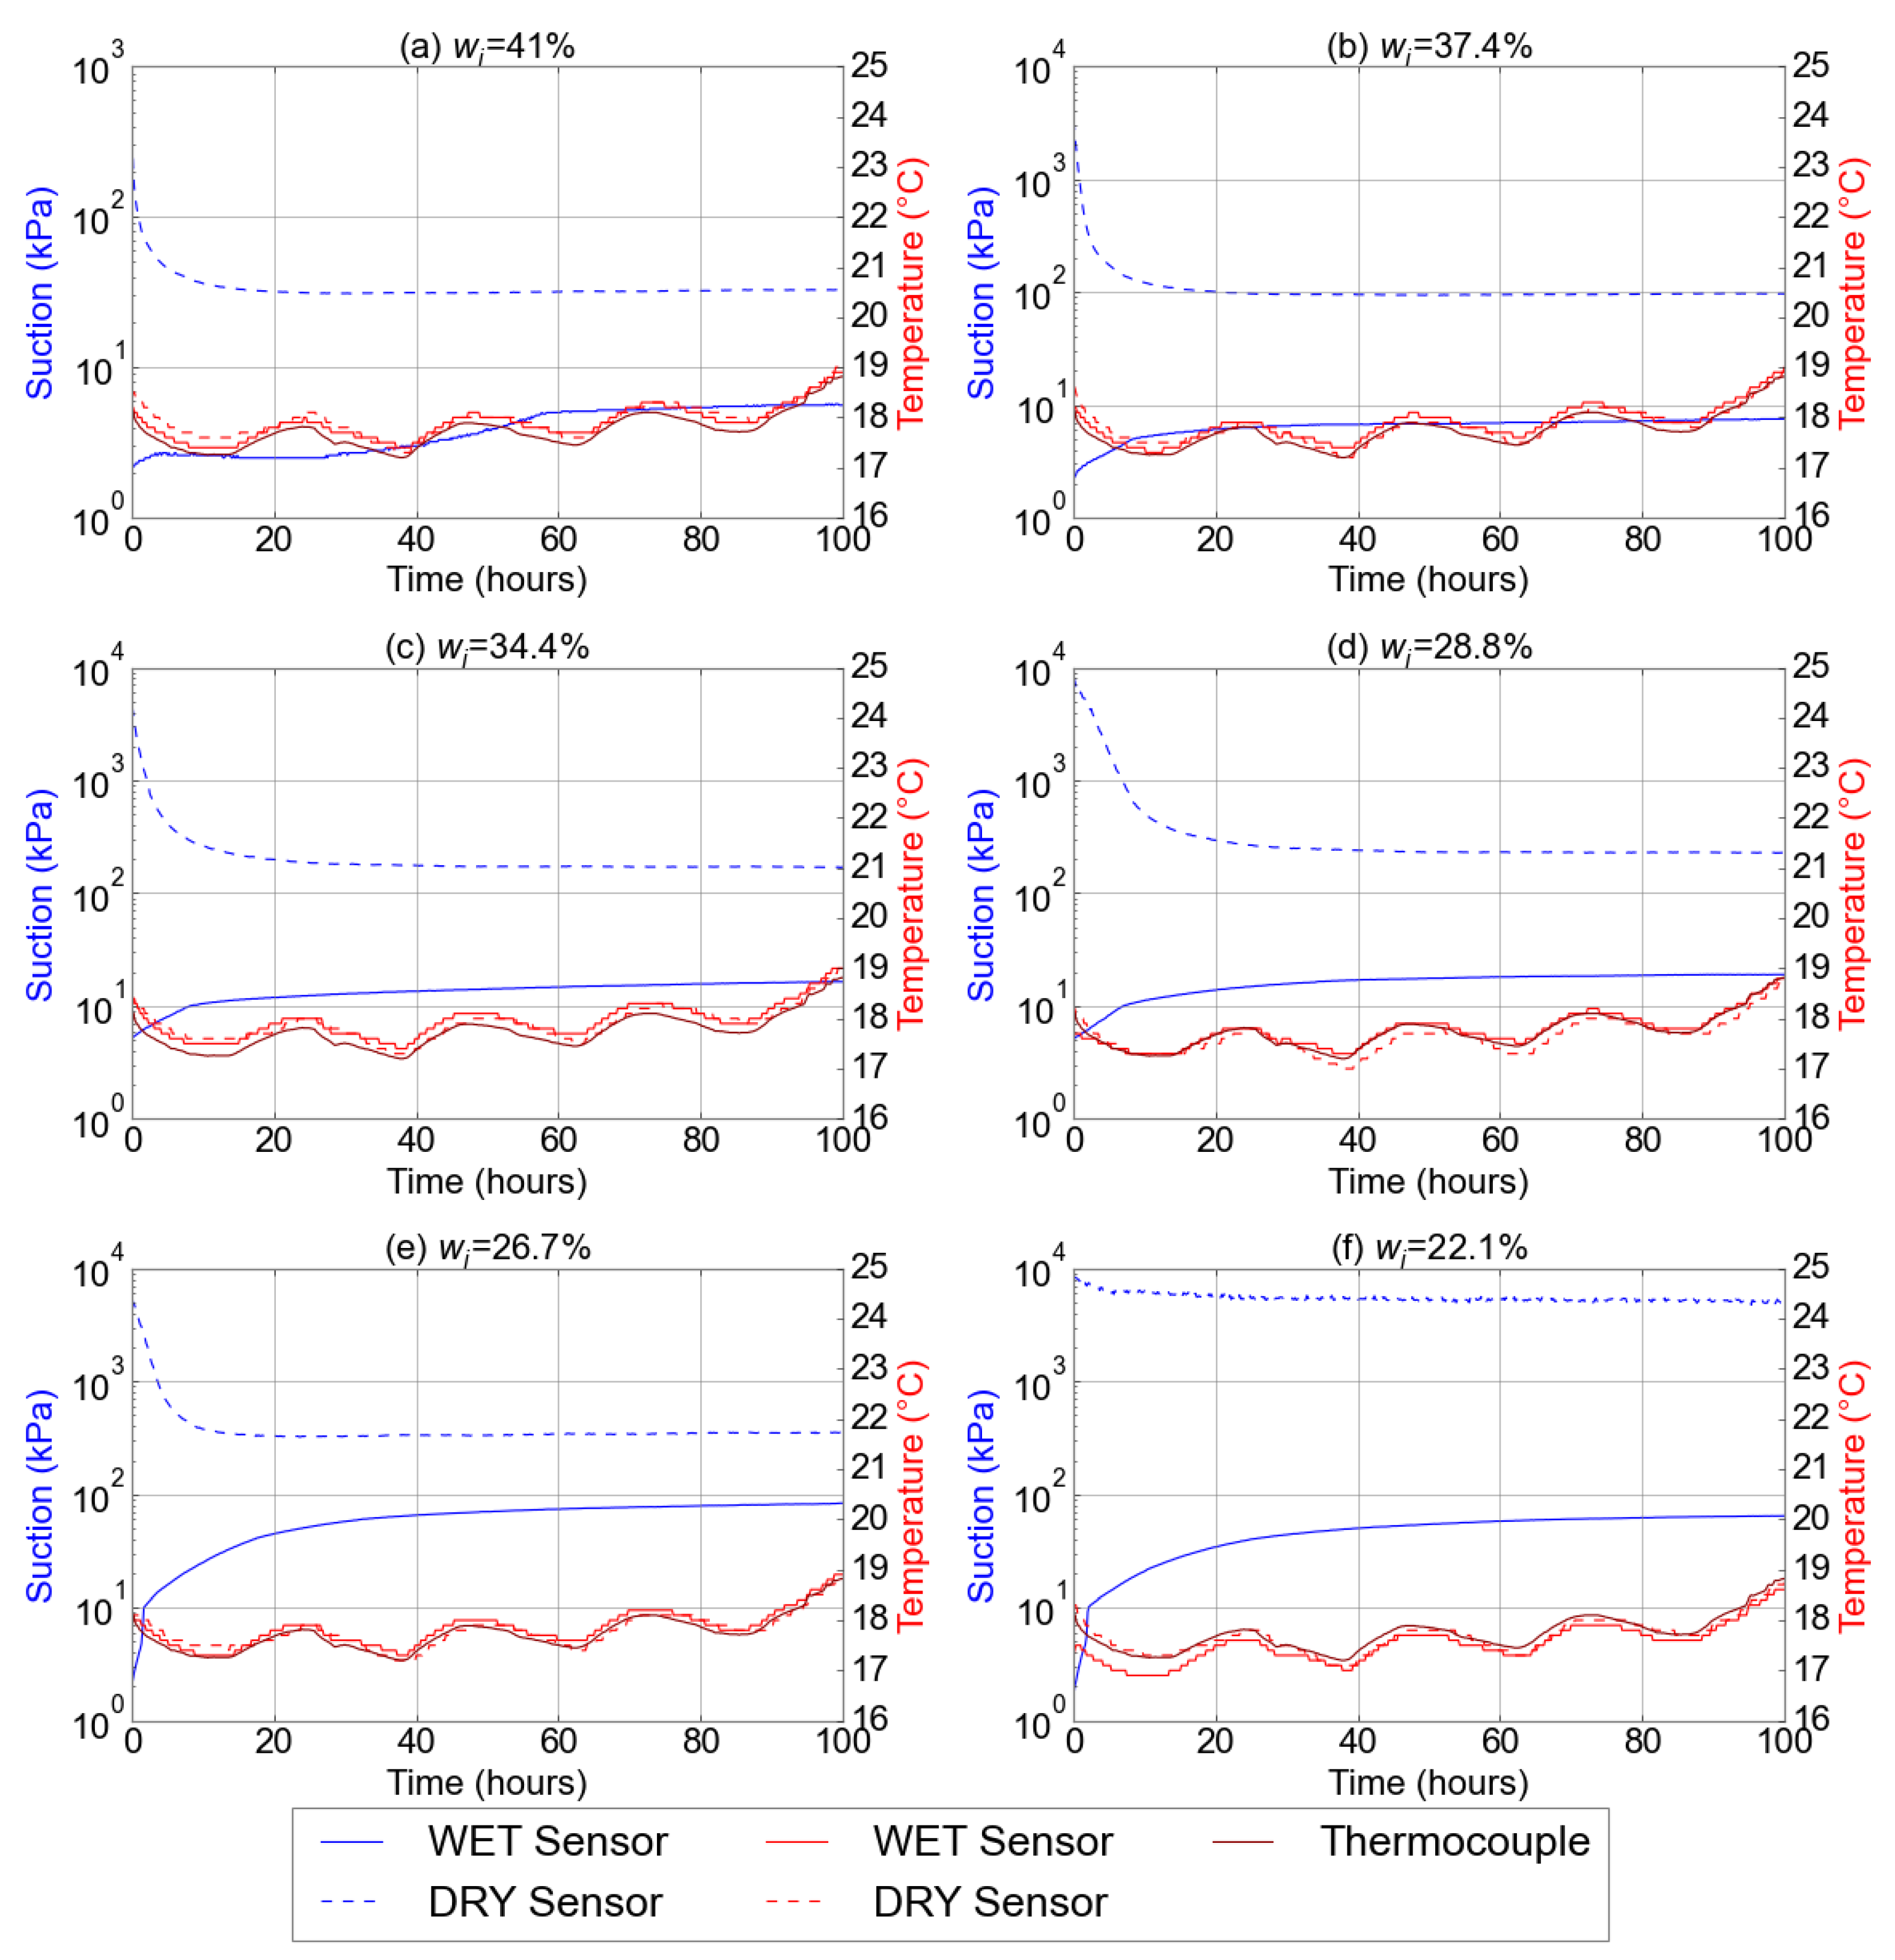
Figure 3 shows the measured suction plots for the soil samples logged by using initially wet (full line) and initially dry sensors (dashed line). In addition, the temperature data recorded by means of the TEROS 21 sensor and the thermocouple during the tests are also reported.
The suction measured by means of the TEROS 21 sensor was found to increase with time when the sensor was initially wet (i.e., the water content of the ceramic discs decreased), whereas it was found to decrease with time for the cases when the initially dry sensors were adopted (i.e., the water content of the ceramic discs increased). The highest measured suction with the wet sensor was about 81.7 kPa at a water content of 26.7%, whereas the lowest measured suction was 5.6 kPa at a water content of 41%. Correspondingly, the highest suction measured with the dry sensor was 5 MPa at a water content of 22.1% and the lowest measured suction was 96 kPa at a water content of 41% (Figure 3a). For the high initial water content conditions (wi = 41%), both the wet and dry sensors reached equilibrium within the first 24 h, indicating a relatively rapid equilibration process. It is worth highlighting that for the wet sensor, a small increase of 2 kPa was recorded after 30 h, probably due to temperature variation. However, the faster response of the wet sensor can be attributed to the tighter contact of the porous stone with the soil, which facilitates faster equilibration. In the case of the medium initial water content (wi = 34–37%), the dry sensors achieved stability first. For both sensors, the equilibrium was achieved at between 24 and 36 h, indicating that the difference in the sensor performance was less pronounced at the medium water content values, and the suction values converged to closer ranges. For a low initial water content (wi = 22–28%), stability was reached after 36–48 h, indicating a longer equilibration process. Also, in this latter case, the dry sensors stabilized faster than the wet sensors, and they exhibited higher stable pressure values (although higher noise is recorded to be about ±106 kPa), making them more efficient at lower moisture contents. As the initial water content decreased, the time required for sensors to stabilize increased. The wet sensors consistently showed lower stable suction values across all moisture levels compared to the dry sensors. The initial condition of the probes was found to influence the recorded suction, since for the same initial water content of the specimen, the measured suction values at equilibrium were different depending on the initial probe conditions. Considering the highest water content of 41.01%, the final suction values differed by 25 kPa (i.e., the suction measured from the wet sensor differed from the dry sensor of 82.8%), while for the lowest water content (i.e., 24.05%), the suction values differed by a greater value (about 5 MPa).
The temperature values recorded by the water potential sensor and the thermocouple during the suction measurements at the different water contents show that the measured temperature fluctuated within ±0.5 °C within a day (Figure 3). During the test, the temperature increased slightly due to the influence of the laboratory’s environmental conditions. Furthermore, temperature fluctuations had a minimal impact on the stability ranges, indicating that the stability ranges were primarily influenced by the initial water content rather than the temperature variations. The temperature measured with the TEROS 21 probes was found to range between 17 and 18.6 °C. In general, in the case of the initially wet sensors, the measured temperature was found to be higher than that measured when adopting the dry probes. However, for the water contents of 22.1%, the temperatures were always lower. The presence of water in the pores of the soil could justify this different thermal response of the probes in the different soil specimens. The comparison between the thermocouple and the TEROS 21 temperature measurements seems to be in good agreement with differences of ±0.25 °C. It is worth noting that the temperature values of the thermocouple were almost always under the temperature values of the sensor at the higher water content of 41% (Figure 3a). On the other hand, the temperature values of the thermocouple were almost always over the temperature values of the sensor at the low water content values, e.g., 22.1% (Figure 3f).
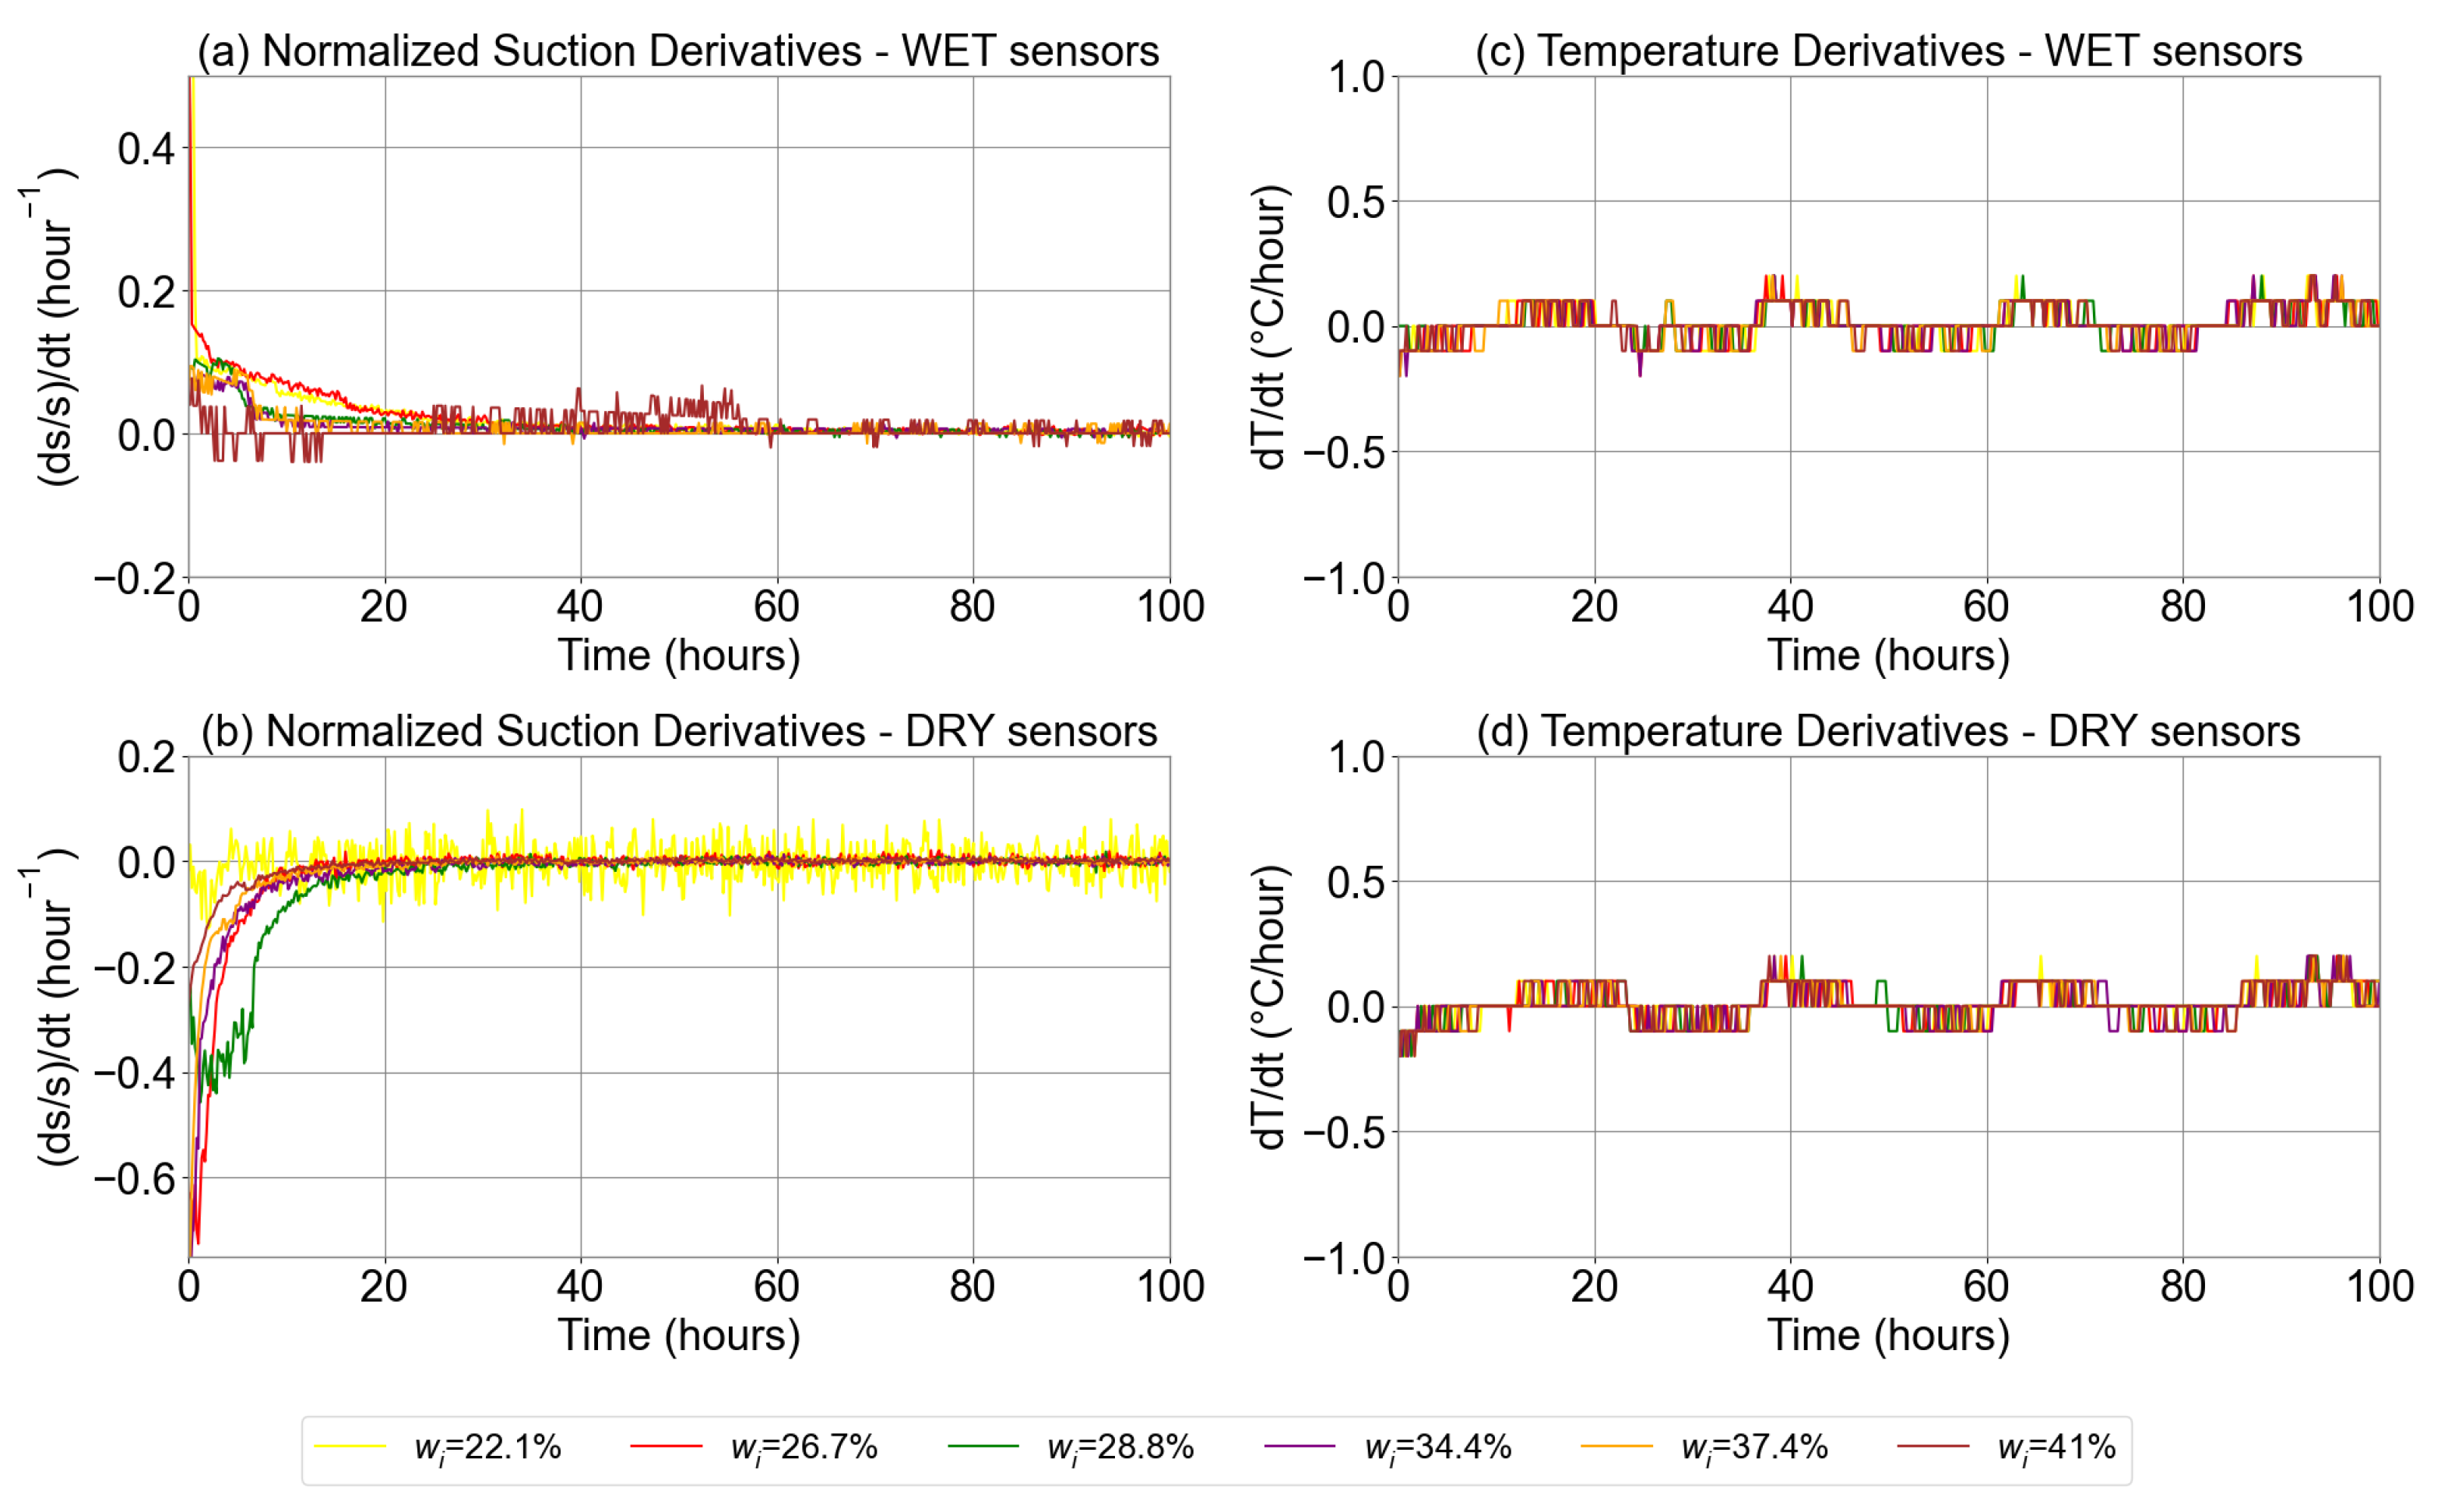
The normalized derivative shown in Figure 4a,b represents the relative rate of change in suction over time. For the initially wet sensors, the initial rates of change were higher, reaching up to 0.5 h−1, indicating a rapid increase in the suction, initially. The rate of change decreased faster for the higher initial water contents, suggesting that the higher water content led to quicker stabilization. For the initially dry sensors, the initial rates of change were lower, down to −0.75 h−1, indicating a decrease in suction, initially. The magnitude of change was larger for the higher water contents, resulting in more significant changes. The stabilization process was more gradual compared to that of the wet sensors, indicating a slower equilibration process. The temperature derivatives in Figure 4c,d show that, for both sensors, the temperature fluctuations ranged between −0.25 °C/h and +0.25 °C/h. For the wet sensors, larger temperature variations were logged for the higher initial water contents in the specimens, indicating a correlation between the water content of the specimen and the temperature changes. For the dry sensors, more pronounced temperature spikes were observed during initial drying, indicating significant thermal responsiveness in the measurement. The temperature fluctuations decreased as the equilibrium was approached, showing a trend toward stabilization.

3.2. Impact of Wet and Dry Sensors on the Soil Water Retention

Figure 5a,b show the test results for both the initially wet and dry sensors of the soil sample at equilibrium in terms of the water content and suction together with the ceramic disc sensors’ water retention curve. Differences between the suction values using the wet and dry sensors can be recognized in all of the water content values tested (Figure 5a). The test results using the sensors with initially dry conditions were found to be higher than the test results using the sensors with initially wet conditions. The suction measurements using the sensors were accompanied by either an increase or a decrease in the water content of the soil depending on whether a wet or dry sensor was used. As a result, the water content values shown in Figure 5a reflect the test conditions rather than the actual water content of the soil specimens. Additionally, while hydraulic equilibrium is reached in terms of hydraulic head, this does not necessarily mean equal water contents in the two porous materials, unless they have similar pore sizes. Therefore, a difference in the water content between the ceramic disc of the sensor and the soil sample is expected at any suction level [7]. Indeed, at the end of each test, additional measurements of the water content for the soil near the ceramic discs were made to investigate the water exchange process between the wet and dry sensors and the soil sample. As a result, after adjusting the water content of the soil specimen, the findings from the dry sensors moved upward, while the data from the wet sensors moved downward, resulting in a reduction in the “hysteresis effect”, as Figure 5b illustrates. However, the analysis revealed a maximum hysteresis gap of 8.2% at 461.5 kPa and a minimum hysteresis gap of 2.1% at 7.7 kPa. It is worth noting that the water contents and suction values of the soil sample and ceramic discs were found to be similar (about w = 35%) at a suction of about 25 kPa.
Figure 5c shows the variation in the water content from the initial samples before the test, and the water content obtained at the end of each test. The results show that, while using a wet sensor, the amount of water in the sample was increased; when using a dry sensor, the amount of soil water in contact with the sensor was found to decrease, as expected. For the wet sensor, the water content ranged from +0.2% to +10%. The most significant changes were observed when water content was less than 28%. In contrast, the dry sensor exhibited water content changes ranging from −0.4% to −6.3%. Larger changes were observed at higher suctions, indicating that the dry sensors were more responsive in conditions with lower suction.

3.3. Test 2: Comparison of Filter Paper and Water Potential Sensor

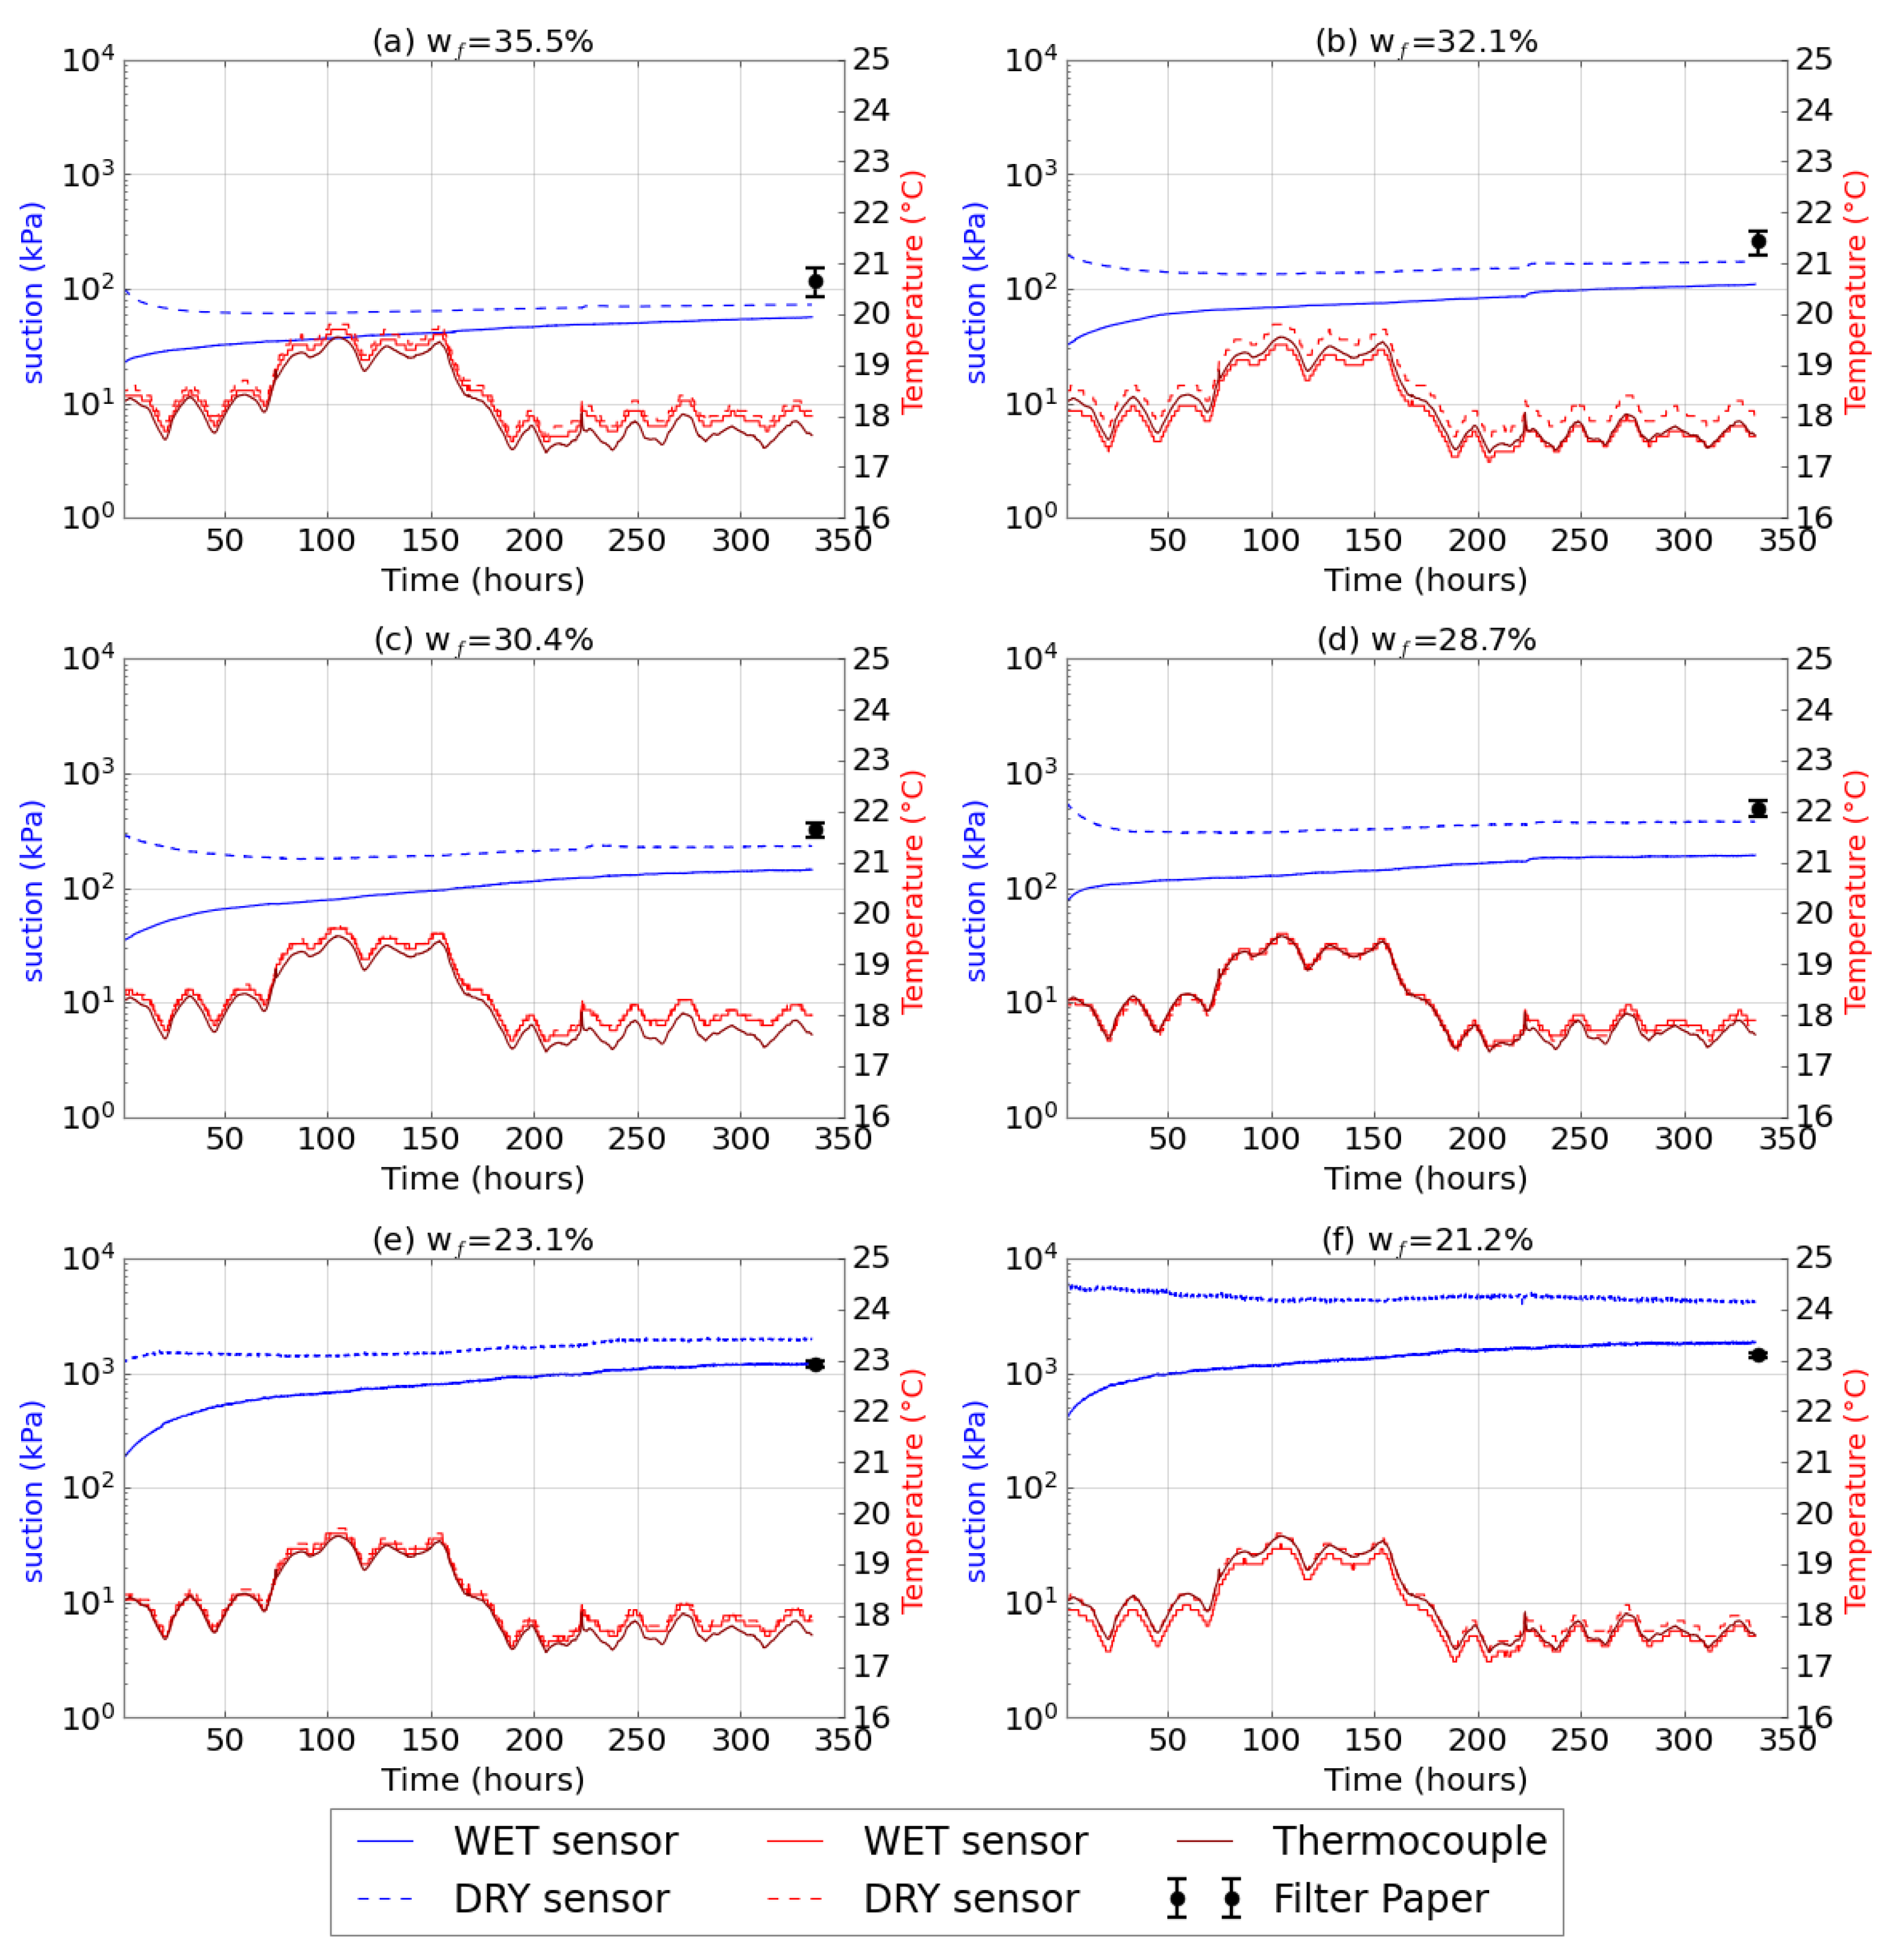
Figure 6 shows data from 14 days of monitoring, in which the sensors (i.e., initially starting from wet and dry condition), starting from the same initial water content in the specimens, at the beginning of the first test, were put together with four filter papers, as already explained in the methodology (Figure 2c). The suction data logged with the sensor have been compared to those monitored by means of the FP method.
The results of the TEROS 21 in terms of suction converged toward the same value, with a difference between 20 kPa and 2 MPa at equilibrium. When the data logged by the TEROS 21 probes are compared with those measured by the FP technique, some differences arise and can be highlighted. The dry sensors demonstrated the closest values to the FP technique at higher water content percentages, specifically when the soil water content was higher than 28%. In this range, the percentage difference from the FP method is approximately 20–25%. However, it is worth mentioning that the calibration curves used for the FP method are typically developed for higher suction ranges, and the sensitivity decreases at lower suctions [28]. As suction increased, with a water content value below 28%, there was a tendency to measure similar suction values, particularly from the wet probe, with similar percentage differences. The latter achieved similar values with a difference between 50 kPa and 200 kPa. Contrarily, the percentage difference from the FP method can reach up to 60–70% in the case of a dry sensor.
It is worth noting that after 14 days, although the suction values tended to converge about the same value, differences persisted, which became more relevant as the suction value rose. This behavior can, once again, be attributed to the hysteretic effect of the sensor, as reflected in the soil specimens, and as already shown in the first test. Furthermore, the effect of temperature on the suction values was evident between 60 and 180 h after the test began, likely due to technical issues encountered in the laboratory.

3.4. Test 3: Comparison of Measurements with Undisturbed Soil Test Result

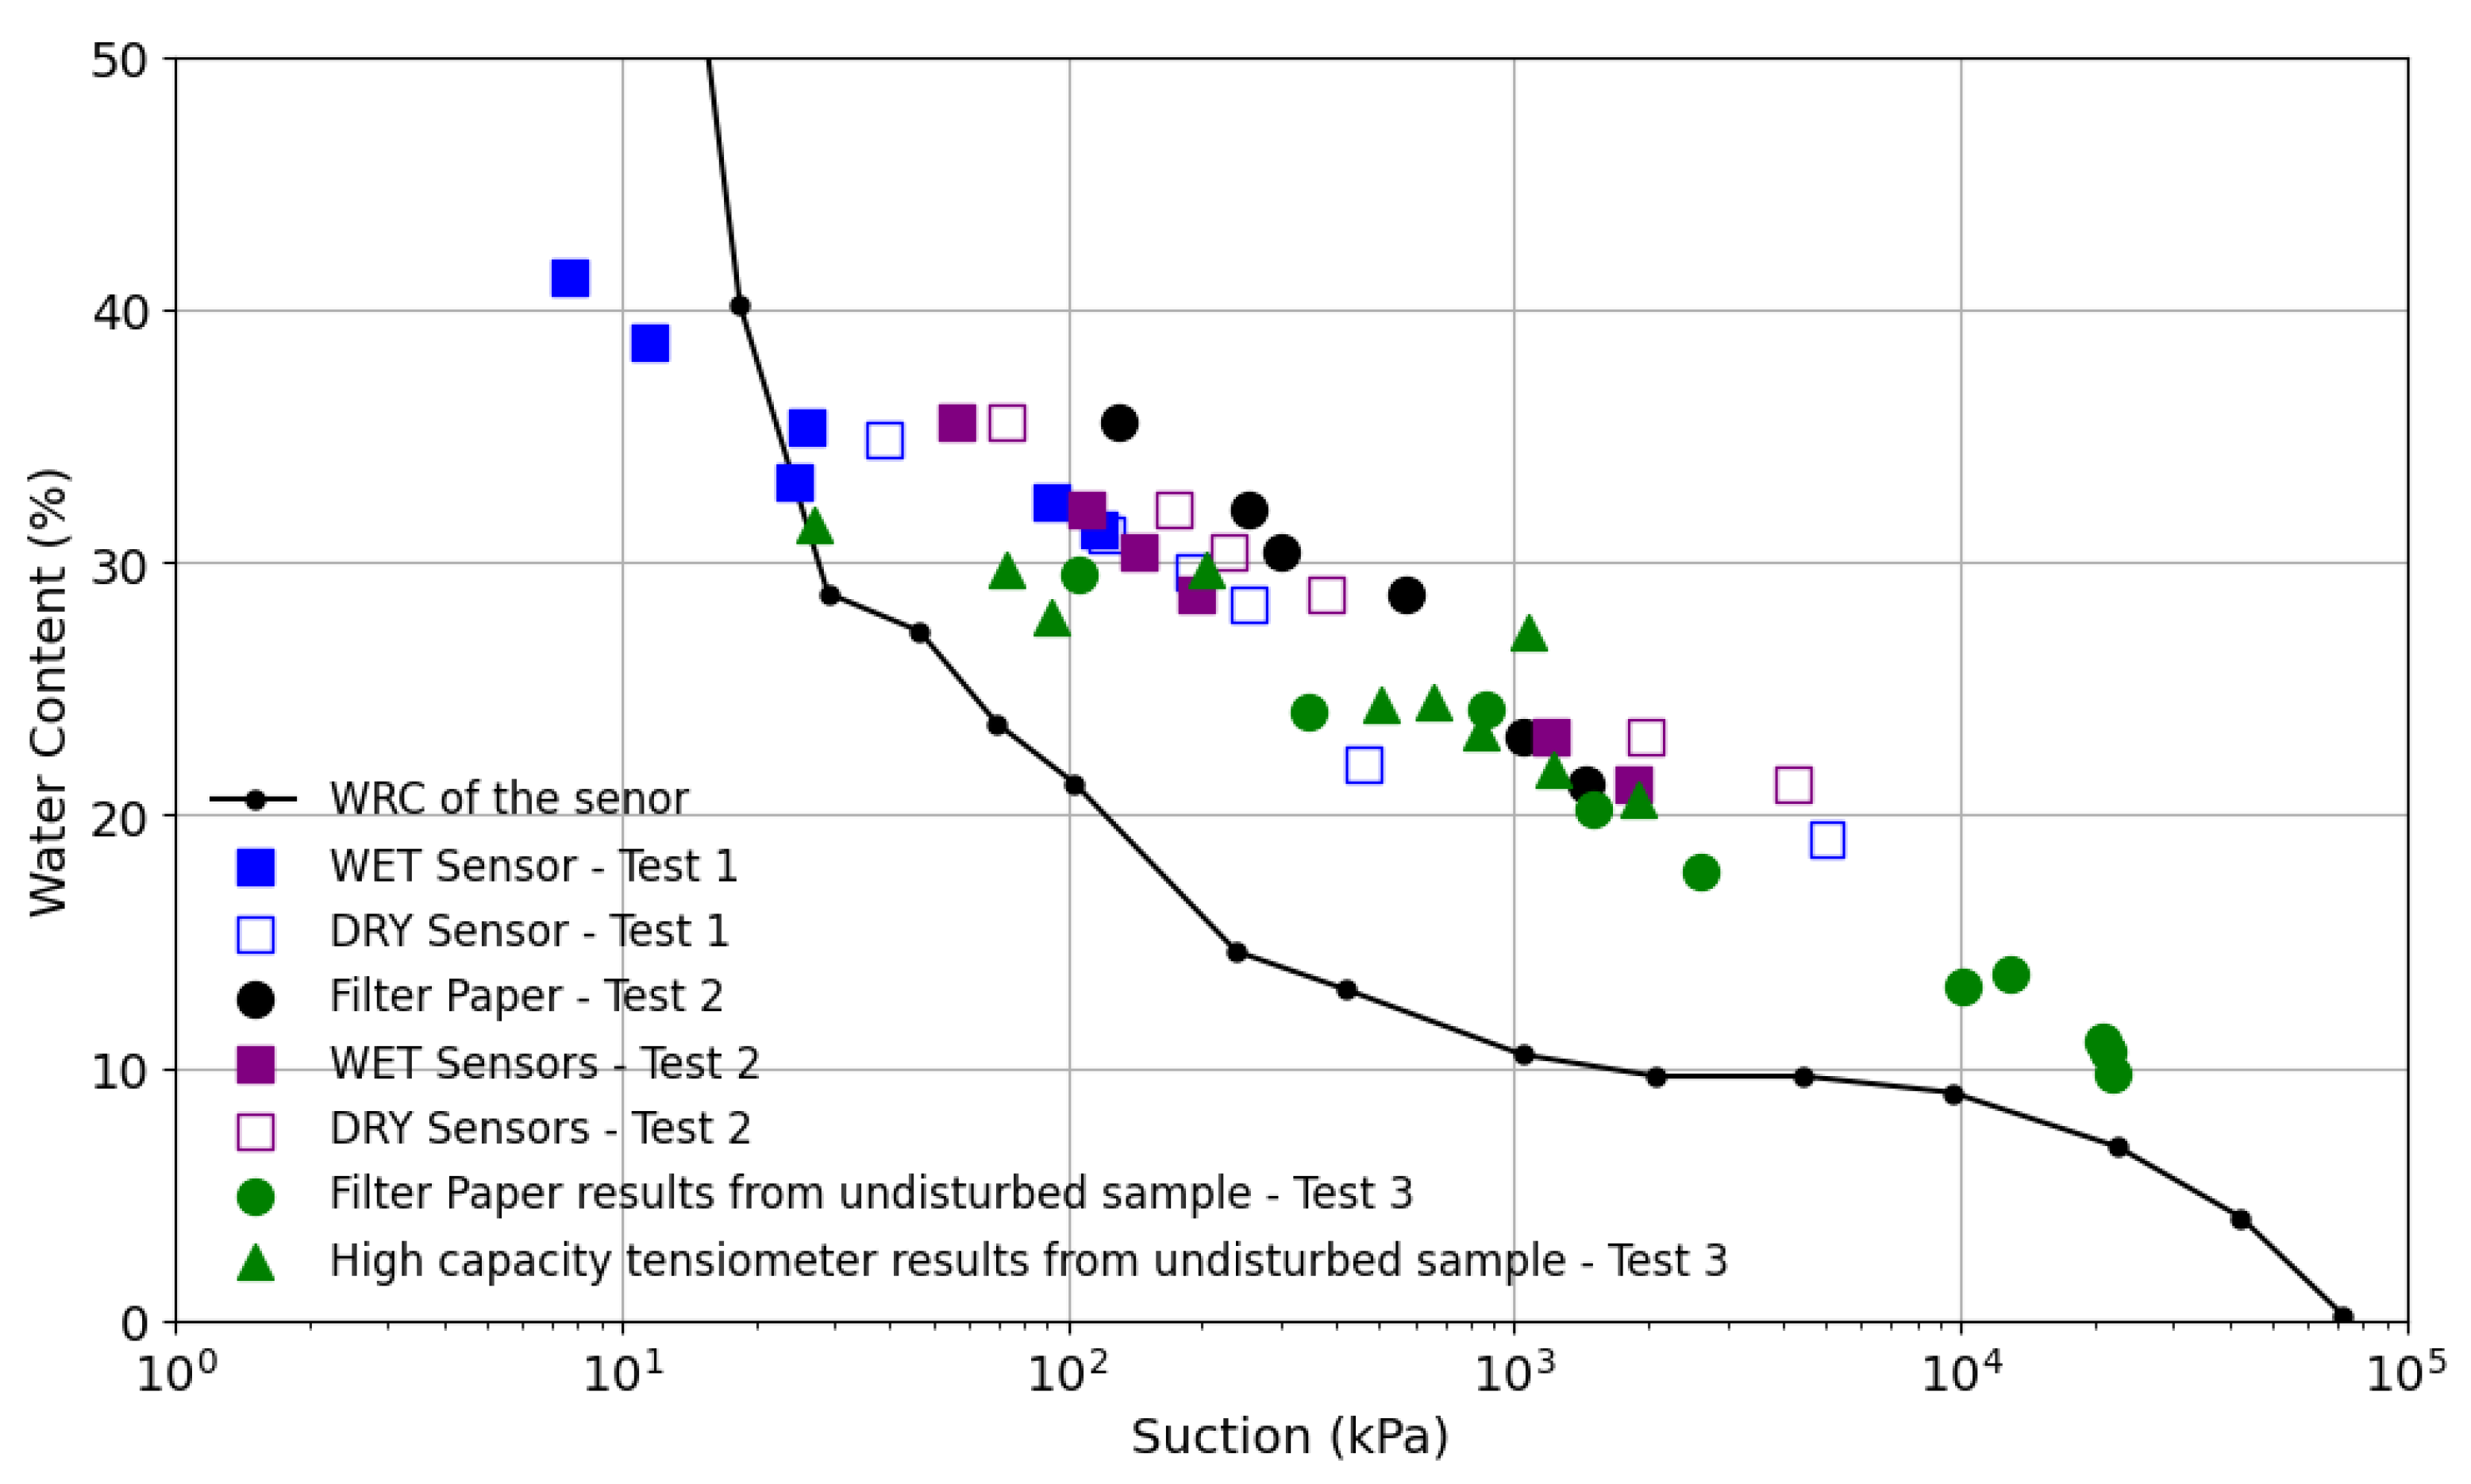
The water content values of the specimens at the end of the first and second tests were compared with the equilibrium suction values obtained from both the wet and dry sensors, as well as the FP. Additionally, retention data from undisturbed samples, determined using the FP method and the HCT, are presented. All collected data are shown in Figure 7, depicting the matric suction as a function of the water content.
At a water content range larger than 25%, in the second test, the suction values obtained from the FP method were only slightly higher than those measured by wet and dry sensors. Conversely, at a lower water content (i.e., <25%), the FP test results were lower than those from the sensors. In agreement with Tripathy et al. [7], when considering the corrected value for the water content of the material in contact with the sensor (as shown in Figure 5), the retention states measured by the wet sensor shifted upward in the water content–suction plot, while for the dry sensor, these shifted downward. This adjustment reduces the discrepancy between the FP and the TEROS 21 probe measurements. Furthermore, the TEROS 21 sensor demonstrated repeatability, as the measurements from test 1 and test 2 were in close agreement, indicating the reliability and consistency of the data.
Comparing the results obtained by means of TEROS 21 for both test 1 and test 2, with the FP and HCT measurements on undisturbed samples, some differences can be observed. All the techniques were found to give reasonably good and consistent measurements for the undisturbed samples for suction values higher than 100 kPa (Figure 7). However, with high water content values, the measurements obtained with the HCT tended to be lower than those obtained from the TEROS 21, i.e., the HCT provided smaller values for suction. This is potentially due to, again, the retention properties of the ceramic discs of the TEROS 21. Specifically, at high water contents, a substantial change in the water content of the discs resulted in only a minor variation in the suction value. Indeed, the WRC of the porous stones became nearly vertical for suction values between 1 and 30 kPa.
When the drying paths were applied to the unsaturated specimens (test 3), it was observed that the water content decreased only slightly, despite a significant increase in the matric suction. This circumstance corresponds to an AEV [5] at a relatively high suction level. When the suction values exceeded 800 kPa, the slope of the retention curve fitting the data increased significantly, aligning well with previously reported values for the same material [26,39]. Following the AEV and the associated ‘volumetric collapse’ [30], the retention curve exhibited high stiffness and minimal shrinkage, eventually transitioning into a constant specific volume stage, during which the degree of saturation continued to decrease [39]. Although the WRC tended toward a residual degree of saturation at very high suction values, the FP measurements were terminated upon reaching a suction of approximately 25 MPa, which can be considered its upper limit [38,45].

4. Discussion

The present study reported and discussed laboratory data of the thermo-hydro-mechanical state of a natural unsaturated clayey soil from the Paola Doce outcropping at Pisciolo (with reference to the soil sample between 0.3 and 1 m depth, which is part of the topsoil), obtained by different monitoring techniques and probes. Suction and temperature measurements were collected to characterize the behavior of the TEROS 21 water potential sensor, comparing its readings with those obtained from more established methods, i.e., the FP technique and HCTs.
During the process of reaching hydraulic equilibrium in both test 1 and test 2, the porous stones of the sensor modified the water content in the sample, as water exchange was established between the stones and the specimen. Water flow from the ceramic discs to the soil sample was activated to achieve hydraulic equilibrium when an initially wet sensor was used to measure the suction of a soil sample with a higher suction than that of the ceramic discs. In this instance, the soil specimen may have undergone a wetting process due to the water lost from the saturated ceramic discs, which were drying. Conversely, water flow from the soil sample to the ceramic discs was activated to achieve hydraulic balance when a dry sensor was used to measure the suction of a soil sample with a lower suction than that of the ceramic discs. Under this scenario, the soil dried while the unsaturated ceramic discs of the sensor were wetted. As already mentioned by Tripathy et al. [7], the hysteretic behavior of the ceramic discs (i.e., differing drying and wetting curves) is not defined, which is reflected in the suction values measured in the soil samples. This has a clear impact on the monitored suction values, depending especially on the initial state of the TEROS 21 probe [7]. This behavior may also be partly related to the size of the specimen, which might have been too small compared to the size of the probe. However, using a larger sample volume could introduce soil heterogeneity and potentially reduce the representativeness of the measurements across different samples [30,39]. The formation of a clear hysteresis loop (Figure 3 and Figure 7) indicates that the sensors exhibited path-dependent behavior, with distinct responses during wetting and drying cycles. This hysteresis effect is crucial for understanding the performance of the sensors, as it highlights the need to consider the “history” of water content changes when interpreting sensor data, particularly for in-situ measurements [33].
The analysis of the data in Figure 3 indicates a non-negligible influence of the initial moisture conditions of the TEROS 21 porous stone (wet or dry) on the measured suction and temperature values. When using the dry TEROS 21, higher suction values were recorded in the soil sample compared to measurements obtained with a wet sensor. Additionally, the initial moisture state of the sensor appears to affect the equilibrium time, as shown in Figure 4. However, it seems that it is not only the initial condition of the sensor that matters but also the water content of the soil specimen to be monitored. Indeed, the closer the moisture conditions of the TEROS 21 and the specimen, the faster the attainment of the hydraulic equilibrium. It is also worth mentioning that the transient hydraulic process that is activated when the sensor is in contact with the soil specimen is also influenced by the interface’s hydraulic condition. The air trapped in the interface can slow down the seepage process required to reach the hydraulic equilibrium, potentially even halting it under certain conditions [7]. Consequently, the logged value obtained by the dry sensor may be affected by a similar troubling issue. In contrast, when adopting wet sensors, this effect is likely less significant, facilitating a more reliable attainment of hydraulic equilibrium.
The values logged by the FP method (Figure 6) are believed to be accurate enough to be used as a benchmark for the evaluation of the accuracy of the TEROS 21 measurements. In this perspective, it can be concluded that for the low water content of the soil specimen (high soil suction), the wet TEROS 21 seems to be more effective in logging accurate suction values, i.e., the wet TEROS 21 measurement is closer to the FP datum. Instead, when measuring the suction for a higher water content in the soil specimens (low soil suction), the dry TEROS 21 appears to yield more accurate readings. However, it is also worth mentioning that the FP method is believed to be less reliable when measuring low suction values. As such, it can be stated that the better accuracy of the dry TEROS 21 at a low suction level may not be validated.
Temperature variations affect suction measurements, influencing the accuracy of suction readings [46]. Additionally, the initial water content affects the temperature response, with a higher water content leading to more significant temperature variations. Temperature stabilization is indicative of approaching equilibrium, suggesting that a stable temperature is a sign of the system nearing equilibrium (Figure 4). The temperature variations during the suction measurements in the second test (Figure 6) further complicated the process, particularly between 60 and 180 h after the test began. These variations are likely linked to the laboratory conditions and the thermal response of the sensors, as observed in the comparison between the thermocouple and the TEROS 21 sensor. The temperature variations correlate with the suction changes, indicating coupled thermal–hydraulic behavior, as previously reported [40,45].
The water retention data presented in this study were obtained using multiple measurement methods, including the TEROS 21 sensor, an HTC, and the FP technique. From the data in Figure 7, a consistent agreement between the suction measured using the FP approach and the suction measured by the water potential sensor can be recognized, especially for a suction range between 300 kPa and 2000 kPa. However, a comparison of the monitored data obtained from these methods demonstrated that, for the tested material, the FP technique recorded higher suction values than the TEROS 21 sensor for water content exceeding 30%. The differences in the test results between the two methods (i.e., TEROS 21 and FP) at a low water content can be attributed to some uncertainties inherent in both techniques. As for the TEROS 21, a potential factor affecting the reliability of the water potential measurements at high suction levels is the steep slope of the WRC of the probe’s porous stones. At a low water content, even a slight change in the water content leads to a substantial variation in the suction values, given that suction is represented on a logarithmic scale. Indeed, the WRC of the porous stones became nearly horizontal for suction values between 1000 and 10,000 kPa. Similarly, the FP technique is also affected by potential sources of error in measuring the suction level. At high water contents, the FP is known to be less effective in measuring low suctions (i.e., <100 kPa) [28]. Moreover, a delay in weighing the FP after the moisture equilibration may lead to moisture changes, thereby reducing the measurement accuracy, as already recognized by Esmaili et al. [47]. Such inaccuracies may reach even some orders of magnitude [47].
Additionally, a slight discrepancy was observed between the suction values obtained using the FP technique in test 2 and those from the undisturbed sample in test 3 (Figure 7). This variation may be attributed to differences in the micro- to mesostructural features of the fissured clay [48], which may have resulted in different void ratios [8,26,48] and, consequently, led to distinct HM responses during drying.
Moreover, according to Walthert and Schleppi [46], incorporating the temperature corrections can further enhance the accuracy of TEROS 21 readings, thereby reducing discrepancies when compared to FP results. This issue is of key relevance, especially when the TEROS 21 is adopted in the field to log weather-induced suction changes, where temperature fluctuations can be relevant [46]. Such improved data, essential for modeling the SVA interactions [39,49,50], should also account somehow for the effect of time equilibrium when coupling data on water content and suction, in order to accurately reconstruct the in-situ SWRC. Both corrections would improve the ability to capture temporal changes in the topsoil properties, offering a more detailed representation of drying and wetting paths and quantifying the hydrological hysteresis affecting the SWRC [51].

5. Conclusions

The experimental study contributes to the assessment of the performance of the TEROS 21 sensor, a capacitance-based water potential sensor, in measuring the soil matric suction and temperature in clayey soils. Laboratory tests were conducted to measure the suction level and temperature of the soil samples with different water contents, the results of which were compared with those obtained using different and more established techniques.
The findings demonstrated that both the suction value and equilibrium time depend on the initial state of the sensor (wet or dry) and the magnitude of the suction to be logged. However, since the measurements carried out involve a specific range of water content of the soil specimens (i.e., from 20% to 40%), further investigation is necessary to assess the sensor’s performance in lower (<20%) and higher (>40%) water content conditions. Although this study did not examine different soil types, the results suggest that the soil type and the meso-structure features are expected to play a relevant role in suction determination.
Despite the issues identified in the use of the TEROS 21 in the laboratory, it is believed that this probe remains a valuable tool for field measurements due to its wide suction range (up to 100,000 kPa), low maintenance requirements, and rapid data acquisition.
The laboratory testing highlighted the increasing scattering in the measurements at higher suction levels, which users should consider when interpreting logged data, particularly for highly retentive soils. Additionally, the use of the TEROS 21 in the field would also mitigate issues related to defining an appropriate soil volume for suction measurements.
Overall, the quantitative findings of this study contribute to a better phenomenological understanding of monitoring data in both laboratory and field settings. These insights are particularly relevant for research on soil–vegetation–atmosphere (SVA) interactions, where transient water and energy exchange processes play a crucial role. Given the influence of the equilibrium time on the coupled water content and suction measurements, it is essential to account for time lags required to reach hydraulic equilibrium and the hysteretic behavior of soil under wetting and drying cycles. This is particularly important when sensors start from different dry or wet configurations, ensuring the accurate interpretation of soil state variables.

Author Contributions

Conceptualization, N.S., V.T. and O.B.; methodology, N.S.; software, N.S.; validation, N.S., V.T., O.B. and F.C.; formal analysis, N.S.; investigation, N.S. and V.T.; resources, N.S.; data curation, N.S.; writing—original draft preparation, N.S.; writing—review and editing, N.S., V.T., O.B. and F.C.; visualization, N.S.; supervision, V.T., O.B. and F.C.; project administration, F.C.; funding acquisition, F.C. All authors have read and agreed to the published version of the manuscript.

Funding

This research was funded by the MIUR PON R&I 2014–2020 program (project MITIGO, ARS01_00964), and project PNRR, MISURA M4_C2_1.4, National Centre for HPC, Big Data and Quantum Computing (CN_00000013 CUP: D93C22000430001)—Spoke 5 “Environment and Natural Disasters”.

Institutional Review Board Statement

Not applicable.

Informed Consent Statement

Not applicable.

Data Availability Statement

The original contributions presented in this study are included in the article. Further inquiries can be directed to the corresponding author.

Acknowledgments

The authors would like to express their gratitude to Benedetta Cesari, who contributed to the research activities presented in this paper.

Conflicts of Interest

The authors declare no conflicts of interest.

References

  1. Cotecchia, F.; Tagarelli, V.; Pedone, G.; Ruggieri, G.; Guglielmi, S.; Santaloia, F. Analysis of climate-driven processes in clayey slopes for the early-warning system design. Proc. Inst. Civ. Eng.-Geotech. Eng. 2019, 172, 463–4641. [Google Scholar] [CrossRef]
  2. Tagarelli, V.; Cotecchia, F. Deep movements in clayey slopes relating to climate: Modeling for early warning system design. In Geotechnical Research for Land Protection and Development: Proceedings of CNRIG 2019 7, Lecco, Italy, 3–5 July 2019; Springer International Publishing: Berlin/Heidelberg, Germany, 2020; pp. 205–214. [Google Scholar]
  3. Dippenaar, M.A.; van Rooy, J.L.; Diamond, R.E. Engineering, hydrogeological, and vadose zone hydrological aspects of Proterozoic dolomites (South Africa). J. Afr. Earth Sci. 2018, 147, 24–352. [Google Scholar] [CrossRef]
  4. Elia, G.; Cotecchia, F.; Pedone, G.; Vaunat, J.; Vardon, P.J.; Pereira, C.; Springman, S.M.; Rouainia, M.; Van Esch, J.; Koda, E.; et al. Numerical modelling of slope–vegetation–atmosphere interaction: An overview. Q. J. Eng. Geol. Hydrogeol. 2017, 50, 249–270. [Google Scholar] [CrossRef]
  5. Fredlund, D.G.; Rahardjo, H.; Fredlund, M.D. Unsaturated Soil Mechanics in Engineering Practice; John Wiley & Sons: Hoboken, NJ, USA, 2012. [Google Scholar]
  6. Lu, N.; Godt, J.W. Hillslope Hydrology and Stability; Cambridge University Press: Cambridge, UK, 2013. [Google Scholar]
  7. Tripathy, S.; Al-Khyat, S.; Cleall, P.J.; Baille, W.; Schanz, T. Soil suction measurement of unsaturated soils with a sensor using fixed-matrix porous ceramic discs. Indian Geotech. J. 2016, 46, 252–260. [Google Scholar] [CrossRef]
  8. Tripathy, S.; Tadza, M.Y.M.; Thomas, H.R. Soil-water characteristic curves of clays. Can. Geotech. J. 2014, 51, 869–883. [Google Scholar] [CrossRef]
  9. Zhu, Q.; Liao, K.; Xu, Y.; Yang, G.; Wu, S.; Zhou, S. Monitoring and prediction of soil moisture spatial–temporal variations from a hydropedological perspective: A review. Soil Res. 2012, 50, 625–637. [Google Scholar] [CrossRef]
  10. Lu, N.; Godt, J.W. Infinite slope stability under steady unsaturated seepage conditions. Water Resour. Res. 2008, 44, W114049. [Google Scholar] [CrossRef]
  11. Campbell, R.H. Soil Slips, Debris Flows, and Rainstorms in the Santa Monica Mountains and Vicinity, Southern California; US Government Printing Office: Washington, DC, USA, 1975; Volume 851. [Google Scholar]
  12. Montrasio, L.; Valentino, R. A model for triggering mechanisms of shallow landslides. Nat. Hazards Earth Syst. Sci. 2008, 8, 1149–1159. [Google Scholar] [CrossRef]
  13. Cuomo, S.; Della Sala, M. Rainfall-induced infiltration, runoff, and failure in steep unsaturated shallow soil deposits. Eng. Geol. 2013, 162, 118–127. [Google Scholar] [CrossRef]
  14. Fredlund, D.G.; Sheng, D.; Zhao, J. Estimation of soil suction from the soil-water characteristic curve. Can. Geotech. J. 2011, 48, 186–198. [Google Scholar] [CrossRef]
  15. Likos, W.J.; Jaafar, R. Pore-scale model for water retention and fluid partitioning of partially saturated granular soil. J. Geotech. Geoenvironmental Eng. 2013, 139, 724–737. [Google Scholar] [CrossRef]
  16. Fredlund, D.G. Unsaturated soil mechanics in engineering practice. J. Geotech. Geoenvironmental Eng. 2006, 132, 286–321. [Google Scholar] [CrossRef]
  17. Wheeler, S.J.; Sharma, R.S.; Buisson, M.S.R. Coupling of hydraulic hysteresis and stress–strain behaviour in unsaturated soils. Géotechnique 2003, 53, 41–54. [Google Scholar] [CrossRef]
  18. Seyfried, M.S.; Grant, L.E. Temperature effects on soil dielectric properties measured at 50 MHz. Vadose Zone J. 2007, 6, 759–765. [Google Scholar] [CrossRef]
  19. Schwank, M.; Green, T.R.; Mätzler, C.; Benedickter, H.; Fluhler, H. Laboratory characterization of a commercial capacitance sensor for estimating permittivity and inferring soil water content. Vadose Zone J. 2006, 5, 1048–1064. [Google Scholar] [CrossRef]
  20. Bottiglieri, O.; Cafaro, F.; Cotecchia, F. Two-Scale Investigation of the Retention Behavior of a Well-Graded Mixed Soil. Geosciences 2021, 11, 431. [Google Scholar] [CrossRef]
  21. Oorthuis, R.; Hürlimann, M.; Fraccica, A.; Lloret, A.; Moya, J.; Puig-Polo, C.; Vaunat, J. Monitoring of a full-scale embankment experiment regarding soil–vegetation–atmosphere interactions. Water 2018, 10, 688. [Google Scholar] [CrossRef]
  22. Najdi, A.; Encalada, D.; Mendes, J.; Prat, P.C.; Ledesma, A. Evaluating innovative direct and indirect soil suction and volumetric measurement techniques for the determination of soil water retention curves following drying and wetting paths. Eng. Geol. 2023, 322, 107179. [Google Scholar] [CrossRef]
  23. Zeng, H.; Tang, C.S.; Cui, Y.J.; Najdi, A. Compressive stress induced by desiccation shrinkage in clayey soils. Appl. Clay Sci. 2025, 267, 107729. [Google Scholar] [CrossRef]
  24. Toll, D.G.; Lourenço, S.D.N.; Mendes, J. Advances in suction measurements using high suction tensiometers. Eng. Geol. 2013, 165, 29–37. [Google Scholar] [CrossRef]
  25. Ridley, A.M.; Burland, J.B. A new instrument for the measurement of soil moisture suction. Géotechnique 1993, 43, 321–324. [Google Scholar] [CrossRef]
  26. Tagarelli, V.; Stasi, N.; Cotecchia, F.; Cafaro, F. Root-induced changes in the hydraulic properties of a fine slope cover. In E3S Web of Conferences; EDP Sciences: Ulys, France, 2024; Volume 544, p. 16002. [Google Scholar]
  27. Tagarelli, V.; Stasi, N.; Cotecchia, F. Numerical back-analysis of in-situ constant head tests in partially saturated soil cover to determine the permeability function. In Proceedings of the National Conference of the Researchers of Geotechnical Engineering, Palermo, Italy, 5–7 July 2023; Springer Nature: Cham, Switzerland, 2023. [Google Scholar]
  28. Pedone, G.; Cotecchia, F.; Tagarelli, V.; Bottiglieri, O.; Murthy, M.B. An investigation into the water retention behaviour of an unsaturated natural fissured clay. Appl. Sci. 2022, 12, 9533. [Google Scholar] [CrossRef]
  29. Esu, F. Behaviour of slopes in structurally complex formations. In Proceedings of the Symposium on the Geotechnics of Structurally Complex Formations, Capri, Italy, 19–21 September 1977; pp. 19–21. [Google Scholar]
  30. Cafaro, F.; Cotecchia, F.; Cherubini, C. Influence of structure and stress history on the drying behaviour of clays. In Unsaturated Soils for Asia: Proceedings of the Asian Conference on Unsaturated Soils UNSAT-ASIA 2000, Singapore, 18–19 May 2000; Rahardjo, H., Toll, D.G., Leong, E.C., Eds.; A.A. Balkema: Rotterdam, The Netherlands, 2000; pp. 633–638. [Google Scholar]
  31. Jackisch, C.; Germer, K.; Graeff, T.; Andrä, I.; Schulz, K.; Schiedung, M.; Haller-Jans, J.; Schneider, J.; Jaquemotte, J.; Helmer, P.; et al. Soil moisture and matric potential–An open field comparison of sensor systems. Earth Syst. Sci. Data 2020, 12, 683–697. [Google Scholar] [CrossRef]
  32. Cai, G.; Ahmed, M.A.; Abdalla, M.; Carminati, A. Root hydraulic phenotypes impacting water uptake in drying soils. Plant Cell Environ. 2022, 45, 650–663. [Google Scholar] [CrossRef]
  33. Tagarelli, V.; Cotecchia, F. Preliminary field data of selected deep-rooted vegetation effects on the slope-vegetation-atmosphere interaction: Results from an in-situ test. Riv. Ital. Geotec. 2022, 56, 62–83. [Google Scholar]
  34. Oorthuis, R.; Vaunat, J.; Hürlimann, M.; Lloret, A.; Moya, J.; Puig-Polo, C.; Fraccica, A. Effect of vegetation and slope orientation on water infiltration in a monitored embankment. In Proceedings of the EGU General Assembly Conference Abstracts, Online, 19–30 April 2021; p. EGU21-7599. [Google Scholar]
  35. Menne, D.; Hübner, C.; Trebbels, D.; Willenbacher, N. Robust soil water potential sensor to optimize irrigation in agriculture. Sensors 2022, 22, 4465. [Google Scholar] [CrossRef]
  36. Chandler, R.J.; Gutierrez, C.I. The filter paper method of suction measurements. Géotechnique 1986, 36, 265–268. [Google Scholar] [CrossRef]
  37. Miguel, M.G.; Vilar, O.M. Study of the water retention properties of a tropical soil. Can. Geotech. J. 2009, 46, 1084–1092. [Google Scholar] [CrossRef]
  38. Marinho, F.A.M.; da Silva Gomes, J.E. The effect of contact on the filter paper method for measuring soil suction. Geotech. Test. J. 2011, 35, 172–181. [Google Scholar] [CrossRef]
  39. Stasi, N.; Tagarelli, V.; Cafaro, F.; Cotecchia, F. On the Wildfire-Induced changes in the properties of a vegetated clayey slope cover. In Proceedings of the 7th International Conference on Geotechnical and Geophysical Site Characterization (ISC ‘24), Barcelona, Spain, 18–21 June 2024. [Google Scholar] [CrossRef]
  40. Associazione Geotecnica Italiana (AGI). Raccomandazioni Sulle Prove Geotecniche di Laboratorio; Associazione Geotecnica Italiana: Roma, Italy, 1994. [Google Scholar]
  41. METER Group AG. TEROS 21 Soil Water Potential Sensor. 2025. Available online: https://metergroup.com/products/teros-21/ (accessed on 10 January 2025).
  42. Karagoly, Y.; Tripathy, S.; Cleall, P.J.; Mahdi, T. Suction measurements by a fixed-matrix porous ceramic disc sensor. In Proceedings of the 7th International Conference on Unsaturated Soils, Hong Kong, China, 3–5 August 2018. [Google Scholar]
  43. Decagon Devices. Operator’s Manual for MPS-2 & MPS-6 Dielectric Water Potential Sensor; Decagon Devices: Pullman, WA, USA, 2014. [Google Scholar]
  44. ASTM D2216-19; Standard Test Methods for Laboratory Determination of Water (Moisture) Content of Soil and Rock by Mass. American Society for Testing and Materials: West Conshohocken, PA, USA, 2019.
  45. Leong, E.C.; He, L.; Rahardjo, H. Factors affecting the filter paper method for total and matric suction measurements. Geotech. Test. J. 2002, 25, 322–333. [Google Scholar] [CrossRef]
  46. Walthert, L.; Schleppi, P. Equations to compensate for the temperature effect on readings from dielectric Decagon MPS-2 and MPS-6 water potential sensors in soils. J. Plant Nutr. Soil Sci. 2018, 181, 749–759. [Google Scholar] [CrossRef]
  47. Esmaili, D.; Hatami, K. Comparative study of measured suction in fine-grained soil using different in-situ and laboratory techniques. Int. J. Geosynth. Ground Eng. 2017, 3, 1–9. [Google Scholar] [CrossRef]
  48. Vitone, C.; Guglielmi, S.; Pedone, G.; Cotecchia, F. Effects of micro-to meso-features on the permeability of fissured clays. Géotech. Lett. 2019, 9, 369–376. [Google Scholar] [CrossRef]
  49. Badakhshan, E.; Vaunat, J.; Veylon, G. Meteorological and vegetation effects on the thermal analysis of slopes. Renew. Sustain. Energy Rev. 2024, 196, 114352. [Google Scholar] [CrossRef]
  50. Cotecchia, F.; Lollino, P.; Petti, R. Efficacy of drainage trenches to stabilise deep slow landslides in clay slopes. Géotech. Lett. 2016, 6, 1–6. [Google Scholar] [CrossRef]
  51. Bordoni, M.; Bittelli, M.; Valentino, R.; Chersich, S.; Meisina, C. Improving the estimation of complete field soil water characteristic curves through field monitoring data. J. Hydrol. 2017, 552, 283–305. [Google Scholar] [CrossRef]
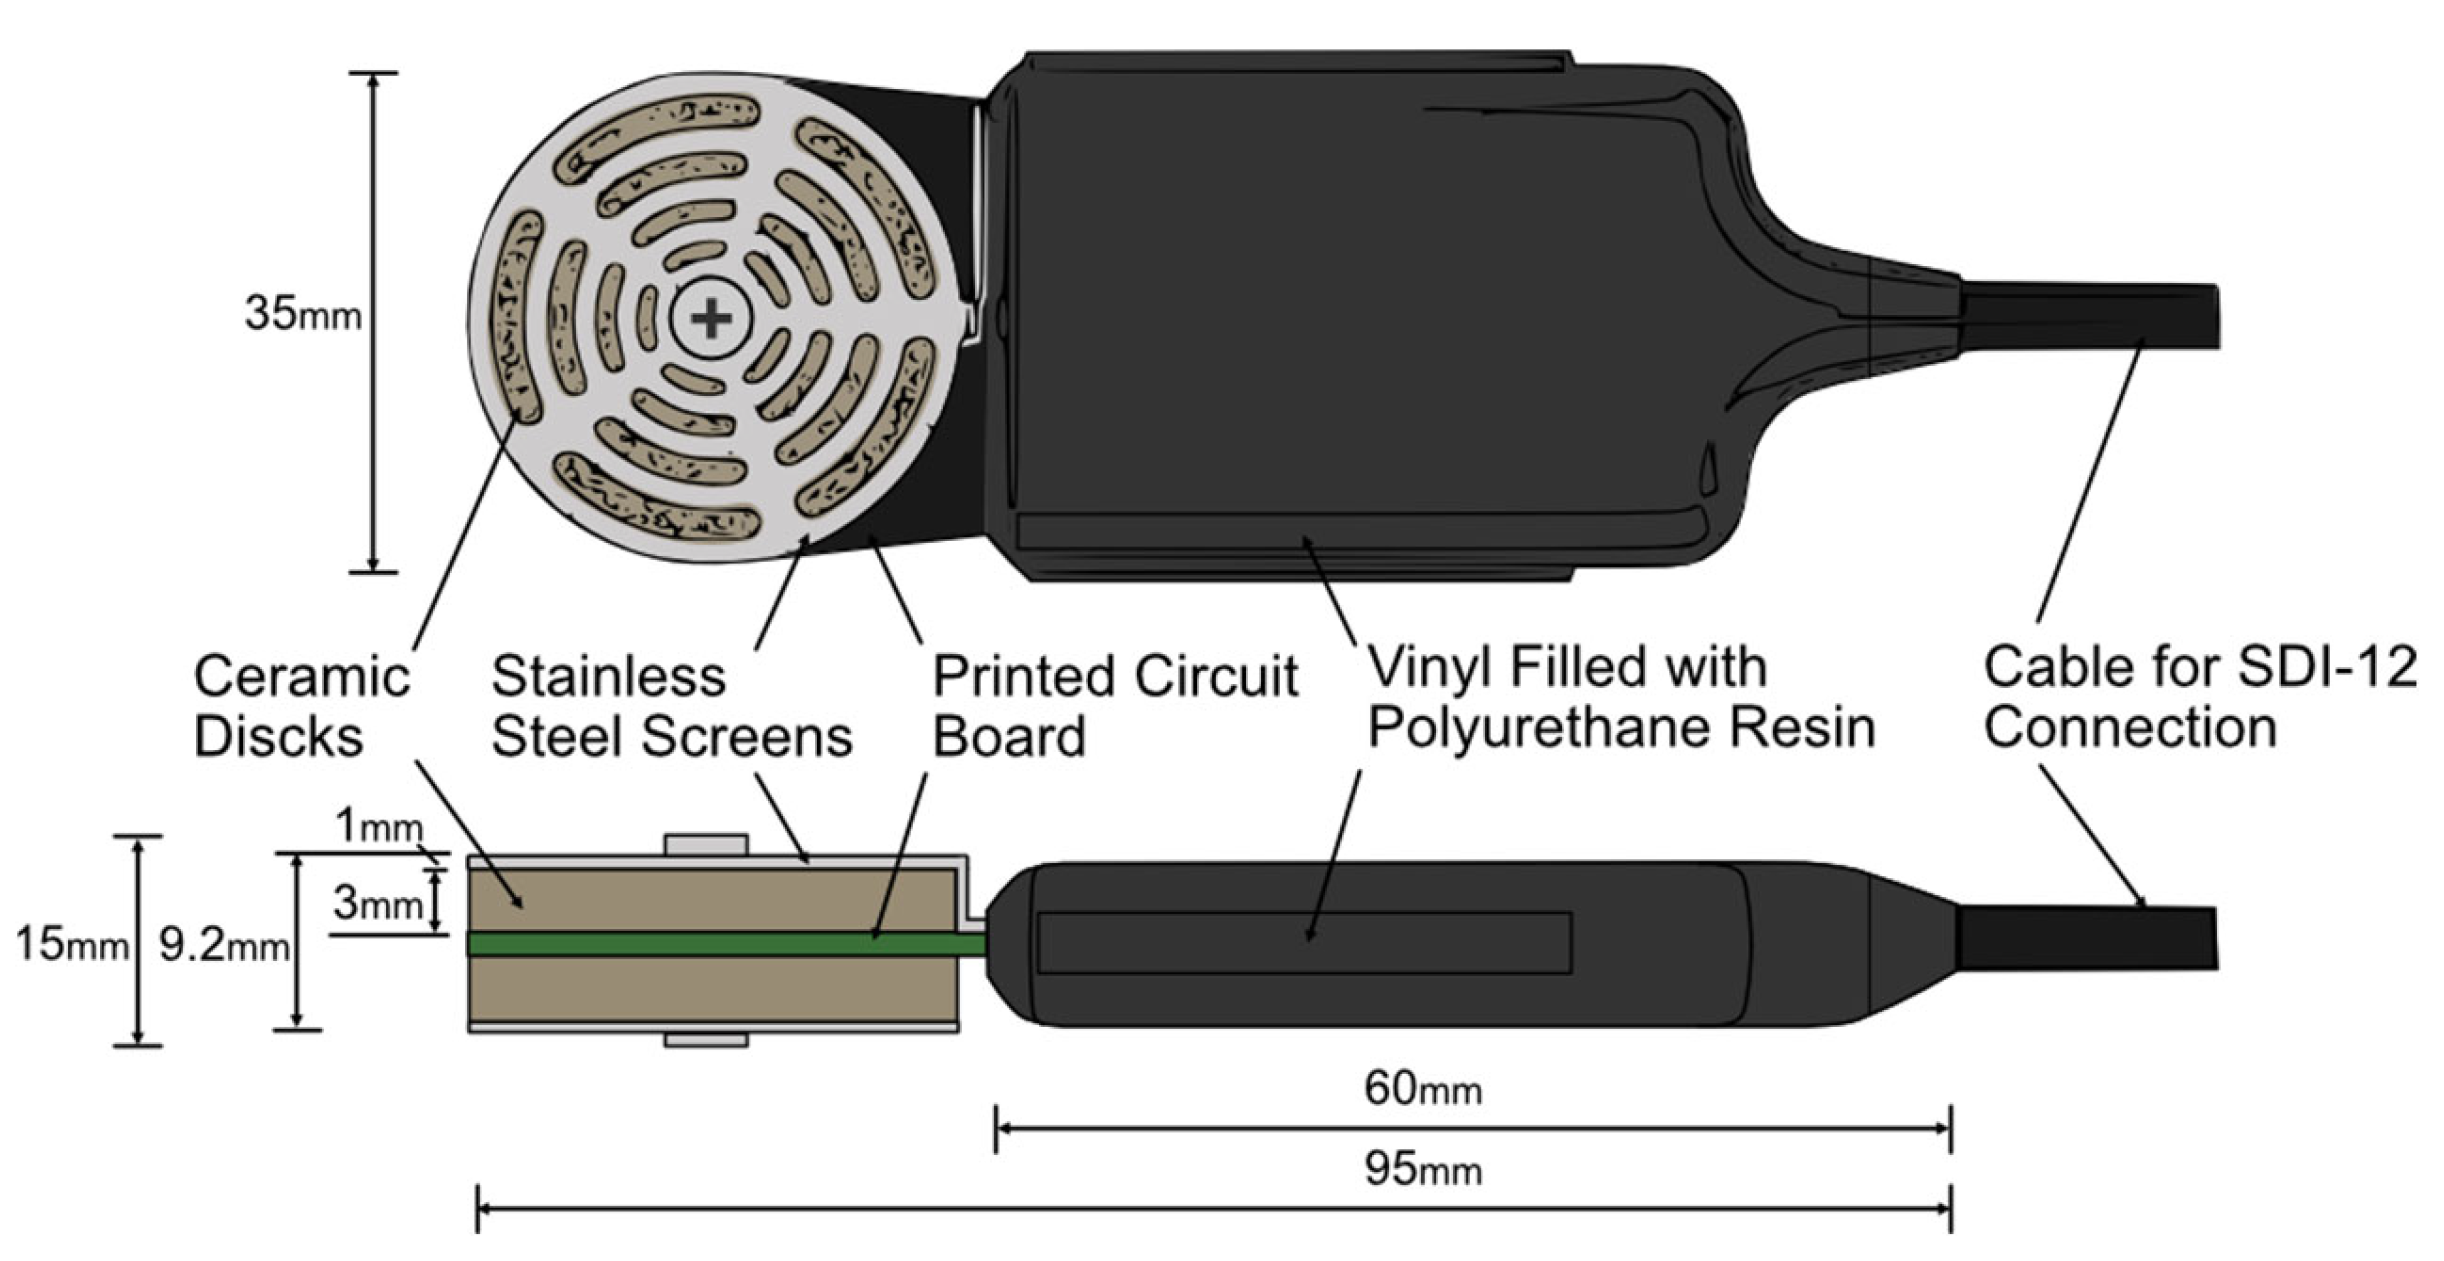
Figure 1. Schematic view of the TEROS 21 water potential sensor. Top plan view; bottom cross-section view.
Applsci 15 03021 g001
Figure 2. (a) Sensor inserts in the soil sample (test 1); (b) soil samples at the same initial water content put together at the end of the equilibrium time with (c) four filter papers attached to soil samples (test 2).
Applsci 15 03021 g002
Figure 3. Suction measurements over time for all the specimens with six initial water content values adopting both initially wet and dry sensors. The plots also report the temperature values over time, as logged by both the water potential sensors and the thermocouple.
Applsci 15 03021 g003
Figure 4. Normalized suction derivatives (a,b) and temperature derivatives (c,d) for both wet and dry sensors, respectively.
Applsci 15 03021 g004
Figure 5. Water content versus suction plots of (a) the soil studied with wet and dry sensors along with the WRC of the sensors at equilibrium. (b) Water content versus suction plots results for both wet and dry sensors of the soil sample at equilibrium after re-measuring the water content. (c) Water exchange between the sensor and the soil samples.
Applsci 15 03021 g005
Figure 6. Measured suction and temperature over time for the soil samples in test 2.
Applsci 15 03021 g006
Figure 7. Comparison of the water retention data determined by means of filter paper technique and the ICL high-capacity tensiometers together with the water content–suction result obtained from the experiments.
Applsci 15 03021 g007
Disclaimer/Publisher’s Note: The statements, opinions and data contained in all publications are solely those of the individual author(s) and contributor(s) and not of MDPI and/or the editor(s). MDPI and/or the editor(s) disclaim responsibility for any injury to people or property resulting from any ideas, methods, instructions or products referred to in the content.