1. Introduction
With the rapid advancement of technologies like autonomous driving, 3D reconstruction, and virtual reality, the utilization of 3D point cloud data has become more prevalent [
1]. Nonetheless, the acquisition of point cloud data can be hindered by challenges such as object occlusion and reflective surfaces, leading to sparse and incomplete datasets. This lack of completeness poses difficulties in accurately capturing both geometric and semantic details, which in turn severely impacts downstream tasks like point cloud classification, semantic segmentation, and object detection [
2]. In the context of autonomous driving, precise 3D scene comprehension is vital, and any loss of data could potentially introduce safety risks. Consequently, researching effective methods for completing point cloud data collected from real-world 3D environments holds significant importance [
3].
Traditional point cloud completion techniques predominantly focus on geometric properties and model-driven completion strategies. These methods typically involve extracting geometric features from the incomplete point cloud’s boundaries and employing techniques like surface reconstruction, interpolation, and smoothing to restore missing structures, especially in geometrically sensitive areas. Pauly et al. [
4] addressed the completion of incomplete point clouds by identifying potential symmetry patterns within the input data and applying these patterns to guide the reconstruction. Similarly, Speciale et al. [
5] leveraged symmetry priors for completion, utilizing the inherent symmetry in the data model. Another approach, template matching, involves comparing partial inputs with a database of template models to complete the shape. Li et al. [
6] introduced a database model matching-based approach for point cloud completion. While this method benefits from using a large array of sample data and diverse databases for shape restoration, it suffers from challenges such as the complexity of building databases and limited sample diversity. These traditional methods are constrained by their heavy reliance on prior knowledge and limited accuracy, making them less applicable for point cloud completion in real-world 3D settings.
In recent years, following the success of PointNet [
7] and PointNet++ [
8] in enabling segmentation and classification tasks through deep learning models directly applied to point cloud data, the use of deep learning for point cloud processing has gained significant attention. In point cloud completion tasks, deep learning models are employed to learn the features and distributions of large-scale point cloud datasets to facilitate data completion. Qi et al. [
7,
8] introduced a pioneering deep learning model capable of directly handling point cloud data, allowing unstructured point cloud data to be processed within deep learning frameworks. This advancement addressed the challenges posed by the irregular and unordered nature of input point cloud data, which had previously hindered effective processing.
Achlioptas et al. [
9] proposed the innovative LGAN-AE network, which incorporates a generative adversarial network (GAN) module into an autoencoder. While this approach improves point cloud completion, it still struggles with generating detailed local features of the point cloud. Guo et al. [
10] introduced the PCT network, which refines the attention mechanism and adapts the Transformer architecture for more effective point cloud data processing. Wang et al. [
11] employed a lightweight DGCNN for feature extraction, integrating a Transformer encoder for both feature extraction and completion. However, the use of a fixed convolution kernel to extract local edge features limits the model’s ability to dynamically adjust to the complex geometric structures inherent in incomplete point clouds.
YUAN et al. [
12] proposed the PCN, which predicts and generates point cloud data through encoding–decoding operations. However, this method only considers the global features of the point cloud and uses fixed convolution, which cannot adapt to multi-scale geometric structures. As a result, it neglects the local detail features of incomplete point clouds, leading to poor performance in local detail completion. To address the issue of dynamic feature fusion in existing Transformer-based point cloud completion models such as PoinTr [
13] and AdaPoinTr [
14], it is important to note that these models rely on fixed domain partitioning, which prevents them from adaptively adjusting local aggregation weights. This limitation leads to significant deviations in results for certain categories. For instance, on the KITTI dataset, the lack of consideration for occlusion patterns results in large FD errors. Additionally, methods such as autoencoders [
15] and 3D point capsule networks [
16] tend to focus heavily on global features, neglecting the local geometric information of the incomplete point cloud. As a result, the generated point cloud often captures only common features of a particular object type, failing to account for the distinctive features of individual objects.
Huang et al. [
17] proposed the PF-Net, a point fractal network designed to effectively capture local features through a multi-scale feature extraction module. This network predicts the missing parts of the point cloud from coarse to fine resolution. However, its reliance on dense point cloud up-sampling to gather more local information significantly increases computational demands.
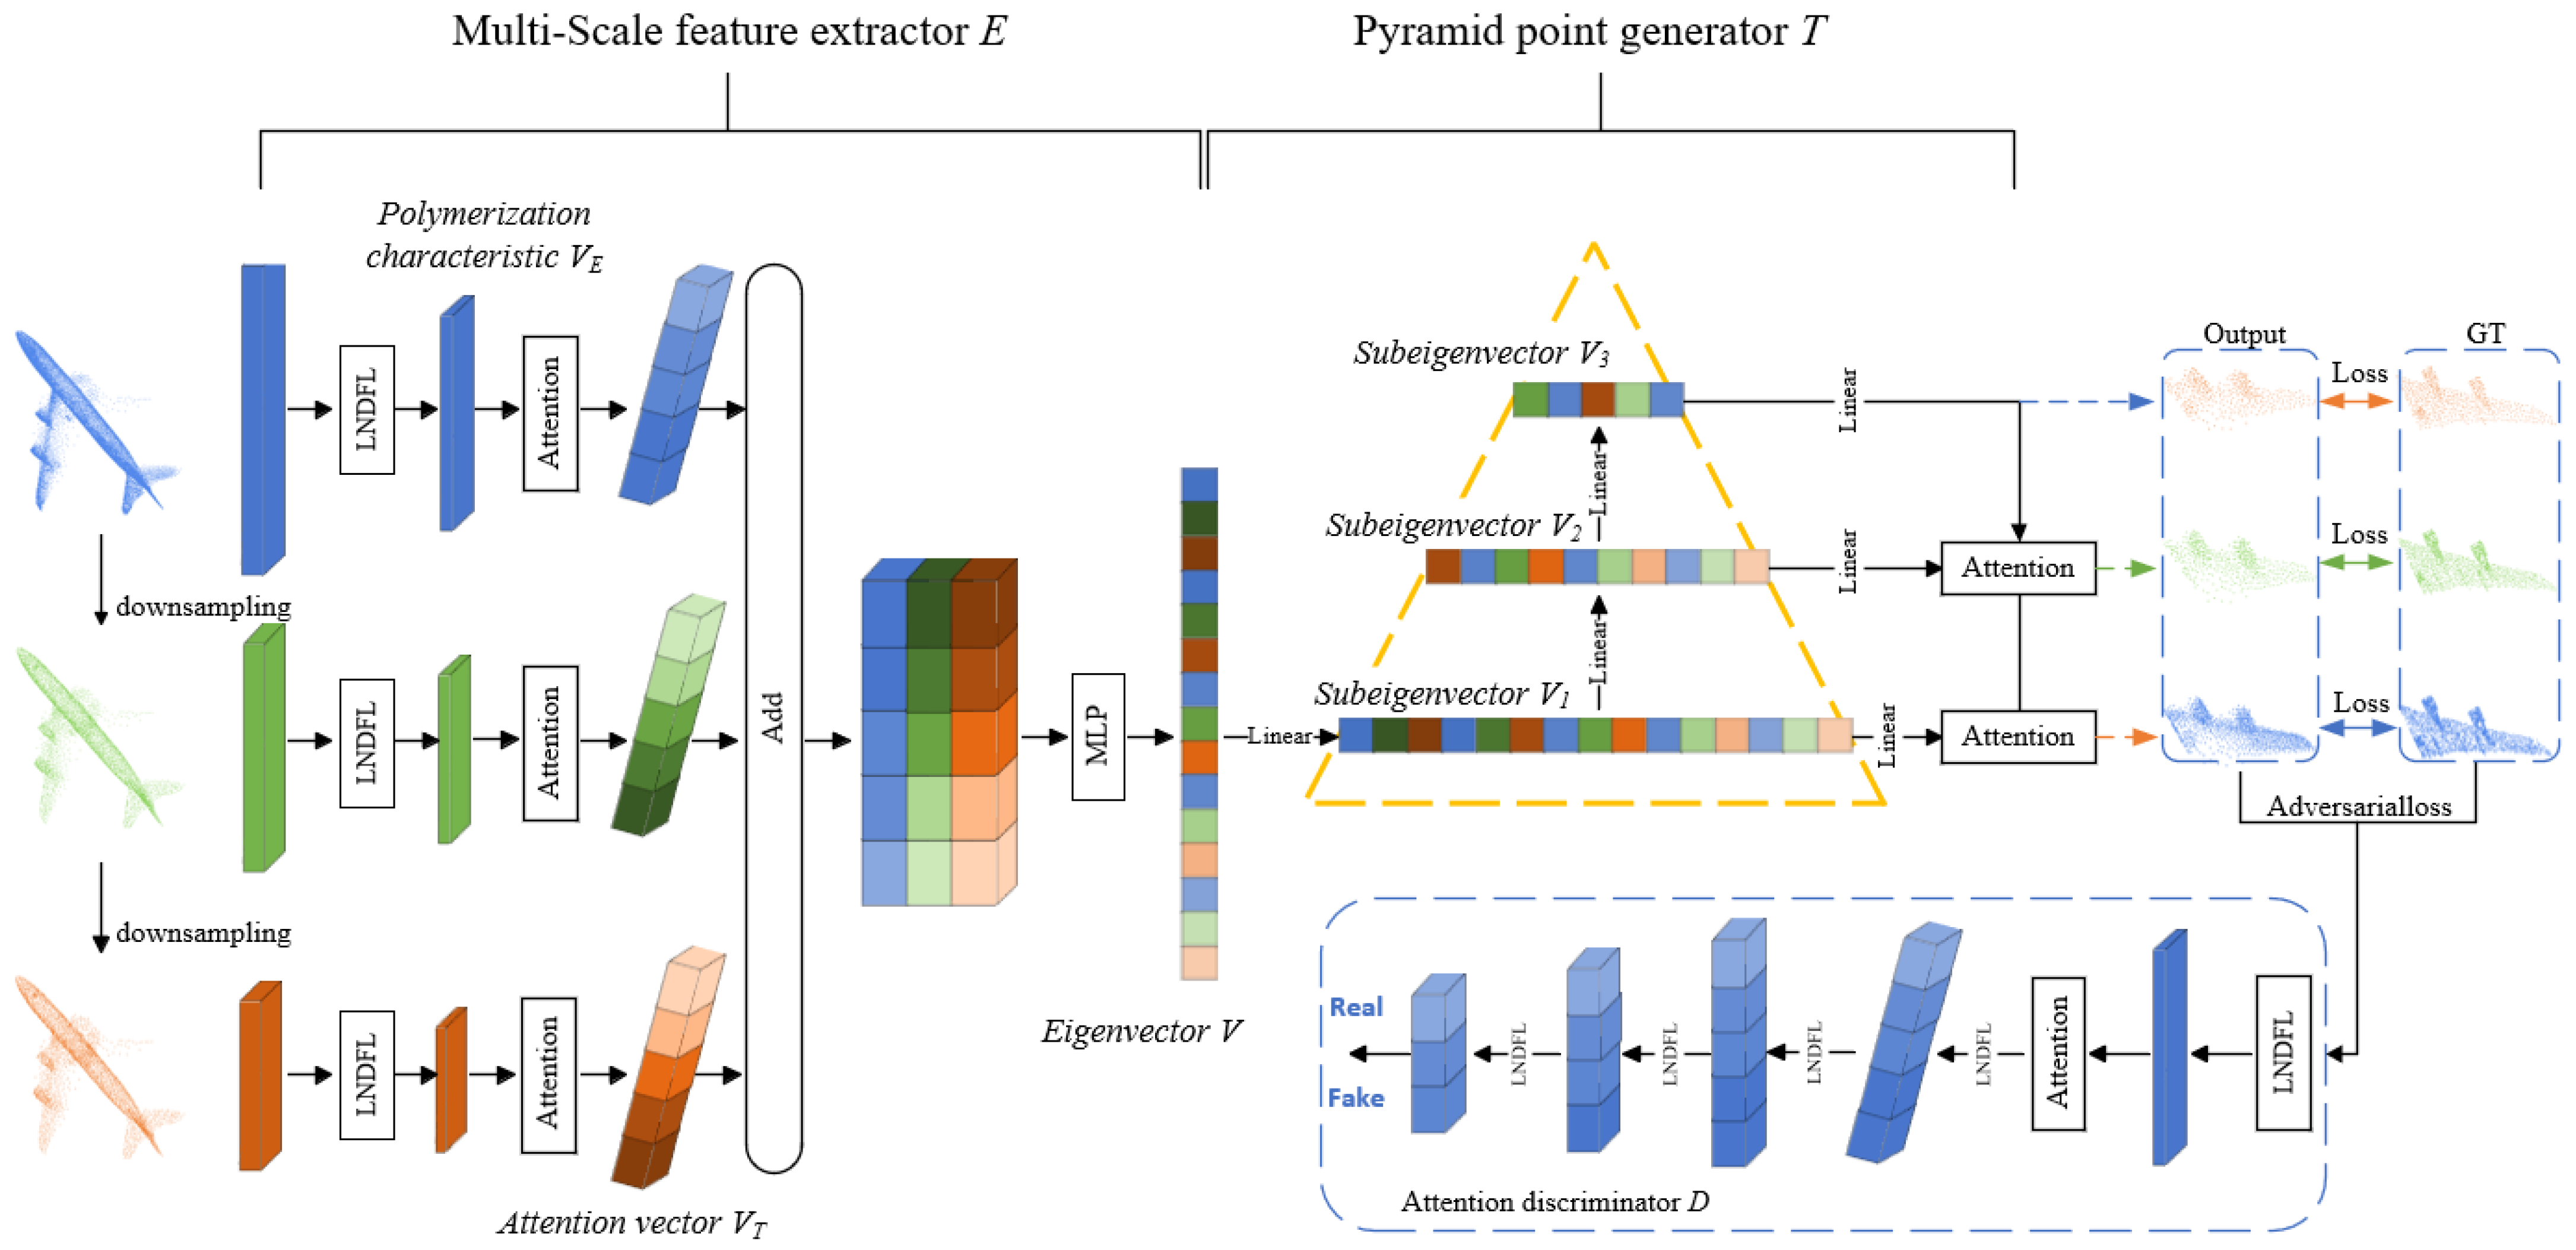
Building on the work, this paper introduces a multi-scale point cloud completion network termed local neighborhood dynamic fusion (LNDM-Net). The network utilizes a local neighborhood dynamic approach combined with an attention mechanism to extract three different scales of the original point cloud, effectively capturing both local and global features of incomplete point clouds. This dual extraction minimizes the loss of local information during the feature extraction process. Furthermore, a pyramid point cloud generator is employed to facilitate multi-stage point cloud completion, progressing from coarse to fine levels. To further enhance completion accuracy, an attention discriminator is incorporated into the model.
The specific contributions of this paper are outlined as follows:
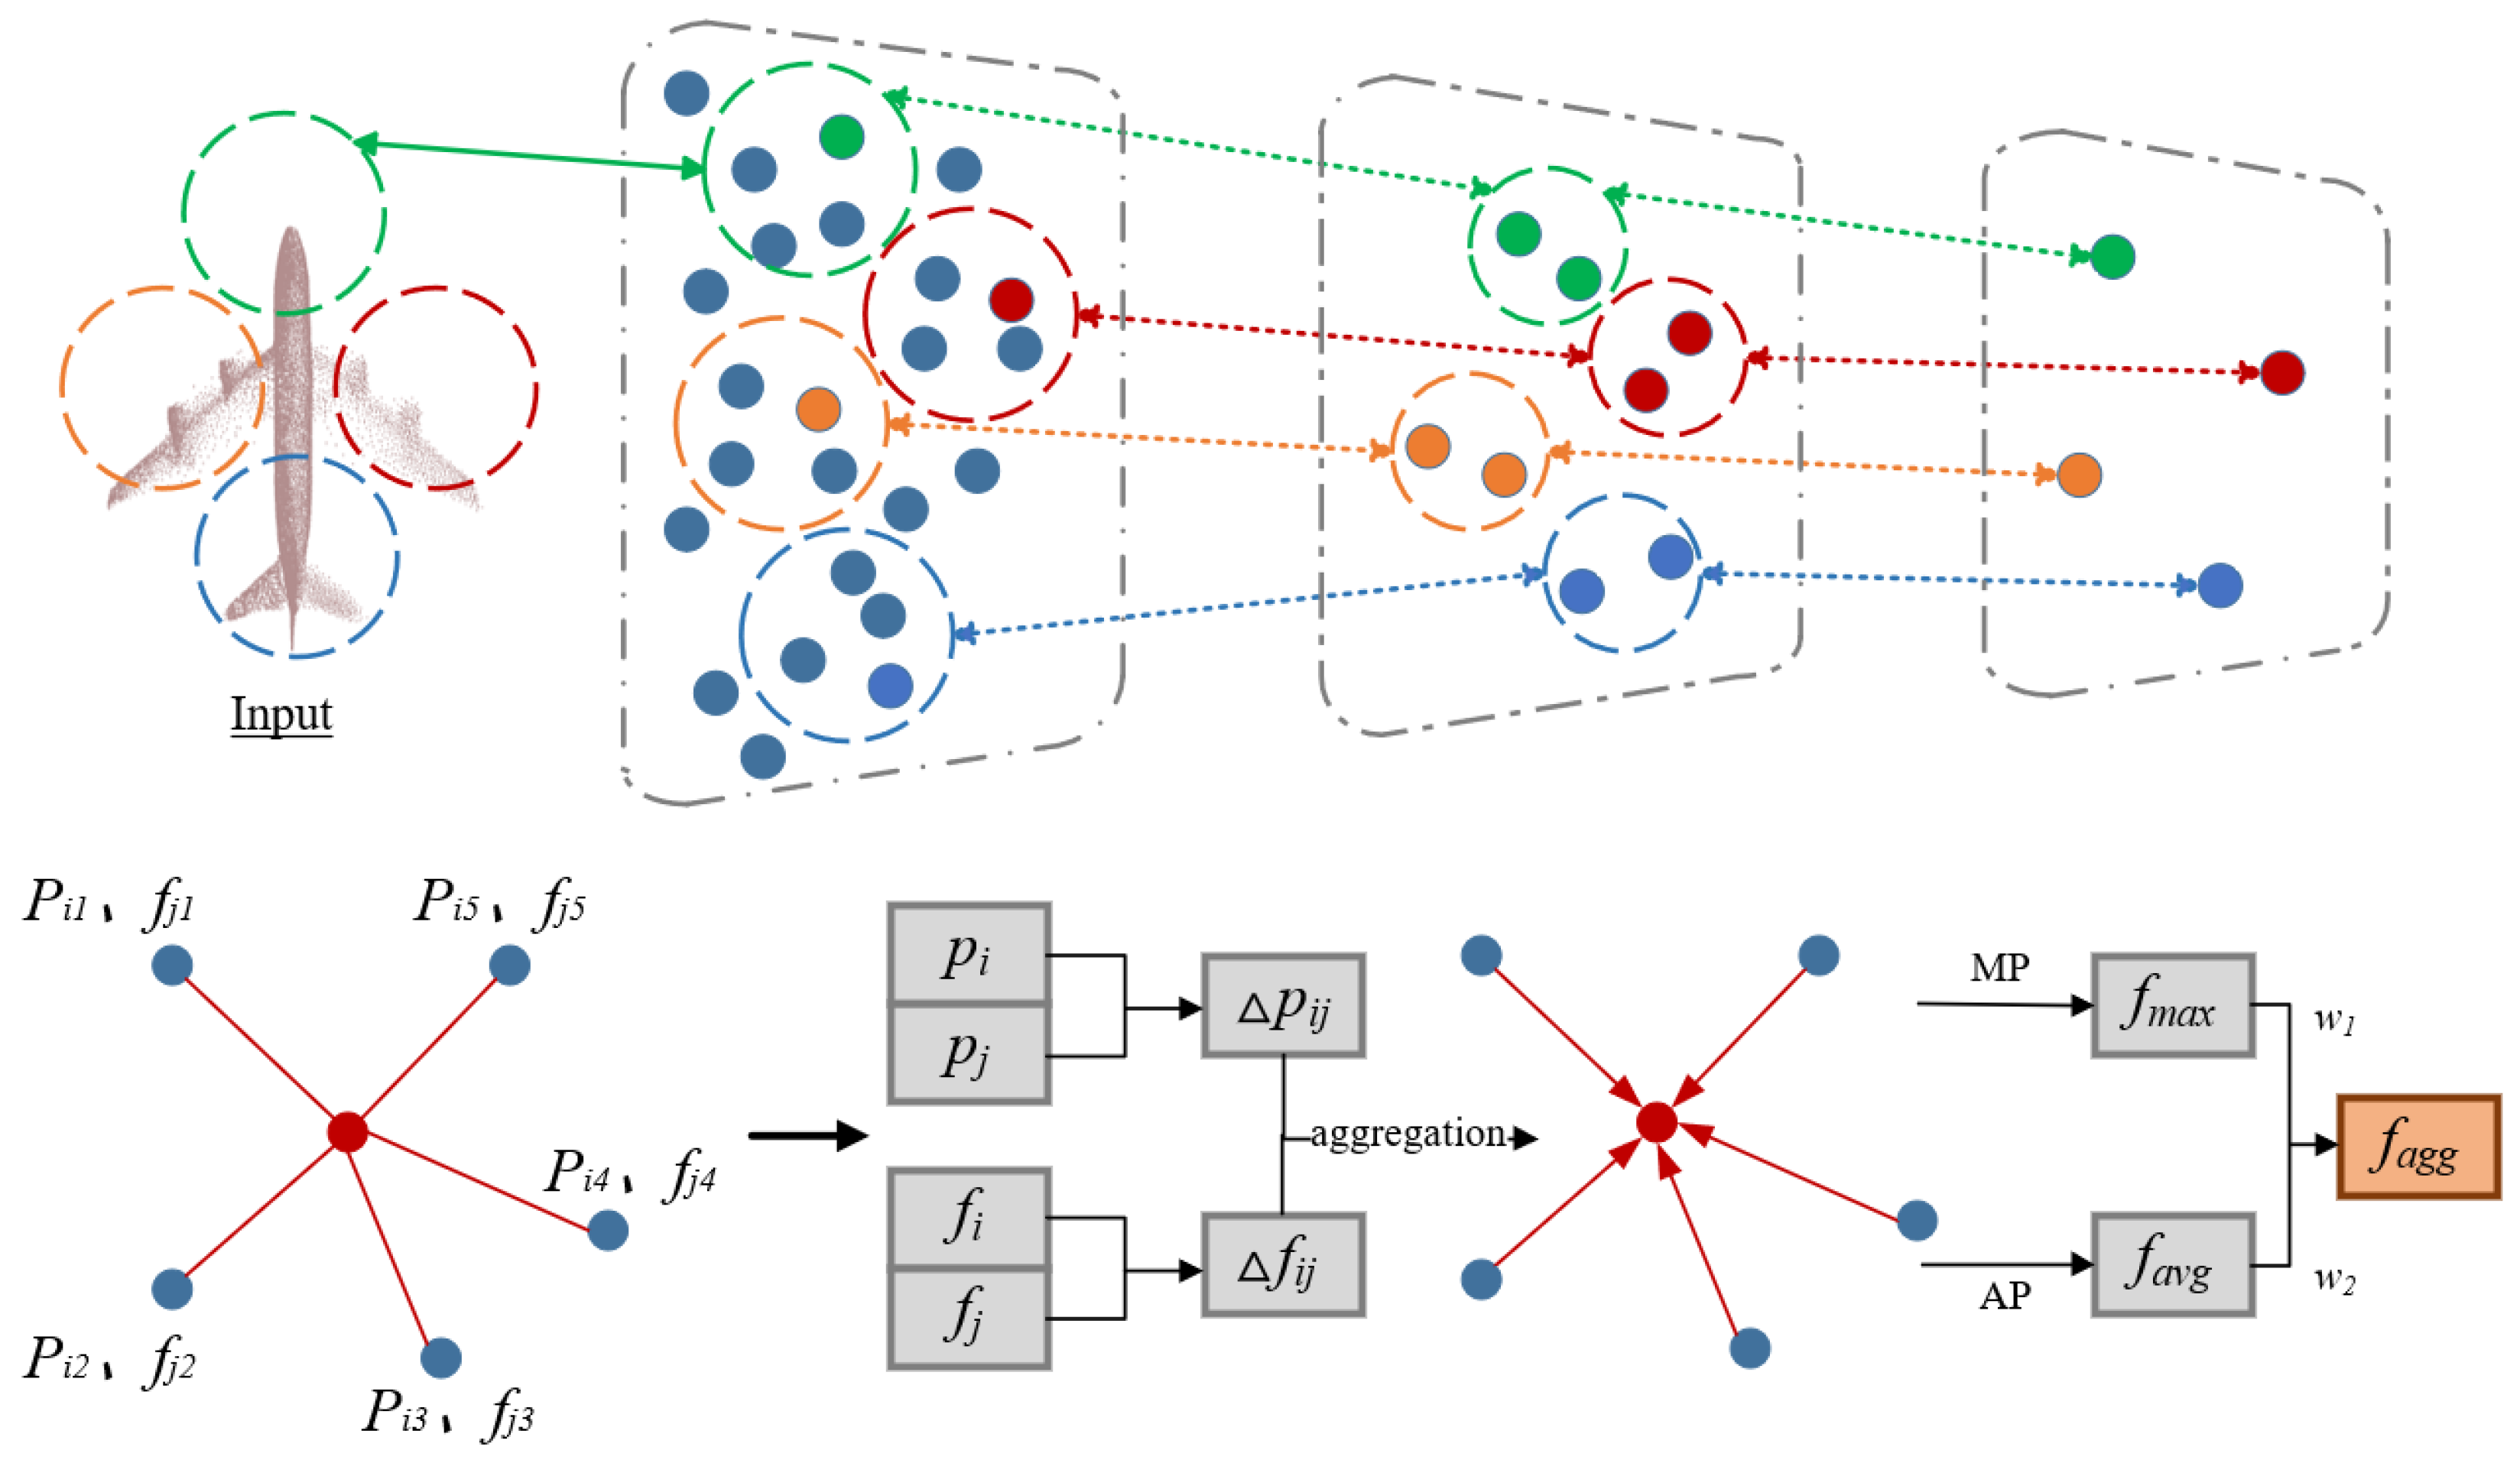
(1) Design of a Multi-Scale Point Cloud Extractor: A novel multi-scale point cloud extractor based on local neighborhood dynamic fusion is proposed. Through farthest point sampling (FPS) for point cloud down-sampling, we generate point clouds at three distinct scales. These multi-scale point clouds are then processed using a Transformer architecture to further enhance feature extraction capabilities. The local neighborhoods around key points in the incomplete point cloud are dynamically fused, and a biased attention mechanism is employed to retain the local feature information at each scale. This improves the network’s ability to extract both global and local features from the original point cloud.
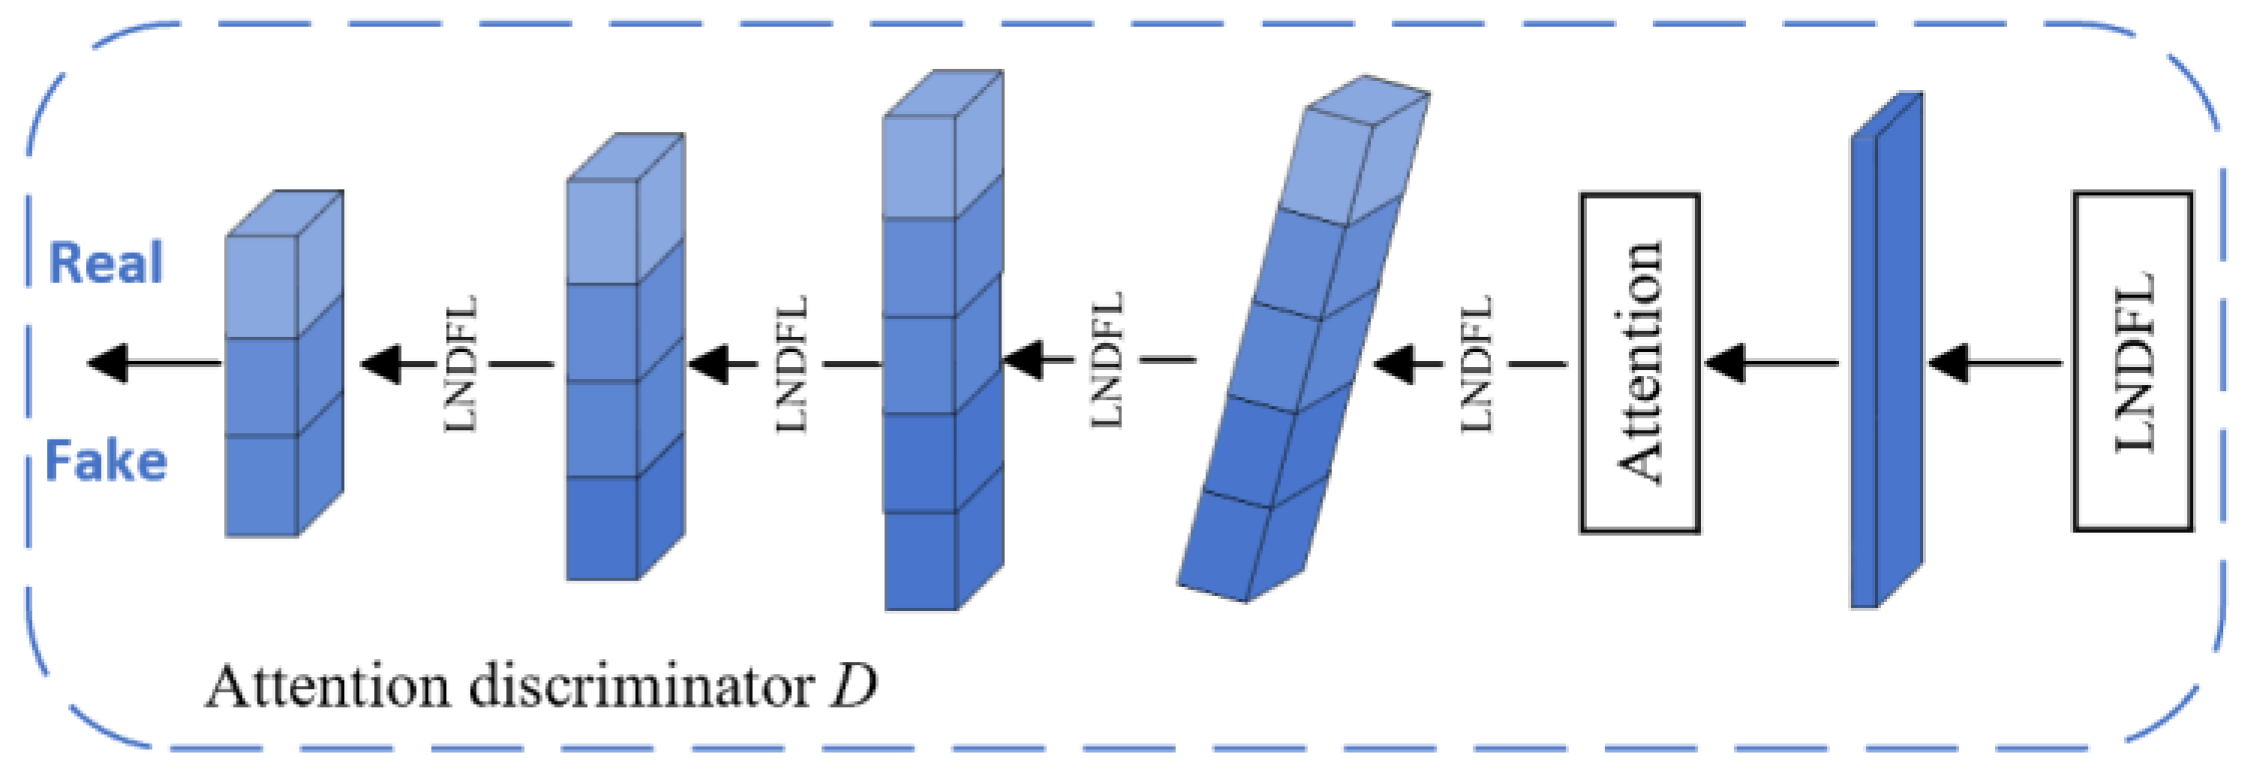
(2) Development of a Multi-Scale Attention-Based Point Cloud Generator: A point cloud generator that leverages a multi-scale attention layer and pyramid structure is introduced. This approach progressively refines local details from coarse to fine resolutions, effectively enhancing point cloud completion. When combined with a generative adversarial network (GAN), a single-scale attention discriminator is incorporated, which further boosts the completion quality of the generated point cloud.
(3) Experimental Validation: The experimental results demonstrate that LNDM-Net achieves promising completion performance on the PCN and ShapeNet public datasets. Ablation studies confirm the effectiveness of the innovative techniques proposed in this paper, while generalization tests show that LNDM-Net exhibits robustness when applied to a variety of sample types.
2. Related Work
Three-Dimensional Shape Completion Methods Based on Deep Learning: Deep learning technologies have made significant strides in the field of 3D shape completion, largely driven by neural networks and extensive training datasets. These advancements primarily focus on two types of data representation: voxels and point clouds.
Voxelization-Based Shape Completion: Two-dimensional convolution techniques inspire the voxel representation method. For instance, the VConv-DAE network, proposed by Sharma et al. [
18], is the first unsupervised learning model for 3D shape feature extraction. However, the process of converting point clouds into voxels inevitably leads to information loss, prompting researchers to explore direct point cloud data processing. Yang et al.’s FoldingNet [
19] demonstrated the feasibility of restoring high-dimensional features to point clouds. However, it generates complete point clouds through global encoding and fails to explicitly model local geometric features (such as surface curvature and edge sharpness), resulting in blurry details in the reconstruction. Tchapmi et al. [
20] introduced TopNet, which treats point cloud generation as a tree growth process and designs a hierarchical decoder. Zhang and Yang’s SA-Net [
21] integrates a self-attention mechanism to improve the retention of local features, while Wang et al.’s SoftPoolNet [
22] replaces traditional max pooling with SoftPool to preserve more fine-grained details. Xiang et al. [
23] proposed SnowflakeNet, which likens point cloud generation to snowflake-like growth, enhancing the richness of the output point cloud details. However, the use of only a global attention mechanism leads to the neglect of the correlation of local details in the final result. As 3D point cloud completion technology continues to evolve, progress has been made in transitioning from voxel-based processing to direct point cloud handling. Innovative network architectures have played a key role in significantly improving the performance and accuracy of shape completion tasks.
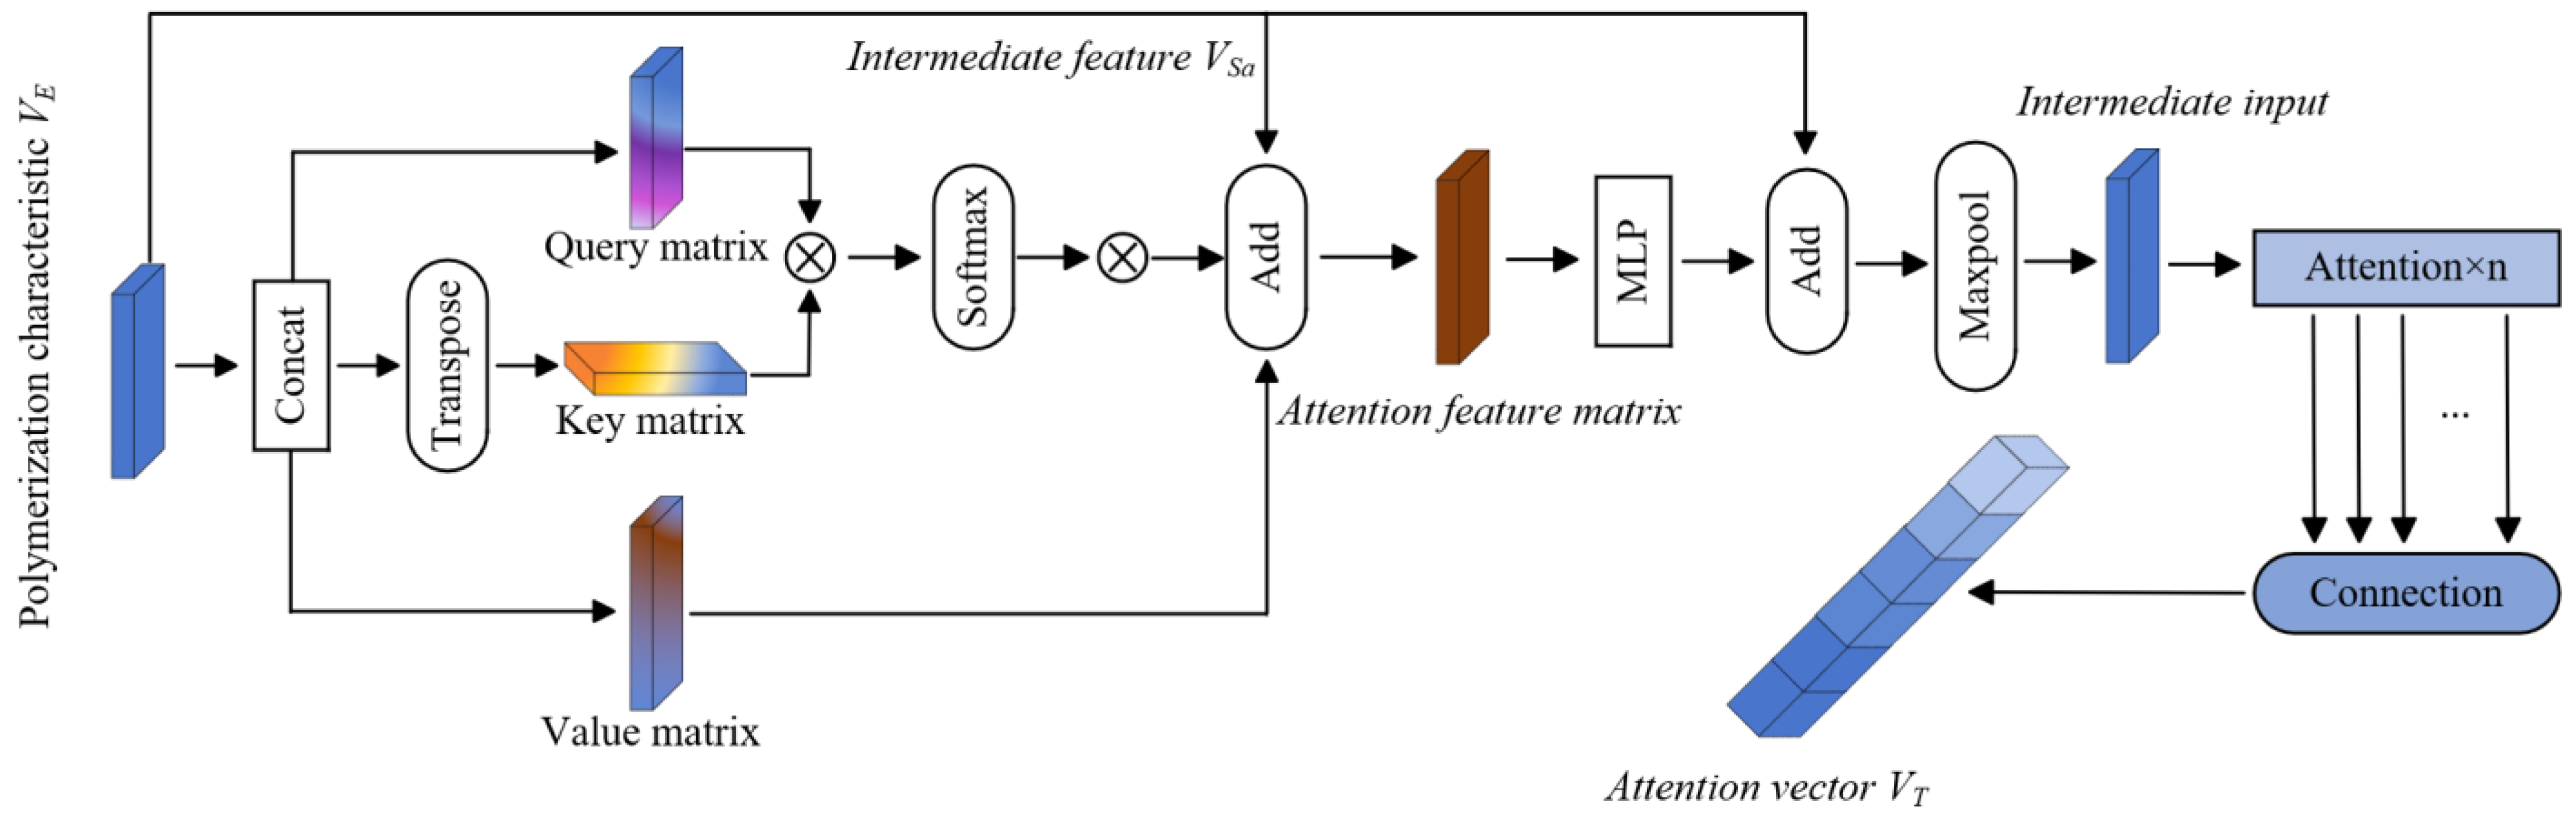
Point Transformer Attention Mechanism: The attention mechanism has emerged as a powerful tool in neural networks, with its influence extending across various domains [
24]. In the realm of point cloud data processing, this mechanism has opened up new possibilities. It is adept at calculating key relational information, such as the spatial distance and relative positions between individual points in the point cloud. Recently, the Transformer architecture has gained significant traction in the field of visual processing. Notably, the introduction of the Vision Transformer (ViT) model [
25] has taken the application of the attention mechanism to new heights. In the context of 3D point cloud data, the Transformer architecture has demonstrated exceptional potential. Guo et al. [
10] and Zhao et al. [
26] have each incorporated Transformer architecture into point cloud processing, designing innovative biased and self-attention mechanisms for feature extraction. The Transformer architecture has not only effectively captured the spatial relationships within point cloud data but also achieved significant results in tasks such as point cloud object classification and scene segmentation. Therefore, the application of the Transformer architecture has advanced 3D point cloud processing technology and provided strong support for practical applications in related fields. Most importantly, it has provided an effective approach for the point cloud completion work presented in this paper.
4. Experiments
To evaluate the effectiveness of the proposed network model across different types of datasets, experiments were conducted on two publicly available datasets: the ShapeNet dataset, which contains 16 categories, and the PCN dataset, which includes 8 categories. Additionally, the algorithm was visually compared with state-of-the-art (SOTA) methods and assessed using the Chamfer Distance (CD) metric for 3D point cloud completion. Furthermore, ablation studies and generalization tests were performed to validate the necessity and effectiveness of each module within LNDM-Net.
4.1. Dataset and Experimental Parameter Settings
During the training and testing phases of LNDM-Net, portions of the ShapeNet dataset (16 categories) and the PCN dataset (8 categories) were selected for training and validation. To ensure consistency in the input data, all original point clouds were centered at the origin, with their 3D coordinates constrained within the interval [−1, 1]. The model was built using the PyTorch deep learning framework. Training was performed on a high-performance workstation featuring an Intel(R) Core(TM) i9-14900K CPU @ 6GHz and an NVIDIA GeForce RTX 4090 GPU, operating under the Ubuntu 18.04 system to ensure stability and compatibility.
For the training process, the Adam optimizer was used with an initial learning rate of 0.001, a batch size of 24, and 400 epochs. To reduce overfitting and gradually lower the learning rate, a decay strategy was employed, where the learning rate was reduced by a factor of 0.5 every 20 epochs. Batch normalization (BN) and the ReLU activation function were applied in the multi-scale feature extractor and the attention discriminator, while only the ReLU activation function was used in the pyramid point cloud generator. Additionally, the sampling and local neighborhood dynamic fusion operations in the local neighborhood dynamic fusion layer were repeated twice, and the attention layer operation was applied four times.
4.2. Combined Loss Function
Point cloud metric indicators are essential evaluation tools that assess the similarity or differences between point cloud data. Commonly used indicators include Chamfer Distance (CD) and Earth Mover’s Distance (EMD). The CD indicator is suitable for analyzing the overall point cloud, providing an intuitive measure of the distance between two point clouds. In contrast, the EMD indicator offers a more detailed analysis of local structural differences, though it is computationally more complex. Due to the importance of computational efficiency, this study selected Chamfer Distance (CD) as the evaluation metric for the model’s completion performance.
Given the computational efficiency of CD, it was preferred over EMD, which requires more extensive calculations. CD is widely adopted in point cloud-related tasks because it effectively reflects the overall differences between point clouds with lower computational cost. Therefore, in this paper, CD was used to quantify the proximity between the generated and real point clouds, serving as a key reference for optimizing the model as follows:
We primarily employed the Chamfer Distance (CD) indicator to measure spatial distances between point clouds. To calculate the CD value, the process first computed the Euclidean distance from each point in point cloud S1 to the nearest point in point cloud S2, and vice versa. Then, the average of these distances from both directions was calculated, and the final CD value was obtained by summing these two averages. This method provided an intuitive representation of the overall distance difference between the two point clouds.
As seen in Equation (10), the CD (Chamfer Distance) indicator measures the average Euclidean minimum distance between the generated point cloud S1 and the real point cloud S2. In the context of this model, the generator produced three multi-scale outputs, and the total generation loss accounted for the losses across these three scales. Specifically, dCD1, dCD2, and dCD3 represent the losses corresponding to the first, second, and final layers of the generator output, respectively. These losses were calculated by comparing the generated point clouds at each scale with the real point clouds using the CD indicator.
Based on the above, the total generation loss
L1 of the model can be expressed as follows:
The expression of the total adversarial loss
L2 is shown in formula (11) below:
In the expression of this loss function, Pin represents the original input defective point cloud, while Pgt refers to the true complete point cloud. It is important to note that the total loss function of the model was derived from the weighted sum of the generation loss L1 and the adversarial loss L2. To enhance the accuracy and stability of the output results, a relatively high number of training epochs were utilized. As the number of epochs increased, the proportion of multi-scale point clouds in the training process also increased. To balance the influence of point clouds at different scales on the total loss and prevent the model from converging to local optima, a dynamic weight α alpha was introduced to scale the contribution of each loss component in the generation loss. Specifically, α was adjusted based on the number of epochs: when epoch <20, α was set to 0.01; when 20 ≤ epoch < 80, α was set to 0.05; and when epoch ≥80, α was set to 0.1.
Additionally, to ensure the accuracy of the model’s output, β beta was introduced as the summation weight for the generation loss L1 and the adversarial loss L2 within the total loss function. In the experiments conducted in this paper, β = 0.95 was chosen to satisfy the condition α + β = 1. This setting facilitated a better balance between the generation and adversarial losses during training, thereby improving the overall model performance.
Finally, the Chamfer Distance
dCD (Chamfer Distance) was employed as the evaluation metric to assess the completion performance, as shown in Equation (12). This metric quantifies the difference between the generated point cloud and the true point cloud.
4.3. Experimental
4.3.1. PCN Dataset
The PCN dataset, derived from ShapeNet, serves as a benchmark dataset for point cloud completion tasks. It generates partial point clouds through back-projection from eight distinct viewpoints, simulating real-world sensor data acquisition. The dataset employs sampling strategies with 16,384 points representing complete shapes and 2048 points as partial inputs and is widely adopted for evaluating algorithm performance, primarily using Chamfer Distance (CD) as the evaluation metric.
To scientifically evaluate the point-cloud completion performance of the proposed algorithm,
Table 1 presents a comprehensive qualitative and quantitative comparison of the experimental results between LNDM-Net and several existing point-cloud completion models. Two key evaluation metrics are utilized in this comparison:
dCD(
S1
→S2) and
dCD(
S2
→S1).
Specifically, dCD(S1→S2) represents the average Euclidean distance from each point in the output point cloud to the nearest point in the real point cloud. This metric is primarily used to assess the positional and shape differences between the generated point cloud and the real point cloud, providing insights into the proximity of the output to the true 3D shape.
On the other hand, dCD(S2→S1) describes the average Euclidean distance from each point in the real point cloud to the nearest point in the output. This metric evaluates how well the generated point cloud covers the real point cloud, effectively determining whether the model has captured the shape and features of the true point cloud.
By employing both of these metrics, a more comprehensive and objective evaluation of LNDM-Net’s point-cloud completion performance can be achieved, enabling a scientific and rational comparison with existing models.
Through an in-depth analysis of the experiments on the PCN dataset in
Table 1, it can be clearly observed that LNDM-Net exhibited excellent performance in terms of the average CD value of the eight-class samples on the PCN dataset, outperforming other algorithms. Specifically, compared with the PF-Net algorithm, the performance improvement of LNDM-Net reaches approximately 5.78%. A further breakdown of each category reveals that LNDM-Net demonstrates better
dCD values for four types of objects such as tables and planes. Moreover, for the other 10 types of objects like guitars and hats, the
dCD(
S1
→S2)/
dCD(
S1
→S2) values of LNDM-Net are also superior to those of other networks.
The experimental results indicate that the ingenious integration of the LNDFL and the Transformer attention architecture in LNDM-Net enhances the model’s completion ability for different samples. This integrated architecture devises a unique feature-extraction approach for point clouds of different scales. Compared to a single MLP architecture, it can more effectively extract local feature information and point-to-point correlation information from the input point clouds.
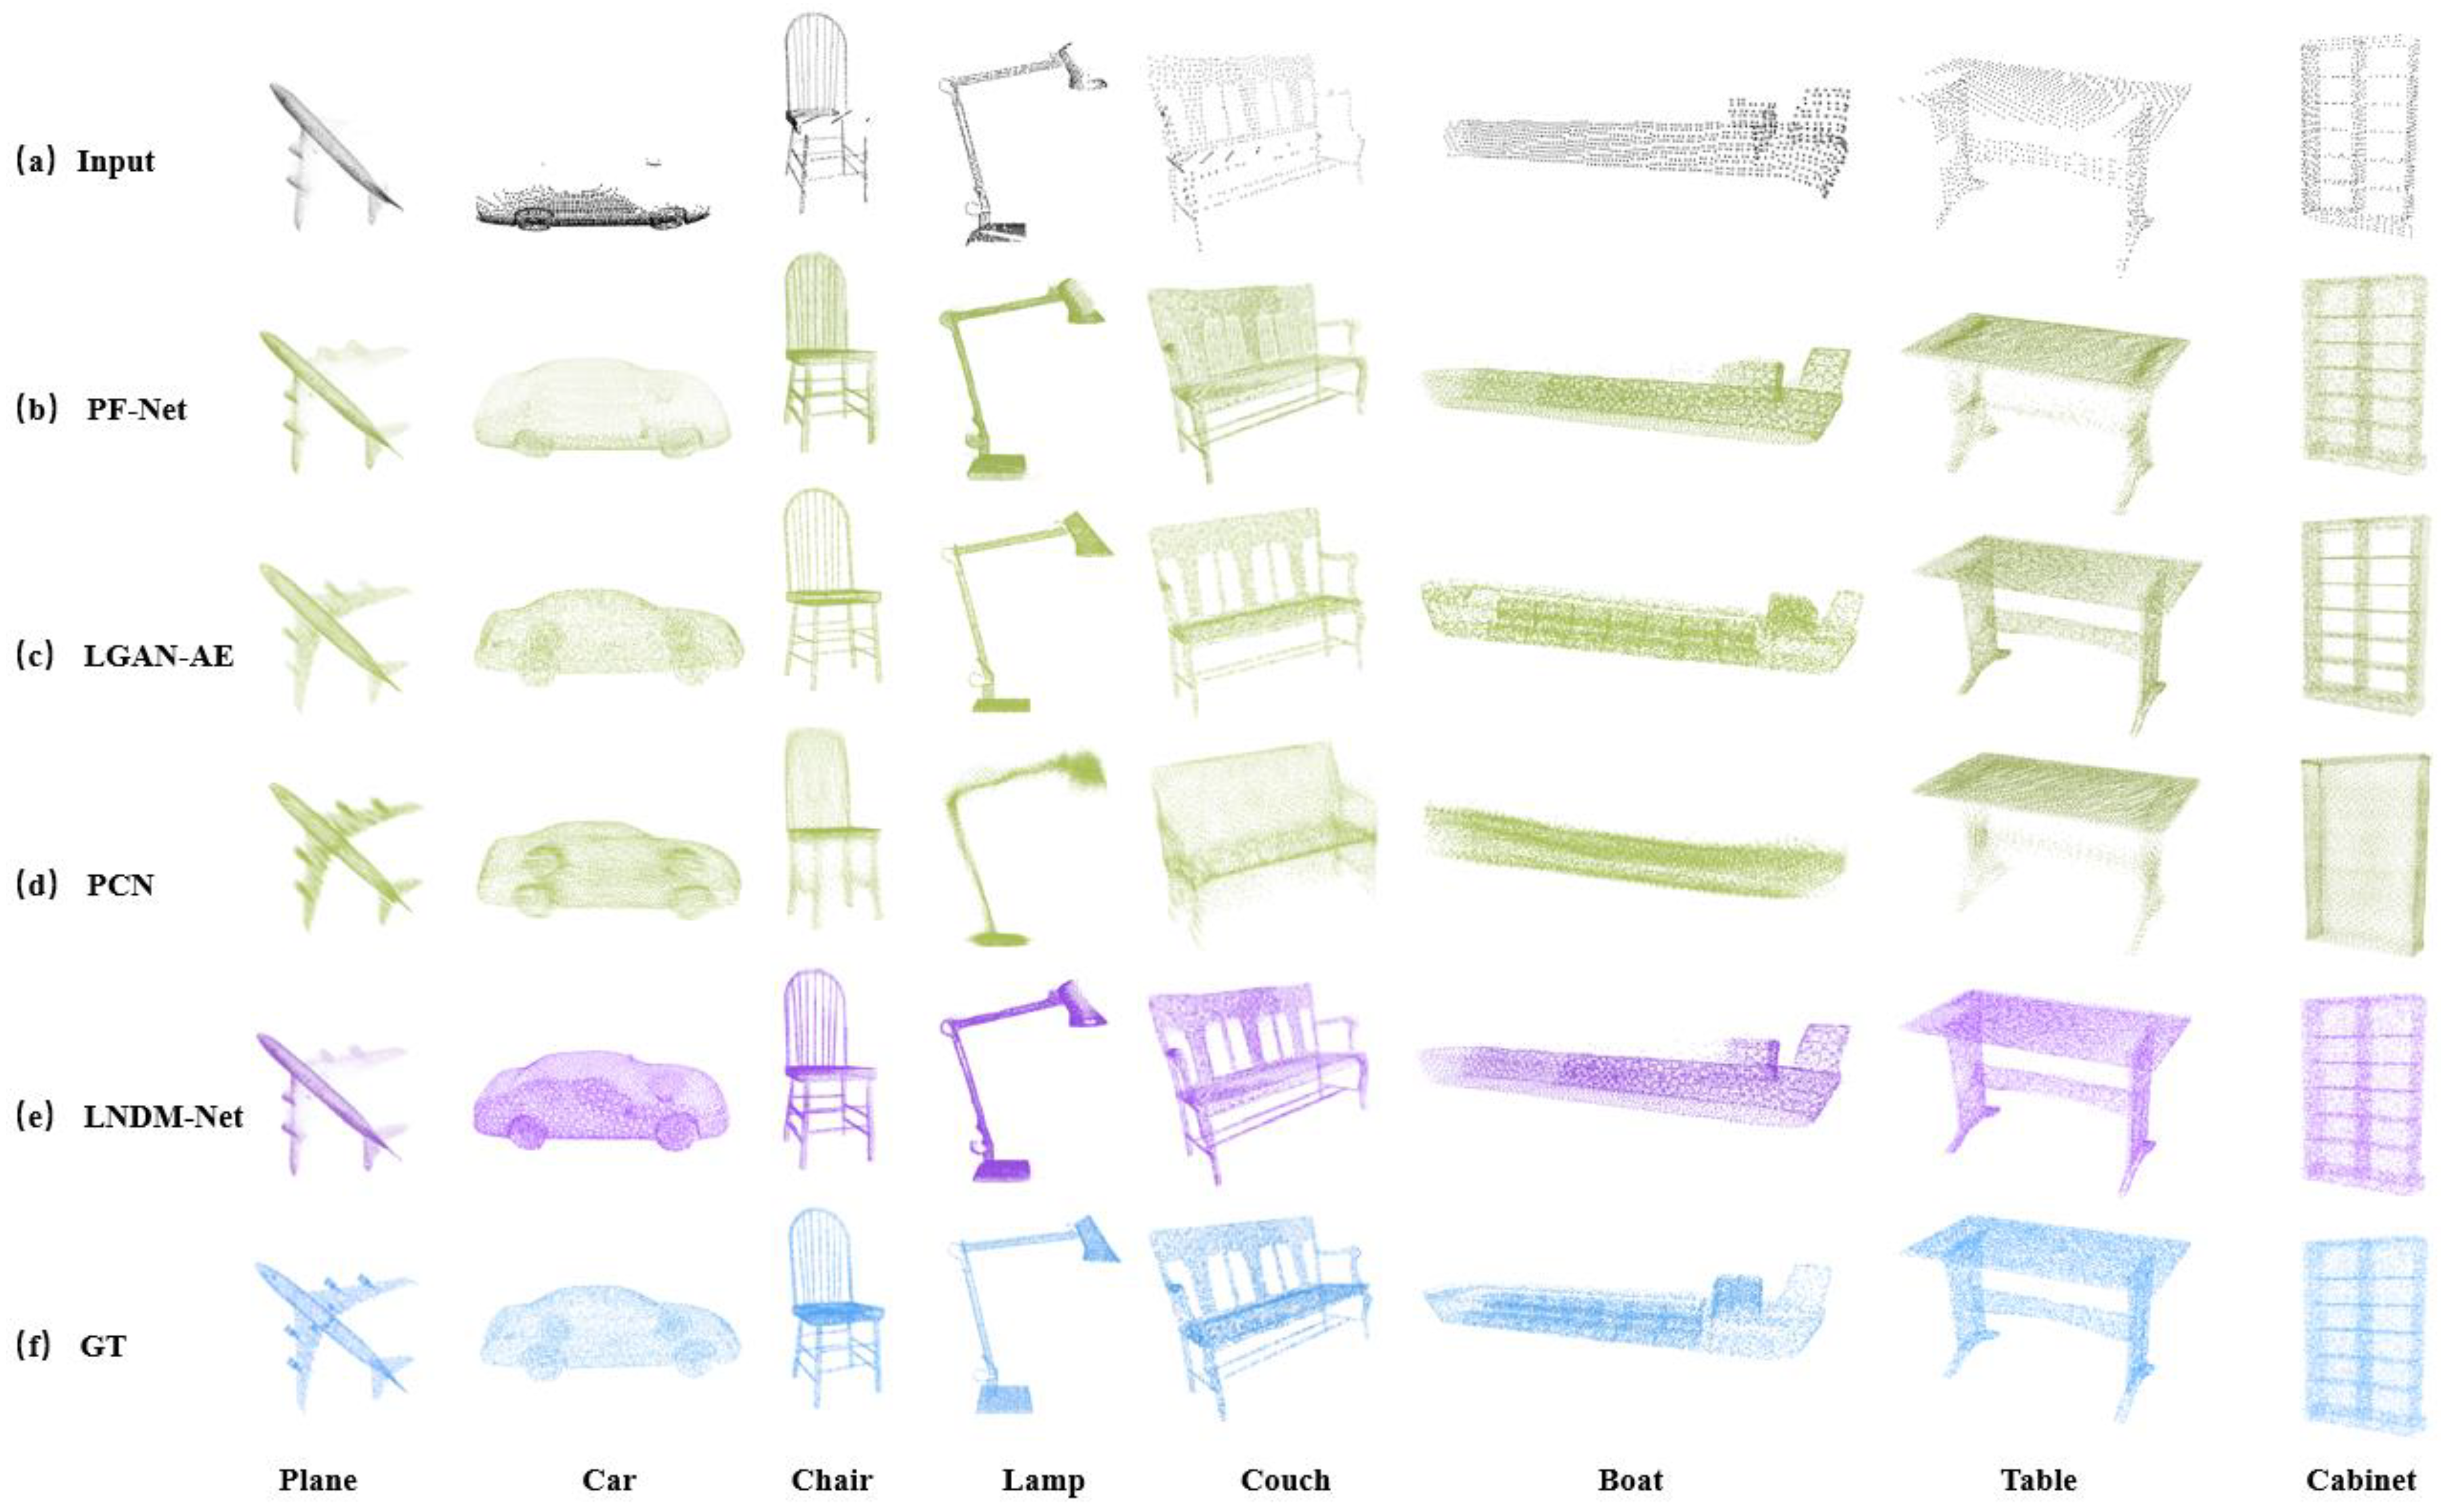
Figure 6 presents a visual comparison of the completion effects of LNDM-Net and other algorithms for some categories in the PCN dataset.
(1) When completing the local details of incomplete point clouds, LNDM-Net demonstrates a more precise ability to complete special structures. From the completion effect diagram of the Chair category in
Figure 6, this chair is different from common ones as its backrest has multiple independent vertical beams. Although the original point cloud does not have a missing structure for this part, only the seat surface of the chair is incomplete. After completion, the PF-Net algorithm can effectively fill in the missing part of the seat surface. However, it mistakenly treats the vertical beams on the backrest as incomplete parts, fills the gaps between the beams with point clouds of relatively low resolution, and, at the same time, retains the special texture structure of each beam. In contrast, based on completing the seat surface of the chair, LNDM-Net treats the texture information of the chair backrest as an intact part, effectively preserves the locally fine-grained structural information that is specially retained in the incomplete point cloud, and can also identify and effectively complete the missing parts. Similarly, this situation occurs in some samples from the Lamp category. From the completion effect diagram, the input incomplete point cloud has missing structures in the lamp base and lampshade parts. The PF-Net algorithm can effectively identify the incompleteness of the base and complete it. However, when completing, it fills the curved wire between the lamp base and the support rod and the hollow structure in the middle of the support rod with low-resolution point clouds while retaining the texture information. As a result, the completed sample seems to have a complete overall structure, but it cannot effectively filter out the special texture structures in the incomplete point cloud, affecting the special structural semantic information of the local structure. In contrast, after identifying the incompleteness of the base, LNDM-Net can effectively complete it. At the same time, when facing the hollow part in the support rod and the curved wire, it can effectively determine that these are intact parts, thus maximizing the retention of local feature structures during overall sample completion.
(2) From the visualization results, it can be concluded that LNDM-Net shows good model generalization ability when facing special samples for completion. During the sample training phase, most samples within the same category have similar structures, but there are also samples with special structures. Since the number of training samples with special structures is relatively small compared to the majority of samples with similar structures, deficiencies will eventually be exposed during completion, affecting the completion effect. For example, in the Boat category samples in
Figure 6, most boats have a long raised structure in the middle, especially when the sample structure is relatively long. However, when facing an incomplete point cloud of a boat with only a small raised part on the deck, as shown in the figure, the PF-Net algorithm can effectively complete the overall structure of the boat when it recognizes that only half of the boat’s point cloud is incomplete. But when completing the missing raised part of the deck, influenced by the training samples, it will complete the raised structure to be relatively long. Although LNDM-Net also struggles to avoid such problems, when lacking the specific position information of the connection between the missing part of the raised part on this sample and the front-end structure of the deck, it can fully understand the lateral missing distance information of the raised part and effectively prevent large-scale longitudinal completion. The final completion effect is defined as shown in
Figure 6. The raised part of the boat sample has a less-than-ideal effect compared to the real point cloud, but it has a better suppression effect on longitudinal completion than PF-Net. Compared with PF-Net, the final completion result is closer to the real point cloud. Specifically, as shown in
Figure 6, the completed right wing of the plane is noticeably sparser than the left wing. This is due to the introduction of the attention discriminator, which results in the generator’s output after a game with the real point cloud. However, compared to PF-Net and LGAN-AE, the completion effect is still better.
4.3.2. ShapeNet Dataset
On the ShapeNet dataset, a comparison of the CD metrics between the LNDM-Net and PF-Net methods was conducted. The ShapeNet dataset encompasses 16 different categories, and the sample structures are more diverse. Overall, as shown in
Table 2, in the ShapeNet dataset, by measuring the average CD value, the results of the proposed method for 10 categories are also superior to those of the PF-Net algorithm. The results further validate the excellent performance of LNDM-Net in point-cloud completion.
4.3.3. KITTI Dataset
To address the verification requirements for 3D point cloud completion tasks in real-world scenarios, this study employs the challenging KITTI autonomous driving dataset for experimental analysis. Jointly constructed by the Karlsruhe Institute of Technology and the Toyota Technological Institute, this dataset is acquired through vehicular-mounted multi-sensor systems (including 64-beam rotating LiDAR, stereo vision cameras, IMU, and GPS) in complex urban environments, which comprehensively record 3D spatial information and multi-modal sensory data in dynamic traffic scenarios.
Based on officially provided 3D bounding box annotations, vehicle instances are extracted from full-scene point clouds. After density filtering (>5 points/instance) and manual verification, we ultimately construct a test set containing 2401 car samples. Compared with synthetic datasets, KITTI’s LiDAR-scanned data exhibit two significant distinctive characteristics: (1) Affected by sensor physical limitations and environmental occlusions, target point clouds demonstrate non-uniform sparse distribution characteristics, with an average point density of 23.7 ± 6.5 points/sample, representing merely 21.3% of ShapeNet synthetic data. (2) The absence of complete ground truth point clouds makes it challenging to directly apply fully supervised evaluation paradigms.
To address the challenge of missing ground truth data, this study adopts a dual-metric evaluation framework inspired by GRNet [
27]. The quantitative analysis comprises the following: (i) Fidelity Distance (FD), defined as the average nearest-neighbor distance from each point in the input cloud to the completion result, which constrains geometric feature preservation during completion; (ii) Minimum Matching Distance (MMD), implemented by retrieving the ShapeNetCars sample with minimal Chamfer Distance (CD) to the completion result, leveraging external prior knowledge to validate semantic rationality. This hybrid evaluation mechanism effectively mitigates assessment bias caused by ground truth absence while simultaneously addressing dual objectives: geometric consistency and shape integrity.
As quantitatively demonstrated in
Table 3, LNDM-Net achieves dual-metric superiority on the KITTI real-scanned dataset with FD = 2.91 × 10
−2 and MMD = 6.57 × 10
−2, exhibiting 64.3% (FD) improvement in geometric fidelity and 3.1% (MMD) enhancement in shape plausibility compared to GR-Net [
27].
Figure 7 visually confirms the model’s sparse-input robustness, even under extreme conditions with point cloud density below 8 points/sample, and LNDM-Net successfully reconstructs complete vehicular topology, including continuous structural expressions of door seams and roof curvature (see
Figure 7). Benefiting from fine-tuning based on the pre-trained model from PCNCars, our approach effectively preserves synthetic data detail-generation capabilities while adapting to non-uniform distribution patterns in real-world scans. Both qualitative visualization and quantitative analysis collectively validate LNDM-Net’s practical value in real-world 3D perception systems.
4.3.4. Ablation Experiment
The innovation of the network model proposed in this paper lies in the targeted improvement of three key modules: the feature extraction module, the attention layer architecture, and the attention discriminator. To thoroughly assess the effectiveness of these modules in practical applications, an ablation experiment was conducted using the PCN dataset. In this experiment, four network models were compared: the complete LNDM-Net model (which includes all the enhanced modules) and three control models (each removing one of the key modules mentioned earlier). By comparing the performances of these models under identical conditions, the contribution of each module to the overall performance can be intuitively evaluated.
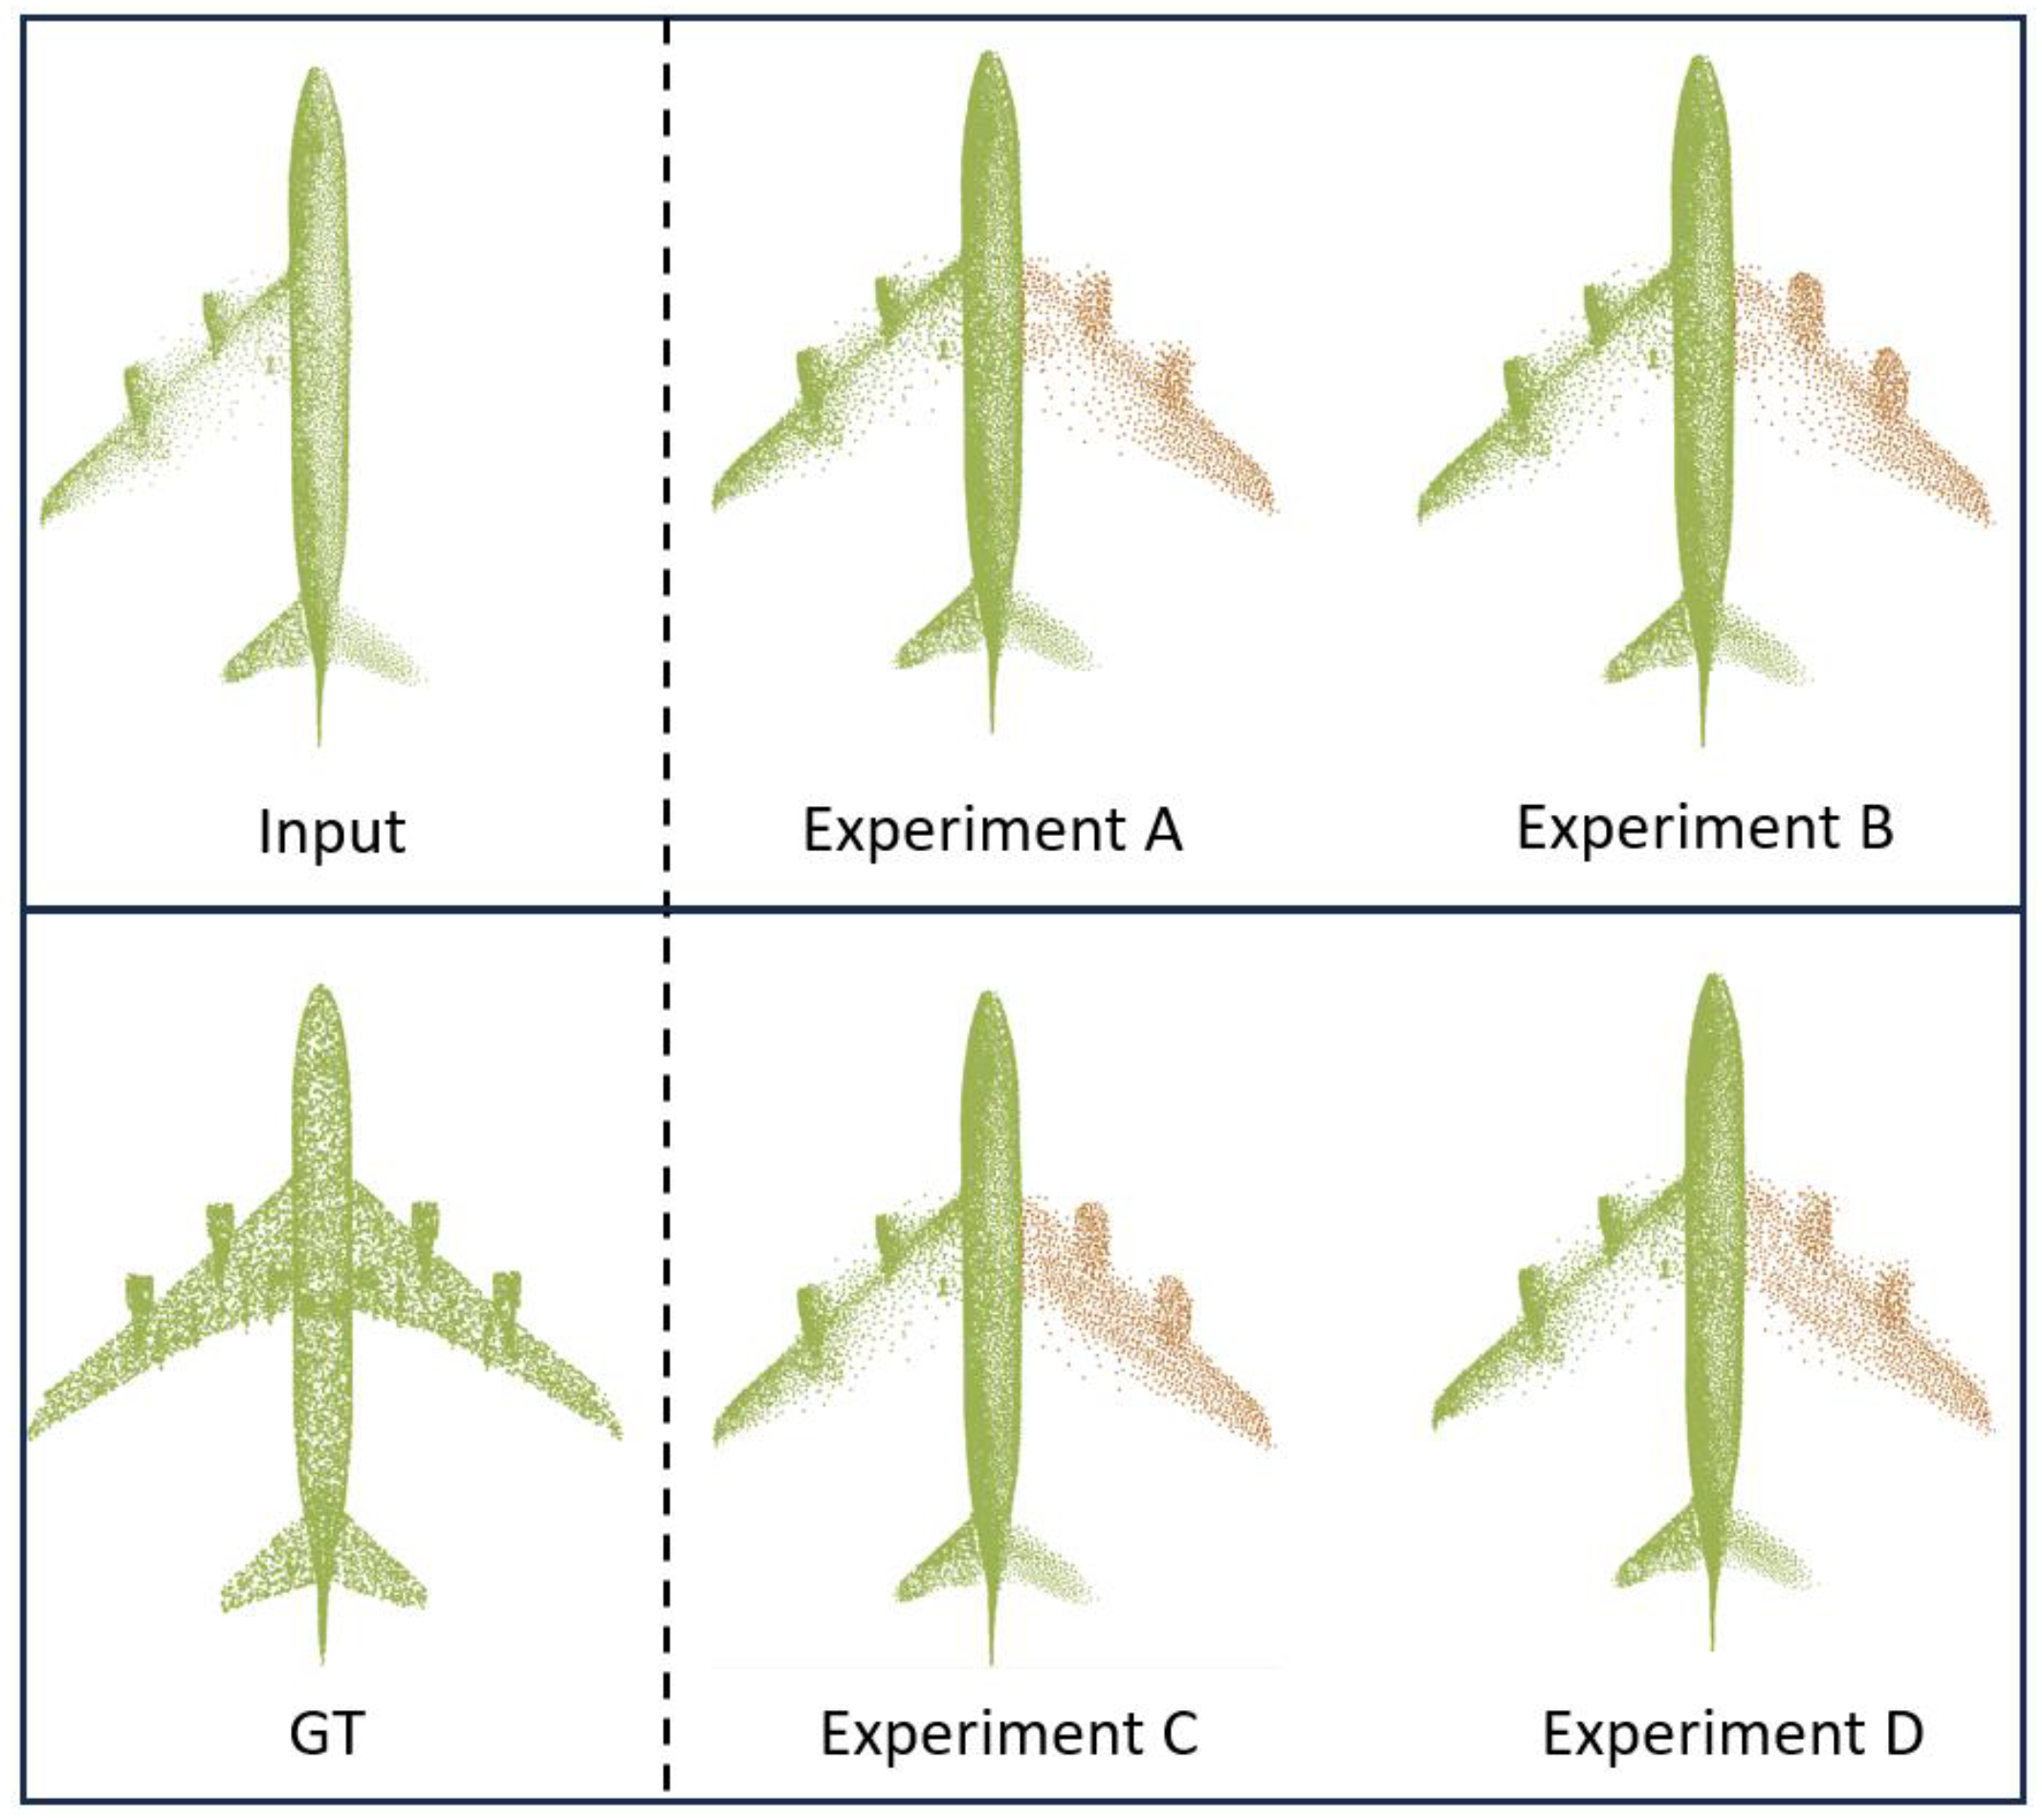
Table 4 provides detailed results from the ablation experiment, and
Figure 8 visually illustrates the point cloud completion results for the Plane category. From the results, it is evident that Experiment [D] (the full LNDM-Net model) achieved the lowest CD value. In this experiment, the model not only effectively completed the missing right-wing engine but also processed the point-cloud distribution at the junction between the wing and the fuselage, making it highly consistent with the corresponding part of the real point cloud. This result not only demonstrates the exceptional performance of Experiment [D] in the point cloud completion task but also emphasizes the importance and necessity of maintaining the integrity of the LNDFL, the attention layer, and the attention discriminator.
Through comparative analysis of the ablation experiment, it can be concluded that the proposed network model significantly enhances point-cloud completion performance, with each key module playing an indispensable role. This conclusion provides strong support for future research and offers valuable insights for researchers in related fields.
Based on the comprehensive analysis of the visualization results and experimental data, the following specific conclusions can be drawn:
In Experiment [A], when the other parts of LNDM-Net were retained and only the feature-extraction module of this model was disabled, the average CD value increased significantly to 1.742/1.854. This change was particularly evident in the completion effect of the contour of the right-wing engine of the plane and the connection between the right wing and the fuselage. Specifically, the completion results lacked clarity, and the contour was blurred. This result further validates the notion that the introduction of the feature-extraction module, especially for the improvement of the local-detail completion ability of incomplete point-cloud samples, has a significant effect.
In Experiment [B], when all components of LNDM-Net were retained except for the bias-attention layer in the feature-extraction process, the average CD value increased significantly to 2.392/2.541. This change was particularly evident in the completion of the plane’s right wing. Specifically, many “floating” stray points appeared around the right wing, and the two engines of the right wing were completed in a rough and unrealistic manner. These results clearly demonstrate that the bias-attention layer allows the model to focus more on the local-detail feature information of the incomplete point cloud by adjusting the attention weights. As observed in the experimental results, when completing the plane sample, the complete and well-defined left wing served as a geometrically sensitive reference, helping the model to complete the missing right wing of the fuselage with greater accuracy and detail.
In Experiment [C], when all components of LNDM-Net were retained except for the attention discriminator, the average CD value increased to 2.197/2.293. This change was most noticeable in the completion of the connection between the fuselage and the right wing, where the result exhibited noticeable gaps and poor continuity. This outcome further highlights the importance of the attention discriminator, which enhances LNDM-Net’s ability to predict and generate point clouds with more complete and precise structures.
In summary, the comparison and analysis of experimental data and visualization results after disabling different modules clearly demonstrate the essential roles of the feature-extraction module, the attention layer, and the attention discriminator in the model. The introduction of these modules significantly improves the point-cloud completion performance and enhances the model’s ability to extract local structural information, complete point clouds by referring to the local geometric structure of the input, and ultimately improve the overall completion quality.
4.3.5. Generalization Experiment
To further evaluate the completion performance of LNDM-Net on incomplete point clouds with varying degrees of missing data, three sub-models were designed based on the ShapeNet dataset. These sub-models were trained by altering the number of points in both the input and generated point clouds, with the goal of assessing the model’s performance under different conditions of point cloud incompleteness.
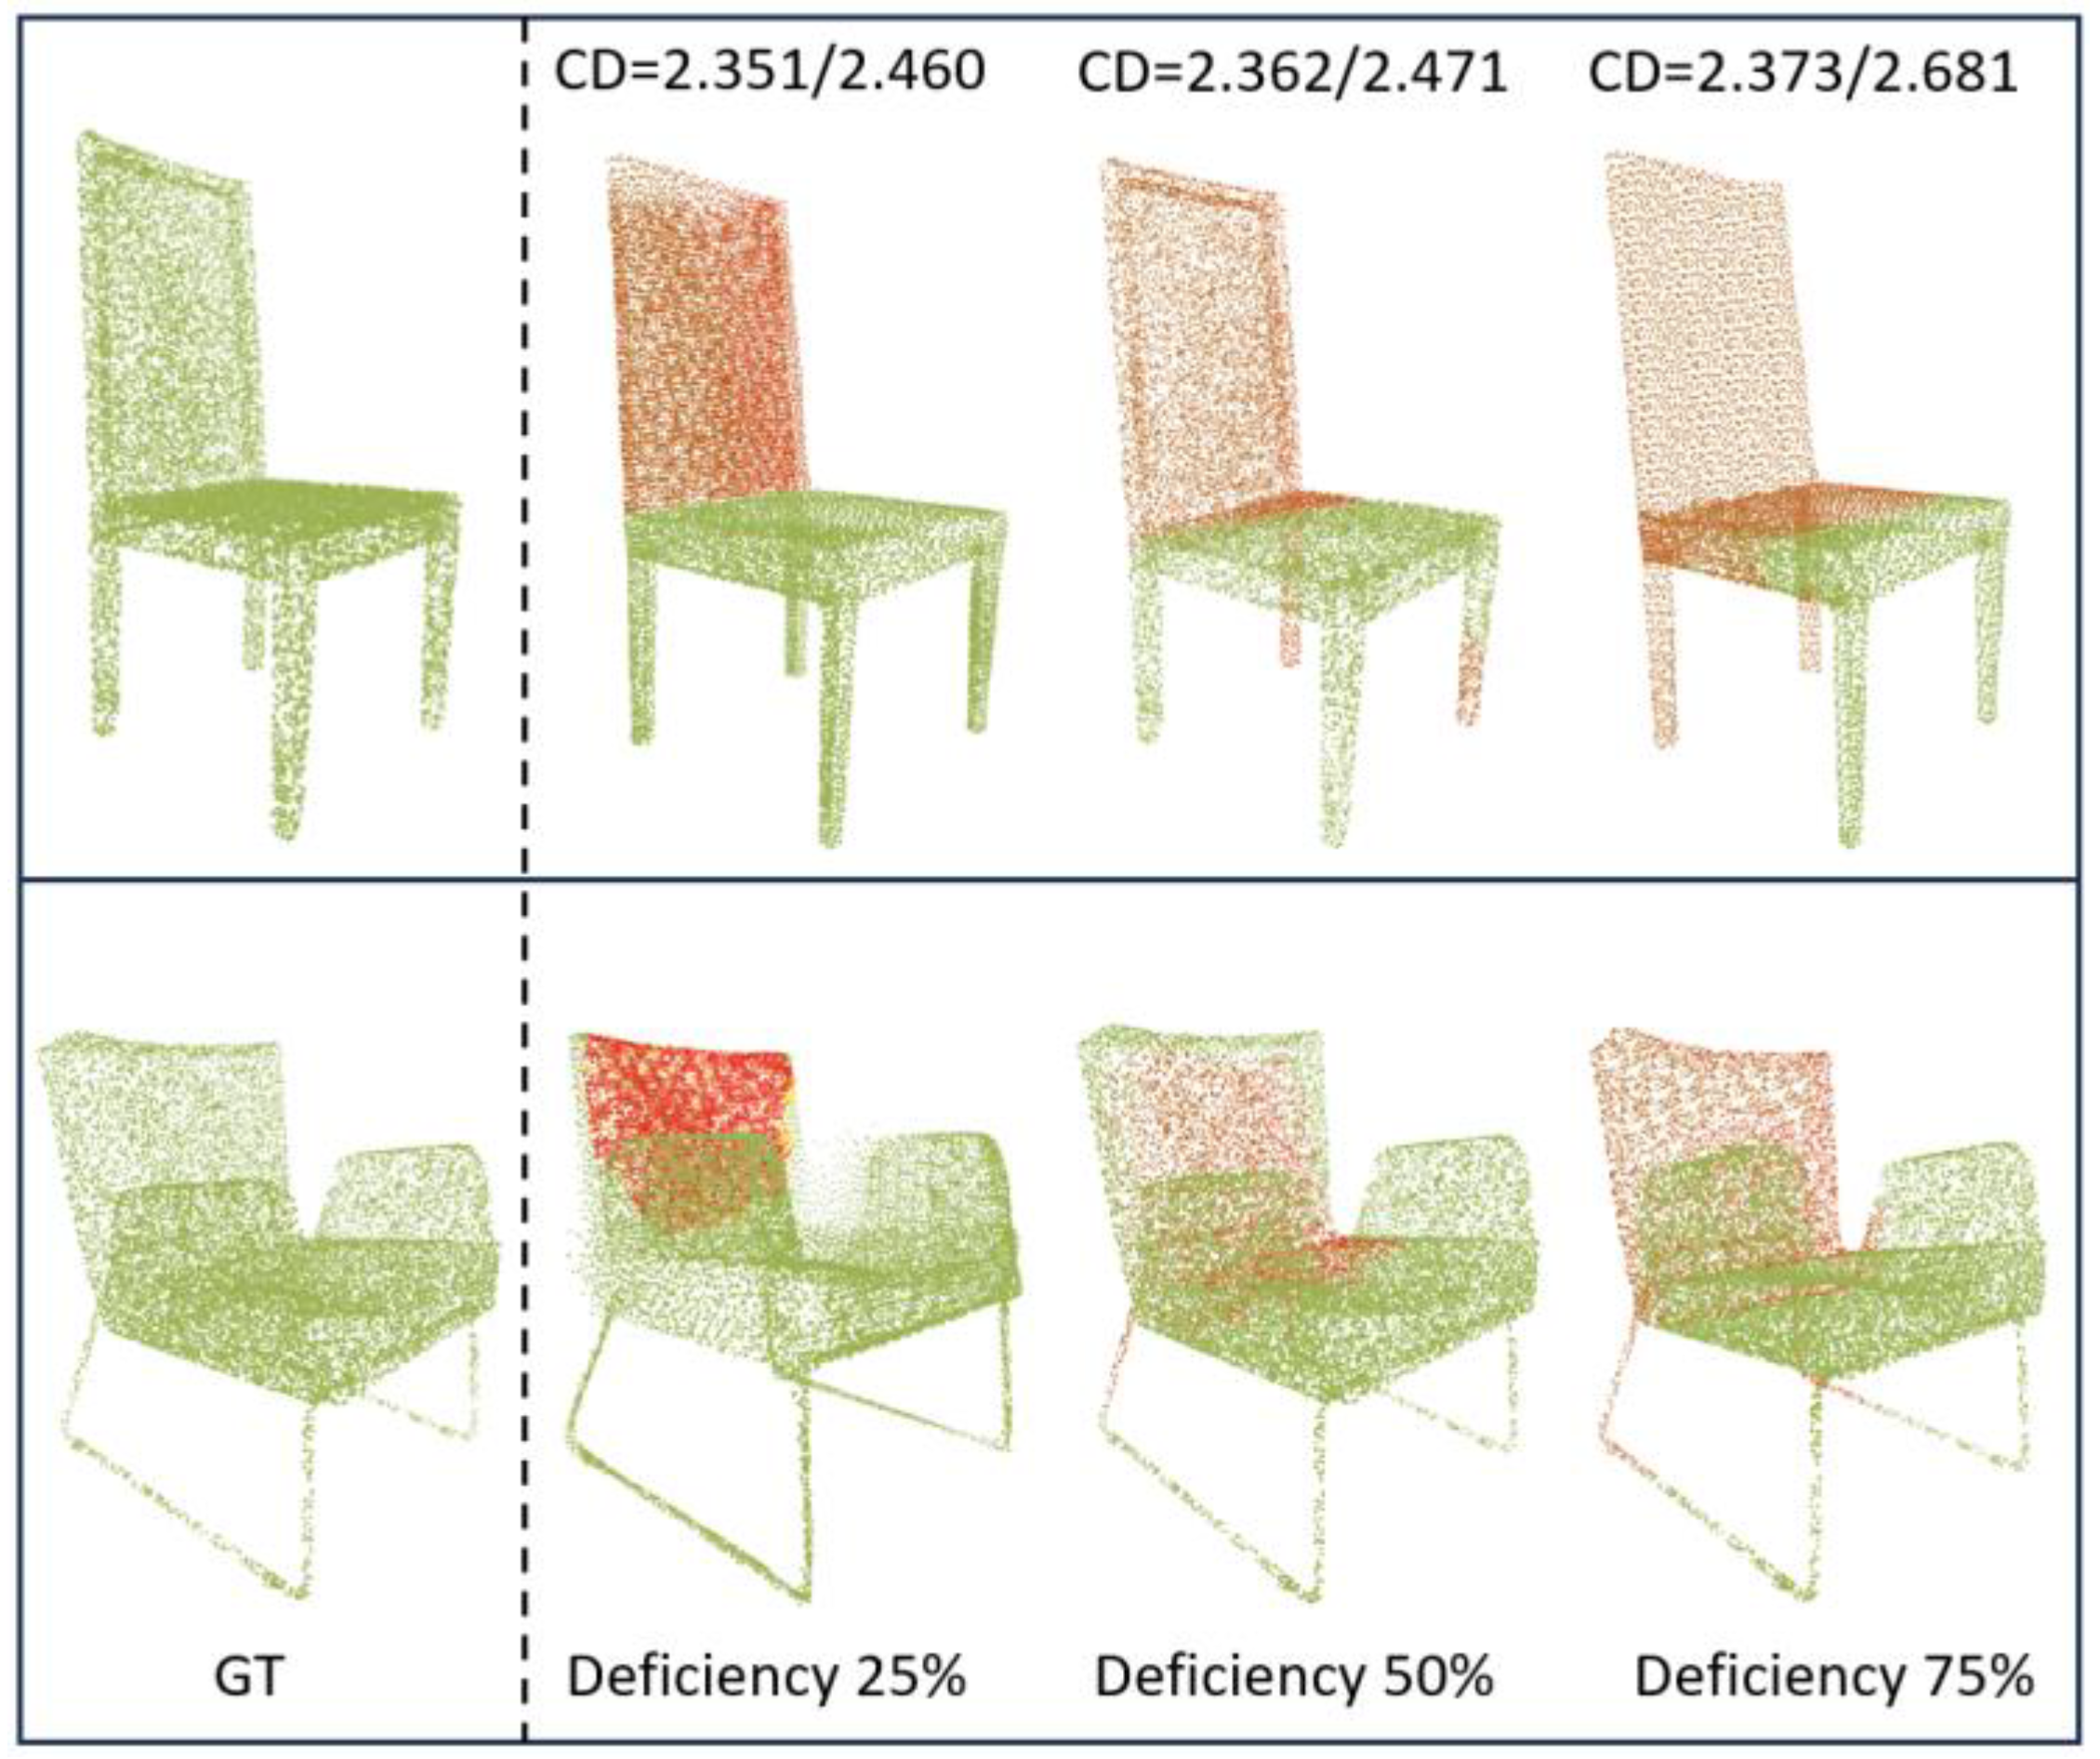
As shown in the experimental results in
Figure 9, the green color represents the input incomplete point cloud, while the orange-red color indicates the completed point cloud output by the model. The overlap of these two visually illustrates the completion effect. Taking the chair sample as an example, under three missing ratios of 25%, 50%, and 75% (indicating the proportion of points missing from the original point cloud), the model consistently demonstrates stable performance.
Notably, when the missing ratios are 25% and 50%, the model’s completion results remain relatively consistent, with CD values being close to each other. Even in the extreme case of a 75% missing ratio, the model still maintains a satisfactory completion effect. This suggests that the model performs well across different levels of point cloud incompleteness.
Further analysis reveals that the CD values under the 25% and 50% missing ratios are similar, indicating that the model achieves comparable completion accuracy in both scenarios. Even with a 75% missing ratio, the CD value for the chair category remains relatively low at 2.373/2.68. These results underscore the excellent completion capability of LNDM-Net, as it can accurately restore the full shape of a chair, even when only the seat and legs of the incomplete chair are provided as inputs.
5. Conclusions
This paper presents an end-to-end network model for multi-scale point cloud completion based on LNDM-Net. The model begins with a multi-scale point cloud extractor that processes point clouds at three different scales in parallel. It dynamically fuses local neighborhoods around key points in each scale of incomplete point clouds, incorporating a bias attention mechanism to preserve local feature information. This enhances the extractor’s ability to capture both global and local features effectively.
Next, the design of the point cloud generator leverages a multi-scale pyramid-like structure, which progressively refines the local details of the point cloud from coarse to fine. Inspired by generative adversarial networks (GANs), the model introduces a single-scale attention discriminator. Through adversarial competition between the discriminator and the pyramid generator, the accuracy of point cloud completion is significantly improved.
Finally, LNDM-Net undergoes extensive experiments on the ShapeNet and PCN datasets. The results demonstrate that compared to the PF-Net algorithm, the average Chamfer Distance (CD) for some samples improves by 4.54% and 4.42%, respectively. Future work will focus on developing a more efficient point cloud completion model, aiming for finer granularity, more uniform distribution, and higher precision in the generated point clouds.


