Article

Deformation Study of Strongly Structured Clays Considering Damage Effects

1
Guangxi Key Laboratory of Geomechanics and Geotechnical Engineering, Guilin University of Technology, Guilin 541004, China
2
School of Energy Engineering and Building Environment, Guilin University of Aerospace Technology, Guilin 541004, China
*
Author to whom correspondence should be addressed.
Appl. Sci. 2025, 15(6), 2969; https://doi.org/10.3390/app15062969
Submission received: 11 January 2025 / Revised: 5 February 2025 / Accepted: 11 February 2025 / Published: 10 March 2025

Abstract

:
Settlement values calculated per the current “Code for Design of Building Foundations” demonstrate significant discrepancies when compared to the actual measured settlement values observed after disturbing a strong, cohesive soil foundation. This inconsistency introduces uncertainties in engineering design. To investigate the deformation behavior of highly structured clay, which is particularly sensitive to disturbances, this study employed a shaking table to subject undisturbed soil samples to various disturbance levels. The shaking frequencies were set at 20 Hz, 35 Hz, and 50 Hz, with durations of 30, 60, 90, and 120 min. One-dimensional compression tests were performed to examine the relationship between soil deformation parameters and overburden pressure, alongside an analysis of the deformation process and pore structure damage in the highly structured clay. A fitting process using Origin software was utilized to develop a deformation modulus calculation model that accounted for disturbance and damage effects, aiming to enhance the accuracy of foundation settlement predictions. The results indicate that the proposed empirical formula for the deformation modulus is highly reliable, which is essential for improving the precision of foundation settlement calculations and ensuring engineering safety.

1. Introduction

Structural clay refers to a type of fine-grained clay that has specific micro- and macro structures, primarily composed of minerals such as kaolinite, montmorillonite, and illite. It possesses good plasticity and forming characteristics. Scholars in the field of geotechnical engineering have extensively investigated the deformation characteristics of clay, revealing that factors such as disturbance degree [1,2,3,4], water content [5,6,7,8], sensitivity [9,10], overburden pressure [11,12], and temperature [13,14] significantly influence the deformation properties of structured clays. Among these factors, the impact of disturbance degree is particularly pronounced. Research by Miao Yonghong et al. [15] indicates that when disturbance is minimal, the mechanical properties of the soil remain relatively stable; however, severe disturbance leads to a rapid deterioration of these properties, resulting in significant deformation.
Chung et al. [16] found that following disturbance, the yield stress of the soil gradually decreases while its compressibility increases. Schmertmann et al. [17] observed that the compression curves of soils at various disturbance levels intersect with the compression curve of remolded soil at approximately the 0.42 e0 point. Regarding the quantitative assessment of disturbance degree, scholars Hong [18] and Hvorslev [19] proposed methods based on the slopes of compression curves before and after disturbance, along with pore water pressure measurements. Xu Yongfu et al. [20] evaluated disturbance degree by examining the ratio of effective stress in the soil prior to and following shield tunneling.
Although these studies lay a foundation for understanding the deformation characteristics of structured clays, they largely overlook the interactions between overburden pressure, damage degree, and disturbance degree on soil deformation effects, particularly lacking quantitative analyses of soil damage degree. Therefore, it is crucial to incorporate damage degree and investigate the deformation behavior of highly structured clays sensitive to disturbance in engineering applications.
This study examines the interactive effects of overburden pressure, damage degree, and disturbance degree on the deformation behavior of highly structured clay. Through one-dimensional compression tests, the behavior of this clay under various disturbance conditions was analyzed, with particular attention given to the impact of vibration duration and frequency on deformation characteristics. The findings reveal the evolving trends of pore structure damage as overburden pressure increases. The comprehensive effects of disturbance degree, damage degree, and overburden pressure on soil deformation characteristics are summarized, and an empirical formula for the deformation modulus that considers both soil damage and disturbance factors is proposed. This provides a theoretical foundation and reference model for the design and construction of foundations and subgrades that involve structured clay.

2. Materials and Methods

2.1. Test Soil

The soil utilized in this study was collected from Zhanjiang, Guangdong, and represents the highly structured clay of the Zhanjiang formation. A cylindrical undisturbed soil sample (height: 200 mm, diameter: 100 mm) was extracted using the “push-in method”. Subsequently, the sample was wrapped in a protective container and transported to the laboratory for preservation. The soil exhibited a gray–black color and a relatively hard texture. Physical and mechanical property tests were conducted following the Standard for Geotechnical Testing Methods (GB/T 50123-2019), and the resulting physical and mechanical parameters are detailed in Table 1 [21].

2.2. Test Scheme

Preparation of disturbed soil samples:
The original undisturbed soil samples were processed into disc-shaped specimens with a diameter of 61.8 mm and a height of 20 mm using the ring knife method. To ensure a constant water content and prevent deformation during vibration, the top and bottom ends of the ring knife containing the specimen were sealed with glass plates and then wrapped with cling film and adhesive tape. Disturbed soil specimens in disc form were prepared at varying disturbance levels according to the vibration testing protocol described in Table 2, utilizing the electromagnetic vibration table produced by He Fei Tian Xiang Experimental Instrument Co., Ltd. of Hebei Province, China. In total, 36 specimens were prepared using this method and divided into 12 groups, each labeled in the format A1–A3. Additionally, one set of undisturbed soil specimens and one set of remolded soil specimens were prepared as backups [22].
Compression test:
The structurally strong clay of the Zhanjiang Group exhibited variations in yield stress due to differing sedimentary environments. To minimize the influence of these variations on the test results, this study employed elevated pressure levels in one-dimensional compression tests conducted on 14 groups of specimens. These included 12 groups of disturbed soil specimens, 1 group of undisturbed soil specimens, and 1 group of remolded soil specimens. The applied pressure levels were set at 12.5 kPa, 25 kPa, 50 kPa, 100 kPa, 200 kPa, 400 kPa, 800 kPa, 1600 kPa, and 3200 kPa [23]. To ensure stability, the loading duration for each pressure level was maintained at a minimum of 24 h, with the deformation increment controlled to not exceed 0.005 mm/h. The experiment was conducted using the GZQ-1 fully automated pneumatic consolidation testing system, which is capable of applying loads automatically according to predetermined pressure levels. The system also recorded key data, including settlement rate and total settlement, with a precision of up to 0.001 mm.

3. Test Results and Analysis

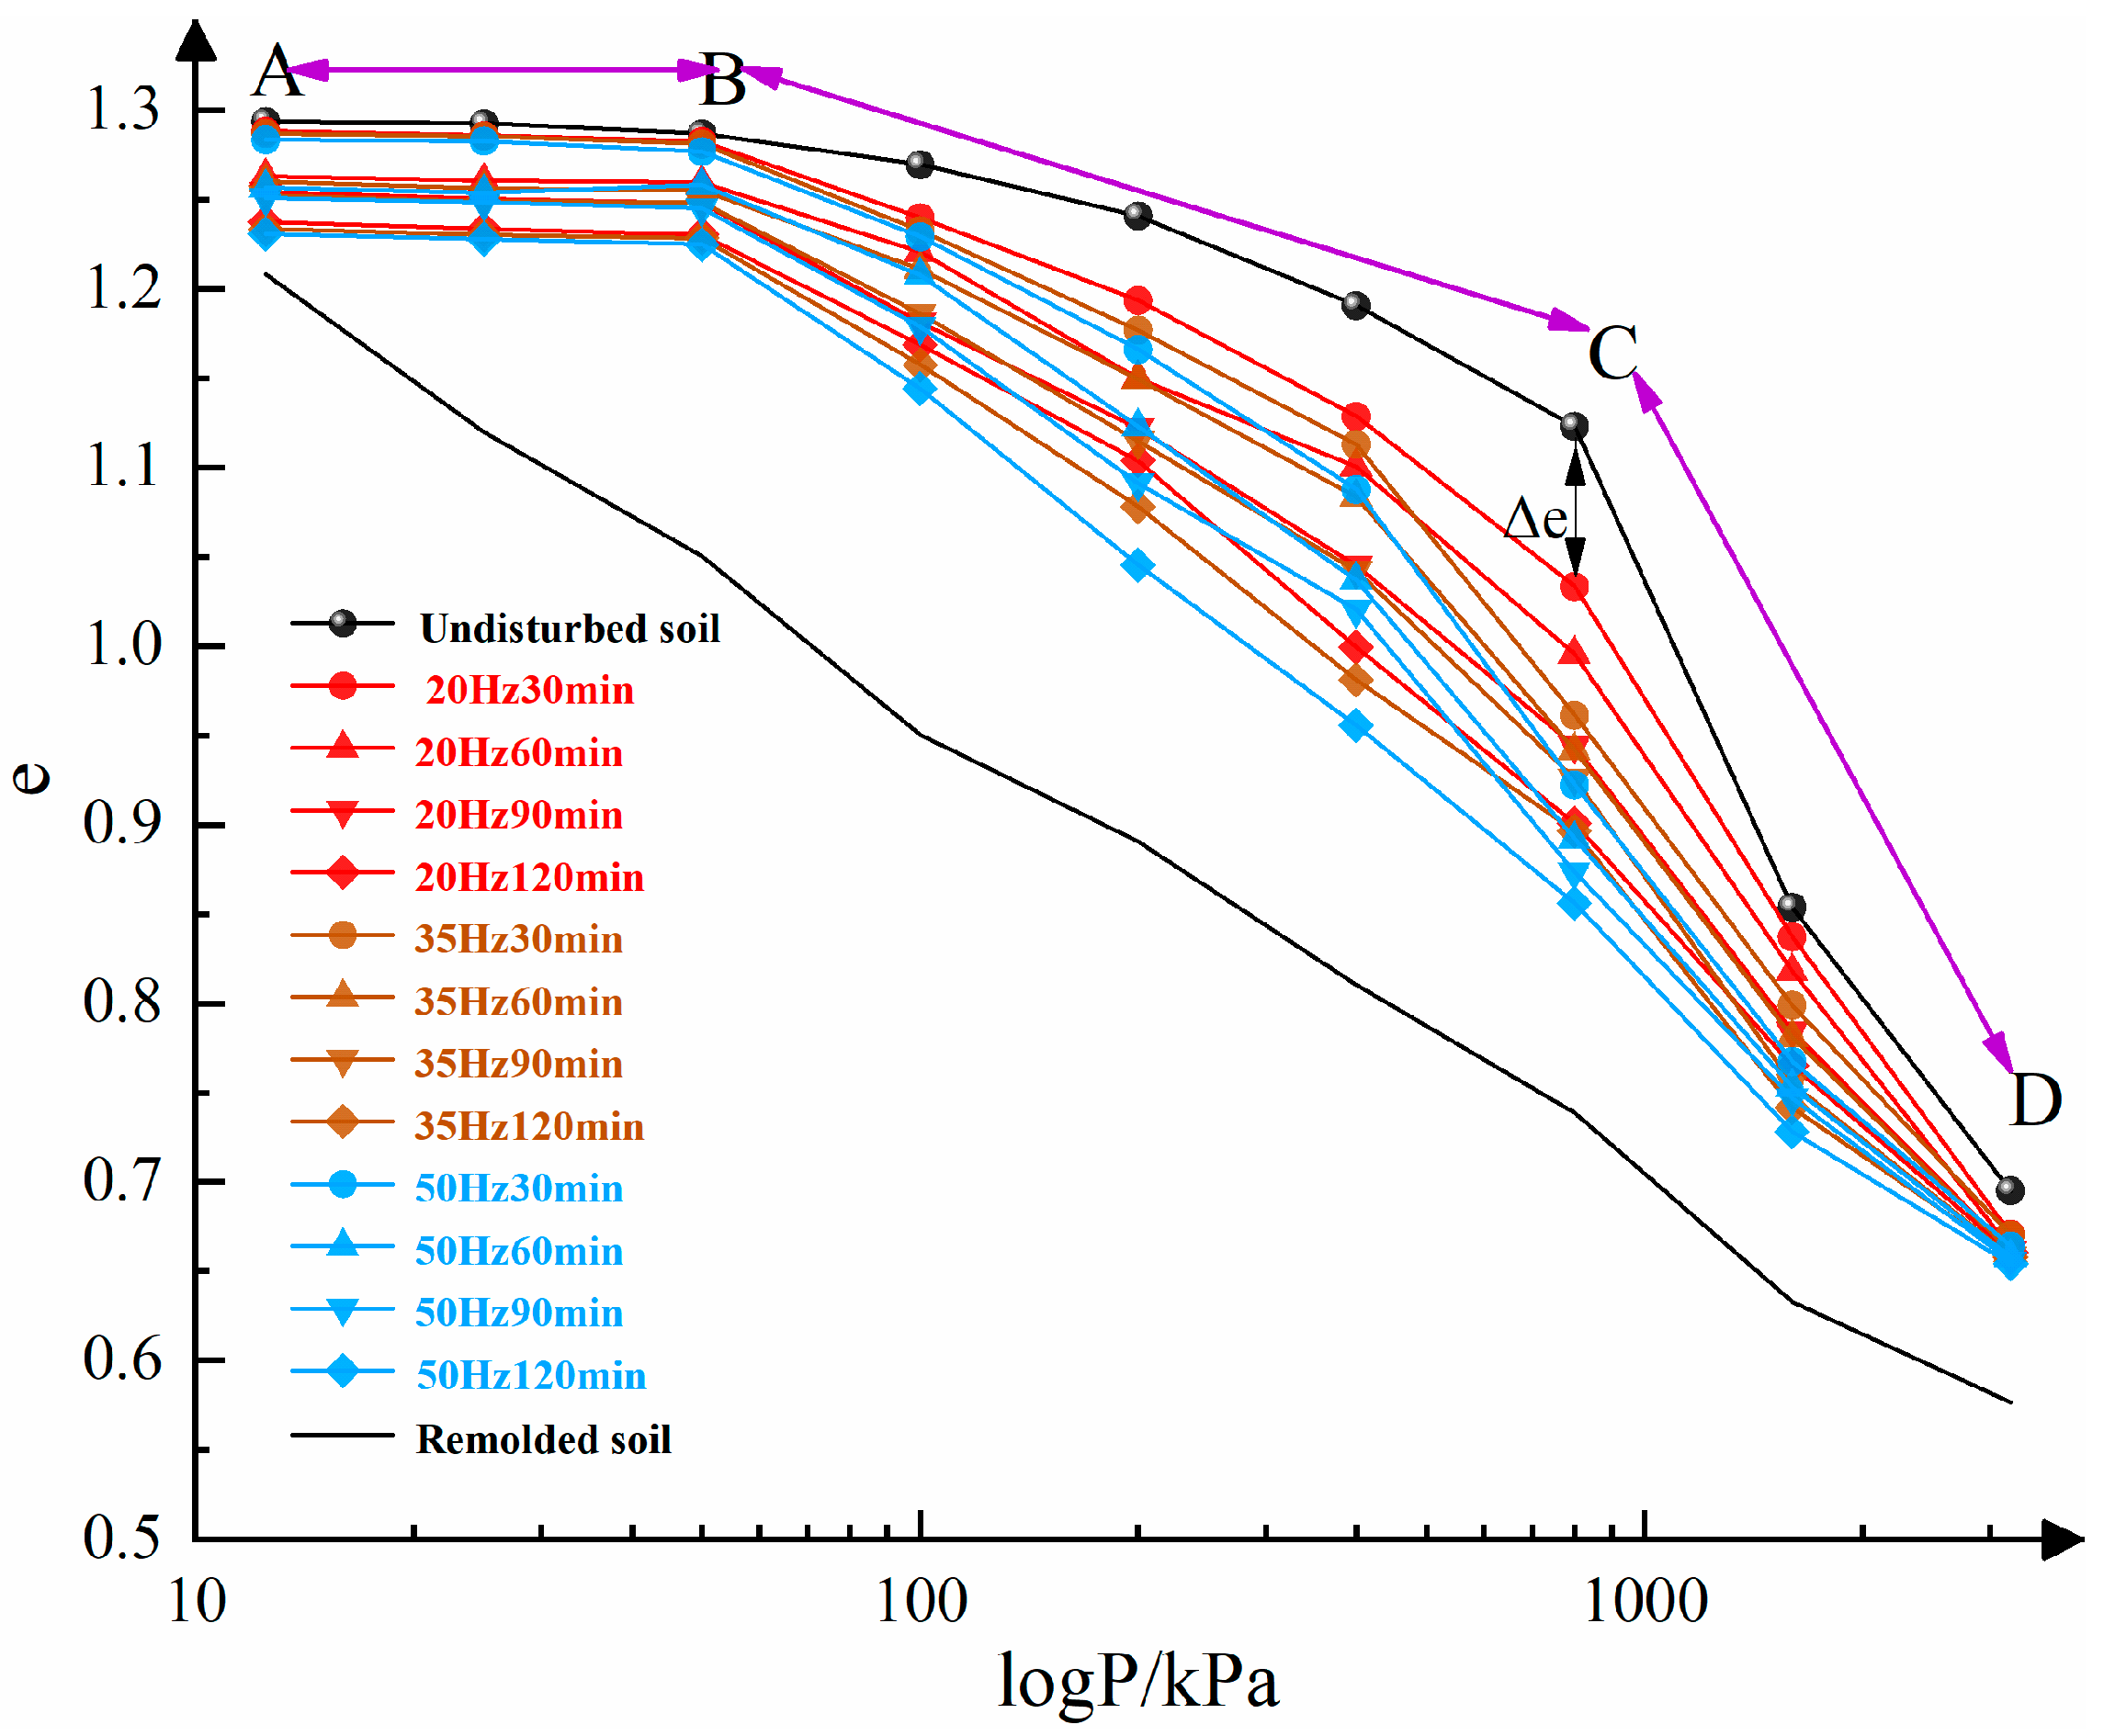
3.1. Analysis of the Deformation Process of Disturbed Soil with Different Vibration Durations and Frequencies

According to the above experimental scheme, the tests were conducted, and the settlement data of 14 groups of specimens under various pressures were obtained. The average values of each group of specimen data were taken for data calculation, and the void ratio values of each group of specimens under different overburden pressures were obtained. The e-logP curves of 14 groups of specimens were plotted using Origin 2018 software (see Figure 1). Figure 1 illustrates the relationship between the void ratio and overburden pressure for the 14 groups of specimens. As overburden pressure increased, all groups exhibited a consistent decrease in void ratio. Notably, the e-logP compression curves for undisturbed, disturbed, and remolded soil specimens exhibited distinct patterns: the compression curves for undisturbed and disturbed soil specimens displayed a “zigzag” configuration, whereas the remolded soil specimen curve was “linear.” This variation can be attributed to the unique sedimentation patterns of the Zhanjiang Group’s structurally strong clay during its soil-forming evolution, which impart strong cementation characteristics not typically observed in conventional soft soils [24]. These sedimentation and cementation factors contributed to the observed differences in the compression behaviors of the undisturbed, disturbed, and remolded soil specimens.
From Figure 1, it can also be observed that the compression curve of the undisturbed soil specimens was positioned above those of the other specimens. This resulted in a difference in void ratio under the same overburden pressure among the specimen groups, termed the incremental void ratio (Δe) [25]. By integrating the concept of Δe with the yield state of the soil, this study proposed the concept of structural yield in soils, categorizing the compression curves of undisturbed and disturbed soil specimens into three distinct stages [26].
  • Stage A–B: pre-structural yield:
Prior to structural yield, the compression curve exhibited a gentle slope, indicating that the primary soil structure remained intact and provided significant resistance to overburden pressure. The Δe caused by the structural characteristics was relatively small, and the deformation was predominantly elastic. For disturbed soil specimens subjected to longer vibration times and higher frequencies, the rate of pore compression increased but remained significantly lower than that of remolded soil specimens.
  • Stage B–C: structural yield:
During the structural yield process, the primary soil structure began to deteriorate, potentially accompanied by the formation of secondary structures. This resulted in a nonlinear change in the compression curve. The Δe gradually increased as the primary structure deteriorated, reaching a maximum at point C, which marked the structural yield of the soil. As the overburden pressure continued to increase, the skeletal structure of the clay was compromised, with larger voids gradually being filled, leading to predominantly plastic deformation. For undisturbed soil specimens, the compression rate accelerated significantly. For disturbed soil specimens exposed to longer vibration times and higher frequencies, the compression rate increase became even more pronounced.
  • Stage C–D: post-structural yield:
After structural yield, the primary structure was largely damaged. Under continued overburden pressure, the internal structure of the clay underwent transformation, which was primarily governed by resistance generated by secondary structures. This resulted in a linear change in the compression curve. As overburden pressure, vibration time, and vibration frequency increased, the disturbance level of the disturbed soil specimens intensified, leading to a gradual decrease in Δe toward zero as the primary structure deteriorated. At this stage, the compression curves of the undisturbed and disturbed soil specimens converged with that of the remolded soil specimens. Deformation was primarily dominated by particle sliding mechanisms.

3.2. Determination of Sample Disturbance Degree

To quantitatively describe the influence of internal engineering parameter variations on the deformation characteristics of soil under different disturbance levels, a calculation formula for the disturbance degree was introduced. As shown in Figure 1, the structural yield stress of the disturbed soil specimens decreased as the disturbance level increased (see Table 3). Therefore, the variation in structural yield stress was considered an appropriate parameter to characterize the disturbance degree of the specimens.
Scholars usually employ the traditional Cassagrande method to determine the production pressure. However, this method has flaws, especially in the difficulty of determining the maximum curvature point, which leads to errors. When using the double logarithmic coordinate system of ln(1 + e) − lg p, the compression curve can be well represented by two straight lines, and the intersection point of these two lines corresponds to the vertical pressure, which is the structural yield stress of the soil. Hong Z et al. [18] Based on the ln(1 + e) − lg p coordinate system, soil sample compression curves were analyzed, and a calculation formula for the degree of disturbance was further proposed, and it was defined as follows:
Disturbance   degree   D :   D = C C L B C C L R × 100 %
In this formula, CCLB and CCLR represent the slopes of the compression curves for disturbed soil specimens and remolded soil specimens, respectively, in the ln(1 + e) vs. −lg p coordinate system prior to yield.
The disturbance degree indicators for the 14 groups of specimens were quantitatively assessed (see Table 4). Due to unavoidable minor disturbances during the sampling process, the disturbance degree of the undisturbed soil specimens was found to be 10.4%. For specimens subjected to vibration, the disturbance degree exhibited a gradual increase with rising vibration frequency when the vibration duration remained constant. Conversely, at a fixed vibration frequency, the disturbance degree also progressively increased with extended vibration time.

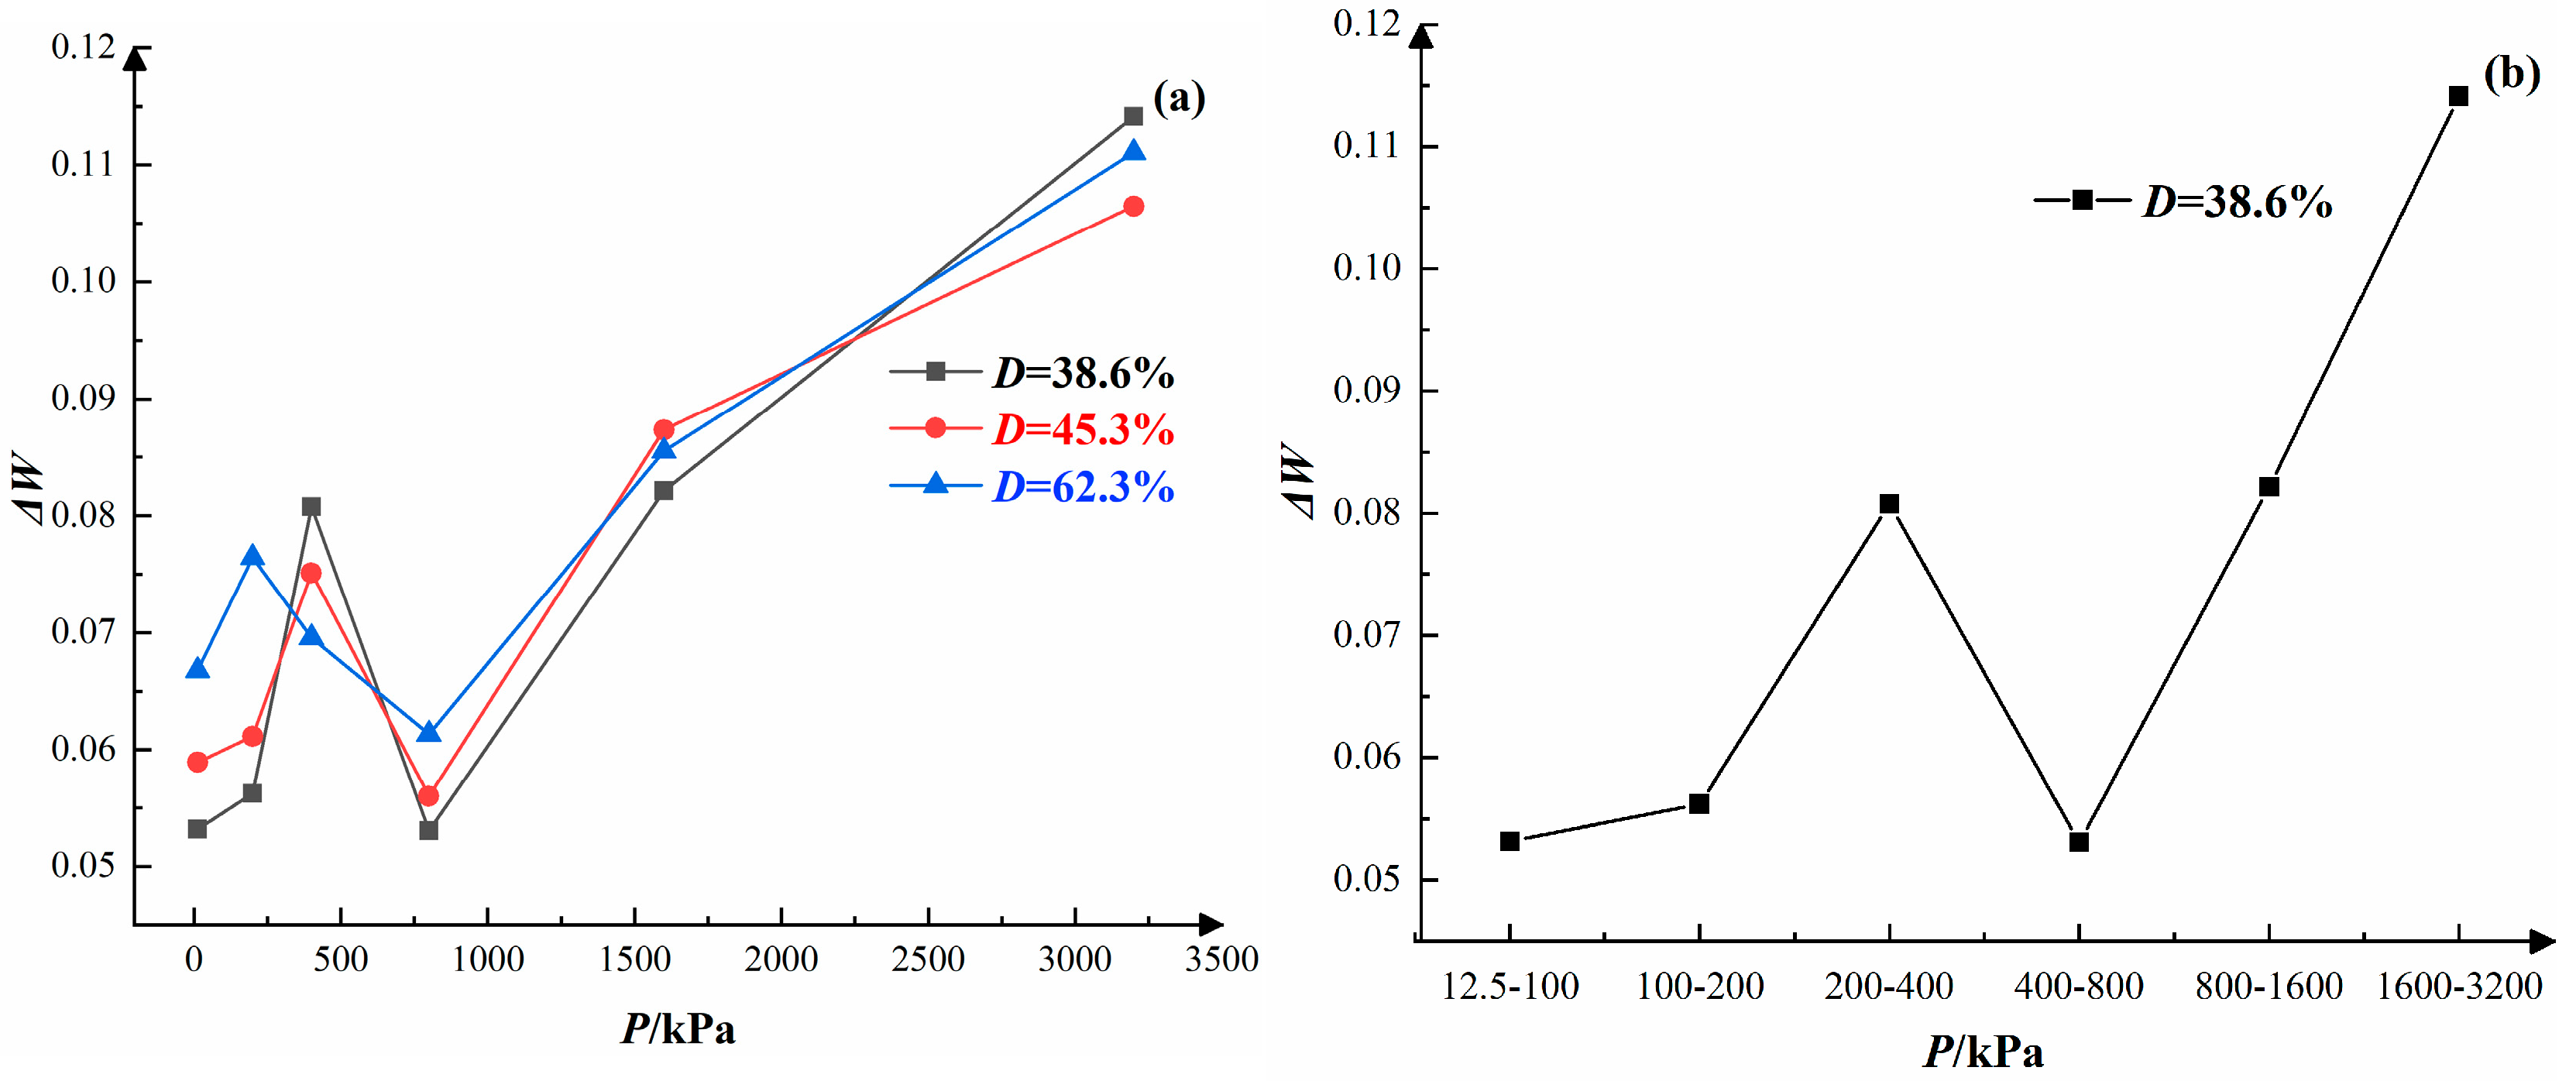
3.3. Evolution of Pore Structure Damage

The damage variable serves as both an internal parameter that influences the material’s constitutive relationship and a metric for quantifying the degree of disturbance [27]. To establish a connection between a given stress state applied to the structurally strong clay of the Zhanjiang Group and the degree of disturbance in the soil, we introduced the concept of the damage variable. The rate of change in the void ratio during axial strain was chosen to represent the degree of damage, with the degree of damage for undisturbed soil defined as 0% and that for remolded soil defined as 100%. This relationship can be expressed as follows:
Damage   degree   W :   W = e 0 e i e 0 × 100 %
In the formula, e0 represents the initial void ratio of the soil sample prior to any vibrational disturbance, while ei denotes the void ratio after consolidation has stabilized at a specific pressure level during the compression test.
In the one-dimensional compression test, each pressure level corresponded to a specific damage index W. Consequently, there was a variation in damage ΔW across different pressure levels. The change in ΔW as a function of pressure effectively characterized the damage evolution of the specimen under various loading conditions.
As illustrated in Figure 2, three types of disturbed soil samples demonstrated the evolution of ΔW as the pressure level increased. Taking the sample with a damage index of D = 38.6% as an example, the damage evolution can be categorized into three distinct stages:
  • Pressure range of 12.5 to 400 kPa:
During this phase, ΔW increased gradually with pressure. As pressure rose from 200 kPa to 400 kPa, the structural integrity of the sample began to deteriorate significantly. At 400 kPa, the degree of damage to the pore structure was markedly higher than at 200 kPa, resulting in an accelerated increase in ΔW.
  • Pressure range of 400 to 800 kPa:
In this range, the sample’s structural integrity was severely compromised, culminating in complete failure at 800 kPa. This led to a substantial reduction in void ratio at this pressure state, while the damage index W correspondingly increased. Despite the rapid rise in W between 200 and 400 kPa, the relative value of ΔW exhibited a decreasing trend.
  • High-pressure range of 800 to 3200 kPa:
In this stage, the overburden pressure significantly exceeded the specimen’s yield stress, which may result in the formation of new pore structures. The damage to these new pore structures increased linearly with pressure.

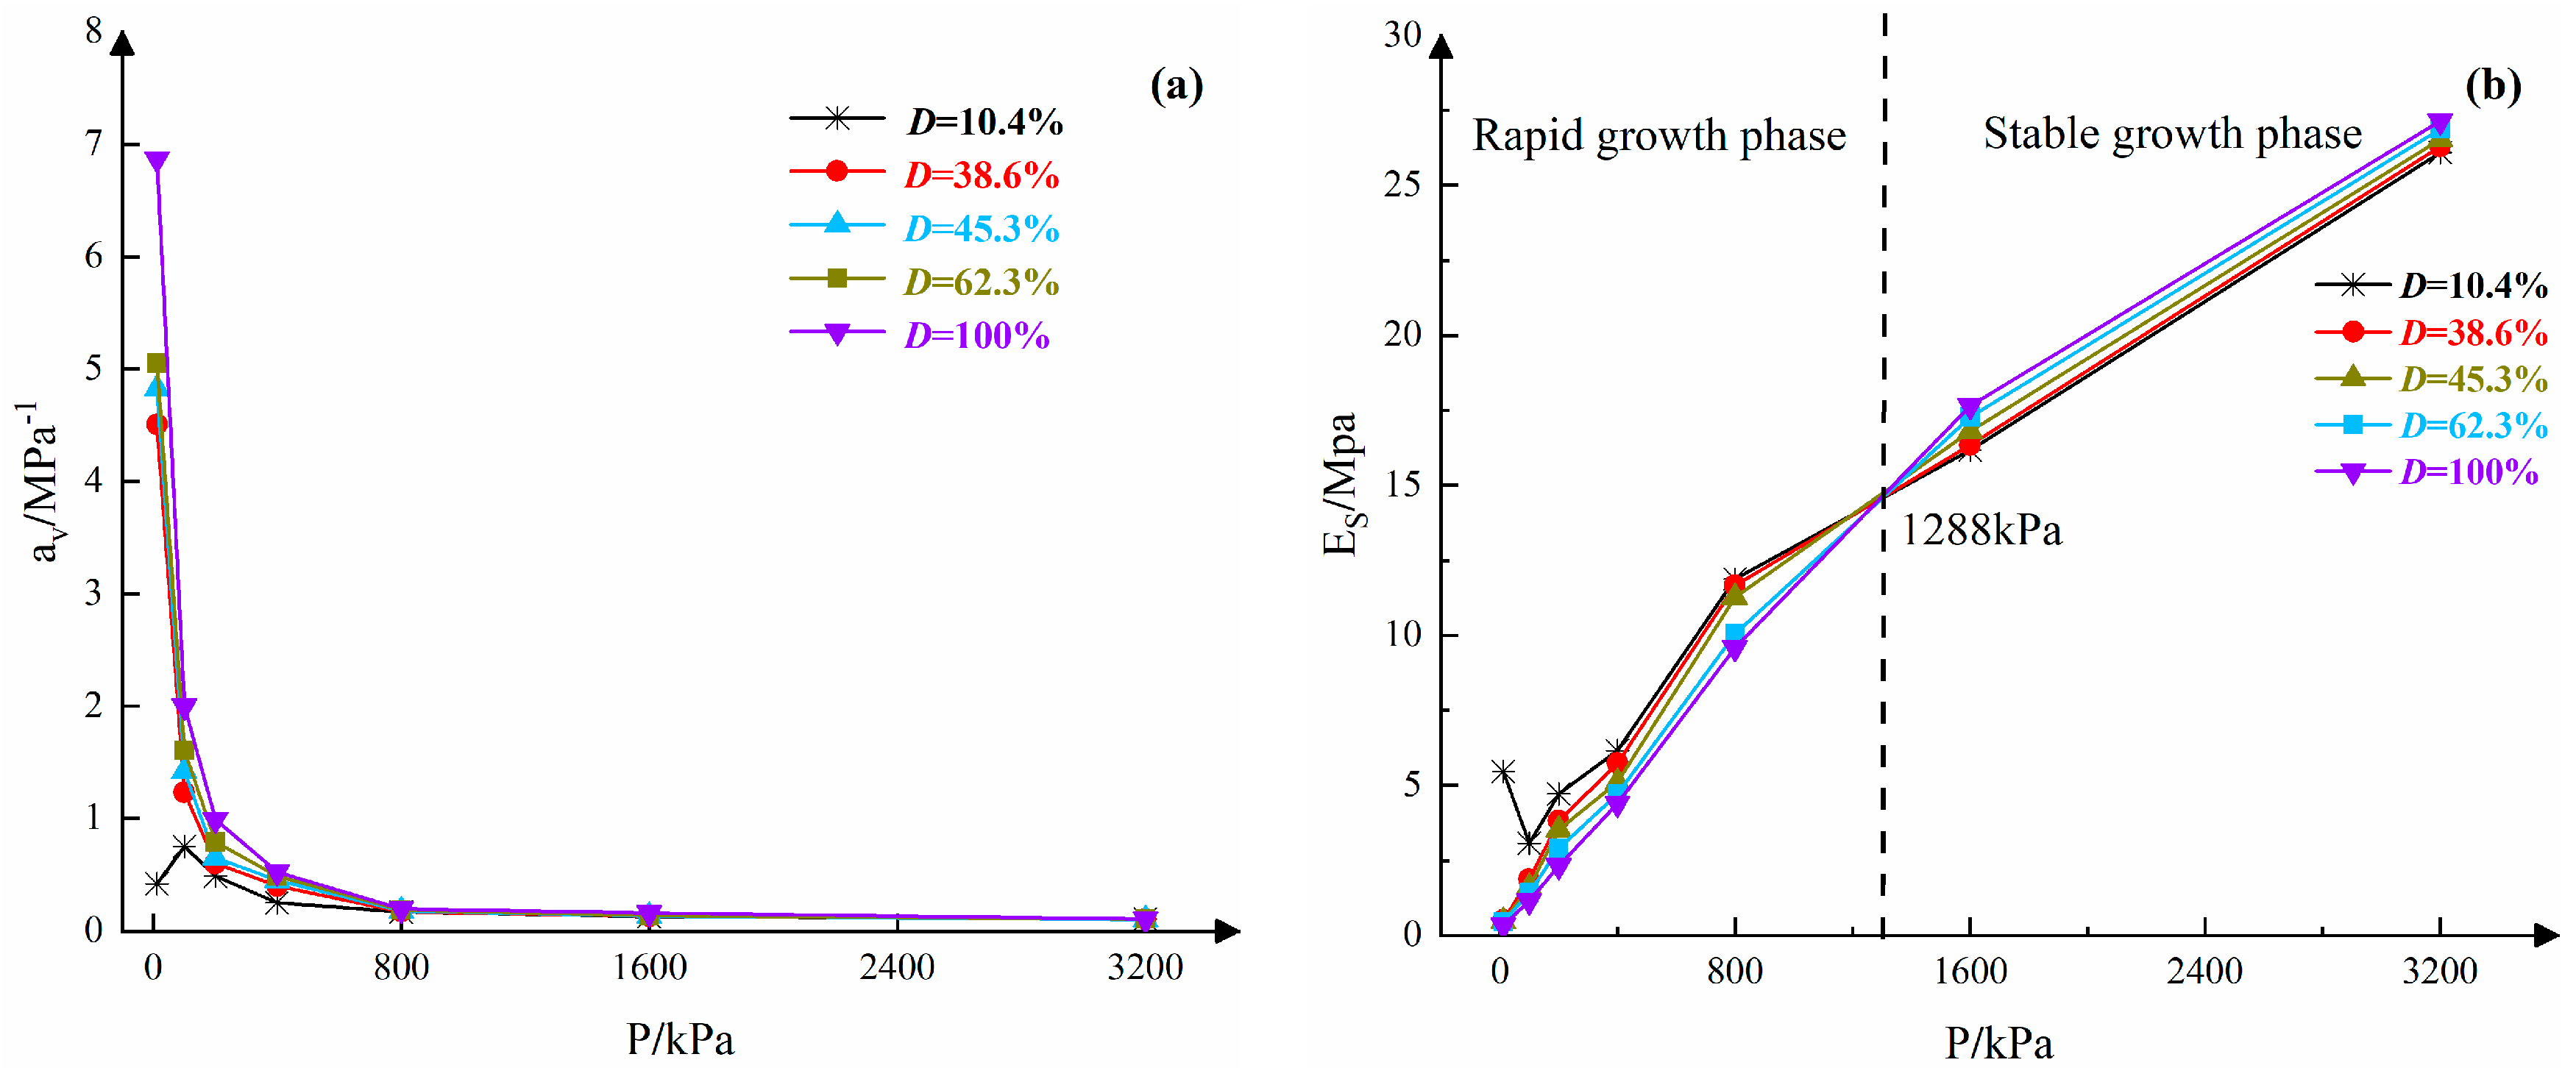
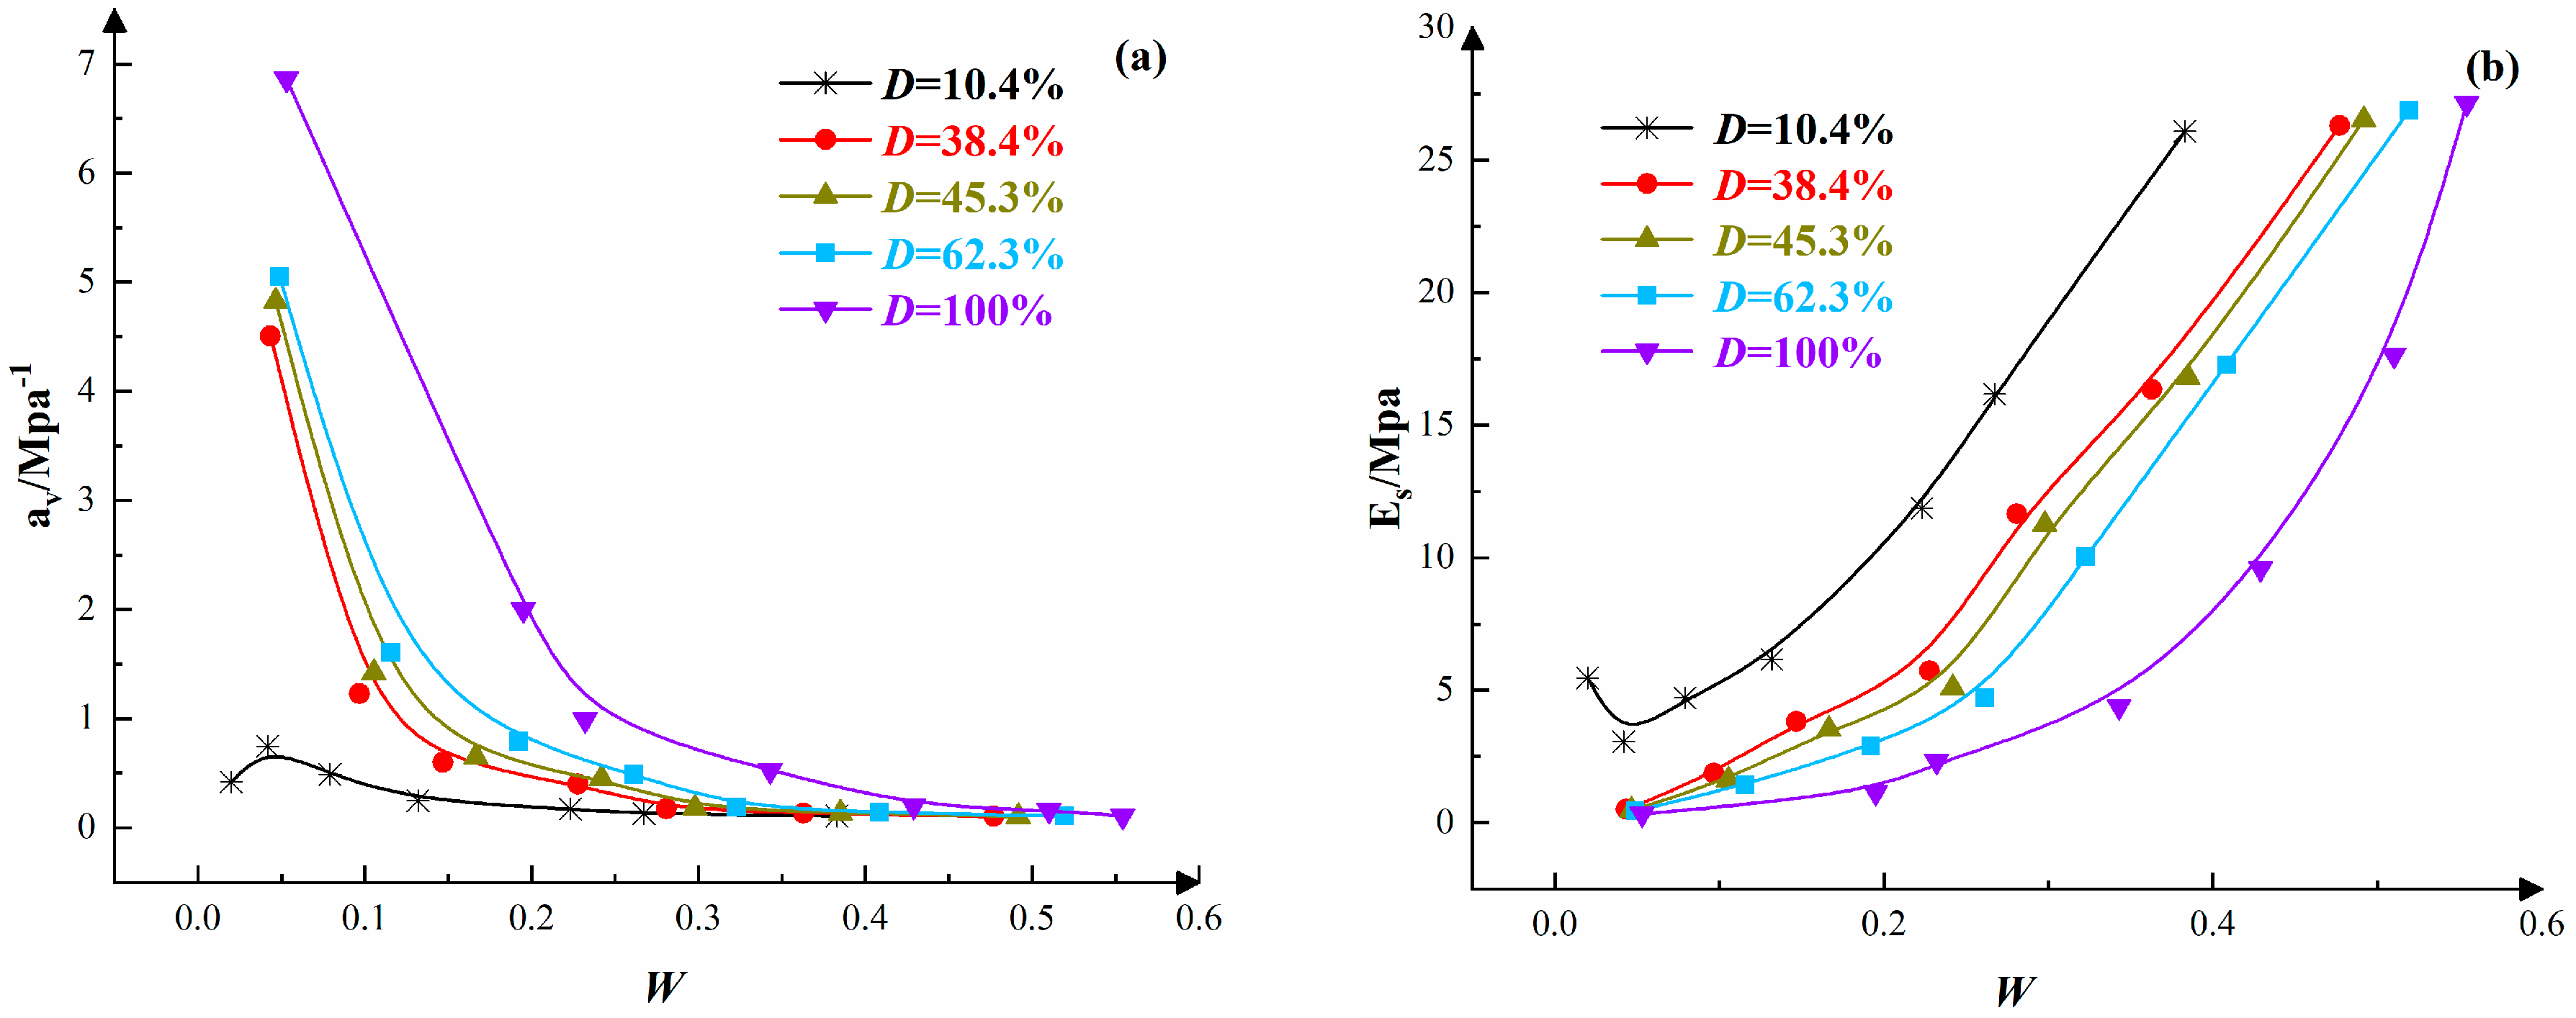
3.4. The Compressive Characteristics of Structurally Strong Clay at Different Disturbance Levels

To clearly illustrate the compressive characteristics of the soil during the disturbance process, samples with disturbance degrees of D = 10.4%, D = 38.6%, D = 45.3%, D = 62.3%, and D = 100% were selected. The relationships between the compression coefficient av, compressive modulus Es, and pressure P are presented in Figure 3, along with the relationships between the compression coefficient av, compressive modulus Es, and damage degree W in Figure 4.
From Figure 3a, it is evident that the compression coefficients of undisturbed and remolded soil samples exhibited different trends. The compression coefficient of the undisturbed soil sample was relatively low under lower overburden pressures. As the overburden pressure increased, the void ratio decreased more rapidly, leading to a gradual increase in the compression coefficient, which reached a peak value before decreasing due to structural effects. Once the pressure exceeded a certain threshold, the compression coefficients of the undisturbed soil samples converged with those of the remolded soil samples. In contrast, the compression coefficient of the remolded soil samples was initially higher but gradually decreased as the pressure increased.
Figure 3b illustrates the variation in the compressive modulus Es with pressure P for samples with different disturbance degrees. The compressive modulus of the structurally strong clay from Zhanjiang can be divided into two stages as the overburden pressure increased:
  • Rapid growth stage:
In the pressure range of 0 to 1288 kPa, the compressive modulus of the samples increased rapidly with pressure. For instance, for the sample with D = 100%, the compressive modulus rose from an initial value of 0.334 MPa to 14.7 MPa. At a pressure of 1288 kPa, all samples exhibited the same compressive modulus of 14.7 MPa. However, the sample with D = 10.4% behaved differently, showing a trend of initially decreasing and then increasing compressive modulus during the early compression phase. This behavior occurred because, when the overburden pressure was significantly lower than the structural yield stress, the undisturbed soil sample maintained its structure well, exhibiting strong resistance to deformation and making it less susceptible to compression. This resistance was closely related to the disturbance degree, gradually decreasing as the disturbance degree increased. Under the same pressure, samples with lower disturbance degrees had higher compressive moduli than those with higher disturbance degrees.
  • Stable growth stage:
In the pressure range of 1288 to 3200 kPa, the compressive modulus of the samples showed a consistent growth trend. Within this pressure range, the soil experienced the gradual destruction of the cemented structure formed during natural deposition as pressure increased, leading to a gradual loss of structural integrity. Consequently, the compressive moduli of samples with different disturbance degrees approached that of the remolded soil samples, indicating that the Es-P curves gradually converged towards the sample with D = 100%.
From Figure 4a, it can be observed that for the sample with a disturbance degree of D = 10.4%, the compression coefficient initially increased and then decreased as the damage degree W increased, particularly when W < 10%. This phenomenon occurred because, at low disturbance and damage degrees, the sample with a high void ratio was significantly affected by pressure, leading to a rapid decrease in void ratio and a slight increase in the compression coefficient. Subsequently, under the influence of structural effects and compaction, the compression coefficient gradually decreased. For samples with disturbance degrees D > 38.4%, the compression coefficient steadily decreased with increasing damage degree, with a more pronounced reduction observed when W < 20%; this trend was especially evident in samples with higher disturbance degrees. Regardless of the disturbance degree, all samples exhibited a similar compressibility at higher damage degrees.
From Figure 4b, it is evident that when the damage degree W > 20%, the compressive modulus significantly increased with the rising damage degree, particularly for samples with lower disturbance degrees, which showed a more pronounced increasing trend. This behavior can be attributed to the fact that, with a constant disturbance degree, samples with higher damage degrees experience a greater rate of change in void ratio, resulting in a reduction in the existing void ratio. This leads to closer particle contact and increased density of the soil sample, thereby enhancing its resistance to compression and consequently increasing the compressive modulus [28].
From Table 5, it can be seen that the correlation coefficients R2 of the fitting curves for the compression coefficients of different disturbed soil samples with respect to the damage degree all reached 0.99, indicating a good fit. The relationship between the compression coefficient av and the damage degree W for the structurally strong clay from Zhanjiang conformed to an exponential function given by the equation: a v = a e b E + c , where a, b, and c are structural damage coefficients of the soil.
Table 6 indicates that the correlation coefficients R2 of the fitting curves for the compressive modulus of different disturbed soil samples with respect to the damage degree all reached 0.95, demonstrating a good fit. The relationship between the compressive modulus Es of the structurally strong clay from Zhanjiang and the damage degree W conformed to the following exponential function: E S = A 1 W 2 + A 2 W + A 3 , where A1, A2, and A3 represent structural damage coefficients of the soil related to the disturbance degree.

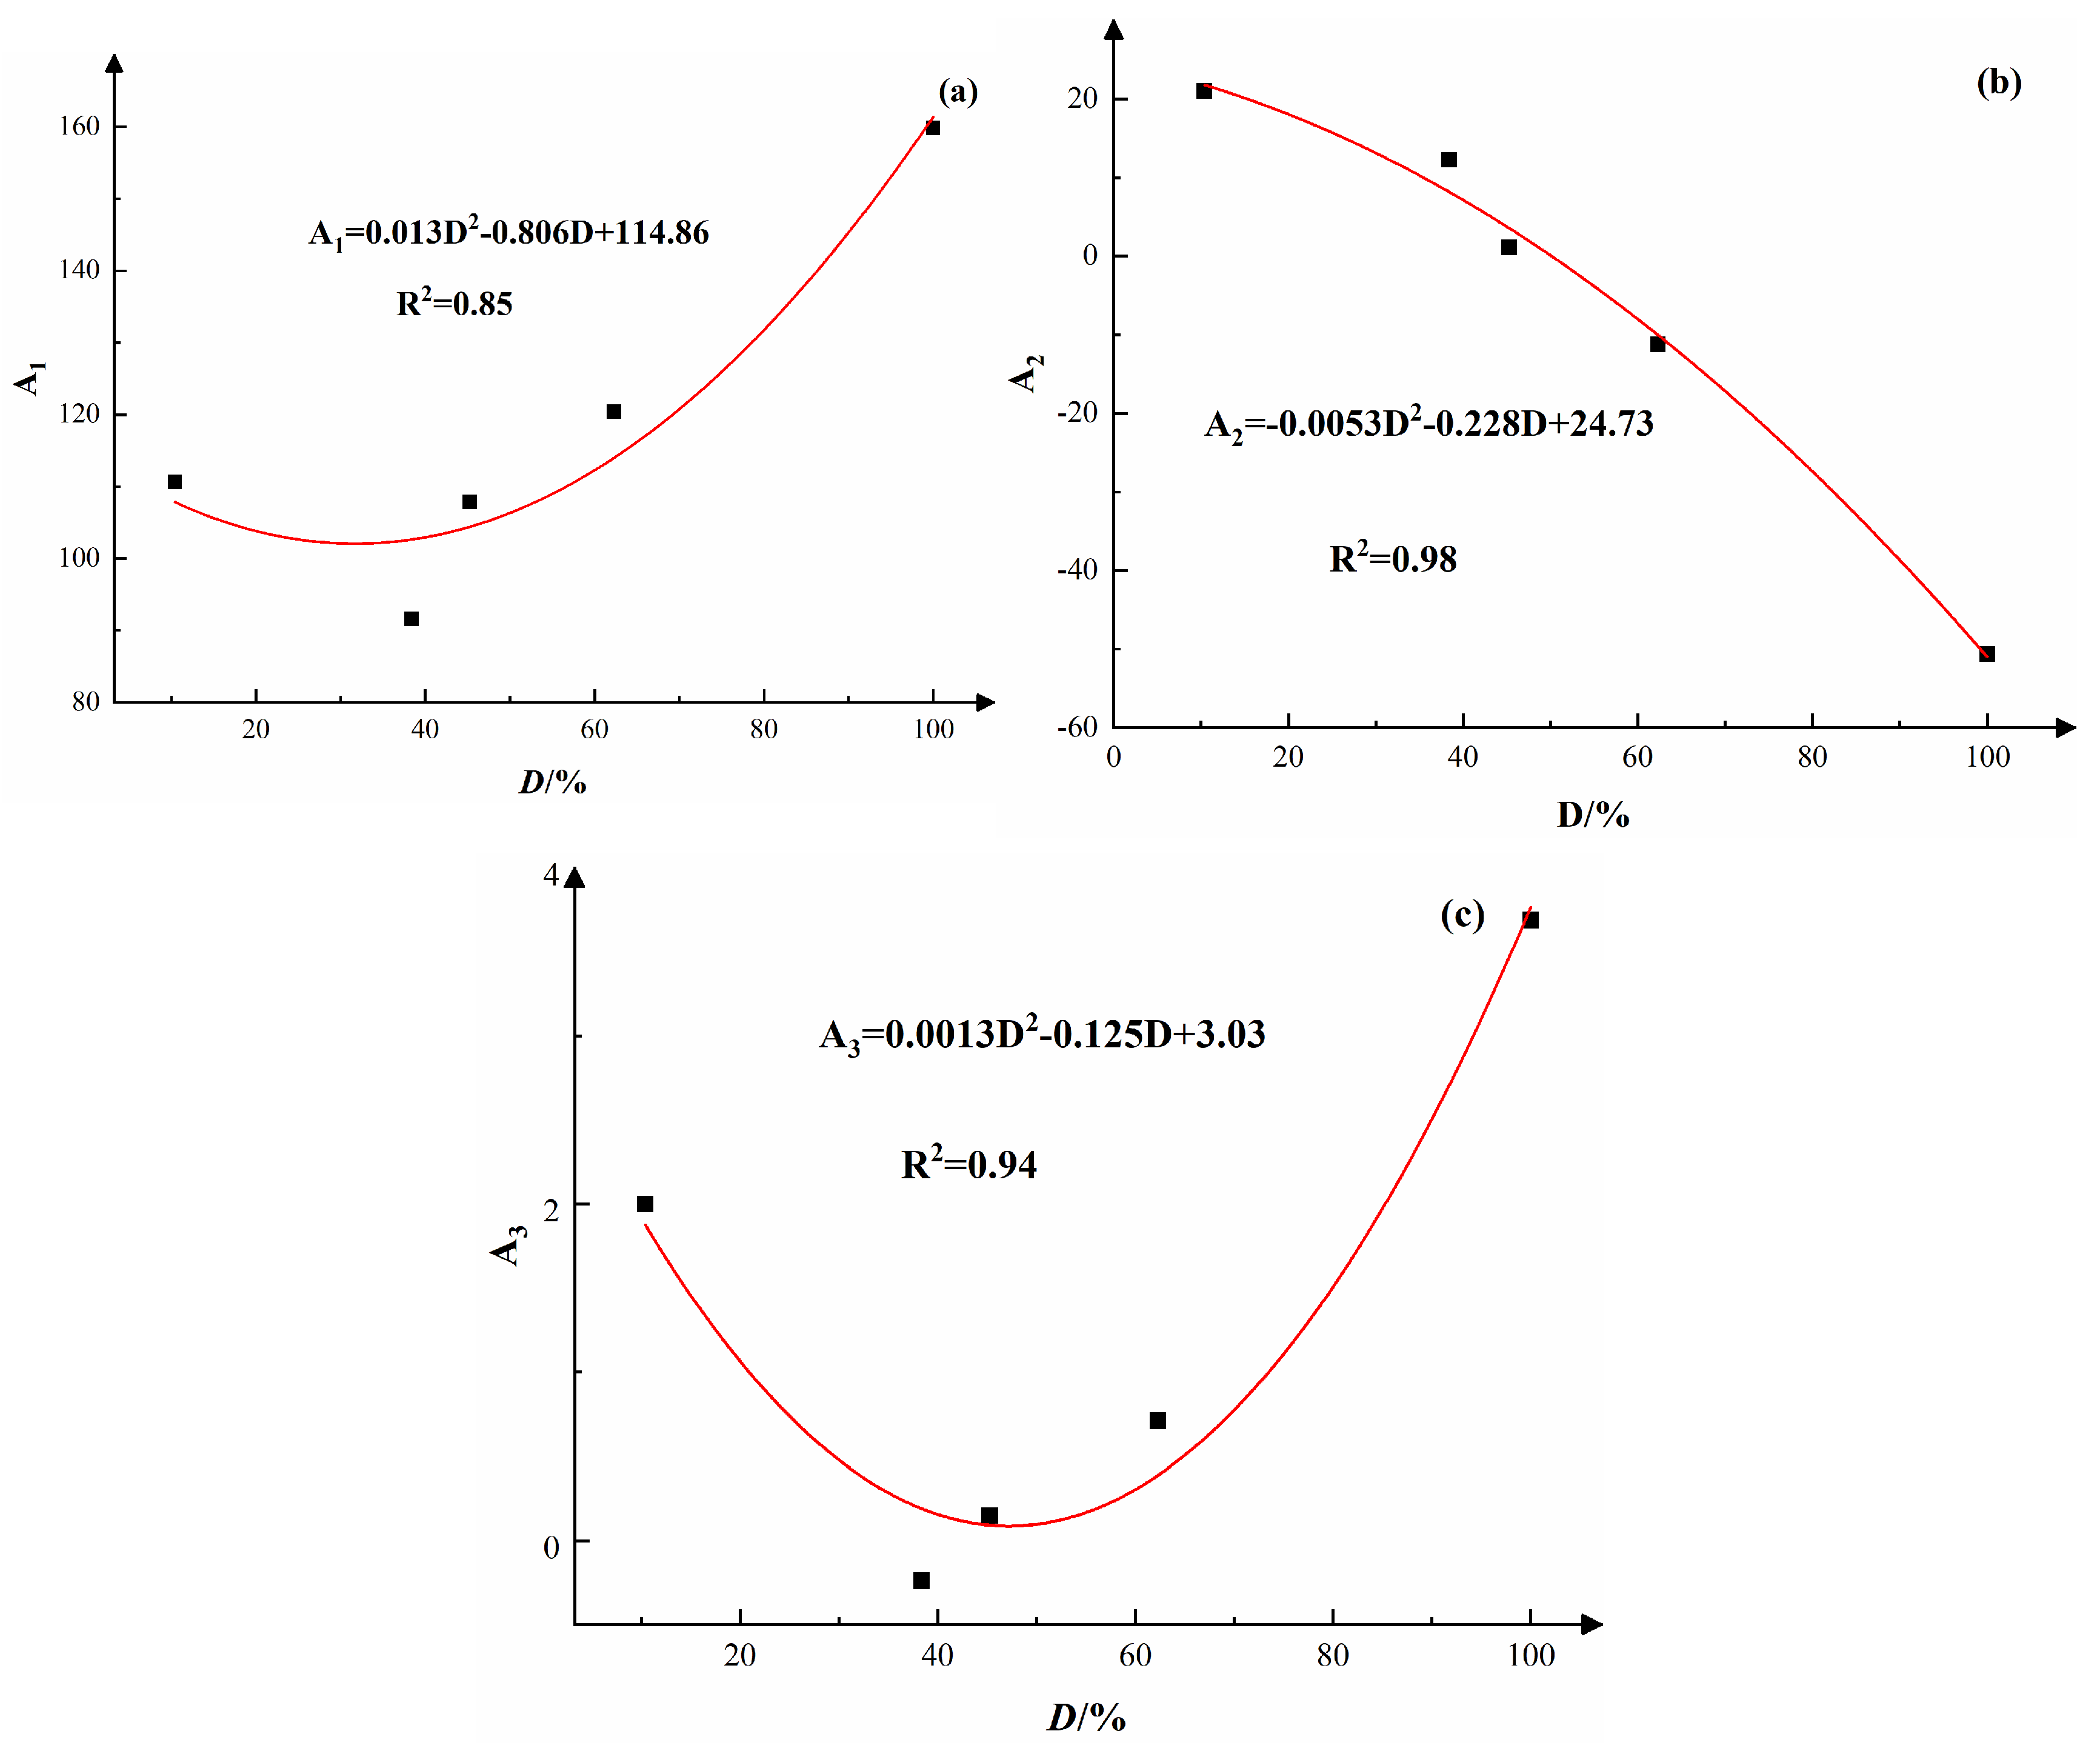
3.5. Establishment of an Empirical Formula for the Deformation Modulus Considering Soil Damage and Disturbance Factors

The deformation modulus E0 of soil is a compressibility parameter obtained through in situ load tests, which accurately reflects the deformation characteristics of natural soil layers. However, this method has several drawbacks, including cumbersome equipment, time consumption, and significant financial investment. Furthermore, conducting load tests on deep soil layers presents technical challenges. As a result, it is often necessary to estimate the deformation modulus based on available data for the compressive modulus. The relationship for converting the compressive modulus to the deformation modulus is as follows:
E 0 = ( 1 2 μ 2 1 μ ) × E S ,
In this equation, μ represents the Poisson’s ratio of the clay, which can be estimated based on the state of the clay, with empirical values ranging from 0.25 to 0.42.
By incorporating empirical formulas for the compressive modulus that account for damage under various disturbance conditions, the following can be obtained:
E 0 = ( 1 2 μ 2 1 μ ) × ( A 1 W 2 + A 2 W + A 3 ) ,
In the equation, A1, A2, and A3 represent structural damage coefficients that are related to the magnitude of disturbance.
To clarify the specific values of A1, A2, and A3 under each disturbance level, the structural damage coefficients A1, A2, and A3 were fitted with the disturbance degree D. The fitting results are shown in Figure 5.
The fitting results of the soil structure damage coefficients A1, A2, and A3 with the disturbance degree D were substituted into Equation (4) to derive the empirical formula for calculating the deformation modulus considering damage:
E 0 = ( 1 2 μ 2 1 μ ) × { ( 0.013 D 2 0.806 D + 114.86 ) W 2 + ( 0.005 D 2 0.228 D + 24.73 ) W + ( 0.0013 D 2 0.125 D + 3.03 ) } ,

3.6. Validation of the Model

To validate the model, experimental data from samples with unused disturbance degrees of D = 30.2% and D = 42.7% were utilized. By substituting these disturbance degrees into Equation (5), the model curves corresponding to disturbance degrees of D = 30.2% and D = 42.7% for W-E0 can be obtained as follows:
E 0 = ( 1 2 μ 2 1 μ ) × { ( 0.013 × 30.2 2 0.806 × 30.2 + 114.86 ) W 2 + ( 0.005 × 30.2 2 0.228 × 30.2 + 24.73 ) W + ( 0.0013 × 30.2 2 0.125 × 30.2 + 3.03 ) } ,
E 0 = ( 1 2 μ 2 1 μ ) × { ( 0.013 × 42.7 2 0.806 × 42.7 + 114.86 ) W 2 + ( 0.005 × 42.7 2 0.228 × 42.7 + 24.73 ) W + ( 0.0013 × 42.7 2 0.125 × 42.7 + 3.03 ) }
The experimental results of the samples with disturbance degrees D = 30.2% and D = 42.7% were compared with the model’s calculated results (see Figure 6). As shown in Figure 6, the model’s calculations closely aligned with the experimental results, indicating that the established model effectively simulated the relationship between the disturbed, damage state of the Zhanjiang Group structured clay and the deformation modulus.

4. Conclusions

To clearly illustrate the unique deformation characteristics of structured clay, the authors conducted a series of one-dimensional compression tests on Zhanjiang structured clay samples with varying disturbance degrees. The main conclusions are as follows:
1.
Before the soil reached structural yield, the compression index significantly decreased while the compression modulus sharply increased. After reaching structural yield, the compression index stabilized. Concurrently, the change in damage, ΔW, exhibited a dynamic evolution pattern characterized by an initial increase, followed by a decrease, and then a subsequent increase. Under identical overburden pressure conditions, samples with higher disturbance degrees demonstrated larger compression coefficients, resulting in greater compressibility.
2.
For samples with the same damage degree, those exhibiting greater disturbance degrees showed larger compression coefficients, whereas their compression moduli were relatively smaller. Furthermore, the compression coefficient increased exponentially with the rise in damage degree, while the compression modulus decreased according to a quadratic function as the damage degree increased.
3.
By analyzing the variation characteristics of the compression modulus and damage degree of disturbed soil samples during one-dimensional compression tests and integrating the conversion relationship between the deformation modulus and compression modulus, this study established an empirical formula for calculating the deformation modulus that accounts for soil sample damage. This formula was validated using two additional sets of experimental data, confirming its effectiveness and providing a solid theoretical foundation and practical reference for the settlement calculations of disturbed, damaged structured clay foundations.

Author Contributions

Writing—original draft, writing—review and editing, and methodology, Y.S.; writing—review and editing and supervision, B.T.; software, Y.S. and Y.W.; data curation, Y.X.; writing—original draft, Y.S. All authors have read and agreed to the published version of the manuscript.

Funding

This research was funded by the Guangxi Natural Science Foundation, China [Grant No. 2024GXNSFAA010450].

Institutional Review Board Statement

Not applicable.

Informed Consent Statement

Not applicable.

Data Availability Statement

The original contributions presented in the study are included in the article, further inquiries can be directed to the corresponding author.

Conflicts of Interest

The authors declare that they have no known competing financial interests or personal relationships that could have appeared to influence the work reported in this paper.

References

  1. Liu, T.F.; Wu, Y.D.; Zhou, Y.F. Experimental study on disturbance deformation of soil sampler penetration based on transparent. Hohai Univ. (Nat. Sci.) 2024, 52, 77–83. [Google Scholar]
  2. Wang, Z.L.; Qu, J.A.; Ding, Z.D. Experimental study on the effect of structure on the compression characteristics of peaty soil layer in Kun Ming. J. Jiangsu Univ. (Nat. Sci. Ed.) 2018, 39, 337–342+354. [Google Scholar]
  3. Dong, J.; Chen, C.; Dong, M.; Lu, B.; Guan, Y.; Zhao, W. Influence of disturbance degree on the propped excavation stability in sandy soil in Shenyang, China. Undergr. Space 2023, 10, 150–165. [Google Scholar] [CrossRef]
  4. Jiao, N.; Sun, S.; Liu, J.; Guo, Q.; Ding, J.; Wan, X. Analysis of existing railway deformation caused by double shield tunnel construction in soil–rock composite stratum. Energy Rep. 2023, 9, 159–165. [Google Scholar] [CrossRef]
  5. Liang, Y.J.; Tan, G.; Liu, L.L. Analysis of deformation characteristics of undisturbed loess with different moisture content under lateral unloading conditions. Sci. Technol. Eng. 2023, 23, 7494–7500. [Google Scholar]
  6. Zhong, H.; Guan, C.H.; Liu, L.L. Study on soil strength and deformation characteristics with different moisture content in typical areas of loess foundation pit. Nanjing Univ. Technol. (Nat. Sci. Ed.) 2024, 46, 205–215. [Google Scholar]
  7. Wu, J.; Yang, N.; Li, P.; Yang, C. Influence of moisture content and dry density on the compressibility of disturbed loess: A case study in Yan’an City, China. Sustainability 2023, 15, 6212. [Google Scholar] [CrossRef]
  8. Wang, Y.; Yang, P.; Hu, Y.D. Experimental study on strength and deformation characteristics of intact loess with different water contents. J. Xi’an Univ. Arch. Tech. (Nat. Sci.) 2022, 54, 325–330. [Google Scholar]
  9. Tang, B.; Zhang, Y.M.; Wang, T. Experimental study on deformation characteristics of structural clay in Zhanjiang Formation. Sci. Technol. Eng. 2016, 16, 247–252. [Google Scholar]
  10. Yang, A.W.; Zheng, Y.X.; Xiao, M. An experimental study of the long-term deformation characteristics of artificial structured soft clay. Hydrogeol. Eng. Geol. 2019, 46, 133–140. [Google Scholar]
  11. Wang, J.L.; Xu, K. Deformation and dynamic behavior of foundation soil under impact loads. Sci. Technol. Eng. 2019, 20, 2411–2416. [Google Scholar]
  12. Lei, H.; Yang, X.; Feng, S.; Ma, T. Softening and deformation characteristics of Tianjin soft soil under principal stress rotation induced by traffic loading. Soil Dyn. Earthq. Eng. 2023, 164, 107587. [Google Scholar] [CrossRef]
  13. Chen, Z.J.; Zhao, R.D.; Chen, W.B.; Wu, P.C.; Yin, J.H.; Feng, W.Q. Effects of temperature on the time-dependent compression and shear behaviour of a soft marine clayey soil. Eng. Geol. 2023, 314, 107005. [Google Scholar] [CrossRef]
  14. Liu, J.; Xu, H.; Tao, Y.; Lyu, Q. Effects of clay content and subfreezing temperature on the freeze–thaw deformation properties of clayey soils. Catena 2024, 239, 107916. [Google Scholar] [CrossRef]
  15. Miao, Y.H.; Fan, J.Q. Influence of Vibration Frequency and Time onCompression Characteristics of Soft Clay Under Disturbance. J. Univ. Jinan (Sci. Technol.) 2022, 36, 261–266. [Google Scholar]
  16. Chung, S.G.; Kwag, J.M.; Giao, P.H.; Baek, S.H.; Prasad, K.N. A study of soil disturbance of Pusanclays with reference to drilling, sampling and extruding. Geotechnique 2004, 54, 61–65. [Google Scholar] [CrossRef]
  17. Schmertmann, J.H. The undisturbed consolidation behavior of clay. Trans. Am. Soc. Civ. Eng. 1955, 120, 1201–1227. [Google Scholar] [CrossRef]
  18. Hong, Z.; Onitsuka, K. A method of correcting yield stress and compression index of Ariake clays for sample disturbance. Soils Found. 1998, 38, 211–222. [Google Scholar] [CrossRef]
  19. Hvorslev, M.J. Subsurface Exploration and Sampling of Soils for Civil Engineering Purposes; National Academies: Washington, DC, USA, 1949. [Google Scholar]
  20. Xu, Y.F.; Chen, J.S.; Fu, D.M. Effect of shield tunneling on mechanical properties of soils. Chin. J. Mech. Eng. 2003, 22, 1174–1179. [Google Scholar]
  21. GB/T 50123-2019; Ministry of Housing and Urban-Rural Development of the People’s Republic of China. Geotechnical Test method Standard. China Planning Press: Beijing, China, 2019.
  22. Xie, Y.; Tang, B.; Shi, Y.; Liu, S.; Hu, J.; Zhang, B. The Influence of Vibration Frequency and Vibration Duration on the Mechanical Properties of Zhanjiang Formation Structural Clay. Appl. Sci. 2024, 14, 8262. [Google Scholar] [CrossRef]
  23. Shi, Z.H.; Tu, Z.Z.; Qian, J.G.; Huang, M.S. Shanghai deep soil samples of clayey soil disturbance evaluation method. J. Geotech. Eng. 2024, 1–10. [Google Scholar]
  24. Zhang, X.W.; Kong, L.W.; Guo, A.G.; Tu, Y. Physical and mechanical indexes and correlation analysis of clay with noticeable structures in Zhanjhiang area. J. Eng. Geol. 2011, 19, 447–454. [Google Scholar]
  25. Yin, J. The influence of structural compression characteristics of natural soft clay soil. Rock Soil Mech. 2012, 33, 48–52. [Google Scholar]
  26. Wang, L.Z.; Li, L.L. Construction disturbance of structural soil and its influence on settlement. Chin. J. Geotech. Eng. 2007, 5, 697–704. [Google Scholar]
  27. Zhang, T.W.; Xu, H.B.; Deng, Y.F. Structural soft clay damage variable and the disturbance degree of correlation study. Rock Soil Mech. 2015, 4, 958–964. [Google Scholar]
  28. Zhang, B.H.; Liu, S.Y.; Xie, Y.H.; Tang, B.; Huan, W.H. Study on Mechanical Properties and Microscopic Mechanism of Structural Clay in Zhanjiang Formation Under Vibration Disturbance. J/OL. Water Resources and Hydropower Technology (Both in English and Chinese). 2024, pp. 1–14. Available online: http://kns.cnki.net/kcms/detail/10.1746.TV.20240128.1432.002.html (accessed on 14 July 2024).
Figure 1. e-logP curves of each group of samples under different vibration frequencies and times.
Applsci 15 02969 g001
Figure 2. The evolution law of the change in damage degree ΔW with pressure P. (a) The relationship between the disturbance degree ΔW and pressure P for three types of disturbed samples. (b) The relationship between ΔW and pressure P for samples with a disturbance degree of 38.6%.
Applsci 15 02969 g002
Figure 3. Variation in compression parameters with overburden pressure for different disturbance degrees. (a) The relationship between the compression coefficient av and pressure P for samples with five different disturbance degrees. (b) The relationship between the compressive modulus Es and pressure P for samples with five different disturbance degrees.
Applsci 15 02969 g003
Figure 4. Variation in compression-related parameters with the damage degree of samples with different disturbance degrees. (a) The relationship between the compression coefficient av and the disturbance degree D, as well as the damage degree W. (b) The relationship between the compressive modulus Es and the disturbance degree D, as well as the damage degree W.
Applsci 15 02969 g004
Figure 5. Relationship between structural damage coefficients A1, A2, and A3 and disturbances. (a) Fitting relationship between the structural damage coefficient A1 and the disturbance degree. (b) Fitting relationship between the structural damage coefficient A2 and the disturbance degree. (c) Fitting relationship between the structural damage coefficient A3 and the disturbance degree.
Applsci 15 02969 g005
Figure 6. Comparison between experimental data and model calculation results. (a) Comparison of experimental data and model calculation results for the sample with D = 30.2%. (b) Comparison of experimental data and model calculation results for the sample with D = 42.7%.
Applsci 15 02969 g006
Table 1. Physical and mechanical indexes of strongly structured clay.
Density ρ/(g·cm−3)Void Ratio eWater Content ω/%Liquid Limit WL/%Plastic Limit Wp/%Sensitivity ST
1.741.2947.2252.31%26.48%4.01
Table 2. Vibration test plan.
Sample GroupVibration Time/(min)Vibration Frequency/(HZ)
A1~A330 min20 HZ
A4~A660 min20 HZ
A7~A990 min20 HZ
A10~A12120 min20 HZ
A13~A1530 min35 HZ
A16~A1860 min35 HZ
A19~A2190 min35 HZ
A22~A24120 min35 HZ
A25~A2730 min50 HZ
A28~A3060 min50 HZ
A31~A3390 min50 HZ
A34~A36120 min50 HZ
Table 3. Yield stress values of 12 disturbed soil samples.
Sample GroupA1~A3A4~A6A7~A9A10~A12A13~A15A16~A18
Yield Pressure Py/kPa779.41751.09726.15705.38756.62718.34
Sample GroupA19~A21A22~A24A25~A27A28~A30A31~A33A34~A36
Yield Pressure Py/kPa703.12682.23726.15687.34651.44617.65
Table 4. Disturbance index of samples based on vibration testing.
Sample GroupCCLBCCLRD/%
Undisturbed soil−0.0145−0.140010.4%
A1~A3−0.0423−0.140030.2%
A4~A6−0.0445−0.140031.8%
A7~A9−0.0466−0.140033.3%
A10~A12−0.0541−0.140038.6%
A13~A15−0.0439−0.140031.4%
A16~A18−0.0501−0.140035.80%
A19~A21−0.0562−0.140040.10%
A22~A24−0.0634−0.140045.30%
A25~A27−0.0466−0.140033.30%
A28~A30−0.0598−0.140042.70%
A31~A33−0.0714−0.140051.00%
A34~A36−0.0872−0.140062.30%
Remolded soil−0.1400−0.1400100.00%
Table 5. Fitting results of the relationship between compression coefficient av and damage degree E of samples with different disturbance degrees.
Disturbance Degree D/%Fitting Curve EquationR2
10.4 a v = 0.025 × exp [ 0.764 / W + 0.181 ] 0.99
38.4 a v = 0.035 × exp [ 0.716 / W + 0.104 ] 0.99
45.3 a v = 0.023 × exp [ 1.082 / W + 0.155 ] 0.99
62.3 a v = 0.013 × exp [ 1.720 / W + 0.241 ] 0.99
100 a v = 2.027 × 10 5 × exp [ 14.732 / W + 1.104 ] 0.99
Table 6. Fitting results of the relationship between the compressive modulus Es and damage W of samples with different disturbances.
Disturbance Degree D/%Fitting Curve EquationR2
10.4 E S = 110.67 W 2 + 20.99 W + 2.0 0.99
38.4 E S = 91.58 W 2 + 12.25 W 0.24 0.98
45.3 E S = 107.88 W 2 + 1.1 W + 0.15 0.98
62.3 E S = 120.38 W 2 11.2 W + 0.71 0.99
100 E S = 159.79 W 2 50.61 W + 3.69 0.95
Disclaimer/Publisher’s Note: The statements, opinions and data contained in all publications are solely those of the individual author(s) and contributor(s) and not of MDPI and/or the editor(s). MDPI and/or the editor(s) disclaim responsibility for any injury to people or property resulting from any ideas, methods, instructions or products referred to in the content.

