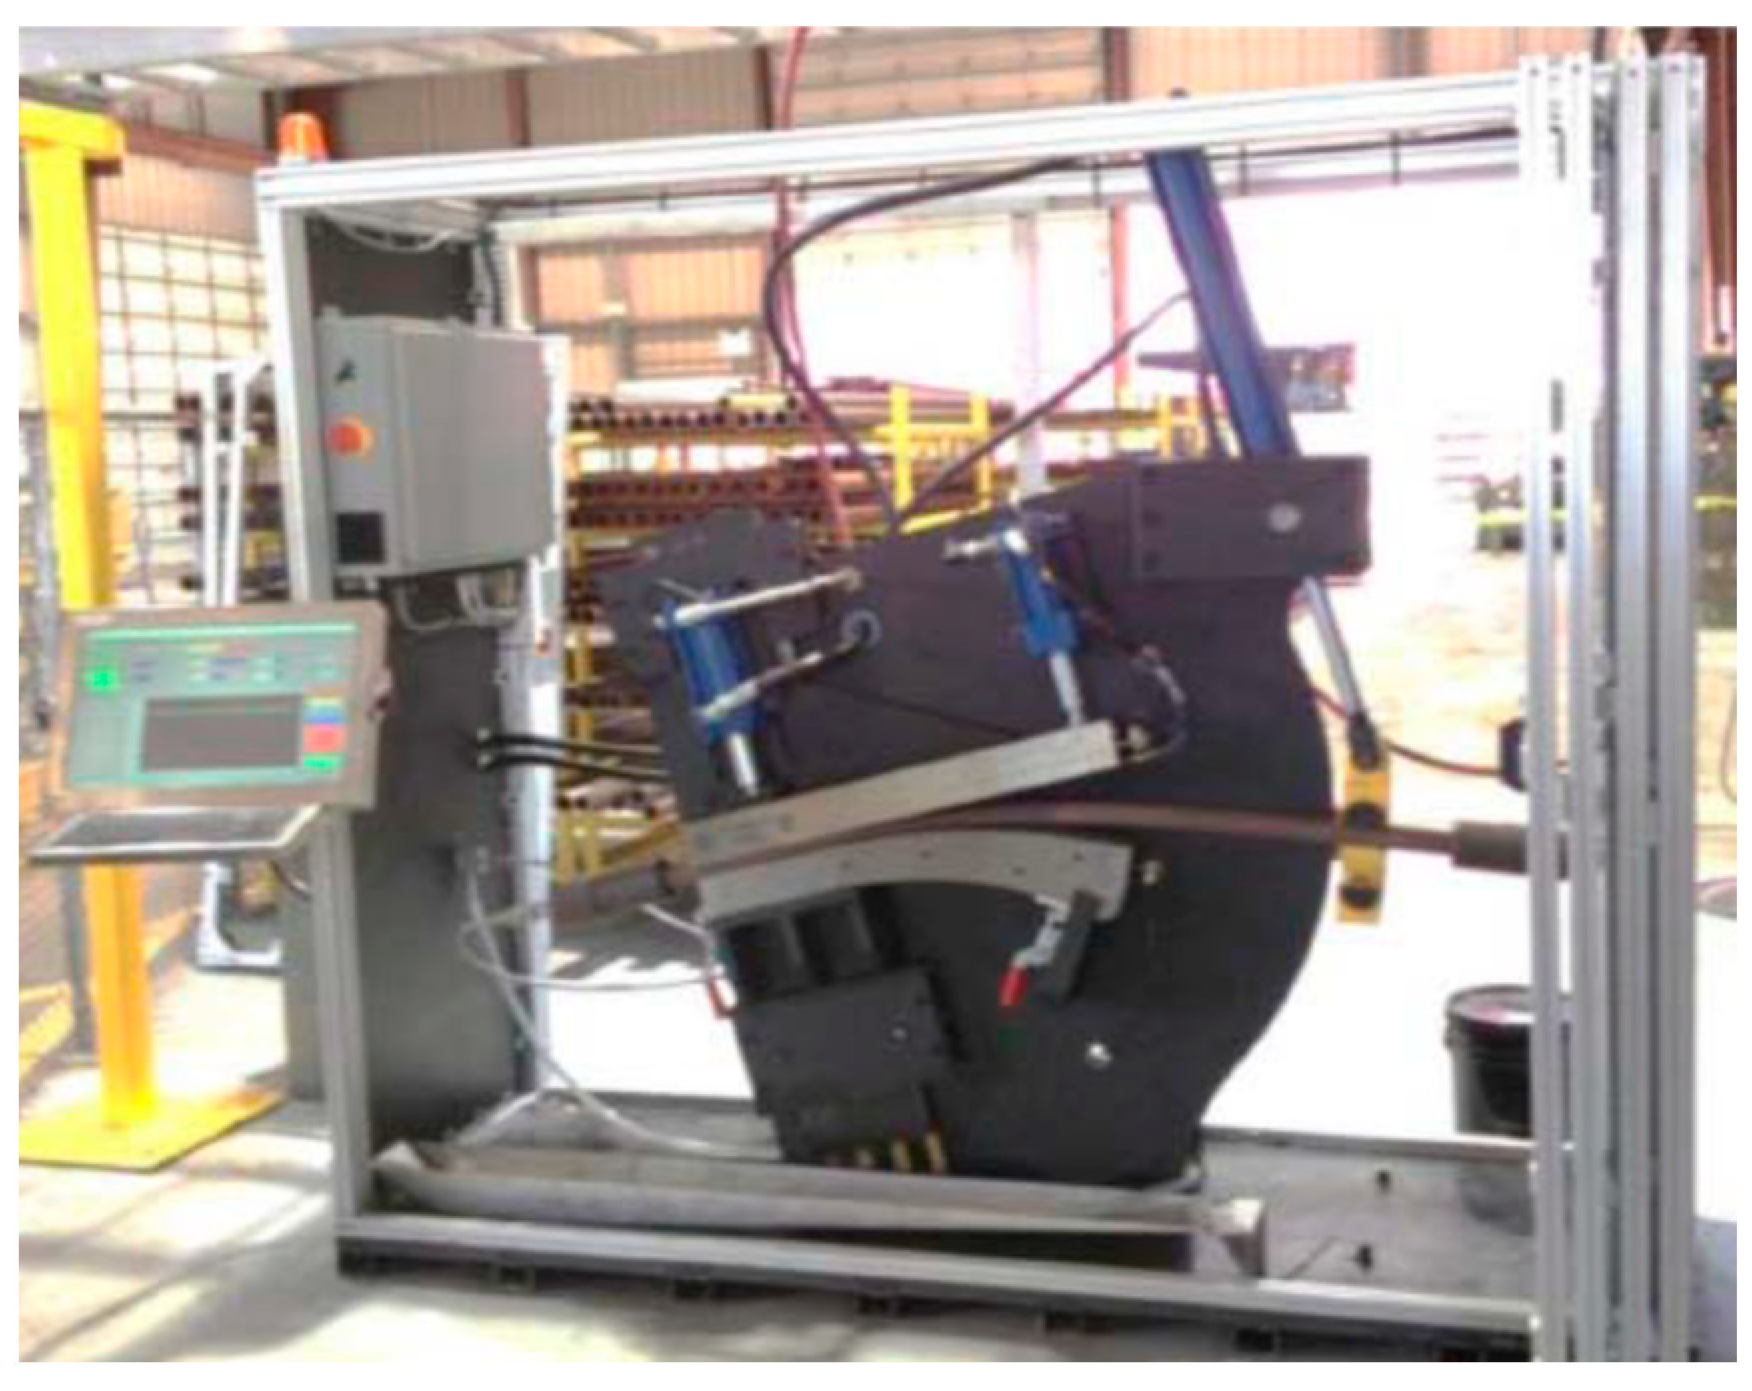
Innovative Approach Integrating Machine Learning Models for Coiled Tubing Fatigue Modeling
Abstract
1. Introduction
2. Data and Methodology
Introduction
3. Data Description and Preprocessing
Dataset Overview
- Grade: Integer representing the CT material grade.
- CT Diameter: A continuous variable representing the outside diameter of the CT.
- Wall thickness: A continuous variable representing the thickness of coiled tube.
- Welding type: A categorical variable with different welding types used between CT segments (bias, manual, orbital, etc.).
- Radius: A continuous variable representing the bending radius of the testing machine.
- Pressure: Integer indicating the applied pressure while testing.
- N cycle: The target variable representing the number of cycles before failure.
4. Data Processing and Algorithms
5. Comparison and Performance Criteria
5.1. Coefficient of Determination (R2)
5.2. Mean Squared Error (MSE)
5.3. Mean Absolut Error (MAE)
5.4. Mean Absolute Percentage Error (MAPE)
5.5. Criteria for Model Selection
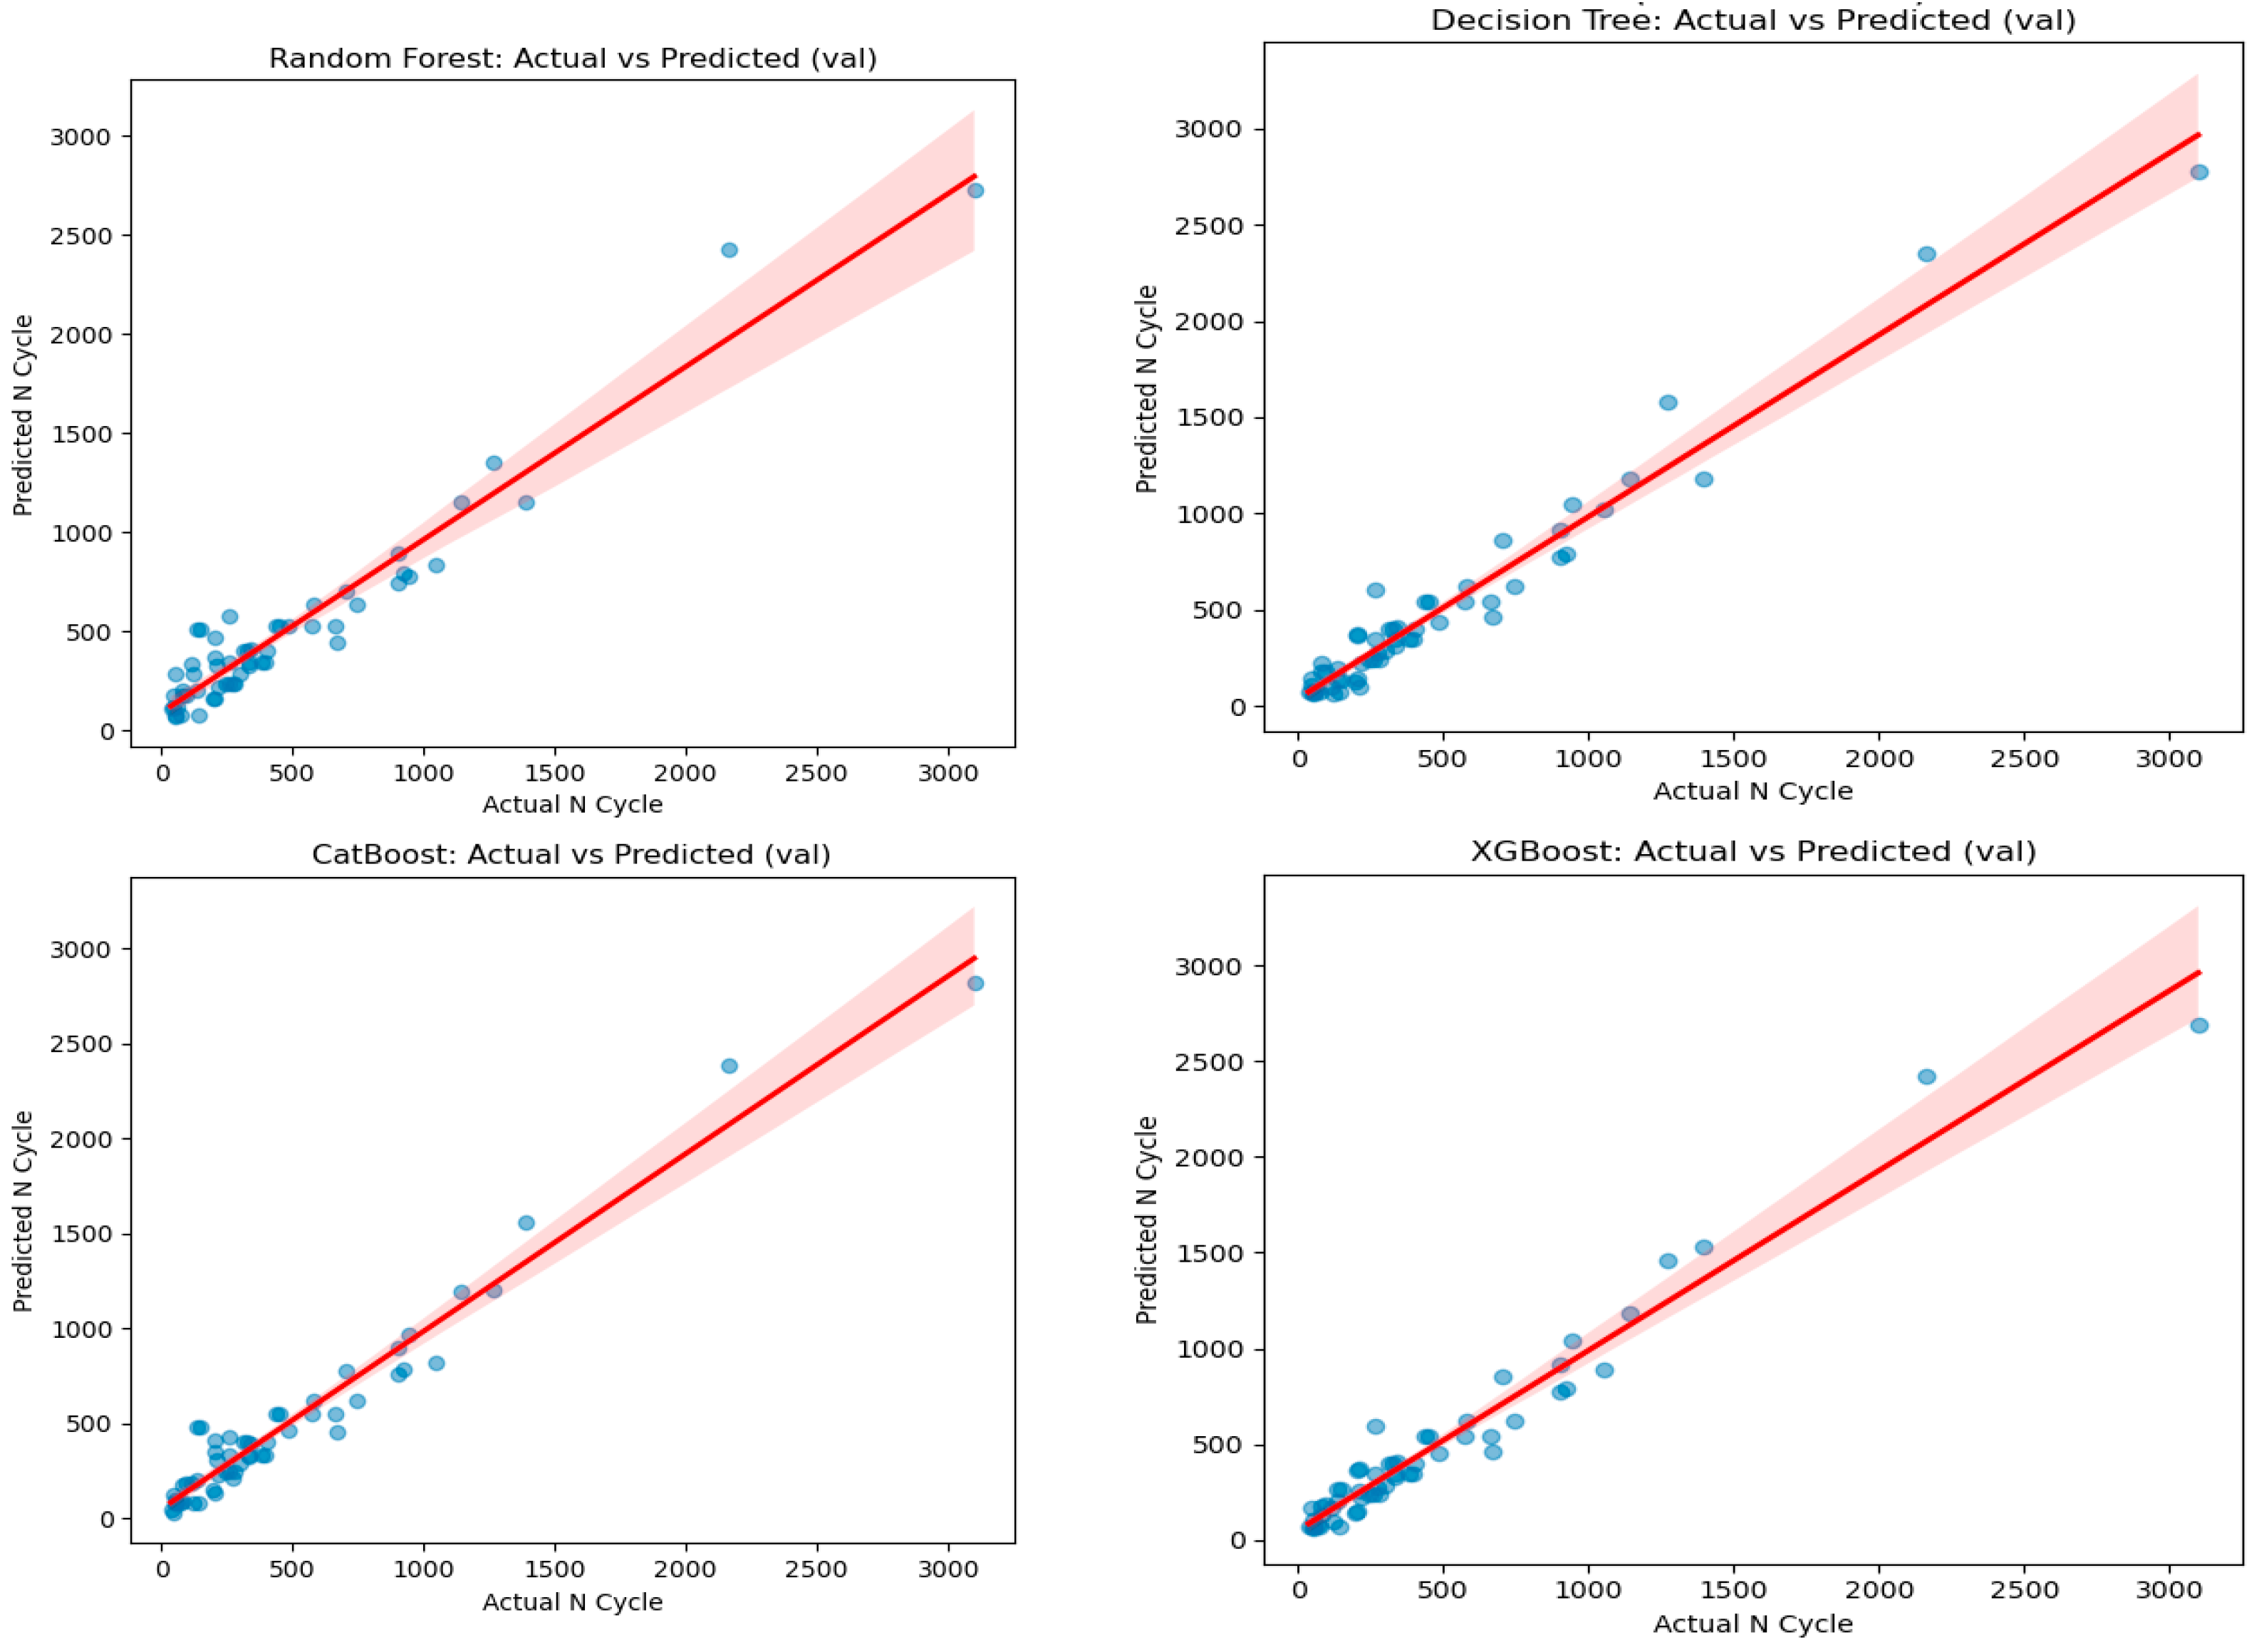
6. Results Analysis and Interpretation
- Model overfitting (occurs when a model is overly complex in training data or fails when tested).
- The dataset might be too small or noisy.
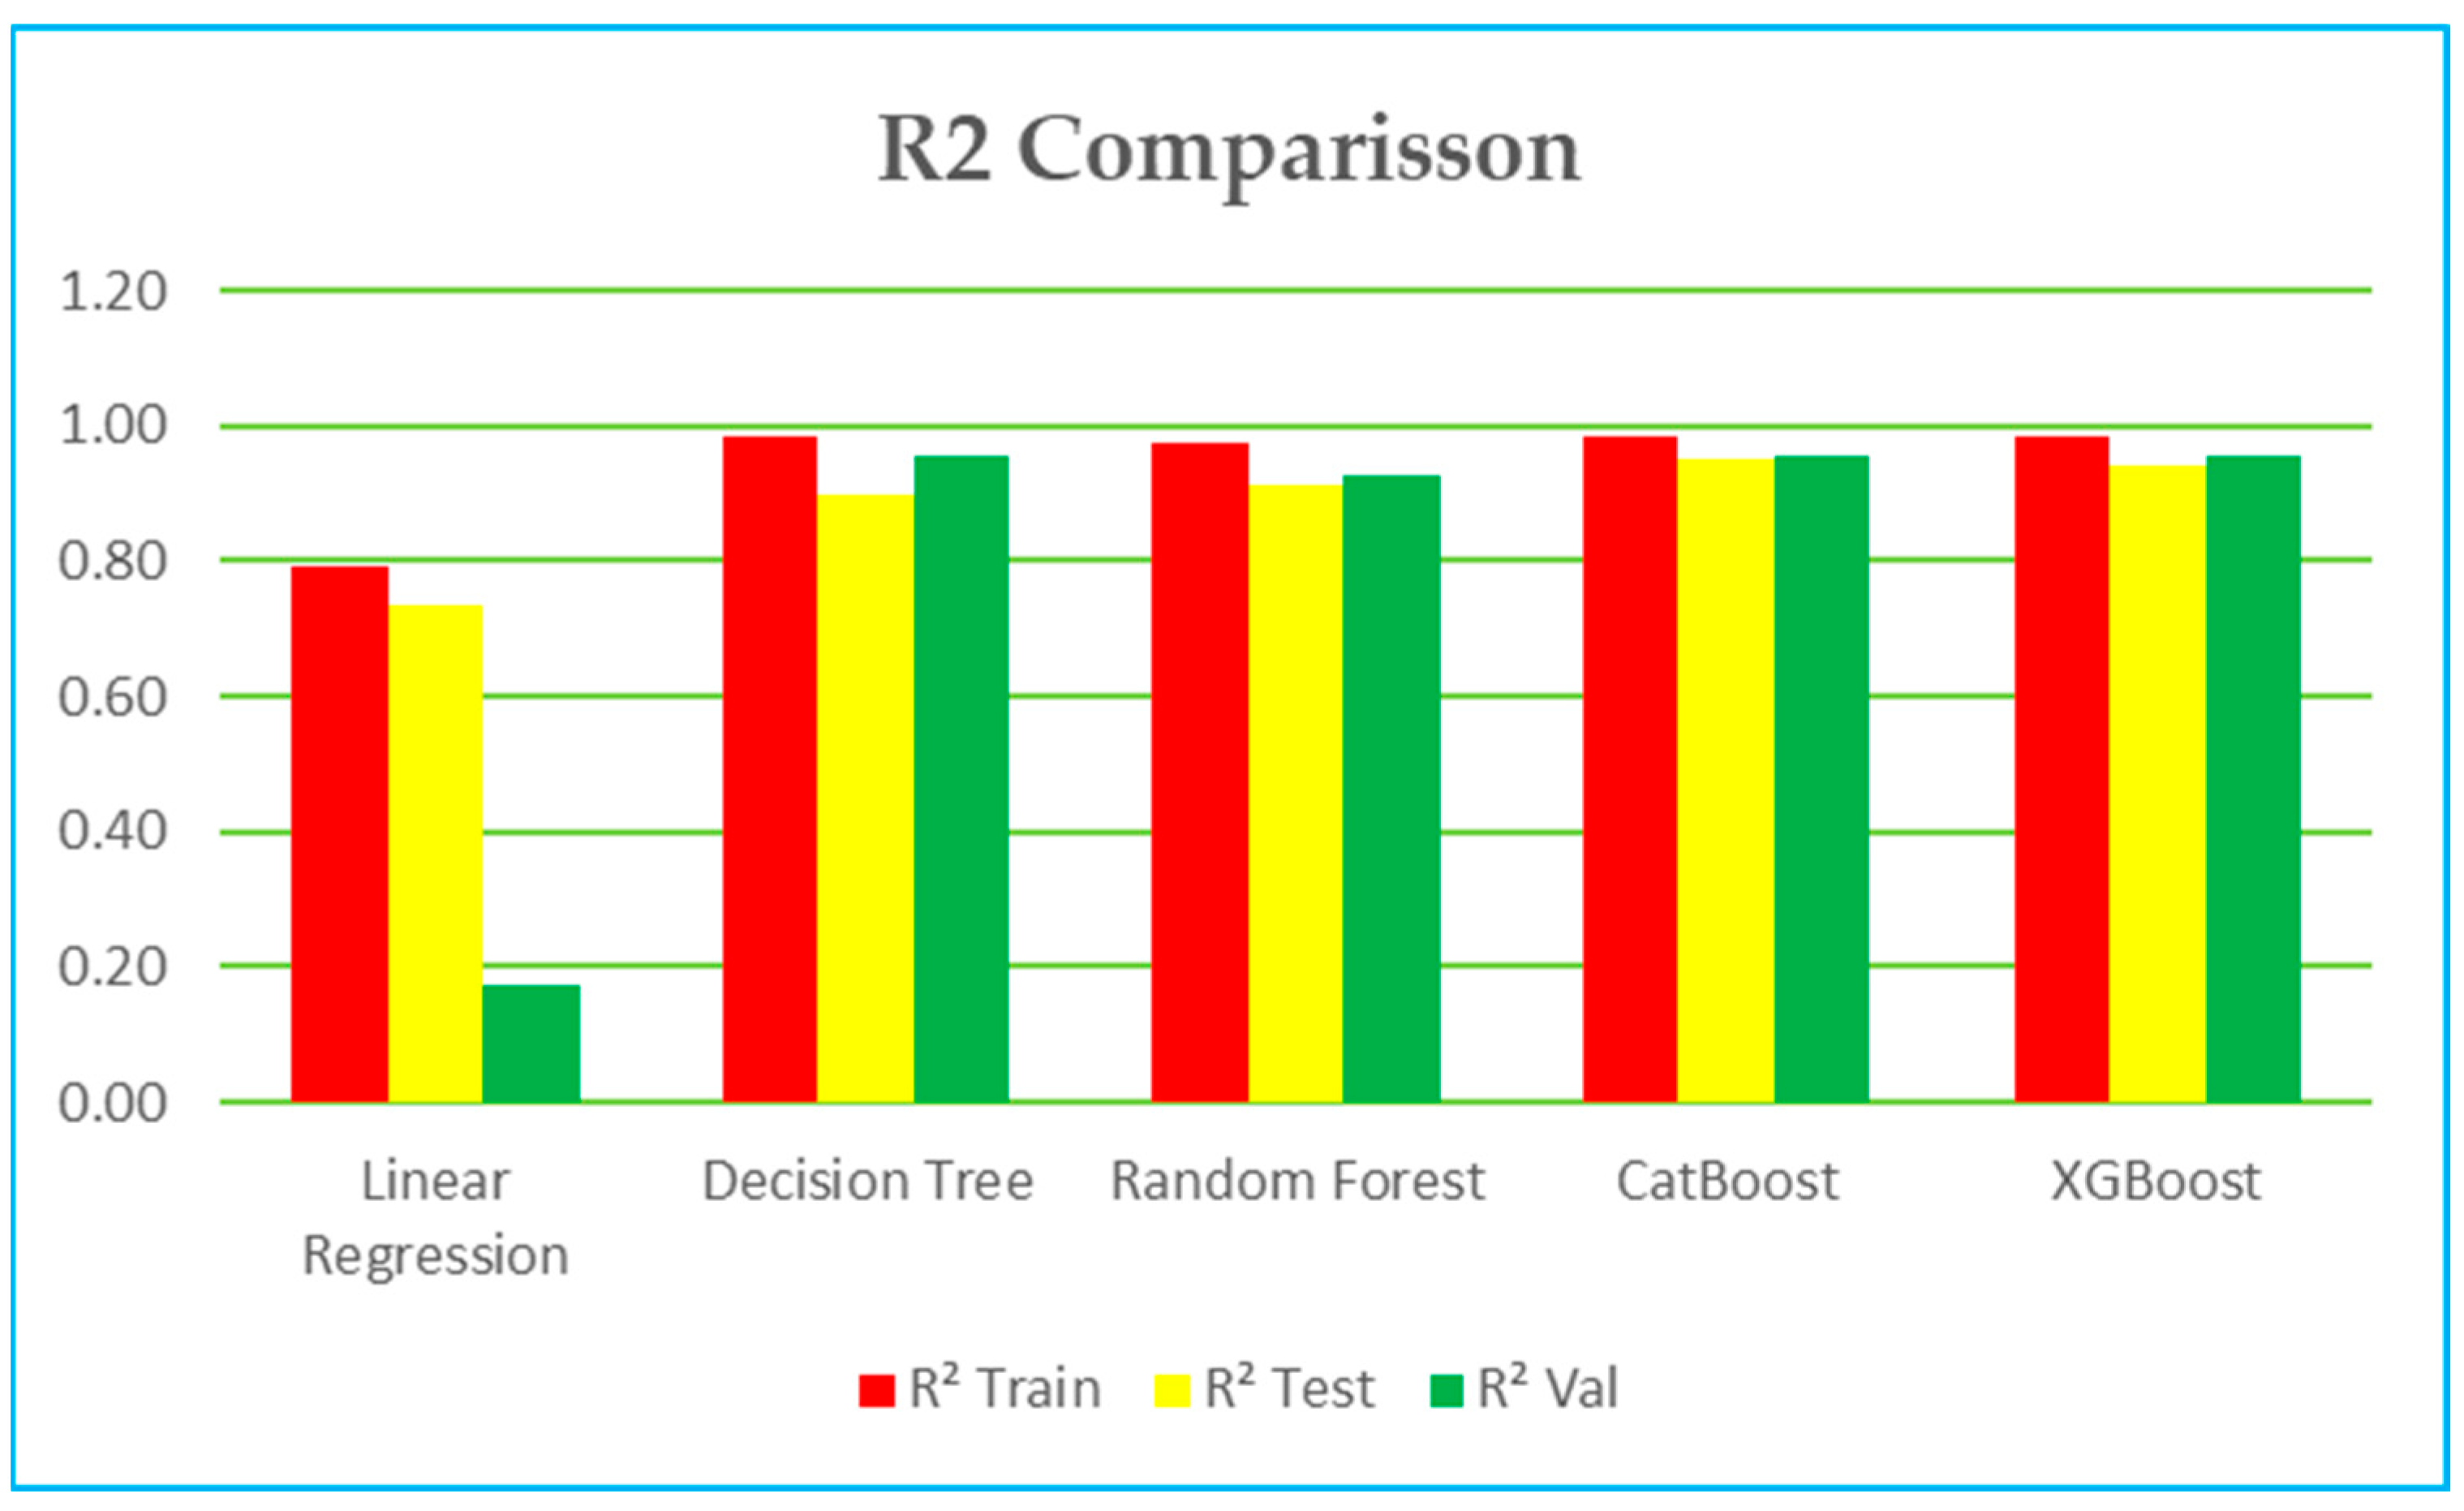
6.1. R2 (Coefficient of Determination)—Figure 6
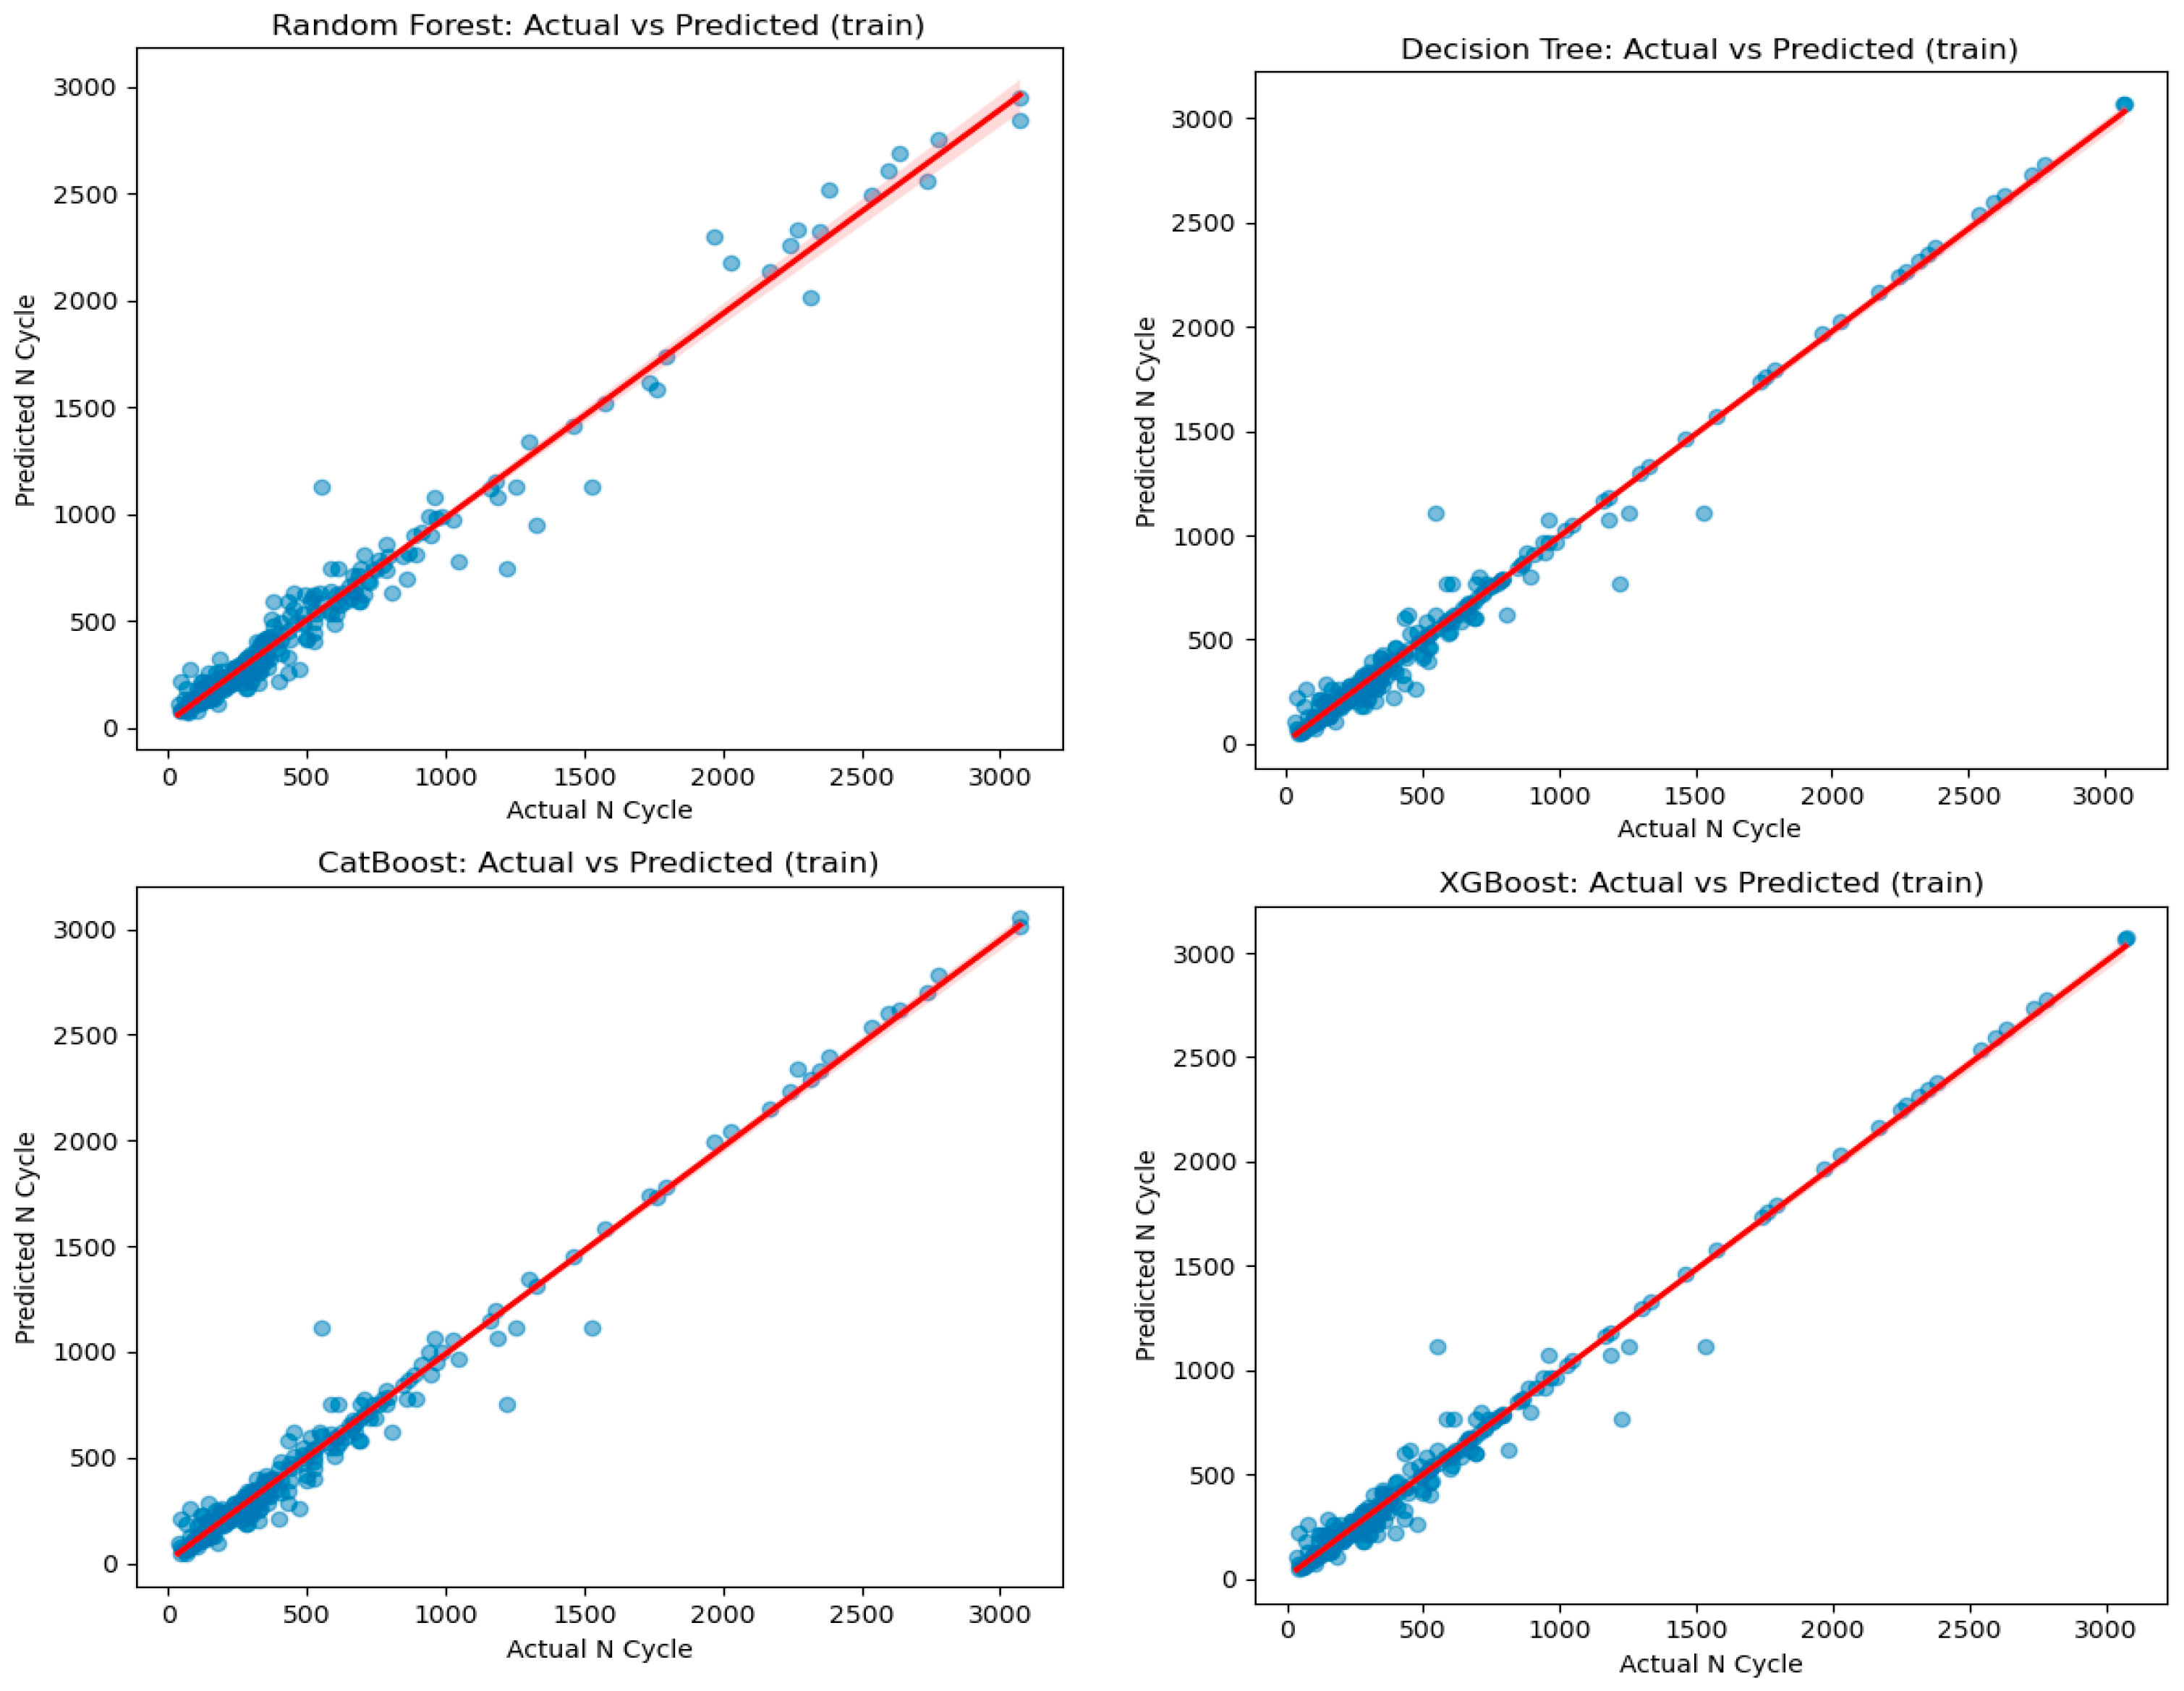
- Training: Both CatBoost, Decision Tree and XGBoost perform similarly with 0.98, followed by Random Forest with 0.97
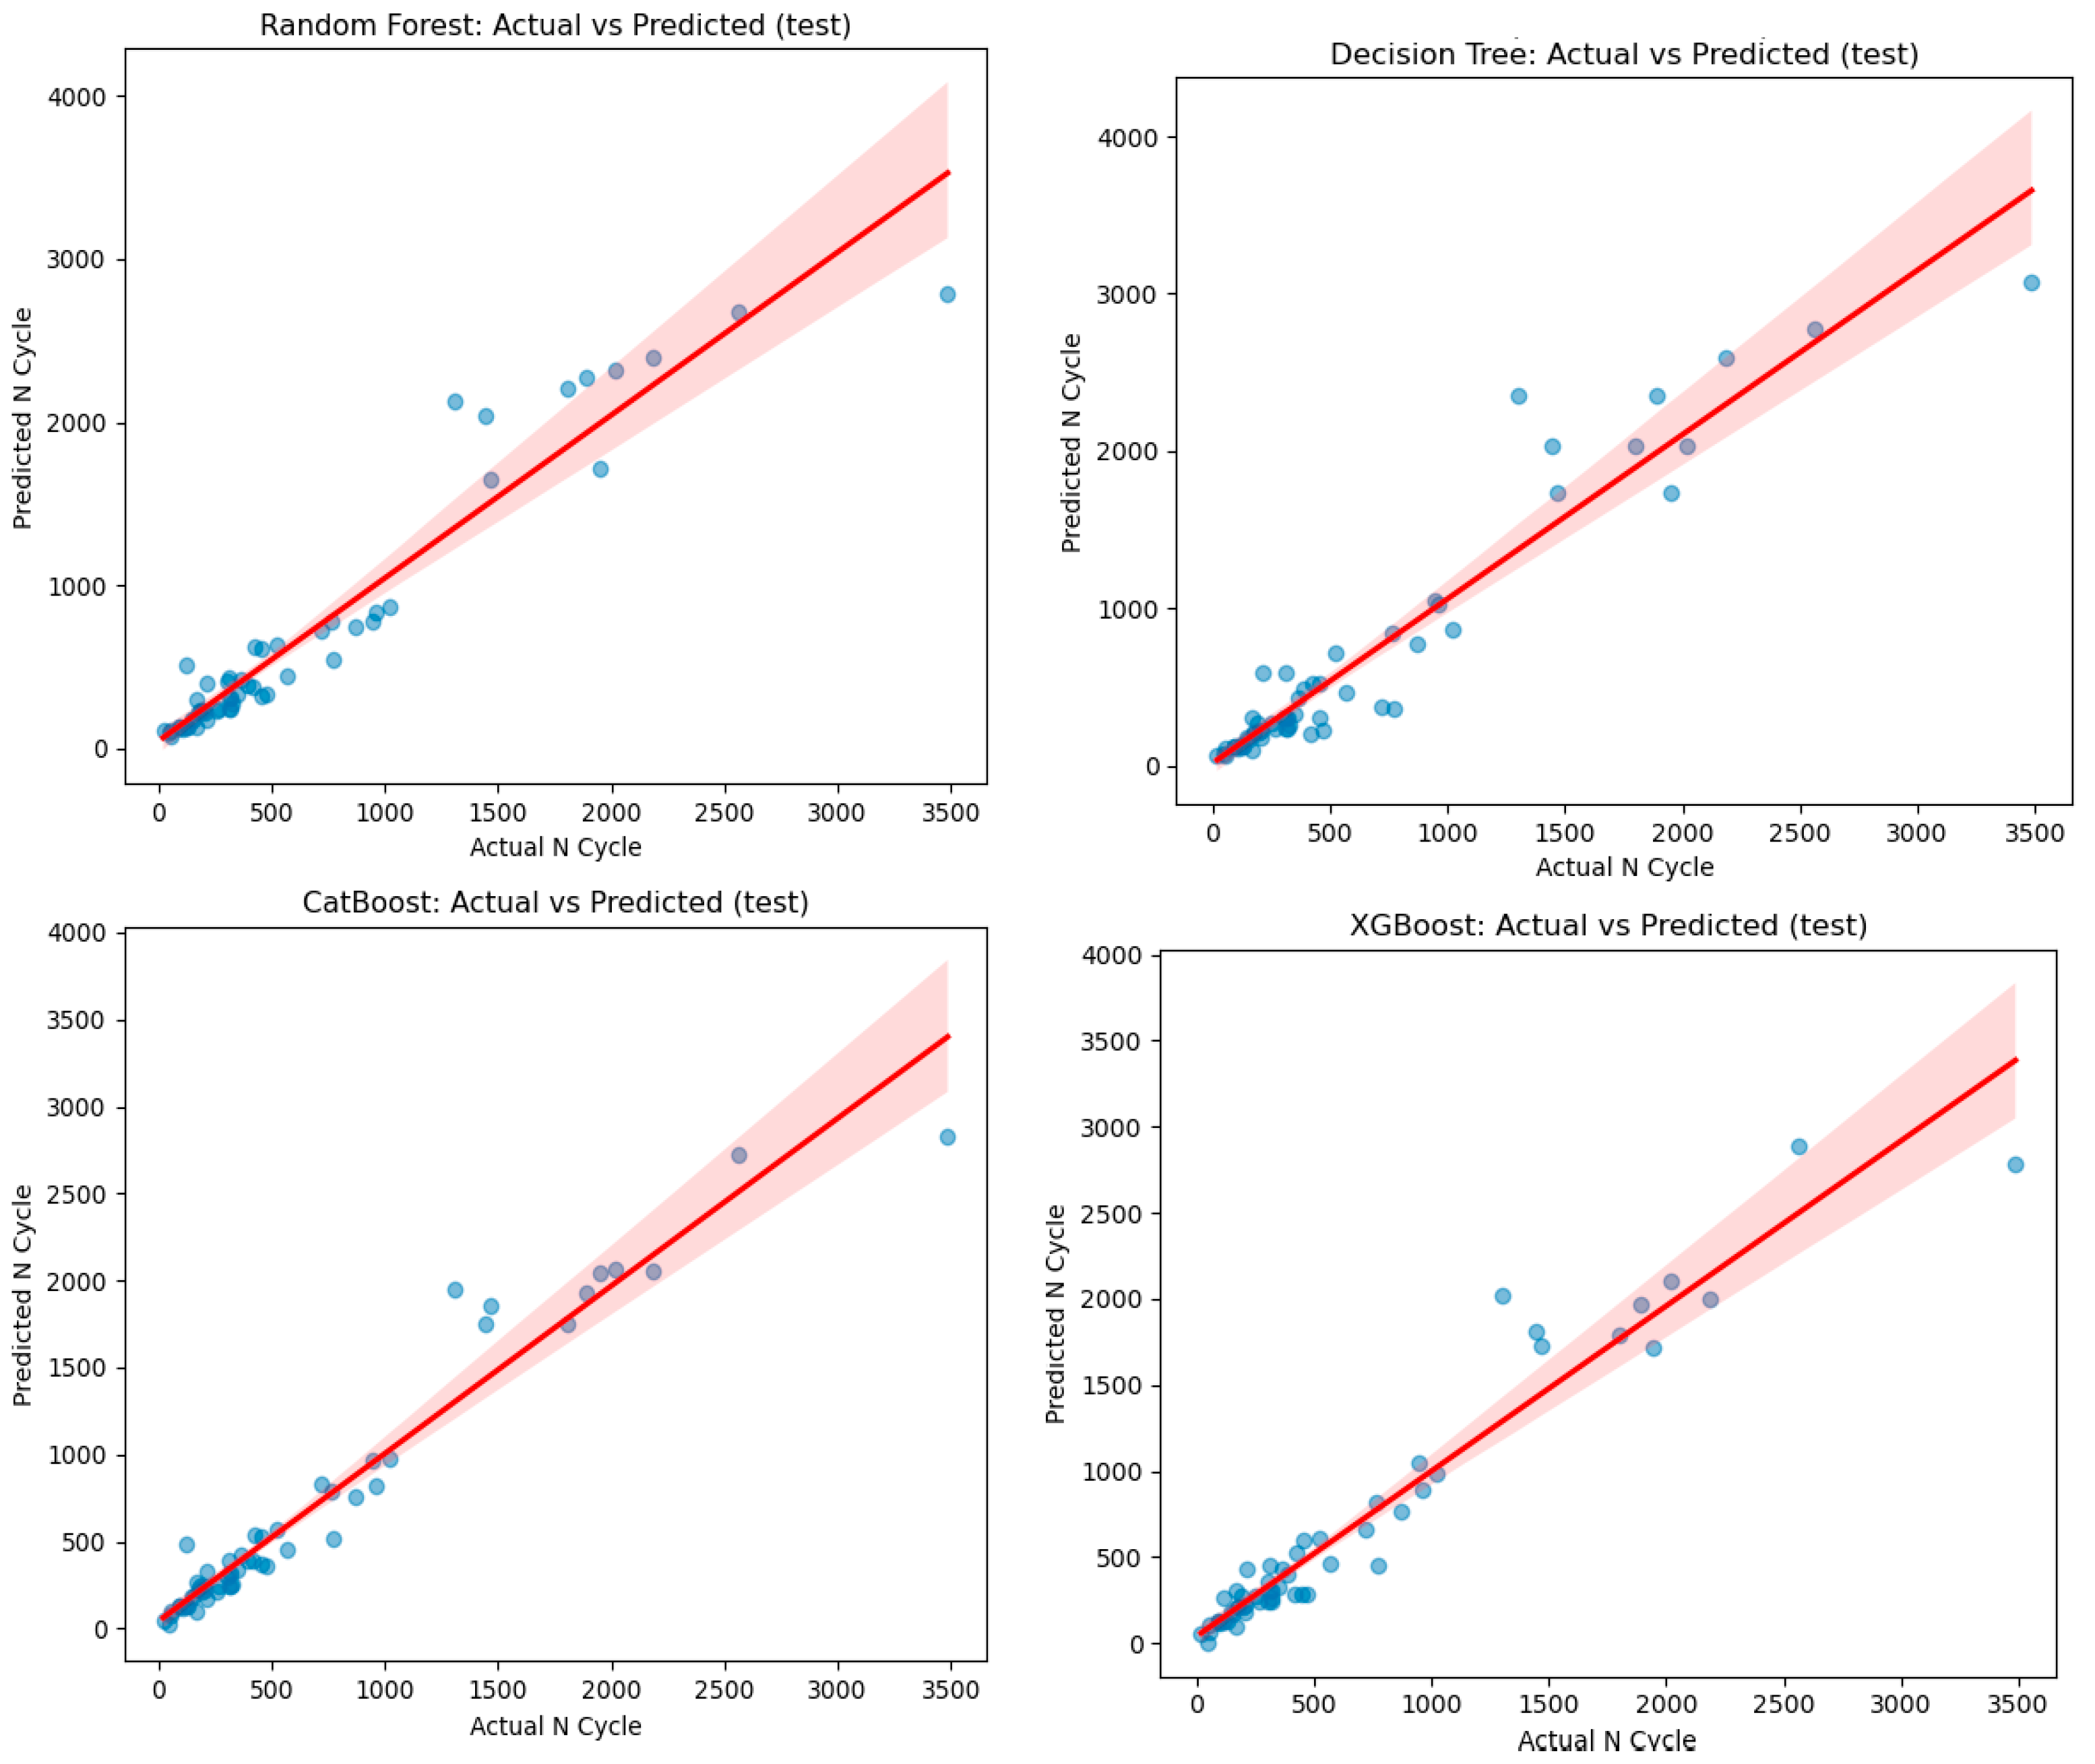
- Testing: CatBoost performance is slightly better with 0.95 compared to XGBoost with 0.945, Random Forest with 0.91 and Decision Tree with 0.90.
- Validation: Decision Tree with 0.96, both CatBoost and XGBoost with 0.95 and Random Forest with 0.96.
- The other models result in poor modeling outputs.
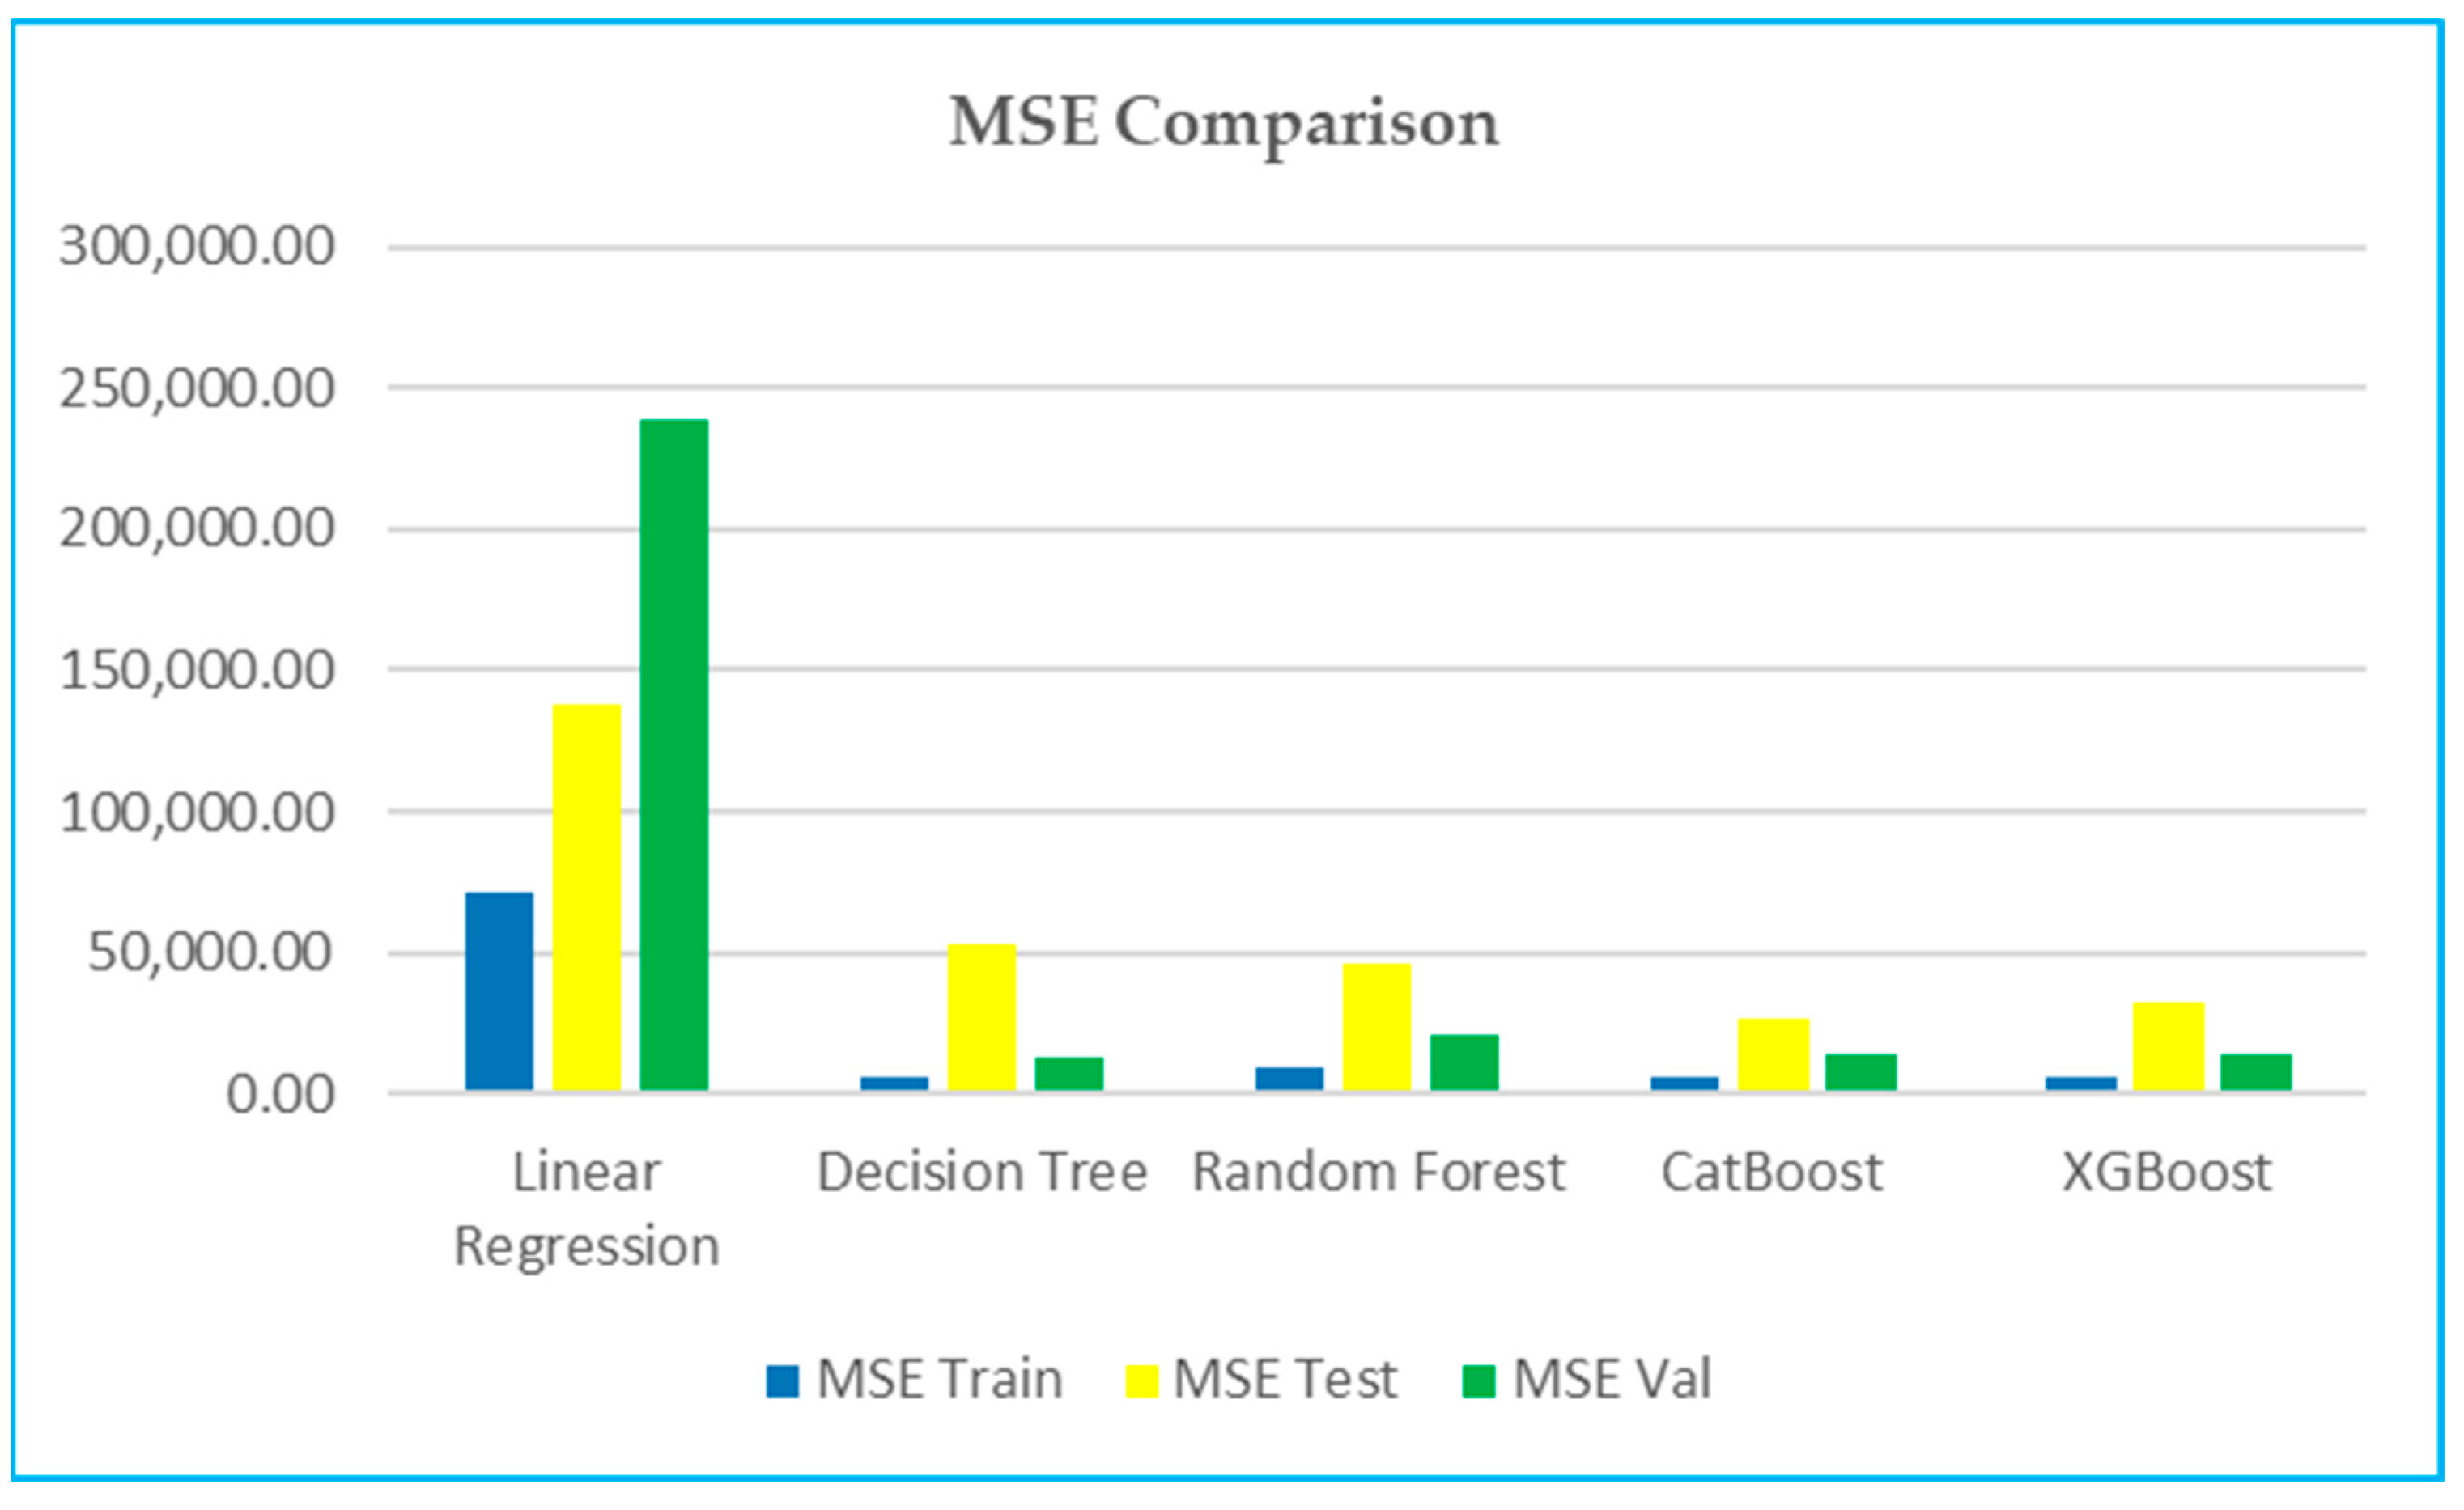
6.2. MSE (Mean Squared Error)—Figure 7
- ▪
- Training: XGBoost and Decision Tree have a lower training MSE (5326, 5325, respectively), indicating that they fit the training data better than CatBoost 5676 and Random Forest with 8808.
- ▪
- Testing and validation: XGBoost and CatBoost perform better in testing, but in validation, Decision Tree and CatBoost are better than XGBoost and Random Forest.
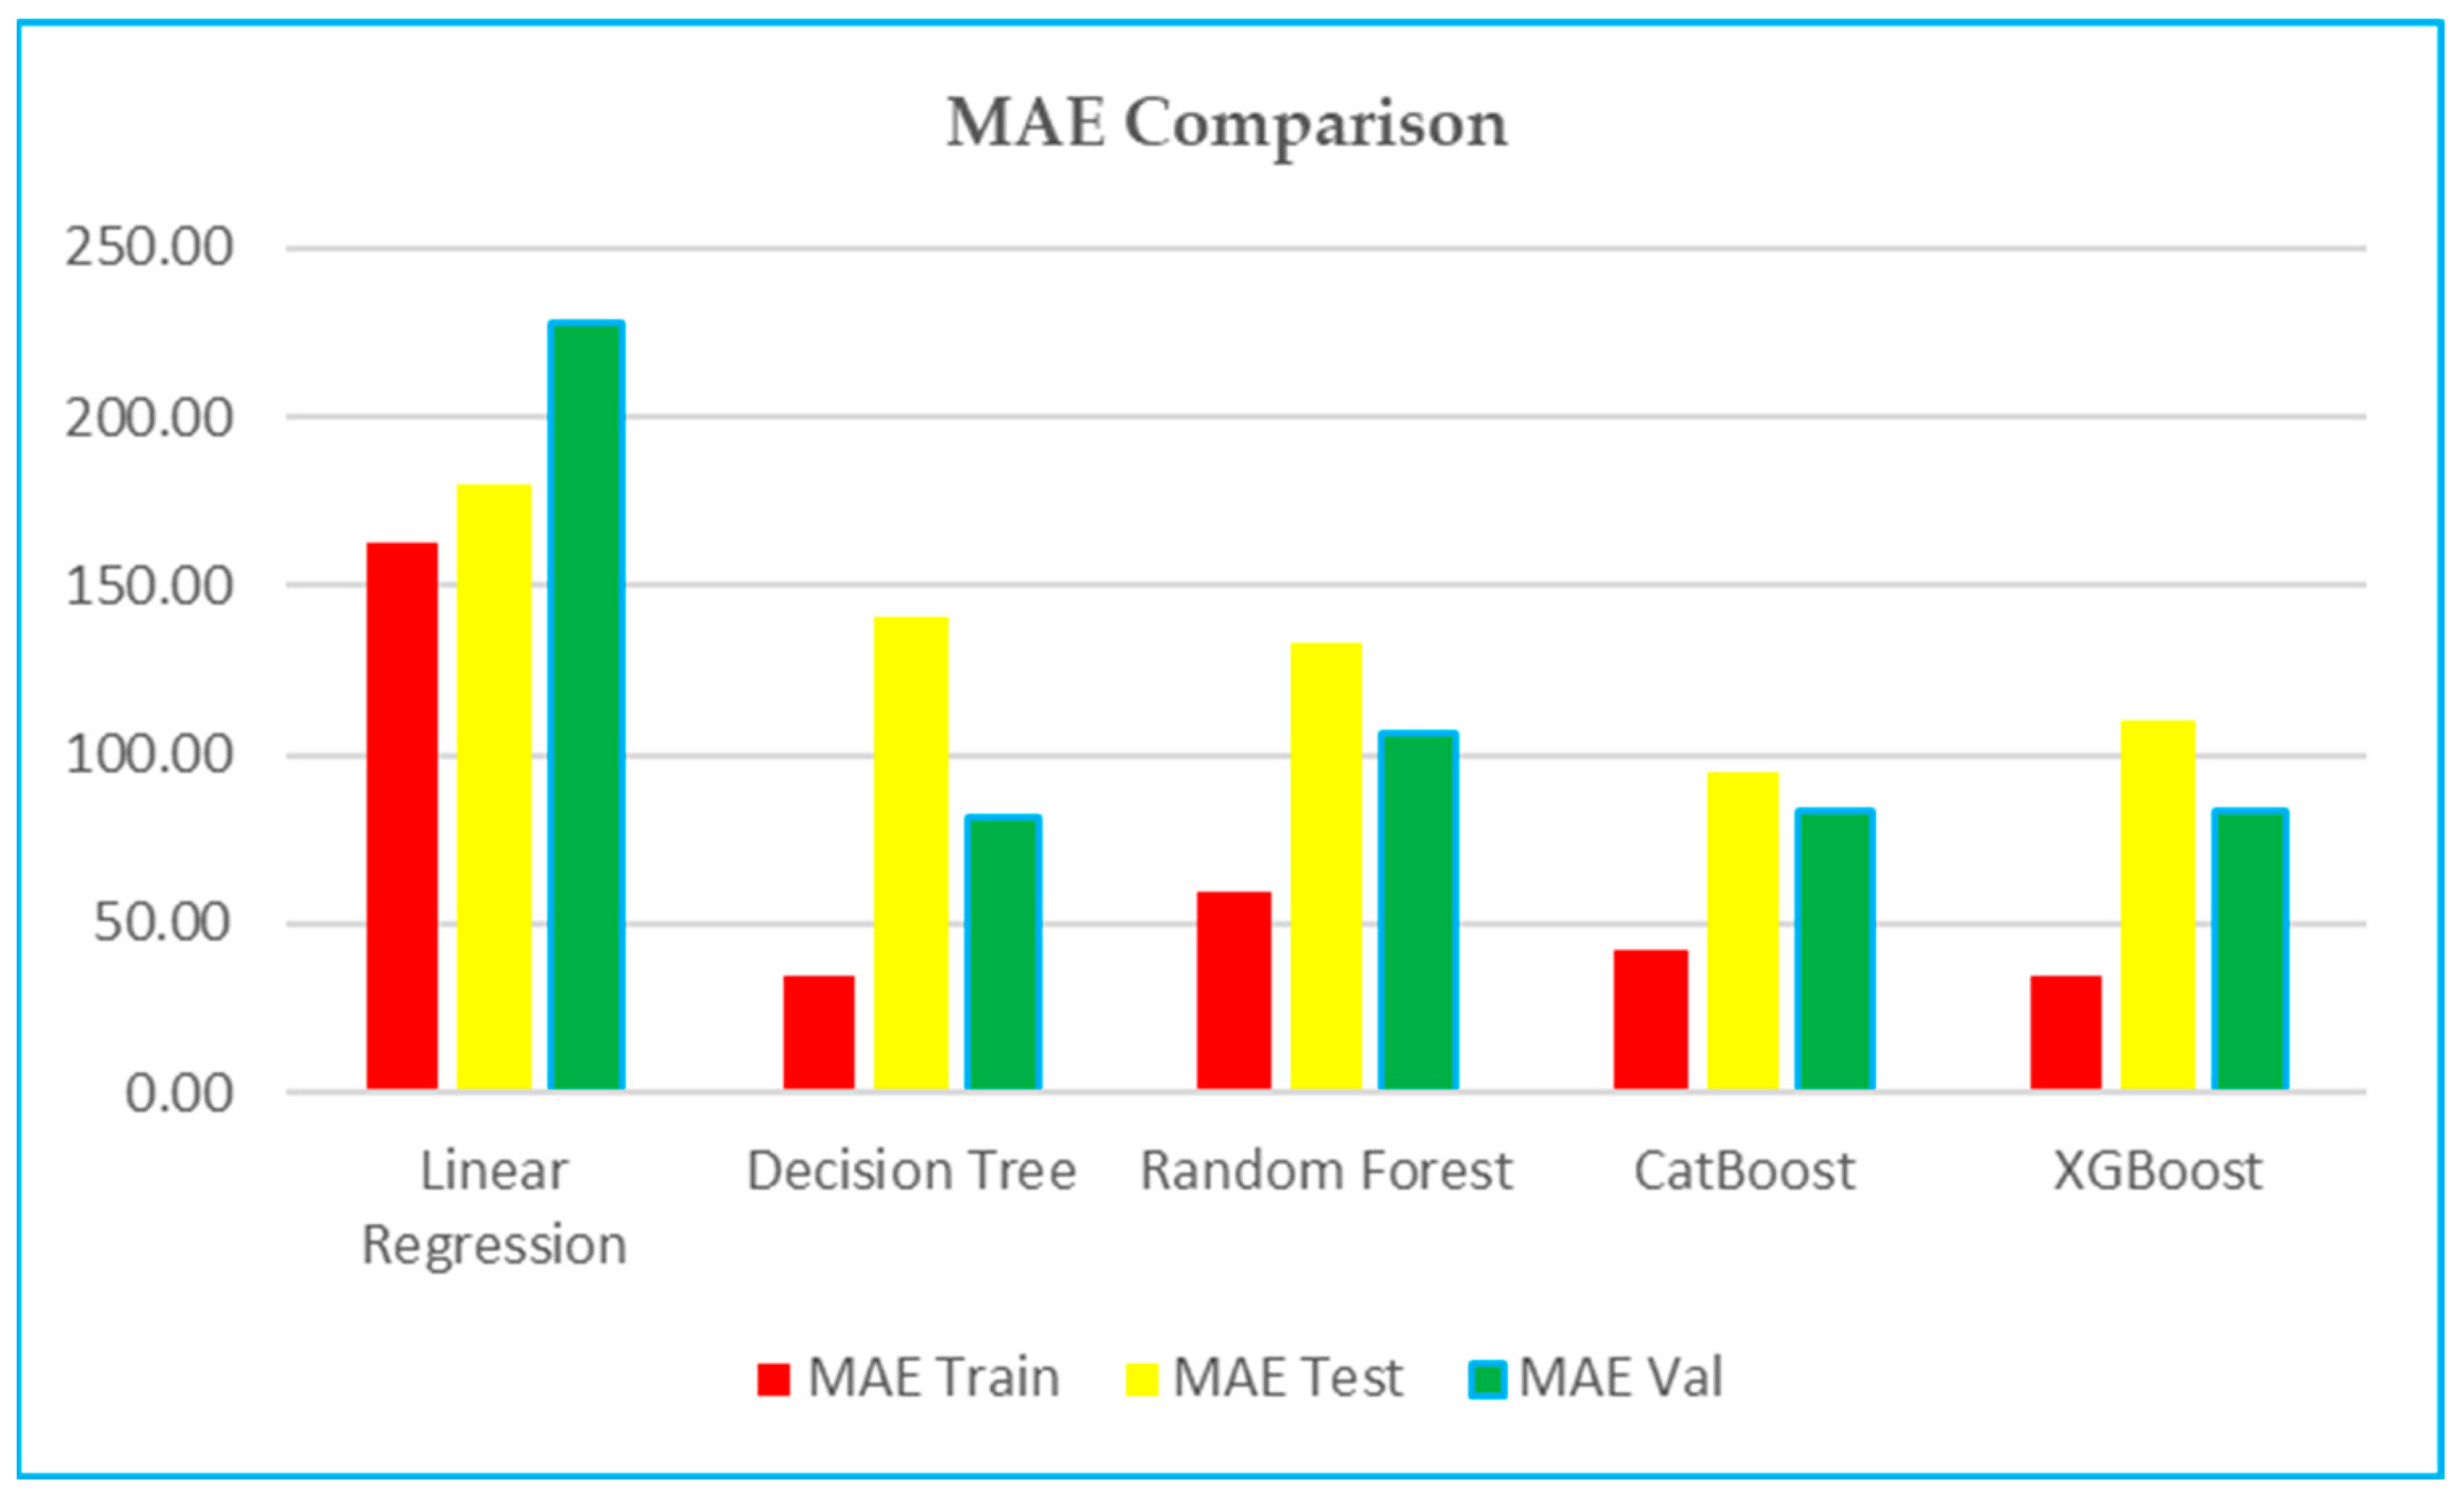
6.3. MAE (Mean Absolute Error)—Figure 8
- Training: Decision Tree and XGBoost have a lower training MAE, at 34.49 and 34.49, respectively, compared to CatBoost at 42.42 and Random Forest at 58.99.
- Testing: CatBoost performs marginally better than XGBoost (94.67–109.97). Random Forest is slightly better than Decision Tree (133.08 vs. 140.34).
- Validation: Random Forest has a lower validation MAE (51.79 vs. 57.30).
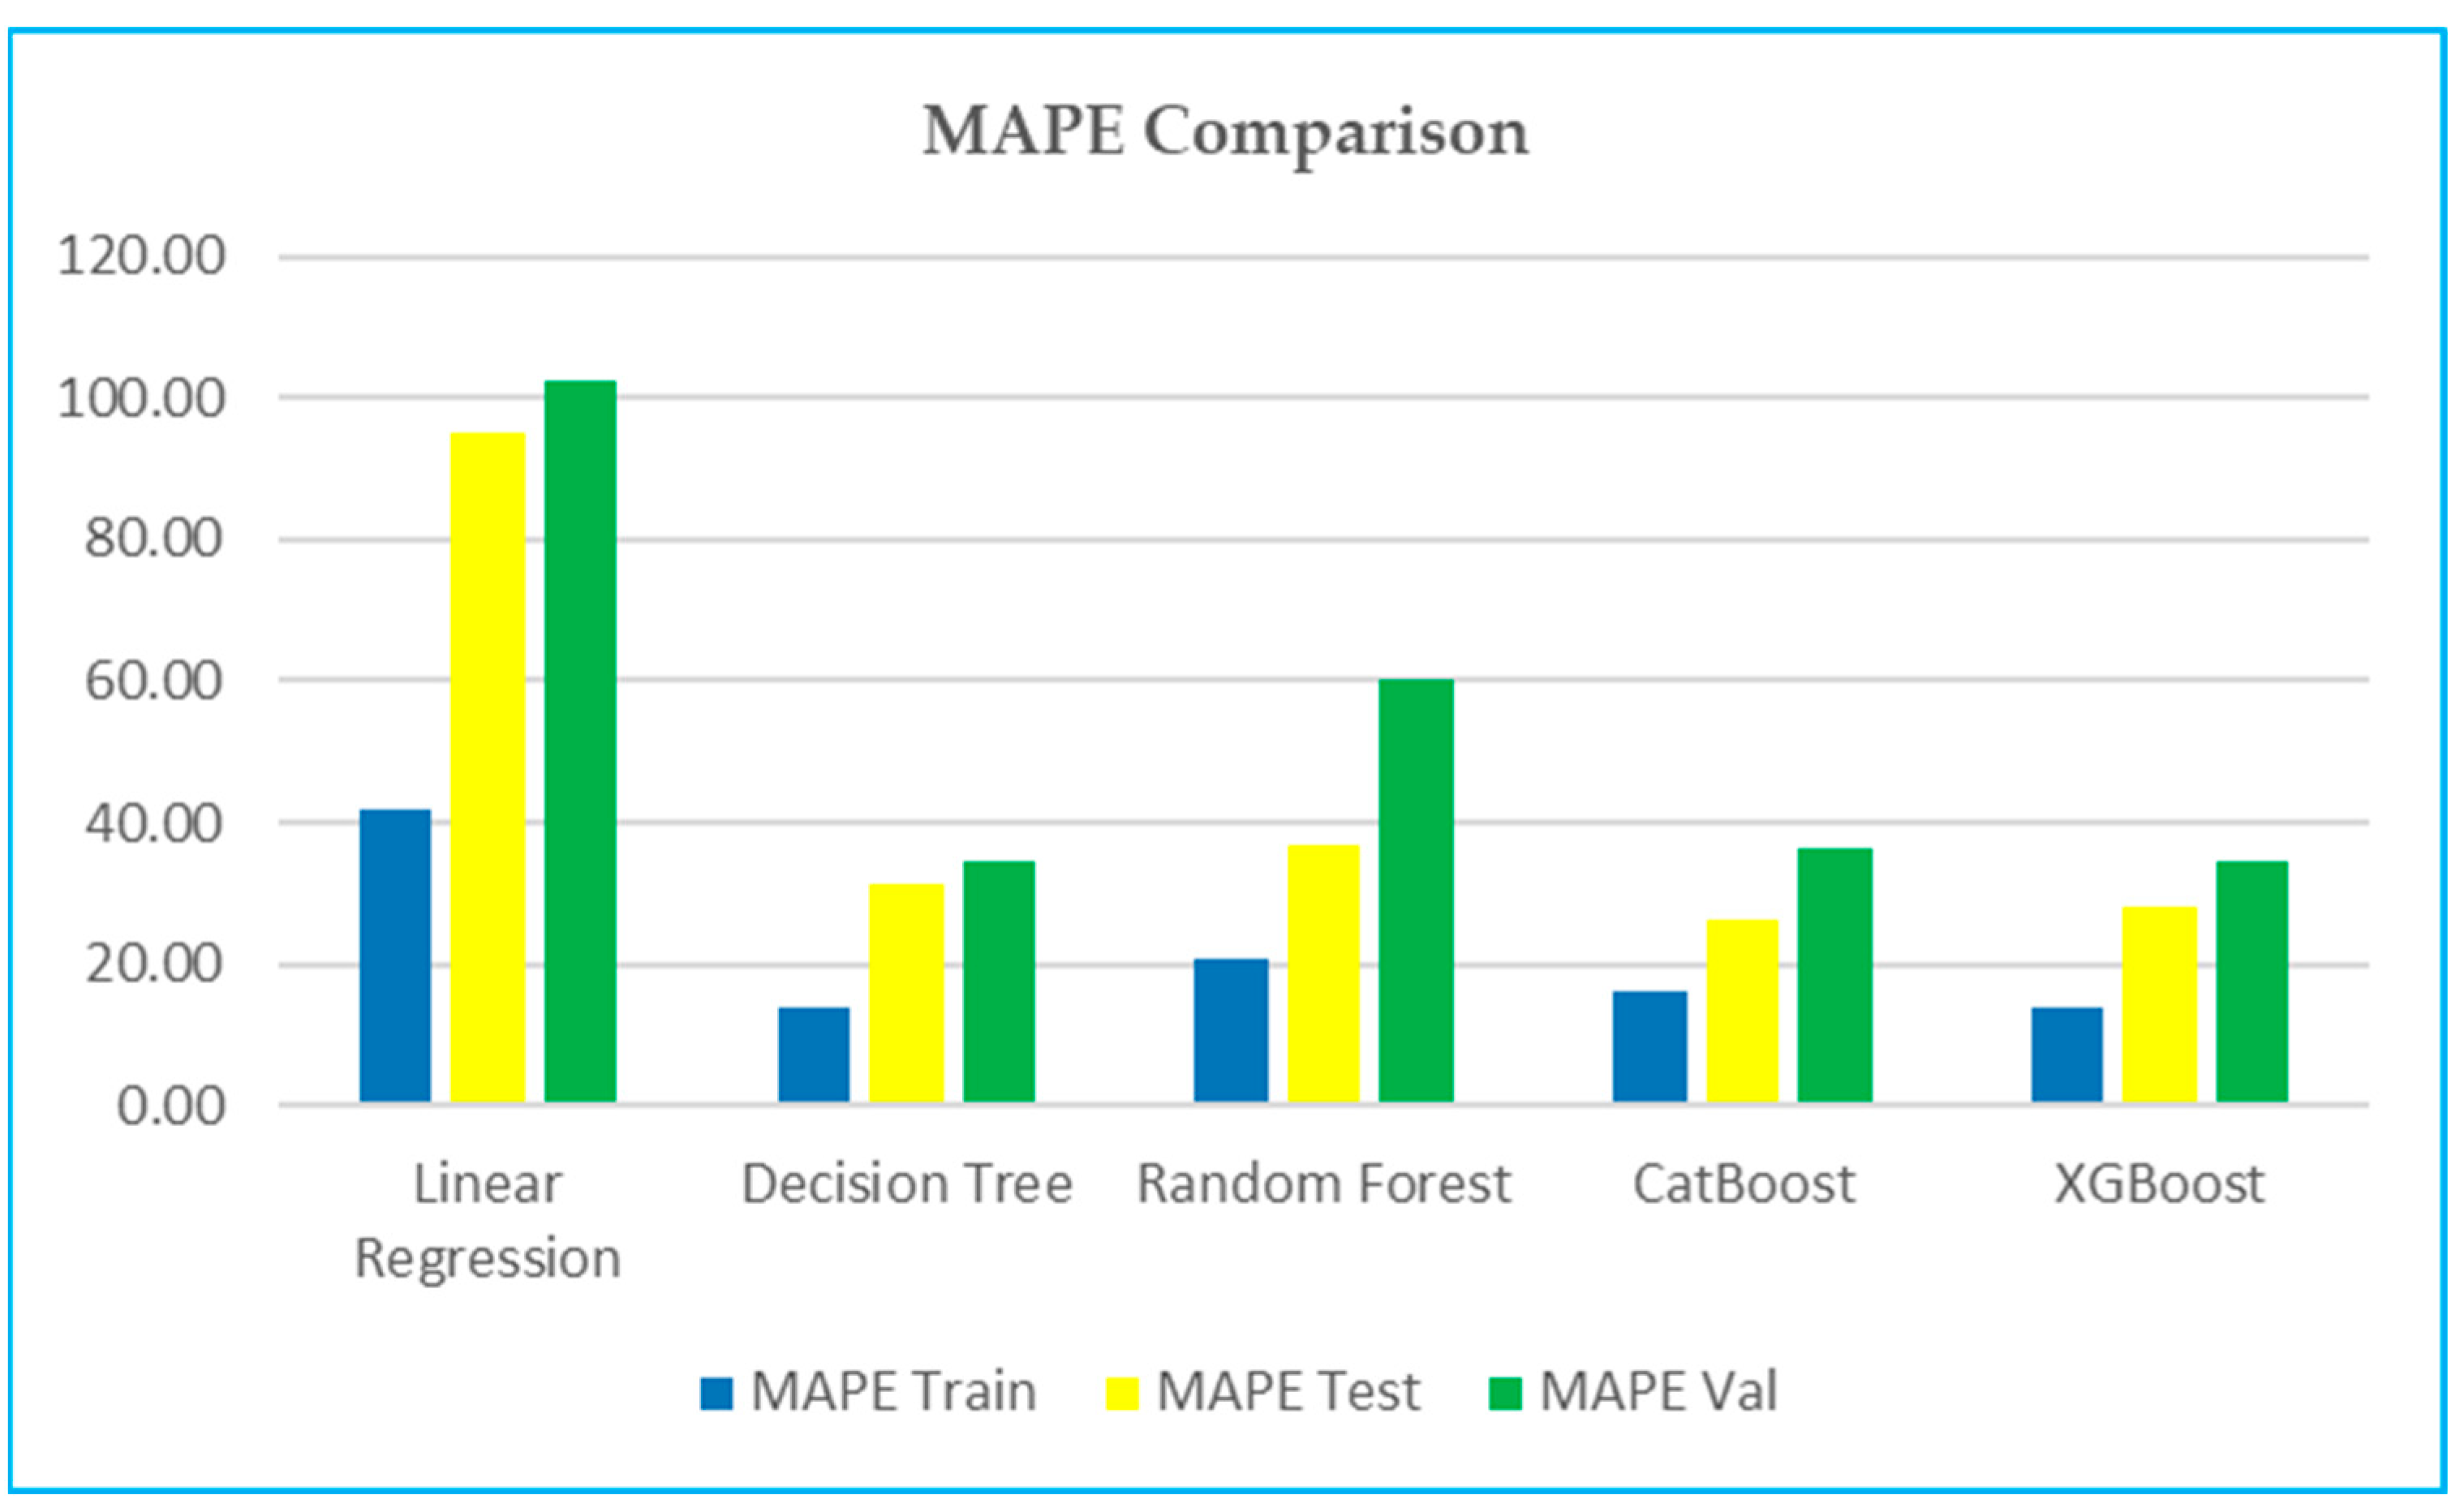
6.4. MAPE (Mean Absolute Percentage Error)—Figure 9
- Training: XGBoost and Decision Tree have a significantly lower training MAPE (13.99 and 13.93, respectively) indicating better percentage error performance during training.
- Testing and validation: CatBoost and XGBoost demonstrate slightly better performance in testing, but in validation sets, XGBoost and Decision Tree demonstrate better performance.
6.5. Model Performance Analysis
7. Correlation Analysis
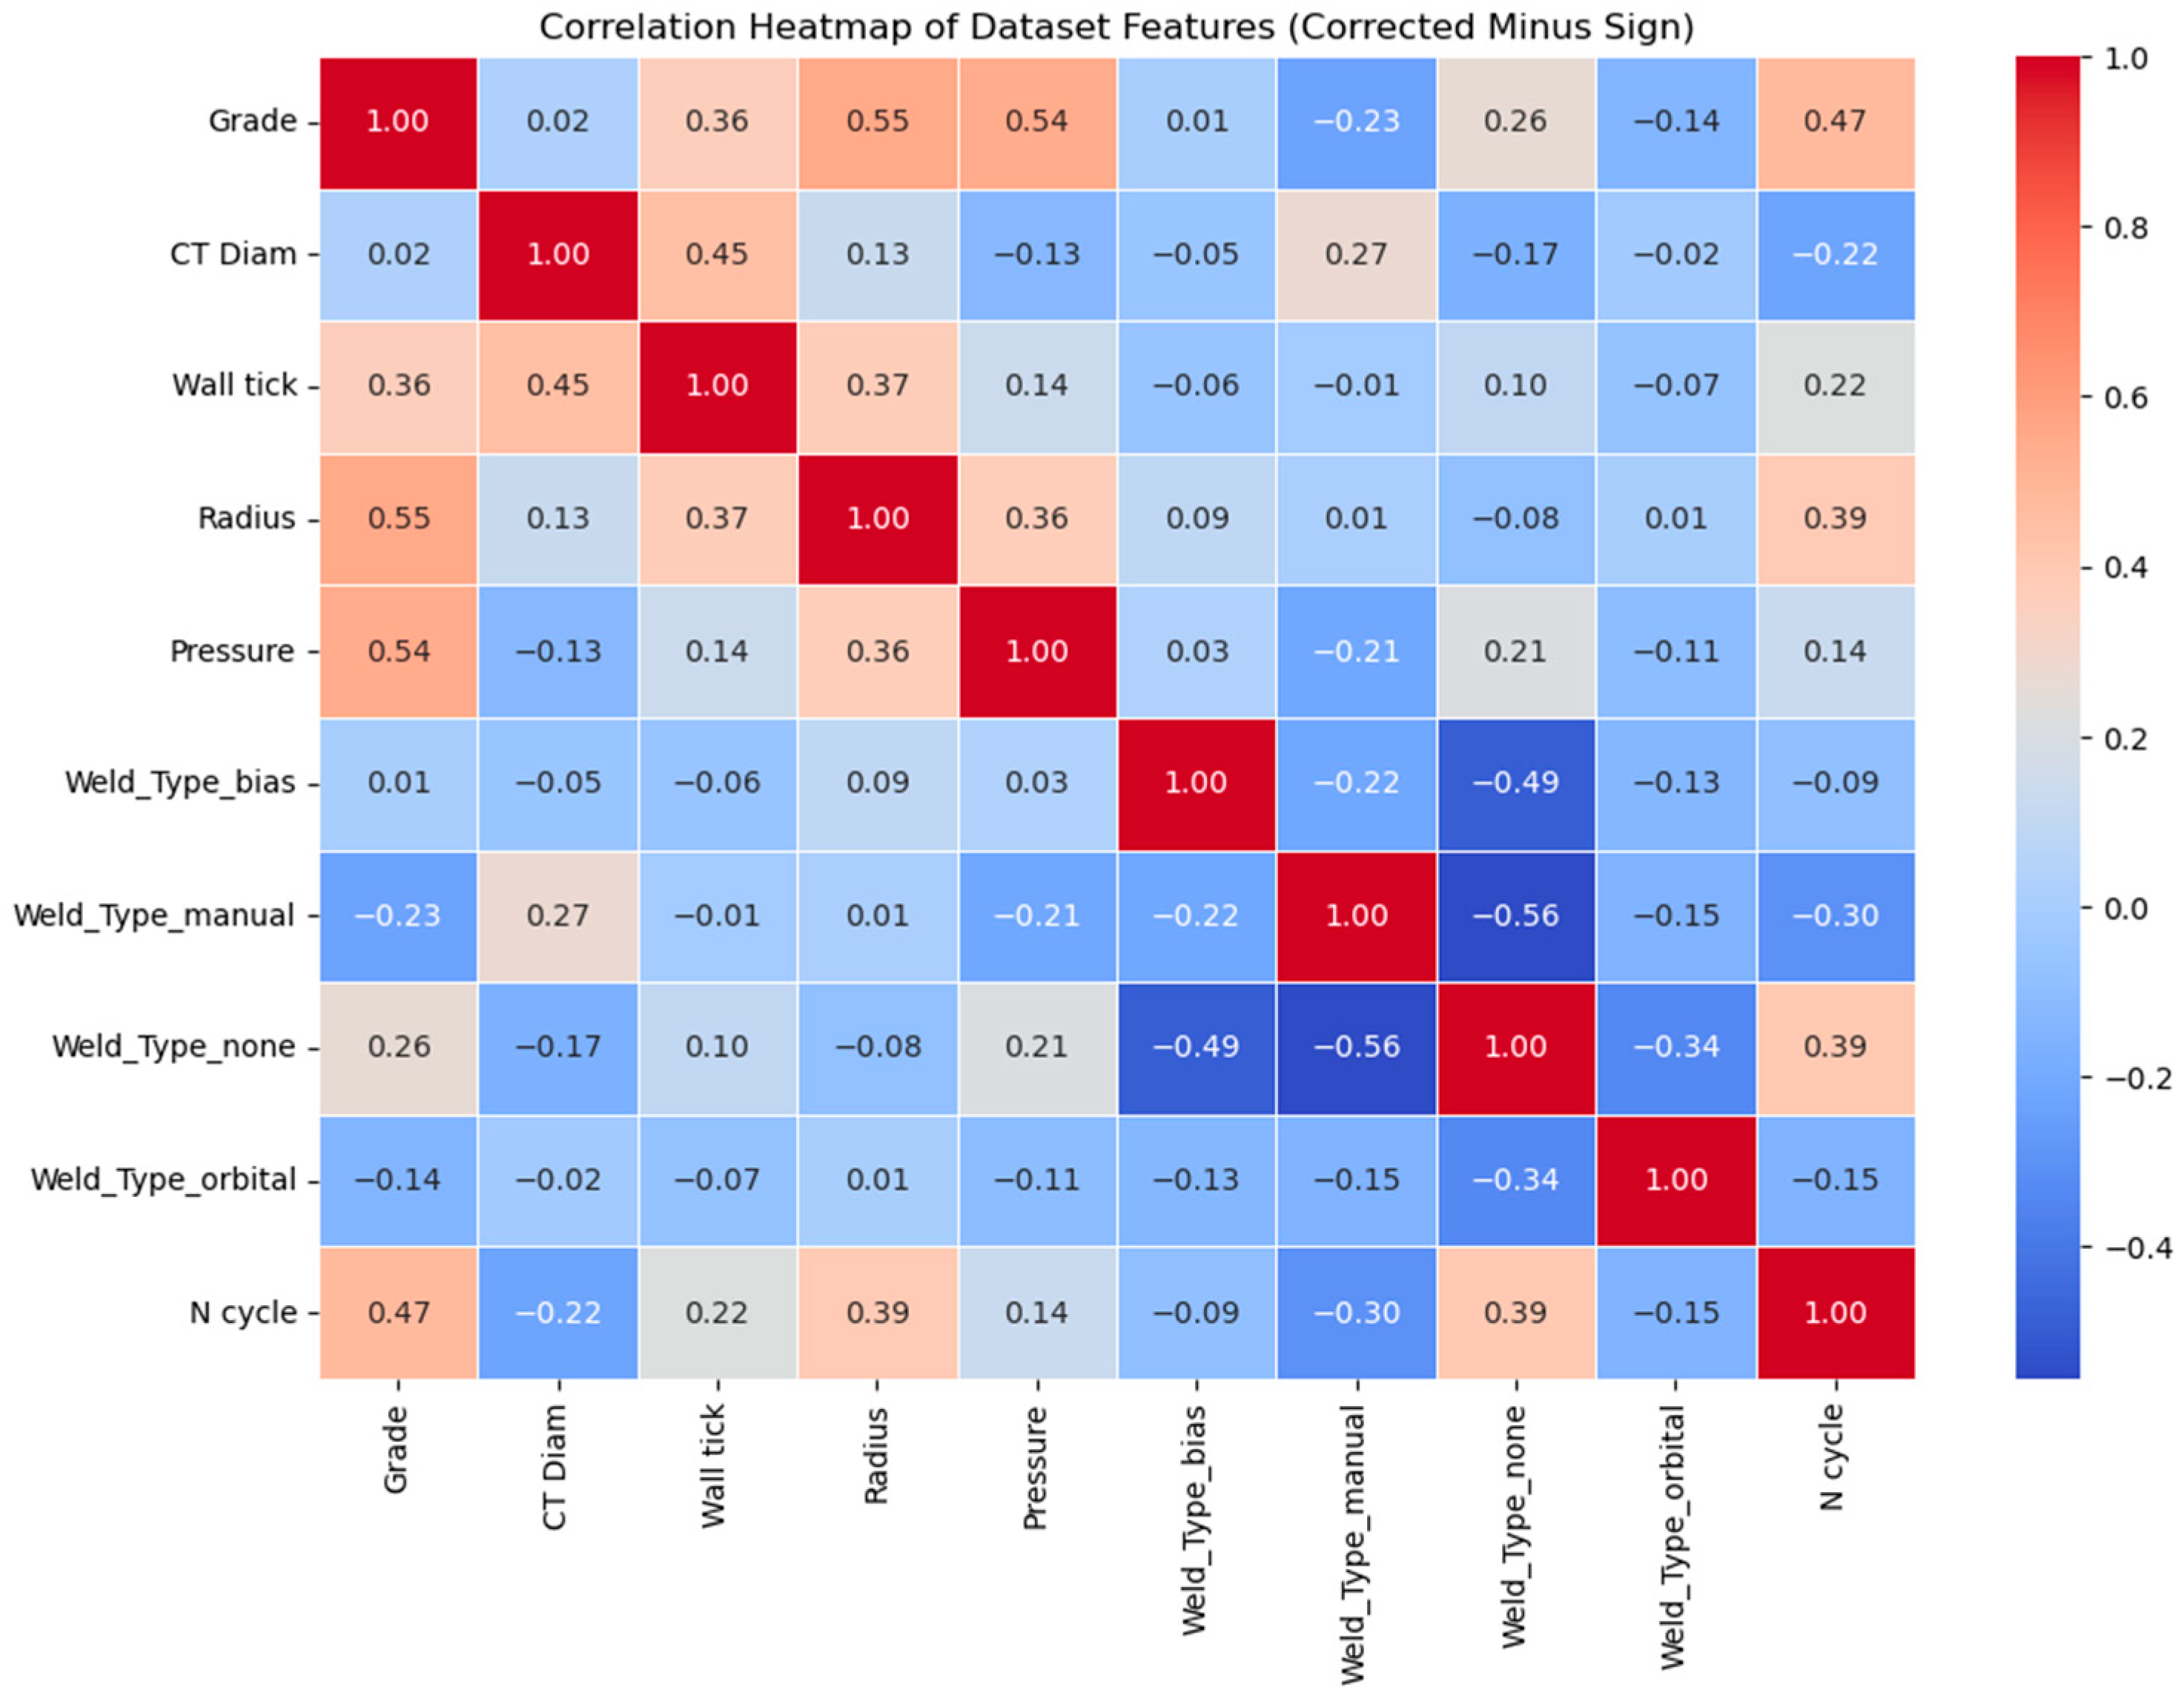
7.1. Heatmap Correlation
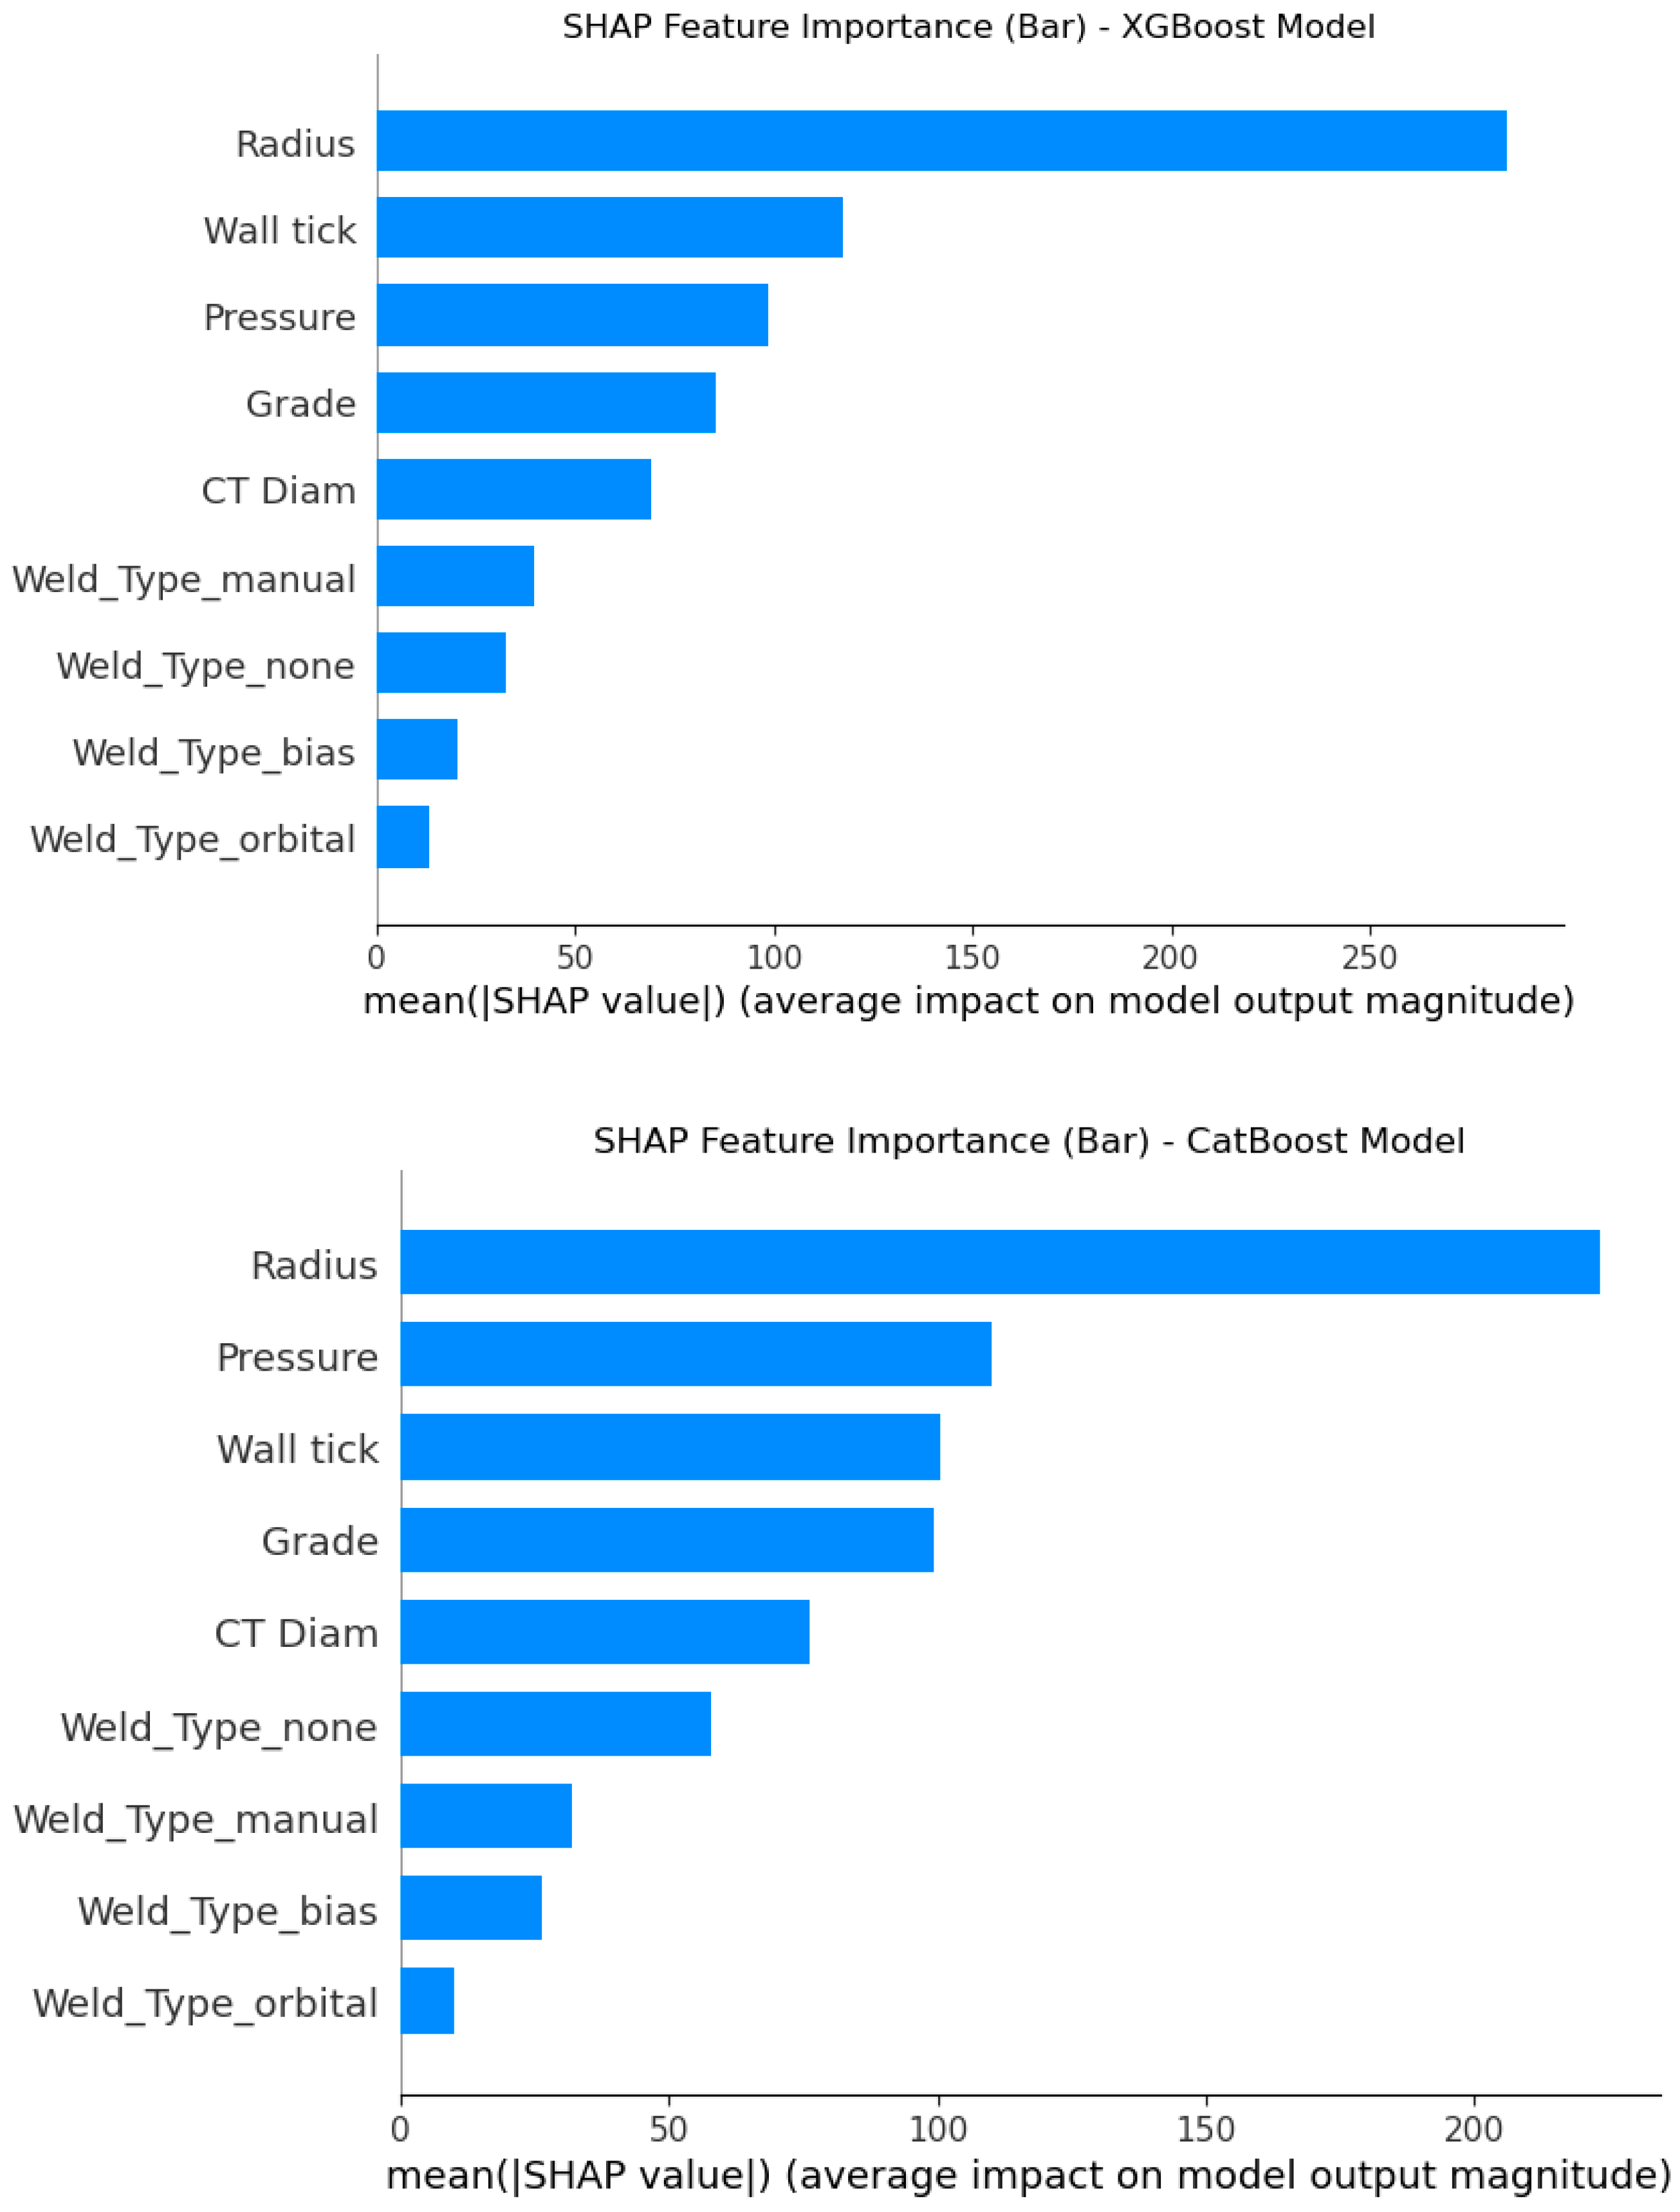
7.2. SHAP Feature Importance Analysis
7.3. Influence of Dominant Features on Fatigue Behavior
7.3.1. Radius of Curvature: The Most Significant Factor
7.3.2. Material Grade: Direct Influence on Fatigue Resistance
7.3.3. Wall Thickness: Stress Distribution Impact
7.3.4. Internal Pressure: Limited Direct Effect on Fatigue Life
7.3.5. Weld Type
7.3.6. Engineering Implications of ML-Driven Feature Importance
Analysis
- Reducing the bending radius significantly shortens fatigue life → Designing tubing with larger radii, where feasible, can increase operational lifespan.
- Higher-grade materials exhibit greater fatigue resistance → Material selection should prioritize grades with superior fatigue endurance properties.
- Wall thickness improves fatigue resistance but is not the primary driver → Optimizing tubing thickness alone will not compensate for poor radius selection.
- Internal pressure effects on fatigue life are secondary → Operators should focus more on cyclic bending stress management instead of just pressure control.
- Welding effects can be minimized through quality control → Proper welding techniques and post-weld treatments (e.g., stress relief and shot peening) can help reduce fatigue-related failures.
7.4. Conclusions
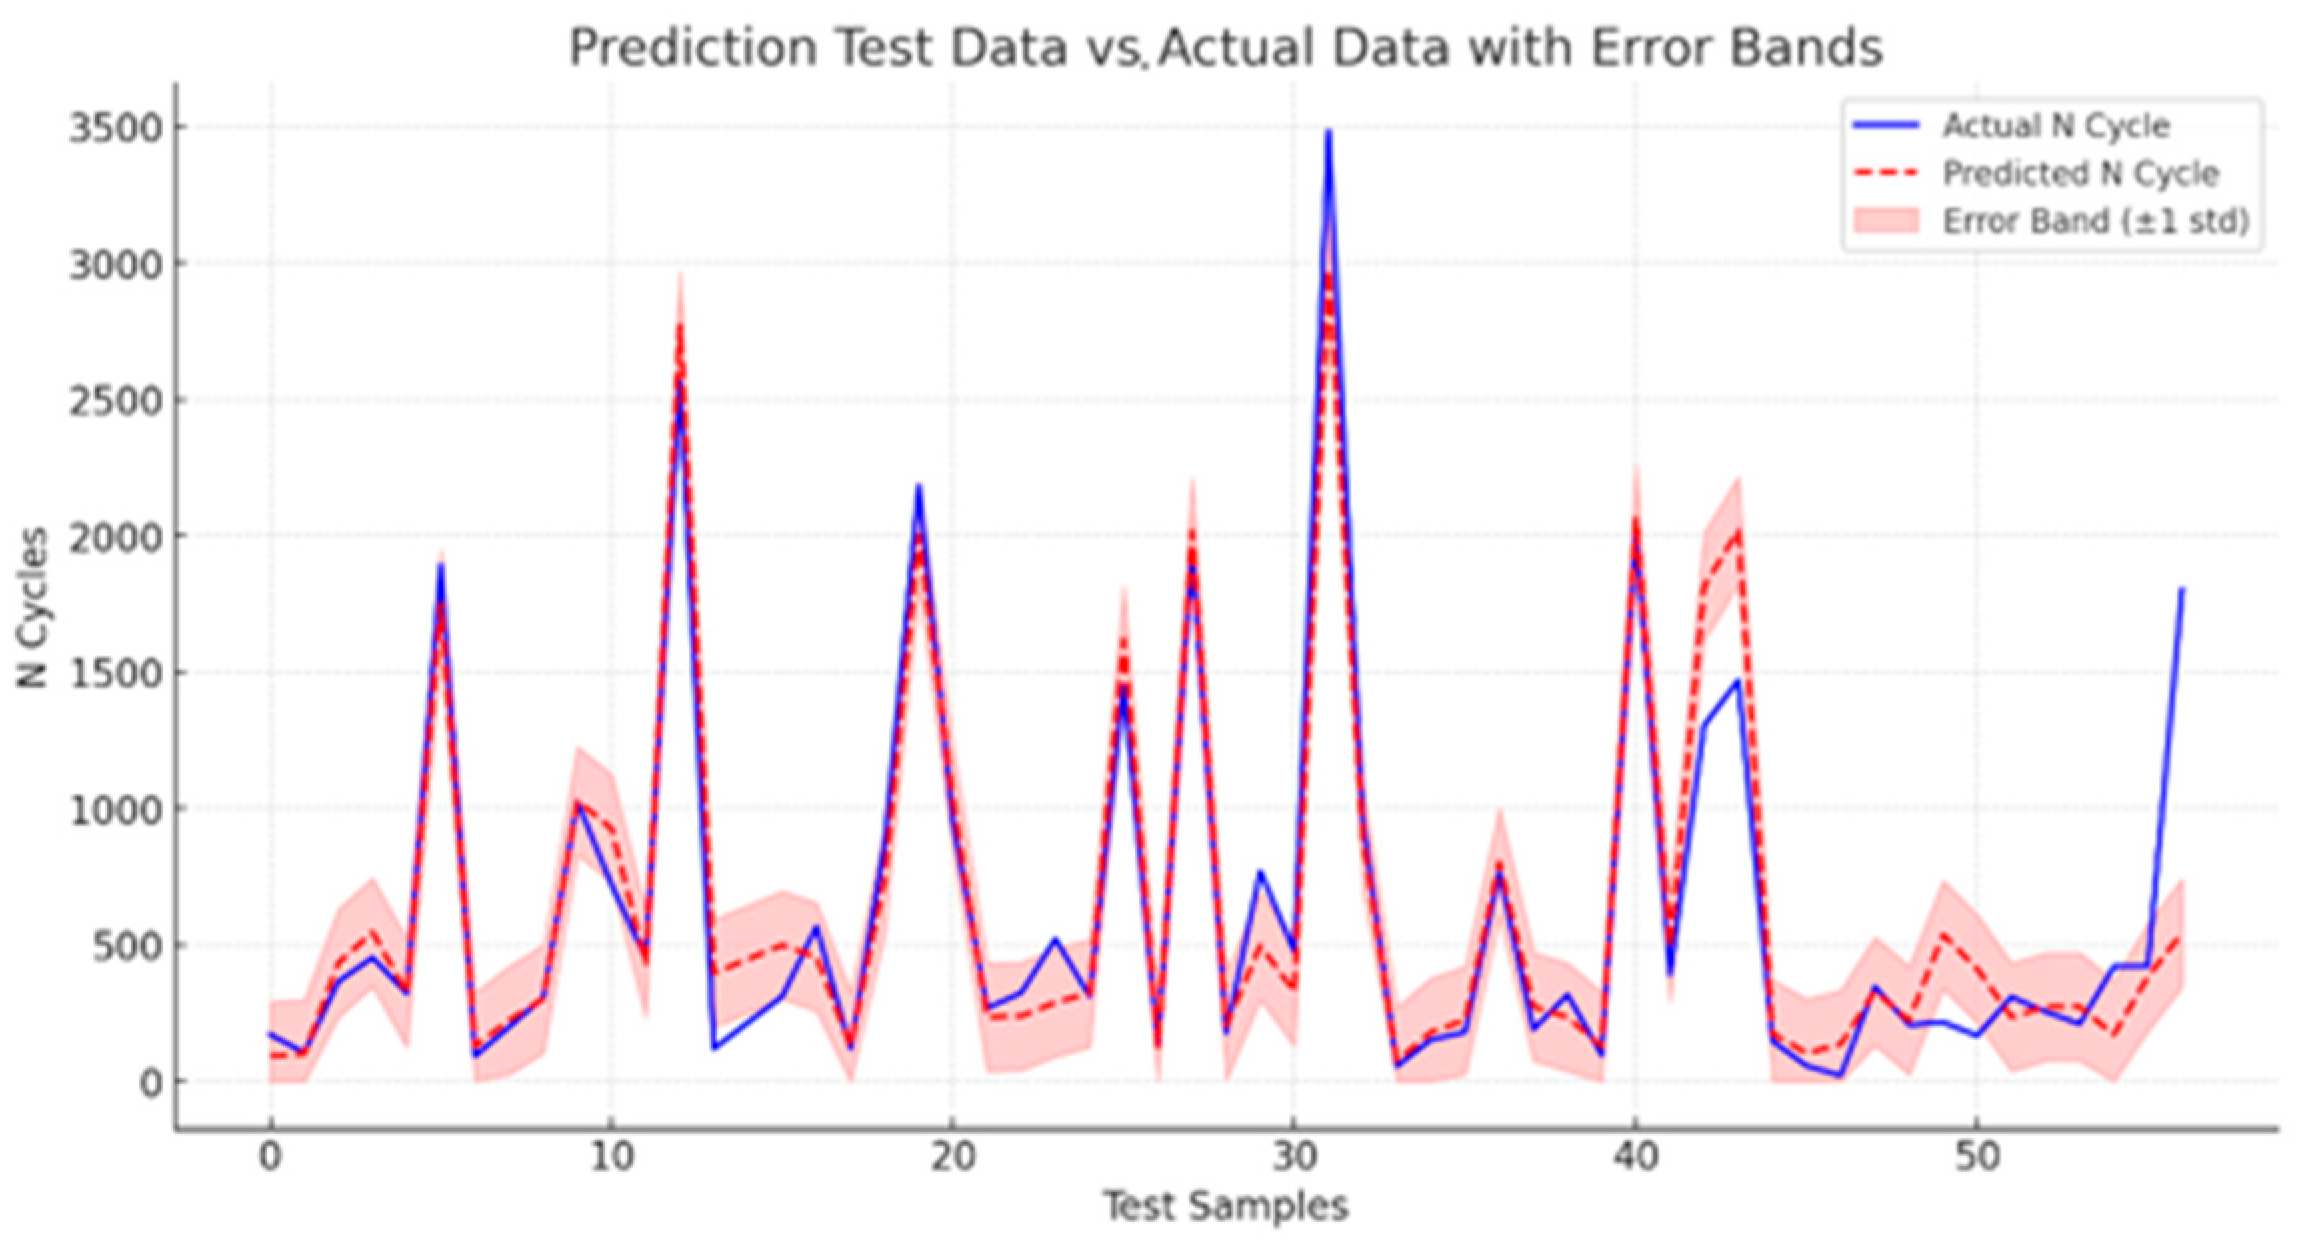
8. Prediction Analysis
ML Modeling Analysis
9. General Conclusions
Author Contributions
Funding
Institutional Review Board Statement
Informed Consent Statement
Data Availability Statement
Conflicts of Interest
Abbreviations
| CT | Coiled tubing |
| ML | Machine learning |
| GBR | Gradient Boosting Regressor |
| SVR | Support Vector Regressor |
| RF | Random Forest |
| ANN | Artificial neural network |
| LR | Linear Regressor |
| SVR | Support Vector Regressor |
| XGB | XGBoost |
| CatB | CatBoost |
| ANN | Artificial neural network |
| BP | Back propagation |
| R2 | Coefficient of determination |
| MSE | Mean squared error |
| MAE | Root absolute error |
| MAPE | Average absolute percentage error |
| N | Number of cycles to failures |
Appendix A
| Parameters of Polynomial Features | |
| Parameter | Value |
| degree | 2 (Default) |
| include_bias | FALSE |
| interaction_only | FALSE |
| Tree Depths of Models | |
|---|---|
| Model | Tree Depth (max_depth) |
| Decision Tree | 5 |
| XGBoost | 3 |
| Random Forest | None (grows fully until stopping criteria are met) |
| CatBoost | 4 |
| ANN Hyperparameters | |
|---|---|
| Parameter | Value |
| Hidden Layers | 3 |
| Neurons per Layer | [100, 50, 25] |
| Activation Function | ReLU |
| Optimizer | Adam (learning rate = 0.001) |
| Loss Function | MSE (mean squared error) |
| Batch Size | 32 |
| Epochs | 1000 (or until early stopping) |
| ANN Architecture | ||
|---|---|---|
| Layer | Type | Details |
| Input Layer | Dense (Fully Connected) | Neurons = Number of Features |
| Hidden Layer 1 | Dense (Fully Connected) | Neurons = 100, Activation = ReLU |
| Hidden Layer 2 | Dense (Fully Connected) | Neurons = 50, Activation = ReLU |
| Hidden Layer 3 | Dense (Fully Connected) | Neurons = 25, Activation = ReLU |
| Output Layer | Dense (Fully Connected) | Neurons = 1, Activation = Linear |
| Best Decision Tree Parameters | Best XGBoost Parameters | ||
| Hyperparameter | Value | Hyperparameter | Value |
| max_depth | 5 | n_estimators | 500 |
| min_samples_split | 2 | max_depth | 3 |
| min_samples_leaf | 1 | learning_rate | 0.2 |
| subsample | 0.8 | ||
| colsample_bytree | 0.8 | ||
| Best Random Forest Parameters | Best CatBoost Parameters | ||
| Hyperparameter | Value | Hyperparameter | Value |
| n_estimators | 500 | iterations | 1000 |
| max_depth | None | depth | 4 |
| min_samples_split | 2 | learning_rate | 0.1 |
| min_samples_leaf | 2 | l2_leaf_reg | 7 |
| bootstrap | TRUE | border_count | 32 |
References
- Neog, D.; Sarmah, A.; Baruah, M.I.S. Computational analysis of coiled tubing concerns during oil well intervention in the upper Assam basin, India. Sci. Rep. 2023, 13, 1795. [Google Scholar] [CrossRef] [PubMed]
- Li, Y.; Gao, X.-L.; Ni, L.; Hu, Q.; Xin, Y. Fatigue of coiled tubing and its influencing factors: A comparative study. In Proceedings of the ASME International Mechanical Engineering Congress and Exposition, Phoenix, AZ, USA, 11–17 November 2016. [Google Scholar]
- Shaohu, L.; Feng, G.; Xianjin, W.; Hui, X.; Zhen, W.; Ting, Y. Theoretical and experimental research of bearing capacity and fatigue life for coiled tubing under internal pressure. Eng. Fail. Anal. 2019, 104, 1133–1142. [Google Scholar] [CrossRef]
- Bridge, C. Combining elastic and plastic fatigue damage in steel pipelines, risers, and coiled tubing. SPE Drill. Complet. 2012, 27, 493–500. [Google Scholar] [CrossRef]
- Zhao, G.; Zhong, J.; Feng, C.; Liang, Z. Simulation of ultra-low cycle fatigue cracking of coiled tubing steel based on cohesive zone model. Eng. Fract. Mech. 2020, 235, 107201. [Google Scholar] [CrossRef]
- Chen, J.; Liu, Y. Fatigue modeling using neural networks: A comprehensive review. Fatigue Fract. Eng. Mater. Struct. 2022, 45, 945–979. [Google Scholar] [CrossRef]
- Tipton, S.M. Multiaxial plasticity and fatigue life prediction in coiled tubing. In Advances in Fatigue Lifetime Predictive Techniques: 3rd Volume; ASTM International: West Conshohocken, PA, USA, 1996. [Google Scholar]
- Newman, K.R. Development of a new CT life tracking process. In Proceedings of the SPE/ICoTA Well Intervention Conference and Exhibition, The Woodlands, TX, USA, 26–27 March 2013; p. SPE 163884. [Google Scholar]
- Milella, P.P. Strain-Based Fatigue Analysis—Low Cycle Fatigue. In Fatigue and Corrosion in Metals; Springer: Berlin/Heidelberg, Germany, 2024; pp. 355–411. [Google Scholar]
- Newman, K.; Kelleher, P. CT Fatigue Modeling Update. In Proceedings of the SPE/ICoTA Well Intervention Conference and Exhibition, Houston, TX, USA, 22–23 March 2016; p. SPE 179049. [Google Scholar]
- Wu, J. Coiled tubing working life prediction. In Proceedings of the SPE Oklahoma City Oil and Gas Symposium/Production and Operations Symposium, Oklahoma City, OK, USA, 2–4 April 1995. [Google Scholar]
- Tipton, S.M. The Achilles Fatigue Model; CTES LP User Technical Note; CTES: Conroe, TX, USA, 1999. [Google Scholar]
- Avakov, V.A.; Martin, J. Large Coiled Tubing Fatigue Life. In Proceedings of the SPE/ICoTA Well Intervention Conference and Exhibition, San Antonio, TX, USA, 5–8 October 1997; p. SPE 38407. [Google Scholar]
- Tian, X.; Zhang, H.; Duan, Q.; Ji, Y. Establishment and application of fatigue life prediction models for coiled tubing. In Proceedings of the Pressure Vessels and Piping Conference, Boston, MA, USA, 19–23 July 2015. [Google Scholar]
- Liu, B.; Li, T.; Xu, L.; Han, B.; Zhuang, H.; Li, S. Effect of surface defects and internal pressure on fatigue life of coiled tubing. In Proceedings of the 9th China-Russia Symposium “Coal in the 21st Century: Mining, Intelligent Equipment and Environment Protection” (COAL 2018), Qingdao, China, 18–21 October 2018; pp. 185–189. [Google Scholar]
- Zhong, J.; Guanghui, Z.; Litong, W.; Yi, H.; Sihai, H. Experimental and Numerical Study on LCF Crack Propagation of Coiled Tubing Steel. Mechanics 2022, 28, 351–357. [Google Scholar] [CrossRef]
- Bunge, J.M.; Coloschi, M.; Cravero, S.; Valdez, M.; Reichert, B.; Grimaldo, C. Coiled Tubing Premature Failure–The Effects of Pressure and Strain. In Proceedings of the SPE/ICoTA Well Intervention Conference and Exhibition, The Woodlands, TX, USA, 22–23 March 2022; p. SPE 208996. [Google Scholar]
- Padron, T.; Aitken, B. CT100+ Bias Weld Fatigue Life Estimations-Are Adjustments Required? In Proceedings of the SPE/ICoTA Well Intervention Conference and Exhibition, Houston, TX, USA, 22–23 March 2016; p. SPE 179045. [Google Scholar]
- Ishak, J.; Santos, M.A.; Tipton, S.M. Numerical and Experimental Analysis of Cyclic Strains in Coiled Tubing Surface Defects for Fatigue Life Assessment. In Proceedings of the SPE/ICoTA Well Intervention Conference and Exhibition, Houston, TX, USA, 21–22 March 2017; p. SPE 184761. [Google Scholar]
- Sherman, S.; Majko, S.M.; Otto, J. High Strength Coiled Tubing-How is Fatigue Life Affected by Slip Damage? In Proceedings of the SPE/ICoTA Well Intervention Conference and Exhibition, The Woodlands, TX, USA, 24 March 2020; p. SPE 199859. [Google Scholar]
- Faszold, J.; Rosine, R.; Spoering, R. Full-Scale Fatigue Testing With 130K Yield Tubing. In Proceedings of the SPE/ICoTA Well Intervention Conference and Exhibition, The Woodlands, TX, USA, 27–28 March 2012; p. SPE 153945. [Google Scholar]
- Tipton, S.M.; Smalley, E.; VanArnam, D. Influence of a straightener on coiled tubing fatigue. In Proceedings of the SPE/ICoTA Well Intervention Conference and Exhibition, The Woodlands, TX, USA, 27–28 March 2012. [Google Scholar]
- Headrick, D.; Rosine, R. Full-scale coiled tubing fatigue tests with tubing pressures to 15,000 psi. In Proceedings of the SPE/ICoTA Well Intervention Conference and Exhibition, Houston, TX, USA, 25–26 May 1999; p. SPE 54482. [Google Scholar]
- Reichert, B.; Nguyen, T.; Rolovic, R.; Newman, K. Advancements in Fatigue Testing and Analysis. In Proceedings of the SPE/ICoTA Well Intervention Conference and Exhibition, Houston, TX, USA, 22–23 March 2016; p. SPE 179064. [Google Scholar]
- Association, D.E. Underbalanced Drilling and Completion Manual, DEA; Maurer Engineering Inc.: Austin, TX, USA, 1996; p. 101. [Google Scholar]
- Falcone, R.; Lima, C.; Martinelli, E. Soft computing techniques in structural and earthquake engineering: A literature review. Eng. Struct. 2020, 207, 110269. [Google Scholar] [CrossRef]
- Yang, D.; Jin, A.; Li, Y. A Novel Physics-Guided Neural Network for Predicting Fatigue Life of Materials. Appl. Sci. 2024, 14, 2502. [Google Scholar] [CrossRef]
- Peng, S.; Xiao, J.-Q.; Tian, Y.; Zhang, Y.; Feng, J.; Hu, Z.-J. Coiled tubing working life prediction based on BP algorithm of artificial neural network. In Proceedings of the IADC/SPE Asia Pacific Drilling Technology Conference and Exhibition? Tianjin, China, 9–11 July 2012. [Google Scholar]
- Newman, K.; Brown, P. Development of a standard coiled-tubing fatigue test. In Proceedings of the SPE Annual Technical Conference and Exhibition? Houston, TX, USA, 3–6 October 1993; p. SPE 26539. [Google Scholar]
- Zhang, L.-G.; Yue, Q.-B.; Luo, M. The prediction of the low cycle fatigue life about the coiled tubing with ovality and wall thickness. J. Fail. Anal. Prev. 2017, 17, 1288–1296. [Google Scholar] [CrossRef]
- Rispler, K.; McNichol, J.; Matiasz, K.; Rheinlander, M. Using an artificial neural network to develop a wall-loss model for coiled tubing fracturing operations. In Proceedings of the SPE/ICoTA Well Intervention Conference and Exhibition, Houston, TX, USA, 7–8 March 2001; p. SPE 68420. [Google Scholar]
- Sisak, W.; Crawford, D. The fatigue life of coiled tubing. In Proceedings of the SPE/IADC Drilling Conference and Exhibition, Dallas, TX, USA, 15–18 February 1994; p. SPE 27437. [Google Scholar]
- Elliott, K.; Graham-Wright, T.; Williams, C.; Hampson, R.; Portillo, B.; Cuaron, A. Development and Compatibility Testing of Coiled Tubing with 140-ksi Specified Minimum Yield Strength. In Proceedings of the SPE/ICoTA Well Intervention Conference and Exhibition, Houston, TX, USA, 21–22 March 2017; p. SPE 184806. [Google Scholar]
- Chitwood, G.; Lewis, P.; Fowler, S.; Zernick, W. High-Strength Coiled Tubing Expands Service Capabilities. In Proceedings of the Offshore Technology Conference, Houston, TX, USA, 24 May 1992; p. OTC 7032-MS. [Google Scholar]
- VanArnam, W.D.; Hargis, C. New Higher-Strength Coiled Tubing Developed To Extend Coiled Tubing Operating Envelopes. In Proceedings of the SPE/ICoTA Well Intervention Conference and Exhibition, The Woodlands, TX, USA, 5–6 April 2011; p. SPE 143152. [Google Scholar]
- Brown, P.A.; Arnam, D.V. Coiled Tubing Weld Cycle Life. 1995. Available online: https://www.athenaeng.com/publications/1995_10_DEA_97_CT_Weld_Cycle_Life_Report.pdf (accessed on 1 March 2025).
- Shaohu, L.; Hao, Z.; Hui, X.; Quanquan, G. A new theoretical model of low cycle fatigue life for coiled tubing under coupling load. Eng. Fail. Anal. 2021, 124, 105365. [Google Scholar] [CrossRef]
- Padron, T.; Datahan, G. Effect of external mechanical damage on the fatigue life of coiled tubing exposed to sour environments: Criteria for CT100 grade. In Proceedings of the SPE/ICoTA Well Intervention Conference and Exhibition, The Woodlands, TX, USA, 31 March–1 April 2009. [Google Scholar]
- Valdez, M.; Morales, C.; Rolovic, R.; Reichert, B. The development of high-strength coiled tubing with improved fatigue performance and H2S resistance. In Proceedings of the SPE/ICoTA Well Intervention Conference and Exhibition, The Woodlands, TX, USA, 24–25 March 2015; p. SPE 173639. [Google Scholar]

| Regressor | Definition | Advantages | Objective |
|---|---|---|---|
| Linear Regression | A technique that models the relationship between the input features and the target variable as a straight line. | Easy to interpret and implement - Computationally efficient - Effective for data that have a linear relationship. | To estimate continuous outcomes by fitting a linear equation that minimizes the squared differences between predicted and actual values. |
| Decision Tree | A model that splits the dataset into branches based on feature values to predict the target variable. | Easy to interpret and visualize - Handles both categorical and continuous features - No need for feature scaling. | To make predictions by dividing the data into smaller subsets, forming a tree structure with decision rules at each branch. |
| Random Forest | An ensemble method that constructs multiple decision trees using different data samples and averages the predictions. | More accurate than individual decision trees - Handles non-linear patterns - Less prone to overfitting. | To enhance prediction accuracy by combining the output of multiple decision trees trained on various random samples of the data. |
| XGBoost | A highly optimized version of gradient boosting, designed for fast, scalable, and accurate modeling. | Very efficient with large datasets - Can handle missing data well - Customizable and offers regularization to avoid overfitting. | To deliver fast and accurate predictions using an optimized gradient boosting approach, particularly useful for large and complex datasets. |
| CatBoost | A gradient boosting algorithm specifically designed to handle categorical features directly without needing extensive preprocessing. | Automatically handles categorical data - Less prone to overfitting - Fast and scalable. | To efficiently work with categorical data while delivering high predictive accuracy, reducing the need for feature encoding. |
| Support Vector Regressor (SVR) | A regression model that predicts continuous values by finding a hyperplane in a high-dimensional feature space. | Performs well in high-dimensional spaces - Robust against outliers - Can model non-linear relationships using kernel functions. | To predict continuous values by maximizing the margin of tolerance, especially useful in high-dimensional data with potential outliers. |
| Artificial Neural Networks (ANNs) | A computational model inspired by biological neurons, designed to capture complex patterns through multiple layers of interconnected nodes. | Can model very complex patterns - Can handle non-linear relationships. | To predict continuous values by learning intricate relationships between input features using a multi-layered network structure. |
| R2 Train | MSE Train | MAE Train | MAPE Train | R2 Test | MSE Test | MAE Test | MAPE Test | R2 Val | MSE Val | MAE Val | MAPE Val | |
|---|---|---|---|---|---|---|---|---|---|---|---|---|
| Linear Regression | 0.79 | 71,043.3 | 162.86 | 41.6 | 0.74 | 137,571 | 179.6 | 95.2 | 0.17 | 238,488 | 227 | 102.6 |
| Decision Tree | 0.98 | 5325.93 | 34.49 | 13.93 | 0.90 | 52,927.47 | 140.34 | 31.18 | 0.96 | 12,851.32 | 81.48 | 34.31 |
| Random Forest | 0.97 | 8808.89 | 58.99 | 20.92 | 0.91 | 46,218.97 | 133.08 | 36.72 | 0.93 | 21,229.60 | 106.67 | 60.11 |
| CatBoost | 0.98 | 5676.25 | 42.42 | 16.16 | 0.95 | 26,838.36 | 94.67 | 26.41 | 0.95 | 13,412.97 | 83.05 | 36.38 |
| XGBoost | 0.98 | 5326.35 | 34.72 | 13.99 | 0.94 | 32,084.48 | 109.97 | 27.97 | 0.95 | 13,372.35 | 83.24 | 34.29 |
| SVR | −0.11 | 380,259.08 | 344.41 | 92.22 | −0.18 | 617,471.00 | 453.79 | 114.22 | −0.07 | 308,336.33 | 320.95 | 132.93 |
| ANN | −2297.66 | 786,764,411.21 | 23,004.33 | 10,138.22 | −1366.43 | 714,863,123.33 | 22,284.46 | 9517.33 | −3439.14 | 991,063,768.03 | 23,647.49 | 16,981.80 |
| Mechanistic Summary | ||
|---|---|---|
| Feature | Correlation with N Cycle | Mechanistic Explanation |
| Wall Thickness | 0.26 | Thicker walls reduce stress concentration, delaying fatigue failure. |
| Weld_Type_none | 0.37 | No welds = No defects, better fatigue resistance. |
| CT Diameter | −0.29 | Larger diameter → Higher bending stress → Lower fatigue life. |
| Weld_Type_manual | −0.39 | Manual welding introduces defects and residual stress, reducing fatigue life. |
| Weld_Type_orbital | −0.16 | Orbital welding still causes some HAZ effects, slightly reducing fatigue life. |
| Grade | 0.24 | Higher grades offer better fatigue resistance. |
| Pressure | −0.06 | Weak influence; bending loads dominate over internal pressure. |
| Radius | 0.3 | Larger bending radius reduces strain, increasing fatigue life. |
Disclaimer/Publisher’s Note: The statements, opinions and data contained in all publications are solely those of the individual author(s) and contributor(s) and not of MDPI and/or the editor(s). MDPI and/or the editor(s) disclaim responsibility for any injury to people or property resulting from any ideas, methods, instructions or products referred to in the content. |
© 2025 by the authors. Licensee MDPI, Basel, Switzerland. This article is an open access article distributed under the terms and conditions of the Creative Commons Attribution (CC BY) license (https://creativecommons.org/licenses/by/4.0/).
Share and Cite
Moulay Brahim, K.; Hadjadj, A.; Abidi Saad, A.; Abidi Saad, E.; Horra, H. Innovative Approach Integrating Machine Learning Models for Coiled Tubing Fatigue Modeling. Appl. Sci. 2025, 15, 2899. https://doi.org/10.3390/app15062899
Moulay Brahim K, Hadjadj A, Abidi Saad A, Abidi Saad E, Horra H. Innovative Approach Integrating Machine Learning Models for Coiled Tubing Fatigue Modeling. Applied Sciences. 2025; 15(6):2899. https://doi.org/10.3390/app15062899
Chicago/Turabian StyleMoulay Brahim, Khalil, Ahmed Hadjadj, Aissa Abidi Saad, Elfakeur Abidi Saad, and Hichem Horra. 2025. "Innovative Approach Integrating Machine Learning Models for Coiled Tubing Fatigue Modeling" Applied Sciences 15, no. 6: 2899. https://doi.org/10.3390/app15062899
APA StyleMoulay Brahim, K., Hadjadj, A., Abidi Saad, A., Abidi Saad, E., & Horra, H. (2025). Innovative Approach Integrating Machine Learning Models for Coiled Tubing Fatigue Modeling. Applied Sciences, 15(6), 2899. https://doi.org/10.3390/app15062899


