1. Introduction
The COVID-19 outbreak quickly began to spread around the world and was classified as a pandemic by the World Health Organization (WHO) in March 2020 [
1]. After more than four years, despite the lack of agreement by experts [
2] or ordinary people of daily life, the WHO has not officially called back the pandemic status of COVID-19 [
1]. According to the WHO database, 777,126,421 total cumulative cases were reported worldwide just a week before the end of 2024 [
3]. Thanks to the vaccination efforts, the number of deaths has reduced, but COVID-19 is still a very dangerous disease whose short- and long-term health effects have not yet been fully understood.
The pandemic has affected every aspect of life, including the energy sector [
4]. The pandemic measures reduced the overall demand for electricity worldwide [
5]. The residential demand largely increased, whereas the industrial and commercial demand significantly reduced. The reduction in the latter outweighed the increase in the first. Thus, the power mix was altered [
6]. However, statistics [
7] from later stages of the pandemic show that, due to the relaxation of COVID-19 measures, the energy demand saw a resurgence, surpassing pre-pandemic demand levels.
The trends above verify the complexity of the problem. Understanding the pandemic to the fullest extent is crucial for designing a resilient and sustainable future since future pandemics might be inevitable [
8]. Calling in a responsive healthcare system, researching microorganisms, and redesigning energy policies alone may not be enough. After all, it is a complex optimization problem with many layers. One of the many remedies is to collect as much data as possible.
Despite the interest and the impressive amount of high-quality research, the majority of energy forecasting-related studies in the literature use data on macro levels. There are not enough contributions that narrowed down their research to more micro levels, i.e., sector-focused or building-focused applications (see
Section 2 for more detail). Hospitals/Healthcare facilities formed the frontline in the struggle against COVID-19. For example, a hospital with the size and power of the one analyzed in this study is an industrial behemoth. Strategically, it is vital for such a healthcare complex’s energy management to be efficient and resilient versus unpredictable consumption patterns. Demand forecasting, therefore, may help the building adjust itself and adapt to changing levels of consumption even in the face of an event like the pandemic, thus creating the primary motivation behind this paper.
The novelties and contributions of this research may sum up as follows:
The first research using DNN and GEP methods among the related works (see
Section 2).
The first study in Türkiye that uses actual on-site data to investigate the impact of COVID-19 on electrical energy demand. In addition, there has not yet been another research study in Türkiye with hospitals/healthcare facilities as its application domain.
One of the very few works among [
9,
10] around the world investigating the impact of the pandemic on the energy demand of hospitals/healthcare facilities by utilizing on-site data.
First study that incorporates the electricity consumption, weather, and COVID-19 data all together in the forecasting equations.
The data have been collected over the entire active stage of the pandemic (March 2020–June 2022). Many related works in the literature only cover a portion of this time frame.
The remainder of this paper is organized in the following order.
Section 2 covers a literature survey to investigate the impact of COVID-19 on the electricity demand. The similarities and differences between these works are discussed and illustrated in a table.
Section 3 consists of the material and methods. The material explains how the data were collected and wrangled. It defines the input variables and their correlations. The section ends with a description of the methods that are used for the data analysis, namely DNN and GEP.
Section 4 discusses the results of the data analysis. The impact of the pandemic on electricity consumption and forecasting results are thoroughly presented. Finally, in conclusions, a summary has been made, and the outputs of the study and future works are elaborated.
2. Related Work or Literature Survey
The lockdown measures taken by the authorities to combat the COVID-19 pandemic have created abrupt and radical changes all over the world. Responding to this shocking new routine has been a challenge for researchers and energy policymakers as the black swan event nature of the outbreak has caught them off-guard with little data in hand. One of the most severely affected branches of the energy sector has been, without a doubt, the electricity market. However, the research community has begun to catch up and has gained some momentum due to the increasing availability of electricity usage data provided by official organizations like the International Energy Agency (IEA) and energy agencies of individual countries or collected by their own initiatives.
Türkiye was among the countries with the highest number of COVID-19 cases during the pandemic’s peak years. Hence, lockdowns with strict measures were frequently enforced in 2020 and 2021. The impact of these lockdowns on electricity demand has been investigated by researchers using forecasting, prediction, and statistical approaches. This research aims to forecast the electricity demand with the COVID-19 period’s electricity consumption data, but to clarify, its’ literature review focuses on the electricity demand during the pandemic in general without diverging as production vs. consumption. The authors of [
11] have investigated the impact of COVID-19 on electricity consumption by proposing an Artificial Neural Network (ANN)-based short-term forecasting method. Another study [
12] has employed several renowned machine learning methods to predict the electricity consumption demand and compared their performances. The work in [
13] has investigated the oil demand and the electricity. The authors of [
14] conveyed a forecasting analysis for electrical energy demand and generation. Researchers of [
15,
16] have inspected the pandemic’s impact from the viewpoint of renewables’ share in the generation mix. In [
17], the electricity demand of a sector in an industrial zone has been predicted using an AI-based technique. The paper [
18] has developed a novel Convolutional Neural Network (CNN)-based algorithm for short-term forecasting of the electricity demand using hourly consumption data between March 2020 and March 2021.
Almost all these studies have considered either the early stages of the pandemic or its first year. In addition, besides [
17], they have used openly available data shared by official Turkish sources and/or international organizations. The consensus in these results has been that the overall demand for electric energy reduced except for the industrial zone case study [
17], where the demand increased. It is not surprising as the energy intensity can be expected to differ among residential, commercial, and industrial zones, including individual ones in each category, but speaking of the impact of the COVID-19 pandemic, an undeniably critical forecasting case would be from the healthcare facilities. Nevertheless, very few studies have investigated the case.
A study from Italy [
9] and another from Australia [
10] have shed some light on the impact of the pandemic on the electricity consumption of hospitals. Zini and Carcasci [
9] have developed an offline monitoring system to address the future electrical energy requirements of a hospital using 2020’s data. They have concluded that the demand was lower than the standard situation due to the reduction in both the general out-patient traffic and the consequential decline in the exploitation of the air conditioning (AC) units. In [
10], additional factors of occupancy and AC unit usage have been considered. However, the study has not correlated energy consumption much with changes in occupancy. Instead, it has stressed that the impact of seasonal temperature seemed much higher than the occupancy factor regarding electricity use; therefore, they have proposed a model to predict future uses, especially with climate change in mind. Liu et al. [
19] have reviewed a substantial amount of literature on energy consumption prediction by building types (3% of which are hospitals). Despite the fact that the majority of the literature in their review was published during the pandemic’s first two years, papers explicitly investigating its impact on the electrical energy demand of healthcare facilities were almost non-existent to our observation.
Although the COVID-19 pandemic and climate change are not directly related, another important question arises, i.e., How does the new demand profile impact the share of renewables exactly? The authors of [
15] have forecast an increase in the use of renewables, whereas a decrease in the use of conventional energy sources in Türkiye for 2022. The results of [
16] have predicted an increasing trend in Germany, France, Spain, Türkiye, and the UK for 2021. Studies like [
20,
21] have indicated the rising proportion of Renewable Energy Sources (RES) in the UK as a result of the pandemic-induced decline in total electricity demand. The short-term impact of COVID-19 on the share of photovoltaics in the Spanish electricity sector has been investigated by [
22]. The impact of the COVID-19 pandemic on the energy sector of China has been investigated in [
23,
24,
25]. The authors of [
23] have discussed the possibilities offered by the RES, namely their decentralized nature and widespread availability, offering more reliability compared to fossil fuels in extreme situations like the pandemic. Researchers of [
26,
27] have drawn similar policy implications for Colombia and Qatar, respectively, suggesting the encouragement of renewable energy technologies based on data collected before and during the pandemic. The global energy demand growth and the rising prices of electricity in the midst of the COVID-19 crisis have been verified by [
28], and the wind energy potential of Poland has been assessed positively but with limitations and challenges in mind. Although the research community appears to have reached a consensus on renewable energy being important for energy safety in situations like the pandemic, in practice, it is not as easy as it may seem. For instance, the negative impact of COVID-19 on India’s renewable energy market and targets have been discussed in [
29].
In regard to reliability, ref. [
20] have studied the impact of the pandemic on the grid stability of the UK. The results have stated that despite operating well in general, the grid was strained at times. For instance, the Loss of Load Probability (LOLP) indicators have demonstrated the inadequacy of resources/reserves corresponding to unusual system loads. The analysis has suggested more efficient balancing actions, taking into account the increased portion of RES in the generation of electricity. While interpreting these results, one might conclude the necessity of the transition from traditional to smart grids. Kwilinski et al. [
30] indeed have assessed the potential of smart grids using various indicators and point out the importance of flexibility of power networks for situations like the pandemic.
It is vital to bear in mind the uncertainty element in the nature of the variability between demand and generation during the pandemic. As an example, the researchers in [
31] have developed a stochastic model for long-term forecasting as they considered that the impacts of the pandemic on our lives will be long-lasting. The work in [
32] has employed the probabilistic Global Forecasting Method (GFM) to understand consumption patterns. Furthermore, some researchers have included mobility data as an exogenous factor for their prediction models [
33,
34]. These studies have provided insights into the correlation between pandemic-altered lifestyles and energy demand. The results of [
34] have shown that extra features like mobility data may also improve the accuracy of forecasting implementations. Furthermore, findings of [
35] have noted that some energy usage patterns persisted even after the ease of restrictions. Therefore, it has been deduced that models that can grasp behavioral patterns are also crucial. For example, authors of [
36] have taken a detailed look at their regional residential electricity consumption profiles, taking into account household income, wealth, and some demographics. Another research [
37] has considered the demographics under a global comparison and provides policy implications. They have both indicated the importance of the data beyond the first years of the pandemic. Besides the residential profile and patterns, some studies have analyzed the impact of COVID-19 on the demand profile of commercial buildings in their region [
38]. Another recent commercial building-focused research has been presented by [
39], but this study has used data collected from three specific buildings in 15-minute intervals instead of overall consumption.
In summary, it is clear that the analysis of data from different settlement zones, buildings as well as regions will help shape the energy policies better, making each study important on a macro level. As stated earlier, very few papers like the hospital case studies of [
9,
10] have used on-site data to analyze the impact of the pandemic on the electrical energy demand. There exist some university campus energy-management projects utilizing on-site data, such as [
40,
41,
42], but in general, publicly available electricity consumption data have been used. Besides that, the main difference between the aforementioned papers in this literature review was their methodical approaches.
A detailed outlook is provided in
Table 1, where reference works are compared based on forecast models (performed and benchmark), application types, and horizons. The word performed model means the model with the best result. In some cases, these are the researchers’ proposed models. Please note that some of the cited works are not included in the table. This is because a couple of them contain compiled results from several reviewed papers, which would be too large to fit, and some of them do not use forecasting methods.
Table 1 highlights the lack of hospital case studies among the related works. Compared to [
9,
10], the data collected for this research belongs to the entire active period of the pandemic. The temporal granularity is 15 min, and the forecasting was implemented hourly and daily, which is shorter term. It uses DNN and GEP methods and provides their benchmarking. It is also the first time they have been used in COVID-19-based forecasting studies. DNN and GEP methods offer several advantages, which are explained in detail in
Section 3.2. Their most significant advantage is that their model equations are comprehensible, allowing easier implementation while trying to find the relationships between the variables. The variables used are given in
Table 2, and it is the first time electrical, meteorological and COVID-19 variables are incorporated in such a way.
4. Results and Discussion
All computational works within the context of this study were carried out via a personal computer possessing a Macintosh operating system (version 15.1.1), an 8-core 3.6 GHz CPU (Intel Core i9, Intel, Santa Clara, CA, USA), and 100 GB RAM. For all computing tasks, RStudio Desktop (version 2024.09.1+394) was utilized as an integrated development environment due to having a well-suited rich ecosystem for machine learning applications and providing elegant visualization for academic writing [
59].
The data set was normalized between 0 and 1 according to minimum-maximum normalization due to the fact that scaling operation triggers eliminating the units of diversified variables, reduces computational time, reserves a smaller space on system memory, and benchmarks a myriad of features in a similar manner.
In the solution of the electricity demand forecasting problem via DNN and GEP methods during the COVID-19 pandemic, coefficient of determination (R
2), normalized mean absolute error (nMAE), and normalized root mean squared error (nRMSE) were used for performance evaluation along with computational time. The formulae of the aforementioned evaluation metrics are stated as follows:
where
and
are actual and predicted instances of the data,
illustrates the mean of the actual data and
n indicates the number of observations [
60,
61].
In this work, the quadratic reference function with two variables demonstrated in Equation (
1) is preferred for the DNN method. Model building parameters for the DNN method are thoroughly stated in the following:
The network parameters:
The maximum number of network layers: 20
The maximum number of polynomial order: 16
The tolerance for the convergence: 10−4
The number of neurons per layer: 20
Network layer connections: Only the previous layer
Overfitting protection control: Hold-out sample (20%)
Moreover, the GEP method utilizes several functions, including summation (+), subtraction (−), multiplication (∗), division (/), and square root (Q) for all simulations. Model building parameters for the GEP method are canonically represented as follows:
The magnitude of initial population: 50
The count of utmost attempts for primary population: 10,000
The number of genes per chromosome: 4
The head length of gene: 8
The number of utmost creations: 2000
The number of creations without enhancement: 1000
The termination value of the top chromosome’s fitness score: 1
The fitness function: Relative selection range
The rates of evolution parameter:
Mutation: 44‰
Gene, inversion, and transposition: 10%
One-point and two-point recombination: 30%
The linking function for all genes: Summation (+)
Features of random constants:
Type of constants: Real (Floating point)
Random real constants per gene: 10
Least constant value: −10
Utmost constant value: 10
Mutation rate: 1%
In addition to those, simple random sampling is used to validate both DNN and GEP methods in such a way that the in-sample covers 80% of the data set for training, while the out-of-sample is the rest 20% for testing, respectively.
4.1. An Hour-Ahead Forecast Results
In the hour-ahead DNN model, 5 out of 25 inputs (
,
,
,
,
) are employed in the prediction stage, and each polynomial equation were comprehensively shown in
Table 3. Recall that each variable used in this section was defined in
Section 3.1 and in
Table 2 in detail.
The final equation of the hour-ahead DNN model is summarized in Equation (
2),
where
N terms stand for the neurons that express unique quadratic functions (see
Table 3). In the hour-ahead GEP model, 4 out of 25 inputs (
,
,
, and
) are utilized as shown in Equation (
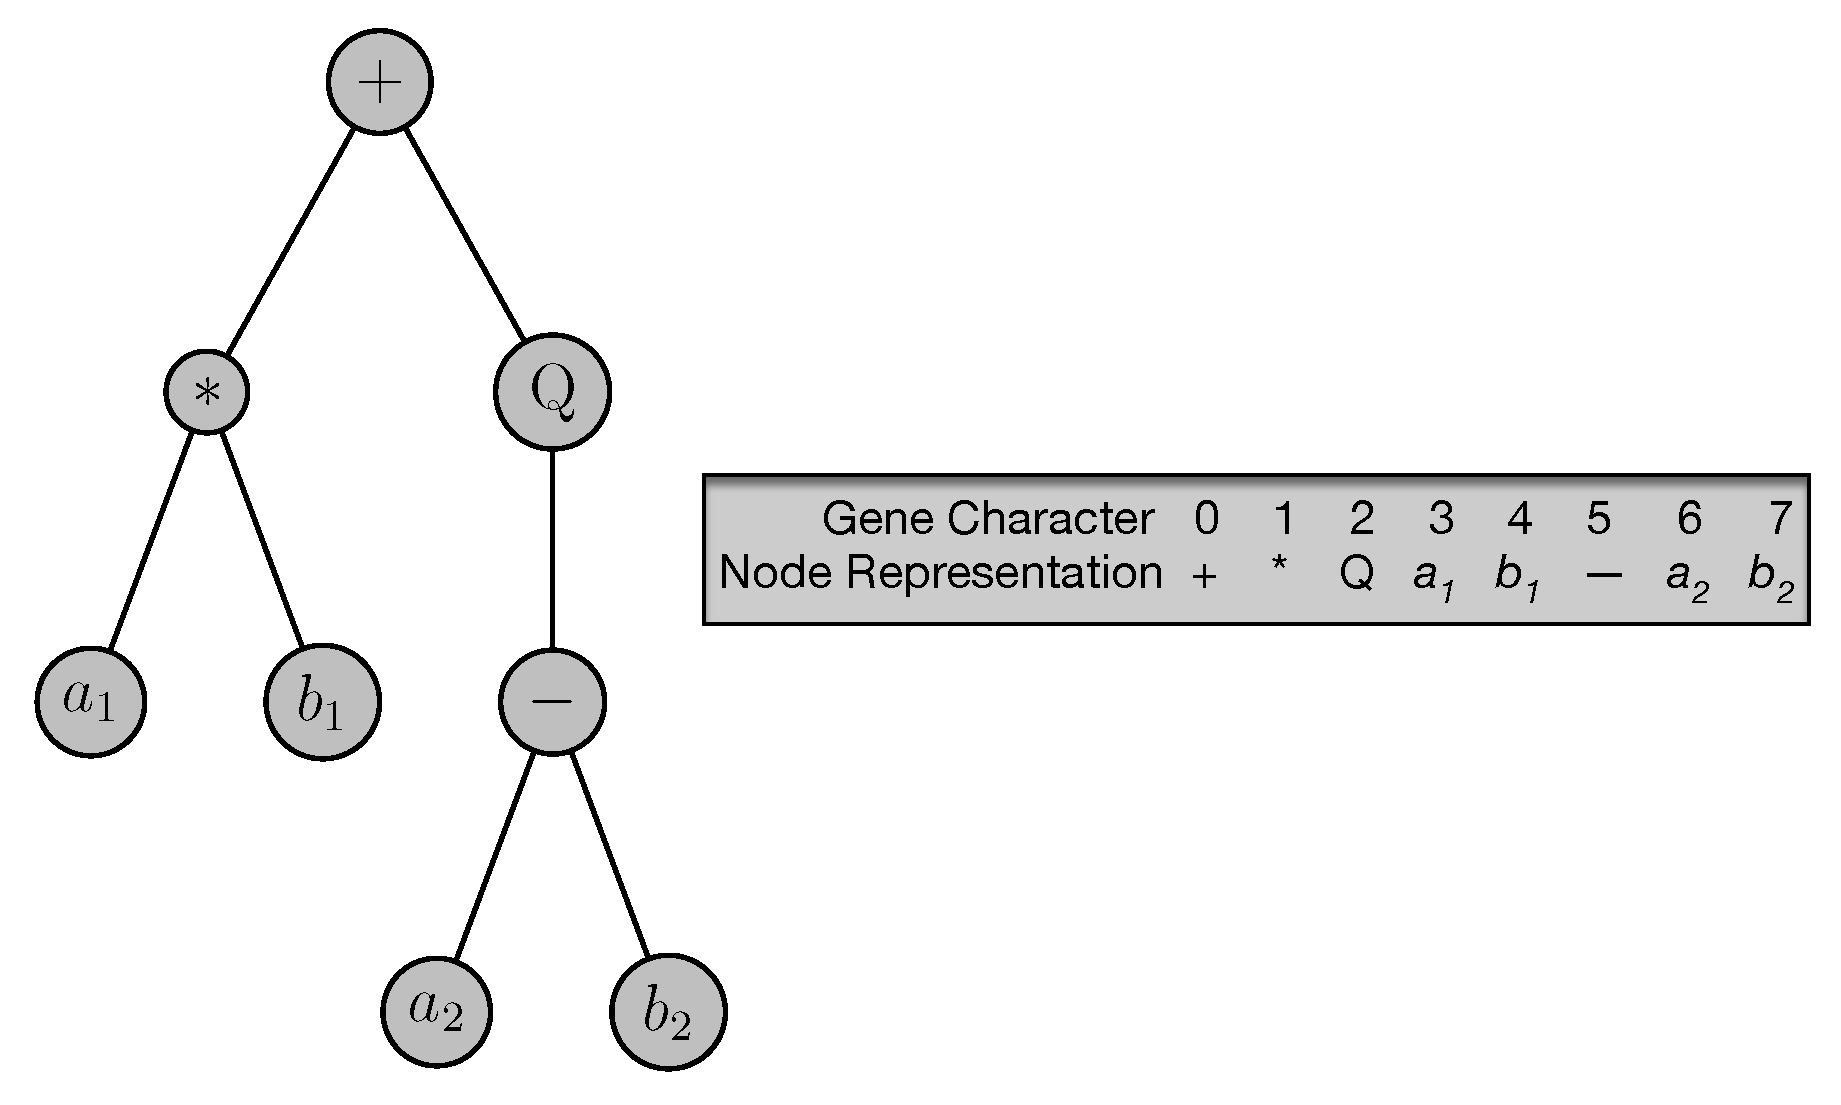
3) and visualized as an expression tree in
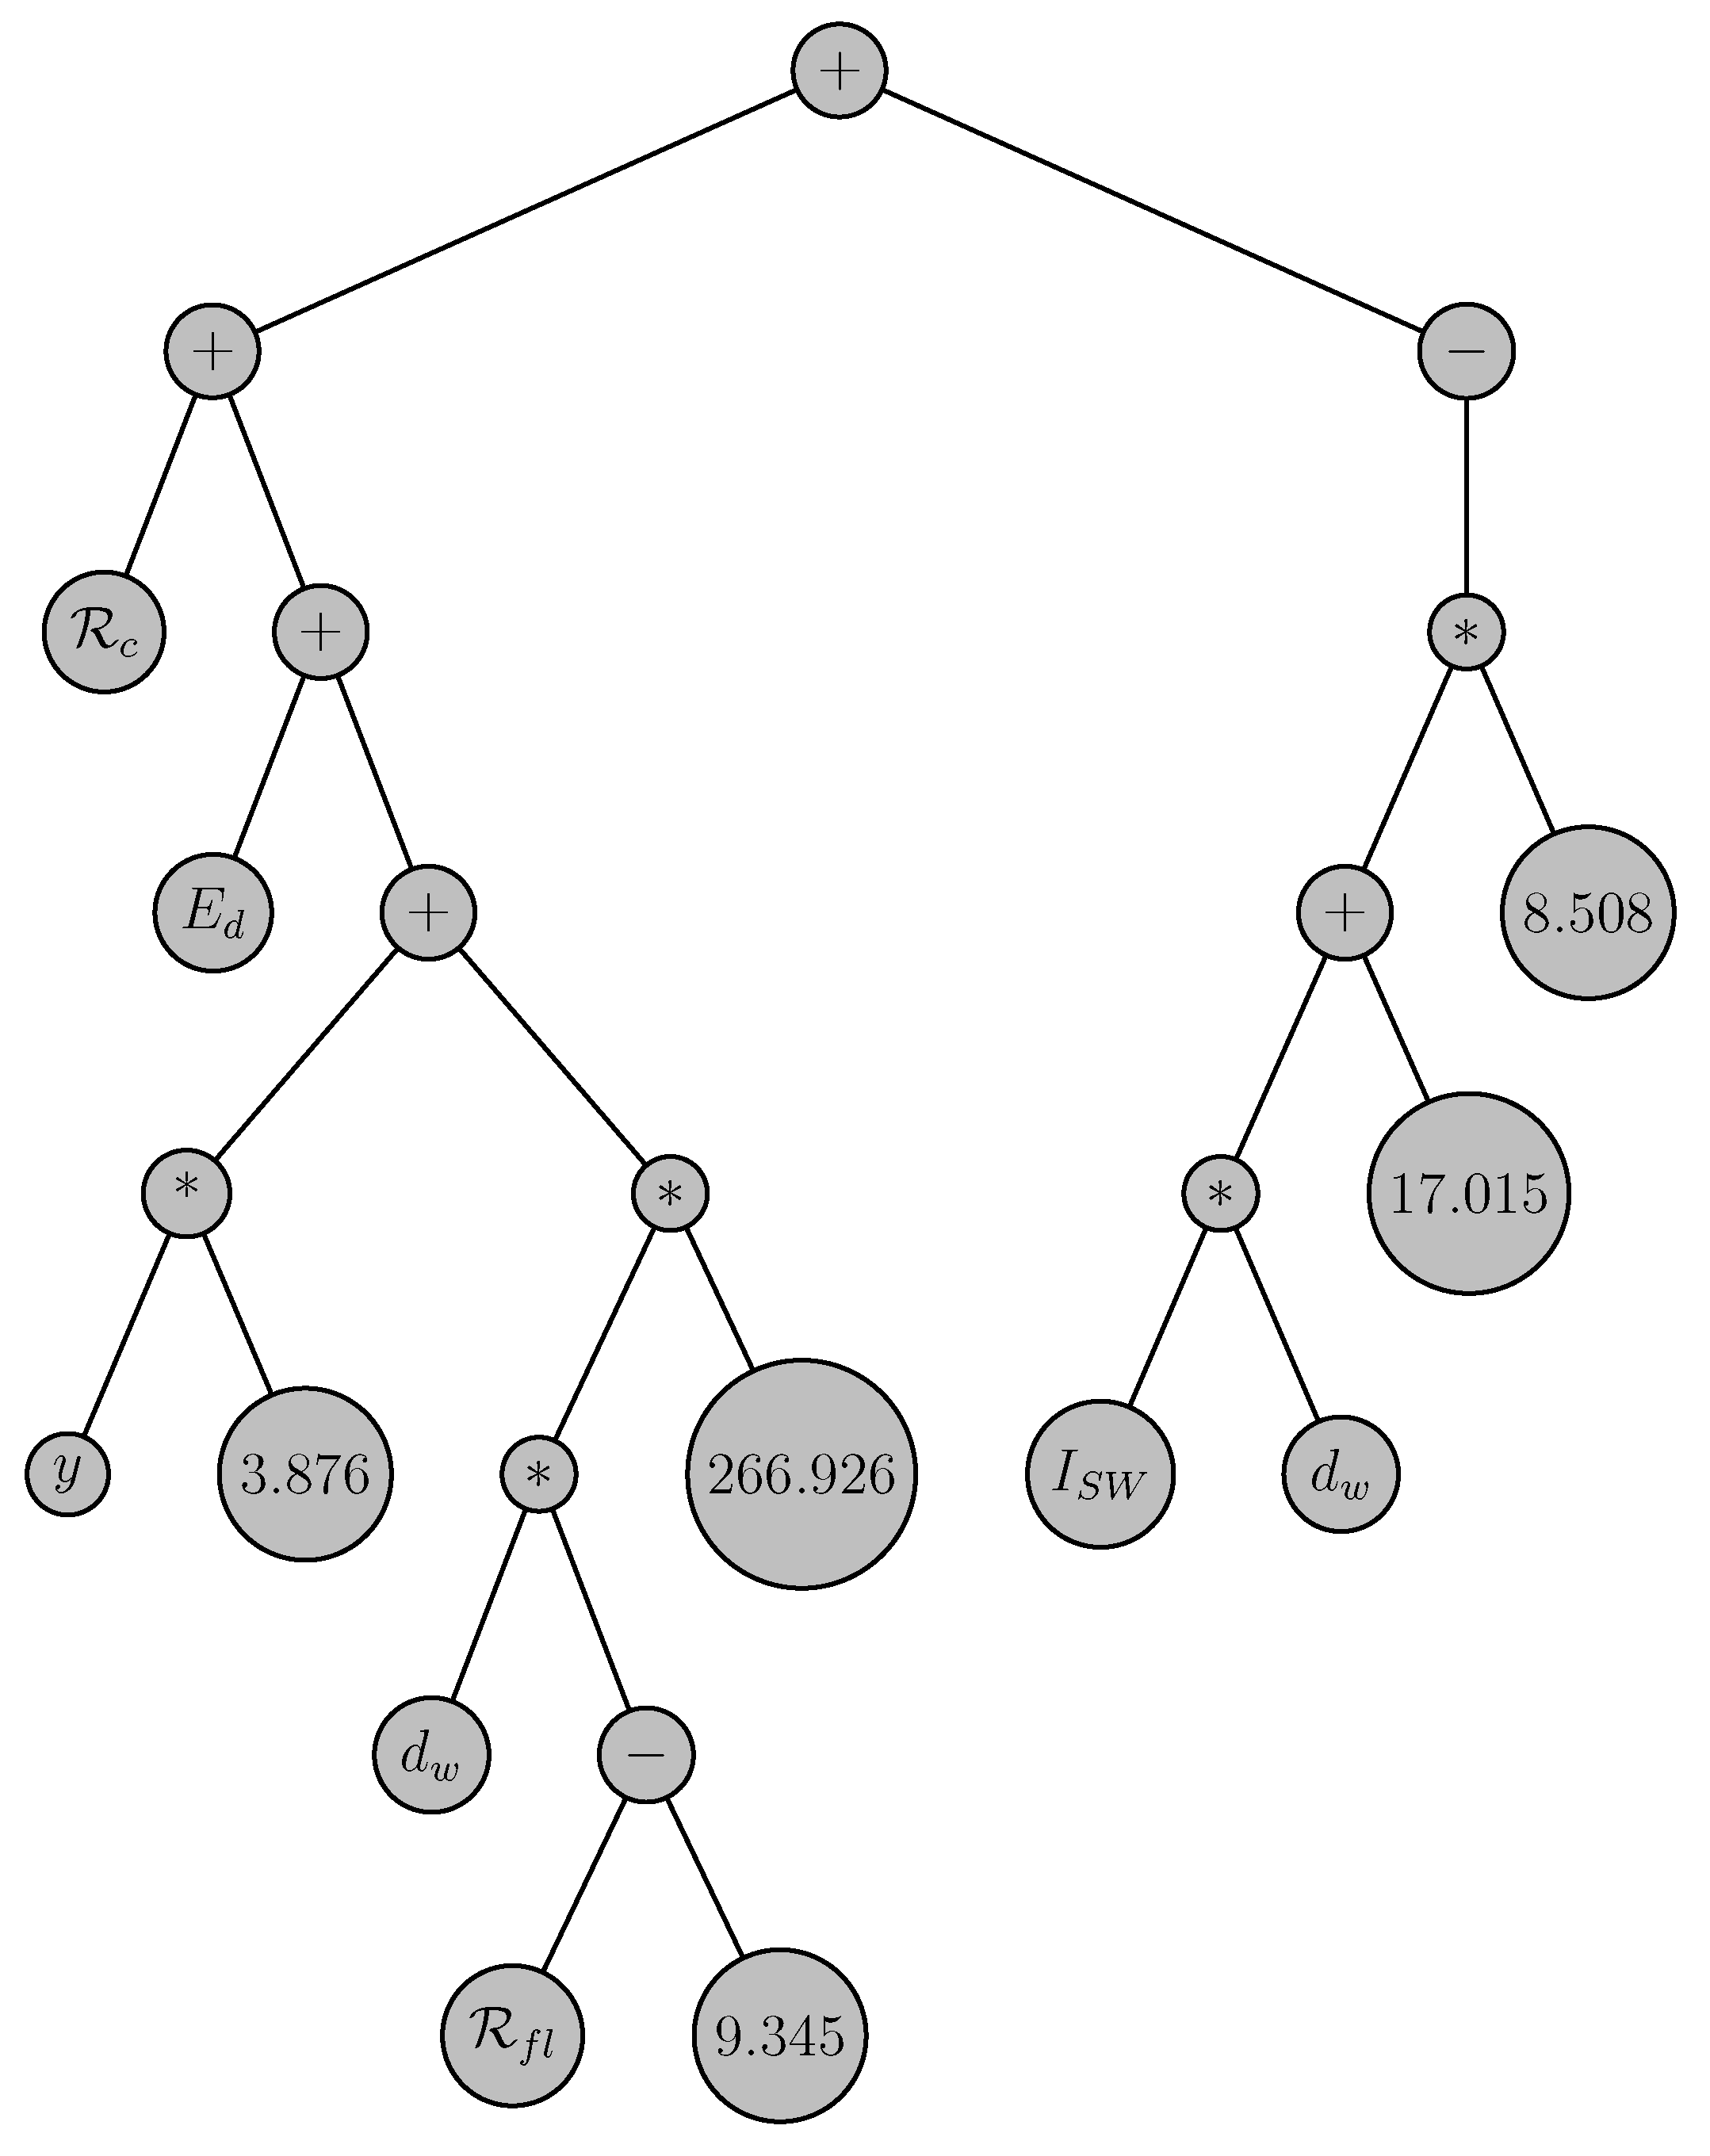
Figure 7.
In
Table 4, the hour-ahead model performance results of the proposed methods are presented in terms of R
2, nMAE, nRMSE, and run time for out-of-sample meticulously. According to
Table 4, the hour-ahead DNN model outperforms the corresponding GEP model by any means. In comparison with the GEP model, the DNN model shows 8.27% and 82.83% better performances with respect to nRMSE and computational time.
4.2. Day-Ahead Forecast Results
In the day-ahead DNN model, 6 out of 24 inputs (
,
,
,
,
, and
) are used in the forecasting stage and equation for each polynomial are rigorously illustrated in
Table 5.
The result equation of the day-ahead DNN model is summarized in Equation (
4).
In the day-ahead GEP model, 5 out of 24 inputs (
,
,
,
y, and
) are employed as indicated in Equation (
5) and illustrated as an expression tree in
Figure 8.
In
Table 6, the day-ahead model performance results of the proposed methods are demonstrated in detail. According to
Table 6, the day-ahead DNN model shows superior performance in comparison with the corresponding GEP model from any perspective. Compared to the GEP model, the DNN model indicates 14.32% and 78.56% better performances in terms of nRMSE and elapsed time.
4.3. Discussion
Predictive model equations of buildings’ electricity demand are accustomed to employing a variety of exogenous variables such as historical electricity demand, temperature, and, accordingly, short-wave irradiation along with calendar variables [
43]. It is the first time in the literature that this paper has attempted to introduce the significant quantities of a pandemic like COVID-19 to forecast an hour-ahead and day-ahead electricity demand of a large building complex serving as a university hospital.
For the hour-ahead forecasts, it is revealed that both of DNN and GEP model equations utilize the number of daily new cases to forecast the electricity demand. In addition, the hour-ahead DNN model used the number of cumulative cases, lockdown, and full lockdown restrictions.
Furthermore, the predicted day-ahead forecasts unveiled that DNN and GEP model equations both processed the full lockdown restriction in forecasting the electricity demand. Moreover, the day-ahead DNN model deployed the number of new cases, while the GEP model included the curfew-restriction parameter.
In comparison, the two hospital/healthcare application case studies that were previously discussed [
9,
10] use MLR and ANN methods, respectively. The MLR is a simple approach but prone to severe multicollinearity, and the ANN is quite a commonly used method with tendencies to overfitting. Furthermore, the resolution of the forecasting in this research is 15 min, which is much higher than the studies in comparison here. The forecast horizon is shorter and covers both hourly and daily predictions, adding to the novelty.
Consequently, it is considered that the effects of the aforementioned COVID-19 parameters in the model equations are unique and vital findings and also original contributions to the building electricity demand forecasting literature in the very short-term and short-term horizon not only for COVID-19 pandemics but also for forthcoming unprecedented events.
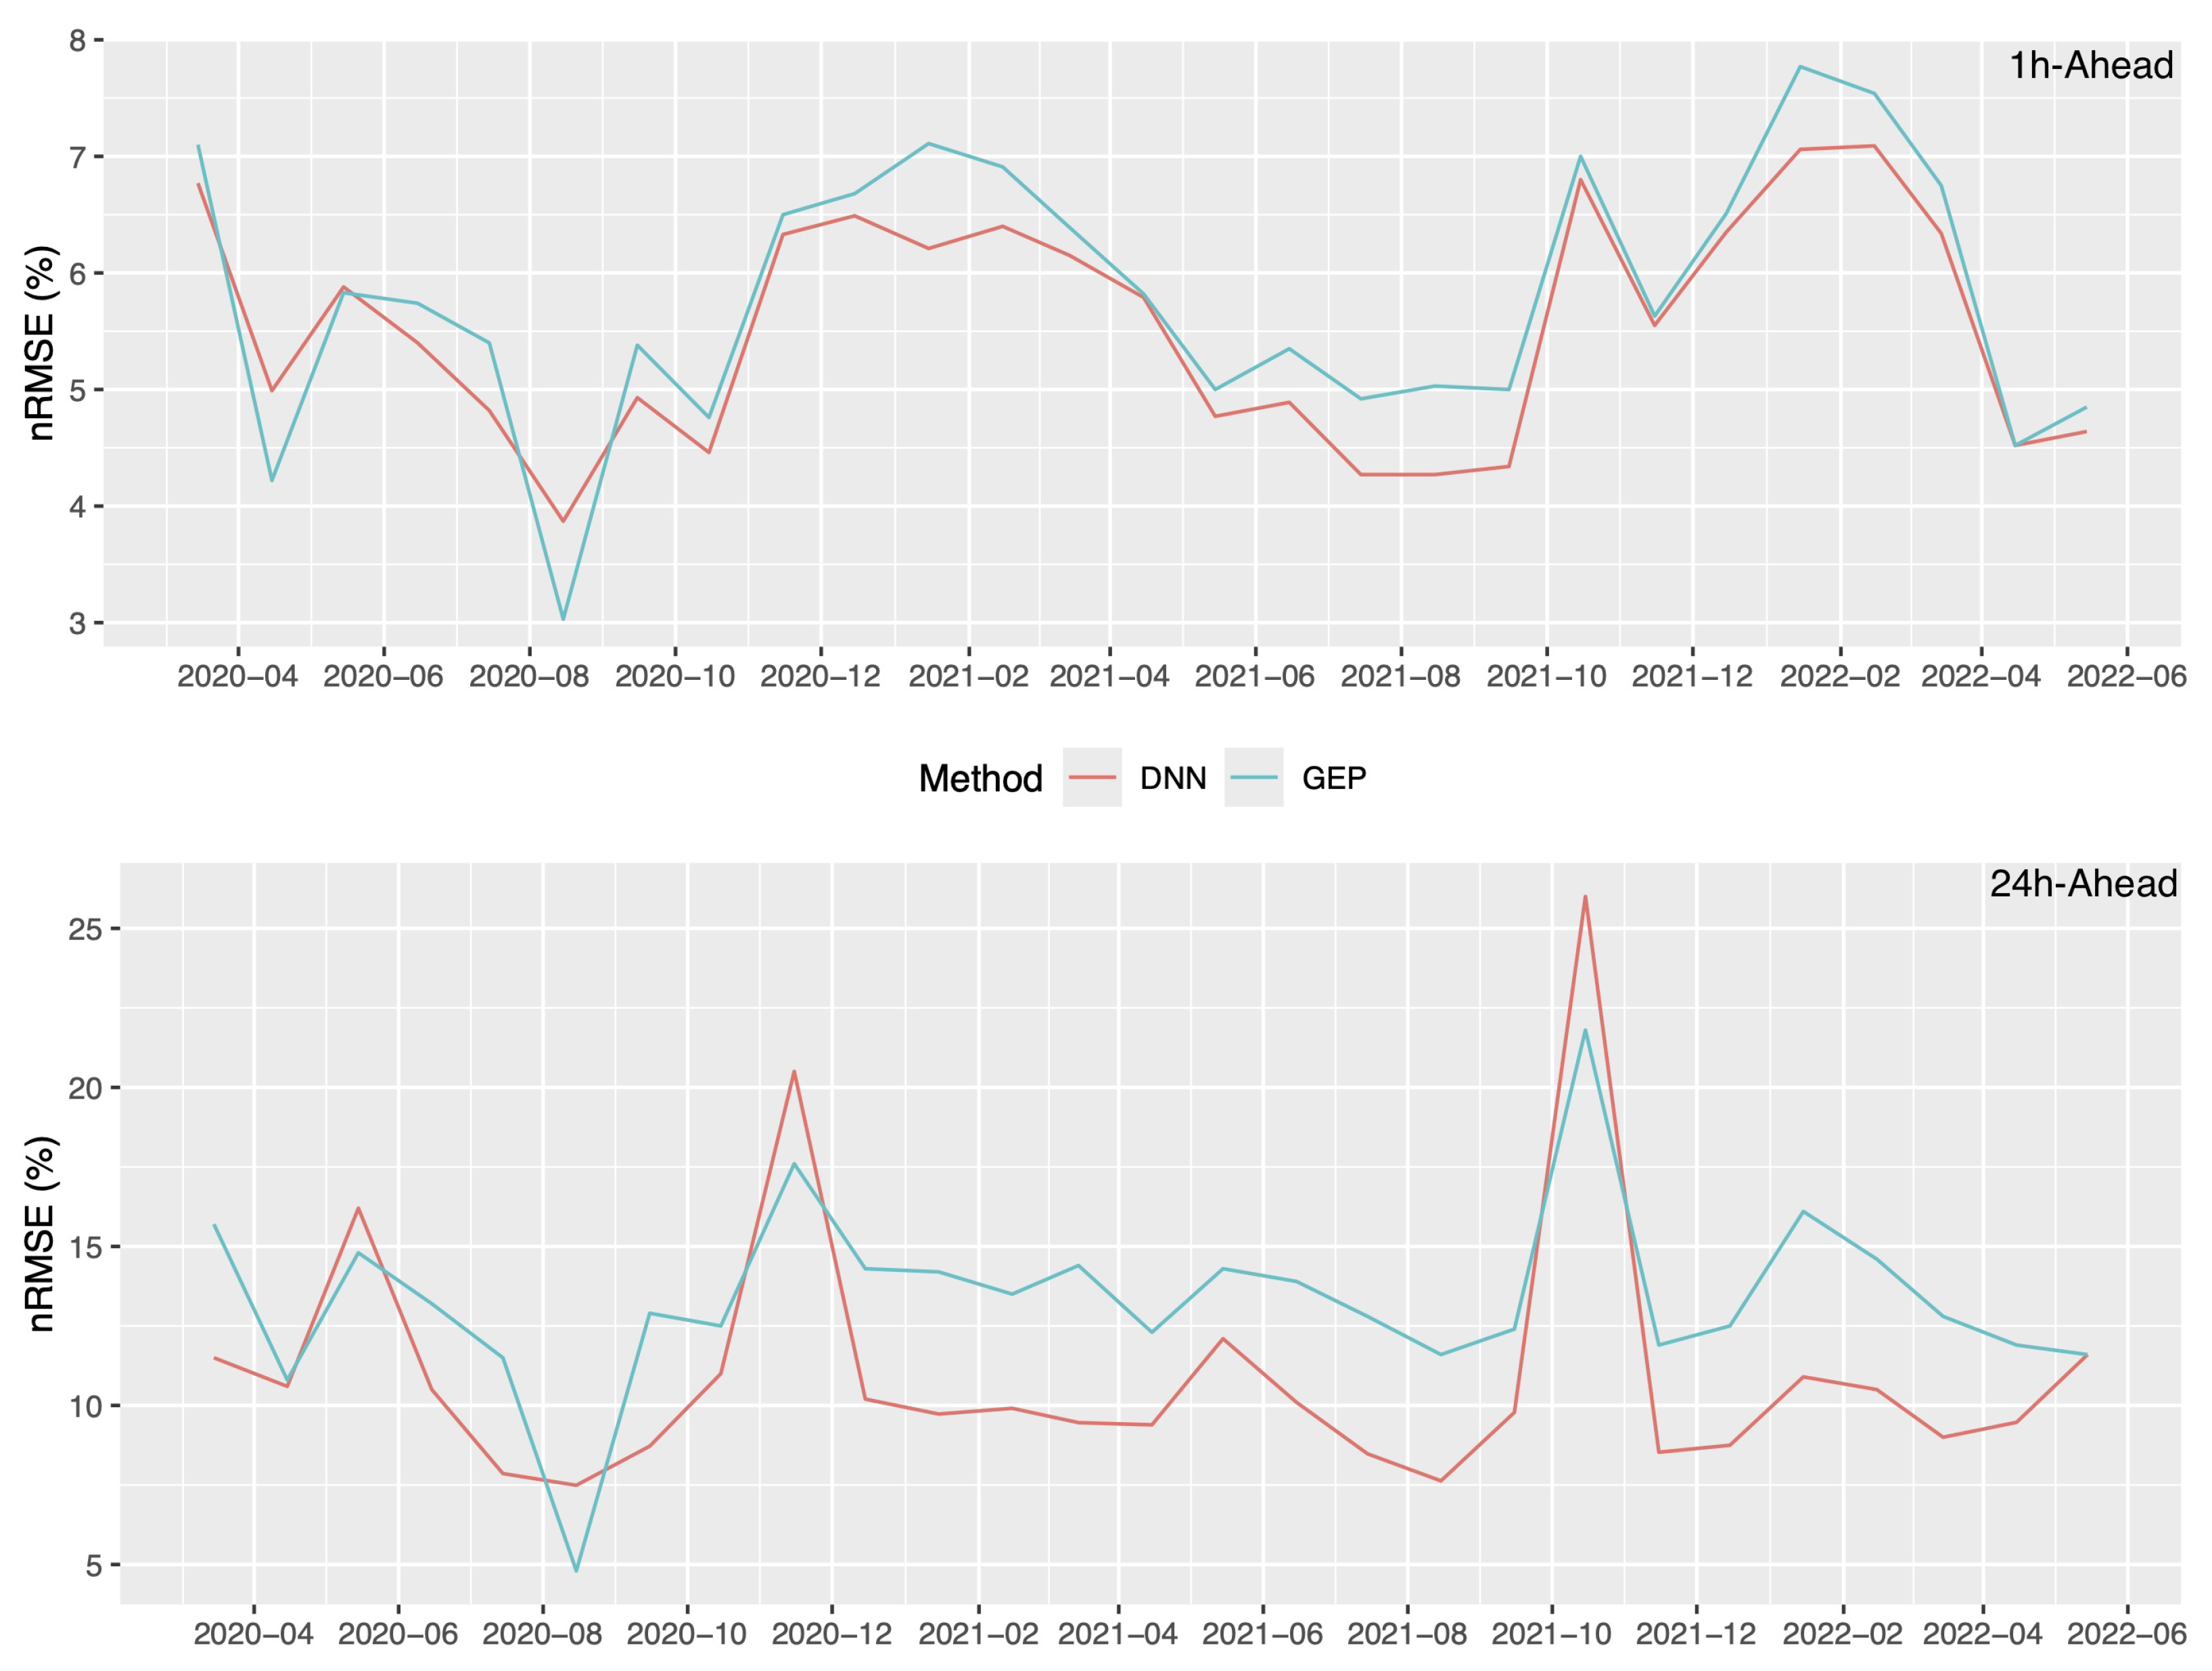
For further discussion,
Table 7 presents the individual error metrics over the seasons of each year the data set covers. This is also graphically represented in
Figure 9. They reveal that the minimum errors happened during the summer peak times, in August of each year. On the other hand, the maximum errors generally occurred towards the end of a year.
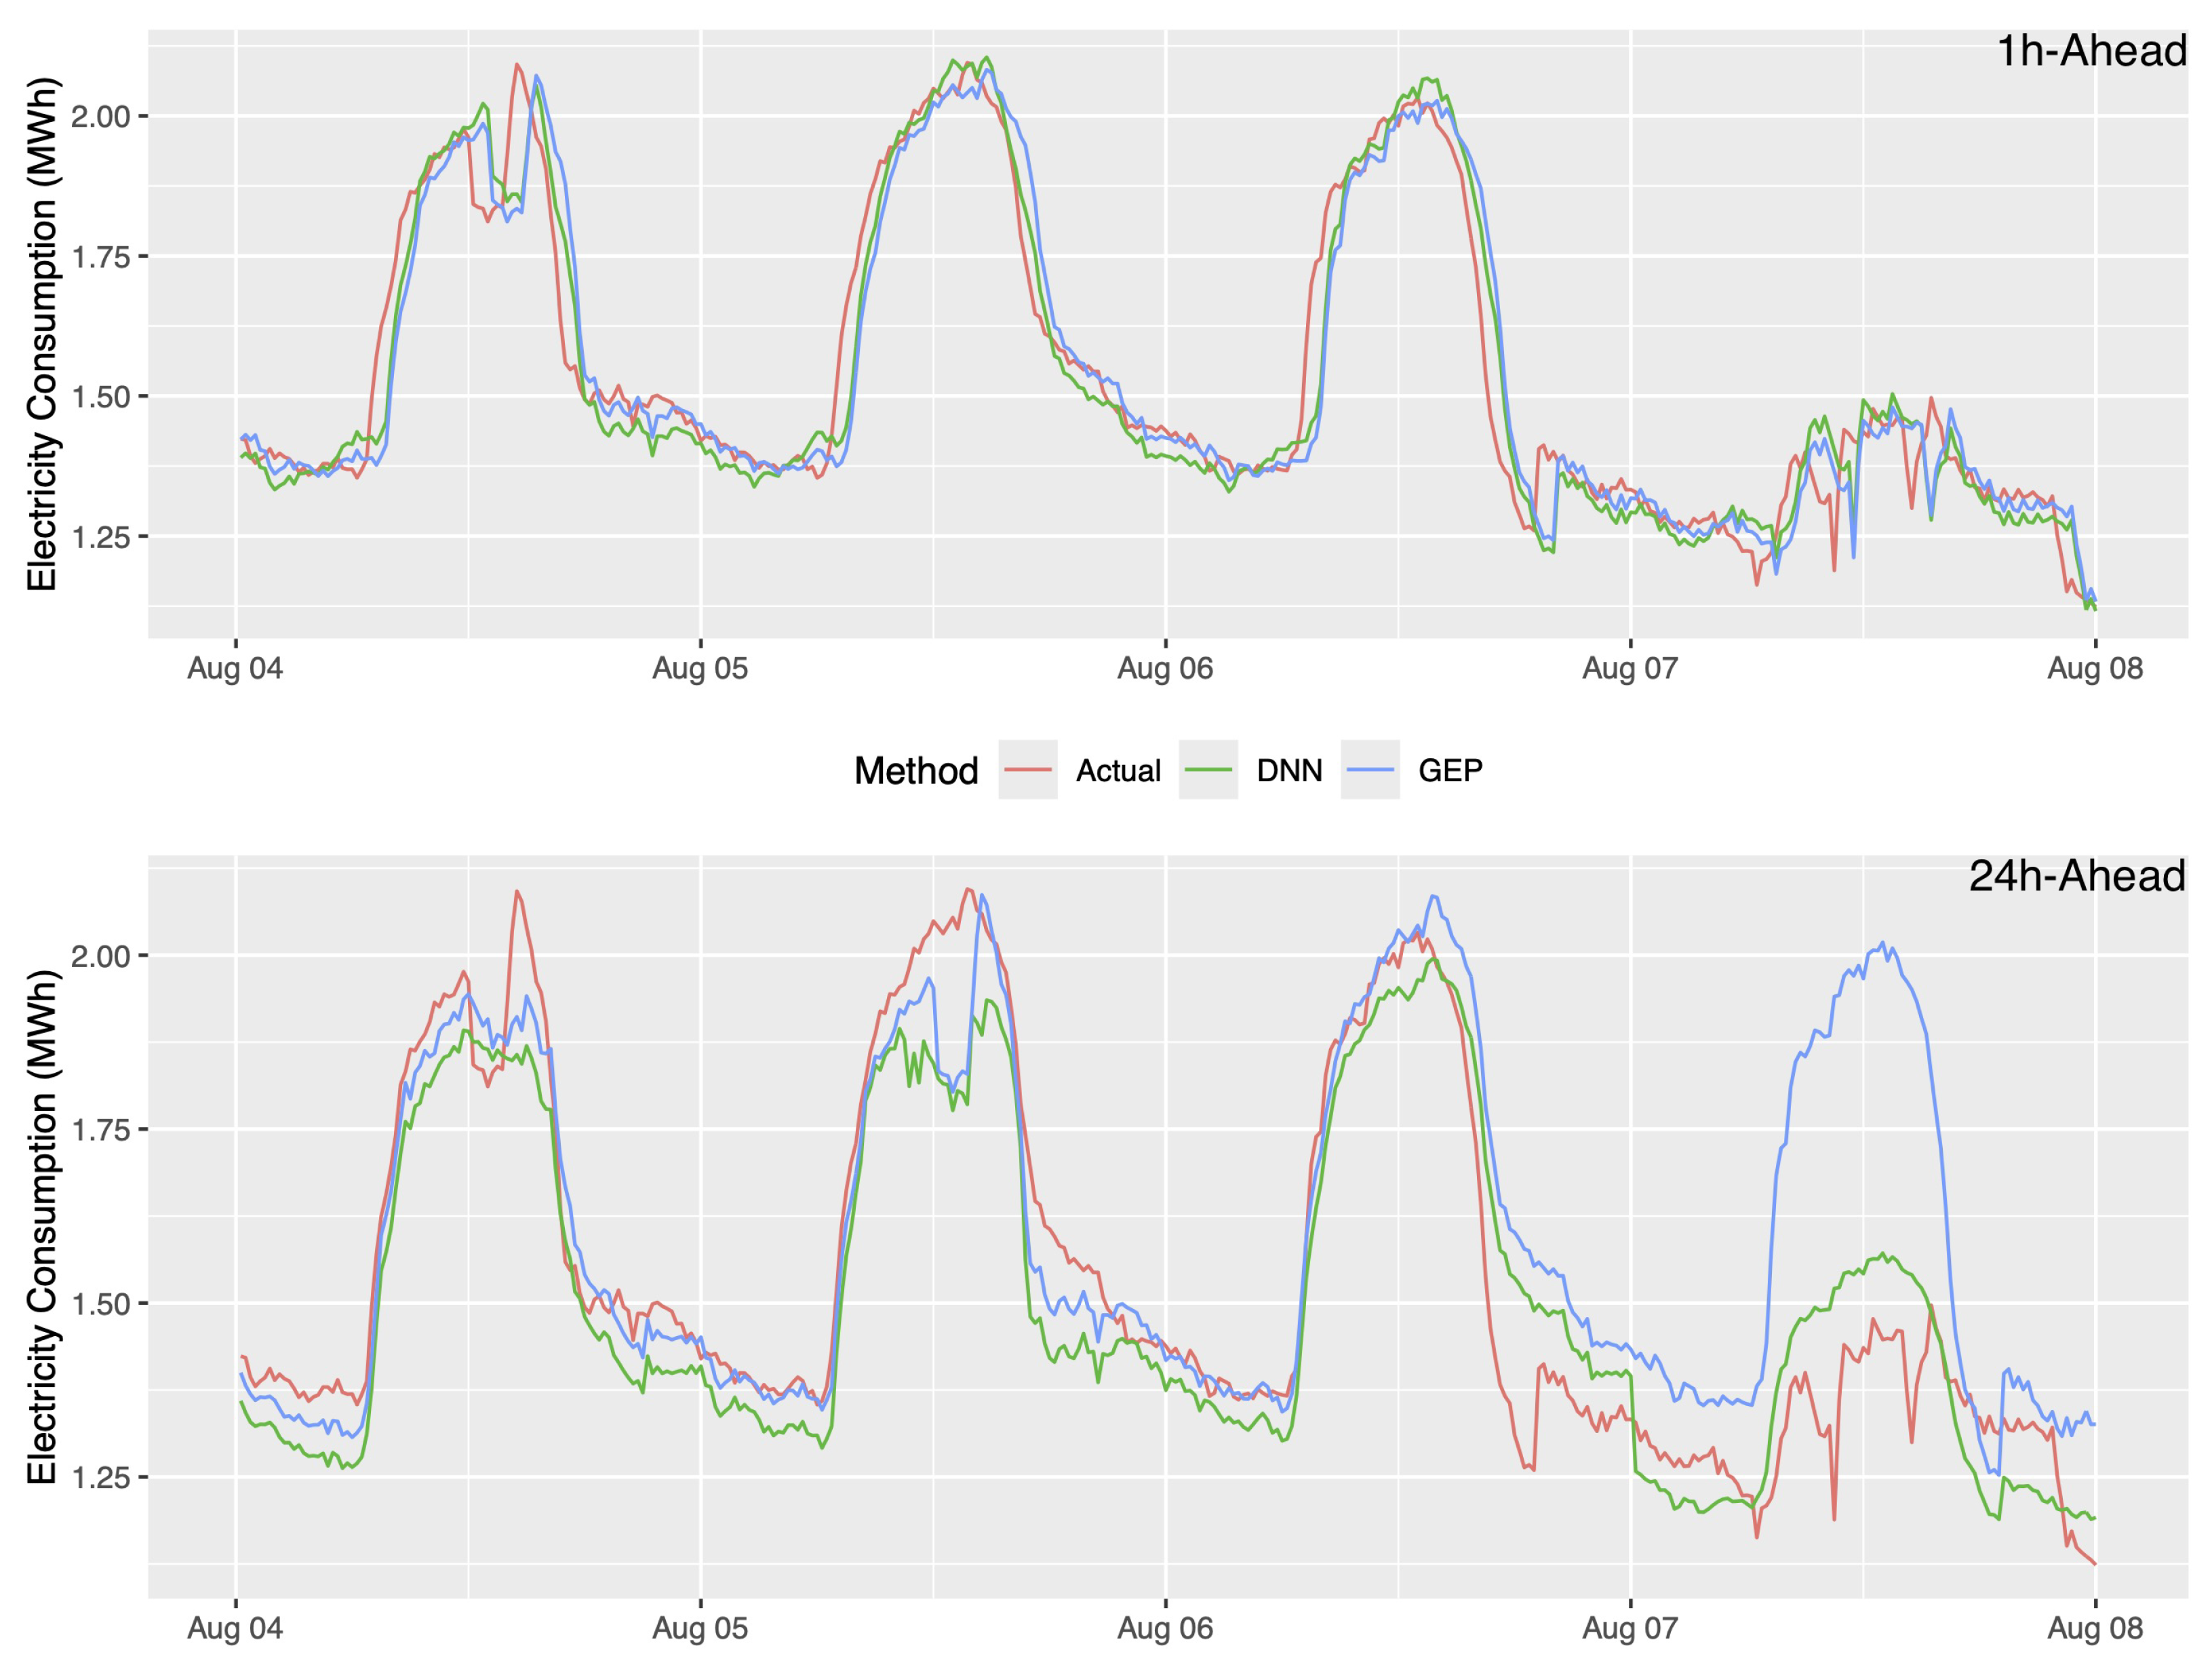
Figure 10 demonstrates the performance of DNN and GEP during the hourly and daily active power peaks that occurred within a selected week when the consumption was the highest throughout the whole data set. The actual electricity consumption is compared to the predictions made by the DNN and GEP methods. The illustration verifies the results presented in
Section 4.1 and
Section 4.2 and highlights the effectiveness of the methods.
5. Conclusions
This research has presented hour-ahead and day-ahead electricity demand forecasting using DNN and GEP methods to predict the electricity consumption of a university hospital based on the data collected during the COVID-19 pandemic. The hospital case study incorporates multiple aspects, such as electricity consumption (data retrieved on-site), weather, and COVID-19 data, into the forecasting models, making the research unique among its counterparts.
The DNN has proven to be the superior choice of algorithm for the predictions with lower nRMSE values compared to that of the GEP. The prediction errors for the DNN were observed to become as low as and for the 1 h-ahead and 24 h-ahead models, respectively, whereas the GEP returned and . These amount to significant improvements in prediction accuracy by and . The DNN has also performed more efficiently with much shorter computational times. It completed the calculations in 30.70 s and 34.81 s, while the GEP finished in 178.75 s and 162.33 s for the hour-ahead and day-ahead cases, respectively. These results amount to significant improvements of and .
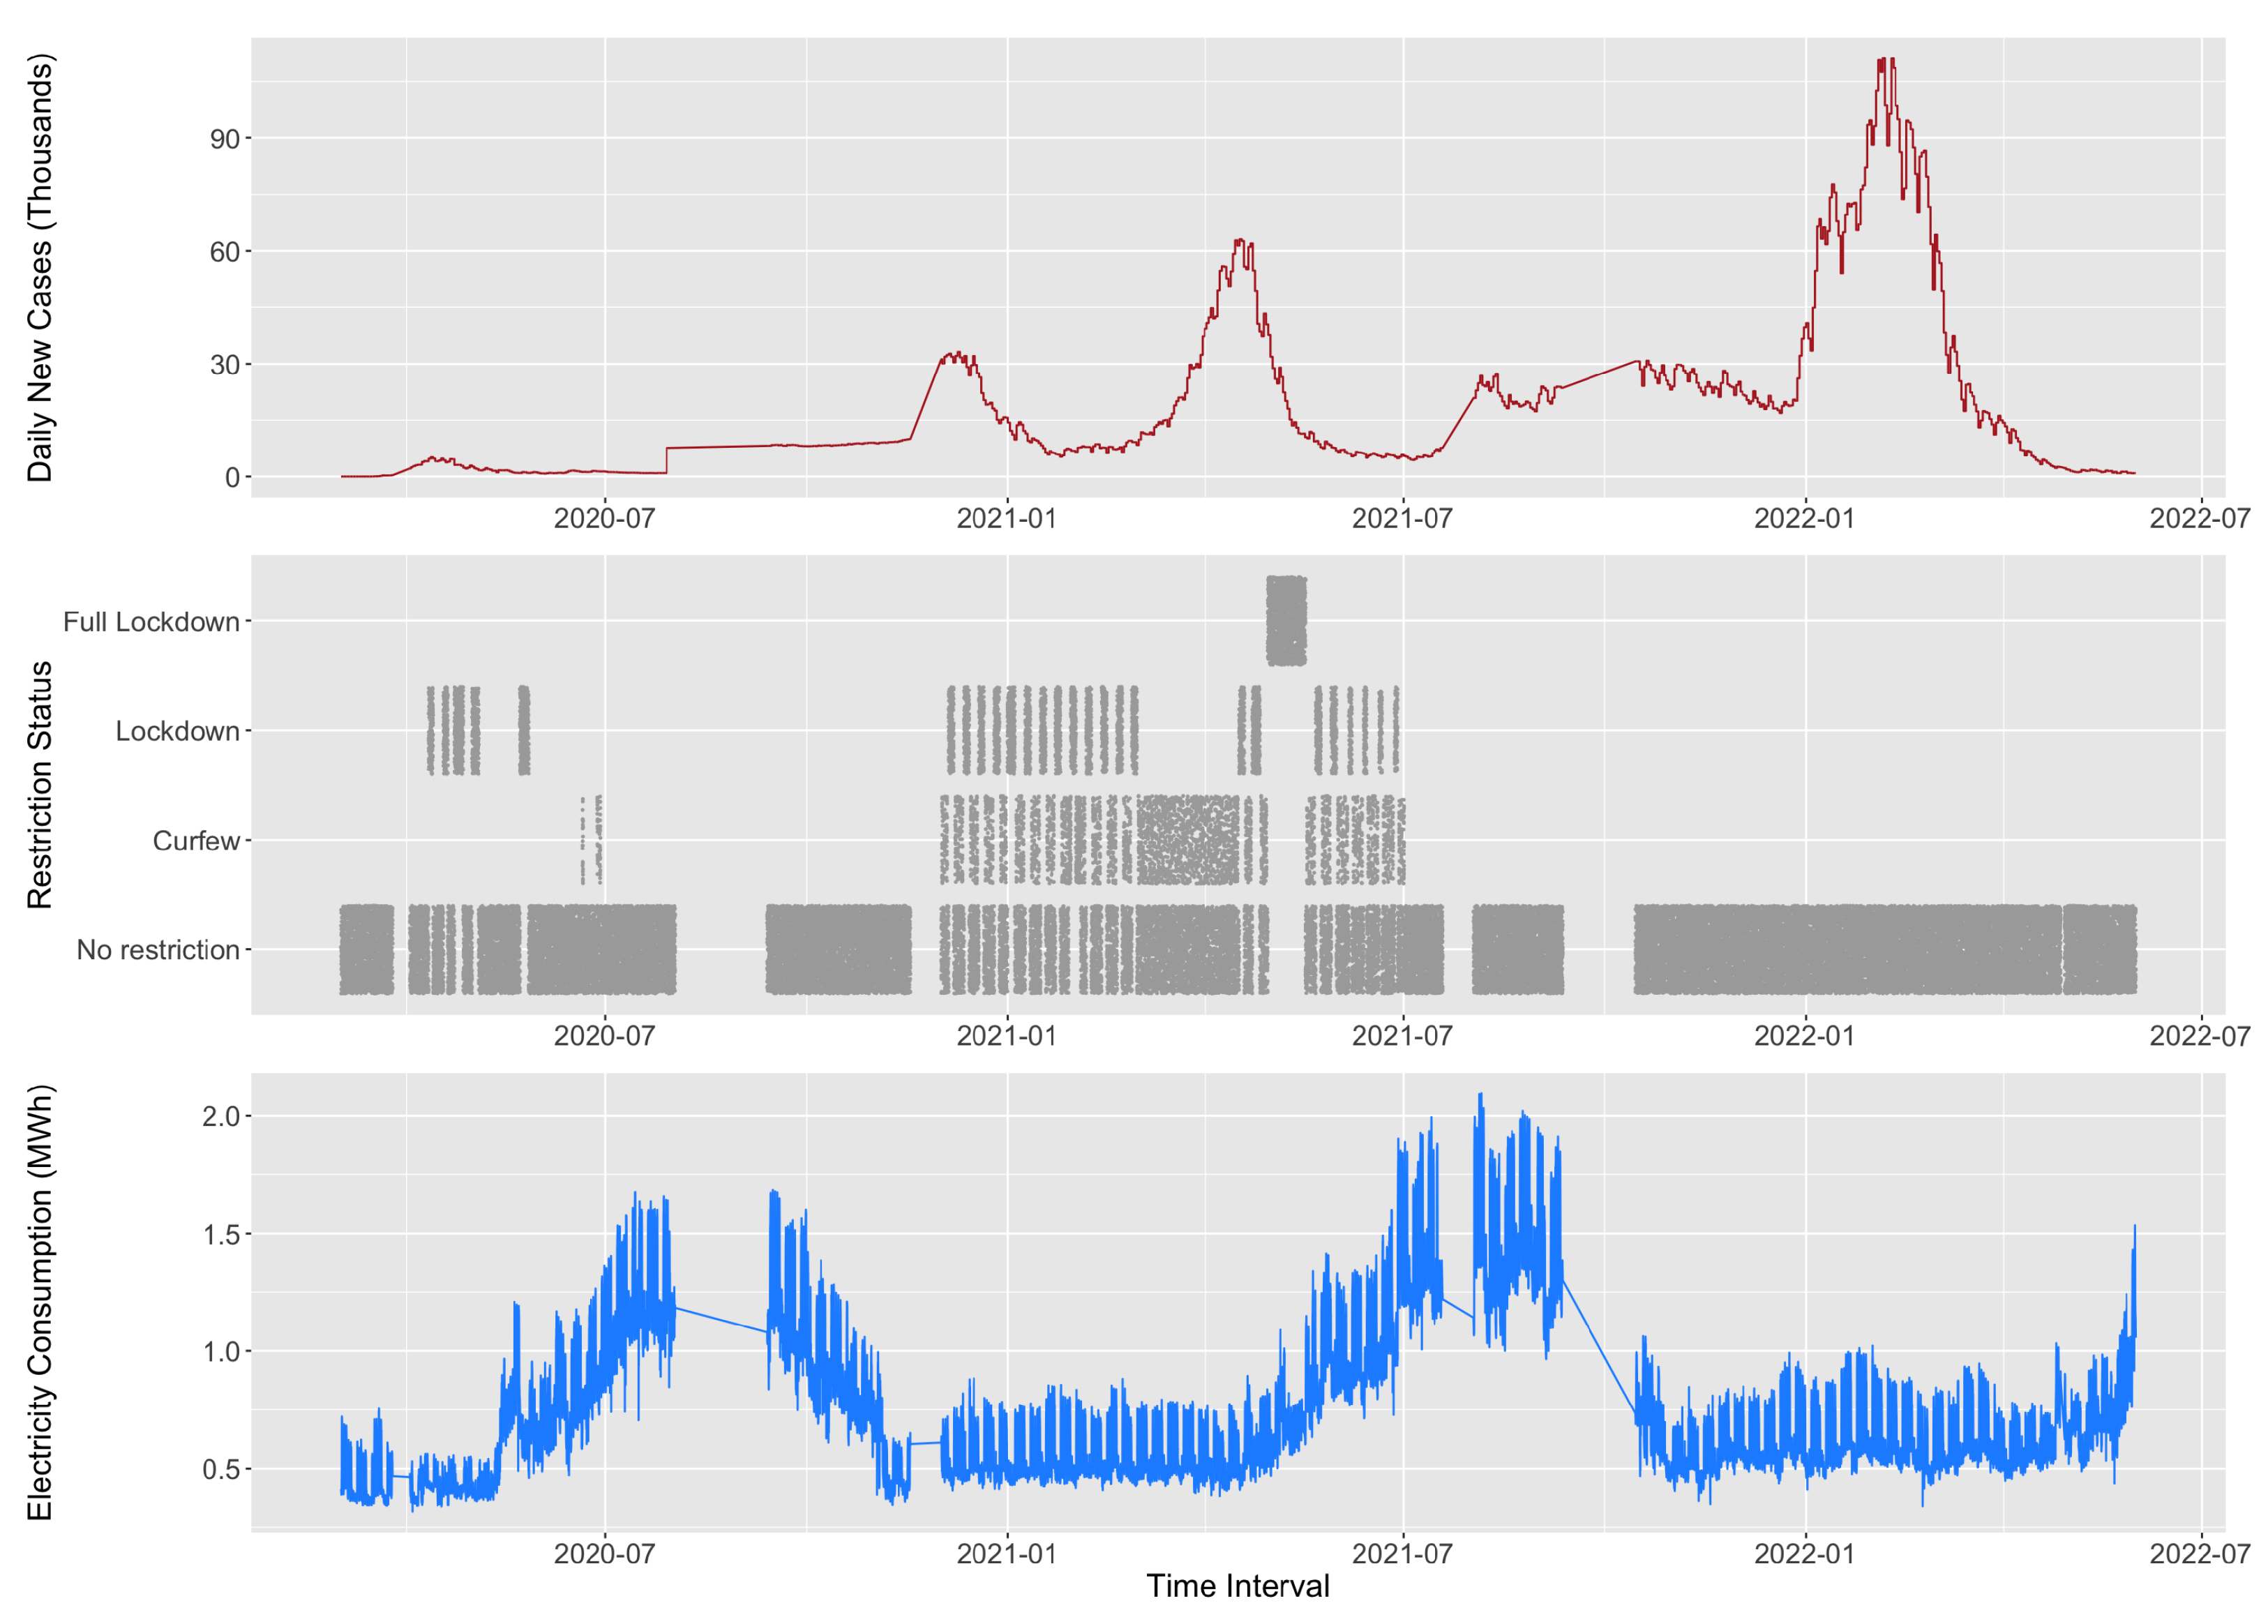
As a result, the impact of COVID-19 on the electricity consumption of the hospital was observed to be dependent on the combination of daily new cases and restriction status (see
Figure 2). For example, when the daily new cases were escalating rapidly and so a lockdown was implemented shortly, abrupt declines in the electricity demand were recorded. On the other hand, when the case numbers were high but decreasing, and thus the lockdown was lifted, abrupt rises in the demand were observed. These sharp changes were usually within the band of 0.5 MWh, more or less.
To summarize the paper, the objectives and motivations of this research can be reiterated as:
The main objective was to predict the electricity demand of the hospital during the COVID-19 pandemic and investigate its impact on the building’s electricity consumption, motivated by the critical role of the healthcare systems,
To collect a substantial amount of data to enhance the strength of the analysis,
Offering a novel methodological approach and verifying the performance of the DNN and GEP methods in demand forecasting,
To discuss the implications and findings of the study and compare them with the literature.
The outcomes of the research, including the novelties and contributions, are given by:
This research took a novel approach in augmenting the electricity consumption, meteorological and COVID-19 data (as shown in
Table 2) within the equations used in predictions. The effects and relationship of these parameters were expressed as unique model equations (refer to
Table 3 and
Table 5). The DNN and GEP algorithms, which were used for the first time in a COVID-19-based forecasting study, showed significant performance using these forecasting models to provide efficient predictions.
The data retrieved covered a larger period than many other contributions in the literature (the whole active period of the pandemic: March 2020–June 2022).
The impact of the pandemic on the electricity consumption of the hospital was observed to depend on the daily new cases and restriction measures alternating between sharp increases and declines in consumption, but as expected in such studies, the greater impact was due to the meteorological data because the AC usage is naturally accepted as the major contributor to consumptions.
Among the COVID-19-related forecasting literature, this research is the second to utilize on-site data of a hospital and the first of its kind from Türkiye.
Future works can cover the extension of this research from the Eastern Mediterranean to the rest of the world for electricity demand forecasting in hospitals or healthcare facilities during extreme events. As stated earlier, the rising portion of RES creates a mismatch in demand and production of electrical energy due to their intermittent nature, which proves to be a significant challenge for the stability of grids. For enhancing the stability and flexibility of grids under the increasing RES penetration, providing efficient and fast ancillary services is attracting the attention of researchers as a solution [
62]. A study from the UK suggests the use of hospitals for the provision of such ancillary services by carrying out a feasibility study to consider the installation of Battery Energy Storage Systems (BESS) for them [
63]. The study also highlights the benefits of such an energy-management strategy in the case of events like the COVID-19 pandemic. The idea is ripe for another future study of this research. Despite being far-fetched from hitting the mainstream yet, there already exist hospitals that utilize BESS and solar panel installations around the world. The works [
64,
65] investigate the economic feasibility of such a hybrid energy system for an American and Malaysian hospital, respectively. However, demand forecasting for these studies under unpredictable situations like the pandemic remains a huge research gap that has not been explored at all.


